intercontinental hotels group - 100067373 ihg ar2016 - 2016 · revpar is the primary metric used by...
TRANSCRIPT

In addition to the performance measures that are directly observable in the Group Financial Statements, the performance review (and Group highlights on page 2)include the following key performance measures.
Performance
Revenue per Available Room (RevPAR)
RevPAR is the primary metric used by management to track hotel performance across regions and brands. RevPAR is also a commonly used performance measure in the hotel industry.
RevPAR comprises IHG System rooms revenue divided by the number of room nights available and can be mathematically derived from occupancy rate multiplied by average daily rate. Occupancy rate is rooms occupied by hotel guests expressed as a percentage of rooms that are available. Average daily rate is rooms revenue divided by the number of room nights sold.
References to RevPAR, occupancy and average daily rate are presented on a comparable basis comprising groupings of hotels that have traded in all months in both the current and prior year. The principal exclusions in deriving this measure are new hotels, hotels closed for major refurbishment and hotels sold in either of the two years.
RevPAR and average daily rate are quoted at a constant US dollar conversion rate, in order to allow a better understanding of the comparable year-on-year trading performance excluding distortions created by fluctuations in exchange rates.
Total gross revenue
An important measure of IHG System performance is the growth in total gross revenue which provides a measure of the overall strength of the Group’s brands.
Total gross revenue comprises total rooms revenue from franchised hotels and total hotel revenue from managed, owned and leased hotels. Other than owned and leased hotels, total gross revenue is not revenue attributable to IHG as it is derived mainly from hotels owned by third parties. A reconciliation of total gross revenue to the owned and leased revenue included in the Group Financial Statements is set out on page 28.
Underlying revenue Underlying operating profit growth Underlying fee revenue Fee margin growth
Underlying revenue and underlying operating profit both exclude the impact of owned asset disposals, managed leases, significant liquidated damages and current year acquisitions, all translated at constant currency using prior year exchange rates. Underlying operating profit growth also excludes the impact of exceptional items (see below). The presentation of these additional performance measures allows a better understanding of comparable year-on-year trading and thereby allows an assessment of the underlying trends in the Group’s financial performance. These measures also provide consistency with the Group’s internal management reporting.
Underlying fee revenue and fee margin further exclude the revenue and operating profit of the Group’s remaining owned and leased properties, thereby providing metrics which measure the underlying performance of the Group’s core fee-based business model.
The performance review should be read in conjunction with the Non-GAAP reconciliations on pages 156 and 157, which reconcile these alternative performance measures to the nearest comparable GAAP measures and also show the amounts on both an actual and constant currency basis.
Total operating profit before exceptional items and tax Adjusted earnings per ordinary share
Total operating profit before exceptional items and tax enables a better understanding of the ongoing operational performance of the Group. For example, total operating profit including exceptional items can be significantly skewed by the profit on disposal of owned assets, as was the case in 2015 with the disposal of InterContinental Hong Kong. In addition, taxes can be influenced by external factors such as legislative changes, and a before tax measure of operating profit is therefore considered more reflective of the Group’s success in executing against its strategy.
Adjusted earnings per ordinary share excludes exceptional items, and their related tax impacts, and is reconciled to basic earnings per share in note 9 on page 117 of the Group Financial Statements. Adjusted earnings per share provides a per share measure that is not skewed by exceptional items.
An analysis of exceptional items for the periods covered by the performance review is included in note 5 on page 112 of the Group Financial Statements.
Exceptional items are identified by virtue of either their size or nature and are excluded from these measures so as to facilitate comparison with prior periods and to assess underlying trends in the financial performance of the Group and its regional operating segments. Exceptional items can include, but are not restricted to, gains and losses on the disposal of assets, impairment charges and reversals, and restructuring costs.
Total operating profit both before and after exceptional items is shown on the face of the Group income statement on page 91, as permitted under IFRS.
Net debt
Net debt is used in the monitoring of the Group’s liquidity and capital structure, and is a number used to calculate the key ratios attached to the Group’s bank covenants.
Net debt comprises loans and other borrowings less cash and cash equivalents, and is reconciled to the amounts included in the Group Financial Statements in note 21 on page 128.
These are Non-GAAP financial measures which should be viewed as complementary to, and not as a substitute for, the measures prescribed by GAAP.
Key performance measures (including Non-GAAP measures) used by management
With the exception of RevPAR, these are financial measures that are either not defined under IFRS or are adjusted IFRS figures and are therefore described as Non-GAAP measures.
The performance review should be read in conjunction with the Non-GAAP reconciliations on pages 156 and 157 and the glossary on pages 184 to 185.
26 IHG Annual Report and Form 20-F 2016 Strategic Report

Performance
Group
Highlights for the year ended 31 December 2016During the year ended 31 December 2016, revenue decreased by $88m (4.9%) to $1,715m primarily as a result of the sale of InterContinental Paris – Le Grand and InterContinental Hong Kong. Operating profit and profit before tax both decreased by $821m to $678m and $591m, primarily due to the gain on sale of InterContinental Paris – Le Grand and InterContinental Hong Kong during the year ended 31 December 2015. Operating profit before exceptional items increased by $27m (4.0%) to $707m.
Underlyinga Group revenue and underlyinga Group operating profit increased by $69m (4.6%) and $61m (9.5%) respectively.
Comparable Group RevPAR increased by 1.8% (including an increase in average daily rate of 1.2%). IHG System size increased by 3.1% to 767,135 rooms, whilst underlying Group fee revenueb increased by 2.3% (4.4% at constant currency).
At constant currency, the net central operating loss before exceptional items decreased by $12m (7.9%) to $139m compared to 2015 (but at actual currency decreased by $23m (15.2%) to $128m).
ACCOUNTING PRINCIPLES
The Group results are prepared under International Financial Reporting Standards (IFRS). The application of IFRS requires management to make judgements, estimates and assumptions, and those considered critical to the preparation of the Group results are set out on page 103 of the Group Financial Statements.
The Group discloses certain financial information both including and excluding exceptional items. For comparability of the periods presented, some of the performance indicators in this Performance review are calculated after eliminating these exceptional items. Such indicators are prefixed with ‘adjusted’. An analysis of exceptional items is included in note 5 on page 112 of the Group Financial Statements.
Group fee margin was 48.8%, up 3.3 percentage points (up 2.5 percentage points at constant currency) on 2015, after adjusting for owned and leased hotels, managed leases, and significant liquidated damages. Group fee margin benefited from efficiency improvements and by leveraging our global scale.
Basic earnings per ordinary share decreased by 62.4% to 195.3¢, whilst adjusted earnings per ordinary share increased by 16.2% to 203.3¢, reflecting the increase in operating profit before exceptional items and the impact of the share consolidation in May 2016.a Underlying excludes the impact of owned asset disposals,
significant liquidated damages and the results from managed-lease hotels, translated at constant currency by applying prior-year exchange rates (see pages 156 and 157). Underlying operating profit growth also excludes the impact of exceptional items.
b Underlying fee revenue is defined as Group revenue excluding revenue from owned and leased hotels, managed leases and significant liquidated damages (see pages 156 and 157).
Group results
12 months ended 31 December
2016 $m
2015 $m
2016 vs 2015 % change
2014$m
2015 vs 2014 % change
RevenueAmericas 993 955 4.0 871 9.6Europe 227 265 (14.3) 374 (29.1)AMEA 237 241 (1.7) 242 (0.4)
Greater China 117 207 (43.5) 242 (14.5)Central 141 135 4.4 129 4.7Total 1,715 1,803 (4.9) 1,858 (3.0)Operating profit before exceptional itemsAmericas 633 597 6.0 544 9.7Europe 75 78 (3.8) 89 (12.4)AMEA 82 86 (4.7) 84 2.4Greater China 45 70 (35.7) 89 (21.3)Central (128) (151) 15.2 (155) 2.6
707 680 4.0 651 4.5Exceptional items (29) 819 (103.5) 29 –Operating profit 678 1,499 (54.8) 680 120.4Net finance costs (87) (87) – (80) (8.8)Profit before tax 591 1,412 (58.1) 600 135.3
Earnings per ordinary shareBasic 195.3¢ 520.0¢ (62.4) 158.3¢ 228.5Adjusted 203.3¢ 174.9¢ 16.2 158.3¢ 10.5Average US dollar to sterling exchange rate
$1:£0.74
$1:£0.65 13.8
$1:£0.61 6.6
STRATEG
IC REP
OR
TG
OVER
NA
NC
EG
RO
UP FIN
AN
CIA
L STATEMEN
TSA
DD
ITION
AL IN
FOR
MATIO
NPA
REN
T CO
MPA
NY FIN
AN
CIA
L STATEMEN
TS
IHG Annual Report and Form 20-F 2016 27
PERFORMANCE CONTINUED
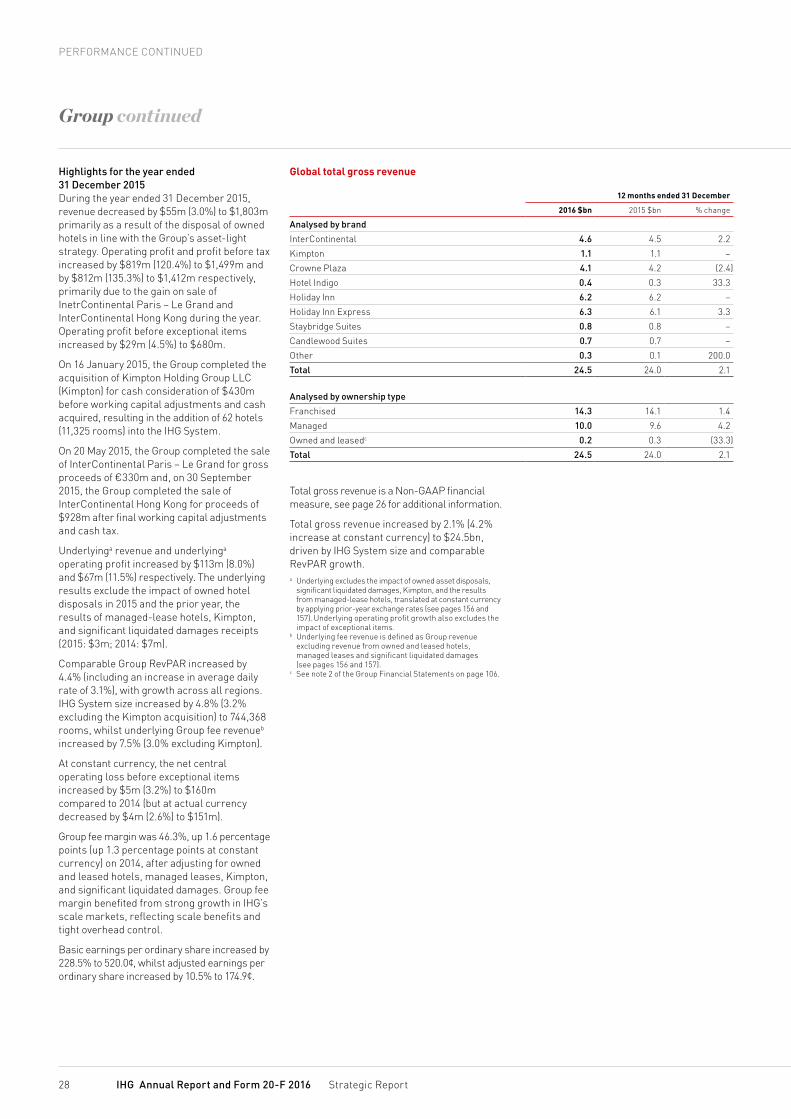
Total gross revenue is a Non-GAAP financial measure, see page 26 for additional information.
Total gross revenue increased by 2.1% (4.2% increase at constant currency) to $24.5bn, driven by IHG System size and comparable RevPAR growth.a Underlying excludes the impact of owned asset disposals,
significant liquidated damages, Kimpton, and the results from managed-lease hotels, translated at constant currency by applying prior-year exchange rates (see pages 156 and 157). Underlying operating profit growth also excludes the impact of exceptional items.
b Underlying fee revenue is defined as Group revenue excluding revenue from owned and leased hotels, managed leases and significant liquidated damages (see pages 156 and 157).
c See note 2 of the Group Financial Statements on page 106.
Group continued
Global total gross revenue
12 months ended 31 December
2016 $bn 2015 $bn % change
Analysed by brandInterContinental 4.6 4.5 2.2Kimpton 1.1 1.1 –Crowne Plaza 4.1 4.2 (2.4)Hotel Indigo 0.4 0.3 33.3Holiday Inn 6.2 6.2 –Holiday Inn Express 6.3 6.1 3.3Staybridge Suites 0.8 0.8 –Candlewood Suites 0.7 0.7 –Other 0.3 0.1 200.0Total 24.5 24.0 2.1
Analysed by ownership typeFranchised 14.3 14.1 1.4Managed 10.0 9.6 4.2Owned and leasedc 0.2 0.3 (33.3)Total 24.5 24.0 2.1
Highlights for the year ended 31 December 2015During the year ended 31 December 2015, revenue decreased by $55m (3.0%) to $1,803m primarily as a result of the disposal of owned hotels in line with the Group’s asset-light strategy. Operating profit and profit before tax increased by $819m (120.4%) to $1,499m and by $812m (135.3%) to $1,412m respectively, primarily due to the gain on sale of InetrContinental Paris – Le Grand and InterContinental Hong Kong during the year. Operating profit before exceptional items increased by $29m (4.5%) to $680m.
On 16 January 2015, the Group completed the acquisition of Kimpton Holding Group LLC (Kimpton) for cash consideration of $430m before working capital adjustments and cash acquired, resulting in the addition of 62 hotels (11,325 rooms) into the IHG System.
On 20 May 2015, the Group completed the sale of InterContinental Paris – Le Grand for gross proceeds of €330m and, on 30 September 2015, the Group completed the sale of InterContinental Hong Kong for proceeds of $928m after final working capital adjustments and cash tax.
Underlyinga revenue and underlyinga operating profit increased by $113m (8.0%) and $67m (11.5%) respectively. The underlying results exclude the impact of owned hotel disposals in 2015 and the prior year, the results of managed-lease hotels, Kimpton, and significant liquidated damages receipts (2015: $3m; 2014: $7m).
Comparable Group RevPAR increased by 4.4% (including an increase in average daily rate of 3.1%), with growth across all regions. IHG System size increased by 4.8% (3.2% excluding the Kimpton acquisition) to 744,368 rooms, whilst underlying Group fee revenueb increased by 7.5% (3.0% excluding Kimpton).
At constant currency, the net central operating loss before exceptional items increased by $5m (3.2%) to $160m compared to 2014 (but at actual currency decreased by $4m (2.6%) to $151m).
Group fee margin was 46.3%, up 1.6 percentage points (up 1.3 percentage points at constant currency) on 2014, after adjusting for owned and leased hotels, managed leases, Kimpton, and significant liquidated damages. Group fee margin benefited from strong growth in IHG’s scale markets, reflecting scale benefits and tight overhead control.
Basic earnings per ordinary share increased by 228.5% to 520.0¢, whilst adjusted earnings per ordinary share increased by 10.5% to 174.9¢.
28 IHG Annual Report and Form 20-F 2016 Strategic Report

Performance
Total number of hotels
5,174Total number of rooms
767,135During 2016, the global IHG System (the number of hotels and rooms which are franchised, managed, owned or leased by the Group) increased by 142 hotels (22,767 rooms) to 5,174 hotels (767,135 rooms).
Openings of 258 hotels (40,134 rooms) were 5.5% lower than in 2015. Openings in The Americas included 128 hotels (15,680 rooms) in the Holiday Inn brand family. 29 hotels (7,938 rooms) were opened in Greater China in 2016, with the Europe and AMEA regions contributing openings of 24 hotels (4,188 rooms) and 17 hotels (4,473 rooms) respectively. 116 hotels (17,367 rooms) left the IHG System in 2016, a decrease from the previous year (143 hotels, 21,679 rooms).
Total number of hotels in the pipeline
1,470Total number of rooms in the pipeline
230,076At the end of 2016, the global pipeline totalled 1,470 hotels (230,076 rooms), an increase of 140 hotels (16,160 rooms) on 31 December 2015. The IHG pipeline represents hotels where a contract has been signed and the appropriate fees paid. Approximately 90% of the closing pipeline at 31 December 2016 is in our 10 priority markets.
Group signings increased from 474 hotels in 2015 to 516 hotels whilst rooms decreased from 78,438 rooms to 75,812 rooms in 2016 due to the signing of one large hotel in the Middle East (5,154 rooms) in 2015. This included 328 hotels (47,842 rooms) signed for the Holiday Inn brand family, 28.2% of which were contributed by Greater China (63 hotels, 13,472 rooms).
Active management of the pipeline to remove deals that have become dormant or no longer viable reduced the pipeline by 118 hotels (19,518 rooms), compared to 108 hotels (17,004 rooms) in 2015.
Group hotel and room count
Hotels Rooms
At 31 December 2016Change
over 2015 2016Change
over 2015
Analysed by brandInterContinental 187 3 63,650 1,610Kimpton 61 – 11,238 262HUALUXE 4 1 1,096 298Crowne Plaza 408 2 113,803 519Hotel Indigo 75 10 8,905 1,241EVEN Hotels 6 3 1,010 564Holiday Inna 1,241 15 231,756 3,656Holiday Inn Express 2,497 72 247,009 10,603
Staybridge Suites 236 16 25,610 1,646Candlewood Suites 362 21 34,192 1,864Other 97 (1) 28,866 504Total 5,174 142 767,135 22,767
Analysed by ownership typeFranchised 4,321 102 542,650 11,902Managed 845 39 222,073 10,670Owned and leased 8 1 2,412 195Total 5,174 142 767,135 22,767
a Includes 46 Holiday Inn Resort properties (11,652 rooms) and 26 Holiday Inn Club Vacations properties (7,601 rooms) (2015: 47 Holiday Inn Resort properties (11,518 rooms) and 16 Holiday Inn Club Vacations properties (5,231 rooms)).
Group pipeline
Hotels Rooms
At 31 December 2016Change
over 2015 2016Change
over 2015
Analysed by brandInterContinental 62 10 17,480 1,804Kimpton 18 – 3,098 (268)HUALUXE 22 1 6,956 324Crowne Plaza 90 6 24,536 1,355Hotel Indigo 75 12 10,593 1,385EVEN Hotels 6 (2) 780 (482)Holiday Innb 261 5 52,678 474Holiday Inn Express 676 74 83,882 8,277Staybridge Suites 140 26 15,321 2,680Candlewood Suites 108 10 9,604 884Other 12 (2) 5,148 (273)Total 1,470 140 230,076 16,160
Analysed by ownership type
Franchised 1,039 134 117,694 15,525Managed 431 7 112,382 837Owned and leased – (1) – (202)Total 1,470 140 230,076 16,160
b Includes 14 Holiday Inn Resort properties (3,531 rooms) (2015: 14 Holiday Inn Resort properties (3,548 rooms)).
STRATEG
IC REP
OR
TG
OVER
NA
NC
EG
RO
UP FIN
AN
CIA
L STATEMEN
TSA
DD
ITION
AL IN
FOR
MATIO
NPA
REN
T CO
MPA
NY FIN
AN
CIA
L STATEMEN
TS
IHG Annual Report and Form 20-F 2016 29

PERFORMANCE CONTINUED
Regional highlights
IHG’s Winning Model is the guiding framework for executing our strategy across all of our regions. In 2016, we had several important initiatives delivered regionally to enhance our guest and owner proposition.
THE AMERICAS
Crowne Plaza Accelerate programmeLaunched in 2016, the Crowne Plaza Accelerate programme is designed to increase guest satisfaction, improve hotel performance, and deliver meaningful differentiation. While the brand has seen solid progress in The Americas over the past two years, we see now as the time to capitalise on the momentum it has built and move the brand forward even faster. A $200 million investment over the next three years (approximately $100 million of which is System funded) will further accelerate the trajectory of Crowne Plaza in the region by:
• deploying significant sales and marketing investment to drive commercial performance and build brand strength;
• executing an integrated programme designed to deliver the essentials with excellence (including connectivity, sleep, service, and food and beverage); and
• strengthening the brand through distinctive, guest-preferred innovation, including new room and public-space designs to meet the changing needs of today’s modern business traveller.
EUROPE
Building scale in GermanyIn the hotel industry, building scale provides significant advantages and, to achieve further targeted-scale benefits, we focus on delivering high-quality growth in the most attractive geographic markets.
For the third year in a row, we had a record year of signings in Germany, one of our ten global priority markets, with 17 hotels signed in 2016. This achievement allowed us to reach the important milestone of more than 100 hotels currently open or in the pipeline. To fuel our future expansion, we have been building a strong partner network with ten Multiple Development Agreement (MDA) partners who are committed to delivering 34 hotels (5,996 rooms) by 2020.
More than
100hotels currently open or in the pipeline in Germany, one of our priority markets
InterContinental Danang Sun Peninsula Resort, Vietnam
GREATER CHINA
Franchise Plus in Greater ChinaSince we are committed to delivering a compelling and preferred owner offer, we continually review and enhance our owner proposition. This year we announced the launch of Franchise Plus – a business model specifically tailored for the Holiday Inn Express brand in China. This model provides owners with all the benefits of operating a franchise business, but with additional features typical of a managed model to ensure we maintain brand integrity for our guests – and enhance operational performance for our owners. This new operating model reflects our ongoing efforts to meet our owners’ need for business models that capture the growing demand for mid-scale hotels outside of tier 1 cities, driven by a rapid expansion of the middle class in recent years.
Signed
20hotels in 2016 under the Franchise Plus business model
AMEA
Strengthening our lifestyle and boutique presenceLifestyle and boutique are key, emerging industry segments, and IHG is one of the leaders in these segments in several regions. We’ve gained strong momentum in these segments in AMEA, too; following the launch of the first Hotel Indigo in the region last year, we opened Singapore’s first Hotel Indigo in July. Eight more hotels are due to open in the region in the next three years, including Hotel Indigo Bali Seminyak, the world’s first Hotel Indigo in a resort location.
The brand’s expansion is profiting from the increasing demand for hotels that offer authentic and refreshingly local experiences. Alongside the growing boutique segment, this year we laid solid foundations for the debut of our lifestyle brand, EVEN Hotels, outside of the US, by signing an agreement to develop a portfolio of hotels across Australia and New Zealand.
Open or due to open
10Hotel Indigo hotels in AMEA in the next three years
Please see Our Winning Model on pages 14 to 15 to read more.
30 IHG Annual Report and Form 20-F 2016 Strategic Report

Performance
The Americas
Maximise the quality of growth and scale of our System, by focusing on driving brand preference across our core upper midscale and upscale portfolio, over the next three years.
PROGRESS AGAINST 2016 REGIONAL PRIORITIES
1. Grew System size by opening 188 hotels, and through key signings for our InterContinental brand (including Houston, Minneapolis, and San Diego). Grew our EVEN Hotels brand, including opening the first franchise in Omaha and two openings in New York City. Delivered a strong year of signings for Kimpton Hotels & Restaurants, and opened its first international hotel with the Kimpton Seafire Resort + Spa, Grand Cayman.
2. Strengthened brand preference by embedding the new Holiday Inn Express room design (see page 17), which has delivered strong performance and penetration in the estate. Began driving adoption of the new Holiday Inn room design (see page 17), which became a brand standard in the US and Canada in 2016. Launched the Crowne Plaza Accelerate programme (see page 30).
3. Built more meaningful relationships with our guests by implementing IHG Connect, which delivers a faster, more reliable and consistent hotel internet experience. Guests benefit from a seamless, wifi log-in across our estate using their IHG Rewards Club credentials. Hotels that have adopted the system have seen wifi-related scores increase by five points since implementation.
4. Drove superior returns for our owners by refining our revenue toolkit, including expansion of the newly approved standard for revenue management, expansion of our revenue management services and embedding our operational model for hotel support.
IHG’S 2017 REGIONAL PRIORITIES
1. Grow System size by opening key properties and strengthening our upscale and luxury portfolio (including the InterContinental Los Angeles Downtown, Hotel Indigo Los Angeles Downtown, and Crowne Plaza HY36 Midtown Manhattan).
2. Drive brand preference through the Crowne Plaza Accelerate programme (see page 30), and through the continued scaling of Holiday Inn Express and Holiday Inn new designs.
3. Drive superior returns for our owners by expanding our revenue management service, Revenue Management for Hire and, in particular, through the expansion of our owner-centric support model and revenue management standard to Mexico.
Industry performance in 2016Industry RevPAR in the Americas increased by 3.8%, driven by a 1.5% increase in room demand and a 4.0% increase in average daily rate. On the supply side, the number of available rooms increased by 1.6%, the highest growth since 2009. All industry segments experienced RevPAR growth, driven by average daily rate. RevPAR in the upper midscale segment, where the Holiday Inn and Holiday Inn Express brands operate, increased by 2.1%, driven by a 2.5% increase in average daily rate. In the US, lodging industry room demand increased by 1.7%, continuing to outpace GDP for the past seven years. Industry room demand set records in all months this year as it has done, except in one month, since March 2011. US supply growth continued to move upwards, reaching 1.6%, (still below the 1.9% per annum historic average). Average daily rate growth of 3.1% drove a 3.2% increase in US RevPAR. In the US, RevPAR increased by 2.3% in upper midscale, 2.1% in upscale and 1.3% in luxury. In Canada, industry RevPAR increased by 4.9%, driven by a 4.3% increase in average daily rate, and in Mexico, RevPAR increased by 17.2%, due to a 17.1% increase in average daily rate.Source Smith Travel Research for all of the above industry facts.
IHG’s regional performance in 2016IHG’s comparable RevPAR in the Americas increased 2.1%, driven by 2.0% average daily rate growth. The region is predominantly represented by the US, where comparable RevPAR increased 1.8%. US RevPAR growth was impacted by our concentration in oil producing markets, where RevPAR declined by 7.5%; in the remainder of the estate RevPAR increased by 3.0%. In the US, we are most represented by our upper midscale brands Holiday Inn and Holiday Inn Express. The Holiday Inn brand increased RevPAR 2.5%, slightly ahead of the segment, whilst Holiday Inn Express brand increased by 1.5%, behind the segment. However, absolute occupancy for both brands was ahead of the industry. In Canada, our comparable RevPAR increased by 2.7% and Mexico increased by 12.9%, both led by rate growth.
Strong demand for IHG-branded hotels continued, with 37,038 rooms signed during 2016. We continued to demonstrate our commitment to quality, with 15,117 rooms leaving the IHG System.
Americas comparable RevPAR movement on previous year
12 months ended 31 December 2016
Franchised ManagedCrowne Plaza
1.5% InterContinental 2.7%
Holiday Inn 2.6% Kimpton 2.9%Holiday Inn Express
1.7% Crowne Plaza 5.7%
All brands 1.9% Holiday Inn 4.9%Staybridge Suites 5.3%Candlewood Suites
1.2%
All brands 3.2%Owned and leasedEVEN Hotels 15.5%All brands 4.0%
Group revenue 2016 ($1,715m)
Number of rooms (767,135)
12%
10%
14%
64%
58%
13%
7%
14%
8%
STRATEG
IC REP
OR
TG
OVER
NA
NC
EG
RO
UP FIN
AN
CIA
L STATEMEN
TSA
DD
ITION
AL IN
FOR
MATIO
NPA
REN
T CO
MPA
NY FIN
AN
CIA
L STATEMEN
TS
IHG Annual Report and Form 20-F 2016 31

PERFORMANCE CONTINUED
RevPAR growth of 1.9%, including 2.6% for Holiday Inn and 1.7% for Holiday Inn Express, together with 2.0% rooms growth. On a constant currency basis, revenue and operating profit increased by $29m (4.4%) to $690m and by $30m (5.2%) to $605m respectively.
Managed revenue increased by $6m (3.6%) to $172m, whilst operating profit stayed flat at $64m due to costs relating to our 20% interest in InterContinental New York Barclay and the ongoing impact of new supply on RevPAR growth in New York. Revenue and operating profit included $34m (2015: $38m) and $nil (2015: $nil) respectively from one managed-lease property. Excluding results from this managed-lease hotel, the benefit of significant liquidated damages receipts (2016: $nil; 2015: $3m) and on a constant currency basis, revenue increased by $16m (12.8%) and operating profit increased by $5m (8.2%) respectively.
Owned and leased revenue increased by $8m (6.3%) to $136m, whilst operating profit stayed flat at $24m.
Regional overheads decreased by $11m (16.7%) to $55m due to a $10m year-on-year decrease in US healthcare costs. a Underlying excludes the impact of owned asset disposals,
significant liquidated damages and the results from managed-lease hotels, translated at constant currency by applying prior-year exchange rates (see pages 156 and 157). Underlying operating profit growth also excludes the impact of exceptional items.
b Royalties are fees, based on rooms revenue, that a franchisee pays to the brand owner for use of the brand name.
c Underlying excludes the impact of owned asset disposals, significant liquidated damages, Kimpton and the results from managed-lease hotels, translated at constant currency by applying prior-year exchange rates (see pages 156 and 157). Underlying operating profit growth also excludes the impact of exceptional items.
Highlights for the year ended 31 December 2015Revenue increased by $84m (9.6%) to $955m and operating profit decreased by $98m (15.0%) to $556m, primarily due to the gain on sale of InterContinental New York Barclay and InterContinental Mark Hopkins San Francisco during the year ended 31 December 2014. Operating profit before exceptional items increased by $53m (9.7%) to $597m. Underlyingc revenue increased by $71m (8.8%), while underlyinga operating profit increased by $53m (9.9%), driven predominantly by strong RevPAR growth in the fee business and an increase in net rooms. The underlying results exclude both InterContinental Mark Hopkins San Francisco and InterContinental New York Barclay whilst under IHG ownership, managed leases, Kimpton, and the benefit of significant liquidated damages receipts (2015: $3m; 2014: $7m).
Franchised revenue increased by $31m (4.9%) to $661m, including the impact of the $7m liquidated damages receipts in 2014 (7.9% excluding these liquidated damages and on a constant currency basis). Royaltiesb growth of 5.1% was driven by comparable RevPAR growth of 4.6%, including 4.6% for Holiday Inn and 4.1% for Holiday Inn Express, together with 1.2% rooms growth. Operating profit increased by $31m (5.7%) to $575m, including an $8m increase in fees associated with the initial franchising and relicensing of hotels. Excluding the benefit of significant liquidated damages (2015: $nil; 2014: $7m), and on a constant currency basis, operating profit increased by $47m (8.8%) to $584m.
Managed revenue increased by $63m (61.2%) to $166m, and operating profit increased by $17m (36.2%) to $64m. Revenue and operating profit included $38m (2014: $38m) and $nil (2014: $nil) respectively from one managed-lease property. Kimpton contributed $59m to managed estate revenue and $18m to operating profit, including $3m of significant liquidated damages. Managed operating profit was impacted by costs relating to our 20% interest in InterContinental New York Barclay during its refurbishment (2015: $4m; 2014: $5m). Excluding results for both Kimpton and managed-lease hotels and on a constant currency basis, revenue increased by $9m (13.8%) and operating profit increased by $2m (4.3%).
Owned and leased revenue decreased by $10m (7.2%) to $128m,and operating profit increased by $6m (33.3%) to $24m, following the disposal of two owned hotels (InterContinental Mark Hopkins San Francisco and an 80% interest in InterContinental New York Barclay) during 2014. Excluding these two hotels and on a constant currency basis, owned and leased revenue and operating profit increased by $13m and $5m, respectively, reflecting improved trading at InterContinental Boston and at Holiday Inn Aruba.
The Americas continued
Highlights for the year ended 31 December 2016With 3,925 hotels (487,993 rooms), The Americas represented 64% of the Group’s room count and 76% of the Group’s operating profit before central overheads and exceptional items for the year ended 31 December 2016. The key profit-producing region is the US, although the Group is also represented in Latin America, Canada, Mexico and the Caribbean. 88% of rooms in the region are operated under the franchise business model, primarily in the upper midscale segment (the Holiday Inn brand family). In the upscale segment, Crowne Plaza is predominantly franchised whereas, in the upper upscale segment, Kimpton is entirely managed. In the luxury segment, InterContinental-branded hotels are operated under both franchise and management agreements. 11 of the Group’s 12 hotel brands are represented in The Americas.
Revenue and operating profit increased by $38m (4.0%) to $993m and by $48m (8.6%) to $604m respectively. Operating profit before exceptional items increased by $36m (6.0%) to $633m. Underlyinga revenue increased by $53m (5.8%), while underlyinga operating profit increased by $46m (7.7%), driven predominantly by RevPAR growth in the fee business and an increase in net rooms. The underlying results exclude the impact of owned asset disposals, managed leases, and the benefit of significant liquidated damages receipts (2016: $nil; 2015: $3m).
Franchised revenue and operating profit increased by $24m (3.6%) to $685m and by $25m (4.3%) to $600m respectively. Royaltiesb growth of 2.4% was driven by comparable
Americas results
12 months ended 31 December
2016 $m
2015 $m
2016 vs 2015 % change
2014 $m
2015 vs 2014 % change
RevenueFranchised 685 661 3.6 630 4.9Managed 172 166 3.6 103 61.2Owned and leased 136 128 6.3 138 (7.2)Total 993 955 4.0 871 9.6Percentage of Group revenue 57.9 53.0 4.9 46.9 6.1Operating profit before exceptional itemsFranchised 600 575 4.3 544 5.7Managed 64 64 – 47 36.2Owned and leased 24 24 – 18 33.3
688 663 3.8 609 8.9Regional overheads (55) (66) 16.7 (65) (1.5)
633 597 6.0 544 9.7Exceptional items (29) (41) 29.3 110 (137.3)Operating profit 604 556 8.6 654 (15.0)Percentage of Group operating profit before central overheads and exceptional items
75.8 71.9 3.9 67.5 4.4
32 IHG Annual Report and Form 20-F 2016 Strategic Report

Performance
Total number of hotels
3,925Total number of rooms
487,993The Americas System size increased by 85 hotels (8,418 rooms) to 3,925 hotels (487,993 rooms) during 2016. 188 hotels (23,535 rooms) opened in the year, compared to 183 hotels (22,942 rooms) in 2015. Openings included 128 hotels (15,680 rooms) in the Holiday Inn brand family, representing 66.6% of the region’s openings.
103 hotels (15,117 rooms) were removed from The Americas System in 2016, demonstrating our continued commitment to quality, compared to 104 hotels (14,709 rooms) in 2015. 37.3% of 2016 room removals were Holiday Inn rooms in the US (30 hotels, 5,638 rooms) compared to 44.0% in 2015 (31 hotels, 6,466 rooms).
Total number of hotels in the pipeline
945Total number of rooms in the pipeline
102,451At 31 December 2016, The Americas pipeline totalled 945 hotels (102,451 rooms), representing an increase of 80 hotels (6,067 rooms) over the prior year. Strong signings of 332 hotels (37,038 rooms) were ahead of last year by seven hotels, but lower by 617 rooms. The majority of 2016 signings were within the Holiday Inn brand family (204 hotels, 21,826 rooms) and our extended-stay brands, Staybridge Suites and Candlewood Suites (93 hotels, 9,130 rooms).
64 hotels (7,436 rooms) were removed from the pipeline in 2016 compared, to 69 hotels (7,661 rooms) in 2015.
Americas hotel and room count
Hotels Rooms
At 31 December 2016Change
over 2015 2016Change
over 2015
Analysed by brandInterContinental 48 (2) 16,408 (701)
Kimpton 61 – 11,238 262Crowne Plaza 164 (8) 44,116 (2,200)Hotel Indigo 46 6 5,932 861EVEN Hotels 6 3 1,010 564Holiday Inna 774 2 136,744 749Holiday Inn Express 2,154 48 192,371 5,399
Staybridge Suites 226 15 24,185 1,523Candlewood Suites 362 21 34,192 1,864Other 84 – 21,797 97Total 3,925 85 487,993 8,418
Analysed by ownership typeFranchised 3,633 85 430,866 8,636Managed 286 (1) 55,302 (413)Owned and leased 6 1 1,825 195Total 3,925 85 487,993 8,418Percentage of Group hotel and room count
75.9 (0.4) 63.6 (0.8)
a Includes 25 Holiday Inn Resort properties (6,791 rooms) and 26 Holiday Inn Club Vacations properties (7,601 rooms) (2015: 23 Holiday Inn Resort properties (5,902 rooms) and 16 Holiday Inn Club Vacations properties (5,231 rooms)).
Americas pipeline
Hotels Rooms
At 31 December 2016Change
over 2015 2016Change
over 2015
Analysed by brandInterContinental 7 3 2,532 987Kimpton 17 (1) 2,949 (417)Crowne Plaza 17 2 3,286 796Hotel Indigo 32 2 3,965 (59)EVEN Hotels 6 (2) 780 (482)Holiday Innb 128 3 17,304 (899)Holiday Inn Express 488 39 46,796 2,851Staybridge Suites 131 26 13,896 2,666Candlewood Suites 108 10 9,604 884Other 11 (2) 1,339 (260)Total 945 80 102,451 6,067
Analysed by ownership type
Franchised 897 88 93,295 7,432Managed 48 (7) 9,156 (1,163)Owned and leased – (1) – (202)Total 945 80 102,451 6,067
b Includes three Holiday Inn Resort properties (455 rooms) (2015: seven Holiday Inn Resort properties (1,657 rooms)).
STRATEG
IC REP
OR
TG
OVER
NA
NC
EG
RO
UP FIN
AN
CIA
L STATEMEN
TSA
DD
ITION
AL IN
FOR
MATIO
NPA
REN
T CO
MPA
NY FIN
AN
CIA
L STATEMEN
TS
IHG Annual Report and Form 20-F 2016 33

PERFORMANCE CONTINUED
Europe
Continue to grow in priority markets and key cities, whilst driving brand preference, focusing on quality and innovation in guest experience, over the next three years.
PROGRESS AGAINST 2016 REGIONAL PRIORITIES
1. Grew our System size, and our potential for future growth, by focusing on significantly increasing our scale in Germany (see page 30). In 2016, 22 hotels were signed or opened.
2. Strengthened brand preference by embedding the new Holiday Inn open-lobby concept – 58 per cent of the estate has implemented or committed to implement it, which has already resulted in an eight percentage-point increase in Guest Love scores versus pre-refurbishment. Embedded the new room design for Holiday Inn Express – 56 per cent of the estate has implemented or committed to implement it, which has already resulted in a five percentage-point increase in Guest Love scores versus pre-refurbishment. Signed the first two Kimpton Hotels & Restaurants hotels in Europe’s key cities, the first to open in Amsterdam in early 2017.
3. Drove demand through our direct channels by rolling out Your Rate across the UK and Ireland, Belgium, Netherlands, France and Germany (see page 16).
IHG’S 2017 REGIONAL PRIORITIES
1. Grow System size by driving growth in our priority markets of the UK, Germany, and Russia and CIS, and across key cities, localising our brands as necessary.
2. Drive brand preference through the adoption of our innovative design concepts, including the Holiday Inn open-lobby concept and the new room design for Holiday Inn Express, thereby continuing to improve the guest experience and increase guest satisfaction. Establish Kimpton in the region, by building on the momentum of our 2016 signings.
3. Drive demand through our direct channels by completing the roll-out of Your Rate in the whole Europe region.
Industry performance in 2016The hotel industry in Europe is influenced by the larger markets in the region, notably the UK and Germany. Slowing demand due to security concerns held back European industry RevPAR in 2016, which increased by 2.5%. Regional room demand increased 1.4% and the average daily rate increased by 2.0%. RevPAR growth in the UK was 1.4%, driven by a 1.6% increase in average daily rate and a 1.8% increase in demand. In Germany, RevPAR saw strong growth of 4.7%, driven by a 3.7% growth in average daily rate and a 1.5% increase in demand. Russia saw growth of 15.7% driven by a 7.7% increase in average daily rate. Source Smith Travel Research for all of the above industry facts.
IHG’s regional performance in 2016IHG’s regional comparable RevPAR increased by 1.7%, driven by average daily rate growth of 1.4%. The UK achieved strong growth of 2.6%, ahead of the industry, led by average daily rate growth in the provinces. In Germany, a favourable trade fair calendar led to RevPAR growth of 6.8%, ahead of industry in both occupancy and average daily rate. Russia RevPAR increased by 16.4%, ahead of industry. Across the rest of Europe, RevPAR declined by 1.4%, impacted by challenging trading conditions in France, Turkey and Belgium.
Europe comparable RevPAR movement on previous year
12 months ended 31 December 2016
Franchised Managed
All brands 2.0% All brands (0.3)%
Group revenue 2016 ($1,715m)
Number of rooms (767,135)
12%
10%
14%
64%
58%
13%
7%
14%
8%
34 IHG Annual Report and Form 20-F 2016 Strategic Report

Performance
Europe results
12 months ended 31 December
2016 $m
2015 $m
2016 vs 2015 % change
2014 $m
2015 vs 2014 % change
RevenueFranchised 102 104 (1.9) 104 –Managed 125 131 (4.6) 159 (17.6)Owned and leased – 30 (100.0) 111 (73.0)Total 227 265 (14.3) 374 (29.1)Percentage of Group revenue 13.3 14.7 (1.4) 20.1 (5.4)Operating profit before exceptional itemsFranchised 78 77 1.3 78 (1.3)Managed 22 28 (21.4) 30 (6.7)Owned and leased – 1 (100.0) 14 (92.9)
100 106 (5.7) 122 (13.1)Regional overheads (25) (28) 10.7 (33) 15.2
75 78 (3.8) 89 (12.4)Exceptional items – 175 (100.0) (56) 412.5Operating profit 75 253 (70.4) 33 666.7Percentage of Group operating profit before central overheads and exceptional items
9.0 9.4 (0.4) 11.0 (1.6)
Franchised revenue decreased by $2m (1.9%) to $102m, whilst operating profit increased by $1m (1.3%) to $78m. On a constant currency basis, revenue and operating profit increased by $6m (5.8%) and $6m (7.8%) respectively.
Managed revenue decreased by $6m (4.6%) and operating profit decreased by $6m (21.4%). Revenue and operating profit included $77m (2015: $75m) and $2m (2015: $1m) respectively from managed leases. Excluding properties operated under this arrangement, and on a constant currency basis, revenue decreased by $5m (8.9%) and operating profit decreased by $6m (22.2%). Performance was impacted by difficult trading conditions for our hotels in Paris, and a revenue reduction in relation to three managed hotels; two of which have exited the system and one of which is undergoing a major refurbishment.
The last remaining hotel in the owned and leased estate, InterContinental Paris – Le Grand, was sold in 2015. Following this, revenue and operating profit in the estate decreased to nil. a Underlying excludes the impact of owned asset disposals,
significant liquidated damages and the results from managed-lease hotels, translated at constant currency by applying prior year exchange rates (see pages 156 and 157). Underlying operating profit growth also excludes the impact of exceptional items.
Highlights for the year ended 31 December 2015Revenue decreased by $109m (29.1%) to $265m and operating profit increased by $220m (666.7%) to $253m, primarily due to the gain on sale of the InterContinental Paris – Le Grand. Operating profit before exceptional items decreased by $11m (12.4%) to $78m. The decrease in revenue and operating profit before exceptional items was primarily due to InterContinental Paris – Le Grand becoming a managed property and the negative impact of significant foreign exchange translation movement. Underlyinga revenue and underlyinga operating profit increased by $13m (7.5%) and $17m (23.3%) respectively, with the transition of 61 UK managed hotels to franchise contracts driving an increase in underlying franchise fees, and cost efficiencies reducing regional overheads. Overall, comparable RevPAR in Europe increased by 5.4%, with the UK increasing by 5.1%, led by rate growth in both London and the provinces, and Germany growing by 4.4%.
Franchised revenue remained flat at $104m, whilst operating profit decreased by $1m (1.3%) to $77m. On a constant currency basis, revenue and operating profit increased by $15m (14.4%) and $11m (14.1%) respectively, following the transition of UK managed hotels to franchise contracts.
Managed revenue decreased by $28m (17.6%) and operating profit decreased by $2m (6.7%). Revenue and operating profit included $75m (2014: $90m) and $1m (2014: $2m) respectively from managed leases. Excluding properties operated under this arrangement, and on a constant currency basis, revenue decreased by $2m (2.9%) and operating profit increased by $3m (10.7%), impacted by the transition of UK managed hotels to franchise contracts.
The one remaining hotel in the owned and leased estate, InterContinental Paris – Le Grand, was sold on 20 May 2015 for gross proceeds of €330m. Owned and leased revenue decreased by $81m (73.0%) to $30m and operating profit decreased by $13m (92.9%) to $1m.
Highlights for the year ended 31 December 2016 Comprising 677 hotels (110,069 rooms) at the end of 2016, Europe represented 14% of the Group’s room count and 9% of the Group’s operating profit before central overheads and exceptional items for the year ended 31 December 2016. Revenues are primarily generated from hotels in the UK and continental European gateway cities. The largest proportion of rooms in Europe are operated under the franchise business model primarily in the upper midscale segment (Holiday Inn and Holiday Inn Express). Similarly, in the upscale segment, Crowne Plaza is predominantly franchised, whereas, in the luxury segment, the majority of InterContinental-branded hotels are operated under management agreements.
Revenue decreased by $38m (14.3%) to $227m and operating profit decreased by $178m (70.4%) to $75m, primarily due to the gain on sale of InterContinental Paris – Le Grand during the year ended 31 December 2015. Operating profit before exceptional items decreased by $3.0m (3.8%) to $75m. Underlyinga revenue increased by $1m (0.6%) and underlyinga operating profit stayed flat at $76m. Overall, comparable RevPAR in Europe increased by 1.7%, with the UK increasing by 2.6%, led by average daily rate growth in the provinces, Germany growing by 6.8% and Russia and CIS growing at 14.7%.
STRATEG
IC REP
OR
TG
OVER
NA
NC
EG
RO
UP FIN
AN
CIA
L STATEMEN
TSA
DD
ITION
AL IN
FOR
MATIO
NPA
REN
T CO
MPA
NY FIN
AN
CIA
L STATEMEN
TS
IHG Annual Report and Form 20-F 2016 35

Total number of hotels
677Total number of rooms
110,069During 2016, Europe System size increased by 17 hotels (3,358 rooms) to 677 hotels (110,069 rooms). The Group opened 24 hotels (4,188 rooms) in Europe in 2016, compared to 36 hotels (5,493 rooms) in 2015.
Seven hotels (830 rooms) left the Europe System in the period, compared to 23 hotels (2,990 rooms) in the previous year.
Total number of hotels in the pipeline
137Total number of rooms in the pipeline
23,954The Europe pipeline totalled 137 hotels (23,954 rooms) at 31 December 2016, representing an increase of 24 hotels (3,422 rooms) over 31 December 2015. New room signings reached their highest level since 2007 with 60 hotels (9,554 rooms), an increase of 12 hotels (728 rooms) from the prior year. Signings included 17 hotels (2,790 rooms) in Germany, a record number of signings for the third year running and 12 hotels (1,952 rooms) in the UK.
12 hotels (1,944 rooms) were removed from the pipeline in 2016, compared to 13 hotels (1,694 rooms) in 2015.
Europe hotel and room count
Hotels Rooms
At 31 December 2016Change
over 2015 2016Change
over 2015
Analysed by brandInterContinental 31 (1) 9,724 (162)Crowne Plaza 92 4 20,887 618Hotel Indigo 21 2 1,910 120Holiday Inna 291 6 47,829 1,679Holiday Inn Express 234 6 28,578 1,053Staybridge Suites 7 1 1,000 123Other 1 (1) 141 (73)
Total 677 17 110,069 3,358
Analysed by ownership typeFranchised 629 14 97,030 2,620Managed 48 3 13,039 738Total 677 17 110,069 3,358Percentage of Group hotel and room count
13.1 – 14.4 0.1
a Includes one Holiday Inn Resort property (88 rooms) (2015: two Holiday Inn Resort properties (212 rooms)).
Europe pipeline
Hotels Rooms
At 31 December 2016Change
over 2015 2016Change
over 2015
Analysed by brandInterContinental 6 1 813 (69)Kimpton 1 1 149 149Crowne Plaza 14 3 3,185 512Hotel Indigo 18 7 2,264 861Holiday Inn 35 (2) 7,511 (323)Holiday Inn Express 58 13 9,395 2,197Staybridge Suites 5 1 637 126Other – – – (31)Total 137 24 23,954 3,422
Analysed by ownership type
Franchised 111 23 17,908 3,781Managed 26 1 6,046 (359)Total 137 24 23,954 3,422
Europe continued
PERFORMANCE CONTINUED
36 IHG Annual Report and Form 20-F 2016 Strategic Report

Performance
Asia, Middle East and Africa (AMEA)
Focus on portfolio growth in key cities and resort destinations, while increasing our revenue share through enhanced guest satisfaction and greater loyalty contribution, over the next three years.
PROGRESS AGAINST 2016 REGIONAL PRIORITIES
1. Grew System size with in-year conversions of over 2,150 rooms in Japan, India, Indonesia and elsewhere. We accelerated our growth by signing over 10,500 rooms, most for full-service brands, and many in high RevPAR locations such as Japan, Australia and the Republic of Maldives.
2. Strengthened brand preference in the boutique and lifestyle segment in the AMEA region by opening the Hotel Indigo Singapore Katong, and entering into an agreement to introduce EVEN Hotels to Australia and New Zealand.
3. Supported our people strategy through the launch of our Learning Culture for General Managers and Corporate colleagues, to further leadership skills and business agility. Recognised by Great Places to Work as the third preferred employer in Singapore and fourth in Saudi Arabia across all industries.
IHG’S 2017 REGIONAL PRIORITIES
1. Grow System size in key cities and resort destinations through both new build and conversion signings. Particular attention to be paid to IHG’s strong portfolio of boutique and lifestyle brands to drive high-value growth.
2. Drive brand preference through relentless focus on service and enhance contribution from IHG Rewards Club, thereby continuing to improve the guest experience and increase guest satisfaction.
3. Drive superior returns for our owners through improved communication and refinement of our hotel design and opening processes, to ensure market-leading ROI.
Industry performance in 2016AMEA room demand growth was offset by supply growth, resulting in flat occupancy. Falling average daily rate in several key countries suppressed RevPAR growth to 0.9%. Slowing global trade and weak oil prices impacted lodging performance in Indonesia, United Arab Emirates (UAE) and Saudi Arabia. Industry RevPAR declined in all three countries by 4.0% in Indonesia, 8.5% in Saudi Arabia and 9.0% in UAE. Decreasing average daily rates were the principal driver in Indonesia and UAE, whilst both occupancy and average daily rate fell in Saudi Arabia. In contrast, Japan achieved solid RevPAR growth of 4.0% due to an increase in average daily rate. RevPAR increased in India by 5.9% and in Thailand by 3.7%, both led by occupancy growth. Australia RevPAR increased by 2.2%, driven by a 1.2% increase in average daily rate.Source Smith Travel Research for all of the above industry facts.
IHG’s regional performance in 2016Across this large region, IHG is widely represented, both geographically and by brand, meaning comparisons with the industry are hard to make. IHG regional comparable RevPAR decreased by 0.2% due to a decline in average daily rate, offset by occupancy gains. Middle East RevPAR declined by 7.0%, impacted by declining oil prices. Performance outside the Middle East was strong with 3.7% RevPAR growth overall. Performance was led by strong positive trading in the mature markets of Japan, where RevPAR increased by 3.6%, and in Australia where RevPAR increased by 2.9% ahead of the industry. India outperformed the market with strong RevPAR growth of 14.1%. Total RevPAR was down 2.0% for the year impacted by the proportion of hotel openings in developing markets where RevPARs are significantly lower than developed markets.
AMEA comparable RevPAR movement on previous year
12 months ended 31 December 2016
Franchised Managed
All brands (0.1)% All brands (0.2)%
Group revenue 2016 ($1,715m)
Number of rooms (767,135)
12%
10%
14%
64%
58%
13%
7%
14%
8%
STRATEG
IC REP
OR
TG
OVER
NA
NC
EG
RO
UP FIN
AN
CIA
L STATEMEN
TSA
DD
ITION
AL IN
FOR
MATIO
NPA
REN
T CO
MPA
NY FIN
AN
CIA
L STATEMEN
TS
IHG Annual Report and Form 20-F 2016 37

AMEA results
12 months ended 31 December
2016 $m
2015 $m
2016 vs 2015 % change
2014 $m
2015 vs 2014 % change
RevenueFranchised 16 16 – 16 –Managed 184 189 (2.6) 187 1.1Owned and leased 37 36 2.8 39 (7.7)Total 237 241 (1.7) 242 (0.4)Percentage of Group revenue 13.8 13.3 0.5 13.0 0.3Operating profit before exceptional itemsFranchised 12 12 – 12 –Managed 89 90 (1.1) 88 2.3Owned and leased 2 3 (33.3) 3 –
103 105 (1.9) 103 1.9Regional overheads (21) (19) (10.5) (19) –
82 86 (4.7) 84 2.4Exceptional items – (2) 100.0 – (100.0)Operating profit 82 84 (2.4) 84 –Percentage of Group operating profit before central overheads and exceptional items
9.8 10.4 (0.6) 10.5 (0.1)
On an actual and constant currency basis franchised revenue and operating profit remained flat at $16m and $12m respectively.
Managed revenue and operating profit decreased by $5m (2.6%) to $184m and $1m (1.1%) to $89m respectively. Revenue and operating profit included $51m (2015: $46m) and $5m (2015: $5m) respectively from one managed-lease property. Excluding results from this hotel and on a constant currency basis, revenue decreased by $9m (6.3%) to $134m, whilst operating profit remained flat at $85m. Good underlying growth in our managed business was offset by a $7m revenue reduction in relation to four hotels; three long standing contracts being renewed onto standard market terms and one equity stake disposal.
In the owned and leased estate, on an actual and constant currency basis, revenue increased by $1m (2.8%) to $37m and operating profit decreased by $1m (33.3%) to $2m. a Underlying excludes the impact of owned asset disposals,
significant liquidated damages and the results from managed-lease hotels, translated at constant currency by applying prior year exchange rates (see pages 156 and 157). Underlying operating profit growth also excludes the impact of exceptional items.
Highlights for the year ended 31 December 2015Revenue decreased by $1m (0.4%) to $241m, whilst operating profit remained flat at $84m. Operating before exceptional items increased by $2m (2.4%) to $86m. Revenue and operating profit before exceptional items were both adversely impacted by foreign exchange translation. Underlyinga revenue and underlyinga operating profit increased by $13m (6.5%) and $7m (8.7%) respectively.
Comparable RevPAR increased 4.5%, driven by growth in both rate and occupancy. Performance was led by strong positive trading in the mature markets of Japan, which grew by 14.6%, and Australia, which increased by 4.5%. South East Asia exhibited growth of 5.7%, however the Middle East increased by 0.2%, impacted by declining oil prices.
Franchised revenue and operating profit remained flat at $16m and $12m respectively. On a constant currency basis, revenue and operating profit increased by $1m (6.3%) and $1m (8.3%) respectively.
Managed revenue increased by $2m (1.1%) to $189m and operating profit increased by $2m (2.3%) to $90m. Comparable RevPAR increased by 5.4%, with the majority of rooms opening in the last quarter of 2015. Revenue and operating profit included $46m (2014: $41m) and $5m (2014: $4m) respectively from one managed-lease property. Excluding results from this hotel and on a constant currency basis, revenue increased by $9m (6.2%), whilst operating profit increased by $6m (7.1%).
In the owned and leased estate, revenue decreased by $3m (7.7%) to $36m and operating profit remained flat at $3m. On a constant currency basis, revenue increased by $3m (7.7%) and operating profit increased by $1m (33.3%).
Asia, Middle East and Africa (AMEA) continued
Highlights for the year ended 31 December 2016 Comprising 280 hotels (76,051 rooms) at 31 December 2016, AMEA represented 10% of the Group’s room count and contributed 10% of the Group’s operating profit before central overheads and exceptional items during the year. 83% of rooms in AMEA are operated under the managed business model.
Revenue and operating profit decreased by $4m (1.7%) to $237m and by $2m (2.4%) to $82m respectively. Operating profit before exceptional items decreased by $4m (4.7%) to $82m. Underlyinga revenue and underlyinga operating profit decreased by $8m (4.1%) and $3m (3.7%) respectively.
Comparable RevPAR decreased 0.2% primarily due to a fall in rate. Performance was positive in India, which grew by 14.1%, and Japan exhibited growth of 3.6%, however the Middle East decreased by 7.0%, impacted by declining oil prices and oversupply.
PERFORMANCE CONTINUED
38 IHG Annual Report and Form 20-F 2016 Strategic Report

Performance
Total number of hotels
280Total number of rooms
76,051The AMEA System size increased by 13 hotels (3,478 rooms) to 280 hotels (76,051 rooms) as at 31 December 2016. Openings decreased by five hotels (2,139 rooms) to 17 hotels (4,473 rooms) in 2016. Four hotels (995 rooms) were removed from the AMEA System in 2016, compared to eight hotels (1,915 rooms) in 2015.
AMEA hotel and room count
Hotels Rooms
At 31 December 2016Change
over 2015 2016Change
over 2015
Analysed by brandInterContinental 69 1 21,203 (35)Crowne Plaza 73 2 20,749 738Hotel Indigo 2 1 323 131Holiday Inna 93 2 21,312 328Holiday Inn Express 34 7 7,583 1,697Staybridge Suites 3 – 425 –Other 6 – 4,456 619Total 280 13 76,051 3,478
Analysed by ownership typeFranchised 55 3 12,570 646Managed 223 10 62,894 2,832Owned and leased 2 – 587 –Total 280 13 76,051 3,478Percentage of Group hotel and room count
5.4 0.1 9.9 0.1
a Includes 14 Holiday Inn Resort properties (2,953 rooms) (2015: 15 Holiday Inn Resort properties (3,169 rooms))
Total number of hotels in the pipeline
149Total number of rooms in the pipeline
39,643At 31 December 2016, the AMEA pipeline totalled 149 hotels (39,643 rooms) compared to 147 hotels (38,216 rooms) at 31 December 2015. Hotel signings in AMEA were at their highest since 2008 with 42 hotels (10,551 rooms), an increase of seven hotels although a fall in terms of rooms (1,890 rooms) from the level seen in 2015. Signings in 2016 included 23 hotels (5,934 rooms) in the Holiday Inn brand family and eight InterContinental hotels (1,737 rooms).
23 hotels (4,651 rooms) were removed from the pipeline in 2016, compared to eight hotels (1,959 rooms) in 2015.
AMEA pipeline
Hotels Rooms
At 31 December 2016Change
over 2015 2016Change
over 2015
Analysed by brandInterContinental 27 5 6,681 1,332Crowne Plaza 21 2 5,554 253Hotel Indigo 14 1 2,582 301Holiday Innb 48 3 13,022 1,493Holiday Inn Express 35 (8) 7,486 (1,858)Staybridge Suites 4 (1) 788 (112)Other – – 3,530 18Total 149 2 39,643 1,427
Analysed by ownership type
Franchised 11 3 2,406 227Managed 138 (1) 37,237 1,200Total 149 2 39,643 1,427
b Includes five Holiday Inn Resort properties (1,256 rooms) (2015: four Holiday Inn Resort properties (1,071 rooms)).
STRATEG
IC REP
OR
TG
OVER
NA
NC
EG
RO
UP FIN
AN
CIA
L STATEMEN
TSA
DD
ITION
AL IN
FOR
MATIO
NPA
REN
T CO
MPA
NY FIN
AN
CIA
L STATEMEN
TS
IHG Annual Report and Form 20-F 2016 39

PERFORMANCE CONTINUED
Greater China
Further grow System size, particularly in tier 2 and 3 cities and in the growing midscale segment, whilst developing a strong local talent pipeline for our hotels, over the next three years.
PROGRESS AGAINST 2016 REGIONAL PRIORITIES
1. Grew System size by opening five InterContinental hotels, including two flagship hotels in Beijing and Shanghai. We also signed 82 new hotels, including four HUALUXE hotels, and increased our pipeline to 239 hotels, out of which around 90 per cent are in tier 2 and 3 cities.
2. Drove superior returns for our owners through the successful introduction of the Franchise Plus business model for the Holiday Inn Express brand in May (see page 30), with a dedicated support structure to capture the growth opportunity in the midscale segment. In 2016, a total of 20 hotels under the Franchise Plus business model were signed.
3. Supported our people strategy through the resourcing and development of hotel talent. Rolled out the IHG Frontline programme to drive consistent and effective frontline training, with almost 150 hotels actively adopting the system.
IHG’S 2017 REGIONAL PRIORITIES
1. Grow System size, under both the managed and franchised business models, through a deeper penetration in tier 2 and 3 cities and a strengthened Holiday Inn and Holiday Inn Express presence to capture the growing midscale segment opportunity.
2. Maximise System size growth potential by further expanding IHG’s brand portfolio in the market. Continue to build brand awareness and drive performance of opened hotels for the HUALUXE brand.
3. Drive brand preference by focusing on the delivery of consistent guest experiences for our brands. Further tailor IHG enterprise platforms to better meet evolving market needs.
4. Support our people strategy by developing a strong local talent pipeline, particularly in tier 2 and 3 cities. Continue to develop and strengthen capabilities to support the needs of the franchise business.
Industry performance in 2016Lodging industry RevPAR growth in Greater China was flat in the year, an improvement on a 2.4% decline in 2015. Industry occupancy increased 1.6 points driven by a 6.4% increase in room demand. Average daily rate decreased by 2.5%. RevPAR in mainland China increased by 1.6%, driven by a 6.9% increase in room demand and an occupancy increase of 1.8 points. The average daily rate decreased by 1.3%. The country’s two largest city markets in terms of hotel rooms, Beijing and Shanghai, both increased RevPAR due to rising room demand. Shanghai RevPAR growth of 3.1% was due to an occupancy increase. Beijing RevPAR growth of 5.0% was due to both occupancy and a moderate average daily rate increase of 2.0%. RevPAR in Hong Kong and Macau declined by 2.1% and 9.1% respectively, both driven by average daily rate declines as room demand increased.Source Smith Travel Research for all of the above industry facts.
IHG’s regional performance in 2016IHG’s regional comparable RevPAR increased 2.2% in 2016, significantly ahead of the industry. Our RevPAR growth was driven by better than industry occupancy, which increased by 4.4%, whilst average daily rate decreased by 2.2%. Mainland China RevPAR increased by 3.9% led by growth of 6.3% in tier 1 cities driven by strong corporate demand. The rest of mainland China grew by 2.2%. Hong Kong RevPAR declined by 2.3%, slightly below the industry. Taiwan and Macau experienced significant trading declines of 10.5% and 13.5% respectively.
Greater China comparable RevPAR movement on previous year
12 months ended 31 December 2016
Managed
All brands 3.0%
Group revenue 2016 ($1,715m)
Number of rooms (767,135)
12%
10%
14%
64%
58%
13%
7%
14%
8%
40 IHG Annual Report and Form 20-F 2016 Strategic Report

Performance
Greater China results
12 months ended 31 December
2016 $m
2015 $m
2016 vs 2015 % change
2014 $m
2015 vs 2014 % change
RevenueFranchised 3 4 (25.0) 4 –Managed 114 105 8.6 99 6.1Owned and leased – 98 (100.0) 139 (29.5)Total 117 207 (43.5) 242 (14.5)Percentage of Group revenue 6.8 11.5 (4.7) 13.0 (1.5)Operating profit before exceptional itemsFranchised 3 5 (40.0) 5 –Managed 64 59 8.5 63 (6.3)Owned and leased – 29 (100.0) 42 (31.0)
67 93 (28.0) 110 (15.5)Regional overheads (22) (23) 4.3 (21) (9.5)
45 70 (35.7) 89 (21.3)Exceptional items – 698 (100.0) – 100.0Operating profit 45 768 (94.1) 89 762.9Percentage of Group operating profit before central overheads and exceptional items
5.4 8.4 (3.0) 11.0 (2.6)
On an actual and constant currency basis, franchised revenue and operating profit decreased by $1m (25.0%) and by $2m (40.0%) respectively.
Managed revenue and operating profit increased by $9m (8.6%) to $114m and by $5m (8.5%) to $64m respectively. Comparable RevPAR increased by 3.0%, whilst the Greater China System size grew by 9.0%, driving a 7.0% increase in total gross revenue derived from rooms business. Total gross revenue derived from non-rooms business increased by 6.8%, primarily due to increased food and beverage revenue. On a constant currency basis, revenue and operating profit increased by $15m (14.3%) to $120m and by $8m (13.6%) to $67m respectively, with ongoing investment in growth initiatives more than offset by scale efficiencies and strategic cost management.
The last remaining hotel in the owned and leased estate, InterContinental Hong Kong, was sold in 2015. Following this, revenue and operating profit in the estate decreased to nil.a Underlying excludes the impact of owned asset disposals,
significant liquidated damages and the results from managed-lease hotels, translated at constant currency by applying prior year exchange rates (see pages 156 and 157). Underlying operating profit growth also excludes the impact of exceptional items.
Highlights for the year ended 31 December 2015Revenue decreased by $35m (14.5%) to $207m and operating profit increased by $679m to $768m due to the gain on sale of InterContinental Hong Kong. Operating profit before exceptional items decreased by $19m (21.3%) to $70m. Underlyinga revenue increased by $8m (7.8%) due to the addition of over 20,000 rooms into the managed estate over the last two years. Underlyinga operating profit decreased by $5m (10.6%), impacted by $5m of ongoing investment into building long-term people capability, as well as the year-on-year impact from $5m of previously disclosed one-off upsides in 2014. Overall, the region achieved comparable RevPAR growth of 0.3%, significantly ahead of the industry, reflecting our scale and management strength in the region. Trading in mainland tier 1 cities was particularly strong, whilst the rest of mainland China showed marginal increases. Trading in Hong Kong and Macau significantly declined. Total RevPAR in Greater China decreased by 2.3% as more hotels opened into developing markets.
Franchised revenue and operating profit remained flat at $4m and $5m respectively.
Managed revenue increased by $6m (6.1%) to $105m, whilst operating profit decreased by $4m (6.3%) to $59m, impacted by the above-mentioned investment in people capability and previously disclosed one-off upsides in 2014. Comparable RevPAR increased by 1.1%, whilst the Greater China System size grew by 10.4%, driving a 4.8% increase in total gross revenue derived from rooms business. Total gross revenue derived from non-rooms business increased by 7.9%, due primarily to increased food and beverage revenue. On a constant currency basis, revenue increased by $8m (8.1%) to $107m, whilst operating profit decreased by $3m (4.8%) to $60m.
The one remaining hotel in the owned and leased estate, InterContinental Hong Kong, was sold on 30 September 2015 for proceeds of $928m after final working capital adjustments and cash tax. Owned and leased revenue decreased by $41m (29.5%) to $98m and operating profit decreased by $13m (31.0%) to $29m.
Highlights for the year ended 31 December 2016 Comprising 292 hotels (93,022 rooms) at 31 December 2016, Greater China represented approximately 12% of the Group’s room count and contributed approximately 5% of the Group’s operating profit before central overheads and exceptional items for the year ended 31 December 2016. 98% of rooms in Greater China are operated under the managed business model.
Revenue decreased by $90m (43.5%) to $117m and operating profit decreased by $723m (94.1%) to $45m, primarily due to the gain on sale of InterContinental Hong Kong in 2015. Operating profit before exceptional items decreased by $25m (35.7%) to $45m. Underlyinga revenue and underlyinga operating profit increased by $14m (12.8%) and by $6m (14.6%) respectively. Overall, the region achieved comparable RevPAR growth of 2.2%. Trading in mainland tier 1 cities was particularly strong, whilst the rest of mainland China showed slower growth.
STRATEG
IC REP
OR
TG
OVER
NA
NC
EG
RO
UP FIN
AN
CIA
L STATEMEN
TSA
DD
ITION
AL IN
FOR
MATIO
NPA
REN
T CO
MPA
NY FIN
AN
CIA
L STATEMEN
TS
IHG Annual Report and Form 20-F 2016 41
Total number of hotels
292Total number of rooms
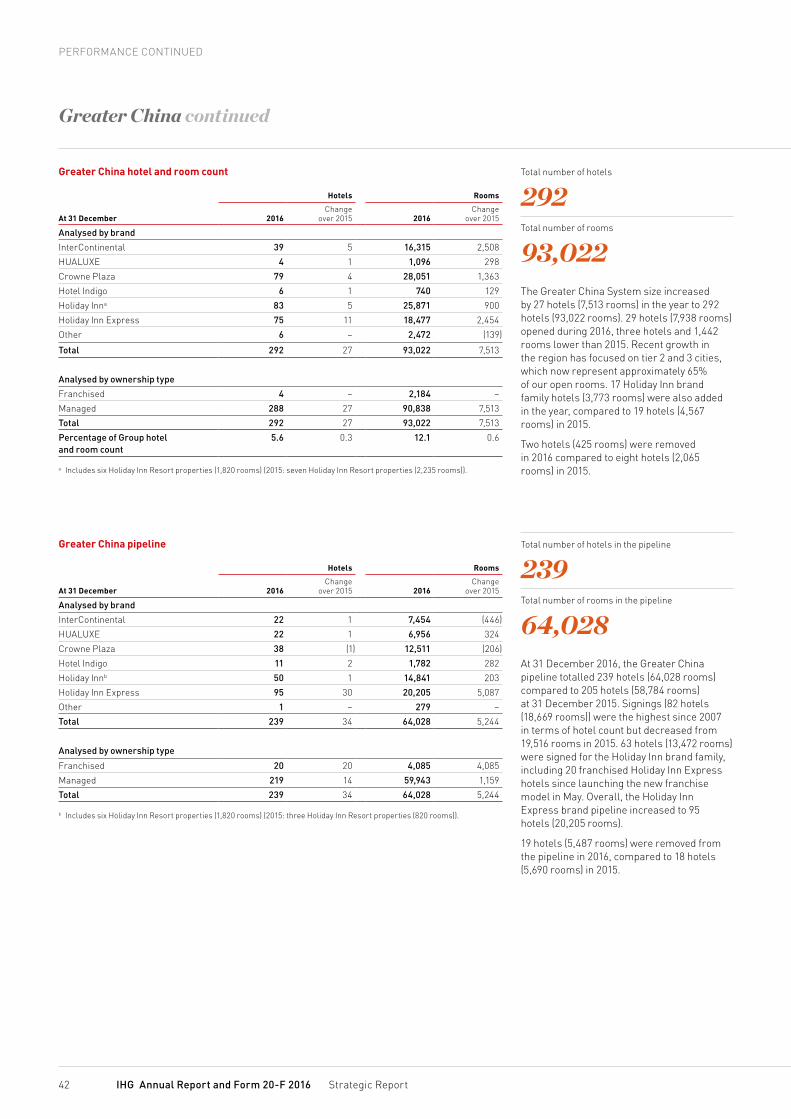
93,022The Greater China System size increased by 27 hotels (7,513 rooms) in the year to 292 hotels (93,022 rooms). 29 hotels (7,938 rooms) opened during 2016, three hotels and 1,442 rooms lower than 2015. Recent growth in the region has focused on tier 2 and 3 cities, which now represent approximately 65% of our open rooms. 17 Holiday Inn brand family hotels (3,773 rooms) were also added in the year, compared to 19 hotels (4,567 rooms) in 2015.
Two hotels (425 rooms) were removed in 2016 compared to eight hotels (2,065 rooms) in 2015.
Total number of hotels in the pipeline
239Total number of rooms in the pipeline
64,028At 31 December 2016, the Greater China pipeline totalled 239 hotels (64,028 rooms) compared to 205 hotels (58,784 rooms) at 31 December 2015. Signings (82 hotels (18,669 rooms)) were the highest since 2007 in terms of hotel count but decreased from 19,516 rooms in 2015. 63 hotels (13,472 rooms) were signed for the Holiday Inn brand family, including 20 franchised Holiday Inn Express hotels since launching the new franchise model in May. Overall, the Holiday Inn Express brand pipeline increased to 95 hotels (20,205 rooms).
19 hotels (5,487 rooms) were removed from the pipeline in 2016, compared to 18 hotels (5,690 rooms) in 2015.
Greater China hotel and room count
Hotels Rooms
At 31 December 2016Change
over 2015 2016Change
over 2015
Analysed by brandInterContinental 39 5 16,315 2,508HUALUXE 4 1 1,096 298Crowne Plaza 79 4 28,051 1,363Hotel Indigo 6 1 740 129Holiday Inna 83 5 25,871 900Holiday Inn Express 75 11 18,477 2,454Other 6 – 2,472 (139)
Total 292 27 93,022 7,513
Analysed by ownership typeFranchised 4 – 2,184 –Managed 288 27 90,838 7,513Total 292 27 93,022 7,513Percentage of Group hotel and room count
5.6 0.3 12.1 0.6
a Includes six Holiday Inn Resort properties (1,820 rooms) (2015: seven Holiday Inn Resort properties (2,235 rooms)).
Greater China pipeline
Hotels Rooms
At 31 December 2016Change
over 2015 2016Change
over 2015
Analysed by brandInterContinental 22 1 7,454 (446)HUALUXE 22 1 6,956 324Crowne Plaza 38 (1) 12,511 (206)Hotel Indigo 11 2 1,782 282Holiday Innb 50 1 14,841 203Holiday Inn Express 95 30 20,205 5,087Other 1 – 279 –Total 239 34 64,028 5,244
Analysed by ownership type
Franchised 20 20 4,085 4,085Managed 219 14 59,943 1,159Total 239 34 64,028 5,244
b Includes six Holiday Inn Resort properties (1,820 rooms) (2015: three Holiday Inn Resort properties (820 rooms)).
Greater China continued
PERFORMANCE CONTINUED
42 IHG Annual Report and Form 20-F 2016 Strategic Report

Performance
Central
System Fund assessments
12 months ended 31 December
2016 $m
2015 $m
2016 vs 2015 % change
2014 $m
2015 vs 2014 % change
Assessment fees and contributions received from hotels
1,439 1,351 6.5 1,271 6.3
Proceeds from sale of IHG Rewards Club points
283 222 27.5 196 13.3
Total 1,722 1,573 9.5 1,467 7.2
Highlights for the year ended 31 December 2016In the year to 31 December 2016, System Fund income increased by 9.5% to $1,722m primarily as a result of a 6.5% increase in assessment fees and contributions from hotels resulting from increased hotel room revenues, reflecting increases in RevPAR and IHG System size. Continued strong performance in co-branded credit card schemes drove the 27.5% increase in proceeds from the sale of IHG Rewards Club points.
Highlights for the year ended 31 December 2015In the year to 31 December 2015, System Fund income increased by 7.2% to $1,573m primarily as a result of a 6.3% increase in assessment fees and contributions from hotels resulting from increased hotel room revenues, reflecting increases in RevPAR and IHG System size. Continued strong performance in co-branded credit card schemes drove the 13.3% increase in proceeds from the sale of IHG Rewards Club points.
Highlights for the year ended 31 December 2016The net operating loss decreased by $34m (21.0%) compared to 2015. Central revenue, which mainly comprises technology fee income, increased by $6m (4.4%) to $141m (an increase of $9m (6.7%) at constant currency), driven by increases in both comparable RevPAR (1.8%) and IHG System size (3.1%). At constant currency, gross costs decreased by $3m (1.0%) compared to 2015 (a $17m or 5.9% decrease at actual currency) driven by a continued focus on strategic cost management. Net operating loss before exceptional items decreased by $23m (15.2%) to $128m (a $12m or 7.9% decrease to $139m at constant currency).
System Fund
Central results
12 months ended 31 December
2016 $m
2015 $m
2016 vs 2015 % change
2014 $m
2015 vs 2014 % change
Revenue 141 135 4.4 129 4.7
Gross costs (269) (286) 5.9 (284) (0.7)Operating loss before exceptional items
(128) (151) 15.2 (155) 2.6
Exceptional items – (11) 100.0 (25) 56.0Operating loss (128) (162) 21.0 (180) 10.0
Highlights for the year ended 31 December 2015The net operating loss decreased by $18m (10.0%) compared to 2014. Central revenue, which mainly comprises technology fee income, increased by $6m (4.7%) to $135m, driven by increases in both comparable RevPAR (4.4%) and IHG System size (4.8%, 3.2% excluding Kimpton). At constant currency, gross costs increased by $13m (4.6%) compared to 2014 (a $2m or 0.7% increase at actual currency). Net operating loss before exceptional items decreased by $4m (2.6%) to $151m (a $5m or 3.2% increase to $160m at constant currency).
In addition to franchise or management fees, hotels within the IHG System pay assessments and contributions (other than for Kimpton and InterContinental) which are collected by IHG for specific use within the System Fund. The System Fund also receives proceeds from the sale of IHG Rewards Club points. The System Fund is managed for the benefit of hotels in the IHG System with the objective of driving revenues for the hotels.
The System Fund is used to pay for marketing, the IHG Rewards Club loyalty programme and the Guest Reservation System. The operation of the System Fund does not result in a profit or loss for the Group and consequently the revenues and expenses of the System Fund are not included in the Group Income Statement.
STRATEG
IC REP
OR
TG
OVER
NA
NC
EG
RO
UP FIN
AN
CIA
L STATEMEN
TSA
DD
ITION
AL IN
FOR
MATIO
NPA
REN
T CO
MPA
NY FIN
AN
CIA
L STATEMEN
TS
IHG Annual Report and Form 20-F 2016 43

DIVIDEND POLICY
PERFORMANCE CONTINUED
Other financial information
Exceptional itemsExceptional items totalled a loss of $29m which included $13m relating to the cost of integrating Kimpton into the operations of the Group and a $16m impairment charge relating to the Barclay associate which owns InterContinental New York Barclay, a hotel managed by the Group. The impairment charge reflects the currently depressed trading outlook for the New York market and the high cost of renovation of the hotel. See note 5 to the Group Financial Statements which provides further detail.
Exceptional items are treated as exceptional by reason of their size or nature and are excluded from the calculation of adjusted earnings per ordinary share in order to provide a more meaningful comparison of performance (for more information see page 26).
Net financial expensesNet financial expenses were flat at $87m, reflecting the issue of £350m 2.125% public bonds in August 2016, and a full year of interest on the £300m 3.75% bonds issued in August 2015, offset by the impact of a weaker pound on translation of sterling interest expense.
Financing costs included $3m (2015: $2m) of interest costs associated with IHG Rewards Club where interest is charged on the accumulated balance of cash received in advance of the redemption of points awarded. Financing costs in 2016 also included $20m (2015: $20m) in respect of the InterContinental Boston finance lease.
TaxationThe effective rate of tax on operating profit excluding the impact of exceptional items was 30% (2015: 30%). Excluding the impact of prior-year items, the equivalent tax rate would be 31% (2015: 36%). This rate is higher than the average UK statutory rate of 20% (2015: 20.25%), due mainly to certain overseas profits (particularly in the US) being subject to statutory tax rates higher than the UK statutory rate, unrelieved foreign taxes and disallowable expenses.
Taxation within exceptional items totalled a credit of $12m (2015: charge of $8m). In 2016, the credit included a $6m deferred tax credit in respect of the impairment charge relating to the Barclay associate and a $5m deferred tax credit representing future tax relief on $13m of Kimpton integration costs. In 2015, the charge comprised $56m relating to the disposal of InterContinental Hong Kong and InterContinental Paris – Le Grand, a credit of $21m in respect of the 2014 disposal of an 80% interest in InterContinental New York Barclay reflecting the judgement that state tax law changes would now apply to the deferred gain and credits of $27m for current and deferred tax relief on other operating exceptional items of current and prior years.
Net tax paid in 2016 totalled $130m (2015: $110m, including $1m in respect of disposals). Tax paid represents an effective rate of 22% (2015: 8%) on total profits and is lower than the effective income statement tax rate of 30% (2015: 30%), primarily due to the timing of US tax payments and the impact of deferred taxes.
IHG pursues an approach to tax that is consistent with its business strategy and its overall business conduct principles. This approach seeks to ensure full compliance with all tax filing, payment and reporting obligations on the basis of communicative and transparent relationships with tax authorities. Policies and procedures related to tax risk management are subject to regular review and update and are approved by the IHG Audit Committee.
The Group’s Approach to Tax document is available on IHG’s website at www.ihgplc.com/responsible-business under Policies.
Tax liabilities or refunds may differ from those anticipated, in particular as a result of changes in tax law, changes in the interpretation of tax law, or clarification of uncertainties in the application of tax law. Procedures to minimise risk include the preparation of thorough tax risk assessments for all transactions carrying material tax risk and, where appropriate,
material tax uncertainties are discussed and resolved with tax authorities in advance.
IHG’s contribution to the jurisdictions in which it operates includes a significant contribution in the form of taxes borne and collected, including taxes on its revenues and profits and in respect of the employment its business generates. IHG earns approximately 80% of its revenues in the form of franchise, management or similar fees, with almost 85% of IHG-branded hotels being franchised. In jurisdictions in which IHG does franchise business, the prevailing tax law will generally provide for IHG to be taxed in the form of local withholding taxes based on a percentage of fees rather than based on profits. Costs to support the franchise business are normally incurred regionally or globally, and therefore profits for an individual franchise jurisdiction cannot be separately determined.
DividendsThe Board has proposed a final dividend per ordinary share of 64.0¢. With the interim dividend per ordinary share of 30.0¢, the full-year dividend per ordinary share for 2016 will total 94.0¢, an increase of 11% over 2015.
In February 2017, the Board proposed a $400m return of funds to shareholders by way of a special dividend and share consolidation.
IHG pays its dividends in pounds sterling and US dollars. The sterling amount of the final and special dividend will be announced on 11 May 2017 using the average of the daily exchange rates from 8 May 2017 to 10 May 2017 inclusive.
Earnings per ordinary shareBasic earnings per ordinary share decreased by 62.4% to 195.3¢ from 520.0¢ in 2015. Adjusted earnings per ordinary share increased by 16.2% to 203.3¢ from 174.9¢ in 2015.
Share price and market capitalisationThe IHG share price closed at £36.38 on 31 December 2016, up from £26.58 on 31 December 2015. The market capitalisation of the Group at the year end was £7.2bn.
The Group’s business is highly cash-generative and the Group has three primary uses for its cash; investing to drive growth, maintaining sustainable growth in the ordinary dividend and returning surplus funds to shareholders. These are kept under constant review by the Board.
IHG has a progressive dividend policy, which means growing dividend per ordinary share each year. The Group has an excellent track record of returning funds to shareholders through ordinary and special dividends and
share buybacks, with the ordinary dividend seeing 11% CAGR since 2003. This is in addition to special returns of funds detailed on page 178.
The Group seeks to maintain an efficient balance sheet and investment grade credit rating and aims to maintain a net debt:EBITDA ratio of 2.0 – 2.5x. The ratio at 31 December 2016 was 1.9x, however, this is before the payment of the $400 return of funds to shareholders via a special dividend with share consolidation proposed by the Board in February 2017.
Ordinary dividend progression (¢)
Interim Final
0
20
40
60
80
100
2003
2004
2005
2006
2007
2008
2009
2010
2011
2012
2013
2014
2015
2016
Cen
ts
11%
7 8 8 10 12 12 12 13 16 21 23 25 28 3017 19 1926
29 29 2935
3943
4752
58 64
44 IHG Annual Report and Form 20-F 2016 Strategic Report

Performance
Sources of liquidityIn August 2016, the Group issued a £350m, 10-year bond at a 2.125% coupon rate, the lowest funding rate the Group has achieved in the sterling bond market. The bonds are repayable in 2026, extending the maturity profile of the Group’s debt.
This is in addition to £400m of public bonds which are repayable on 28 November 2022 and £300m of public bonds which are repayable on 14 August 2025. On 9 December 2016, the Group repaid £250m of maturing public bonds which were issued in 2009.
The Group is further financed by a $1.275bn revolving syndicated bank facility (the Syndicated Facility) and a $75m revolving bilateral facility (the Bilateral facility) which mature in March 2021, with a one-year extension option exercisable in 2017. $110m was drawn under the Syndicated Facility at the year end.
The Syndicated and Bilateral facilities contain the same terms and two financial covenants; interest cover; and net debt divided by earnings before interest, tax, depreciation and amortisation (EBITDA). The Group is in compliance with all of the financial covenants in its loan documents, none of which is expected to present a material restriction on funding in the near future.
Additional funding is provided by the 99-year finance lease (of which 89 years remain) on InterContinental Boston and other uncommitted bank facilities (see note 20 to the Group Financial Statements). In the Group’s opinion, the available facilities are sufficient for the Group’s present liquidity requirements.
Net debt of $1,506m (2015: $529m) is analysed by currency as follows:
2016 $m
2015 $m
BorrowingsSterling 1,289 1,405US dollar 418 253Euros 2 4Other 3 4
Cash and cash equivalentsSterling (27) (619)US dollar (127) (460)Euros (12) (15)Canadian dollar (8) (8)Chinese renminbi (7) (4)Other (25) (31)Net debt 1,506 529Average debt level 1,235 1,420
Borrowings included bank overdrafts of $89m (2015: $39m), which were matched by an equivalent amount of cash and cash equivalents under the Group’s cash pooling arrangements. Under these arrangements, each pool contains a number of bank accounts with the same financial institution, and the Group pays interest on net overdraft balances within each pool. The cash pools are used for day-to-day cash management purposes and are managed daily as closely as possible to a zero balance on a net basis for each pool. Overseas subsidiaries are typically in a cash-positive position, with the most significant balances in the US, Canada, and Singapore, and the matching overdrafts are held by the Group’s central treasury company in the UK.
Cash and cash equivalents include $3m (2015: $1m) that is not available for use by the Group due to local exchange controls.
Information on the maturity profile and interest structure of borrowings is included in notes 20 and 22 to the Group Financial Statements.
The Group had net liabilities of $759m at 31 December 2016, (net assets of $319m at 31 December 2015), with the decrease due to the $1.5bn special dividend paid in May 2016.
Cash from operating activitiesNet cash from operating activities totalled $752m for the year ended 31 December 2016, up $124m on the previous year largely due to cash receipts on behalf of the System Fund of approximately $95m from renegotiation of long-term partnership agreements.
Cash flow from operating activities is the principal source of cash used to fund the ongoing operating expenses, interest payments, maintenance capital expenditure and normal dividend payments of the Group. The Group believes that the requirements of its existing business and future investment can be met from cash generated internally, disposition of assets, and external finance expected to be available to it.
Cash from investing activitiesNet cash outflows from investing activities totalled $216m. In 2015 net cash inflows totalled $589m, including $1,277m of disposal proceeds primarily related to the disposal of InterContinental Paris – Le Grand and InterContinental Hong Kong and $438m on the acquisition of Kimpton Hotels & Restaurants. Excluding the effect of these major acquisitions and disposals, net cash outflows from investing activities decreased by $34m, primarily driven by proceeds from other financial assets in 2016.
The Group had committed contractual capital expenditure of $97m at 31 December 2016 (2015: $76m).
Cash used in financing activitiesNet cash used in financing activities totalled $1,456m, which was $1,346m higher than 2015, mainly due to the $1.5bn special dividend paid in May 2016. Net cash inflows from borrowings were $150m higher than in 2015.
Overall net debt increased during the year by $977m to $1,506m as at 31 December 2016.
Off-balance sheet arrangementsAt 31 December 2016, the Group had no off-balance sheet arrangements that have or are reasonably likely to have a current or future material effect on the Group’s financial condition, revenues or expenses, results of operations, liquidity, capital expenditures or capital resources.
Contractual obligationsThe Group had the following contractual obligations outstanding as of 31 December 2016.
$m
Total amounts
committed
Less than
1 year
1–3 years
3–5 years
After 5 years
Long-term debt obligationsa, b
1,402 – – 110 1,292
Interest payableb
320 42 84 84 110
Derivatives 3 3 – – –Finance lease obligationsc
3,333 17 32 32 3,252
Operating lease obligations
590 53 92 99 346
Agreed pension scheme contributions
5 5 – – –
Capital contracts placed
97 97 – – –
Total 5,750 217 208 325 5,000
a Repayment period classified according to the related facility maturity date.
b Excluding bank overdrafts.c Mainly represents the minimum lease payments related
to the 99-year lease (of which 89 years remain) on InterContinental Boston. Payments under the lease step up at regular intervals over the lease term.
Contingent liabilitiesContingent liabilities include performance guarantees with possible cash outflows totalling $14m, guarantees over the debt of equity investments of $33m, outstanding letters of credit of $37m, and an indemnity over a $43m bank loan made to an associate. The Group may also be exposed to additional liabilities resulting from security incidents. See note 30 to the Group Financial Statements for further details.
Liquidity and capital resources
STRATEG
IC REP
OR
TG
OVER
NA
NC
EG
RO
UP FIN
AN
CIA
L STATEMEN
TSA
DD
ITION
AL IN
FOR
MATIO
NPA
REN
T CO
MPA
NY FIN
AN
CIA
L STATEMEN
TS
IHG Annual Report and Form 20-F 2016 45