intercloud systems -...
TRANSCRIPT
Corporate Overview
InterCloud Systems
2
Disclaimers
This presentation contains forward-looking statements. All statements other than statements of historical
facts contained in this presentation, including statements regarding InterCloud’s future results of
operations and financial position, financial targets, business strategy, plans and objectives for future
operations, are forward-looking statements. The Company has based these forward-looking statements
largely on its current estimates of its financial results and its current expectations and projections about
future events and financial trends that it believes may affect its financial condition, results of operations,
business strategy, short-term and long-term business operations and objectives, and financial needs as of
the date of this presentation. These forward-looking statements are subject to a number of risks,
uncertainties and assumptions. Moreover, the Company operates in a very competitive and rapidly
changing environment. New risks emerge from time to time. It is not possible for Company management to
predict all risks, nor can the Company assess the impact of all factors on its business or the extent to which
any factor, or combination of factors, may cause actual results to differ materially from those contained in
any forward-looking statements the Company may make. In light of these risks, uncertainties and
assumptions, the forward-looking events and circumstances discussed in this presentation may not occur
and actual results could differ materially and adversely from those anticipated or implied in the forward-
looking statements.
More detailed information about the risk factors affecting the Company’s performance is available under the
heading “Risk Factors” in the Company’s filings with the Securities and Exchange Commission (the “SEC”),
which are available on the SEC’s website, www.sec.gov. Readers are cautioned not to place undue reliance
on these forward-looking statements, which reflect management’s analyses only as of the date hereof. The
Company neither intends to, nor assumes any obligation to, update or revise these forward-looking
statements in light of developments that differ from those anticipated.
3
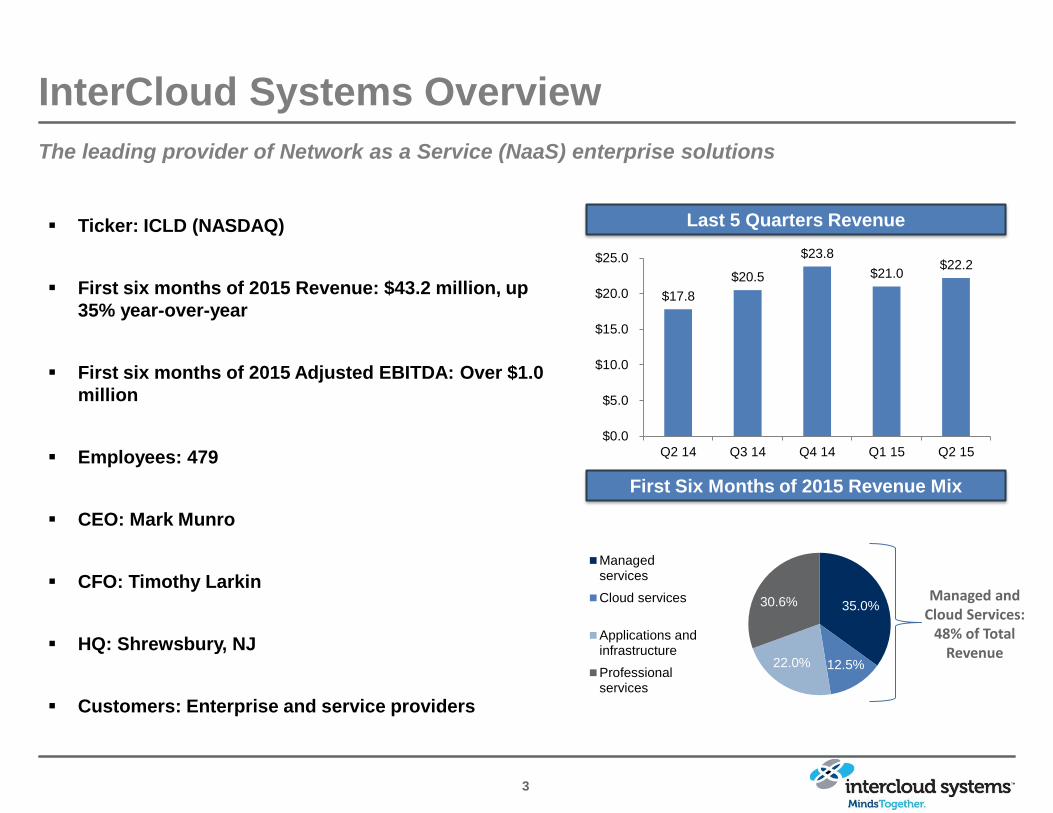
InterCloud Systems Overview
The leading provider of Network as a Service (NaaS) enterprise solutions
Ticker: ICLD (NASDAQ)
First six months of 2015 Revenue: $43.2 million, up
35% year-over-year
First six months of 2015 Adjusted EBITDA: Over $1.0
million
Employees: 479
CEO: Mark Munro
CFO: Timothy Larkin
HQ: Shrewsbury, NJ
Customers: Enterprise and service providers
Last 5 Quarters Revenue
First Six Months of 2015 Revenue Mix
Managed and Cloud Services:
48% of Total Revenue
35.0%
12.5% 22.0%
30.6%
Managedservices
Cloud services
Applications andinfrastructure
Professionalservices
$17.8
$20.5
$23.8
$21.0 $22.2
$0.0
$5.0
$10.0
$15.0
$20.0
$25.0
Q2 14 Q3 14 Q4 14 Q1 15 Q2 15

4
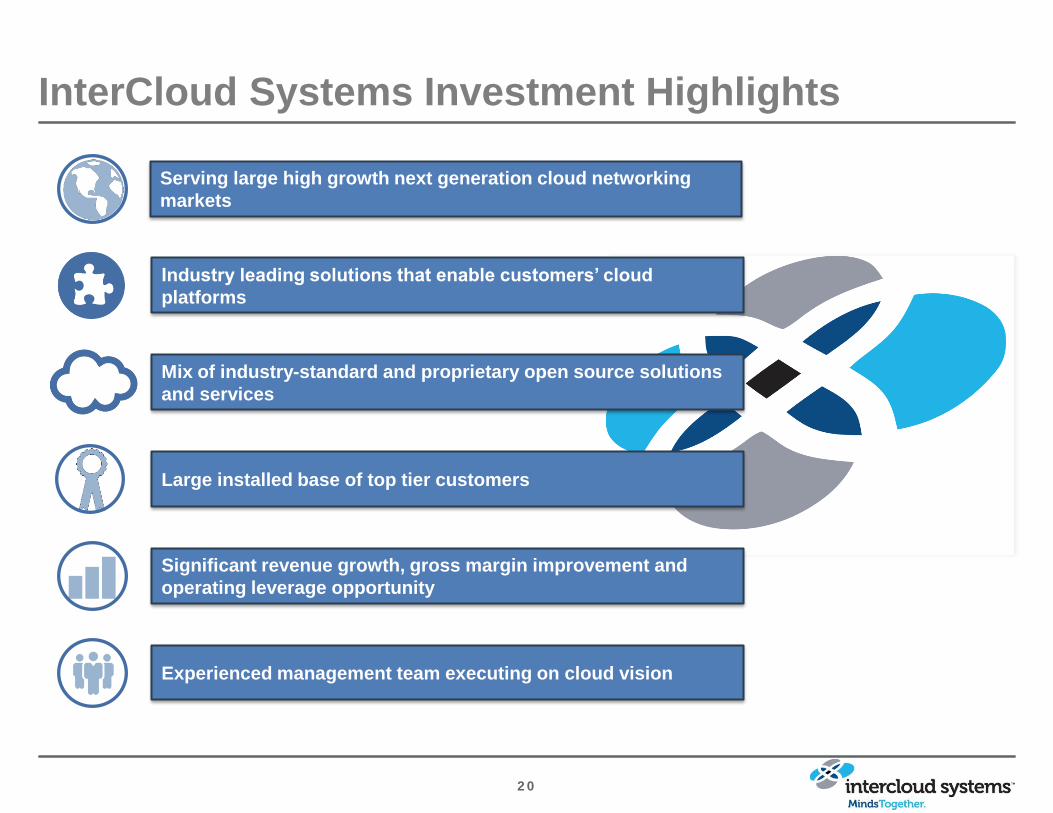
InterCloud Systems Investment Highlights
Serving large high growth next generation cloud networking
markets
Industry leading solutions that enable customers’ cloud
platforms
Mix of industry-standard and proprietary open source solutions
and services
Large installed base of top tier customers
Significant revenue growth, gross margin improvement and
operating leverage opportunity
Experienced management team executing on cloud vision
5
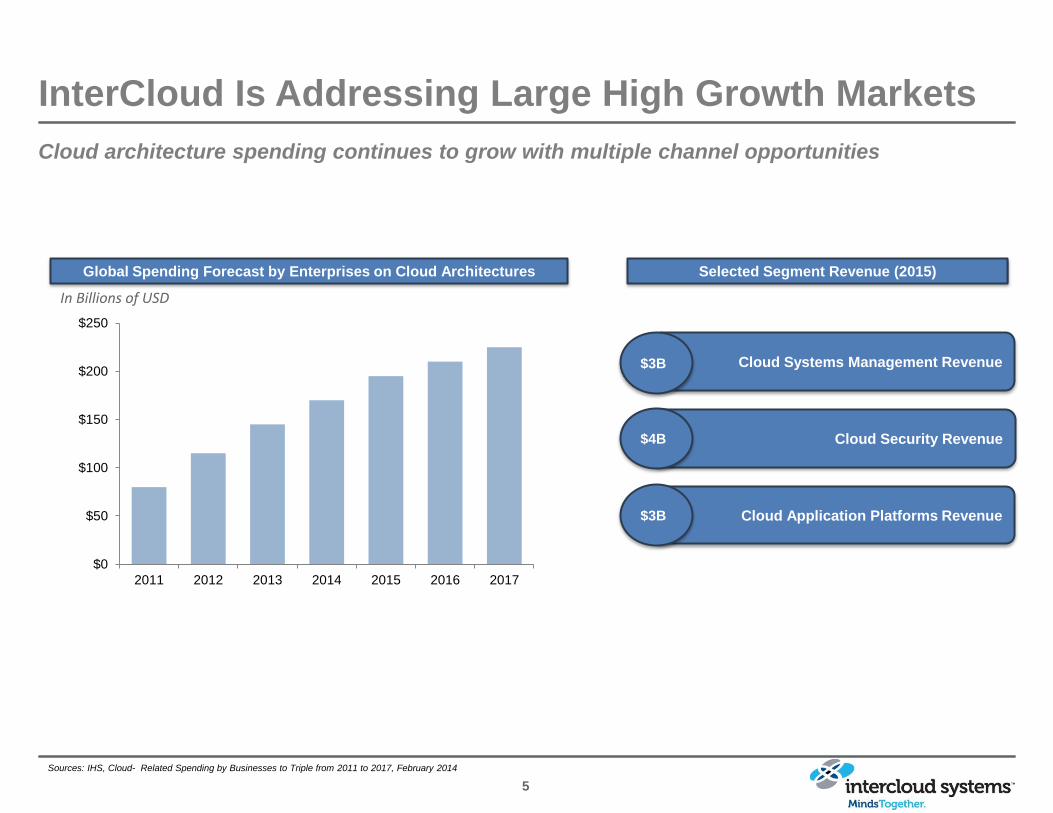
Cloud architecture spending continues to grow with multiple channel opportunities
InterCloud Is Addressing Large High Growth Markets
Sources: IHS, Cloud- Related Spending by Businesses to Triple from 2011 to 2017, February 2014
Cloud Application Platforms Revenue
Cloud Systems Management Revenue
Cloud Security Revenue
$3B
$4B
$3B
Selected Segment Revenue (2015) Global Spending Forecast by Enterprises on Cloud Architectures
$0
$50
$100
$150
$200
$250
2011 2012 2013 2014 2015 2016 2017
In Billions of USD
6
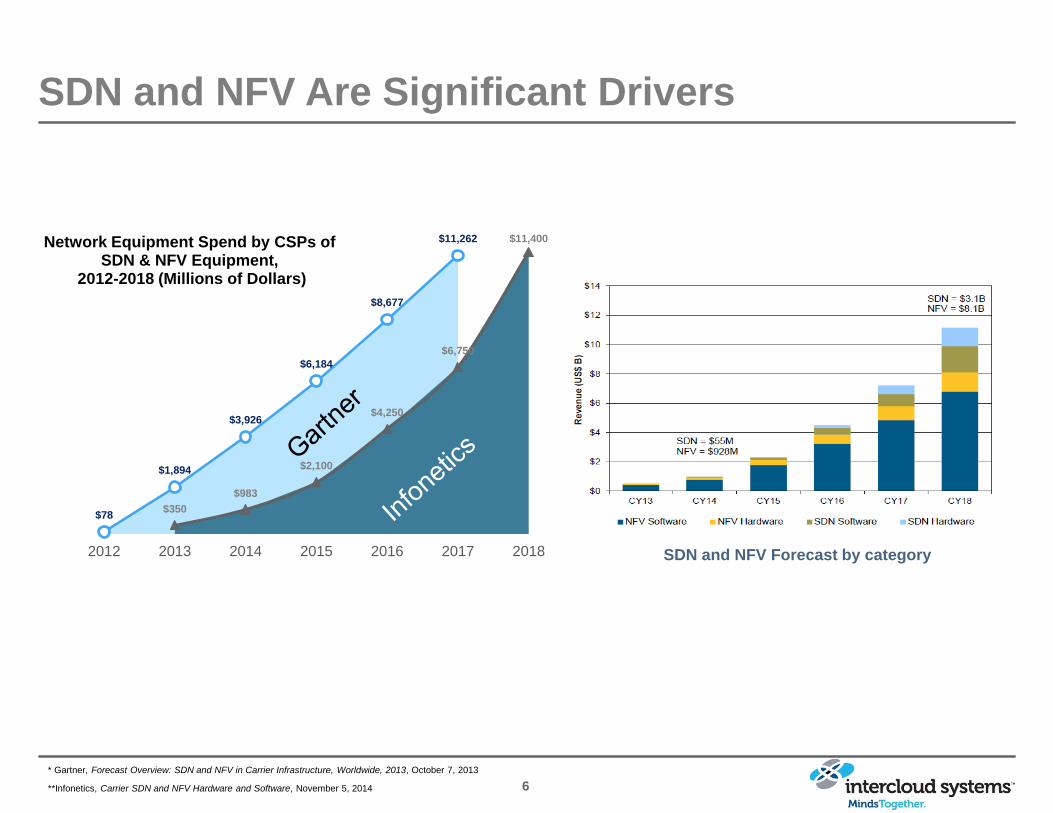
SDN and NFV Are Significant Drivers
$78
$1,894
$3,926
$6,184
$8,677
$11,262
$350
$983
$2,100
$4,250
$6,750
$11,400
0
2000
4000
6000
8000
10000
12000
2012 2013 2014 2015 2016 2017 2018
Network Equipment Spend by CSPs of SDN & NFV Equipment,
2012-2018 (Millions of Dollars)
SDN and NFV Forecast by category
* Gartner, Forecast Overview: SDN and NFV in Carrier Infrastructure, Worldwide, 2013, October 7, 2013
**Infonetics, Carrier SDN and NFV Hardware and Software, November 5, 2014
7
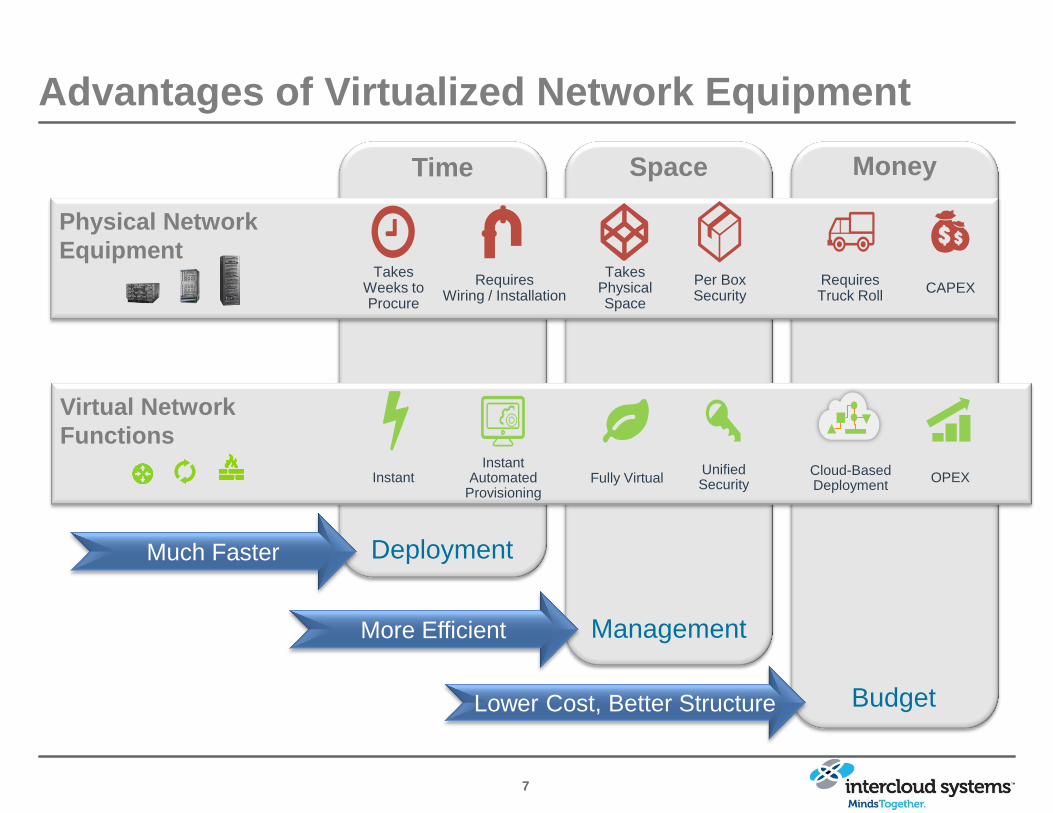
Advantages of Virtualized Network Equipment
Budget
Management
Deployment
Physical Network
Equipment Takes
Weeks to Procure
Requires Wiring / Installation
Takes Physical Space
Per Box Security
Requires Truck Roll
CAPEX
Virtual Network
Functions
Instant Instant
Automated Provisioning
Fully Virtual Unified Security
Cloud-Based Deployment
OPEX
Much Faster
More Efficient
Lower Cost, Better Structure
Time Space Money
8
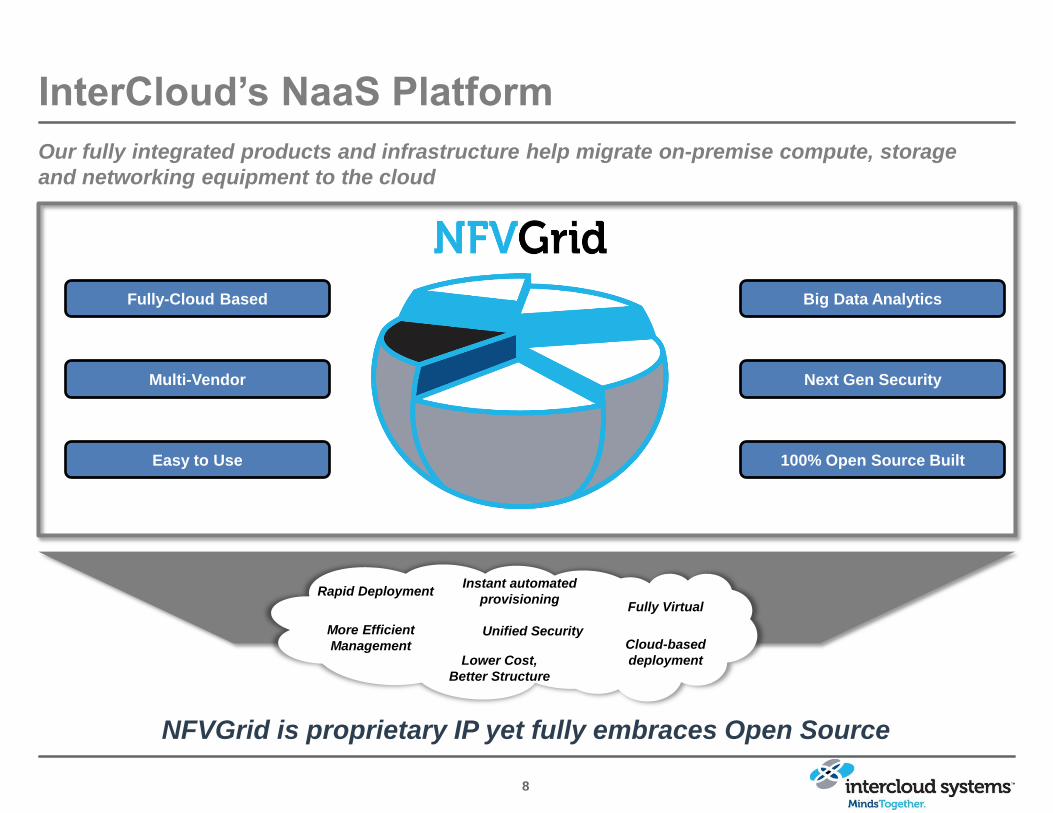
InterCloud’s NaaS Platform
NFVGrid is proprietary IP yet fully embraces Open Source
Our fully integrated products and infrastructure help migrate on-premise compute, storage
and networking equipment to the cloud
Fully-Cloud Based
Multi-Vendor
Easy to Use
Big Data Analytics
Next Gen Security
100% Open Source Built
0000
Rapid Deployment
Lower Cost,
Better Structure
Fully Virtual
Unified Security Cloud-based
deployment
Instant automated
provisioning
More Efficient
Management
9
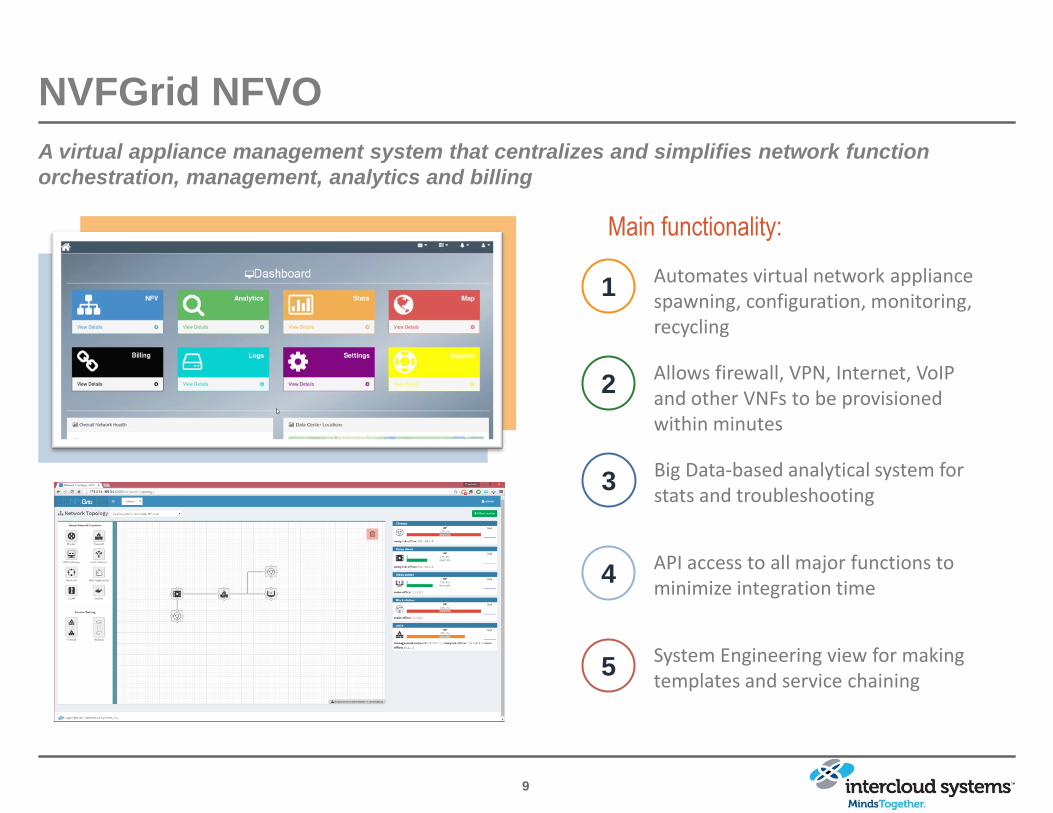
NVFGrid NFVO
A virtual appliance management system that centralizes and simplifies network function
orchestration, management, analytics and billing
Main functionality:
1 Automates virtual network appliance spawning, configuration, monitoring, recycling
2 Allows firewall, VPN, Internet, VoIP and other VNFs to be provisioned within minutes
3 Big Data-based analytical system for stats and troubleshooting
4 API access to all major functions to minimize integration time
5 System Engineering view for making templates and service chaining
1 0
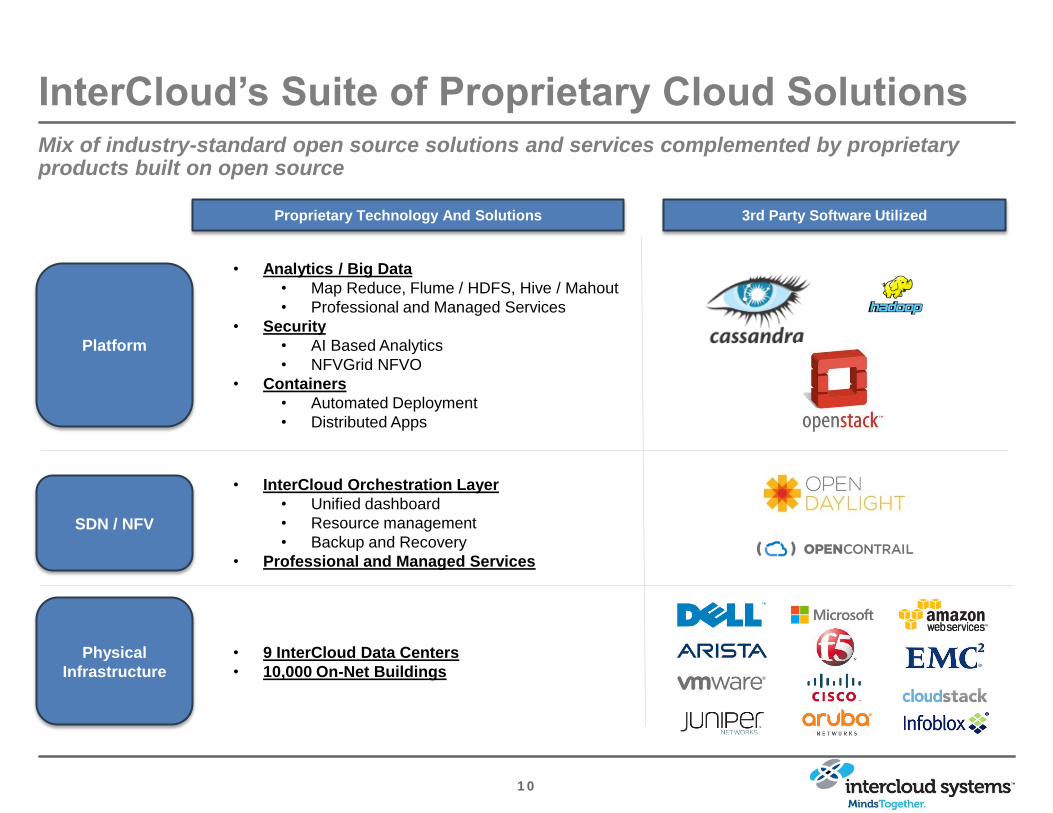
InterCloud’s Suite of Proprietary Cloud Solutions Mix of industry-standard open source solutions and services complemented by proprietary products built on open source
Platform
SDN / NFV
Physical
Infrastructure
Proprietary Technology And Solutions 3rd Party Software Utilized
• Analytics / Big Data
• Map Reduce, Flume / HDFS, Hive / Mahout
• Professional and Managed Services
• Security
• AI Based Analytics
• NFVGrid NFVO
• Containers
• Automated Deployment
• Distributed Apps
• InterCloud Orchestration Layer
• Unified dashboard
• Resource management
• Backup and Recovery
• Professional and Managed Services
• 9 InterCloud Data Centers
• 10,000 On-Net Buildings

1 1
Representative Verticals / Customers
Tier 1, 2, 3 Service
Providers
Other
Enterprise
Customers
Retail and
Manufacturers
Medical and
Public Sector
Enterprise Customers and GEM
Financial and
Insurance
50%
Vertical % of 2014 Revenue Representative Customers
40%
SMB 10K customers 10%
1 2
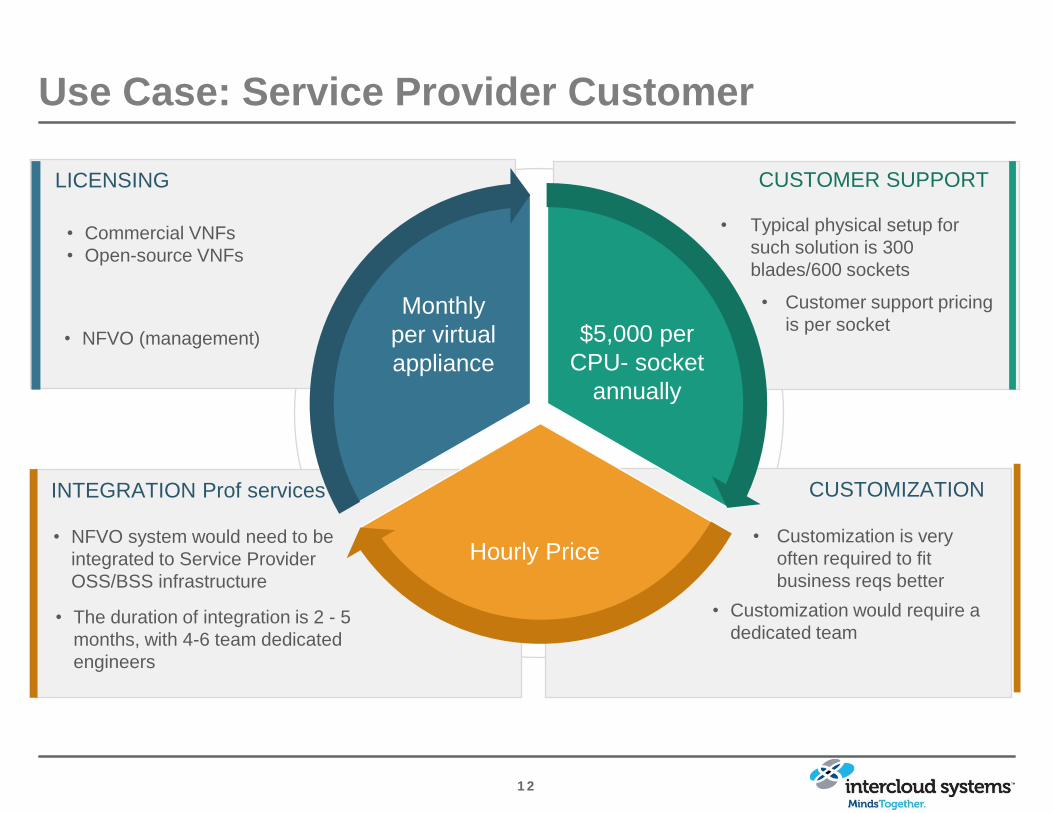
Use Case: Service Provider Customer
LICENSING
• Commercial VNFs
• Open-source VNFs
• NFVO (management)
CUSTOMER SUPPORT
• Typical physical setup for
such solution is 300
blades/600 sockets
• Customer support pricing
is per socket
INTEGRATION Prof services
• NFVO system would need to be
integrated to Service Provider
OSS/BSS infrastructure
• The duration of integration is 2 - 5
months, with 4-6 team dedicated
engineers
CUSTOMIZATION
• Customization is very
often required to fit
business reqs better
• Customization would require a
dedicated team
Network function +
Management
Monthly
per virtual
appliance
$5,000 per
CPU- socket
annually
Hourly Price
1 3
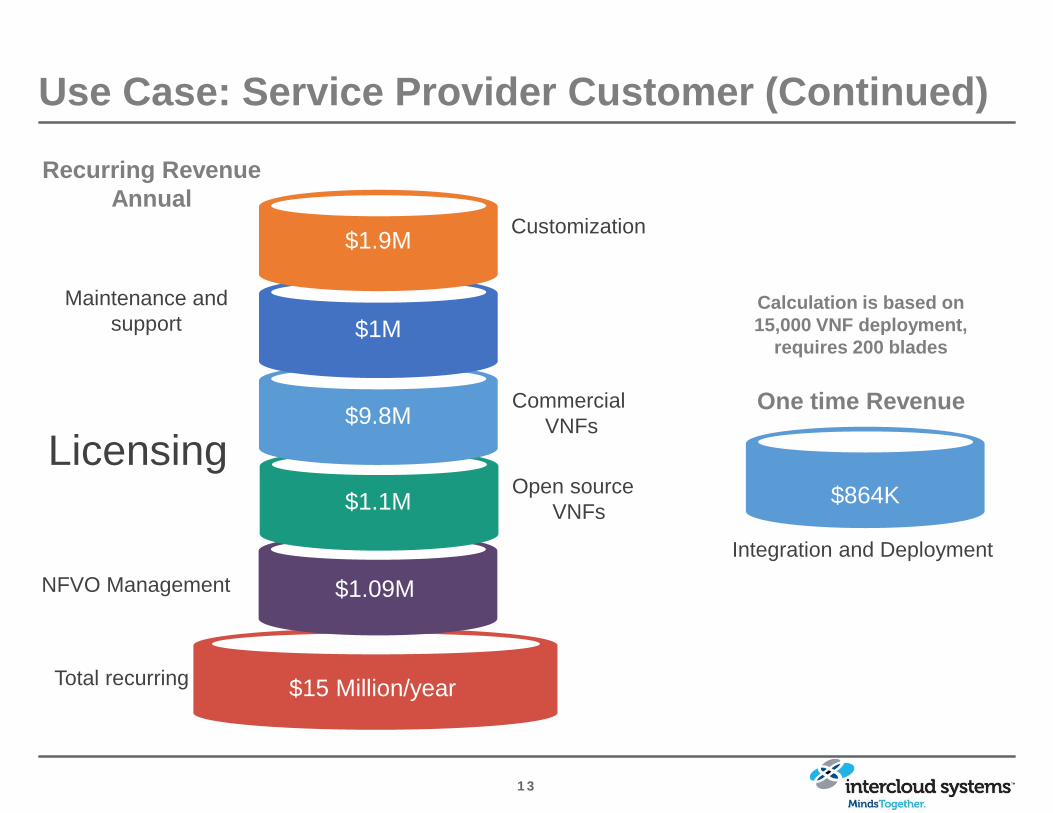
Use Case: Service Provider Customer (Continued)
Customization
Commercial
VNFs
Maintenance and
support
Total recurring
$9.8M
$1M
$1.9M
Recurring Revenue
Annual
$15 Million/year
$864K
Integration and Deployment
One time Revenue
Calculation is based on
15,000 VNF deployment,
requires 200 blades
NFVO Management $1.09M
Licensing Open source
VNFs $1.1M
1 4
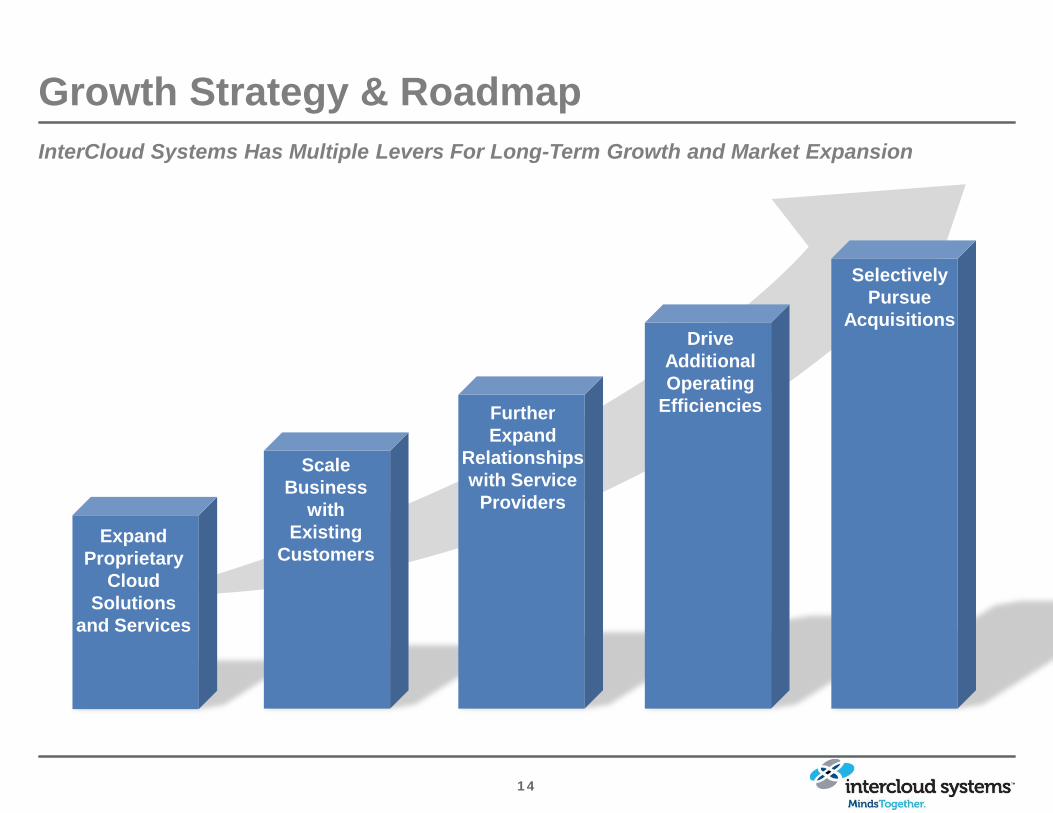
Growth Strategy & Roadmap
InterCloud Systems Has Multiple Levers For Long-Term Growth and Market Expansion
Expand
Proprietary
Cloud
Solutions
and Services
Scale
Business
with
Existing
Customers
Further
Expand
Relationships
with Service
Providers
Drive
Additional
Operating
Efficiencies
Selectively
Pursue
Acquisitions
1 5
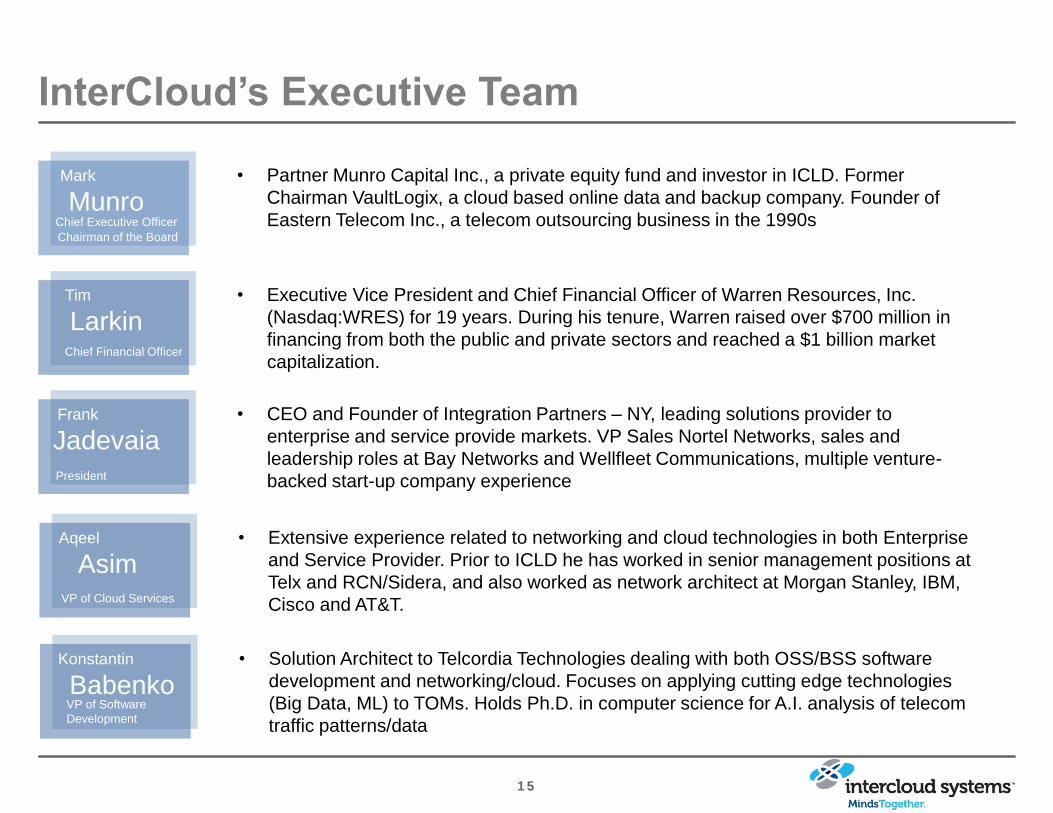
InterCloud’s Executive Team
• Executive Vice President and Chief Financial Officer of Warren Resources, Inc.
(Nasdaq:WRES) for 19 years. During his tenure, Warren raised over $700 million in
financing from both the public and private sectors and reached a $1 billion market
capitalization.
Mark
Munro Chief Executive Officer
Chairman of the Board
• Partner Munro Capital Inc., a private equity fund and investor in ICLD. Former
Chairman VaultLogix, a cloud based online data and backup company. Founder of
Eastern Telecom Inc., a telecom outsourcing business in the 1990s
• CEO and Founder of Integration Partners – NY, leading solutions provider to
enterprise and service provide markets. VP Sales Nortel Networks, sales and
leadership roles at Bay Networks and Wellfleet Communications, multiple venture-
backed start-up company experience
• Extensive experience related to networking and cloud technologies in both Enterprise
and Service Provider. Prior to ICLD he has worked in senior management positions at
Telx and RCN/Sidera, and also worked as network architect at Morgan Stanley, IBM,
Cisco and AT&T.
• Solution Architect to Telcordia Technologies dealing with both OSS/BSS software
development and networking/cloud. Focuses on applying cutting edge technologies
(Big Data, ML) to TOMs. Holds Ph.D. in computer science for A.I. analysis of telecom
traffic patterns/data
Tim
Larkin Chief Financial Officer
Konstantin
Babenko VP of Software
Development
Frank
Jadevaia President
Aqeel
Asim VP of Cloud Services
1 6
Financial Highlights
• Strong revenue growth in recent years driven by growth of cloud services and
acquisitions
• Cloud and Managed Services account for 48% of revenue in the first half of 2015, up
from 41% in 2014
• Increasing revenue visibility from recurring revenue
• 29% in the first half of 2015, up from 10% in the first half of 2014
• Increasing gross margins driven by growth of cloud solutions and services
• 32% in the first half of 2015, up from 30% in the first half of 2014
• Significant operating leverage
• Adjusted EBITDA of over $1.0 million in the first half of 2015
• De-leveraging balance sheet
• Potential for conversion of related party debt and other debt
• Higher coupon debt to be repaid with cash flow or refinanced in due course
1 7
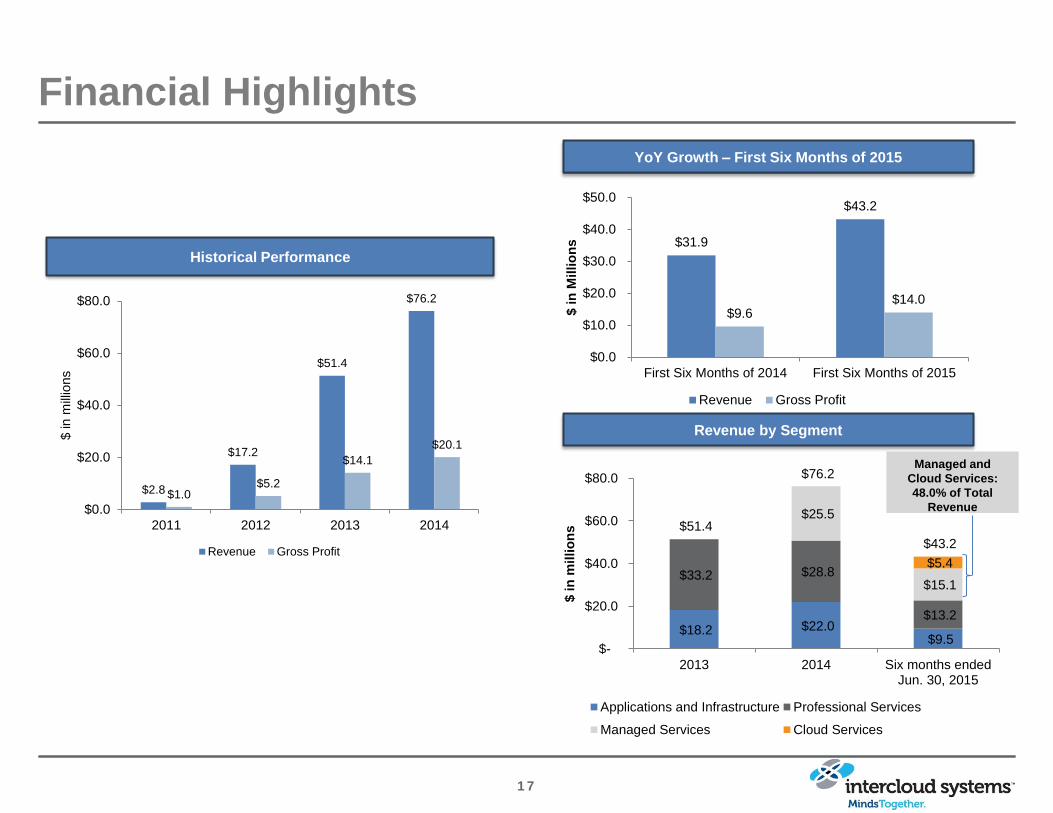
Financial Highlights
Historical Performance
Revenue by Segment
YoY Growth – First Six Months of 2015
$2.8
$17.2
$51.4
$76.2
$1.0 $5.2
$14.1
$20.1
$0.0
$20.0
$40.0
$60.0
$80.0
2011 2012 2013 2014
$ in m
illio
ns
Revenue Gross Profit
$31.9
$43.2
$9.6 $14.0
$0.0
$10.0
$20.0
$30.0
$40.0
$50.0
First Six Months of 2014 First Six Months of 2015
$ in
Millio
ns
Revenue Gross Profit
Managed and
Cloud Services:
48.0% of Total
Revenue
$18.2 $22.0 $9.5
$33.2 $28.8
$13.2
$25.5
$15.1
$5.4
$51.4
$76.2
$43.2
$-
$20.0
$40.0
$60.0
$80.0
2013 2014 Six months endedJun. 30, 2015
$ in
millio
ns
Applications and Infrastructure Professional Services
Managed Services Cloud Services
1 8
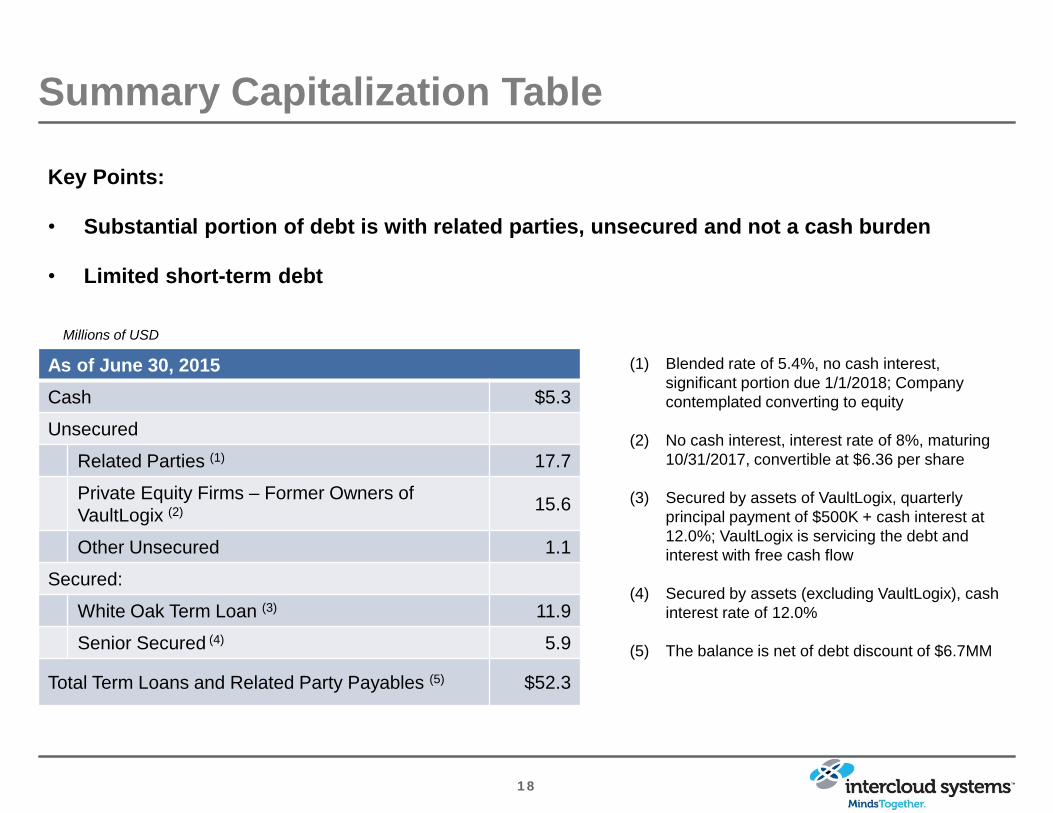
Summary Capitalization Table
Key Points:
• Substantial portion of debt is with related parties, unsecured and not a cash burden
• Limited short-term debt
Millions of USD
As of June 30, 2015
Cash $5.3
Unsecured
Related Parties (1) 17.7
Private Equity Firms – Former Owners of
VaultLogix (2) 15.6
Other Unsecured 1.1
Secured:
White Oak Term Loan (3) 11.9
Senior Secured (4) 5.9
Total Term Loans and Related Party Payables (5) $52.3
(1) Blended rate of 5.4%, no cash interest,
significant portion due 1/1/2018; Company
contemplated converting to equity
(2) No cash interest, interest rate of 8%, maturing
10/31/2017, convertible at $6.36 per share
(3) Secured by assets of VaultLogix, quarterly
principal payment of $500K + cash interest at
12.0%; VaultLogix is servicing the debt and
interest with free cash flow
(4) Secured by assets (excluding VaultLogix), cash
interest rate of 12.0%
(5) The balance is net of debt discount of $6.7MM
1 9
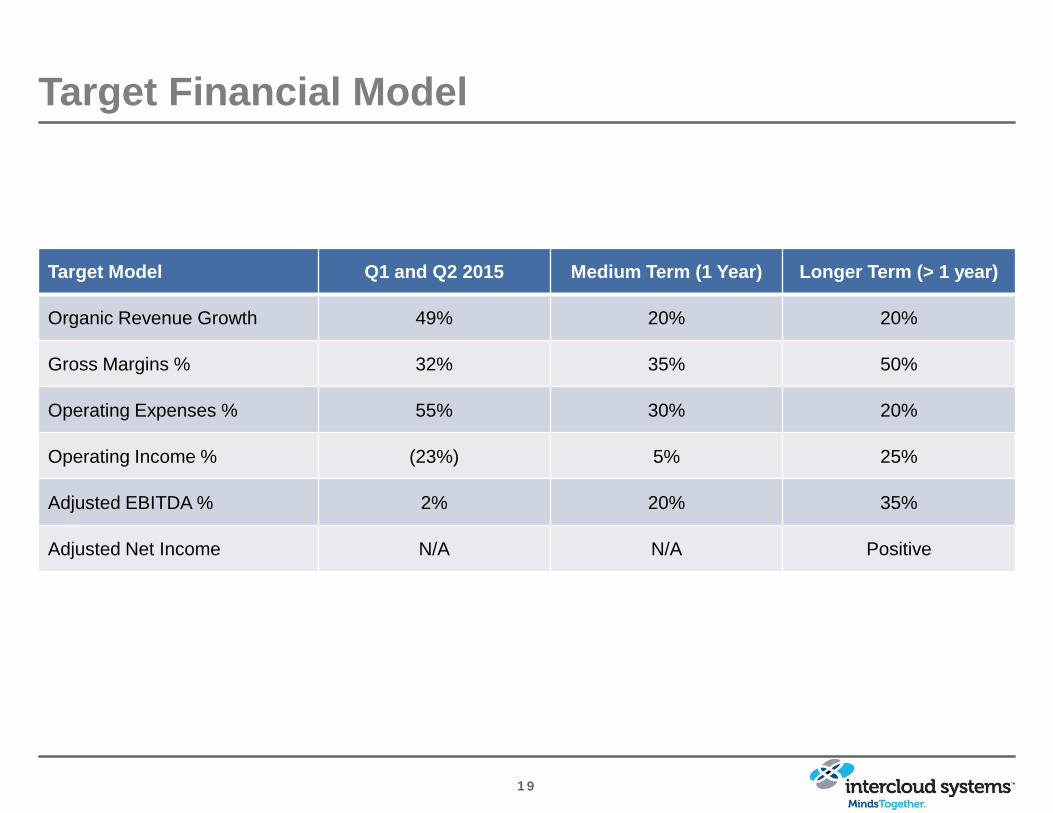
Target Financial Model
Target Model Q1 and Q2 2015 Medium Term (1 Year) Longer Term (> 1 year)
Organic Revenue Growth 49% 20% 20%
Gross Margins % 32% 35% 50%
Operating Expenses % 55% 30% 20%
Operating Income % (23%) 5% 25%
Adjusted EBITDA % 2% 20% 35%
Adjusted Net Income N/A N/A Positive
2 0
InterCloud Systems Investment Highlights
Serving large high growth next generation cloud networking
markets
Industry leading solutions that enable customers’ cloud
platforms
Mix of industry-standard and proprietary open source solutions
and services
Large installed base of top tier customers
Significant revenue growth, gross margin improvement and
operating leverage opportunity
Experienced management team executing on cloud vision