interannual time scales: enso decadal time scales:
DESCRIPTION
Marine Ecosystems and Climate Variability. Interannual Time Scales: ENSO Decadal Time Scales: Basin Wide Variability (e.g. Pacific Decadal Oscillation, North Atlantic Oscillation ) Longer Time Scales: Warming trend. ENSO. A. SST Anomalies – Jan 1998. Less upwelling - PowerPoint PPT PresentationTRANSCRIPT
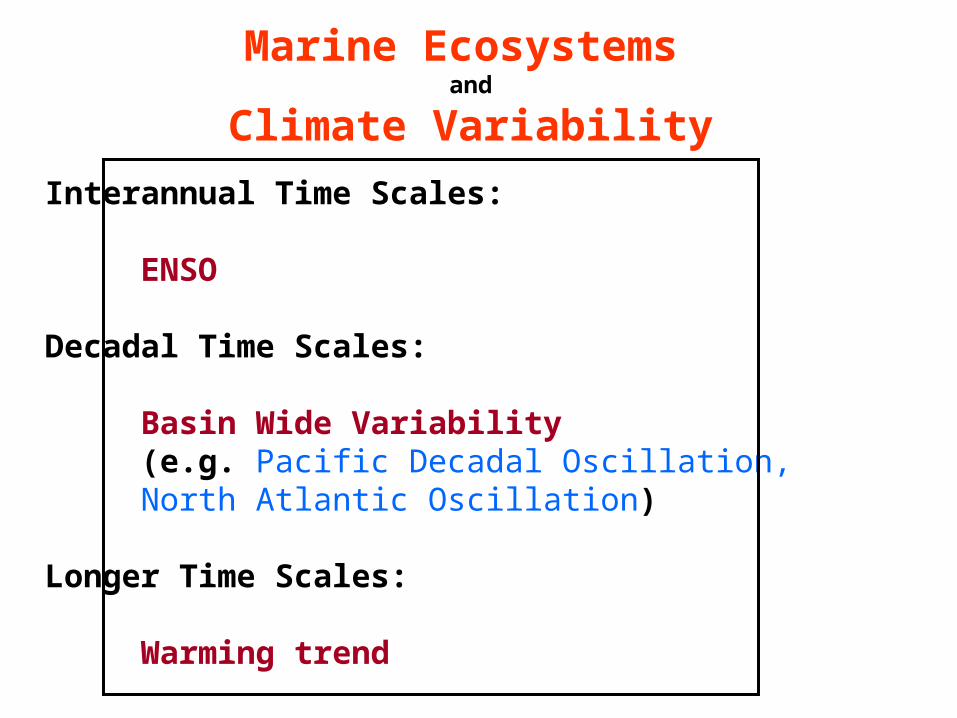
Interannual Time Scales:
ENSO
Decadal Time Scales:
Basin Wide Variability (e.g. Pacific Decadal Oscillation, North Atlantic Oscillation)
Longer Time Scales:
Warming trend
Marine Ecosystems and
Climate Variability

SST Anomalies – Jan 1998
SST Anomalies – Dec 1999
A
B
ºC
Pt. 1
Pt. 2
Pt. 3y
x
ENSO
Warm Phase
ColdPhase
Less upwelling
Less primary production
Less CO2 flux out of the ocean
More upwelling
More primary production
More CO2 flux out of the ocean
Interannual Time Scales:
ENSO
Decadal Time Scales:
Basin Wide Variability (e.g. Pacific Decadal Oscillation, North Atlantic Oscillation)
Longer Time Scales:
Warming trend
Marine Ecosystems and
Climate Variability
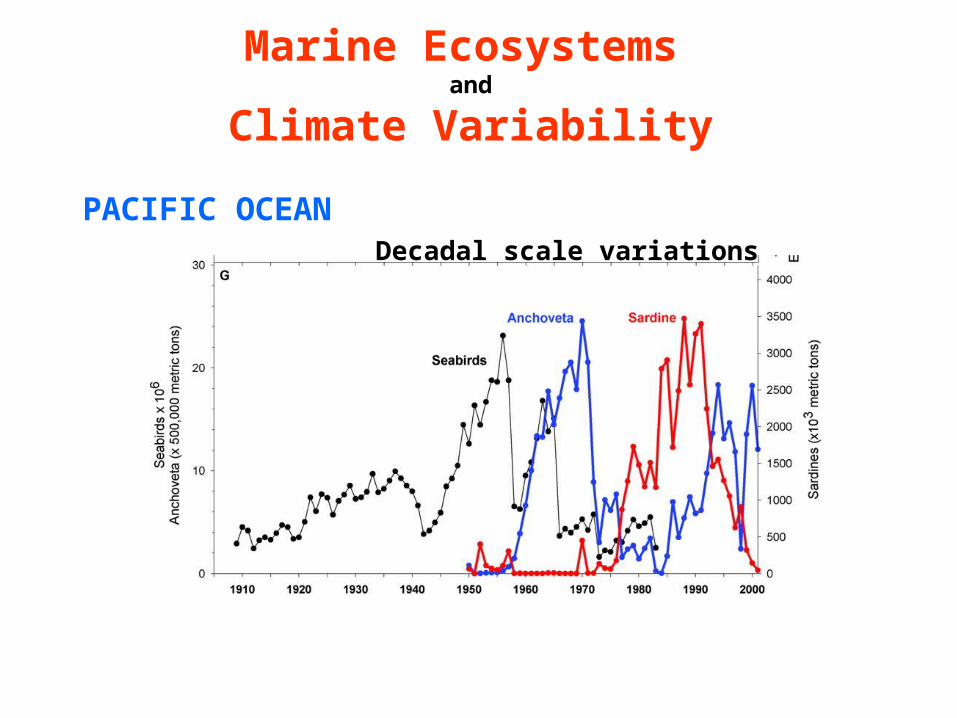
PACIFIC OCEAN
Marine Ecosystems and
Climate Variability
Decadal scale variations
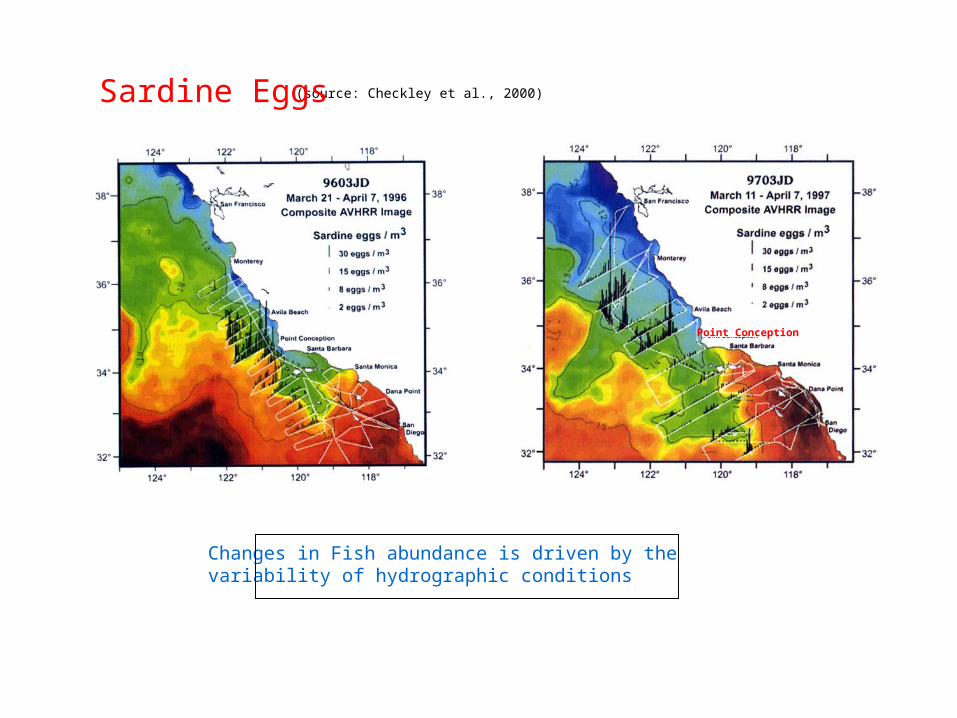
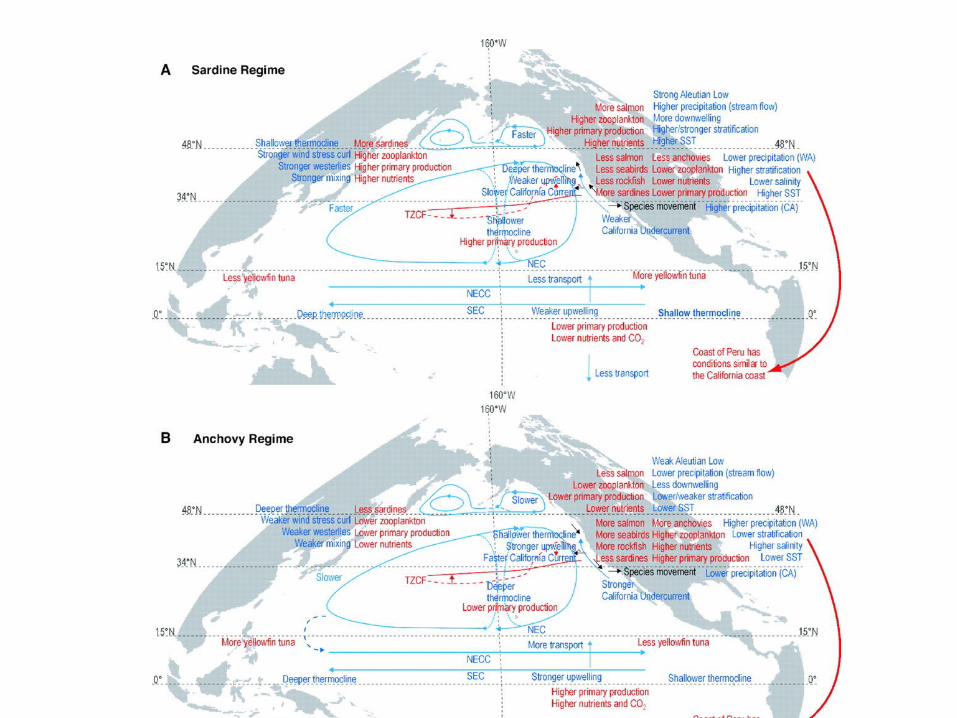
(source: Checkley et al., 2000)Sardine Eggs
Changes in Fish abundance is driven by the variability of hydrographic conditions
Point Conception
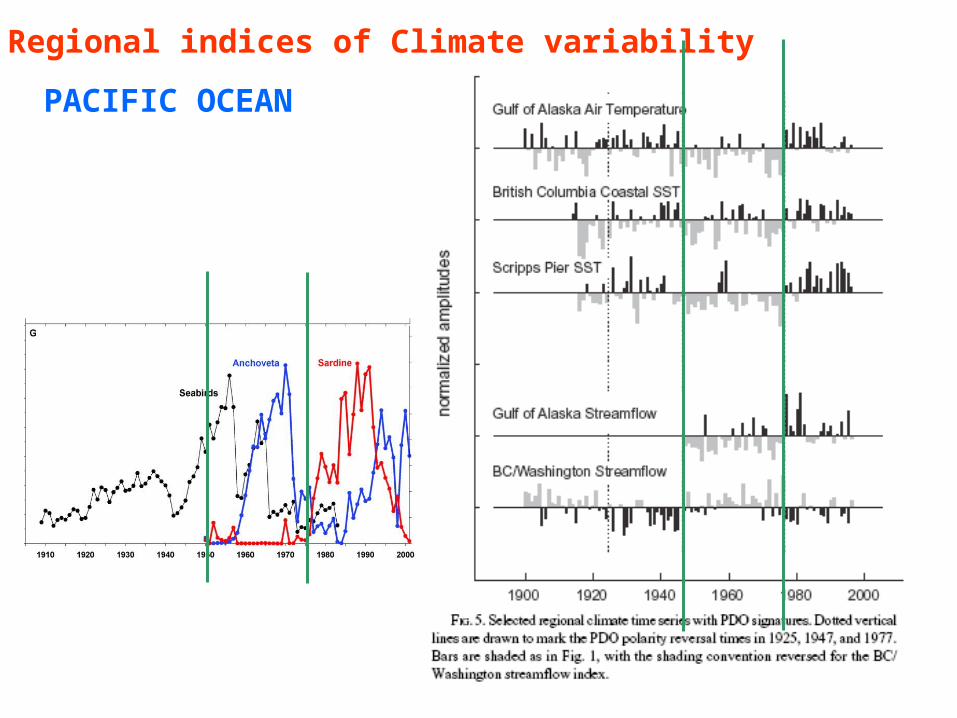
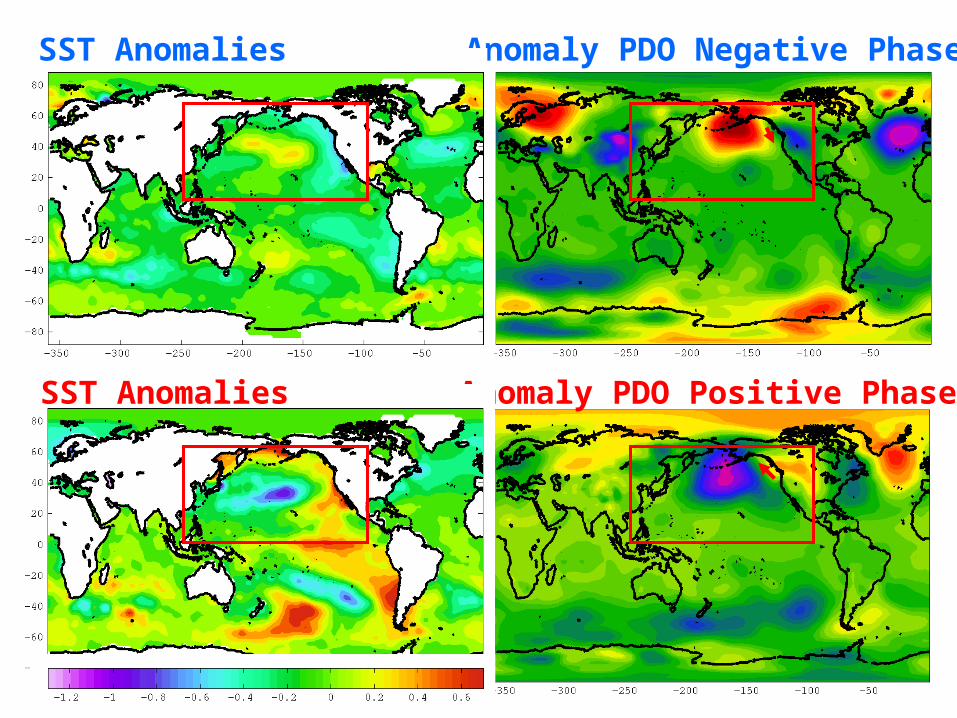
Regional indices of Climate variability
PACIFIC OCEAN
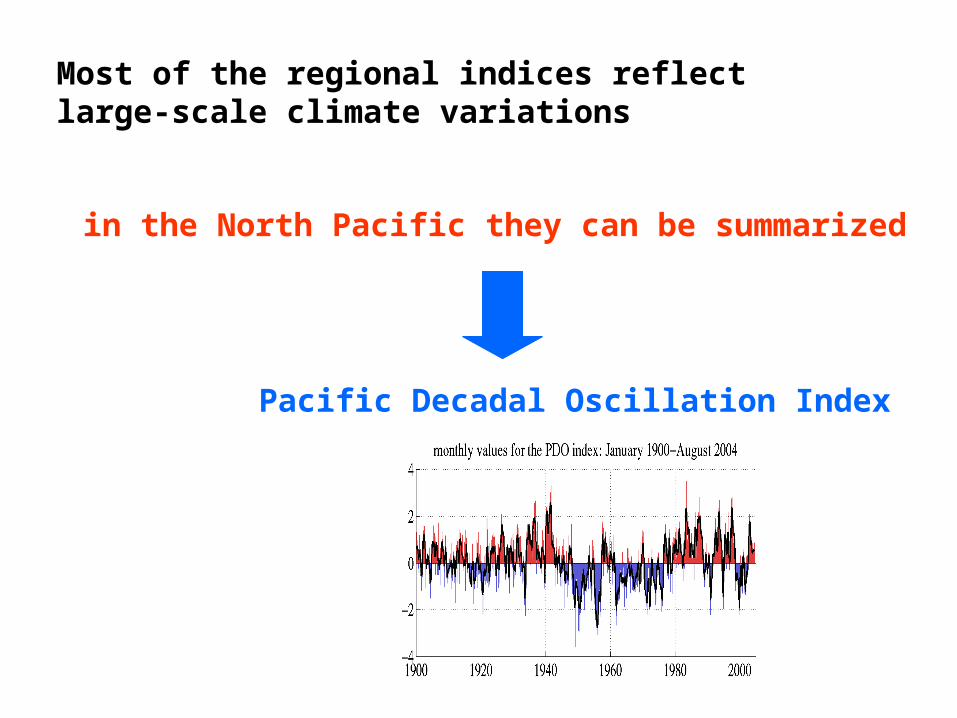
Most of the regional indices reflectlarge-scale climate variations
in the North Pacific they can be summarized
Pacific Decadal Oscillation Index
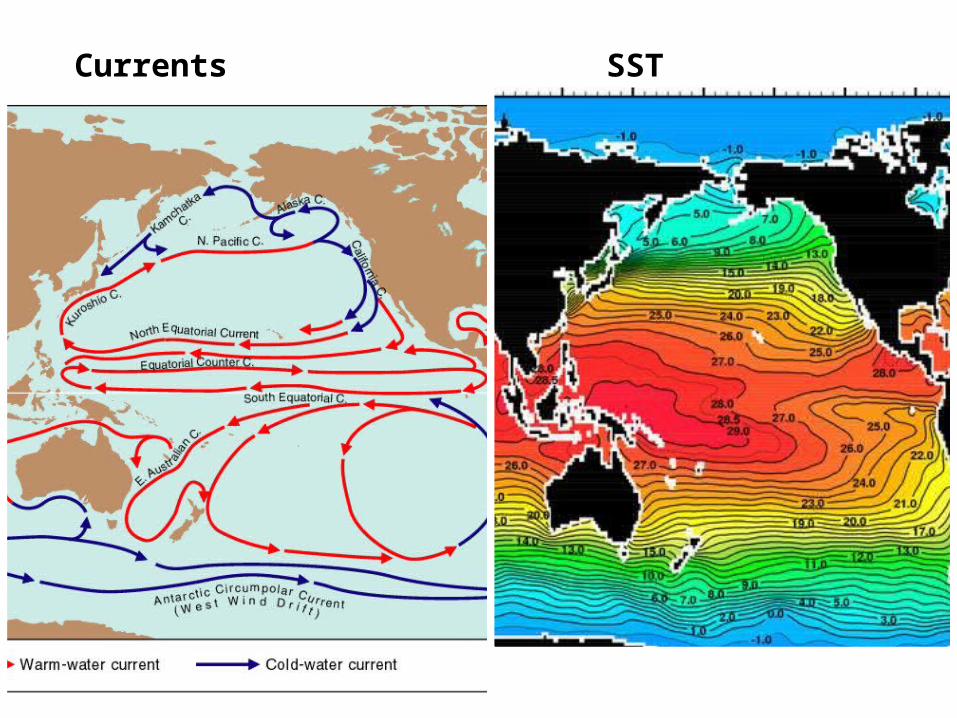
Currents SST
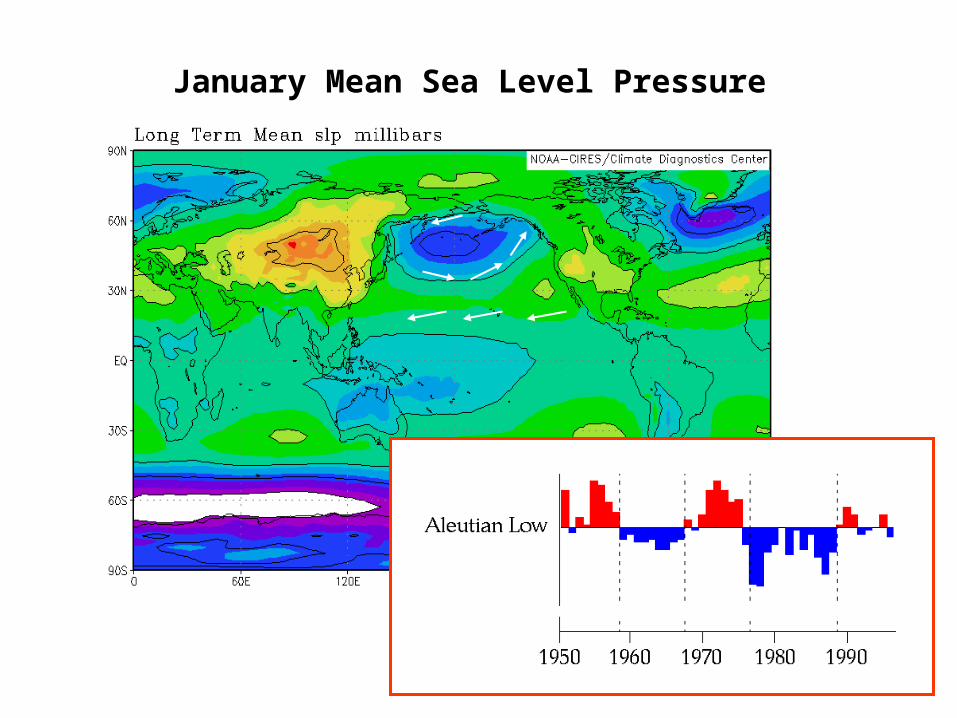
January Mean Sea Level Pressure
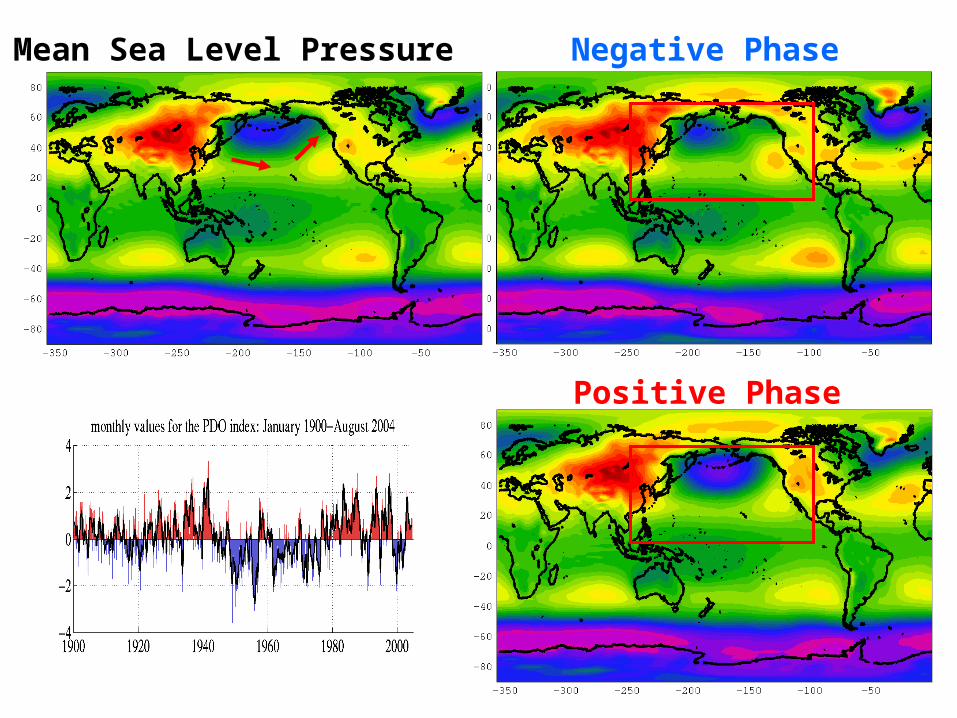
Negative Phase
Positive Phase
Mean Sea Level Pressure

Anomaly PDO Negative PhaseMean Sea Level Pressure
Anomaly PDO Positive Phase
Anomaly PDO Negative Phase
Anomaly PDO Positive Phase
SST Anomalies
SST Anomalies
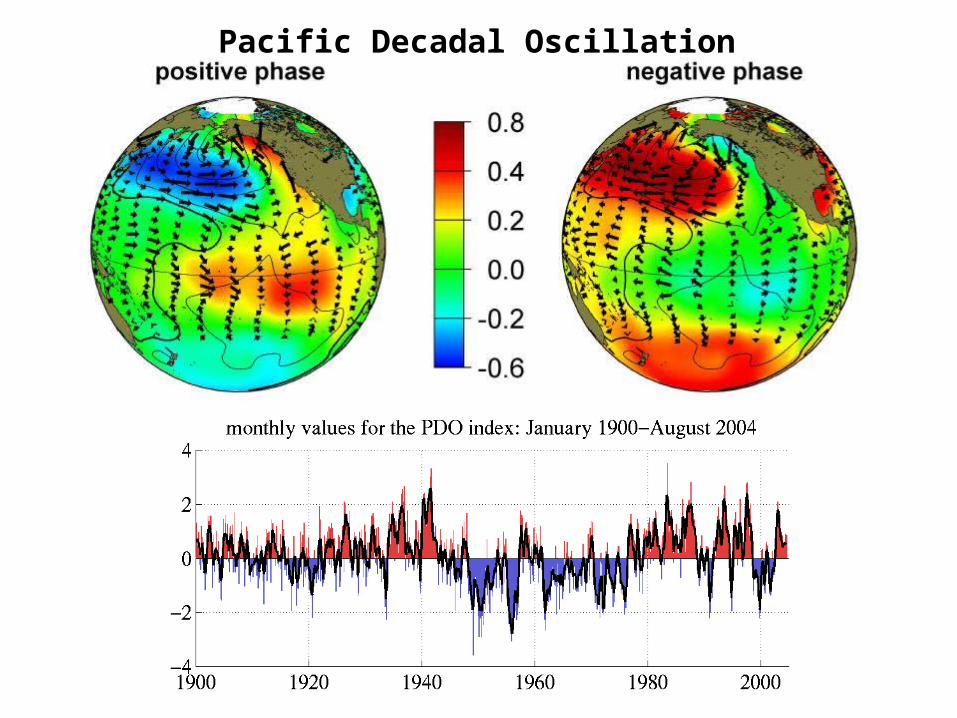
Pacific Decadal Oscillation
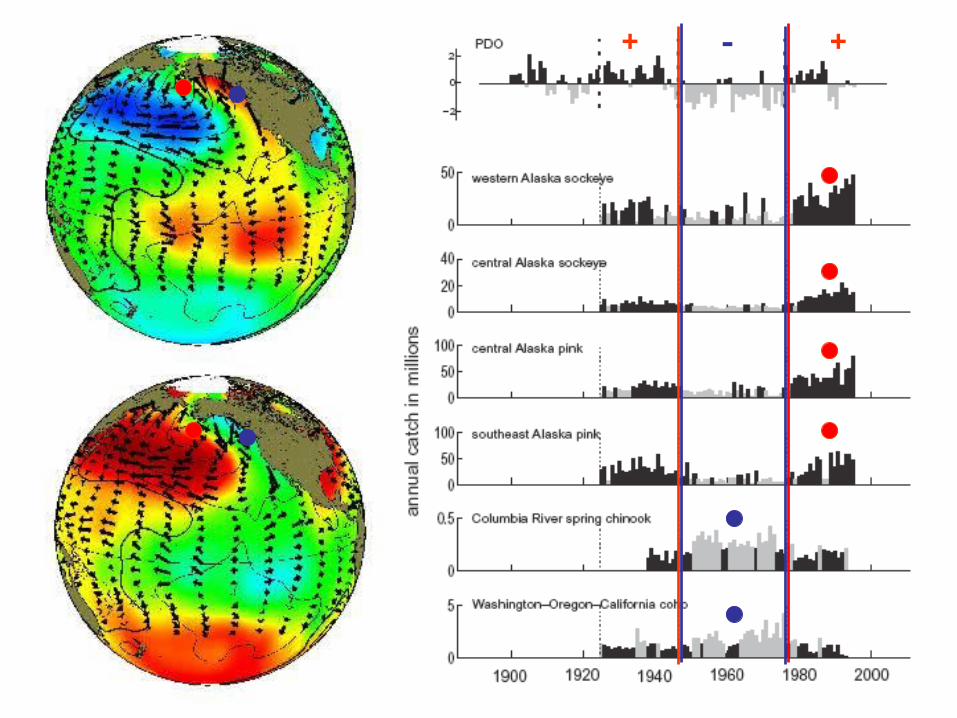
++ -
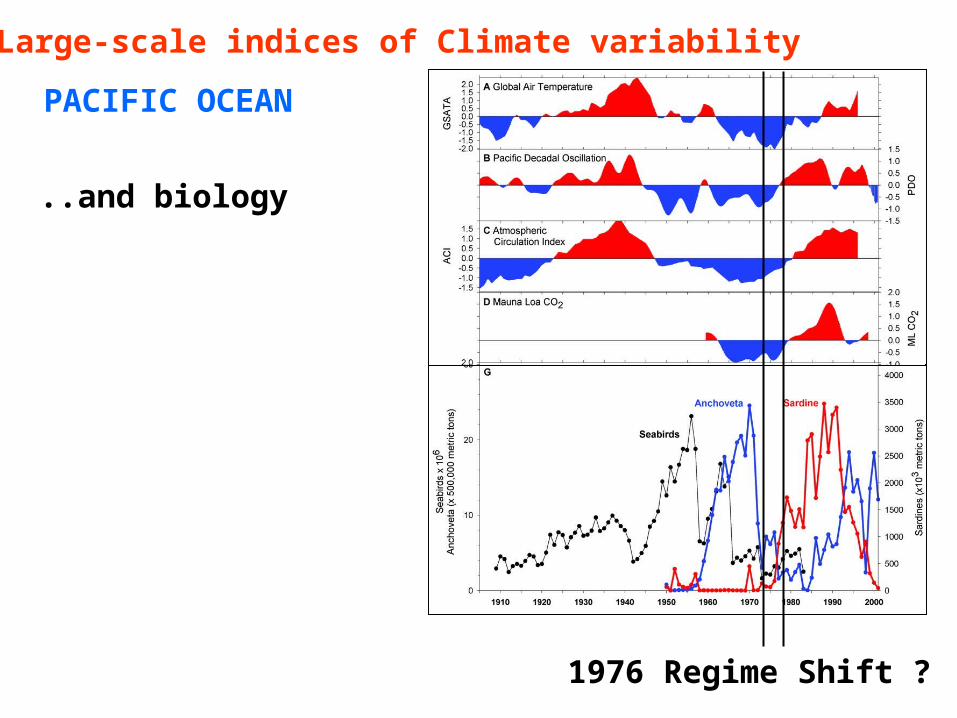
Large-scale indices of Climate variability
PACIFIC OCEAN
..and biology
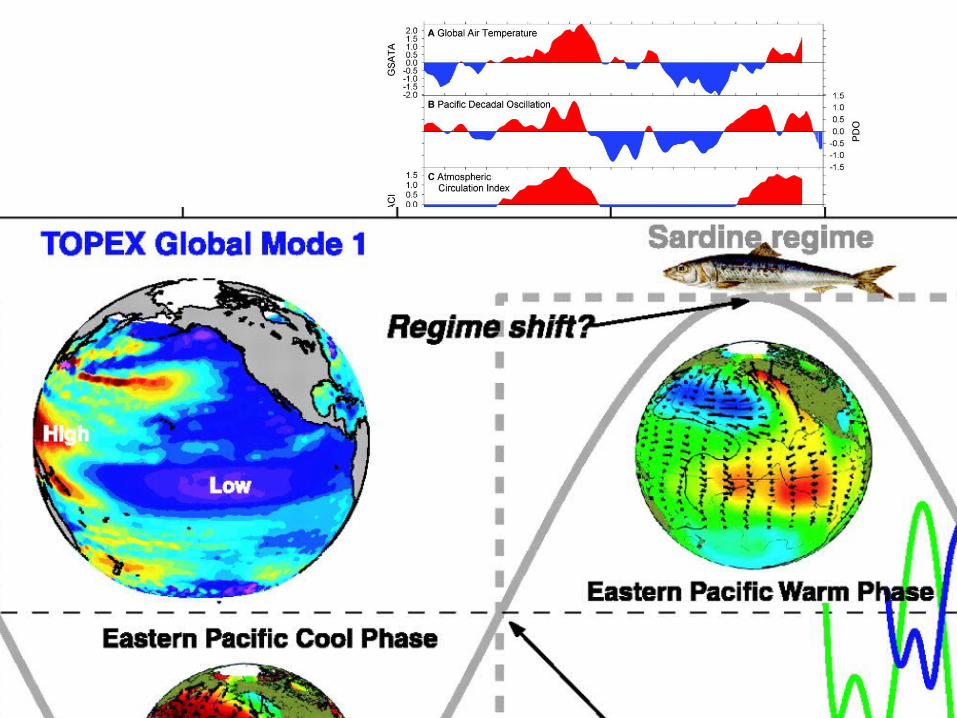
1976 Regime Shift ?

WARM PHASE of PDO
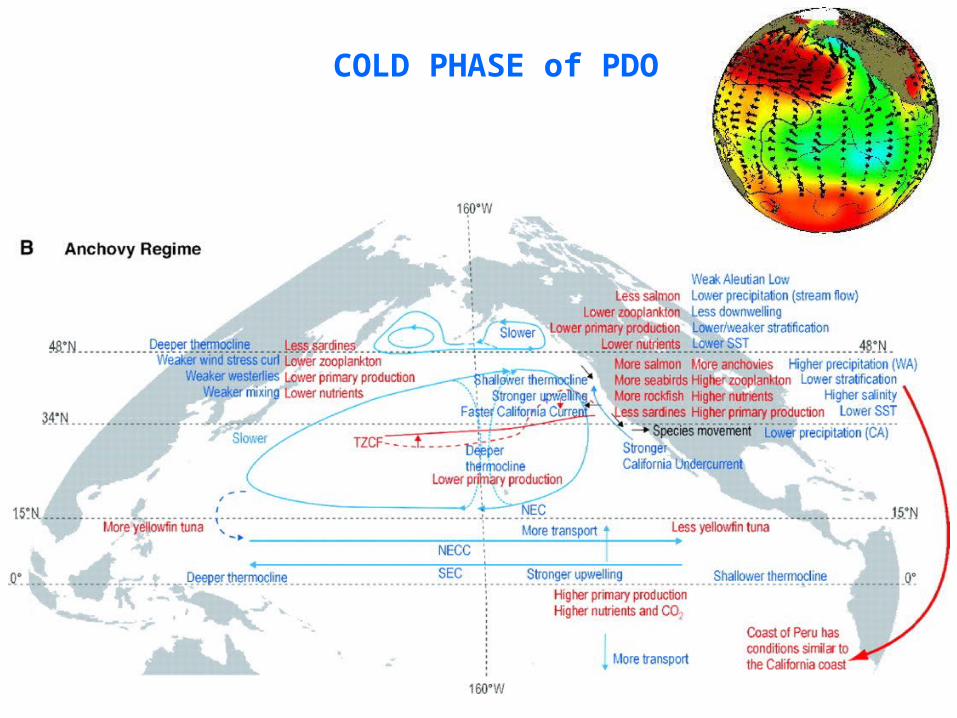
COLD PHASE of PDO

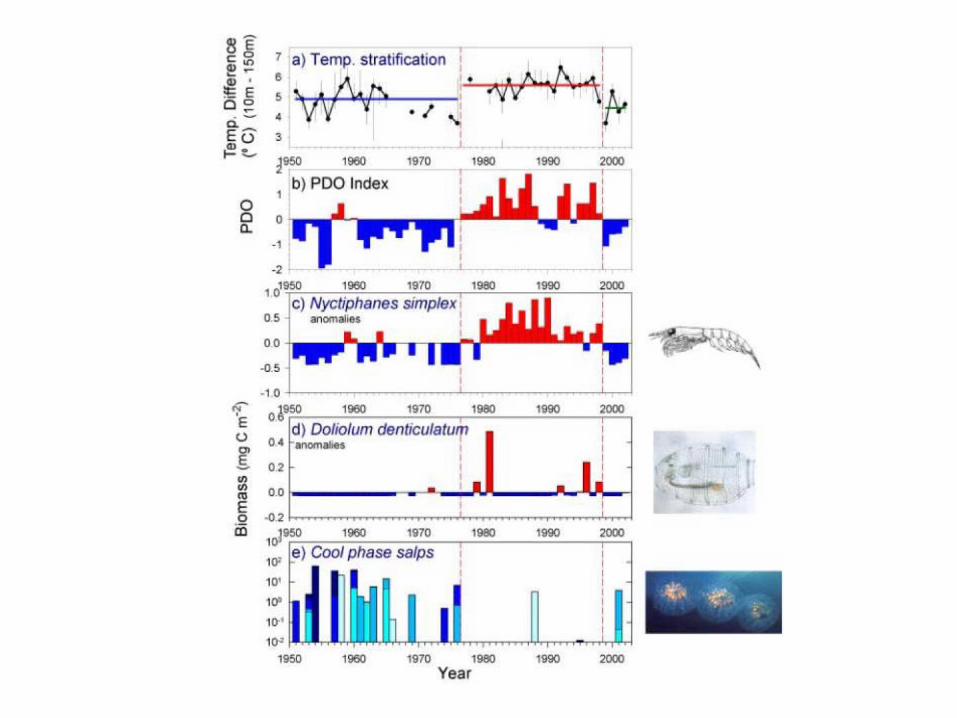
Transitions in the Ecosystem may by nonlinear and sudden.
There could be predictive skill (in terms of climate change) in monitoring closely the ecosystem
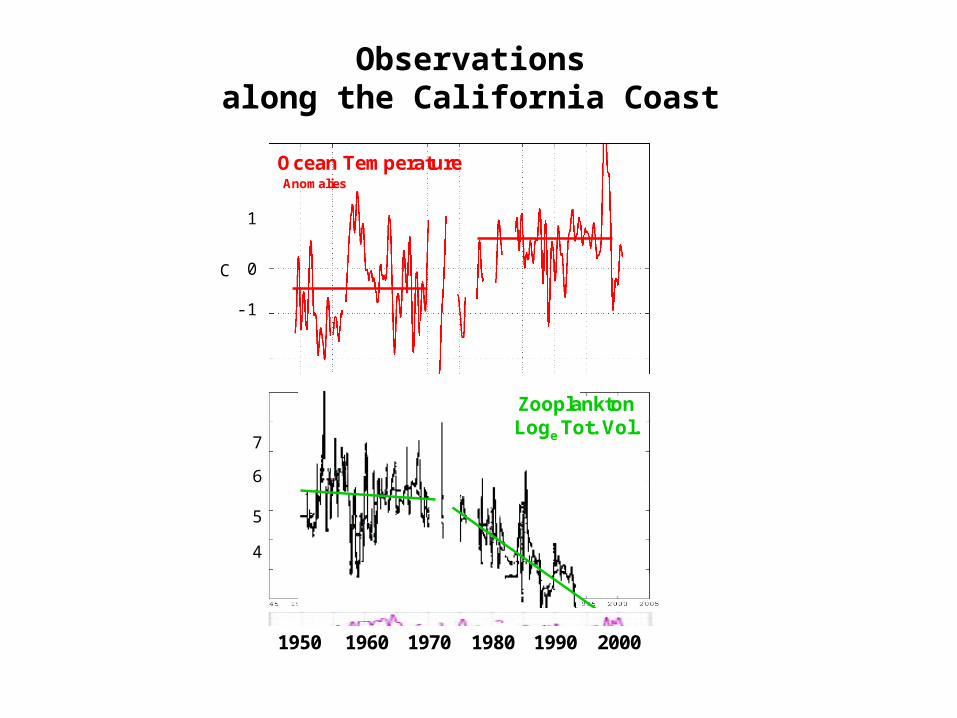
Ocean Temperature
ZooplanktonLoge Tot. Vol.
5
7
6
4
Anomalies
199019701950 200019801960
C
-1
1
0
Ocean Temperature
ZooplanktonLoge Tot. Vol.
5
7
6
4
Anomalies
199019701950 200019801960
C
-1
1
0
Observationsalong the California Coast

Zoo-plankton
Phytoplankton
Ab
un
dan
ce
Population Dynamics

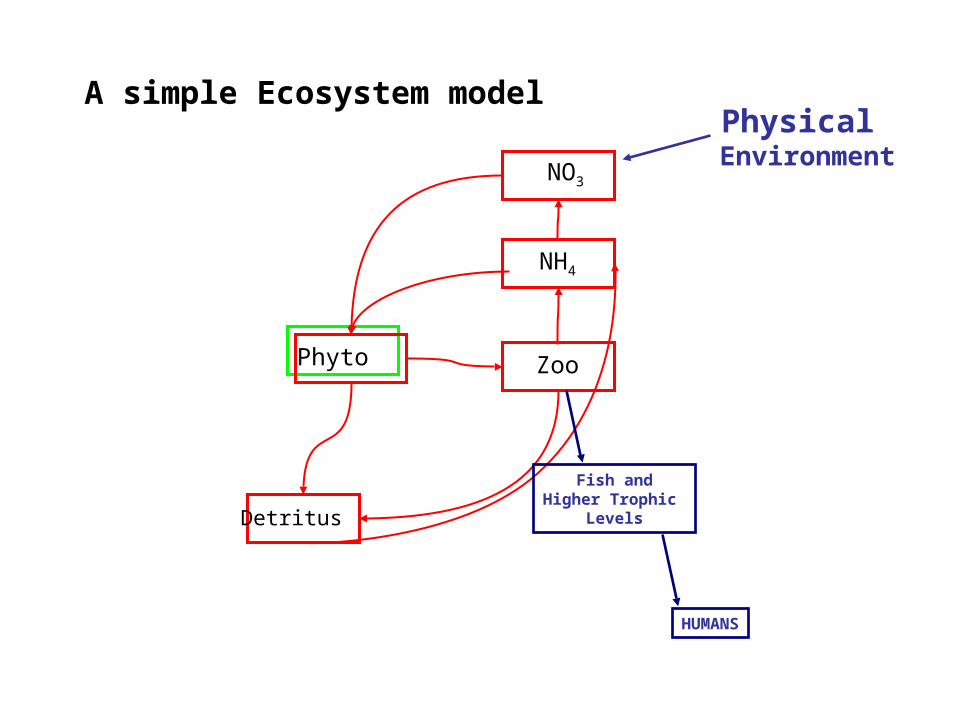
A simple Ecosystem model
Phyto
Detritus
NO3
NH4
Zoo
Physical Environment
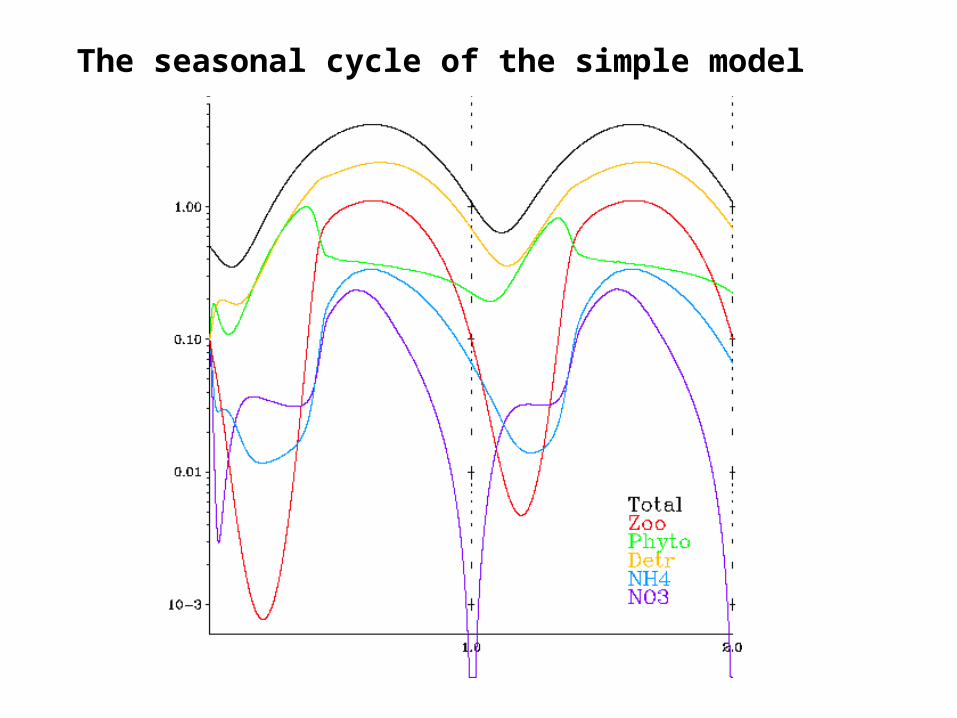
The seasonal cycle of the simple model
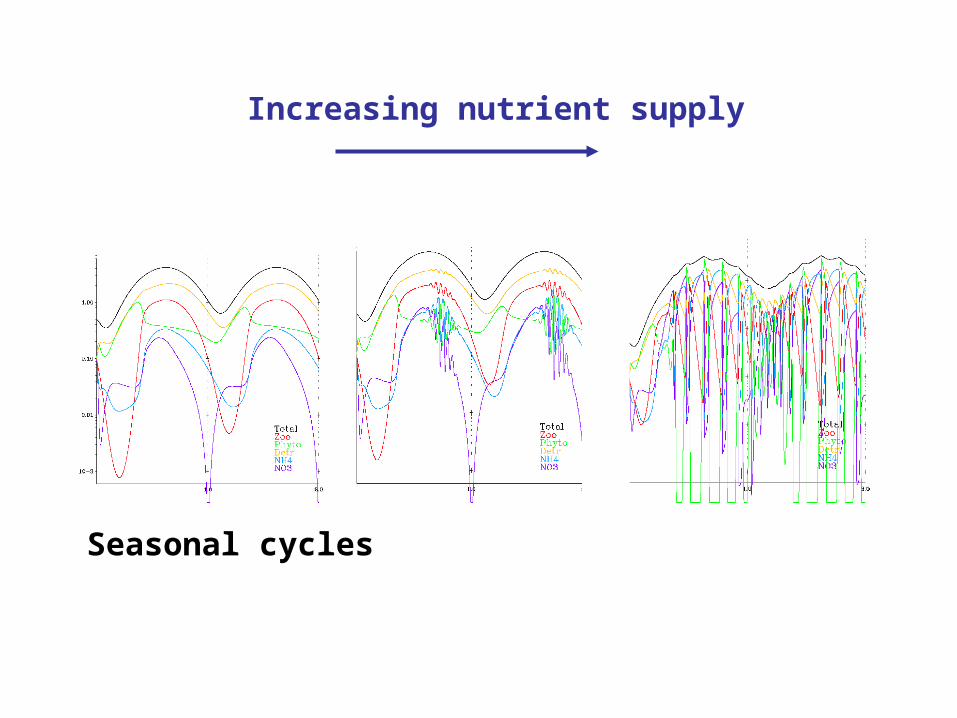
Increasing nutrient supply
Seasonal cycles
A simple Ecosystem model
Phyto
Detritus
NO3
NH4
Zoo
Physical Environment
Fish andHigher Trophic
Levels
HUMANS
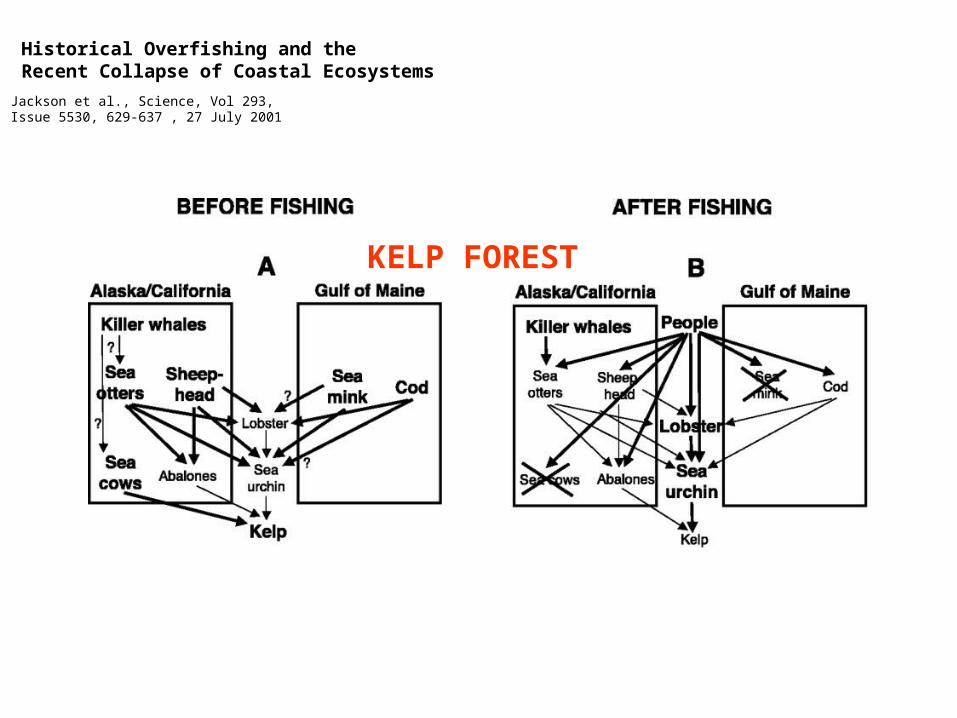
Historical Overfishing and the Recent Collapse of Coastal Ecosystems
Jackson et al., Science, Vol 293, Issue 5530, 629-637 , 27 July 2001
KELP FOREST
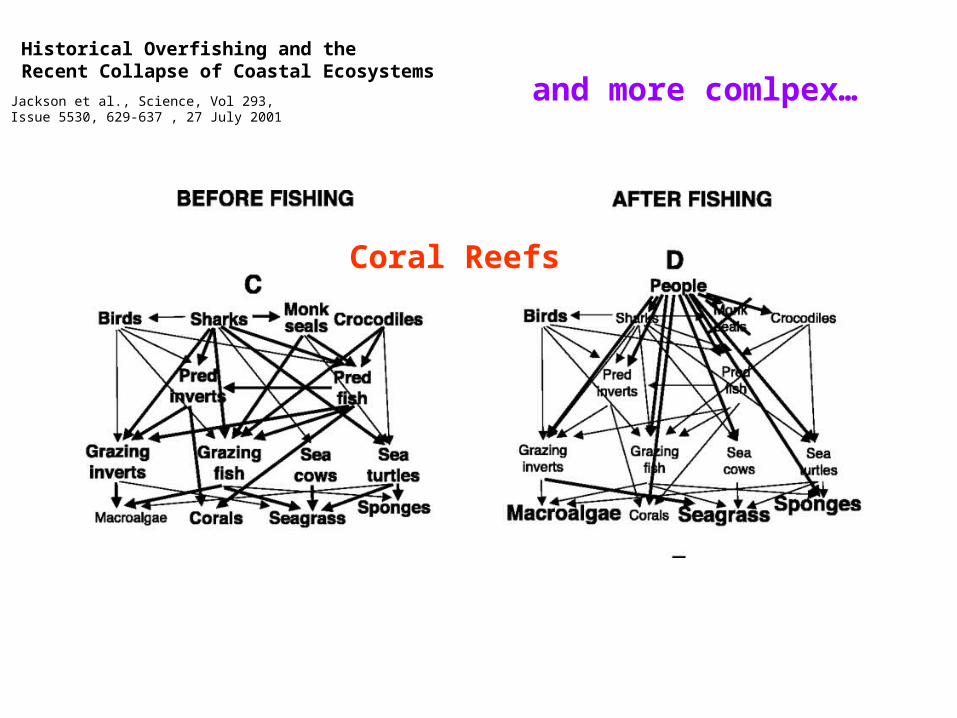
Historical Overfishing and the Recent Collapse of Coastal Ecosystems
Jackson et al., Science, Vol 293, Issue 5530, 629-637 , 27 July 2001
and more comlpex…
Coral Reefs
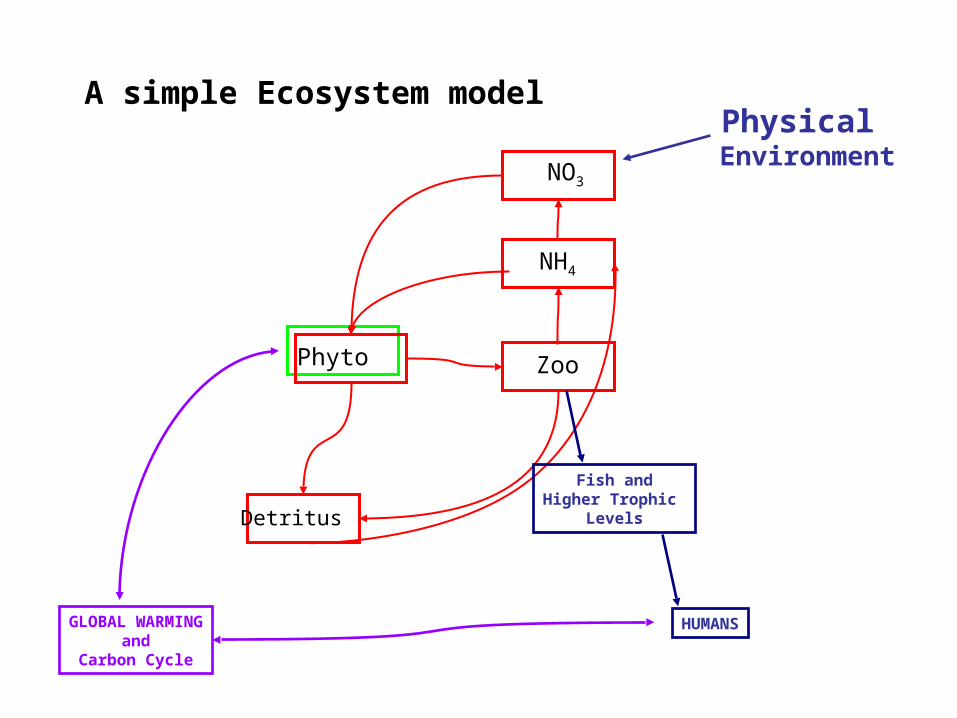
A simple Ecosystem model
Phyto
Detritus
NO3
NH4
Zoo
Physical Environment
Fish andHigher Trophic
Levels
HUMANSGLOBAL WARMINGand
Carbon Cycle

End of lecture
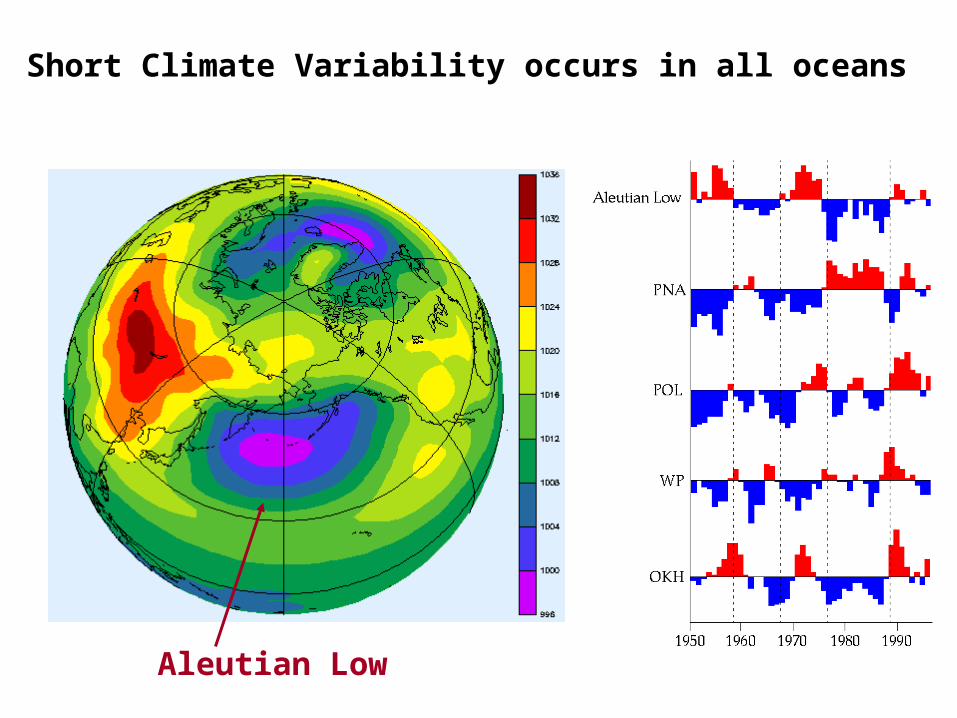
Short Climate Variability occurs in all oceans
Aleutian Low
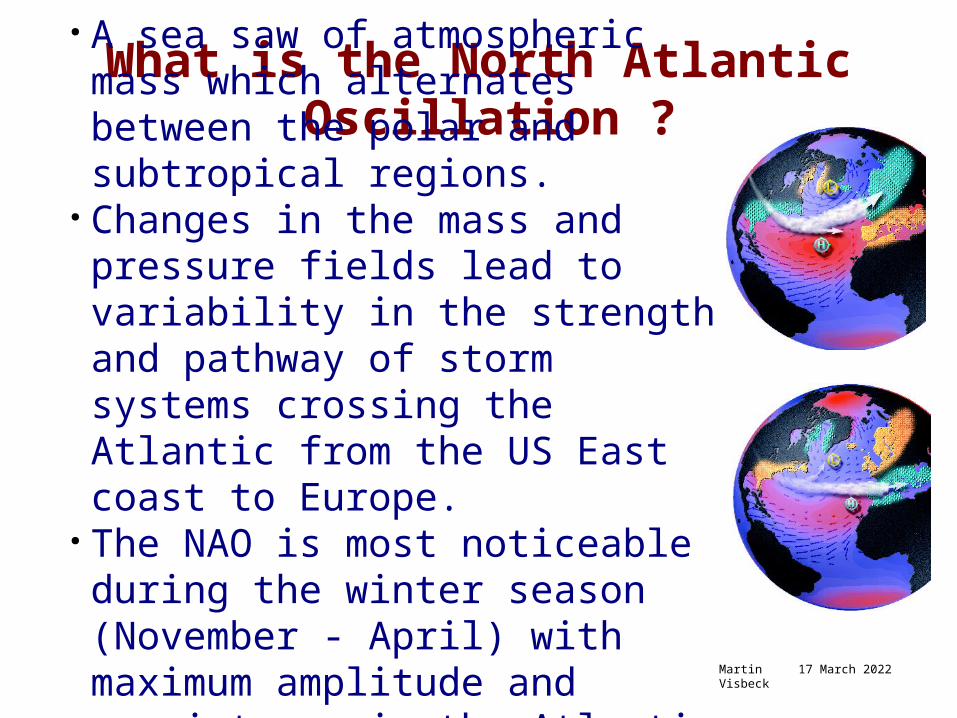
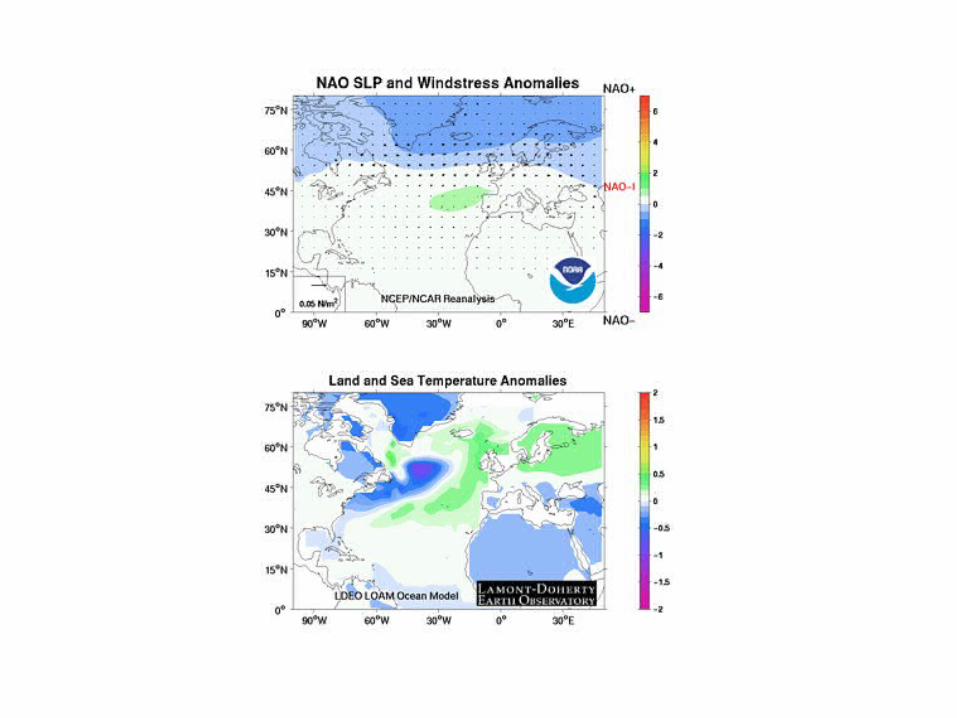
What is the North Atlantic Oscillation ?
A sea saw of atmospheric mass which alternates between the polar and subtropical regions.
Changes in the mass and pressure fields lead to variability in the strength and pathway of storm systems crossing the Atlantic from the US East coast to Europe.
The NAO is most noticeable during the winter season (November - April) with maximum amplitude and persistence in the Atlantic sector. Martin Visbeck 20 April 2023
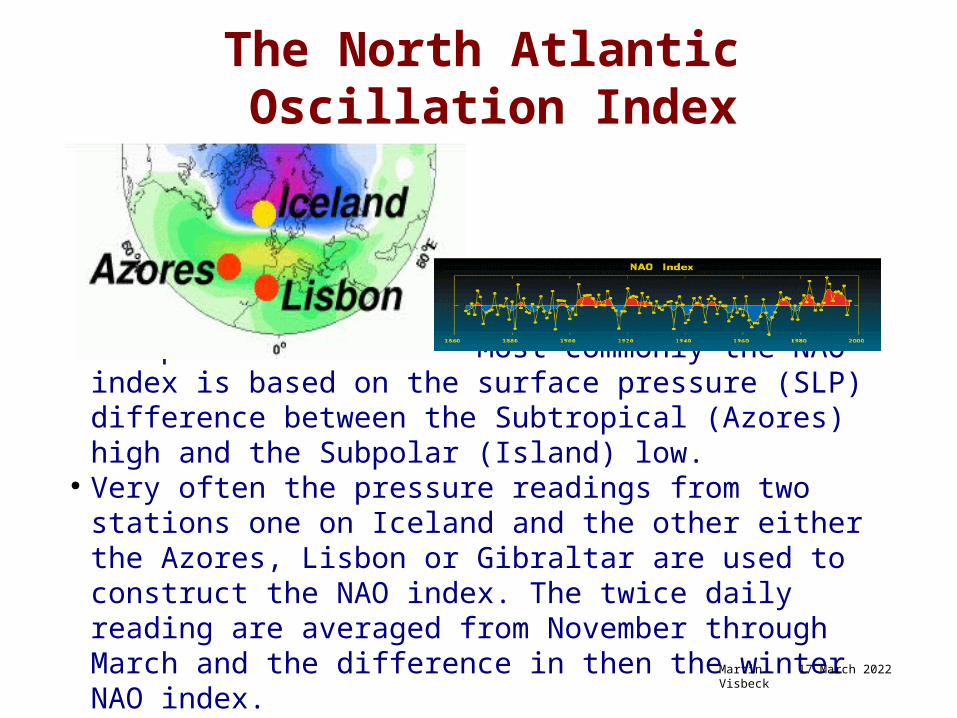
The North Atlantic Oscillation Index
An Index can be constructed that represents the phase of the NAO. Most commonly the NAO index is based on the surface pressure (SLP) difference between the Subtropical (Azores) high and the Subpolar (Island) low.
Very often the pressure readings from two stations one on Iceland and the other either the Azores, Lisbon or Gibraltar are used to construct the NAO index. The twice daily reading are averaged from November through March and the difference in then the winter NAO index.
Martin Visbeck 20 April 2023
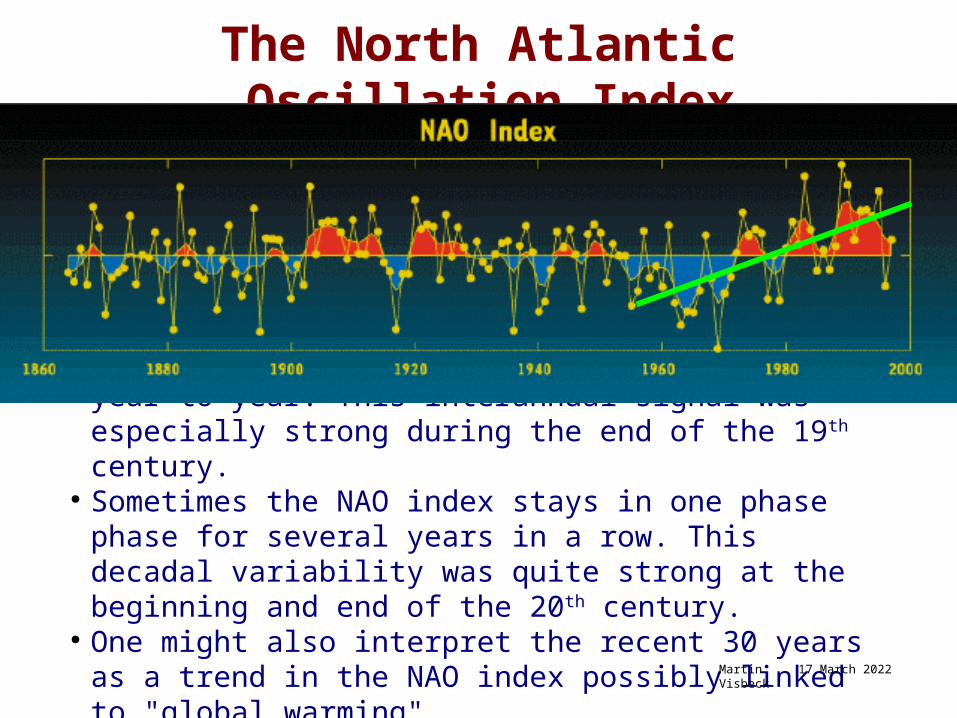
The North Atlantic Oscillation Index
The NAO index shows large variations from year to year. This interannual signal was especially strong during the end of the 19th century.
Sometimes the NAO index stays in one phase phase for several years in a row. This decadal variability was quite strong at the beginning and end of the 20th century.
One might also interpret the recent 30 years as a trend in the NAO index possibly linked to "global warming". Martin Visbeck 20 April 2023
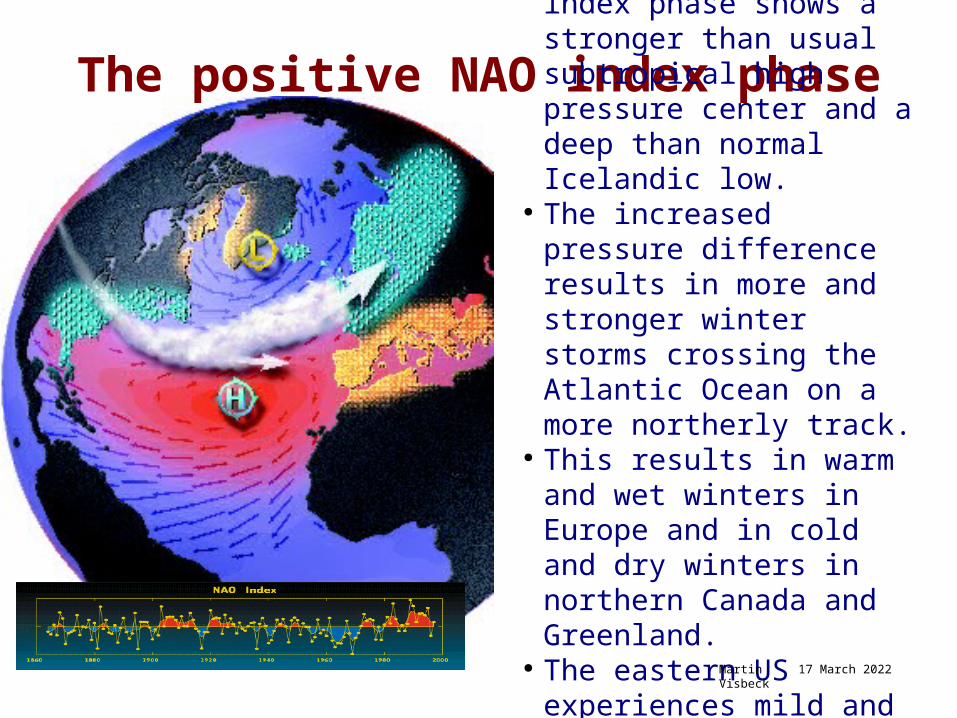
The positive NAO index phase The positive NAO index phase shows a stronger than usual subtropical high pressure center and a deep than normal Icelandic low.
The increased pressure difference results in more and stronger winter storms crossing the Atlantic Ocean on a more northerly track.
This results in warm and wet winters in Europe and in cold and dry winters in northern Canada and Greenland.
The eastern US experiences mild and wet winter conditions.
Martin Visbeck 20 April 2023
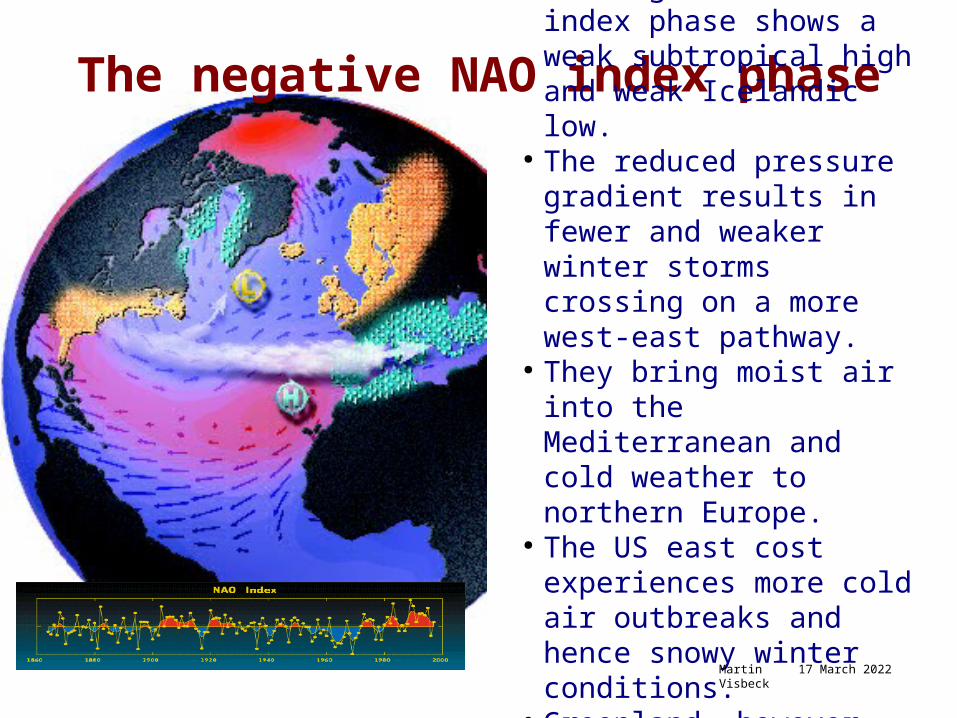
The negative NAO index phase The negative NAO index phase
shows a weak subtropical high and weak Icelandic low.
The reduced pressure gradient results in fewer and weaker winter storms crossing on a more west-east pathway.
They bring moist air into the Mediterranean and cold weather to northern Europe.
The US east cost experiences more cold air outbreaks and hence snowy winter conditions.
Greenland, however, will have milder winter temperatures.
Martin Visbeck 20 April 2023

North Altantic Oscillation

Reading/Homework assignment:
What is interesting about the relationship between Climate and Ocean Biology?
Examples:
•Fisheries and food•Global Warming problem •Preservation of species

An example
1) The Pacific Decadal Oscillation and ecosystem responses
2) Understanding the ecosystem response with models
3) The North Atlantic Oscillation and ecosystem responses

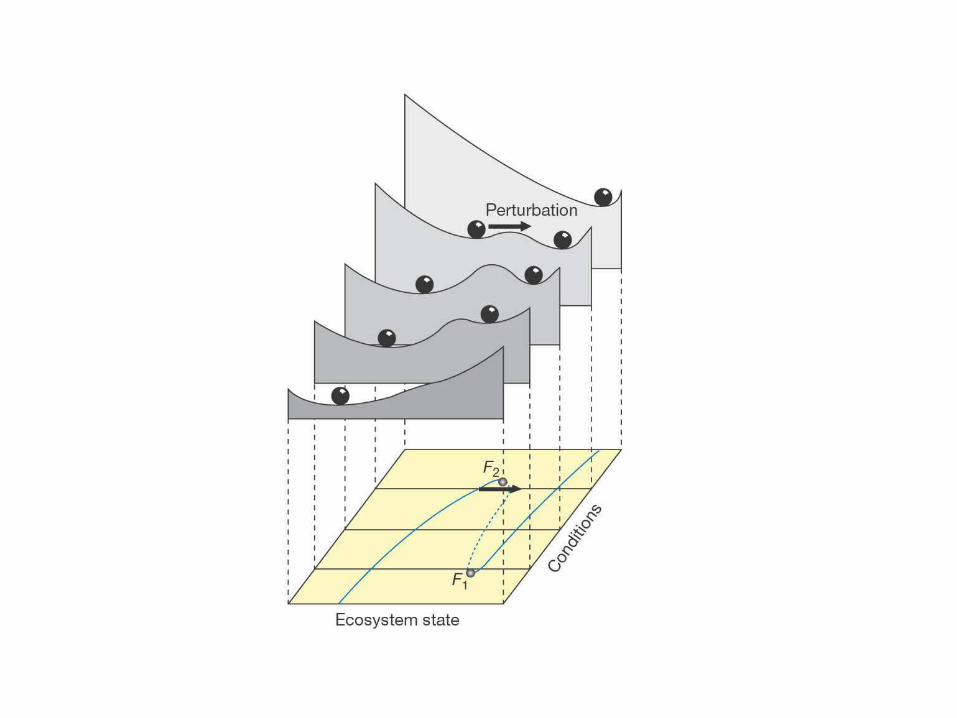
Nitrate Concentration
Abundance Reached at equilibrium
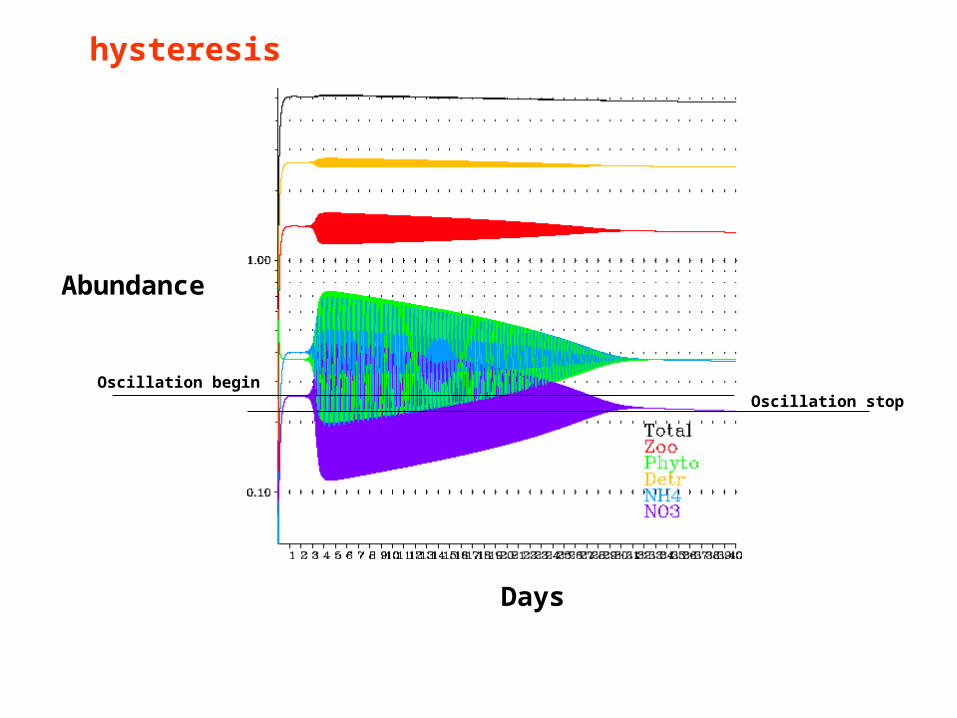
Abundance
Days
Oscillation beginOscillation stop
hysteresis
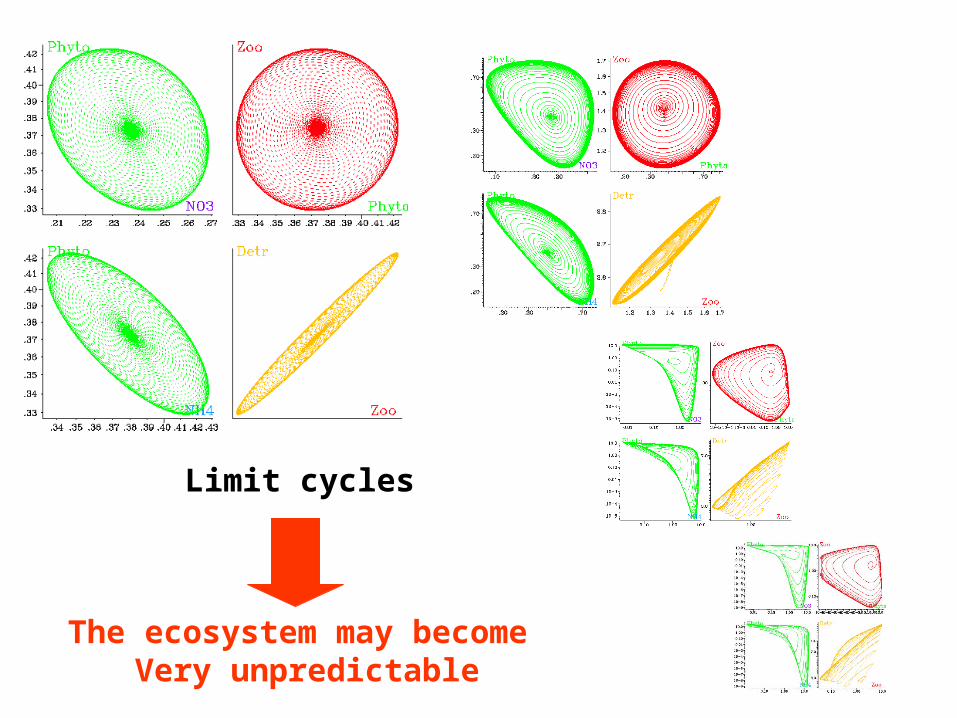
Limit cycles
The ecosystem may become Very unpredictable