interactions between cationic starch...
TRANSCRIPT
Helsinki University of Technology Laboratory of Forest Products Chemistry, Reports Series A 12 Espoo 2001 INTERACTIONS BETWEEN CATIONIC STARCH AND ANIONIC SURFACTANTS Juha Merta Dissertation for the degree of Doctor of Philosophy to be presented with due permission of the Department of Forest Products Technology for public examination and debate in Auditorium Ke 2 at Helsinki University of Technology (Espoo, Finland) on the 2th of March, 2001, at 12 noon. Helsinki University of Technology Department of Forest Products Technology Laboratory of Forest Products Chemistry Teknillinen korkeakoulu Puunjalostustekniikan osasto Puunjalostuksen kemian laboratorio

Distribution: Helsinki University of Technology Laboratory of Forest Products Chemistry P.O.Box 6300 FIN-02015 HUT, Finland Tel. +358 9 4511 Fax +358 9 451 4259 ISBN 951-22-5328-3 ISSN 1457-1382 Picaset Oy Helsinki 2001 HELSINKI UNIVERSITY OF TECHNOLOGY

HELSINKI UNIVERSITY OF TECHNOLOGY
ABSTRACT OF DOCTORAL DISSERTATION
Author: Juha Merta Name of the dissertation: Interactions between Cationic Starch and Anionic Surfactants Language of the dissertation: English Translation in Finnish: Kationisen tärkkelyksen ja anionisten pinta-aktiivisten aineidenväliset vuorovaikutukset Date of the manuscript: 5.12.2000 Compound dissertation Department: Department of Forest Products Technology Laboratory: Laboratory of Forest Products Chemistry Field of research: Surface and Colloid Chemistry Supervisor: Professor Per Stenius HUT professorship code: Puu-19 Pre-examiners: Professors Heikki Tenhu and Johan Sjöblom Opponent: Professor Mats Almgren Abstract The interactions between cationic starch (CS) and anionic surfactants and their mixtures were studied by using surface tension, solution viscosity and dynamic light scattering (DLS) measurements. The composition and structure of the complexes of CS and surfactants were studied by using phase equilibrium determination, small-angle neutron scattering (SANS) and small-angle X-ray scattering (SAXS) measurements. Critical association concentrations (cac) are well below the critical micellisation concentrations (cmc) of the surfactants. Associative phase separation occurs in extremely dilute systems when the charge ratio between the surfactants and the polymer is close to one. The effect of mixing on micellisation of the binary surfactant solution can be described by taking into account the effects of the volume difference between the hydrocarbon chains. The separated phase is a hydrophobic, viscous, gel-like complex containing less than 60 w% of water. With mixed surfactants, the more surface-active component is enriched in the complex phase. The gel is dissolved entirely or partly when excess surfactant is added with charge reversal mechanism. The mixed micelles of alkanoates are prolate ellipsoids with the longer-chain surfactant enriched in the end-cups of the ellipsoid. In dilute solutions CS molecules have a helical conformation. The core of CS/surfactant aggregates is formed by surfactant monomers and the surrounded shell by CS-chains. The structure of the complexes in dilute solutions resembles the inclusion complexes of amylose and surfactants. The charge neutralized CS-surfactant complexes consists of lyotropic liquid crystalline phase. The mesophases are the same as the pure surfactants form without any added polymer (hexagonal, lamellar or cubic), but they form with CS at lower surfactant concentrations. The gel-like CS-surfactant complex phases have high viscosity and elasticity. Their rheological behaviour is described by the Hershel-Bulkley model. Keywords: Cationic starch, anionic surfactants, interactions, complexes, structure, surface tension, phase equilibrium, viscosity, SAXS, SANS, DLS UDC: 661.185.22 : 541.18 : 535.36 Distributed by / Publisher: Helsinki University of Technology Laboratory of Forest Products Chemistry Reports; Series A 12 ISBN/ISSN (HUT series): ISBN-951-22-5328-3, ISSN-1457-1382 107 + 108 Pages Contacts of the author: E-mail [email protected] dissertation can be read at http://www.hut.fi/Yksikot/Kirjasto/Diss/

i
Preface The experimental work of this thesis was carried out at the Laboratory of Forest Products Chemistry of Helsinki University of Technology 1992 - 2000. The small-angle X-ray scattering measurements were performed at Laboratory of X-ray Physics, University of Helsinki by Dr. Mika Torkkeli. Most of the small-angle neutron scattering measurements were carried out by Dr. Vasyl Garamus at SANS1 of GKSS Research Centre, Geesthacht, Germany. Also, some measurements were made at the Frank Laboratory of Neutron Physics in Joint Institute for Nuclear Research, Dubna, Russia by Dr. Alexander Kuklin. I express my deepest gratitude to Professor Per Stenius for guiding me in my work on surface and colloid chemistry. I would like to thank him also for all the encouragement and the stimulating discussions over these years. I would like to thank the personnel at the Laboratory of Forest Products Chemistry for the positive and dynamic working atmosphere. My special thanks are due to Tekla Tammelin, Hanna Iitti, Emma Matikainen and Ritva Kivelä for excellent technical assistance, and also Lic. Sc. (Tech.) Esa Pirttinen for inspiring discussions. Financial support from Finnish Technology Development Centre (TEKES) and different industries, especially Raisio Chemicals Oy, Finland, is gratefully acknowledged. Finally, I warmly thank my wife, Sinikka, and my daughters, Emmi and Noora, for their patience and understanding.

ii
LIST OF PAPERS This thesis consists of a summary and the following papers, which will be referred to in the text by their Roman numerals I. Merta, J.; Stenius, P. (1995), Interactions between cationic starch and anionic surfactants. 1. Phase equilibria and surface tensions. Colloid Polym. Sci. 273, 974 - 983.
II. Merta, J.; Stenius, P. (1997), Interactions between cationic starch and anionic surfactants 2.Viscosity and aggregate size in dilute solutions. Colloids Surfaces A: Physicochem. Eng. Aspects 122, 243 - 255.
III. Merta, J., Pirttinen, E.; Stenius, P. (1999), Interactions between cationic starch and
anionic surfactants. III. Rheology and structure of the complex phase. J. Dispersion Sci. and Techn. 20, 677 - 697.
IV. Merta, J. and Stenius, P. (1999), Interactions between cationic starch and mixed anionic surfactants. Colloids Surfaces A: Physicochem. Eng. Aspects 149, 367 - 377. V. Merta, J., Torkkeli, M., Ikonen, T., Serimaa, R. and Stenius, P. (2001). The structure of cationic starch (CS)/anionic surfactant complexes studied by small angle X-ray scattering. Macromolecules. Accepted. VI. Merta, J., Garamus, V., Willumeit, R., Kuklin, A. and Stenius, P. (2000). Determination of the structure of Complexes Formed by a Cationic Polymer and Mixed Anionic Surfactants by SANS. Langmuir 16, 10061 – 10068.

iii
The following acronyms and abbreviations are used throughout this thesis: AOT
C10TAB
C12TAB
C14TAB
C16TAB
C12TAC
CnTAB
cac
CS
cec
cmc
Cn(EO)m
DDBS
DLS
DMSO
DP
DS
EHEC
fwhm
HB
HY
KDod
KOct
LPEI
NaCMA
NaDe
NaDod
NaDXS
Sodium diethylhexylsulfosuccinate
Decyltrimethylammonium bromide
Dodecyltrimethylammonium bromide
Tetradecyltrimethylammonium bromide
Hexadecyltrimethylammonium bromide
Dodecyltrimethylammonium cloride
Alkyltrimethylammonium bromide
Critical association concentration
Cationic starch
Critical electrolyte concentration
Critical micellisation concentration
Alkyl poly(oxoethylene ether)
Sodium dodecylbenzene sulphonate
Dynamic light scattering
Dimethyl sulfoxide
Degree of polymerisation
Degree of substitution
Ethyl(hydroxyethyl) cellulose
Full width at half maximum height
Herschel-Bulkley model
Hyaluronate
Potassium dodecanoate
Potassium octanoate
Linear poly(ethyleneimine) chloride
Sodium carboxymethylamylose
Sodium decanoate
Sodium dodecanoate
Sodium dextrane sulphate
iv
NaEr
NaHy
NaOct
NaOl
NaPa
NaPal
NaPSS
NaPVS
NMR
PAA
PAMPS
PDADMAC
PEO
PMAA /NIPAM
PMAA
Polymer JR
PVAc
PS1
PS4
PSS
PVP
PVS
Reten
SANS
SAXS
SDS
SEM
SHS
SOS
STS
TEM
Sodium cis-13-docosenoate (sodium erucate)
Sodium hyaluronate
Sodium octanoate
Sodium cis-9-octadecenoate (sodium oleate)
Sodium poly(acrylate)
Sodium hexadecanoate (sodium palmitate)
Sodium poly(styrene sulphonate
Sodium poly(vinyl sulphate)
Nuclear magnetic resonance
Poly(acrylic acid)
Poly[2-(acrylamido)-2-methylpropanesulphonic acid]
Poly(diallylmethylammonium chloride)
Poly(ethylene oxide)
Poly(sodium methacrylate-co-N-isopropylacrylamide)
Poly(sodium methacrylate)
Cellulose, 2-hydroxyethyl 2-[2-hydroxy-3-(trimethylammonio)propoxy]
ethyl 2-hydroxy-3-(trimethylammonio)propyl ether, chloride (9CI)
Poly(vinyl alcohol)
Poly(maleic acid-co-methyl vinyl ether)
Poly(maleic acid-co-butyl vinyl ether)
Poly(styrene sulphonate)
Poly(vinyl pyrrolidone)
Poly(vinyl sulphate)
Acrylamide/-methacryloxyethyltrimethylammonium chloride copolymer
Small Angle Neutron Scattering
Small Angle X-ray Scattering
Sodium dodecyl sulphate
Scanning electron microscopy
Sodium hexadecyl sulphate
Sodium octyl sulphate
Sodium tetradecyl sulphate
Transmission electron microscopy

v
CONTENTS 1. INTRODUCTION 1 2. THEORETICAL BACKGROUND 2 2.1. Characteristic of polyelectrolytes 2 2.2. Surface active agents 3 2.2.1. General 4 2.2.2. Micelle formation in aqueous solutions 4 2.2.3. Factors affecting the cmc and aggregation number 5 2.2.4. Mixed micellisation 6 2.2.4.1. Modelling mixed surfactants systems 6 2.2.4.2. Synergism in mixing of different surfactants 7 2.3. Polymer-surfactant interactions 8 2.3.1. Driving forces 8 2.3.2. Binding isoterms 9 2.3.3. Strength of interaction 10 2.3.4. Interactions between polyelectrolytes and oppositely charged surfactants 11 2.3.4.1. Influence of the surfactant 12 2.3.4.2. Influence of the polyelectrolyte 13 2.3.4.3. Effect of salt 14 2.4. Polyeletrolyte/surfactant complexes 14 2.4.1. Phase behaviour of hydrophilic polymers with pure surfactant micelles 14 2.4.1.1. Oppositely charged mixtures 15 2.4.2. Structure of complexes 16 2.4.2.1. Conformation of surfactant molecules 16 2.4.2.2. Conformation of the polyelectrolyte 18 2.4.3. Native starch-surfactant complexes 19 2.4.4. Polyelectrolyte-surfactant complexes with high range order 19 2.4.4.1. In organic solvents and in the solid state 19 2.4.4.2. In aqueous solutions 20 2.5. Basics of the research methods used in this study 23 2.5.1. Surface tension 23 2.5.2. Solution viscosity and rheology 25 2.5.3. Dynamic light scattering (DLS) 30 2.5.4. Small angle X-ray scattering (SAXS) and small angle neutron scattering (SANS) 34 2.5.4.1. Basics of the theory of small angle scattering 34 2.5.4.2. Scattering by simple objects 36 2.5.4.3. Structure analyses of ionic micelles with SANS 38 2.5.4.4. Determination of molecular structure of liquid crystals by SAXS 41

vi
3. EXPERIMENTAL 42 3.1. Materials 42 3.1.1. Cationic starch 42 3.1.2. Surfactants 44 3.2. Methods 45 3.2.1. Surface tension measurements 45 3.2.2. Viscosity measurements 46 3.2.3. Dynamic light scattering 47 3.2.4. Electrophoretic mobility 47 3.2.5. Phase equilibria determination 48 3.2.6. Rheology 48 3.2.7. Small angle X-ray scattering (SAXS) 48 3.2.8. Small angle neutron scattering (SANS) 49 3.3. Results and discussions 50 3.3.1. Critical association concentrations (cac) 50 3.3.1.1. Effect of the chain length of the surfactant 50 3.3.1.2. Effect of the charge density of the polymer 51 3.3.1.3. Effect of the polyelectrolyte concentration 53 3.3.1.4. Effect of the electrolyte concentrations 53 3.3.2. Phase separation and redissolution 54 3.3.2.1. Dissolution of CS-surfactant precipitates 56 3.3.3. Phase diagrams 57 3.3.4. Interactions between CS and mixed anionic surfactants 60 3.3.4.1. Micellisation in surfactant mixtures 60 3.3.4.2. Critical association concentrations 63 3.3.4.3. Phase separation and redissolution 65 3.3.4.4. Surfactant ratio in CS/mixed micelle complex phase 66 3.3.5. Structure of CS-surfactant systems in dilute solutions 67 3.3.5.1. Mixed micelles 68 3.3.5.2. CS/surfactant complexes 72 3.3.6. Charge neutralized CS-surfactant complexes 77 3.3.6.1. Structure of pure surfactant mesophases and CS/surfactant complexes 77 3.3.6.2. Lattice constant and interparticle distances 82 3.3.6.3. Geometry of polyelectrolyte oppositely charged surfactant aggregate phases 83 3.3.7. Rheology of the complexes 86 3.3.7.1. General 86 3.3.7.2. Fitting of the results to simple rheological models 88 3.3.7.3. Rheology vs. structure of CS/surfactant complexes 90 CONCLUSIONS 91 REFERENCES 93

1
1. INTRODUCTION
Systems containing water, ionic or non-ionic surfactants and water-soluble polymer have been
a subject of extensive investigations in the last ten years aimed at a fundamental understanding
of their properties as well as at evaluation of their use in various technical applications.
A polymer that has been relatively little studied in spite of its technical importance, is cationic
starch, CS. CS is widely used in paper processing as flocculation and retention aid. Cationic
starch is a better retention aid than native starch, because due to the cellulose fibre/cationic
starch attraction, it retains very effectively to the fibres and doesn’t concentrate to the
circulation water as badly as native starch. It is not only the fibres that are involved but also
fines and fillers, which are much smaller particles than fibres. Their retention to the fibre
network is extremely important. Fibres, fines and fillers are all negatively charged and
therefore repel each other. Large cationic polyelectrolyte, cationic starch can adsorb on these
negatively charged particles and collect them by formation bridges between them. In this way
is its possible to effectively flocculate and also retain the fines and fillers. Optimal retention
improves the wet strength of paper, and also important, the waste of these components
decreases radically.
Starch has also been proved to improve the dry strength of paper, making the interfibre
bonding stronger. It is added to the process between refiner and the headbox. Starch is also
used as a size on uncoated papers. It improves the printability, prevents the dusting of paper
and makes the paper surface smooth.
Cationic starches of high degree of substitution (>0.1) are also used in the paper coatings as
well as in the headbox of paper machines, among other things in order to collect harmful
anionic compounds from the water circle. This so-called “anionic trash” consists mainly of
dissolved hemicelluloses, fatty and resin acids, and their salts, which are components of wood
extracts. Cationic starch that is used as a retention aid can also produce, together with wood
extracts very harmful precipitates, which can disturb the whole paper processing. The cationic
starch-cellulose fibre interactions are extensively studied in the thesis of (van Steeg, 1992) but
nothing has been published about interactions of cationic starch with surfactants. Thus, it is
very important to get information about the interactions of these two substances.

2
For example, interactions of surfactants with cationised cellulose, has been studied by
(Goddard et al., 1976, 1977) and nonionic cellulose ethers have been subject of extensive
studies by (Piculell, Lindman et al., 1992). The structure of starch is very similar to cellulose,
but the difference on the bindings, which link the monoglucose units to form the polymer,
makes their chemical behaviour very different. The polymer chains in starch are much more
flexible than in cellulose, making the polymer more soluble in different solvents. The polymer
chains of amylopectin are also branched, whereas cellulose has completely straight chain.
Thus, actually starch is very different material to cellulose despite of their chemical similarity.
The aim of this is theses is to form better understanding about interactions between
polyelectrolyte and oppositely charged surfactants: What are the parameters affecting these
interactions and how can these systems be modelled. Another important part of this study was
the determination of the structure of these complexes and how these structures might be
modified.
Over the last few years, there has been an increasing interest in biodegradable materials. This
interest was also a motivating factor in these studies, because chemicals used in these studies
are nearly all derived from nature and also non-toxic and biodegradable. Starch is produced in
huge amounts all around the world so it would be important to try to find new applications for
its use instead of synthetic non-biodegradable polymers where possible.
2. THEORETICAL BACKGROUND
2.1. Characteristic of polyelectrolytes
Polyelectrolytes, such as cationic starch, have some special properties, which distinguished
them from uncharged polymers. First, the mutual repulsion of their charges causes expansion
of the chain far beyond the expansion from changes from poor to good solvents with ordinary
polymers. The size of the polyelectrolyte random coil is, moreover, a function of the
concentrations of polymer and added salt, since both influence the degree of ionisation.
Secondly, the ionisation of the electrolyte groups leads to a variety of unusual effects in the
presence of small amounts of salt. The intensity of the light scattering decreases because of the
3
ordering of the molecules in solution, while osmotic pressure and ultracentrifugation
behaviour are determined predominantly by the total charge on the molecule (Donnan effect).
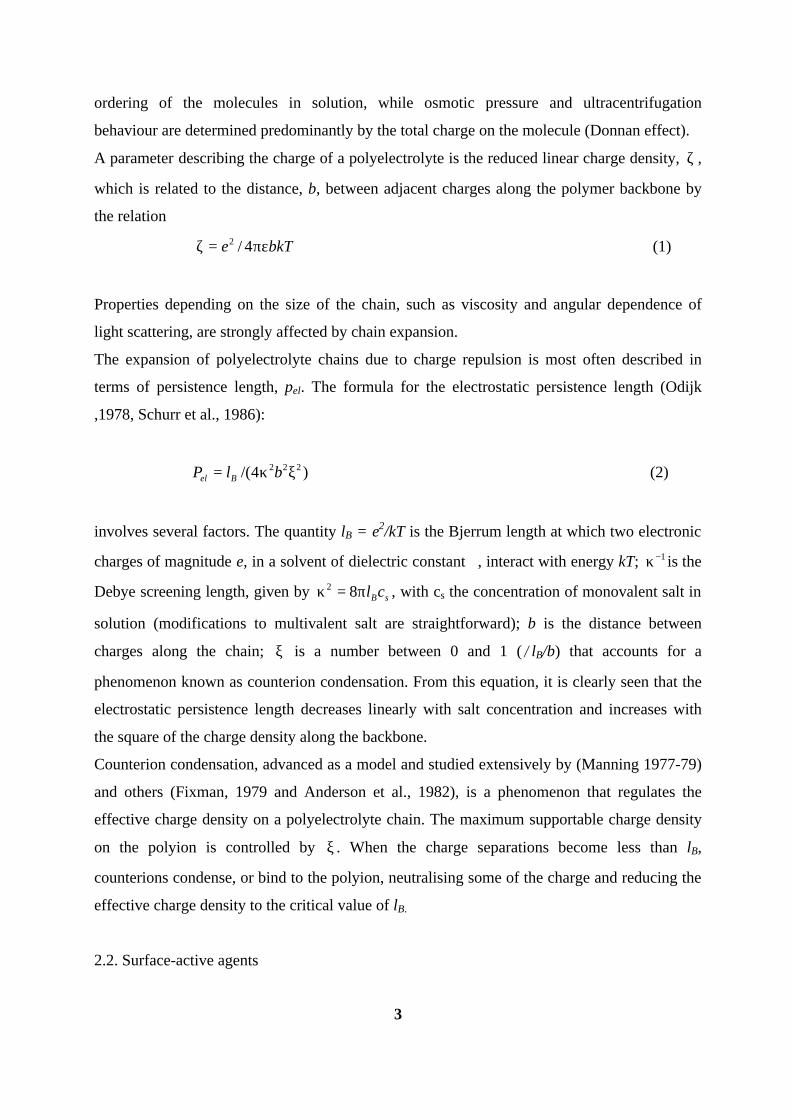
A parameter describing the charge of a polyelectrolyte is the reduced linear charge density, ζ ,
which is related to the distance, b, between adjacent charges along the polymer backbone by
the relation
bkTe πε=ζ 4/2 (1)
Properties depending on the size of the chain, such as viscosity and angular dependence of
light scattering, are strongly affected by chain expansion.
The expansion of polyelectrolyte chains due to charge repulsion is most often described in
terms of persistence length, pel. The formula for the electrostatic persistence length (Odijk
,1978, Schurr et al., 1986):
)4/( 222 ξκ= blP Bel (2)
involves several factors. The quantity lB = e2/kT is the Bjerrum length at which two electronic
charges of magnitude e, in a solvent of dielectric constant, interact with energy kT; 1−κ is the
Debye screening length, given by sBclπ=κ 82 , with cs the concentration of monovalent salt in
solution (modifications to multivalent salt are straightforward); b is the distance between
charges along the chain; ξ is a number between 0 and 1 (/lB/b) that accounts for a
phenomenon known as counterion condensation. From this equation, it is clearly seen that the
electrostatic persistence length decreases linearly with salt concentration and increases with
the square of the charge density along the backbone.
Counterion condensation, advanced as a model and studied extensively by (Manning 1977-79)
and others (Fixman, 1979 and Anderson et al., 1982), is a phenomenon that regulates the
effective charge density on a polyelectrolyte chain. The maximum supportable charge density
on the polyion is controlled by ξ . When the charge separations become less than lB,
counterions condense, or bind to the polyion, neutralising some of the charge and reducing the
effective charge density to the critical value of lB.
2.2. Surface-active agents

4
2.2.1 General
Surfactants are characterised by the presence of two moieties in the same molecule, one polar
and the other non-polar. The behaviour of surfactants in aqueous solution is determined by
their tendency to move their hydrophobic part away from the solution and their hydrophilic
part towards the solution. This dual tendency is responsible for adsorption of surfactants at
interfaces and for the formation of such aggregates as micelles.
Surfactant molecules adsorb at the water/air interface with their hydrophobic groups away
from the water and their hydrophilic groups in solution. A consequence of this is that some of
the water molecules at the interface will be replaced by hydrocarbon or other non-polar
groups. Since the interaction force between water molecules decreases, adsorption of
surfactants at the interface results in a reduction in the surface tension of the solution.
2.2.2. Micelle formation in aqueous solutions
Above a certain concentration, the so-called critical micelle concentration (cmc), almost all of
the added surfactant molecules are consumed in micelle formation, and the monomer
concentration does not increase. Since only the surfactant monomers adsorb at the interface,
the surface tension remains constant above the cmc.
As mentioned above, surfactant molecules in aqueous solutions at concentrations above their
cmc aggregate to form uniform sized structures referred to as micelles. Well-studied micelles
like those of SDS have a near-spherical geometry over a wide range above the cmc. Evidence
also exists for the formation of cylindrical and other shapes in certain systems.
It has been found that surfactants with bulky hydrophilic groups and long, thin hydrophobic
groups tend to form spherical/globular micelles in aqueous solutions. In contrast to this,
surfactants with bulky hydrophobic groups and small hydrophilic groups tend to form lamellar
or cylindrical micelles.
The shape of a micelle is related to its size. The size is normally expressed in terms of an
aggregation number. Typical aggregation numbers obtained for commonly used surfactants
varied from 30 to 90. The size and aggregation number of surfactants change markedly with
such variables as ionic strength and temperature.

5
2.2.3 Factors affecting the cmc and aggregation number
An increase in the length of the hydrocarbon chain decreases the cmc. Linear hydrocarbon
surfactants tend to have much lower cmc than their branched-chain counterparts. The presence
of a double bond in the chain increases the cmc.
Hydrophilic group. In aqueous media, ionic surfactants have a much higher cmc than non-
ionic surfactants with a corresponding hydrocarbon chain length. Correspondingly, as the
number of ionising groups increases in a surfactant molecule the cmc increases. As the
position of the ionic group changes from the terminal position to more central positions, the
cmc increases.
Counterions adsorb at the ionic micelle surface and stabilise it; the extent of adsorption is
dependent on the micelle charge density. The higher the adsorption of counterions, the lower
the cmc. An increase in the valency of counterion decreases the cmc. An increase in hydrated
radius, on the other hand, increases the cmc. .
Electrolytes have a significant effect on the cmc of ionic surfactants (Corrin et al. 1947). An
increase in the concentration of the electrolytes progressively contracts the electrical double
layer around the micelle and in the process stabilizes the micelle. This is manifested as a
reduction in cmc with electrolyte concentration. Note, however, that an increase in the
electrolyte level need not increase the amount of counterions bound in the Stern layer of the
micelle (Lindman, 1984).
The process of micellisation itself is dependent on temperature in a complex way. For
example, cooling of a micellar solution of SDS below 12 oC, results in the precipitation of the
surfactant. Here the concentration of the surfactant is equal to the cmc. This temperature,
referred to as the Krafft temperature or Krafft point, is the temperature at which the solubility
of the surfactant equals the cmc, and above this temperature, the total solubility of the
surfactant increases markedly because of the formation of micelles. Below this temperature,
only surfactant monomers exist in solution and, therefore, the total solubility is drastically
limited. The Krafft point of surfactants depends upon the chain length of the hydrophobe as
6
well as the type, valency, and concentration of counterions. The Krafft point, in general,
increases with alkyl chain length.
2.2.4. Mixed micellisation
In solutions containing mixtures of surfactants, the tendency to form aggregated structures can
be substantially different from that in solutions containing only the pure surfactants. The
tendency for components to distribute between a non-aggregated state and an aggregate may
vary from component to component for mixtures. Therefore, the surfactant composition of a
micelle may differ greatly from the composition of the non-aggregated surfactants.
2.2.4.1 Modelling mixed surfactant systems
In models of mixed micellisation, the Gibbs energy of mixed micelle formation is discussed in
terms of several contributions.
1) Contact energy of the surfactant. When the hydrophobic moiety of the surfactant is
transferred from aqueous environment into the liquid hydrocarbon-like interior core of the
micelle, there is a favourable change in the contact energy, which depends on the hydrocarbon
chain length but is mainly due to the creation of water/water contacts.
2) Conformational entropy. The transfer of the hydrophobic moiety of the surfactant into the
micelles also implies an energetically favourable change in their conformational energy.
3) Aggregate core-water interfacial Gibbs energy. If the hydrophilic moiety is not very bulky,
the formation of a micelle generates an interface between the hydrophobic core region and the
surrounding aqueous solution.
4) Head group steric interactions. In the formation of micelles, the polar head groups of the
surfactant molecules are crowded onto the aggregate surface. This generates steric repulsions
between the head groups.
5) Head group ionic and dipole interactions. For ionic surfactants, repulsive electrostatic
interactions arise at the micellar surface. For zwitterionic surfactants, one has to consider the
interactions between the permanent dipoles of polar head groups.
7
6) Gibbs energy of mixing of surfactant tails. This contribution accounts for the entropy and
enthalpy of mixing of the surfactant tails of molecules A and B in the hydrophobic core of the
micelle.
In the simplest approach, it is assumed that the only contribution to the Gibbs energy of
micellisation from the mixing process is the entropy of mixing of surfactant tails. This ideal
mixing model leads to a simple equation for the cmc of n different surfactants:
1
1C f Cmix
i
i ii
n
==
∑ α (3)
where Cmix is the cmc of the surfactant mixture, ái is the fraction of surfactant i of the total
amount of surfactant, fi is its activity coefficient and Ci its cmc. In ideal mixed micelles, the
activity coefficient fi is unity and so the surfactants do not interact with each other. Although
few micellar systems behave ideally, this model is useful as a reference system in the
description of reasons for non-idealities.
2. 2. 4. 2. Synergism in mixing of different surfactants
Mixtures of different surfactant types often exhibit synergism in the formation of micelles, i.e.
deviations from ideal mixing results in substantially lower cmcs and interfacial tensions than
would be expected based on the properties of the unmixed surfactants alone.
The most commonly used models of non-ideal mixing are based on the regular solution
approximation. This assumes that the excess Gibbs energy of mixing consists only of an
enthalpy term, while there are no excess entropy contributions. For a binary mixture the
excess enthalpy of mixing per mole at the cmc is defined by
H x x RT GE E= − =β 1 11( ) (4)
where the parameter represents the molecular interaction between two surfactants.
In this model, the micellar mole fractions of a binary surfactant mixture can be calculated by
the iterative solution of the following expression:
8
α
α1 2 2 1
2 1 1 1
11
C f xC f x
*
*
( )−= (5)
where C1* and C2
* are the cmcs of the pure component and x1 is the mole fraction of
component 1 in the mixed micelle. The non-ideality is characterised by the net interaction
parameter, which is related to the activity coefficients by:
f x1 121= −exp ( )β (6)
f x2 12= exp ( )β (7)
From the regular solution theory, it follows that in a binary surfactant system, can be
calculated from cmcs of the surfactant mixture and the cmcs of the pure components
according to:
[ ] [ ]
βα α
=−
=−ln / ( )
( )
ln / (( ) )* * * *1 1 1
12
2 1 2
121
1C x C
x
C x C
xMix Mix
(8)
where C*mix is the cmc of the surfactant mixture.
2.3. Polymer-surfactant interactions
2.3.1. Driving forces
The interactions responsible for association phenomena in polymer-surfactant systems are
mainly:
1. Hydrophobic interactions between polymer and surfactant molecules. This kind of
interaction will be particularly important for hydrophobically modified polymers.
2. Hydrophobic interactions between hydrophobic parts of surfactant molecules.

9
3. Hydrophobic interactions between polymer molecules.
4. Electrostatic interactions between polymer molecules.
5. Electrostatic interactions between polymer and surfactant molecules; they may be
repulsive or attractive, depending on whether the molecules have similar or opposite charges.
6. Electrostatic interactions between hydrophilic parts of surfactant molecules. These repulsive
interactions are strongly unfavourable for surfactant micellisation.
For the different interactions mentioned, the main driving force of association in polymer-
surfactant systems in general comes from the hydrophobic interactions between surfactant
molecules. For hydrophobic polymers, the hydrophobic interaction between polymer and
surfactant alkyl chains, will contribute more or less strongly, depending on the system.
Because of delicate energy balances, even quite small contributions from the other interactions
can have dramatic influences on the self-assembly and induce important surfactant-polymer
interactions. Ionic surfactant micellisation will, because of the electrostatic interactions, be
particularly susceptible to changes.
There is obviously an interrelation between specificity and cooperativity such, that for a higher
degree of specificity, cooperativity will be less important and smaller aggregates may form.
The variation in driving forces will have its counterpart in the structural description. For many
polyelectrolyte-ionic surfactant systems, there will be just a long-range effect on micellisation,
and the polymers chains and the surfactant micelles may remain at some distance.
2.3.2. Binding isotherms
A characterisation of the surfactant binding to the polymer (at fixed polymer concentration) is
to represented as a "binding isotherm" (Fig. 1). .
10
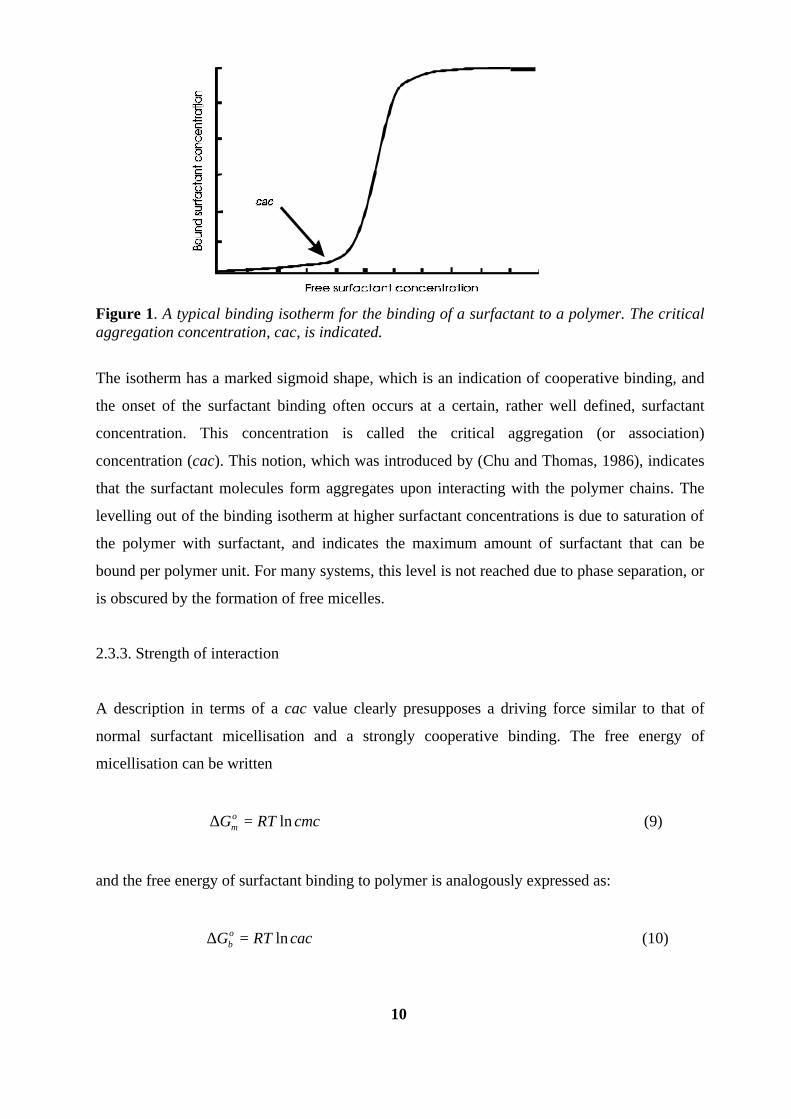
Figure 1. A typical binding isotherm for the binding of a surfactant to a polymer. The critical aggregation concentration, cac, is indicated.
The isotherm has a marked sigmoid shape, which is an indication of cooperative binding, and
the onset of the surfactant binding often occurs at a certain, rather well defined, surfactant
concentration. This concentration is called the critical aggregation (or association)
concentration (cac). This notion, which was introduced by (Chu and Thomas, 1986), indicates
that the surfactant molecules form aggregates upon interacting with the polymer chains. The
levelling out of the binding isotherm at higher surfactant concentrations is due to saturation of
the polymer with surfactant, and indicates the maximum amount of surfactant that can be
bound per polymer unit. For many systems, this level is not reached due to phase separation, or
is obscured by the formation of free micelles.
2.3.3. Strength of interaction
A description in terms of a cac value clearly presupposes a driving force similar to that of
normal surfactant micellisation and a strongly cooperative binding. The free energy of
micellisation can be written
cmcRTGom ln=∆ (9)
and the free energy of surfactant binding to polymer is analogously expressed as:
cacRTGob ln=∆ (10)

11
Therefore, we can derive the free energy per mole surfactant for the reaction: free micelle º
polymer-bound micelle, as
) GoPS = RT ln (cac/cmc) (11)
This quantity is a convenient measure of the strength of the interaction between the surfactant
and the polymer. In particular, it is impossible to have a cac that is higher than the cmc of the
surfactant; in that case, the surfactant molecules would prefer to form free micelles instead of
polymer-bound ones, and surfactant binding to the polymer would not occur. If the polymer
preferentially interacts with a micelle, the free energy of the micelle, and thus the cmc, should
be lowered. On the other hand, while a lowering of the cmc demonstrates an interaction, it is
not necessarily an indication of a complex formation between the polymer and the surfactant.
For example, addition of salt also reduces the cmc and addition of polyelectrolyte of the same
charge as the surfactant has a similar effect.
The strength of the interaction varies considerably between the different types of polymer-
surfactant systems. In particular, the interaction between a polyelectrolyte and an oppositely
charged surfactant is strongly favoured, and a decrease of the cac relative to the cmc by several
orders of magnitude is commonly observed.
2.3.4. Interactions between polyelectrolytes and oppositely charged surfactants
Systems of a polyelectrolyte and an oppositely charged surfactant in dilute solution have been
extensively studied. Due to the strong attraction between two species, the interaction starts at
very low surfactant concentrations and is difficult to study by most conventional techniques.
Often, binding of an ionic surfactant to polyions starts at a concentration, which is several
magnitudes lower than the cmc in polymer-free solution. The surfactant binding is also highly
cooperative in these systems, pointing to the contribution from interactions among the
adsorbed surfactant molecules, and the formation of polymer-adsorbed micelles or micelle-like
clusters.
There are some general features of relevance for systems of polyelectrolyte and oppositely
charged surfactant. First, it should be noted that, due to general electrostatic interactions,
polyelectrolytes give rise to an uneven distribution of ions in a solution. The concentration of

12
counterions is strongly enhanced close to the polyelectrolyte and decays rapidly with an
increased distance from it. The uneven distribution of counterions also applies to monomeric
surfactant counterions, present in the polyelectrolyte solution. Thus, the concentration of
surfactant ions is enhanced close to the polyelectrolyte in systems of polyelectrolyte and
oppositely charged surfactant. The major reason for cooperative binding of surfactant
molecules to an oppositely charged polyelectrolyte is the electrostatic stabilization of the
surfactant micelles. For hydrophilic polyelectrolytes, such as polysaccharides, there is no
driving force to make the polymer segments to penetrate into the hydrophobic interior of the
micelle. The situation is thus very different from systems of an uncharged polymer, where
forces other than pure electrostatic ones play a major role. The situation will be altered if the
polyelectrolyte also contains hydrophobic moieties.
2.3.4.1. Influence of the surfactant
The length of the hydrocarbon tail of the surfactant is a crucial parameter for the interaction
with a polyelectrolyte. An increasing difference between log(cmc) and log(cac) when
surfactant chain length is increased indicates that the interaction between polymer and
surfactant is increasing (Figure 2).
Figure 2. Cac values for CnTAB and Hy at 25o C compared with the cmc values of the surfactant. Also, included are cmc values for these surfactants in the presence of 0.5 M NaBr, and cmc values for non-ionic surfactants of the Cn(EO)6 type. Ref. from (Thalberg and Lindman, 1989)
13
This can be attributed to the uneven distribution of counterions between the bulk and the
micellar surface, which is unfavourable for the formation of normal micelles and which is
more pronounced for a longer surfactant; a lower cmc gives a lower intermicellar
concentration. The binding of an oppositely charged polyelectrolyte to the micelles entails a
release of the ordinary counterions, and, therefore, leads to a larger increase in the entropy of
the counterions for a surfactant of longer chain length (Thalberg and Lindman, 1989). For
surfactants with less than a certain chain length (10 for the Hy-CnTAB system), there will be
no binding to the polyelectrolyte. In this case, normal free micelles are favoured relative to the
polyelectrolyte-bound ones.
A second way of conceiving the interaction is to consider the formation of polyelectrolyte-
surfactant aggregates with a relatively low charge. The surfactant chain length dependence for
the formation of these aggregates will therefore be similar to the alkyl chain length dependence
for the formation of non-ionic micelles.
2.3.4.2. Influence of the polyelectrolyte
The properties of the polyelectrolyte are also of major importance for the interaction with
surfactants. One important parameter is the reduced linear charge density of the
polyelectrolyte, . (Eq. 1). Cac data for different systems as a function of . are given in Figure
3. The trend is clearly that an increase in linear charge density gives rise to a stronger
interaction. Apparently, other forces also play a role besides the pure electrostatic ones, and
modulate the interaction between the polyelectrolyte and the surfactant micelles. Such
contributions may arise from different types of charged groups or from the presence of
hydrophobic moieties on the polyelectrolyte. In addition, the flexibility of the polymer
backbone and the type of counterions present may influence the interaction.

14
Figure 3. Log(cac) for C12TAB (R) and C14TAB (N), polyelectrolytes varying the reduced linear charge density, .. The polyelectrolytes are PA (polyacrylate) (. = 2.8), alginate (. = 1.5), and pectate (. = 0.6). Data is from (Hayakawa et al., 1991 and Thalberg et al., 1989). The cooperativity in surfactant binding is also influenced by the charge density of the
polyelectrolyte; the cooperativeness decreases rapidly with a reduced charge density of the
polyelectrolyte, but a marked cooperativeness is also observed for the binding of C10TAB to
Hy, which has a relatively low charge density (Thalberg and Lindman, 1989, Thalberg et al.,
1990a, 1991a). Thus, the cooperativeness also depends on other features of the polyelectrolyte,
such as the flexibility of the chains and hydrophobic character of the repeating units.
2.3.4.3. Effect of salt
The effect of salt on the polyelectrolyte-surfactant complexes is opposite to the influence of
salt in micellar systems, where stabilization occurs manifested by a lowering of the cmc. The
effect of salt is twofold: 1) A reduction in the electrostatic interaction between polyelectrolyte
and the surfactant, and 2) The stabilization of the surfactant aggregates. The first mechanism
will dominate at low ionic strength, while at high ionic strength, the second mechanism will
take over. A decrease in cac at high-salt concentrations, similar to the cmc behaviour, can
therefore be expected.
2. 4. Polyelectrolyte/surfactant complexes
2. 4. 1. Phase behaviour of hydrophilic polymers with pure surfactant micelles
Hydrophilic non-ionic polymers are well soluble in water. There are no hydrophobic
interactions between these polymers and surfactants. In most cases, the phase separation is

15
segregative, but if the polymer and the surfactants are oppositely charged, associative phase
separation of the complexes may occur. Adding a certain amount of salt will suppress the
association and eventually lead to a segregative phase separation.
2. 4. 1. 1. Oppositely charged mixtures
High-charged polymers differ strongly from the corresponding non-ionic species. There is a
strong enrichment of counterions close to the polyelectrolyte and this uneven counterion
distribution lowers the entropy markedly. For ionic surfactants, this entropic effect strongly
counteracts micellisation. This is the major reason for the much higher cmc of ionic surfactants
compared to non-ionics (Evans et al., 1994). In the presence of electrolytes, micelles are
stabilised, the higher is the valency of the oppositely charged ion. This polyelectrolyte
induced lowering of the cmc of oppositely charged surfactants is also referred to as a
cooperative binding of the surfactant to the polyelectrolyte. .
Another observation is that in oppositely charged mixtures associative phase separation occurs
at quite low surfactant concentrations, often only slightly above the cac (Goddard (1986a, b
and Goddard and Ananthapadamabhan, 1993). The concentrated phase could be a solid or a
highly viscous gel-like solution. Addition of large amount of salt inhibits the phase separation
and a redissolution of the complex phase takes place when an excess of surfactant is added.
The phase behaviour of oppositely charged surfactant and hydrophilic polyelectrolyte depends
on the choices of polyelectrolyte, surfactant and simple salt. The minimum concentration of
surfactant required for phase separation decreases strongly as its chain length increases, i.e. as
cmc decreases. This observation supports the notion that associative phase separation involves
the polyion and the self-associated surfactant. The redissolution concentration is less
dependent on the surfactant chain length. An increase in the simple salt concentration leads to
shrinkage of the two-phase area. The amount of salt needed to give redissolution, the critical
electrolyte concentration (cec), increases with increasing surfactant chain length and is
strongly dependent on the surfactant concentration. Cec also depends on the nature of the
added salt, the anion in particular. Increasing the valency of a simple ion lowers counterion
entropy effects and decreases the entropic gain of polyion-micelle association. This reduces the
16
tendency to associative phase separation. The salt effects have been confirmed for mixtures of
cationics with NaPa (sodium poly(acrylate)) by (Hansson and Almgren, 1994). They suggested
that the increasing cec with increasing surfactant chain length could be attributed to a larger
aggregation number of micelles. Tendency to association increases strongly with increasing
charge density of the polyelectrolyte. This is nicely shown in a study of poly(acrylate-co-
acrylamide) (Ranganathan and Kwak, 1996) where the ionisation of the polymer was varied.
The experiment of varying the charge density of the micelles by mixing in non-ionic surfactant
has also been made (Li and Dubin, 1995). As expected, reducing the micellar charge density or
the charge density of the polymer markedly reduces the extent of the phase separation.
2. 4. 2. Structure of complexes
2.4.2.1. Conformation of surfactant molecules
Polyelectrolyte/oppositely charged systems have been widely studied and especially the
aggregation numbers of the associating surfactants have been determined. The general picture
emerging from these studies is that micelle-like surfactant clusters bind to the polymer chains
so that the charged segments are neutralised by the oppositely charged head groups of the
surfactant. The majority of the investigations directed towards the structure of polyelectrolyte-
surfactant complexes have focussed on the properties of the surfactant aggregates; notably
their aggregation numbers.
In particular, the use of fluorescence techniques has contributed to the establishment of this
structure, but also different NMR techniques have been used. The first report of aggregation
numbers in polyeletrolyte/surfactant system is of (Abuin and Scaiano, 1984). They studied the
system of PSS and C12TAB and found that the surfactant forms small clusters of only up to 10
monomers absorbed into the polymer chains. (Zhen and Tung, 1992) studied extensively
interactions of NaCMA (sodium carboxymethylamylose) with SDS. The cac was found to be
3*10-3 M for SDS. Dynamic fluorescence-quenching measurements indicated that the
aggregation number of associated micelles is smaller than for free micelles. (Nagg ~47;
NaCMA = 1.6 w%, [SDS] = 5*10-3 M). For C16TAB the Nagg ranges from 36 to 55, as
compared 147 for the free micelles. There have been many studies aimed at the determination
of surfactant aggregation numbers in polyelectrolyte/surfactant systems. The results from these
numerous studies can be summarised as follows.

17
Nagg has been found to be independent of the concentration of the bound surfactant, Cb
(Hansson and Almgren, 1994,1995). This behaviour has been illustrated by the studies of
(Anthony and Zana, 1996). They studied binding of C12TAC to PS1 (poly(maleic acid-co-
methyl vinyl ether) and PS4 (poly(maleic acid-co-butyl vinyl ether). The constancy of Nagg
indicates that the surfactant binding to polyions results in the formation of aggregates of
constant composition and, thus, involving a constant length of polyion, in number increasing
with Cb.
In the same studies was also found that Nagg increases with " (degree of neutralization) for PS4
but decreases for PS1. This difference has been attributed to the fact that the side methyl
groups of PS1 are short and contribute very little to the formation of the mixed aggregates. On
the contrary, with, PS4, the side butyl chains interact hydrophobically with the surfactant alkyl
chains and the aggregates are similar to mixed micelles of two surfactants. The latter form only
small micelles and its mixed micellisation with a longer chain surfactant results in micelles of
aggregation number smaller than for the longer surfactant. (Kiefer et al., 1992) also observed
an increase of Nagg with " in the system of PAA/C14TAB in the presence of 10mM KBr.
The Nagg values for polyelectrolyte-bound aggregates increase with the surfactant chain length
as in polymer-free systems (Almgren et al, 1992), but decrease with temperature (Hansson and
Almgren, 1995) and are independent of the nature of the surfactant counterion (Hansson and
Almgren, 1994) and of the added electrolyte (Hansson and Almgren, 1995). Thus, there is
series of results in contrast with the behaviour of polymer-free surfactant solutions.
The bound aggregates have been shown to be relatively polydisperse with F/Nagg values
ranging between 0.3 and 0.7 (F = standard deviation of the distribution) (Almgren et al. 1992).
Almgren et al. have performed extensive determinations of Nagg for variety of systems
(NaPSS/CnTAB and CnTAC (Almgren et al., 1992); NaPAA or NaPSS and CnTAB (Hansson
and Almgren, 1994); NaPVS or NaDXS and C12TAB (Hansson and Almgren, 1995); NaHy
and C10TAB or C12TAB (Thalberg et al., 1991 a, d). The Nagg values were found to be close to
those for polymer-free aggregates for PS1("=1)/C12TAC, NaPAA/C12TAB, NaHy/C12TAB
and NA-CMA (sodium carboxyamylose)/C16TAB (Zhen and Tung, 1992). These
polyelectrolytes are all highly hydrophilic. On the other hand, the Nagg values in the
PS4("=1)/C12TAC and NaPSS/C12TAB or C12TAC were found to be smaller than those in the
18
absence of polyelectrolyte. Both PS4("=1) and NaPSS behave like hydrophilic
polyelectrolytes. Nevertheless, they show an effect of hydrophobicity arising from the
presence of butyl chains and phenylene groups. A partial penetration of the polymer chains in
the micelles result in lower Nagg values. Finally, the Nagg values in the NaPVS/C12TAB and
NaDXS/C12TAB systems were found to be larges than for pure C12TAB micelles. This was
interpreted as due to the special nature of sulphate group (Hansson and Almgren, 1995), as
similarly the nature of counterion can affect micelle aggregation number.
In some polyelectrolyte/surfactant systems, such as NaPAA/C12TAB or C12TAC systems,
phase separation upon addition of salt yielded two liquid phases: dilute phase and a
concentrated one (Hansson and Almren, 1994). The values of Nagg in the two phases differ
only slightly. The difference can be up to 15%.
2. 4. 2. 2. Conformation of the polyelectrolyte
Information of this topic is traditionally mainly obtained from viscosity measurements on
dilute polymer solutions. Recently scattering studies with SANS and SAXS have provided
further information. A decrease in the dimensions of the polyelectrolyte coils was observed for
NaPA-CnTAB solutions (Thalberg et al., 1991 c). Certainly, coiling of the chains can be
expected both for electrostatic reasons, as polyelectrolyte chains in pure water are extended,
and for topological reasons, i.e., in order to create a large contact area between polymer chain
and the micelle. (Herslöf and Sundelöf, 1992) studied the viscosity in dilute solution for
NaHy-C16TAB system after addition of salt (NaBr). A reduction in the viscosity was found as
compared to the surfactant-free system, but only below a certain salt concentration.
Apparently, the polyelectrolyte-surfactant interaction is fully screened out at high salt
concentration. Below this concentration, the viscosity decreased rapidly with a reduced salt
concentration until the phase separation limit was reached.
Recently, Monte Carlo simulations have been applied to investigate complex formation
between micelles and hydrophilic polyelectrolytes (Wallin and Linse, 1995). The scope of
these studies was to study how different system parameters as flexibility and linear charge
density of the polymer, and the chain length of the surfactant affect the cac/cmc ratio. The
conformation of polyelectrolyte-surfactant complexes was found to depend on the flexibility of
the polymer chains. A flexible polyelectrolyte chain can easily wrap around the micelle and the

19
micellar charge is neutralised by polyelectrolyte charges located close to the micelle,
contributing to lower cac values. However, when the bare persistence length is of the order of
the micellar dimension, the polyelectrolyte is wrapped less tightly around the micelle and
obviously, the possibility of the polymer to replacing small counterions of the micelle is
diminished. However, the results with relatively stiff CS show that this is not a general rule.
2. 4. 3. Native starch-surfactant complexes
It is very well known that amylose exists in three different helical conformations in aqueous
solutions. These polymorphs are named A-, B- and V-forms. The A- and B- forms comprise
parallel-packed, left-handed double helices. The A- and B-forms can be considered as
extended helices with, unlike the V-form, no hydrogen bonding between consecutive turns of
the helices. The V-form occurs only in the presence of some complex-forming ligand.
It has for a long time been known that amylose forms helical inclusion complexes with a
variety of organic compounds such as lipids (Snape et al., 1998), carboxyl acids (Codet et al.,
1993) and different surfactants (Yamamoto et al., 1983). The helical coil formed by the
amylose/lipid inclusion complex in aqueous solution has been demonstrated to comprise from
6 to 8 repeating glucose units per helical turn. Amylose takes so-called V-form conformation
when forming the inclusion complexes. The V amylose is a generic name for crystalline
amyloses, obtained as single helices co-crystallized with compounds such as water, iodine,
DMSO, alcohols or fatty acids. In the V-form, a single chain of amylose forms a helix with a
relatively large cavity. The central cavities of the V-forms have a pitch of about 8Å per turn. A
detailed X-ray conformational analysis of the hydrated helix with a guest molecule inside has
been reported by (Rappenecker et al., 1981). (Yamamoto et al., 1983) found that the binding
of sodium alkyl sulphates to amylose is cooperative when the DP of polymer is big enough,
and that its cooperativeness depends on the carbon chain length of the surfactant. Also, the
outer branches of the amylopectin molecule are assumed to form the same kind of inclusion
complexes with suitable lipids (Kubik et al, 1995, Thomasik et al., 1995, Eliasson et al.,
1995).
2. 4. 4. Polyelectrolyte-surfactant complexes with high range order
2. 4. 4. 1. In organic solvents and in the solid state

20
Polyelectrolyte-surfactant complexes have known for some years to form ordered complexes
in organic solvents and in the solid state. For a review, see (Ober and Wegner, 1997).
(Antonietti et al., 1994) have observed that complexes that precipitate out when aqueous
solution of NaPSS and alkyltrimethylammonium bromides are mixed together can be
redissolved in organic solvents such as dimethylformamide, tetrahydrofuran or ethanol, where
they behave like polyelectrolytes. Cast films of some of these complexes showed highly
ordered mesophases of the lamellar type (Antonietti et al., 1995). Such structures appear to be
of a general character since they were observed with several polyion/surfactant ion complexes:
copolymers of 2-acrylamido-2-methyl-1-propanesulphonic acid with N-octadecylacrylamide,
at different ratios of the two monomers with C16TAB (Antonietti et al. 1996), and poly-
(dimethyldiallylammonium chloride)/natural lipid (Antonietti et al. 1998).
(Kabanov et al., 1994, 1995) investigated complexes of polycations and polyanions with the
anionic surfactant AOT (sodium diethylhexylsulfosuccinate) in organic solvents in the
presence of water. The complexation of polyelectrolytes of the ionomer type (partially
sulfonated polystyrene) by AOT in m-xylene resulted in a partial disruption of the aggregates
formed by the ionomer (Kabanov et al., 1994). Poly(N-ethyl-4-vinylpyridinium bromide) was
found to be soluble in octane and hexane in the presence of AOT (Kabanov et al., 1995) and in
the presence of water pools formed by AOT, where it adopted a rather compact conformation
(Kabanov et al., 1994). At low water content, the authors proposed a comb-like model for the
complex.
2. 4. 4. 2. In aqueous solutions
In the first reported study, as expected, (Harada and Nozakura, 1984) described electron
microscope (TEM) studies of polyelectrolyte complexes made from poly(vinyl sulphate), PVS,
with C16TAB. By mixing dilute aqueous solutions of the potassium salt of PVS with C16TAB,
precipitates were formed which showed maximum turbidity when a 1:1 mixture was prepared.
The precipitates possessed complex lamellar structures that were measured by X-ray
diffraction and found to be of thickness 50-60 Å, the length of two surfactant molecules.
Similar layered structures were reported for the complex made from ionene-3,4 and SDS.
21
Osada et al. made extensive studies of x,y-ionene/SDS and PVS or PAMPS (poly[2-
(acrylamido)-2-methylpropanesulphonic acid]/n-alkylpyridinium surfactants systems (Chen et
al., 1998 and Kim et al., 1999). The results showed that n-alkylpyridinium surfactants form
lamellar mesophases in the complexes of NaPSS, but hexagonal close-packed of spherical
micelles with PAMPS. They assumed that the reason for these different structures might be the
more rigid chains of NaPSS, which may inhibit the folding of polymer chains around the
micelles.
Kabanov et al. studied the NaPA-gel/alkyltrimethylammonium bromide complexes
(Khandurina et al., 1994 a, b, c). The complexes were found to have lamellar structure when
the chain length of the surfactant was long enough (>14). The NaPA complexes with C14TAB
and C12TAB were amorphous without any long-range order. Benjamin Chu and his co-workers
have extensively studied ordered polyelectrolyte/surfactant structures. They studied
poly(diallylmethylammonium chloride, PDADMAC) gels with different sodium alkyl
sulphates (Sokolov et al., 1996, 1998) and found that these complexes have structure of
hexagonal close-packed of cylindrical micelles with SDS, STS, and SHS. The SDS complex
was found to have a cubic structure. The structure was dependent on surfactant chain length
and temperature, thus SOS or SHS complexes do not have any ordered structure at room
temperature, but at -5EC, PDADMAC/SOS the complex has a cubic structure. Recent studies
(Zhou et al., 1999) on the complexes of PMAA and (PMAA/NIPAM) systems showed a clear
dependence of the complex structure formed on chain length of the surfactant. With surfactants
of different chain lengths, PAA forms different structures (C8TAB, micellar; C10TAB,
C12TAB, C14TAB and C16TAB cubic Pm3n). PMAA/NIPAM-complexes are with: C18TAB
cubic, C14TAB and C16TAB face-centred cubic close packing of spheres, C12TAB hexagonal
close packing of spheres. PMAA/NIPAM is more hydrophobic than PMAA, and the
hydrophobicity has a clear effect on the structure of polyelectrolyte/surfactant complexes. In
the same studies, PSS/surfactant complexes were also compared with PMAA/surfactant
complexes. PSS has a more rigid and stiffer chain than PMAA. The structure of PSS/C14-
18TAB complexes was a 2D hexagonal close packing of cylinders. Thus, the structure of PSS
and PMAA complexes is quite different. It was assumed that this difference is due to the rigid
chain of PSS that makes it difficult to wrap the polymer chain around spherical micelles.

22
Very recently (Ilekti et al., 1999) published studies about NaPA/C16TAB system. They
produced a phase diagram that shows the structure of NaPA/C16TAB complexes as a function
of NaPA and C16TAB concentrations. The structure of the complex was found to chance with
increasing concentration of complex phase from micellar to cubic and hexagonal. At higher
temperatures and at high concentrations lamellar structures can also formed. These phase
transitions were also compared with the phase transitions of pure surfactant in the same
conditions, and it was found that the existence of polyelectrolyte can lead to different
structures.
There are also some studies about the effect of adding polyelectrolyte to the liquid crystalline
phase of some surfactants. (Kosmella et al., 1996 and Ruppelt et al., 1997) found that the
intercalation of sodium polyacrylate into mesophases formed by alkyltrimethylammonium
bromides induced some disordering, but did not substantially affect the phase structures.
These studies can be summarised as follows: 1) Alkyl chain length of the surfactant affects the
formation and transition of highly ordered structures inside polyelectrolyte/surfactant
complexes. The longer the chain length, the stronger are the hydrophobic interactions between
surfactant and polymer chains and the smaller the volume ratio of polar-to-apolar moieties of
surfactant, both of which determine the self-assembly behaviour of the surfactant inside the
complexes. 2) Both electrostatic and hydrophobic interactions are very important for inducing
the highly ordered self-assembly of surfactant molecules. The longer the surfactant chain
length, the lower the charge density and the weaker is the hydrophobicity of polyelectrolyte
chains are required to form ordered structures. 3) The charge density of the polyelectrolyte is
an important parameter determing the structures formed. When the charge density of
polyelectrolyte chains decreases the structures of the resulting complexes become less ordered.
Both the aggregation number and the radius of the micelles inside the complexes decrease with
decreasing charge density of the polymer. 4) The flexibility of polyelectrolyte chains affects
the shape of structural elements formed by the self-assembly of polymer-bound surfactant
molecules. The surfactant molecules bound by stiff polymer chains prefer to form the
structural element of cylinders, while those bound by more flexible polymer chains can form
spheres. 5) Temperature has also a clear effect on the stability of the ordered structures. At
higher temperatures ordered structures with lower stability are formed, and above certain
temperatures, the formation of highly ordered structures inside the complexes can be totally
prevented.

23
2. 5. Basics of the research methods used in this study
2. 5. 1. Surface tension
There is a simple relationship between a change in the surface tension and the surface excess
of surface-active agent. For a binary system the relation can be written:
d( = - '2(1)d:2 (12)
where, '2(1) is the excess surface concentration of component 2, and :2 is the chemical
potential of component 2. This is so called Gibbs adsorption equation.
It was (Jones, 1967), who studied the properties of mixed poly(ethylene oxide) (PEO)/sodium
dodecyl sulphate (SDS) systems and first formalised the concept, in a system of fixed polymer
concentration and increasing amounts of surfactant, using two critical concentrations, viz. T1
and T2, of the surfactant (Figure 6). When an increasing amount of surfactant is added, the
concentration of surfactant on the water/air interface increases. This is seen as a reduction in
surface tension. T1 represent the concentration at which the cooperative interaction between
surfactant and polymer first occurs. The surface concentration of the surfactant does not
increase, because all added surfactant associates with the polymer. This results in a flat part in
the surface tension curve. T2' is the concentration at which the polymer becomes saturated by
the surfactant and the surface tension starts to decrease again. At T2, the surfactant
concentration reaches the cmc; and all added surfactant forms micelles. The concentration of
surfactant monomers at the surface does not increase any more and the surface tension remains
nearly constant. Jones illustrated the simplicity of the surface tension method when applied to
a mixture of a highly surface-active species, the surfactant, and a weakly surface-active
species, the polymer. If one makes the reasonable assumption that the surface tension is a
sensor of the free surfactant in solution, a method to monitor the concentration changes of non-
complexified surfactant in the mixed systems is thus provided.

24
Figure 4. Diagrammatic surface tension/concentration plot of a surfactant in the presence of a complexing polymer. From (Goddard and Anabthapadmanadhan, 1993).
A system which has been widely studied by the surface tension method is poly (vinyl
pyrrolidone) (PVP)/SDS as illustrated in the works of (Lange, 1971) and (Murata et al., 1973).
Another system which is much studied by surface tension method is the system of Polymer JR
(cationic hydroxyethyl cellulose derivate)/SDS, studied by (Goddard et al., 1976). They
detected: 1) A synergistic lowering of the surface tension at very low surfactant concentration,
implying the formation of a highly surface active complex; 2) The persistence of a low surface
tension even in the zone of high precipitation where most of the originally added SDS is out of
the solution; 3) Eventual coincidence with the surface tension curve of the polymer-free
surfactant system in the micellar region. The observed phenomena can be explained in terms of
the diagrams shown in Figure 5, representing progressive uptake of surfactant by the polymer.

25
Figure 5. Conditions in bulk and surface of a solution containing a polycation (fixed concentration) and anionic surfactant. Full line is the hypothetical surface tension/concentration curve of the surfactant alone; dotted line is that of the mixture with polycation. Simple countercations are depicted only in surface zone. From (Goddard and Anabthapadmanadhan, 1993).
2. 5. 2. Solution viscosity and rheology
One of the most significant aspects of polymer-surfactant systems from a practical point of
view is that of rheology control and viscosity enhancement. The studies can be grouped into
three categories: 1) Cross-linking of hydrophobe-modified polymers by surfactant; 2)
Polyelectrolytes interacting with ionic surfactants; 3) Using the temperature-dependent
solvation of non-ionic polymers to obtain a thermal gelation with ionic surfactants. The
following representation will mainly concentrate on the second case i.e. polyelectrolyte-ionic
surfactant systems.
Dilute solution viscosity is usually measured in capillary viscosimeters of the Ostwald-Fenske
or Ubbelohde type. The measuring of reduced viscosity or viscosity number is widely used as
a tool for analysis in polymer/surfactant systems.
The reduced viscosity values are calculated from the efflux times using:

26
0red = ((t - to) / t) / C (13)
where t is the measured efflux time, to is the efflux time of the pure solvent (water) and c is the
weight concentration of the polymer.
The interplay of the polymer charging, related conformational changes, and viscosity increases
is well recognised. In systems of uncharged polymer and ionic surfactant, many studies have
been carried out using viscosity measurements. Jones reported a steady increase in the relative
viscosity of PEO solution on adding increasing amounts of SDS (Jones, 1967). A clear change
in viscosity occurred at a concentration T2, but no slope change was present near T1. In the
same way, (Lange, 1971) observed an increase in viscosity of PVP on addition of SDS. In this
case, the effect was recorded as an increase in specific viscosity that occurred in the vicinity of
T1 for this system. These results clearly imply a change in polymer conformation, viz. an
expansion of the polymer coils, on association with the charged surfactant, as reported also by
Nagaran and Kalpakci of PEO/SDS systems (Nagaran et al., 1982), and by (Tadros, 1974) for
PVAc/DDBS systems, respectively. A systematic investigation of the variation of the viscosity
of PEO solutions, covering a range of molecular weight and concentration, as a function of
added SDS concentration, has been described by (Francois et al., 1985). Their plots of reduced
viscosity show a sudden increase at a concentration (T1) of SDS, which was independent of the
polymer concentration, and a levelling off at a concentration (T2), which increased with
polymer concentration (Figure 6).

27
Figure 6. Reduced viscosity of poly(ethylene oxide) as a function of SDS concentration: (!) mol wt = 2 x 10⁶, concentration = 6 x 10⁻¹ g dm-3; (") mol wt = 106, concentration = 6 x 10⁻² g dm-3; (Q) mol wt = 2 x 10⁵, concentration = 5 x 10⁻¹ g dm-3; (#) mol wt = 7 x 10⁴, concentration = 5 x 10⁻¹g dm-3. (Fancois et al., 1985)
Several references may be found in the literature to the compaction of polyelectrolytes on
binding of oppositely charged surfactants (Musabekov et al., 1983). Viscosity measurements
have been carried out by (Abuin and Scaiano, 1984) on mixtures of PSS of Mw of 130 000 and
DTAB. When added to solution of 0.36 w% PSS, DTAB in the pre-precipitation zone brought
about a progressive reduction in the viscosity of the solutions. For example, 5.8 mM DTAB
was found to drop the reduced viscosity of PSS by a factor of ten, far exceeding the reduction
effected by addition of the simple analog "surfactant", tetradecyltrimethylammonium bromide.
The explanation offered was that coiling of the flexible "vinyl" backboned polyelectrolyte
occurs around small clusters of the surfactant, which form under these conditions. Similar
effects have been obtained by (Bekturov et al., 1984), who studied the viscosity characteristics
of a series of amphoteric polymers on addition of anionic (SDS) or cationic (CTAB)
surfactants to their solutions.
(Goddard et al., 1982) and (Leung and Goddard, 1985) have reported viscosimetric and
rheological studies on two cationic polymers, viz. a cationic cellulosic (Polymer JR) and an
acrylamide/$-methacryloxyethyltrimethylammonium chloride copolymer (Reten, Hercules)

28
within a range of polymer and added SDS concentrations. Considerable differences in
behaviour between the two polymers were found. At the 1% Reten level, no change was
detectable in viscosity at all levels of added SDS but, by contrast, the viscosity of 1% Polymer
JR solutions increased over 200-fold (Figure 7).
Figure 7. Relative viscosity of 1% Polymer JR400 and 1% Reten 220 as a function of SDS concentration. From (Goddard and Leung, 1982).
Under the same conditions, the viscosity of 0.1% Polymer JR solutions decreased somewhat.
These results suggested little change in conformation accompanied the binding of SDS to
Reten but that intermolecular association was promoted in the solutions of the cationic
cellulose at higher concentration and intramolecular association at the lower concentrations.
The results of viscosity measurements were interpreted so that the low-viscosity form is a
somewhat tangled necklace structure of SDS micelles and polymer chains, and the higher-
viscosity form is a more open structure with double layer of adsorbed SDS molecules.
A careful rheological characterisation of the JR-400/SDS gels showed that the elastic
properties dominate over the viscous ones even down to very low frequencies in oscillatory
measurements. The strength of these gels increases with increasing charge density of the
polymer. The structure of the complexes is a stiff network i.e. the polymer molecules are
linked together via surfactant aggregates forming a network structure.

29
(Thalberg, 1990b) has studied the rheological properties of hyalouran/polyacrylate-CnTAB
complexes (Figure 8). The complexes were also found to be transparent gels. The rheological
characterisation of these gels shows that the loss modulus dominates at low frequencies and
the elastic modulus at high, but indicates no fundamental difference to concentrated solutions
of the polymer alone. From the time-resolved fluorescence quenching and NMR self-diffusion
studies, a clear picture of the structure of these complexes arises. It is an entangled
polyelectrolyte solution with the surfactant micelles placed in the meshes of the network.
Figure 8. Storage (G’) and loss (G’‘) moduli as a function of oscillation frequency. Dashed lines NaHy (12 w%), full lines NaHy (12 w%) + C14TAB (25 w%), dotted lines concentrated complex phase of NaHy and C14TAB.
Thus, what is the reason for these differences and hence the rheological properties of these two
polylectrolyte-surfactant complexes? The most obvious reason is the stiffness of the polymer
chain. Cellulose chains are very rigid which makes them very hard to wrap around the
associating surfactant aggregates. Otherwise, the associated micelles can easily act as links
between different polymer chains. Hyalouronic and polyacrylate chains are more flexible and
are able to wrap around the micelles. In this case, the formation of intermolecular bridges via
surfactant micelles between separate polyelectrolyte molecules is very difficult. Another
important parameter favouring network formation is, of course the charge density of the
30
polyelectrolyte.
2. 5. 3. Dynamic light scattering (DLS)
Dynamic light scattering has become an important tool in the study of polymer solutions over
the last decades. The rationale for this is that it provides data on the molecular mobility and
diffusion coeffients of macromolecules, which are of increasing conceptual and practical
importance. This data can also be interpreted directly in terms of the size and configuration of
the polymer molecule.
It is possible to record the scattering intensity from tiny scattering volumes in time intervals as
short as 50 ns. This enables the following of the motion of macromolecules in solution. This is
achieved by the construction of a time correlation function (Pecora, 1975).
G2(t) = <i(0) i(t)> (14)
where the scattering intensity at time zero is compared with that at a delayed time t . 10-6 s -
10-3 s. This intensity correlation function is difficult to interpret, but can, under most
conditions be converted into a correlation function g1(t) of the scattered electric field so that
G2(t) = A + (Bg1(t))2 (15)
with
g1(t) = S(q,t)/S(q) (16)
where S(q,t) is the dynamic structure factor, which is given by
S(q,t) = 3 3 < exp (iq*r j (0) - r k (t)*) > (17)
Here, q is the magnitude of scattering vector
q = (4B/8) sin 2/2 (18)
31
and r j (0) is the position of the j th scattering element at time zero, while r k (t) is that of the k th
element at time t. S(q) is time independent and is the static structure factor
S(q) = < 3 3 exp (iq*r j (0) - r k (0)* > (19)
In most cases, there is a very limited knowledge of the required space-time distribution
functions, and only the simplest cases are known. One example is that of small particles with a
narrow weight distribution, and for mono-dispersal, large, hard sphere. Then we can write
g1(t) = B exp(-'t) (20)
with B a constant close to unity and a decay constant ', that is related to the translational
diffusion coefficient DT by the equation
' = DT q2 (21)
In most cases, simple single exponential behaviour is not observed, and deviations from the
straight line of log g1 (t) against t are apparent. Once DT has been determined, the
hydrodynamic radius, RH, can be calculated from DT using the Stokes-Einstein equation
(Einstein, 1956):
DT = kT/6B0RH (22)
where k is Boltzmann's constant, T is the absolute temperature and 0 is the viscosity.
A polydispersed system of spherically symmetric clusters will have a first-order correlation
function with contributions from all sizes (Schmitz, 1990).
g1(t) = Io4 (F(Reff)exp [-(q2Defft)] dReff (23)
where the weighting factor F(R) is the intensity of light scattered by clusters of size R. The
effective diffusion coefficient in this equation equals the translational diffusion coefficient for
32
qR<1. When qR>>1 the rotational diffusion coefficient contributes to the decay of correlation
function. The intensity distribution function can be related to the number distribution function,
N(R), via
F(R) = B"2(R)S(qR)N(R) (24)
where B is a normalization factor and "(R) and S(qR) are the polarisability and form factor for
clusters of size R measured at a wave vector q.
Substitution of Eq. 24 into Equations 20 and 21, and assuming that Deff = kT/6B0Reff yield a
Laplace transform relationship between the measured second-order correlation function and
the intensity distribution
(g2(t) - 1)1/2 = Io4 F(Reff) exp [-(q2kT/6B0) Reff
-1 t] dReff + * (25)
where * is a constant background contribution to g(1)(t) due to scattering from large impurities
or dust.
There are many procedures developed to obtain the intensity distribution of clusters from the
measured time correlation function. One of the most frequently used is Contin (Provencer,
1982 and Ju, 1992), which is developed by Provencer. The program uses a constrained Laplace
transform to find the smoothest non-negative intensity distribution consistent with the data. A
grid of line-widths is laid out with equal spacing in log(') and a preliminary non-smoothed
solution is sought. Thereafter, a penalizing function (regulariser) is added to the model and
additional solutions are sought with increasing weight of the regulariser. For each solution, a
statistic, the 'probability to rejection', is calculated via comparison of the sum of squared
residuals for this degree of regularisation and that obtained in the preliminary calculation. The
regulariser used is based on the sum of the second derivates of G(') with respect to '. The
solution for which the 'probability to rejection' is closest to 0.5 is recommended as the 'chosen
solution'. All fitting is done to the g1 values, which are calculated from the g2-1 values
obtained from a homodyne experiment.
Polyelectrolyte systems have specific properties that make the interpretation of the light
scattering data difficult (Nicolai, 1989). The polyelectrolytes have small counterions
surrounding each polyion, which screens the surface charge of the polyion. This long-range
effect is to reduce the apparent charge on the polyion and thereby reduce the magnitude of the
33
direct polyion-polyion interactions. The role of the small ions can be classified as passive or
active, depending on whether they affect the equilibrium or dynamic properties of the polyion.
As passive components, the small ions are assumed to instantaneously relax to their
equilibrium distribution, and therefore they act to screen the interactions between the polyions.
The second effect is an indirect coupling of the polyions. That is, the dynamics of the polyions
become statistically coupled by way of overlapping ion clouds. As active components, the
small-ion dynamics can have a significant influence on the dynamics of the polyions.
Especially at very low ionic-strength solutions, polyions are found to diffuse at the same rate
as their counterions. Decreasing the ionic strength decrease the observable diffusion rate of the
polyions by increasing the repulsion between the charged segments. It has also another effect
by expanding the counterion layer and thus increasing the apparent friction factor and so
decrease the diffusion rate. The intensity of light-scattering by a charged particle is also
reduced relative to the neutral particle. This makes ligh-scattering experiments of
polyelectrolytes in dilute solutions even more difficult. When the added electrolyte
concentration is lower than the equivalent polyelectrolyte concentration, the intensity
correlation functions of polyelectrolyte solutions are no longer of the unimodal type but
display a bimodal behaviour, with two characteristic decay rates termed fast and slow. Both a
slow and a fast decay rate are found for rod-like and flexible polyelectrolyte molecules such as
DNA (Wang et al., 1991) and NaPSS (Sedlak et al., 1992). It has been demonstrated for
quaternised poly(2-vinylpyridine) (Förster et al., 1990) that for polyelectrolyte solutions
without added salt the intensity correlation functions are unimodal at very low polyelectrolyte
concentrations and bimodal at the higher ones.
For polyelectrolyte solutions containing an abundant amount of salt, the apparent cooperative
diffusion coefficients (Dapp) determined from the correlation functions are discussed in analogy
to those observed in solutions of uncharged macromolecules. In these systems, two
polyelectrolyte concentration regitimes can be separated. In the dilute regitime, in which the
polyelectrolyte coils are well separated and behave like independent entities, the cooperative
diffusion coefficient depends on the size of the individual coils. In the semi-dilute regitime, the
polyelectrolyte chains form a transient physical network and the cooperative diffusion
coefficient depends on the size of this network. Experimental evidence for this behaviour has
been given by (Koene et al., 1983 a, b, c) for solutions of poly(styrenesulphonate) (NaPSS)
and (Smits et al., 1993) for solutions of linear poly(ethyleneimine) chloride (LPEI). Due to
34
these difficulties, light-scattering techniques have seldom been employed to elucidate changes
in systems of polymers and surfactants. Dubin and co-workers (Dubin et al. 1988, 1990) have
described light-scattering measurements on a negatively charged surfactant in solution with a
neutral polymer, and on the complex formed between mixed micelles and an oppositely
charged polyelectrolyte. There is also an article by (Fundin et al., 1994) where
polymer/surfactant interactions in a system of sodium poly(styrenesulfonate) and CTAB are
studied by light-scattering measurements.
2. 5. 4. Small Angle X-ray Scattering (SAXS) and Small Angle Neutron Scattering (SANS)
Small angle scattering arising from inhomogeneities in the refractive index within a material
coherently scatter radiation in a forward direction. The intensity distribution as a function of
angle is dependent on the shape, the size, the concentration, and the smoothness of the
inhomogeneities. Small angle scattering data can be analysed directly by curve fitting and by
comparison to theoretical models. Small angle scattering is used to elucidate microstructural
information in amorphous non-heterogeneous materials on length scales ranging from a few
ångströms to a few micrometers.
2. 5. 4. 1. Basics of the theory of small angle scattering
We assume a plane monochromatic wave Aoexp(ikor) incident at the point scattering centre 0,
which generates a secondary spherical wave. Then, at some observation point, the resulting
wave is given by
Aoexp(ikor) + (Aob/r)exp(ikr) (26)
where ko and k are the incident and scattering wave vectors with *ko*= *k** = 2B/8, 8 denoting
the wavelength, Ao and (Aob/r) are the scattering amplitudes of the two waves, and r is the
vector which determines an observation point L corresponding to the scattering centre 0. The
stronger is the interaction between the incident wave and the point centre 0, the greater the
constant b. This quantity has the dimension of length and is called the “scattering length”, or
“the scattering amplitude”, of the centre. .
We consider the scattering of a plane monochromatic wave of X-rays or neutrons by a real

35
object consisting of an accumulation of nuclei and electrons - a group of point scatterers. The
scattering ability of the object can be characterised by the scattering density function n (r). In
the case of X-ray scattering, n (r) represents the distribution of the electric charge density,
while in neutron scattering this function represent the nuclear and spin density distribution.
The wave interacts with all the nuclei and electrons, which become the sources of secondary
waves. The superposition of these waves gives the first approximation to the scattering waves.
The use of the first approximation is appropriate for weakly scattering centres or fields only
(Landau and Lifshitz, 1985). The wave R(r) scattered by field n (r) is sought as a solution of
the wave equation. .
[)+ k02 +<n(r)]R(r) = 0 (27)
where k0 = *k0* represents the wave number for the incident wave in free space, ) is the
Laplace operator, and < is the parameter specifying the strength of the interaction with a
potential field. The solution of this equation is sought as power series in <. To the first
approximation and *r -r’* is very large compared the scattering area i.e. the case of Fraunhofer
diffraction the scattering vector is in the form
ψ ψν
πϕ( ) (1)( ) ( ) exp( )
exp( )( ' ) exp( ) '0
0 00 0
4r r A ik r
A ik rr
r isr dr+ = + ∫ (28)
where s = k - k 0 represents the scattering vector and *s* = (4B sin 2) / 8, 22 being the
scattering angle.
Comparison of Equations 26 and 28 shows that, for the potential field n (r), the function
f s r isr dr( ) ( ) exp( )= ∫νπ
ϕ4
(29)
plays the same role as that of factor b in the case of the point centre. Thus, f(s) is the amplitude
of elastic scattering by the field n (r). This expression is a first Born approximation, in other
words, the single-scattering approximation where it is assumed that there is no interaction
between separate particles. This expression represents a Fourier transform. Solution of the
36
inverse problem - calculation of n (r) using the known function f(s) - is given by inverse
Fourier transform
ϕπ ν
( ) ( ) exp( )r f r isr ds= −∫1
2 2 (30)
In an experiment we cannot measure the scattering amplitude, but only the flow of scattering
energy or the number of scattered particles, proportional to the square of scattering amplitude:
dWd
Ar
f sAr
I so
Ω= =
2
2
2 02
2( ) ( ) (31)
where S represents a solid angle. The function I(s) is scattering intensity (term used in X-ray
scattering) or scattering cross section (for neutron scattering). .
One significant feature of an object is the total scattering intensity (or total scattering cross
section), which is obtained by integrating Equation (31) over all the angles:
σ = ∫I sr
d( )
2Ω
Ω (32)
The main problem in the structure analysis of matter is the reconstruction of the scattering
density distribution according to the measured function I(s).
2. 5. 4. 2. Scattering by simple objects
The relationships for Fourier integrals are very useful when calculating scattering amplitudes
involving objects of simple shape:
Rectangular parallelepiped. For homogenous palallelepiped (scattering density n0) with
edges a, b and c we can write:
ϕ ϕ ϕ( ) ( , , ) ( , ) ( , ) ( , )r x y z x a y b z c= = 0Π Π Π (33)
37
where function A is a Fourier image. The scattering amplitude is the given by
f q V a X b X c Z( ) ( , ) ( , ) ( , )= ϕ δ δ δ0 (34)
where V=abc represent the parallelepiped volume and *(u,v)=sin(Buv)/Buv. This general
relationship relates the linear characteristics of real and reciprocal spaces and represents the
general definition of the resolution limits of any diffraction experiment. If a, b, c 6 4 we
obtain:
f q X Y Z∞ =( ) ( ) ( ) ( )ϕ δ δ δ (35)
i.e., the whole scattering is concentrated at point q=0. Thus, the scattering intensity of a
parallelepiped is given by the relationship
I q V a X b Y c Z( ) ( , ) ( , ) ( , )= ϕ δ δ δ02 2 2 2 2 (36)
Homogenous thin plate. This case is obtained from previous one when c 6 0. Thus, if S = ab
(the area of plate) and a, b 6 4 (infinitely thin plate) one obtains
f q X Yo( ) ( ) ( )→ ϕ δ δ (37)
i.e. scattering amplitude differs from zero only along the straight line X=0, Y=0.
Homogenous thin rod. This object is also a particular case of homogenous parallelepiped when
a, b 6 0, so
ϕ ϕ δ δ( ) ( ) ( ) ( , )r x y z c= 0 Π (38)
f q c c Z( ) ( , )= ϕ δ0 (39)
if c 6 4 (infinitely long rod)
f q Z( ) ( )= ϕ δ0 (40)

38
i.e. the whole scattering is concentrated in the plane Z=0.
Spherically symmetric body. When n(r) = n(r) (r=*r*), then using spherical coordinates one
may write
f s rsr
srr dr( ) ( )
sin( )=
∞
∫40
2π ϕ (41)
where we recall that s=2Bq=4Bsin2/8. It is clear that for spherically symmetric bodies, the
scattering patterns also have spherical symmetry. For scattering by a homogeneous solid
sphere
ϕ ( ) ( ) , ; ,r r R r R r R= − = ≤ >Π 1 0 (42)
and one may obtain the following important relationship by direct calculation:
f s sR sR sR sR sR( ) ( ) [sin( ) cos( )] ( )= − =−3 3 θ (43)
where f(0)=1 (normalised scattering amplitude).
There are several good textbooks published on the theory of SAXS and SANS where the
theory is discussed in more detail (Glatter and Kratky, 1992, Brumberger, 1995, Feigin and
Svergun, 1987).
2. 5. 4. 3. Structure analyses of ionic micelles with SANS
Charged micelles can be modelled as a population of particles that interact through a screened
Coulomb potential. For a population of slightly anisotropic or polydispersed particles of
number density n, the differential cross sections of neutron scattering per unit volume,
dG(q)/dS, can be written as (Feigin and Svergun, 1987)
[ ] d qd
n P q S q P q P qΣ
Ω
( )( ) ( ) ( ) ( )= < > + < > − < >2 2 2 (44)
39
where the scattering vector q is defined by
q =4π θ
λ
sin (45)
and 22 is the scattering angle and 8 is the wavelength. The form factor P2(q), which expresses
the scattering cross-section of a single spherical particle of radius r, is
P q r iqr dvs( ) ( ( ) ) exp( )= −∫ ρ ρ (46)
D(r) is the scattering length density of the particle and Ds is the scattering length density of the
solvent. The structure factor S(q) is given by
[ ]S qV
g r iqr dv( ) ( ) exp( )= + −∫11
1 (47)
where g(r) is the interparticle correlation function and V is the volume of solution per particle.
The micelles are assumed to be monodisperse, spherical or prolate, core-and-shell ellipsoids of
volume V2 with semiaxes a, b, b (a/b=(). The volume of the core, which consists of
hydrocarbon chains, is V1 and its scattering length density is D1. The volume of the shell, which
contains the polar head groups, is V2 - V1 and its scattering length density is D2. Then the single
particle scattering function is given by:
P q V F q R V F q R ds s( ) [ ( ) ( , ) ( ) ( , )]sin/
= − + −∫ 1 1 1 2 2 20
2
ρ ρ ρ ρ β βπ
(48)
where
F q RX X X
X( , )
sin cos=
−3 3 (49)
with
X qR= +sin cos2 2 2β γ β (50)

40
Let the mean aggregation number of micelles to be Na. The mean volume of the core, V1, can
then be calculated from molecular group volumes. For sodium alkanoate micelles for example:
[ ]V N CH n CHa1 3 21= + < > −ν ν( ) ( ) ( (51)
while the volume of the shell, V2, is given by
[ ] V V N COO D O Na D Oa HG Na2 1 2 21− = + + − +− +ν ϖ ν α ν ϖ ν( ) ( ) ( ) ( ) ( (52)
where
- <n> is the average number of carbon atoms in the hydrocarbon chains of the micelle
- <(CH2), <(CH3), <(COO-) are the volumes of, respectively, methylene, methyl and head
groups in the surfactant
- <(Na+) and <(D2O) are the volumes of sodium ions and solvent molecules bound to the
surfactant
- jHG and jNa are the hydration numbers of the head groups and of the sodium ion,
respectively
- " is the degree of dissociation of the surfactant molecules in micelle
The second term of Equation (44) can be calculated using the decoupling approximation of
(Kotlarchyk and Chen, 1983), i.e. it is assumed that there is no correlation between inter-
particle separation and particle size, and no correlation between inter-particle distances and
particle orientation. This assumption is reasonable for dilute solutions of charged micelles if (
is not much bigger than one. The rescaled mean spherical approximation (RMSA) by (Hansen
and Hayter, 1982) can be used to calculate the structure factor for dilute dispersions of
charged colloidal particles:
S qG q R ZHS HS eff
( )( , , , )
=−
11 24η η
(53)
41
where 0 is volume fraction of particles. The exact expression of G(q, RHS, 0HS, Zeff) the
function of effective hard sphere radius, hard sphere volume fraction and effective charge can
be found in (Hayter and Penfold, 1981) and (Hansen and Hayter, 1982).
If the interparticle interactions are assumed to be due to interactions between the diffuse
double layer surrounding the micelles, then the interaction potential at distance r from the
centre of a spherical micelle of mean diameter <d> is given by
V rd r d
r( )
exp[ ( )]=
− − < >πεε ψ κ02
02
(54)
where R0 is the surface potential, g0 is the permeability of vacuum, g is the dielectric constant
of the solution between micelles, 6 is the Debye-Hückel inverse screening length, determined
by the ionic strength of the solution. The surface potential is related to the charge, z, on the
micelle, to a good approximation by (Verwey and Overbeek, 1948).
ψπεε κ0
0 2=
< > + < >z
d d( ) (55)
The average diameter, aggregation number (Na), axial ratio ((), average number of charges (e0)
and degree of dissociation (") of the micelles can be obtained by fitting procedure.
2. 5. 4. 4. Determination of molecular structure of liquid crystals by SAXS
The method is based directly on analysing the diffraction patterns. Braggs condition says that
n8 = 2dsin2 (56)
where 8 is the wave length of X-ray source, d is the layer spacing, 2 is the scattering angle and
n is an integer. The scattering vector, q, can determined as
q = d-1 = 2sin2 / 8 (57)
42
In the small angle X-ray measurements the scattering intensity is measured as a function of
scattering vector, q. The structure of periodic continuous well-ordered structure normally has 2
to 3 diffraction peaks. These can be used to determine the structure. When the three diffraction
maxima associated with the spacing of structure are d1, d2 and d3, the ratio between the maxima
d1/d2/d3 shows the ordering: 1 / 2 / 4 lamellar, 1 / %3 / %4 hexagonal, %4 / %5 / %8 cubic etc.
(Hahn, 1985).
Thus, the structure of liquid crystalline mesophases can be easily determined from the
characteristic spacing ratios of the diffraction peaks. The lattice parameter a, the micelle radius
r, the micellar separation h, and the surface area per surfactant ion A can be calculated from the
values of spacing q1, volume fraction of the surfactant ions Ns, the mass per surfactant ion M,
and its density D. For example, in the case of hexagonal mesophase of surfactant
aq
= ( )( )2
3
2
1
π (58)
R a s= [ ] /φπ3
21 2 (59)
AM
R=
2ρ
(60)
h a R= − 2 (61)
Possible difficulties in determining of structure parameters arise from the second and higher
order reflections.
3. EXPERIMENTAL
3.1. Materials
3.1.1. Cationic starch

43
Starch is a polymeric carbohydrate consisting of anhydroglucose units linked together primary
through "-D-(164) glucosidic bonds. Starch is a heterogeneous material consisting, at the
extremes, of two major types of polymers - amylose and amylopectin.
Amylose is essentially linear polymer in which the anhydroglucose units are predominantly
linked through "-D-(164) glucosidic bonds. It may contain about 200 to 2 000 anhydroglucose
units.
Amylopectin is a branched polymer containing, in addition to anhydroglucose units linked
together as in amylose through "-D-(164) glucosidic bonds, periodic branches at the carbon-6
position. Each branch contains about 20 to 30 anhydroglucose units. A schematic diagram is
shown in Figure 9. Light-scattering measurements indicate molecular weights in the millions.
Depending on botanic source of the starch the amylopectin/amylose ratio can vary from 1 to
near 0.3. Potato starch, which was used in this work, contains about 79% amylopectin and 21%
amylose.
Figure 9. A schematic diagram of the structure of amylopectin, where monoglucose units are
linked together via 1,4-"-glycisidic bindings.
The starch, used in these studies, was a quaternary substituated (2-hydroxy-3-
trimethylammoniumpropyl starch) (Fig.10 and Fig. 11) delivered from Raisio Chemicals,
Raisio, Finland. The potato starch was oxidised by sodium hypoclorite before cationisation,
thus it was depolymerised to a considerably degree and so it was not possible to separate the
amylose and amylopectin fractions in the GPC chromatograms.

44
Figure 10. Quaternary ammonium-group as cationic substituent at cationic starch.
Figure 11. A rod model of helix-like structure of cationic amylose molecule. Green sticks represent the carbon-carbon bindings, the red ones the bindings including oxygen, and the blue ones the quaternary ammonium - carbon bindings in cationic group.
3.1.2. Surfactants
Surfactants were sodium dodecyl sulphate (SDS) and different alkanoates with hydrocarbon
chain length from C8 to C22:1. The alkanoates were potassium octanoate, C7H15COOK, (KOct)
CH2CHCH2N(CH3)Cl
OH
Starch O +
45
and dodecanoate, C11H23COOK, (KDod), sodium octanoate, C7H15COONa, (NaOct),
decanoate, C9H19COONa (NaDe), dodecanoate C11H23COONa (NaDod), palmitate (sodium
hexadecanoate), C15H31COONa, (NaPal), oleate (sodium cis-9-octadecenoate),
C9H18=C8H15COONa, (NaOl) and erucate (sodium cis-13-docosenoate), C9H18=C12H23COONa,
(NaEr).
Sodium dodecyl sulphate (SDS) was analytical grade from Fluka Ag. The surface tension of
solutions prepared from the sample as delivered showed a minimum at concentrations just
below the cmc, indicating that a trace amount of alcoholic impurities was present in the sample.
The sample was therefore recrystallised 3 times from ethanol. This procedure removed the
impurities causing the minimum. All the alkanoates and alkenoates were synthesized by
neutralising the corresponding solution of carboxylic acid (Fluga Ag, purum) in ethanol (20 %
solution) with alkyl hydroxide. The soap was recrystallised 3 times from acetone.
The deuterated surfactants were synthesized in the same way as the protonated surfactants from
deuterated carboxylic acids (C7D15COOH; 98% D, C9D19COOH; 98% D and C15D31COOH;
98%D). The deuterated acids were neutralised with NaOD in C2H5OD. All deuterated
chemicals were from Medical Isotopes Inc., USA. The purity of all surfactants was verified by
measurements of surface tensions. The critical micellisation concentrations (cmc) of the
surfactants (SDS: 8.25 mmol dm-3; KOct: 345.0 mmol dm-3; KDod: 16.0 mmol dm -3, NaOct:
398.0 mmol dm-3, NaDe: 110.0 mmol dm-3, NaDod: 27.0 mmol dm-3, NaPal: 1.62 mmol dm-3,
NaOl: 0.90 mmol dm-3 and NaEr: 0.07 mmol dm-3 determined from the surface tensions are in
good agreement with those reported in literature (Mukerjee and Mysels, 1971).
3.2. Methods
3.2.1. Surface tension measurements
Surface tension measurements were performed using a ring tensiometer (KSV Instruments
Sigma 70). This instrument is computer controlled and makes it possible to make several
measurements on the same sample automatically by lowering and rising the vessel containing
the solution, thereby passing the ring repeatedly through the weight maximum. The correction
factors calculated by (Huh and Mason, 1975) were used to calculate surface tensions. All
46
measurements were performed at 25o C. All solutions were prepared at least 24 h before
measurements. The solubility of starch was ensured by heating the starch solution in an
autoclave for 30 min at 120o C. In order to avoid the formation of very surface-active acid/soap
complexes, the alkanoate solutions were made slightly alkaline before measurements (pH =
10.5) by adding sodium or potassium hydroxide. All the vessels were cleaned using aqua regia,
ion-exchanged water and distilled water. The ring and the measuring vessel were treated with a
gas flame after measurements. The samples were allowed to stabilize 30 min in the measuring
vessel before measurement. In spite of these precautions, the reproducibility between
measurements on the same sample was only of the order ± 0.5 mNm-1. This uncertainly is at
least partly due to the adsorption of starch on the ring and the ring becoming hydrophobic due
to adsorption of surfactants. These problems are well known weaknesses of the ring method.
The reproducibility between measurements on different samples was about ± 1.0 mNm-1. This
uncertainly is obviously due to the very low concentrations of starch used (0.001 - 0.1 weight
%).
3.2.2. Viscosity measurements
Viscosities were determined with an Ubbelohde capillary viscometer system (Schott-Geräte,
AVS 350). This instrument is computer controlled and makes it possible to take several
measurements on the same sample automatically by repeating filling of the capillary followed
by recording of the flow time. The correction factors of Hagenbach were used to calculate the
real efflux times. The viscometer was immersed in a bath thermostat to (298.15 ± 0.01) K. All
solutions were prepared at least 24 h before measurements were made. The solubility of starch
was ensured by heating the starch solutions in an autoclave for 30 min at 120o C. All starch
samples were also filtered through a 3.0 :m pore size membrane to remove dust and other
macroscopic impurities. The viscosimeter was cleaned using aqua regia, ion-exchanged water
and distilled water. The samples were allowed to equilibrate 10 min in the thermostat set before
measuring. The reproducibility between measurements of efflux times on the same sample was
normally of the order ± 0.01 s. The only difficulties were found at certain surfactant/CS ratios
when the aggregates formed very mobile flocs, which tended to stick in the capillary. Another
problem, which occurred at some surfactant concentrations, was the formation of bubbles in the
samples. This could partly be avoided by draining the capillary fully between measurements.

47
The results of the viscosity measurements are presented as reduced viscosity values, calculated
from the efflux times (Equation 13)
3.2.3. Dynamic light scattering
A Coulter Instruments N4MD light-scattering instrument was used. The light source is a 4 mW
He-Ne laser operating at 632.8 nm. For detection fibre optics are used with the possibility of
using 6 different scattering angles (15.2 - 90o). The correlator-unit has 80 quasi logarithmically-
spaced channels, spanning a time scale of 3072 equivalent linearly-spaced channels. Samples
were prepared the same way as for viscosity measurements. To avoid dust, all starch samples
were also filtered trough a membrane with 3.0:m pore size. The temperature of the sample
chamber was adjusted to (298.15 ± 0.2) K. All measurements were performed at scattering
angle of 90o in order to minimize the scattering from macroscopical impurities. The particle size
distributions were calculated by Contin (Prowencer, 1982 and Ju et al. 1992) analysis program.
The reproducibility of the mean particle sizes was of the order ± 2 % and the particle size
distributions no better than ± 10 %.
The difficulties observed were due to the very high polydispersity of the samples, which makes
analysis of the scattering function very difficult. The starch particles also tend to aggregate,
resulting in the formation of particles with high scattering power. This combined with the fact
that using He-Ne laser, the lower range of the detection is about 3 nm, led to a situation in
which micelles were not detectable.
3.2.4. Electrophoretic mobility
Electrophoretic mobility (zeta potential) measurements were performed by Coulter Electronics,
DELSA 440, Doppler electrophoretic light-scattering analyser. This instrument makes
measurements at four angles simultaneously (7.5o, 15o, 22.5o and 30o). The system has four
separate detectors and four independent 256-channel analysers. The light source of this
instrument is a He-Ne laser operating at 632.8 nm. The measurements were performed at
constant ionic strength and the sample preparation was carried out in the same way as in the
viscosity and DLS measurements.

48
3.2.5. Phase equilibrium determination
Weighed amounts of starch solution, surfactant and distilled water were added to tightly
closed test tubes. The tubes were equilibrated by continuously turning over at a fixed
temperature for 7 days. The tubes were then centrifuged for 30 min at 1600g in order to
separate the solution and the complex phases. After centrifugation, the samples were again
allowed to equilibrate at the same temperature for 7 days. The gel and the solution phases were
separated by careful decantation of the solution. The viscosity of the solution was low, so that
separation in this way was relatively easy. The composition of the both phases was analysed by
determining the dry content of the complex phase by weighing and the amount of the nitrogen
by Kjeldahl analysis (Bradstreet, 1965). The amount of the surfactant was calculated as the
difference between the amount of starch and the total amount of dry matter in the samples.
The composition of the supernatant phase was analysed by determining the CS concentration by
ordinary spectrophotometric methods used commonly to determine the total carbohydrate
content. The amount of surfactant in the supernatant phase was determined by a standard gas
chromatographic method of carboxylic acid analysis. CS has Cl- as a counter ion and, the
surfactants Na+ or K+, thus there is also NaCl or KCl forming due to the association. The
electrolyte concentration of separate phases was not determined, but total salt content is, of
course, directly dependent on the amount of associated surfactant.
3.2.6. Rheology
A Bohlin VOR rheometer (Bohlin Reologi, Lund, Sweden) with cone-and-plate geometry was
used. The cone angle was 1o and the diameter of the cone was 30 mm. Steady-state
measurements were made of the shear stress (*) or viscosity (() of the sample as a function of
shear rate ((t) at 25o C. The level of the strain was adjusted so that all oscillatory
measurements were made within the linear viscoelastic regime. In dynamic measurement the
storage (G’), loss (G’‘) and complex moduli (G*) were measured as a function of oscillation
frequency. The samples were sealed with a layer of silicone oil to avoid evaporation of solvent
during the measurement.
3.2.7. Small angle X-ray scattering (SAXS)

49
Small angle X-ray scattering (SAXS) measurements were performed using Cu K" (8 = 1.542 Å)
radiation monochromatised with a Ni-filter and a totally reflecting glass block (Huber small-
angle chamber 701). The intensity curves were measured using a linear position sensitive
detector (Mbraun OED-50M). The fine focus (0.4 x 10 mm) X-ray tube is placed in a point-
focus position. The beam is reduced in the vertical direction with a 1mm slit in front of the
sample and a triangular slit in front of the detector. The k-range was from 0.03 Å-1 to 0.65 Å-1.
The instrumental broadening function has fwhm 0.01 Å-1 in the horizontal direction and 0.08 Å-
1 in the vertical direction. Thus, the geometry is considered as point-like and, apart from the
detector height and response profile, no further corrections are applied to the presented data.
The background scattering was measured separately and subtracted from the intensity curves.
A small amount (ca. 20 mg) of the complex phase was sealed in a steel ring between 13 :m
poly(imide) windows to prevent dehumidification and pressed against a hot plate (LINKAM
TP93 hot stage), which has a small aperture for X-ray beam.
3.2.8. Small angle neutron scattering (SANS)
Small-angle neutron scattering experiments were carried out with two instruments. The first
was the SANS1 instrument at the FRG1 research reactor of GKSS, Geesthacht, Germany
(Shuhrmann et al., 1995). The range of scattering vectors (0.008 < q < 0.25 Å-1) was covered by
three combinations of neutron wavelengths (8.5 Å) and sample-to-detector distances (0.7 - 7
m). The wavelength resolution was 10% (fwhm). Figure 12 shows a schematic picture of the
instrumental set-up of the instrument. .
Figure 12. A schematic view of the instrumental set-up at SANS-1 at FGR-1 research reactor,
GKSS.

50
The second SANS instrument was the "MURN" time-of-flight small-angle neutron scattering
spectrometer on the IBR-2 pulsed reactor at the Frank Laboratory of Neutron Physics, Joint
Institute for Nuclear Research, Dubna, Russia (Ostanevich, 1988). The scattering vector range
was 0.01 < q < 0.4 Å-1, the sample-to-detector distance was 6 m, and the neutron wavelength
interval was 0.7 - 5 Å. The intensities, which were recorded by a one-dimensional detector,
were corrected for background by subtracting the scattering of the solvent. Vanadium standard
was used for calibration. The samples were kept at 70±1 oC in quartz cells with a path length of
1.5 mm.
The raw spectra were corrected for backgrounds from the solvent, sample cell, and other
sources by conventional procedures (Cotton, 1991). The two-dimensional isotropic scattering
spectra were azimuthally averaged, converted to an absolute scale, and corrected for detector
efficiency by dividing by the incoherent scattering spectra of pure water (Wignall and Bates,
1986), which was measured with a 1-mm-path-length quartz cell.
The data analysis included smearing appropriate to the different instrumental set-ups. For each
instrumental setting, the scattering curves were smeared by the appropriate resolution function.
The calculated scattering intensity was fitted to the experimental results by means of least-
squares methods (Pedersen et al., 1990). The parameters in the models were optimized by
conventional least-squares analysis and the errors of parameter estimates were calculated by
conventional methods (Bevington, 1969).
3.3. Results and discussions
3.3.1 Critical association concentrations
3.3.1.1. Effect of the chain length of the surfactant
The cac-point (log cac) decreases with increasing chain length (Fig. 13). That is also seen as an
increase in the surfactant concentration, required to cause a drop in viscosity (Fig. II. 2) or a
decrease in the mean particle size of the starch (Fig. II. 8). The more favourable interaction
between surfactant and CS, as the surfactant chain increases, indicates, as in many other

51
systems, that the critical association involves cooperative interactions between hydrocarbon
chains. With Koct, neither the viscosity measurement, nor the particle sizes or surface tension
measurements indicate any marked interactions between CS and surfactant. Thus, it seems that
there is a minimum alkyl chain length of the surfactant required for the association to take
place. For surfactants shorter than this minimum, the formation of free micelles is energetically
preferred to those bound to CS.
Figure 13. Surface tensions of CS/surfactant - solutions with different chain lengths having surfactants: KDod (é), KOct (ê), NaOl (ñ) and SDS (ï). CS (N4) concentration was 0.01 w%. Cac - points are indicated with arrows. The two-phase area is indicated by dashed lines.
3.3.1.2. Effect of the charge density of the polymer
The difference in the degree of substitution of CS samples has a clear effect on the cac
determined by surface tension method (Fig. I. 2). The results are consistent with the notion that
electrostatic interaction between CS and the surfactant increases when the linear charge density
of the polymer increases. The charge density, i.e. the degree of the substitution of the CS, also
has a clear effect on the viscosity of the samples. The electrostatic repulsion between charged
segments increases the dimensions of the polymer molecules and leads more open
conformation, which is seen from the DLS data of very low concentrations of surfactant or
surfactant-free CS solutions (Fig. II. 8).

52
As the surfactant concentration increases, the viscosity drops. In Figure 14, it can be seen that
the lower the charge density, the lower is also the surfactant concentration that leads to a drop
in the viscosity. The cacs determined from surface tensions are clearly lower than the
concentrations at which the viscosity drops. Thus, this drop does not directly indicate the
critical association concentration, i.e. minimum surfactant concentration required for
polymer/surfactant interactions to take place. Actually, the viscosity of the solution is not a very
sensitive method for detecting this kind of phenomena. It shows only what is happening with
the CS particles, but is quite insensitive to the small molecule association. Thus, it seems
reasonable to assume that the association of surfactants takes place first by association as
counterions, which is seen on the surface tension curves (I). At somewhat higher surfactant
concentrations extensive cooperative association takes place between surfactant and polymer
molecules. A rapid drop in viscosity is expected when the association has reached an extent
required to cause intramolecular bridging by surfactant micelles.
Figure 14. Reduced viscosity of CS/SDS - solutions. CS having different of degrees of substitution: 0.097 (#), 0.415 (ï) and 0.772 (é). CS concentration was held constant at 0.01 w% and ionic strength (1.3 mM). The two-phase area is indicated by dashed lines.
The electrophoretic mobilities give exactly the same information as the viscosities. The net
charge of the particles begins to decrease at the same surfactant concentration as the viscosity
drops (II). The size distributions (Fig. II, 10a-d) show that aggregation first takes place
53
between small starch fragments and surfactant. When the charge of the CS/surfactant
aggregates is almost neutral, intermolecular binding takes place and phase separation occurs.
3.3.1.3. Effect of the polyelectrolyte concentration
The polymer concentration has a large effect on the viscosity of polyelectrolyte solutions. The
counterion concentration is an important parameter affecting the repulsion between charged
segments on the polymer and, accordingly, the conformation of the polyelectrolyte and the
viscosity of the polyelectrolyte solutions. Normally, the viscosity of polymer solution decreases
when solution is diluted, but with polyelectrolytes, the situation is quite complex, because
diluting the solution leads also to decreasing counterion concentration. The lower counterion
concentration results in a more open polyelectrolyte conformation, thus increasing viscosity.
However, as seen in Figure II, 4 the viscosity drops down at lower surfactant (SDS)
concentrations the lower is the CS concentration. This stresses the importance of charge
neutralization for the interactions and, above all, for the phase behaviour of CS/surfactant
systems.
From surface tension measurements, it can be seen that the effect of the polymer concentration
on the cac appears to be very small. The main effect is the same as that of increasing the ionic
strength of the solution by adding a corresponding amount of simple electrolyte (I).
3.3.1.4. Effect of electrolyte concentrations
Adding a simple electrolyte to the solution has three effects. The main effect is screening of the
electrostatic interaction between the polymer and the surfactant. Salt also affects the micelle
formation because it screens the electrostatic repulsion between negative-charged head groups
of the surfactant molecules, thus favouring the micelle formation. As already pointed out, the
conformation of the polyelectrolyte salt is strongly affected because the repulsion between the
charged units is screened. Hence, normally, in dilute concentrations adding salt increases cac a
little, but at higher concentrations, the effect favouring micellisation dominates. At higher
concentrations, adding salt also reduces the association and redissolution.

54
From Figure 15, where different amounts of salt (KCl) are added to CS/KDod - system, it can
be observed that the association between surfactant micelles and CS coils takes place at lower
concentrations when more salt is added.
Figure 15. Surface tensions of 0.01 w% CS/SDS solutions at different concentrations of added simple electrolyte (KCl). No salt (ñ), 0.001 M (ï), 0.01 M (é) and 0.1 M (ê). The DS of CS was 0.772. The two-phase area is indicated by dashed lines.
The same effect is also seen in the viscosity curves (II, 7a and b). The other effect that is
detectable, is that the difference between cac and intermolecular association (formation of gel-
like complex) increases with increasing electrolyte concentration (II) so also does the difference
between cac and cmc.
3.3.2. Phase separation and redissolution
Phase separation is a general feature of systems of a polyelectrolyte and oppositely charged
surfactant. Surfactant binding to an oppositely charged polyelectrolyte leads to reduction of the
charge and hydrophilicity of the complex. Hence, phase separation is expected. The phase
separation can be visually observed because the solution becomes turbid after a certain amount
surfactant is added. However, the two-phase area can also be detected very sensitively in
surface tension measurements, as a jump in the surface tension curve. The jump occurs because
measurements are made on systems where the polyelectrolyte concentration is constant and
surfactant is added; thus the investigation line crosses the tie-lines in the two-phase area so that

55
the chemical potential of the components in the equilibrium phases changes as the total
surfactant concentration increases. Because the surfactant is strongly bound to the
polyelectrolyte, the chemical potential of the surfactant on the "surfactant-rich" side of the two-
phase area is lower than on the "CS-rich" side. Thus, the surfactant concentration at air/water
interface decreases and surface tension increases. As excess surfactant is added, the surface
tension decreases until it reaches the value that is characteristic for the pure surfactant solution
above micellisation concentration (I).
It has been well proven by (Lindman et al., 1992) that phase separation is due to the
aggregation of surfactant micelles and polymer coils. The results from CS/surfactant systems
show that phase separation does not occur at the theoretical charge neutralisation point.
Actually, it takes place when an excess of surfactant has been added and also well below the
cmc of pure surfactant. When the viscosity of the solution decreases, the association between
the polymer and surfactant takes place, so that the CS molecules loop around the surfactant
micelles. This is clearly observed from all viscosity curves.
The viscosity rise at onset of gelation is not as big as is typical for EHEC (de Gennes, 1990, and
Karlström et al., 1990) and other hydrophobic polymers (Magny et al., 1994 and Effing et al.,
1994). When the gel-like complex phase is formed, because there are no hydrophobic segments
on CS there is essentially no strong intermolecular network formed when the surfactant binds to
the polymer. The binding is primary intramolecular. When the complex is almost neutral the
complex phase forms by intermolecular association of polymer/surfactant complex.
The complex phase has very high viscosity indicating the interactions to be strong. It has also
such a high degree of hydrophobia that it does not stay in the solution but separates rapidly and
completely so that the viscosity of the solution drops to a minimum.
The polymer charge density has a significant effect on the phase separation. The higher the
degree of substitution of CS, the higher surfactant concentration is required to cause phase
separation. Also, a certain minimum charge density on the CS is required for phase separation
or other detectable interaction between polymer and surfactant to occur. With CS, sample N1,
DS=0.0014, no phase separation or other interactions were observed.

56
The polymer concentration has the same kind of effect. The lower the polymer concentration,
the less surfactant is needed to separate out the complex phase. Phase separation occurs clearly
even in CS solution as dilute as 0.001 w%. At high CS concentrations, phase separation occurs
but it is no longer easy to detect it from surface tension curve (I). Thus, it can be assumed that
both charge neutralisation and hydrocarbon chain length plays important roles in phase
separation phenomena.
Increasing the surfactant chain length decreases the phase separation concentration i.e. the
occurrence of phase separation runs parallel to the cac and is clearly related to cooperative
interactions between the hydrocarbon chains of the surfactant. Thus, a certain minimum alkyl
chain length of the surfactant is needed for the interaction. In accordance with these notions, the
binding with KOct is very weak. The reason is that at the cmc of short chain surfactant is high
(KOct: 450 mM). This implies that at the cmc the total ionic strength of the solution is high so
that, because of the weakened polycation/surfactant interactions, it is energetically more
favourable to form pure surfactant micelles than polymer bound ones.
The electrolyte concentration does not affect the phase separation as markedly as in many
systems of anionic polyelectrolyte and cationic surfactants (Hayakawa et al., 1983 a, b and
Thalberg et al. 1991 e). Increased electrolyte concentration has a common effect in screening
all electrostatic interactions. The lower boundary of phase separation decreases a little when a
small amount (1 - 10 mM) electrolyte is added. Higher added electrolyte concentrations (0.1
M), when added, clearly decrease the size of the two-phase area in the surface tension curve,
but phase separation still occurs (Fig. 15 b). Thus, the interactions between CS and anionic
surfactants appear to be stronger than they are in most systems of oppositely charged
polyelectrolytes and surfactants. It can also be assumed that the nature of the interactions is
highly cooperative due to hydrophobic interactions between alkyl chains.
3.3.2.1. Dissolution of CS-surfactant precipitates
It is commonly assumed that the dissolution of polyelectrolyte/surfactant complexes may take
place by two different mechanisms. One is that redissolution results from decreased binding of
the surfactant. Normally, a surfactant concentration much higher than cmc is needed if
redissolution is to take place by that mechanism. Another mechanism is that the increase of

57
surfactant binding to such an extent that the complexes become net negatively charged, as has
been reported, for example, by (Goddard and Hannan, 1976) for cationic cellulose JR400. The
electrophoretic mobility of CS/surfactant aggregates was measured. The results (Fig. 16)
unambiguously show that the charge of the complexes becomes negative when sufficient
amount surfactant is added; at the same time redissolution takes place.
Figure 16. Electrophoretic mobility of CS/SDS particles at 298.15 K. CS (DS=0.772) concentration was 0.01 w%.
Another fact that speaks in favour of the charge reversal mechanism is the concentration at
which redissolution takes place. At low CS concentrations, it always takes place when the
surfactant concentration - the cmc of the pure surfactant. In the redissolution the biggest
aggregates break apart, but the smallest starch fragments are left in the form of aggregates as is
seen in Fig. II. 10 d. If much more surfactant than required for redissolution is added, some
reaggregation takes place (II).
The charge density has some effect on the redissolution. With the highly substituted CS
(DS=0.772), the redissolution is no longer complete. This is also a well-known behaviour of
systems redissolving by charge reversal mechanism (Goddard and Hannan, 1977).
3.3.3. Phase diagrams
Three-component phase diagrams were determined for systems SDS/CS/water, KDod/CS/water
and NaOl/CS/water. The effect of adding electrolyte to these systems was also investigated.
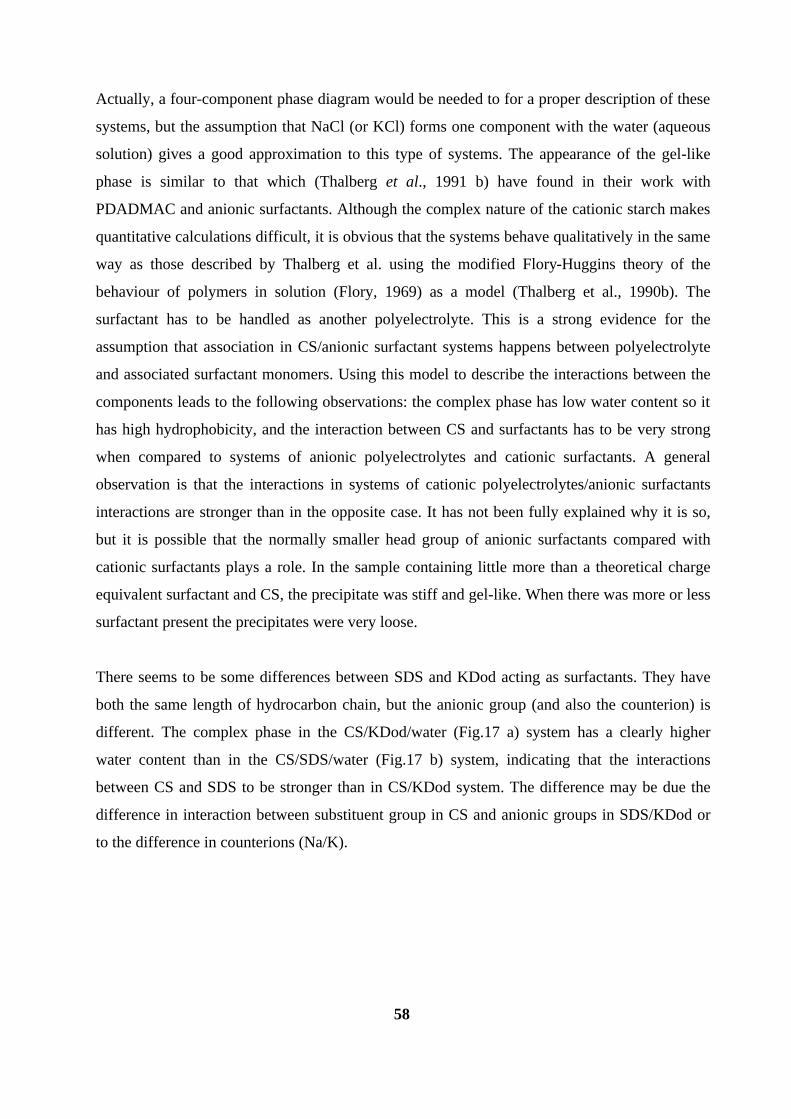
58
Actually, a four-component phase diagram would be needed to for a proper description of these
systems, but the assumption that NaCl (or KCl) forms one component with the water (aqueous
solution) gives a good approximation to this type of systems. The appearance of the gel-like
phase is similar to that which (Thalberg et al., 1991 b) have found in their work with
PDADMAC and anionic surfactants. Although the complex nature of the cationic starch makes
quantitative calculations difficult, it is obvious that the systems behave qualitatively in the same
way as those described by Thalberg et al. using the modified Flory-Huggins theory of the
behaviour of polymers in solution (Flory, 1969) as a model (Thalberg et al., 1990b). The
surfactant has to be handled as another polyelectrolyte. This is a strong evidence for the
assumption that association in CS/anionic surfactant systems happens between polyelectrolyte
and associated surfactant monomers. Using this model to describe the interactions between the
components leads to the following observations: the complex phase has low water content so it
has high hydrophobicity, and the interaction between CS and surfactants has to be very strong
when compared to systems of anionic polyelectrolytes and cationic surfactants. A general
observation is that the interactions in systems of cationic polyelectrolytes/anionic surfactants
interactions are stronger than in the opposite case. It has not been fully explained why it is so,
but it is possible that the normally smaller head group of anionic surfactants compared with
cationic surfactants plays a role. In the sample containing little more than a theoretical charge
equivalent surfactant and CS, the precipitate was stiff and gel-like. When there was more or less
surfactant present the precipitates were very loose.
There seems to be some differences between SDS and KDod acting as surfactants. They have
both the same length of hydrocarbon chain, but the anionic group (and also the counterion) is
different. The complex phase in the CS/KDod/water (Fig.17 a) system has a clearly higher
water content than in the CS/SDS/water (Fig.17 b) system, indicating that the interactions
between CS and SDS to be stronger than in CS/KDod system. The difference may be due the
difference in interaction between substituent group in CS and anionic groups in SDS/KDod or
to the difference in counterions (Na/K).
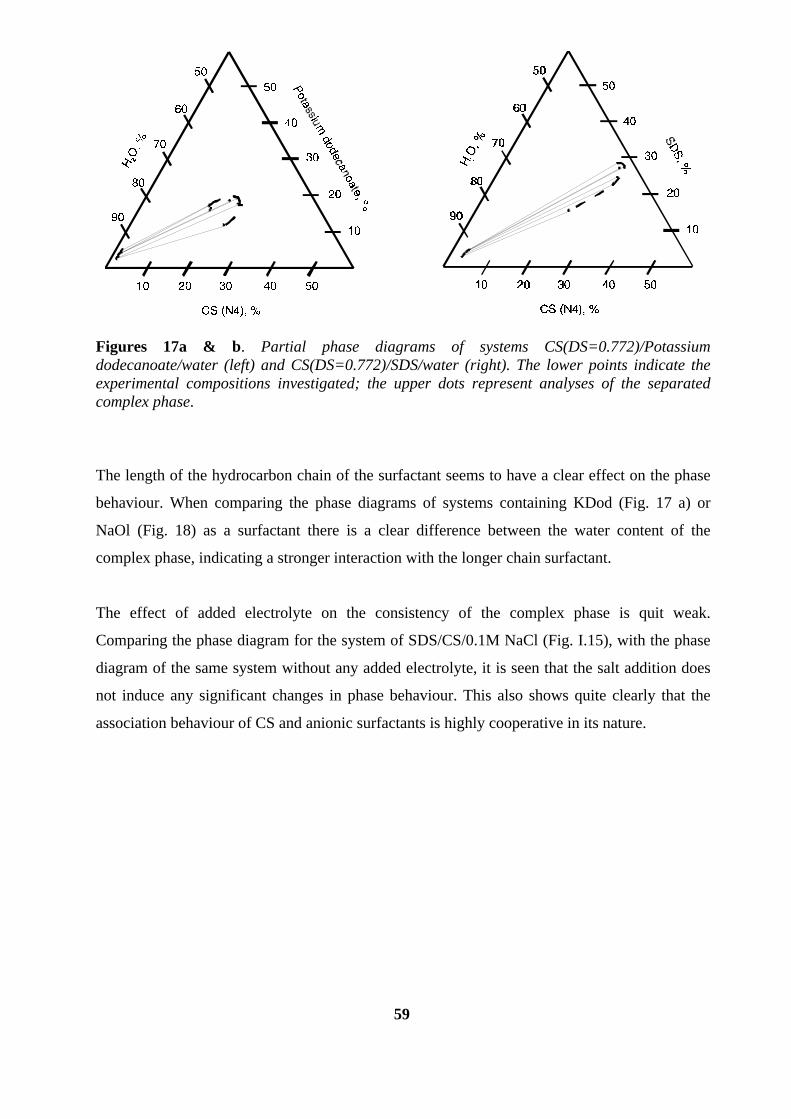
59
Figures 17a & b. Partial phase diagrams of systems CS(DS=0.772)/Potassium dodecanoate/water (left) and CS(DS=0.772)/SDS/water (right). The lower points indicate the experimental compositions investigated; the upper dots represent analyses of the separated complex phase.
The length of the hydrocarbon chain of the surfactant seems to have a clear effect on the phase
behaviour. When comparing the phase diagrams of systems containing KDod (Fig. 17 a) or
NaOl (Fig. 18) as a surfactant there is a clear difference between the water content of the
complex phase, indicating a stronger interaction with the longer chain surfactant.
The effect of added electrolyte on the consistency of the complex phase is quit weak.
Comparing the phase diagram for the system of SDS/CS/0.1M NaCl (Fig. I.15), with the phase
diagram of the same system without any added electrolyte, it is seen that the salt addition does
not induce any significant changes in phase behaviour. This also shows quite clearly that the
association behaviour of CS and anionic surfactants is highly cooperative in its nature.
60
Figure 18. Partial phase diagram of the system CS (DS=0.772)/sodium oleate/water at 25 "C. The lower points indicate the experimental compositions investigated; the upper dots represent analyses of separated complex phase.
3.3.4. Interactions between CS and mixed anionic surfactants
3.3.4.1. Micellisation in surfactant mixtures
Gibbs energy of formation of mixed micelles. In models of mixed micellisation (Holland and
Rubingh, 1992) the Gibbs energy of mixed micelle formation is discussed in terms of several
contributions (see page 6.)
In the simplest approach, it is assumed that the only contribution to the Gibbs energy of
micellisation from the mixing process is the entropy of mixing of the surfactant tails. This ideal
mixing model leads to a simple equation for the cmc of n different surfactants (Eq. 3) where
mixed cmc depends only on the cmcs and molar ratios of the surfactants because, in ideal mixed
micelles, the activity coefficient fi is unity. Although few micellar systems behave ideally, this
model is useful as a reference system in the description of reasons for non-idealities.
Synergism in mixing of different surfactants. Mixtures of different surfactant types often exhibit
synergism in the formation of micelles, i.e. deviations from ideal mixing result, in substantially

61
lower cmcs and interfacial tensions than would be expected based on the properties of the
unmixed surfactants alone.
The most commonly used models of non-ideal mixing are based on regular solution
approximation. This assumes that the excess Gibbs energy of mixing consists only of an
enthalpy term, while there are no excess entropy contributions. In this model, micellar mole
fractions of a binary surfactant mixture can be calculated by iterative solution provided by
expression (Eq. 5). The non-ideality is characterised by a net interaction parameter $, which is
related to the activity coefficient (Eq. 6 and 7). From the regular solution theory it follows that
in a binary surfactant system, $ can be calculated from the cmcs of the surfactant mixtures and
the cmcs of the pure components as presented in Eq. 8.
Mixing two surfactants with same ionic head group. For binary surfactant mixtures with the
same end group, a major contribution to the excess Gibbs energy of non-ideality of mixing will
be due to the volume difference between the hydrophobic tails of the two surfactants. In
addition to the effect on the entropy of mixing, which can be accounted for by replacing the
mole fractions by volume fractions, at any given aggregation number, the mean area per
molecule on the surface of the mixed micelle will be a non-linear function of the micelle
composition. Another source of non-ideality is that the ionic interactions at the micelle surface
will be modified. However, as a first approximation it can be assumed that the polar head group
interactions will not be markedly different from those in the single surfactant micelles as long
as the ionic strength is kept constant. The consequences of significant variation in the
hydrophobic chain length are interesting. (Shinoda, 1954) showed that in potassium
tetradecanoate/potassium octanoate mixtures the less hydrophobic potassium octanoate is
almost completely excluded from the micelles.
The results confirm that micelle formation in mixed sodium alkanoate systems is close to ideal.
Figure 19 shows the cmcs for NaOl/NaDe mixtures predicted by Equation (3). The system
shows only a slightly negatively deviation from the ideal mixing.

62
Figure 19. The cmc of sodium oleate (NaOl)/sodium decanoate (NaDe) aqueous solution as a function of mole fraction of the short-chain surfactant (NaDe). - - - - Ideal solution, (é)experimental results.
Figure IV. 9 shows the cmcs of the same NaOl/NaDe mixtures, but now the volume differences
of the hydrocarbon chains of the two surfactants has been taken into account by using
approximate volume fractions instead of mole fractions. The deviation from the theoretical
curve, considering the free volume differences, is positive. Thus, while the calculation slightly
overestimates the lowering effect of the longer-chain surfactant on the cmc, taking the volume
differences into account definitely improves the agreement between the theoretical and
experimental values.
Figure 20 shows the calculated values of the interaction parameter, $. The parameter, $ is
negative but quite small over the whole volume fraction range of NaDe. Thus, it can be asserted
that the chain volume differences between NaOl and NaDe are sufficient to almost completely
explain the deviations of the surfactant mixture in the micelles from ideality.

63
Figure 20. The unideal interaction parameter, $2, in NaOl/NaDe solutions as a function of the mole fraction of NaDe.
3. 3. 4. 2. Critical association concentrations
Association with cationic starch. It has been shown in articles I and II that the main interactions
controlling the CS/surfactant association are the hydrophobic interactions between the
hydrocarbon chains of the surfactant, and the electrostatic interactions between the cationic
starch and the anionic micelles. When another surfactant is added to the system the packing
conditions of the monomers in the micellar aggregates are changed. Changing the mean size of
the hydrophobic tail changes the balance between hydrophobic interactions and electrostatic
repulsion.
When the fraction of the less hydrophobic surfactant increases the cac also increases. This is
analogous to the behaviour of single surfactant/CS systems, in which the cac increases when
the surfactant chain length decreases. This association is reflected in the dependence of surface
tension and viscosity on surfactant concentration as a break point in the surface tension, and in a
sudden drop in the reduced viscosity.
In the CS/mixed surfactant systems, the cac markedly increases when the chain length of the
second surfactant decreases in the order NaDod < NaDe < NaOct (Figures IV. 4 and IV. 5). The
mean degree of hydrophobia of the surfactant mixture is the lower the shorter is the chain
64
length of the second surfactant and, in analogy with the formation of free mixed micelles,
micellisation on the polymer chains occurs at higher concentrations (table IV. 2).
Polymer/surfactant mixture interaction parameter. Polymer/surfactant association can be
described as a polymer induced micellisation. Thus, there is an obvious analogy between mixed
micelle formation in pure surfactant systems and the cooperative formation of surfactant
aggregates on the polymer in systems of surfactant mixtures and polymers. To illustrate this, we
assume that the electrostatic interactions are independent of micellar composition, and that
mixed micelle formation on the polycation is completely analogous to the formation of free
micelles, except that the presence of the polycation strongly reduces the repulsive electrostatic
interactions between the ionic end groups. Then a specific interaction parameter, $cac, can be
calculated for the mixed micelles associated with the polymer. In an analogy to the interaction
parameter for free mixed micelles, by substituting the cacs for the cmc in Eq. (8):
βα α
CACmix mixCAC x CAC
xCAC x CAC
x=
−=
−ln[ / ( )]( )
/ [( ) ]* * * *1 1 1
12
2 1 2
121
1 (62)
where CAC1* is the cac with surfactant 1, CAC2
* is the cac with surfactant 2 and CACMic* is the
cac in the surfactant mixture. The values of the specific interaction parameter, $cac, can be used
as a measure of the synergism in polymer/binary surfactant systems. Figure 21 shows $cac, as a
function of mole fraction of NaDe in CS/NaOl/NaDe system. There is no synergism observed in
polymer/surfactant association in the sense that there would be a maximum in the value of $cac
The interaction parameter is small and changes from negative to positive when the fraction of
the short-chain component increases. Thus, mixed micelle formation with the polymer also
seems to result in the formation of a remarkably ideal surfactant mixture in the micelles.

65
Figure 21. Calculated polymer/binary surfactant interaction parameter, $cac, as a function of the mole fraction of NaDe of the total surfactant concentration in CS (DS=0.80, C=0.01w%)/NaDe/NaOl system.
3.3.4.3. Phase separation and redissolution
Phase separation is a general feature of aqueous systems of a polyelectrolyte and an oppositely
charged surfactant. The binding of surfactant results in a complex with a lower charge and
which is less hydrophilic than the initial polymer. When the amounts of the polymer and
surfactant are roughly charge-equivalent, the complex precipitates as a water-rich gel. It is by
now well established that phase separation is due to the association of surfactant micelles (in
this case more precisely mixed micelles) with polymer coils. As is reported in article I, phase
separation takes place at surfactant concentration somewhat higher than the theoretical charge-
neutralization point but well below the cmc of the pure surfactant. When an excess of surfactant
is added the complex partly redissolves. The redissolution takes place trough a charge reversal
mechanism (Hayakawa et al., 1991).
Figures IV. 3-5 show that the higher the mole fraction of the short-chain component in the
surfactant mixture, the higher the concentration at which phase separation takes place. This is
not surprising, because when the concentration of short-chain surfactant increases, the fraction
of this surfactant in the micelles increases and, hence, their hydrophobicity decreases. As
expected, redissolution also takes place at higher concentrations when the fraction of the short-
chain surfactant increases.

66
At a given bulk composition, the chain length of the shorter surfactant does not affect the
surfactant/polymer ratio in the complex phase, but the maximum water content of the complex
increases strongly when the chain length of the shorter chain surfactant decreases (Figure 22).
This indicates reduced hydrophilicity of the complex. Redissolution of the complexes takes
place at somewhat lower surfactant concentrations when the chain length of the shorter
surfactant decreases.
Figure 22. Partial phase diagram of the system of CS (DS=0.80)/NaOl/second surfactant/water at 25o C. The surfactant mixtures are: NaOl; NaOl/NaDod; NaOl/NaDe and NaOl/NaOct. The molar ratio of the surfactants in mixtures is 1:1. Points A indicate the compositions prepared in experiments; points B gives analysed compositions of the complex phase and points C represent the compositions of the supernatant aqueous phase.
3. 3. 4. 4. Surfactant ratio in CS/mixed micelle complex phase
The molar ratio of the surfactants in mixed micelles depends on their chain length difference.
For a given bulk composition, free mixed micelles contain less short-chain surfactant, the larger
the chain length difference. The same behaviour is observed in the CS/surfactant complexes.
(Figure IV. 8). Thus, the fraction of NaDe in CS/NaOl+NaDe, when the molar ratio of
surfactant monomers is 1 to 1, is only about 0.003. In systems of CS/NaOl+NaDod where the
chain length difference of the surfactants is not so large, the corresponding fraction of the
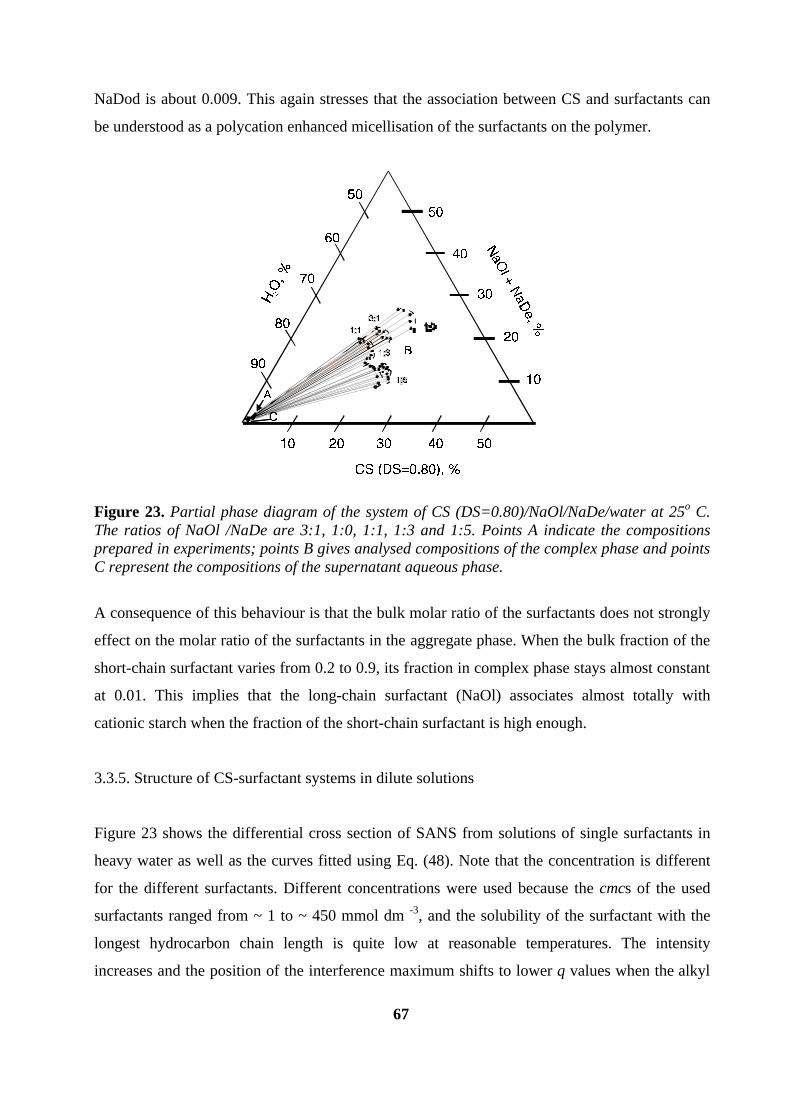
67
NaDod is about 0.009. This again stresses that the association between CS and surfactants can
be understood as a polycation enhanced micellisation of the surfactants on the polymer.
Figure 23. Partial phase diagram of the system of CS (DS=0.80)/NaOl/NaDe/water at 25o C. The ratios of NaOl /NaDe are 3:1, 1:0, 1:1, 1:3 and 1:5. Points A indicate the compositions prepared in experiments; points B gives analysed compositions of the complex phase and points C represent the compositions of the supernatant aqueous phase.
A consequence of this behaviour is that the bulk molar ratio of the surfactants does not strongly
effect on the molar ratio of the surfactants in the aggregate phase. When the bulk fraction of the
short-chain surfactant varies from 0.2 to 0.9, its fraction in complex phase stays almost constant
at 0.01. This implies that the long-chain surfactant (NaOl) associates almost totally with
cationic starch when the fraction of the short-chain surfactant is high enough.
3.3.5. Structure of CS-surfactant systems in dilute solutions
Figure 23 shows the differential cross section of SANS from solutions of single surfactants in
heavy water as well as the curves fitted using Eq. (48). Note that the concentration is different
for the different surfactants. Different concentrations were used because the cmcs of the used
surfactants ranged from ~ 1 to ~ 450 mmol dm -3, and the solubility of the surfactant with the
longest hydrocarbon chain length is quite low at reasonable temperatures. The intensity
increases and the position of the interference maximum shifts to lower q values when the alkyl

68
chain length increases. This shows that larger micelles are formed by surfactants with longer
alkyl chains, as is well known from earlier studies (Chevalier and Zemb, 1990). Agreement
between theoretical curves and experimental data is excellent, i.e. the model of micelles as
prolate rotational ellipsoids or spheres interacting through a screened Coulomb potential
satisfactorily describes the experimental data. The small deviation at the lowest q range is
probably due to the limitations of instrumental resolution.
Figure 23. The differential cross-section of SANS from solutions of single surfactants (non-deuterated) in heavy water as well as the curves fitted using Eq. (48 ). Surfactant concentrations: NaPal and NaDod, 100 mM; NaDe, 200 mM; NaOct, 600 mM. T = 343 K.
Parameters obtained by the fitting procedure are given in Table VI. 2. When the chain of the
surfactant becomes shorter, the average diameter of the micelles decreases from 71 ± 2 Å
(NaPal) to 31 ± 5 Å (NaOct) with simultaneous change in the micellar shape from prolate
ellipsoid with axis ratio 2.0 ± 0.2 (NaPal) to spherical (NaDe and NaOct). The degree of
dissociation increases in the order NaPal < NaDod < NaDe, which agrees with many other
observations of the dependence of α on chain length. The lower value of α for NaOct is
probably due to experimental inaccuracy.
3.3.5.1. Mixed micelles
0,01 0,10,1
1
NaPal(H) NaDod(H) NaOct(H) NaDe(H)
dΣ(q
)/dΩ
, cm
-1
q, A-1

69
Solutions of NaPal(H)/NaDod(H), NaPal(H)/NaDe(H) and NaPal(H)/NaOct(H) in heavy water
were investigated (molar ratio 1:1, (H) indicates hydrogen-based surfactants). The results were
compared to measurements on similar solutions of NaPal(D)/NaDod(H), NaPal(D)/NaDe(H)
and NaPal(D)/NaOct(H), where (D) denotes deuteration. The total surfactant concentration was
100 mM, which is above the cmc of pure NaPal and NaDod but below the cmc of NaDe and
NaOct. The results are shown in Figures 24a and b.
Figure 24.a. The differential cross section of SANS from solutions of 1:1 surfactant mixtures (non-deuterated) in heavy water as well as curves fitted using Eq. (53). Total surfactant concentrations 100 mM.
Marked formation of mixed micelles is detected only in the NaPal/NaDod system. Due to the
large difference in the scattering-length densities, the ratio of the scattering intensity from
NaPal(H) in D2O to the scattering from NaPal(D) in D2O is ~ 100. It is not possible to detect
pure NaPal(D) micelles in D2O by SANS. q at the interference maximum is equal for
NaPal(H)/NaDod(H) and NaPal(D)/NaDod(H), which indicates that the concentration of
micelles is the same in both solutions.
From the intensity ratio of NaPal(D)/NaDod(H) to NaPal(H)/NaDod(H) it can be estimated
(Holland and Rubingh, 1992) that the fraction of NaPal molecules in the mixed micelle is 0.49 ±
0.02. Thus, the composition of the mixed micelles is the same as the total composition of
surfactant in solution. This result confirms that at concentrations much higher than the cmc of a
surfactant mixture, the composition of the micelles is approximately the same as the total
composition of the surfactant in solution (Pedersen et al., 1990).
0,01 0,1
0,1
1
NaPal(H)/NaOct(H) NaPal(H)/NaDe(H) NaPal(H)/NaDod(H)
dΣ(q
)/dΩ
, cm
-1
q, A-1

70
Figure 24.b. The differential cross-section of SANS from solutions of 1:1 mixtures of deuterated NaPal and non-deuterated surfactants with shorter chains in heavy water as well as curves fitted using Eq. (53). Total surfactant concentrations 100 mM.
There is no sign of scattering in the curves for NaPal(D)/NaOct(H) and NaPal(D)/NaDe(H)
(Figure 24b). This indicates that in 100 mM NaPal/NaDe and 100 mM NaPal/NaOct only pure
NaPal micelles are formed. However, the size and interactions of the micelles are affected
different ways by NaDe and NaOct.
Addition of NaDe increases the effective micellar charge. The effect leads to significant
intermicellar interactions, as shown by the maximum in the scattering intensity. Thus, it seems
that NaDe is to some extent incorporated in the micelles. Presumably, because the total
concentration is below the cmc of pure NaDe, very small amounts of the surfactant will be
incorporated so that the micelles cannot be detected by SANS when the NaPal contrast is low.
In the model calculations (drawn lines in Fig. 24a) it was assumed that the micelles in
NaPal(H)/NaDe(H) and NaPal(H)/NaOct(H) contain only NaPal and that the NaPal/NaDod
ratio in the micelles is 1:1, i.e. the same as in bulk solution. The agreement between theoretical
curves and experimental data is as good as for single surfactant solutions. The dimensions of the
mixed NaPal(H)/NaDod(H) micelles in 1:1 solutions lie between those of pure NaPal and pure
NaDod (Table VI.3). The surface charge is closer to the charge of pure NaDod micelles. .
When the same fitting procedure was applied to the data for NaPal(D)/NaDod(H), Na turned out
to be about 10% smaller than for NaPal(H)/NaDod(H). The degree of dissociation is about the
same and the axial ratio is only 1.0. A possible explanation is that the NaPal and NaDod
0,01 0,10,1
0,2
0,3
0,4
0,5
NaPal(D)/NaDe(H) NaPal(D)/NaOct(H) NaPal(D)/NaDod(H)
dΣ(q
)/dΩ
, cm
-1
q, A-1

71
molecules are not evenly distributed in the prolate micelles. The radius of the cylindrical part of
the prolate micelle is clearly closer to the chain length of the NaDod than to that of NaPal. This
implies that the middle part of the micelle must be enriched in NaDod, with NaPal located close
to the end caps. Accordingly, SANS detects an aggregate with lower axial ratio in the
NaPal(D)/NaDod(H) system, where only NaDod contributes to the scattering. It is not quite
clear why this situation should be energetically favourable, as the mean radius of curvature is
smaller in end caps, and the bending energy of a mixed surfactant bilayer should be lower, the
higher the fraction of short-chain surfactant (Barneveld et al., 1992, 1994).
The results from fitting the theoretical curves to the results from NaPal(H)/NaDe(H) and
NaPal(H)/NaOct(H) solutions confirm that the effects of NaDe and NaOct on NaPal micelles
are different.
The micelles in the NaPal/NaOct solution are larger than the micelles in NaPal/NaDe or NaPal
solutions (Tables VI.2 and 3). The micelles consist almost entirely of NaPal because the
concentration of NaOct is far below its cmc, so that it should have little tendency to participate
in micelle formation. Thus, the effect of NaOct is mainly that of a simple electrolyte that
promotes micelle formation by better screening of electrostatic repulsion The result is that the
micelles formed by NaPal grow slightly, the degree of dissociation increases slightly,
intermicellar interactions decrease, and the interference maximum almost disappears.
The micellar aggregation number in 100 mM NaPal/NaDe is lower than in 100 mM pure NaPal,
while the degree of dissociation increases. The smaller size could be due to the lower
concentration of NaPal in the mixed system, but the higher charge and the fact that NaDe does
not affect micellar properties in the same way as NaOct indicate that NaDe does participate in
some way in micelle formation, although this cannot be directly detected by SANS. 50 mM
NaDe is much closer to its cmc than 50 mM NaOct, so this conclusion does not seem
unreasonable.
Figure 25 shows the dependence of the aggregation number of mixed NaPal/NaDod micelles on
the mean chain length of the surfactant at constant surfactant concentration (100 mM).
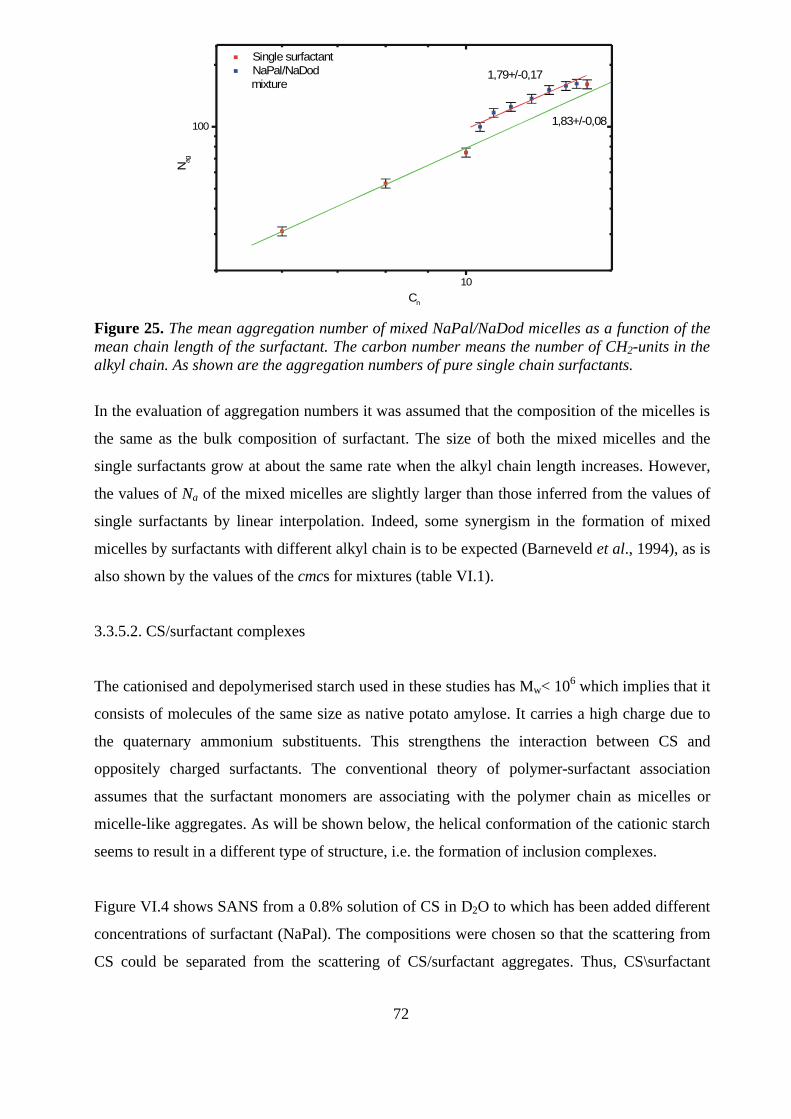
72
Figure 25. The mean aggregation number of mixed NaPal/NaDod micelles as a function of the mean chain length of the surfactant. The carbon number means the number of CH2-units in the alkyl chain. As shown are the aggregation numbers of pure single chain surfactants.
In the evaluation of aggregation numbers it was assumed that the composition of the micelles is
the same as the bulk composition of surfactant. The size of both the mixed micelles and the
single surfactants grow at about the same rate when the alkyl chain length increases. However,
the values of Na of the mixed micelles are slightly larger than those inferred from the values of
single surfactants by linear interpolation. Indeed, some synergism in the formation of mixed
micelles by surfactants with different alkyl chain is to be expected (Barneveld et al., 1994), as is
also shown by the values of the cmcs for mixtures (table VI.1).
3.3.5.2. CS/surfactant complexes
The cationised and depolymerised starch used in these studies has Mw< 106 which implies that it
consists of molecules of the same size as native potato amylose. It carries a high charge due to
the quaternary ammonium substituents. This strengthens the interaction between CS and
oppositely charged surfactants. The conventional theory of polymer-surfactant association
assumes that the surfactant monomers are associating with the polymer chain as micelles or
micelle-like aggregates. As will be shown below, the helical conformation of the cationic starch
seems to result in a different type of structure, i.e. the formation of inclusion complexes.
Figure VI.4 shows SANS from a 0.8% solution of CS in D2O to which has been added different
concentrations of surfactant (NaPal). The compositions were chosen so that the scattering from
CS could be separated from the scattering of CS/surfactant aggregates. Thus, CS\surfactant
10
100 1,83+/-0,08
1,79+/-0,17
Single surfactant NaPal/NaDod
mixture
Nag
Cn

73
aggregates should be seen with the combination CS/NaPal(H)/D2O while only CS should be
seen with the combination CS/surfactant(D)/D2O. NaPal was chosen because it forms the
largest micelles of the investigated surfactants.
The differential scattering intensities immediately indicate that two processes take place in the
system as the surfactant concentration increases: on the one hand the formation and growth of
CS/surfactant complexes and, on the other hand, changes in the conformation of CS. The
scattering at low values of q suggests that the overall size of the aggregates is larger compared
with the experimental interval of scattering vectors so that the scattering cross sections observed
are essentially due to intra-particle interactions. For this reason, and because the CS neutralizes
the charge of the surfactant aggregates, inter-particle interactions were neglected in the analysis
of scattering data.
In Figure VI.5 is shown differential SANS cross-sections for CS/NaPal(H),
CS/NaPal(H)/NaDod(H) and CS/NaDod(H) mixtures. The concentration of CS and the total
surfactant concentration is the same in all systems (0.8 % and 8 mM, respectively). The
surfactant concentration is much higher than the critical association concentration of CS/NaPal
(cac ~ 0.01 mM) so that significant amounts of CS/surfactant complexes should be present. The
scattering intensities indicate that the largest complexes occur in the CS/NaPal system and that
the difference between CS/NaPal and CS/NaPal/NaDod complexes is smaller than the
difference between CS/NaPal/NaDod and CS/NaDod complexes. Apparently, NaPal is enriched
in the complex phase formed by the NaPal/NaDod mixtures.
When interparticle interactions are neglected the differential scattering cross-section can be
written as
d q
d
d
dp q Binc
( ) ( )( )
∑ ∑= +
Ω Ω0
2 (63)
where dΣ(0)/dΩ is the scattering at “zero“ angle and Binc is the incoherent scattering
background. dΣ(0)/dΩ is related to the concentration of particles (Nv), volume (V) and the
scattering length densities by
74
d
dN Vv s
( )( )
0 2 2∑= < > −
Ωρ ρ (64)
where <ρ> is the average scattering length density of the particle. The slope of a log/log plot of
the differential cross-section vs. q is close to -1, which indicates that elongated structures are
formed. Therefore, in the analysis of experimental data, it is assumed that the aggregates are
cylindrical. In this case the single-particle scattering function P2(q) is equal to <F2(g)> where
F(q), the form factor of a cylinder is written as
F qqL J qRqL qR
d( )sin( / cos ) ( sin
( / cos )( sin )sin
/
=
∫
2 22
1
2
0
2 β ββ β
β βπ
(65)
where L is the length and R is the radius of the cylinder, J1 is the first-order Bessel function, and
β is the angle between the q vector and the axis of the cylinder.
Four parameters were varied in the fitting of theoretical differential cross-sections to
experimental results: R, L, dΣ(0)/dΩ and Binc. The model describes the experimental data for q
values larger than 0.01 Å-1. The deviations at lower q could be due to the presence of some
much larger particles (possibly some incompletely dissolved CS). Parameters obtained by the
fitting procedure are given in table VI. 4.
The first row in table VI.1 shows that pure CS in solution exhibits local cylindrical behaviour
(radius of cylinder 30 Å). Probably the pure CS solution contains cylinder-like aggregates in the
size-range investigated. The cylinder length is ~ 600 Å. In the q interval used it is difficult to
estimate this parameter more accurately, but this is a very reasonable value for starch with the
molecular weight of the CS, assuming that it has a helical conformation.
The radius of the cylindrical CS-surfactant aggregates decreases when the surfactant
concentration increases. This result is expected, because when surfactant associates with the CS,
the repulsion between cationic substituent-groups decreases so that the conformation of the CS
molecules becomes more compact. Hydrophobic interactions between the surfactant chains may
also contribute.
75
When deuterated surfactants are used (Figure VI.6), the intensities are only about a tenth of the
intensities, recorded for protonated surfactants. They fall in the same range as for cationic starch
without surfactant (Figures VI.2 and 4). However, the dependence of the scattering cross-
section on q-1 still indicates the formation of cylindrical aggregates. This confirms that fraction
of surfactants in the CS/surfactant complexes is high. The scattering of mixed
NaDod(D)/NaPal(D)/CS aggregates is lower than for pure NaDod(D)/CS or NaPal(D)/CS. The
reason for this is not clear; it may be an experimental artefact.
In the analysis of surfactant systems, the length of cylinder was kept constant and only its radius
was adjusted. The cylinder radius of deuterated complexes is larger than the radius obtained for
fully protonated complexes. This suggests that the surfactant molecules are inside the
CS/surfactant complexes with the CS molecules forming some kind of shell around the
surfactant aggregates. Due to the low intensity of scattering from CS, the contribution of CS
shell scattering is less visible in CS/NaPal(H), CS/NaDod(H) and CS/NaPal(H)/NaDod(H)
mixtures.
The application of a homogeneous model (homogeneous cylinder) gives different “effective
radii” - smaller for mixtures contained protonated surfactants and larger for mixtures with
deuterated surfactants.
An explanation for the large difference in intensities between scattering from pure CS and CS
containing protonated aggregates is that the hydrogen atoms (H) in CS are extensively
substituted by D from the solvent.
The scattering at “zero“ angle (dE(0)/dS) obtained from fitting the parameters can be used to
determine the volume fraction of surfactant in CS/surfactant complexes. This is possible
because we also investigated mixtures of protonated and deuterated surfactants. The volume
fraction (VF) of substituted surfactant is given by
VR
RF
s surfac t H s
CS surfac t H s surfac t D CS
=− −
− − −
( )( )
( ) ( )tan ( )
tan ( ) tan ( )
1 ρ ρ
ρ ρ ρ ρ (66)
where
76
R
d
dd
d
sCS surfac t H
CS surfac t D
=
∑
∑
( )
( )/ tan ( )
/ tan ( )
0
0Ω
Ω
(67)
and ρ denotes scattering length densities of CS, solvent (D2O) and protonated and deuterated
surfactant. The volume fraction of surfactant is shown in Table VI.4. As expected, it increases
with increasing surfactant concentration. The high volume fraction in 8 mM solution supports
the assumption that aggregates at this concentration have low charge so that inter-particle
interactions (structure factors) can be neglected.
The single-particle scattering function of a two-shell cylinder P2(q) can be expressed in the
same way as for a two-shell prolate ellipsoid (Eq. 48), using the form factor of a cylinder (Eq.
65). The calculated dimensions of aggregates of CS and NaPal are: length of aggregate ~ 630
Å, radius of the outer cylinder (formed by CS) ~35.5 Å and radius of the inner cylinder (formed
by NaPal) ~3.3 Å. While the values of the dimensions and aggregation numbers are relatively
uncertain, there is no doubt that the results indicate that NaPal, in contrast to many other
complexes of oppositely charged polymer-surfactant complexes, does not form spherical or
ellipsoidal micellar aggregates when associating with CS. In Table VI.5 are shown some
properties of other CS/surfactant complexes analysed by using this shell-core model. When the
hydrocarbon chain length of the surfactant decreases (from C16 to C12) the radius of the shell as
well as the radius of the core decreases. The values of the structure parameters of complexes of
mixed CS/NaPal/NaDod aggregates are between the values of parameters of CS/NaPal and
CS/NaDod aggregates.
In conclusion, the structure of the complexes can be roughly described as a core/shell cylinder.
The shell is formed by the CS chains, which apparently, in the same way as the amylose and
also, partly amylopectin, has helical conformation. The core consists of surfactant chains. Thus,
the structure of CS/surfactant complexes is similar to that of inclusion complexes of amylose
and surfactants, but, apparently, the cooperativity is much stronger due to the electrostatic
attraction between the head groups of the surfactant and the cationic groups in CS thus leading
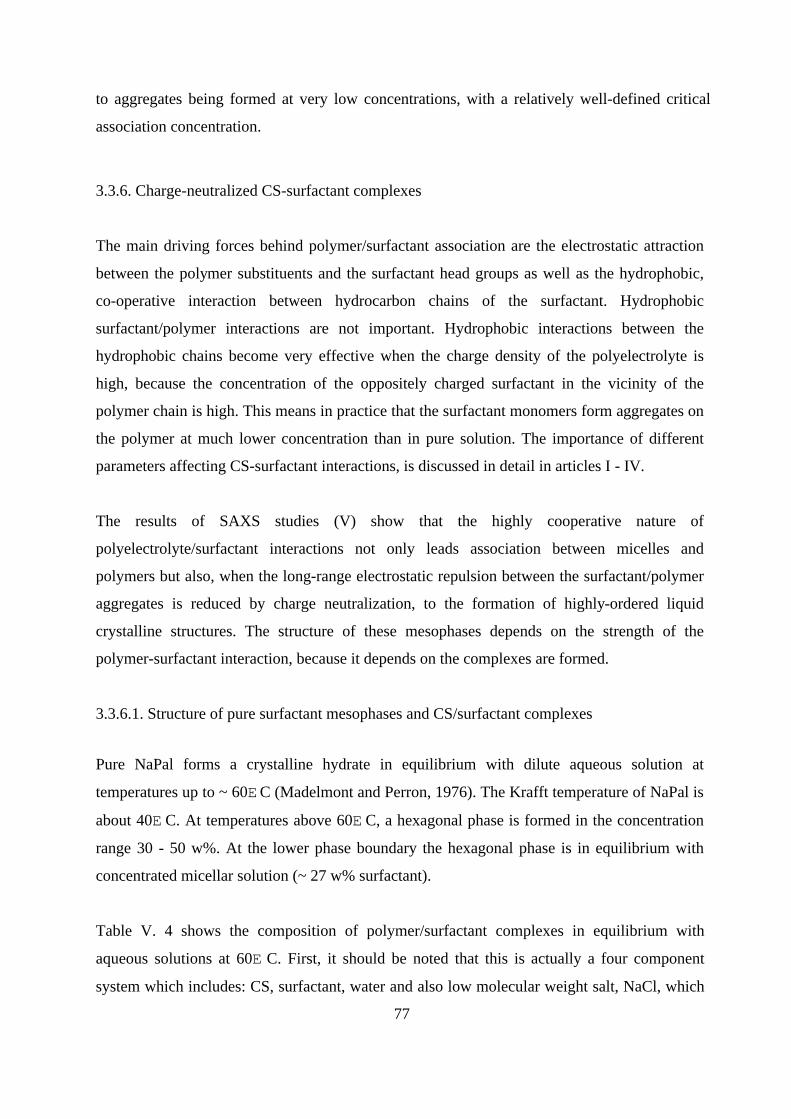
77
to aggregates being formed at very low concentrations, with a relatively well-defined critical
association concentration.
3.3.6. Charge-neutralized CS-surfactant complexes
The main driving forces behind polymer/surfactant association are the electrostatic attraction
between the polymer substituents and the surfactant head groups as well as the hydrophobic,
co-operative interaction between hydrocarbon chains of the surfactant. Hydrophobic
surfactant/polymer interactions are not important. Hydrophobic interactions between the
hydrophobic chains become very effective when the charge density of the polyelectrolyte is
high, because the concentration of the oppositely charged surfactant in the vicinity of the
polymer chain is high. This means in practice that the surfactant monomers form aggregates on
the polymer at much lower concentration than in pure solution. The importance of different
parameters affecting CS-surfactant interactions, is discussed in detail in articles I - IV.
The results of SAXS studies (V) show that the highly cooperative nature of
polyelectrolyte/surfactant interactions not only leads association between micelles and
polymers but also, when the long-range electrostatic repulsion between the surfactant/polymer
aggregates is reduced by charge neutralization, to the formation of highly-ordered liquid
crystalline structures. The structure of these mesophases depends on the strength of the
polymer-surfactant interaction, because it depends on the complexes are formed.
3.3.6.1. Structure of pure surfactant mesophases and CS/surfactant complexes
Pure NaPal forms a crystalline hydrate in equilibrium with dilute aqueous solution at
temperatures up to ~ 60E C (Madelmont and Perron, 1976). The Krafft temperature of NaPal is
about 40E C. At temperatures above 60E C, a hexagonal phase is formed in the concentration
range 30 - 50 w%. At the lower phase boundary the hexagonal phase is in equilibrium with
concentrated micellar solution (~ 27 w% surfactant).
Table V. 4 shows the composition of polymer/surfactant complexes in equilibrium with
aqueous solutions at 60E C. First, it should be noted that this is actually a four component
system which includes: CS, surfactant, water and also low molecular weight salt, NaCl, which
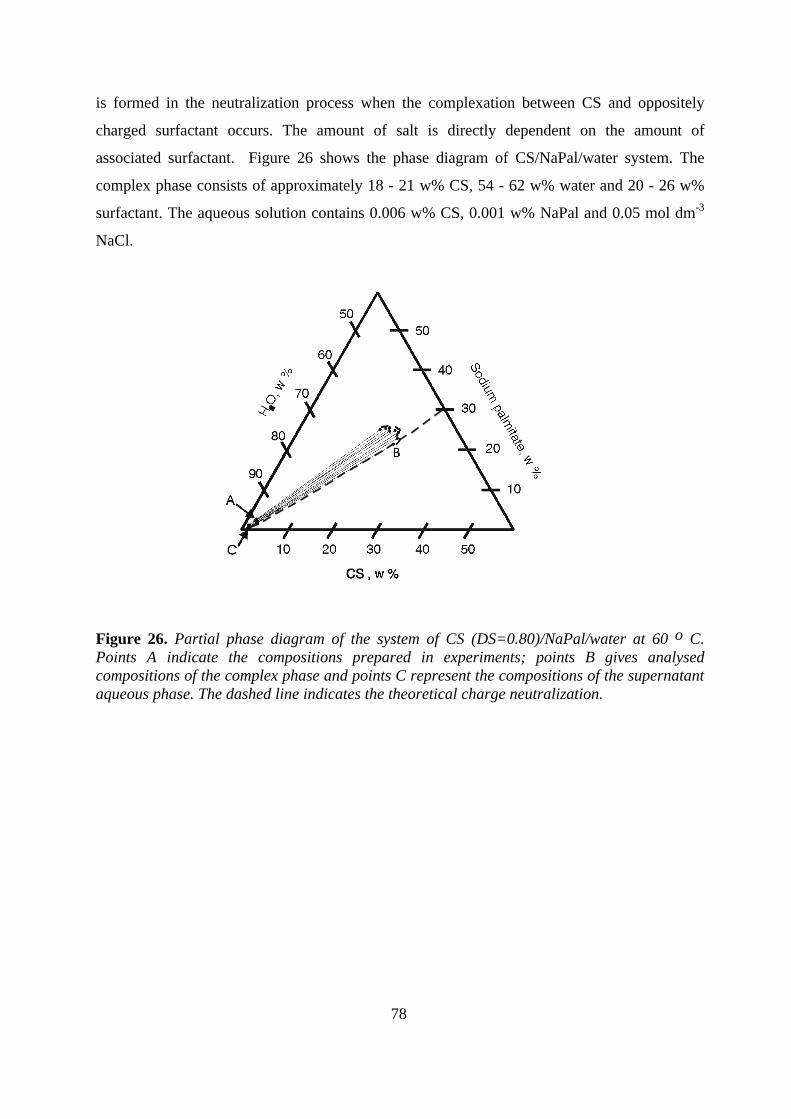
78
is formed in the neutralization process when the complexation between CS and oppositely
charged surfactant occurs. The amount of salt is directly dependent on the amount of
associated surfactant. Figure 26 shows the phase diagram of CS/NaPal/water system. The
complex phase consists of approximately 18 - 21 w% CS, 54 - 62 w% water and 20 - 26 w%
surfactant. The aqueous solution contains 0.006 w% CS, 0.001 w% NaPal and 0.05 mol dm-3
NaCl.
Figure 26. Partial phase diagram of the system of CS (DS=0.80)/NaPal/water at 60 o C. Points A indicate the compositions prepared in experiments; points B gives analysed compositions of the complex phase and points C represent the compositions of the supernatant aqueous phase. The dashed line indicates the theoretical charge neutralization.
79
Figure 27. The SAXS intensity of the neutral CS/Pal complex at 60E C. The vertical lines show expected reflections similarly to figure V. 2. The DS of starch was 0.80. The water content of complex phase was 54 w% at 60E C.
Figure V.3 shows the SAXS intensity curve for the CS/Pal complex at room temperature,
which is well below the Krafft point of NaPal. Three positions of reflections match well with
NaPal/water hydrate, which has a layered structure. The other peaks suggest that the complex
consists of two different types of liquid crystalline phases: lamellar and pm3n cubic with short
rod-like micelles. (Fontell et al., 1985) have found the same cubic structure with pure NaPal.
When the complex is measured at 60E C, the SAXS measurements show (Fig.27) that the
structure of CS/Pal complex phase is 2-d hexagonal. Thus, complexation of NaPal with CS
shifts the range of existence of the NaPal hexagonal phase towards lower temperatures than for
the pure surfactant. It also separates at much lower surfactant concentrations (well below the
cmc of the surfactant).
Figure V.10 shows the phase diagram of CS/NaOl/water system. The surfactant concentration
in the complex phase varies from 20 to 26 w%. In this concentration range, pure NaOl forms
only micellar solutions. A hexagonal phase is formed in concentration range from 30 to 40
w% and is stable from room temperature to 100E C (Vold 1939). The SAXS results show
(Figure V.2.) that same hexagonal structure is formed by the CS/Ol complex in the
temperature range from 25 to 80E C, again in equilibrium with very dilute solution of the
surfactant.

80
Figure V.11 shows the phase diagram of CS/NaDod/water system. The surfactant
concentration varies from 15 to 20 w%. In this concentration range pure sodium dodecanoate
forms micelles and a cubic liquid crystalline phase at temperatures below 30E C. At higher
temperatures only micellar solutions are formed. In the concentration range 30-50 w%, NaDod
forms a cubic phase below 40E C and hexagonal phase above 40E C (Madelmont and Perron,
1976). The phase behavior of CS/Dod complexes is quite similar, but the mesophases are
stable at significantly lower surfactant concentrations and different temperatures. Because of
the shorter chain length of NaDod, the CS/Dod complex forms hcp phase in equilibrium with
aqueous solution, while CS/Ol and CS/Pal form 2-d hexagonal phase (Table V.2).
The concentration of decanoate in the CS/De complex phase, separating from aqueous
solution, is quite low (<15 w%). No long-range ordering can be detected in this phase. The
pure surfactant liquid crystalline phases are formed only at very high surfactant concentrations.
The phase behavior of NaEr is similar to the behavior of NaPal. The Krafft points of both
surfactants are well above room temperature. NaEr differs from NaPal in that the lamellar
liquid crystalline phases separate from micellar solution at quite low surfactant concentrations.
The structure of CS/Er complex phase is the same as for pure NaEr, but it is formed at much
lower surfactant concentrations.
The hydrocarbon chain length of SDS is quite short, but the ionic sulphate group interacts
strongly with the trimethylammonium groups in the CS. This strong interaction is reflected in
the composition of the complex phase. It contains from 25 to 30 w% of surfactant, which is
much higher than in the CS/Dod complexes, although the hydrocarbon chain lengths differ by
only one carbon atom. The phase in equilibrium with aqueous solution is 2-d hexagonal rather
than hcp (Table V. 2), which implies that head group repulsion is more effectively screened
than for CS/Dod. Pure SDS forms micellar solutions in the concentration and temperature
range where the complex forms hexagonal phase (Kekicheff et al., 1989 a,b). Above 25E C,
SDS forms hexagonal mesophase when the surfactant concentration exceeds 38 w% and the
equilibrium hexagonal phase contains 40 w% of surfactant. In a narrow temperature range (20
- 25E C) the micellar solution is in equilibrium with a crystalline hydrate of SDS.

81
The charge density of CS is together with the chain length of the surfactant the other important
parameter affecting to the CS/surfactant interactions and hence, the structure of the neutral
complexes. The effect of charge density can be seen in that when the charge density of the
polyelectrolyte decreases the complex phase loses its order and behaves like a very
concentrated micellar solution. As shown by table V.3, the lowering of the charge density by a
relatively small amount has a surprisingly strong effect on the structure of CS/surfactant
complexes. The effect of decreasing charge density is also to increase the lattice constant of
the complexes. This indicates weakened interactions between the CS/surfactant aggregates.
The effect of temperature. The temperature has two effects on the structure of CS-surfactant
complexes.
1) The Krafft points of long-chain surfactants NaEr and NaPal is well above room temperature.
For this reason the complexes were prepared at 60E C. Thus, when the complexes were moved
to room temperature the surfactant that was not associated to CS, obviously precipitated. This
precipitated surfactant hydrate is well seen in the SAXS measured at room temperature. At
higher temperatures these hydrate peaks disappear. The simultaneous existence of surfactant
hydrates with other liquid crystalline phases is a quite common feature of surfactant solutions
at low temperatures.
2) Effect on the structure of the complexes. It is well known that the stability of lyotropic
liquid crystals formed by pure surfactants decreases when the temperature rises. The free
volume of the hydrocarbon chains increases and hence, the repulsion between the chains
increases decreasing the CS-surfactant interaction when temperature is rising. As these results
in table V. 2 show, when temperature rises the long-range ordering of the structures is
weakened.
In summary, it can be concluded that crystalline phases are formed in the same sequence and
with similar structures in the polyelectrolyte/surfactant system as in pure binary
surfactant/water systems. However, the concentration of surfactant in the polyelectrolyte-
containing phases is substantially lower than in pure surfactant system, and they also
precipitate from solutions containing much less surfactant than in the binary system, i.e. the
two-phase regions between liquid crystalline phase and solution are very wide. This shows that

82
the effect of adding polyelectrolyte is not only an increase in the ionic strength but probably
also direct binding of the polyelectrolyte to the aggregate surfaces, which reduces the
electrostatic repulsion between the aggregates. This notion is further substantiated by the
discussed below.
3.3.6.2. Lattice constants and interparticle distances
Table V.2 shows the lattice constants of different complex phases. These can be used as a
measure of interaggregate distances. CS and sodium erucate form a lamellar mesophase with
the lattice constant 54.0 Å. The extended chain length of erucate is 28 Å. This indicates that
the lamellar structures have to be very close to each other because there has to be room for the
CS-chains between the separate lamellas. The SANS measurements at dilute solutions (VI)
show, that the surfactant molecules in complexes are incorporated into CS helix. Thus, the
formation of lamellae presumably must imply some unfolding of this helix.
The extended chain length of oleate is about 23 Å. This value is very close the value of half of
the Bragg distance (47 Å) of hexagonal phase of CS/Ol complex (Table V.2.). In hexagonal
geometry the Bragg distance is actually the distance between lattice planes. Thus, the lattice
constant and interparticle distance is in this case 54.0 Å. It seems that the surfactant cylinders
in this structure are quite close to each other, which is possible only if the CS chains are
wrapped around these cylinders.
The lattice constant in the hexagonal (hcp) Dod/CS complex phase, which is also the
interparticle distance, is a = 53 Å and c = 87 Å (Ta ble V.2.). The length of the surfactant
monomer is in this case 15.4 Å. This indicates that there is more room between surfactant
aggregates in this structure. This is also seen as higher water content of the complex phase
(table V. 4).
The CS/Pal complex phase consists of hexagonally ordered cylinders (Table V.2.). The lattice
constant at room temperature, when the structure is cubic (pm3n) is 118 Å. At higher
temperature the structure changes to 2-d hexagonal the lattice constant and hence, the distance
between the cylindrical aggregates is 55.0 Å - 52.6 Å. The extended chain length of Pal is 20.5

83
Å. Comparison of the interparticle distances of CS/Ol (54.1 Å, +40 C) and CS/Pal (55.0 Å,
+40 C) shows that in spite of the different chain lengths they are quite similar.
The SANS results (VI) show that the radius of CS helices is about 30 Å at 70 C. Adding of
8mM NaPal decreases the radius to about 25 Å. Thus, it is quite obvious that CS chains take
cylindrical conformation also at high concentrations with NaPal, and also with NaOl. An
argument in favour of this assumption is that the surfactant chain length has only a minor
effect on the dimensions of cylindrical CS/surfactant aggregates. The difference in interparticle
distances is also partly explained by the different water content of the two systems.
The structure of the CS/De complex phase appears to be akin to a concentrated micellar
solution (Table V. 2.). The distance between the micelles is 36.0 Å at room temperature. The
extended chain length of De is 13 Å so there is plenty of water between the aggregates in these
complexes, as is also indicated by their analytical composition (Table V. 4).
SDS and CS form very highly viscous complexes with low water content. Depending on the
temperature, the distances between the cylinders vary from 42.9 to 46.0 Å. The dimensions of
a CS/DS aggregate phase are significantly shorter, resulting in a stiffer structure and
significantly lower water content of the complex phase (Table V.4).
3.3.6.3. The geometry of polyelectrolyte oppositely charged surfactant aggregate phases
Energetics of amphiphilic monolayers. The structure of surfactant aggregates depends on the
bending energy of the surfactant layers in the aggregates. This bending energy leads to the
formation of surfactant aggregates with different radii of curvature i.e. different geometry. The
bending energy, gc, of the layers in an aggregate can be expressed in terms the deviations from
the monolayer's preferred spontaneous curvature, c0, i.e. ∆c1 = c1 - c0 and ∆c2 = c2 - c0. Thus,
the bending energy is given by a two-dimensional version of Hooke’s law:
g k c k c k c cc c c= + +−1
2121
222
1 2∆ ∆ (68)

84
where kc is the bending modulus and k−
is a coupling constant. The bending energy depends on
the intermolecular forces between the amphiphile in the monolayers, including structural
forces, hydrogen bonding, electrostatic repulsion, steric repulsion, van der Waals’ attractions,
hydrophobic interactions and solvation forces.
The structural force, due to the collisions between the molten hydrocarbon chains creates an
outward pressure, tending to expand the hydrocarbon moiety. This is clearly reflected in the
temperature dependence of the curvature of the aggregate structures both in pure surfactant/
water and CS/surfactant/water systems.
At the polar/non-polar interface, hydrophobic interactions create an inward pressure that tends
to reduce water-oil contact. In the head group region there are steric, electrostatic and
hydration forces, which are expected to create a net positive outward pressure. When the
outward pressure in the chain region is high the monolayer is likely to bend towards water. On
basis of presently available results, the importance of hydrophobic, steric and hydration forces
in the CS/surfactant/water systems are difficult to assess. However, the strong interaction
between sulphate and trimethylammonium groups in the CS/DS complexes leads to formation
of aggregates with lower curvature than in corresponding CS/Dod systems, which indicates
that reduction of hydrophobic interactions and solvation in the surface plays a role.
The electrostatic contributions to the bending modulus of mean curvature, kc. It can be
deduced from the results described above is that phases similar to those formed by the pure
surfactants are formed by the CS/surfactant complexes, but at considerably lower surfactant
concentrations. It seems reasonable to assume that the major reason for this effect is the
electrostatic interaction between the polyelectrolyte and the surfactant aggregates. Considering
lamellar structures, there are three characteristic length scales: the mean membrane separation
2d, the Debye-Hückel screening length 1−κ and the Gouy-Chapman length σπ=λ le 2/ , where
σ is the surface charge density, e is the electronic unit charge, Tel πε= 4/2 is the Bjerrum
length, and ε is the dielectric constant of the solvent. In the limit of high electrolyte
concentration ( dκ >1 and κλ <1), the solutions of linearised Poisson-Bolzmann equation for
several geometries all indicate that the electrostatic contribution to the bending constant kc is
given by (Harden et al., 1992):

85
kT
lc =
3
4 3 2πκ λ (69)
where
κεε
=
∑e n z
kTi i
2 0 2
0
1 2/
(70)
and ni0 and zi are the number concentration and valency, respectively, of ion i. Because 6-1
increases with increasing electrolyte concentration, the bending constant between charged
particles kc decreases very rapidly when the electrolyte concentration increases. For example,
when the electrolyte concentration (1-1 electrolyte) increases from 1 mM to 10 mM,
1−κ decreases from 9.6 nm to 3.04 nm, and the bending constant is reduced to about 6 % of its
initial value.
The screening of electrostatic repulsion does, indeed, explain the reduction in the bending
energy caused by ionic interactions between the polar head groups. This is manifested in the
gradual transitions from micellar to saddle to lamellar phases as the concentration of surfactant
in binary water/surfactant systems increases. The same effects can be obtained by adding a
simple electrolyte. However, it is evident that the oppositely charged polyelectrolyte
neutralizes the charges much more effectively than a simple electrolyte. Adsorption of
polyelectrolyte to the monolayer (or micellar) surface neutralizes the charges by direct ion
binding. This markedly reduces the electrostatic contribution to the bending energy (Eq. 69)
and, hence the surface curvature of surfactant aggregates is changed, leading to stabilization of
phases with lower curvature than micelles. As Equation (70) shows, the bending modulus
depends strongly on the Gouy-Chapman lengths and, hence, on the charge density i.e. the
packing of the polar head groups of the surfactant monomers. The CS has very high charge
density; therefore the association of surfactant aggregates with CS chains with high charge, via
charge neutralization, results in a very effective shortening of λ and, hence, also a lower
bending energy and a closer packing of surfactant monomers in aggregates of low curvature.
Similar conclusions were reached in a recent study of sodium polyacrylate/
cetyltrimethylammonium bromide systems (Ilekti et al., 1999).

86
When the ionic strength increases, the phase boundaries of lyotropic liquid crystalline phases
move towards lower surfactant concentrations. They also shift to higher temperatures,
indicating increased stability of the surfactant aggregates. However, this effect is much weaker
than the effect of adding polyelectrolyte. For instance, the phase diagram of the
NaPal/NaCl/water system (Laughlin 1994) shows that addition of up to 5 w% of NaCl to a
1w% NaPal solution does not cause any phase changes. In our investigation, the initial NaPal
concentration of the CS/Pal sample was 1 w% and the CS concentration 1.2 w%. The
estimated effect of CS on the ionic strength corresponds approximately to 0.1 w% of added
NaCl. This indicates very clearly that the addition of polyelectrolyte has much stronger effect
than the addition of a simple electrolyte.
Because the formation of more or less neutral complexes when the polycation associates with
anionic surfactant, there is also an ionic strength effect due to the release of simple ions from
the polyelectrolyte and the micelles. This could explain part of the detected shift of the phase
boundaries and areas of liquid crystalline phases of CS/surfactant complexes, but it is clear
from the discussion above that this effect is minor.
3.3.7. Rheology of the complexes
3.3.7.1.General
The rheological behaviour of highly concentrated CS solution is shown in Figures III.2a. and
III.2b. Complex modulus is nearly identical to the loss modulus. Thus, viscosity is the
predominating rheological property. This behaviour is characteristic of many polymer
solutions. Addition of an anionic surfactant so that complex phase is formed, affects the
rheological properties very significantly. A typical pattern of behaviour is exemplified by the
CS/SDS system in Figure 28. The dynamic modulus is two orders of magnitude larger than
that of surfactant-free starch. The interaction between CS and the surfactant results in a
strongly increased elastic modulus of the complex phase. The complexes are also slightly
thixotropic (Fig. III.3).

87
Figure 28. Dynamic rheological behaviour of CS/DS complex phase. Degree of substitution of starch was 0.772. T=298 K.
Charge density of the polymer. In Table III.2 it can be seen that the yield stress increases when
the DS of the CS increases. The existence of yield stress at higher shear rates indicates that the
structure of the complex is somewhat stronger. When the DS of the CS increases, both
viscosity and elasticity of the complex phase increase, but it is the increase in the elasticity that
dominates. Thus, the CS/surfactant interaction in the complex phase is stronger (I). This can be
seen also in the fact that the maximum swelling of neutral complex phases with water
decreases with increasing charge density of the cationic starch. The other possibility is that the
association of surfactants with CS of higher DS forms complexes with lower water content and
also different liquid crystalline phases of the surfactants.
Surfactant chain length. As the hydrocarbon chain length of the surfactant increases, the
viscosity and the dynamic module of the complex phase rapidly increase. On the other hand, it
is known that the long-chain surfactants associate with the polymers in lower concentrations
than the short-chain surfactants do. The growth of length of the hydrocarbon chain strengthens
the interaction between the CS and surfactant (I, II). In addition, the changes of surfactant
liquid crystal phases (V) probably contribute to the rheological properties of the complex
phase, but our data do not allow any conclusions regarding these effects.
Electrolyte concentration. The electrostatic interactions are increasingly screened when the
electrolyte concentration increases. These weakened interactions show up as decreasing yield
stress, decreasing viscosity and increasing water content of the complex phase in equilibrium
0
50000
100000
150000
200000
250000
300000
350000
0,01 0,1 1 10 100
Frequence, [Hz]
G*,
G',
G'',
[P
a]
G*
G'
G"

88
with aqueous solution. The structure of the complex phase comes more swollen because the
interaction between polyelectrolyte and oppositely charged ionic end-groups of the surfactant
is weakened. In spite of the decreasing elasticity and viscosity of the complex the
elasticity/viscosity ratio is not affected by the increasing electrolyte concentration.
The effect of surfactant mixture. It is well known that mixing of two surfactants with the same
functionality produces mixed micelles that include both individual surfactant monomers. It has
also been shown that these mixed micelles primary consist of the long-chain surfactant and the
fraction of the short-chain surfactant is very much lower (IV), (Shinoda, 1954), in the micelles
than in the surrounding solution.
3.3.7.2. Fitting of the results to simple rheological models
Many different phenomenological equations have been used to describe the viscoelastic
behaviour of different systems. At best, the theoretical background of these is limited.
However, they are quite useful for the phenomenological comparison of the viscoelastic
properties of different systems. Hence, the experimental data is fitted to the commonly used
equations by a simple least squares procedure. Used models were:
Power law σ γ= k n.
(71)
Bingham plastic σ σ γ= +y k. (72)
Herschey-Bulkley σ σ γ= +ynk
.
(73)
Casson σ σ γ= +y k1 2 1 2/ /.
(74)
Vocaldo σ σ γ= +( )/.
yn nk1 (75)
where F is the shear stress, ( is the shear rate, Fy is the yield stress and k is a measure of the
viscosity at high shear rates.
Figure 29 shows the correlation of these models with the rheological data of several samples.
Clearly, the Bingham plastic or power law models do not fit the experimental data. Using the
more complex Casson or Vocaldo models provides no improvement over the Herschel-Bulkley
(HB) model, which, moreover, correlates very well indeed with the results. Therefore, the
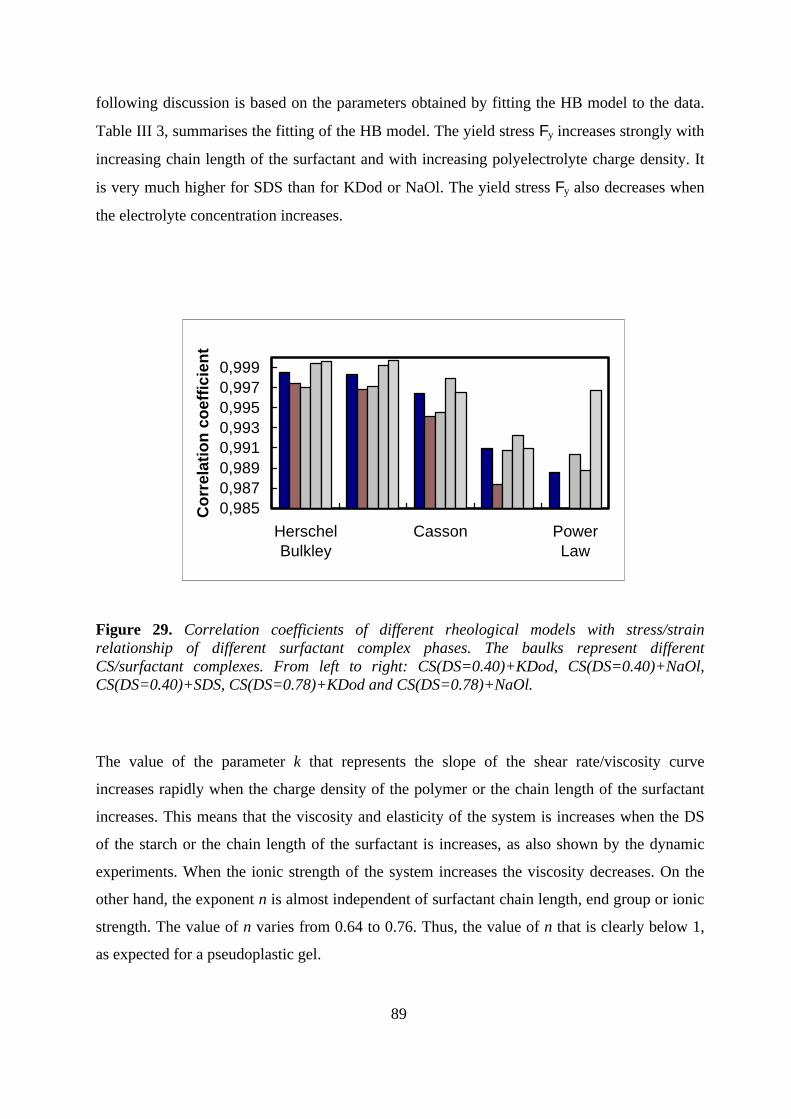
89
following discussion is based on the parameters obtained by fitting the HB model to the data.
Table III 3, summarises the fitting of the HB model. The yield stress Fy increases strongly with
increasing chain length of the surfactant and with increasing polyelectrolyte charge density. It
is very much higher for SDS than for KDod or NaOl. The yield stress Fy also decreases when
the electrolyte concentration increases.
Figure 29. Correlation coefficients of different rheological models with stress/strain relationship of different surfactant complex phases. The baulks represent different CS/surfactant complexes. From left to right: CS(DS=0.40)+KDod, CS(DS=0.40)+NaOl, CS(DS=0.40)+SDS, CS(DS=0.78)+KDod and CS(DS=0.78)+NaOl.
The value of the parameter k that represents the slope of the shear rate/viscosity curve
increases rapidly when the charge density of the polymer or the chain length of the surfactant
increases. This means that the viscosity and elasticity of the system is increases when the DS
of the starch or the chain length of the surfactant is increases, as also shown by the dynamic
experiments. When the ionic strength of the system increases the viscosity decreases. On the
other hand, the exponent n is almost independent of surfactant chain length, end group or ionic
strength. The value of n varies from 0.64 to 0.76. Thus, the value of n that is clearly below 1,
as expected for a pseudoplastic gel.
0,9850,9870,9890,9910,9930,9950,9970,999
HerschelBulkley
Casson PowerLaw
Co
rrel
atio
n c
oef
fici
ent

90
3.3.7.3. Rheology vs. structure of CS/surfactant complexes
Dilute aqueous solutions. It is evident from the cooperative nature of the interaction (I) and
from the special character of CS conformation (VI) that the surfactant associated with cationic
starch forms inclusion-like complexes. It is possible that in the complexes the aggregates
interact with other starch molecules, creating a loose network structure. It is plausible to
assume that because of their dynamic structure, the aggregates do not form solid, linked
network structures. Instead, they form a weak, very elastic and renewable structure.
Concentrated complex phase. Recent studies discussing the structure of polyelectrolyte/
oppositely charged surfactant complexes (Ponomarenko et al., 1998 and Ilekti et al., 1999)
have shown that the structure of these kind of concentrated complexes is quite different from
what has been believed previously. The complexes consist of highly ordered liquid crystal
phases of surfactants where the polymer is anchored. The surfactants can form, for example
lamellar, hexagonal or cubic phases in polyelectrolyte/surfactant complexes. As it has been
shown (VI) CS/surfactant complexes have the same kind of structure. The results indicate (IV)
that the interaction between this type of mixed micelles and CS depends on the chain length
difference of these surfactants and also on the molar ratio of these surfactants. The results
showed that the interaction between CS and surfactants is the weaker the higher is the fraction
of the short-chain surfactant and the bigger is the chain length difference of the surfactants.
The effect of the second surfactant on the rheology of these CS/surfactant complex phases is
well explained by the effect of the second surfactant on the CS/surfactant interaction. The
effect is quite similar to the effect of using the shorter-chain surfactant alone. Thus, when the
fraction of the short-chain component increases one approaches the situation obtaining for pure
CS/shorter-chain surfactant complexes. This can also be observed as increasing water content
of the complex phase in equilibrium with aqueous solution (IV).

91
4. CONCLUSIONS
CS/anionic surfactant interactions can be understood by assuming that the most important
factors governing the behaviour on the systems are cooperative hydrophobic interactions
between surfactant chains and electrostatic interactions between cationic and anionic
polyelectrolytes Hydrophobic polymer /surfactant interactions are of minor importance.
The enhanced surface activity of these systems at very low surfactant concentrations is due to
formation of surface-active complexes by way of counter ion condensation. Critical
association concentrations are observed at concentrations well below the cmcs of the
surfactants.
There is a minimum hydrocarbon chain length of the surfactant and also a minimum degree of
substitution of the CS to association between the CS and surfactant to take place.
Associative phase separation occurs in extremely dilute systems when the charge ratio between
the surfactants and the polymers is close to one.
The effect of mixing on the micellisation of the binary surfactant solutions can be described to
a good approximation by taking into account only the effects of the volume difference between
the hydrocarbon chains. Complex formation on CS depends on the chain-length difference in
exactly the same way as for free mixed micelles.
The separated complex phase is a hydrophobic, highly viscous and gel-like containing 40 to 60
w% of water. The high viscosity and low water content of the complex phase indicates that the
interactions between the CS and anionic surfactants are very strong. The water content of the
complex phase decreases when the chain length of the surfactant or the DS of the CS increases,
indicating increased polymer/surfactant interaction.
With mixed surfactants the water content of the complex phase increases when the chain
length difference increases. The more surface-active component is strongly enriched in the
polymer complexes.
When excess surfactant is added, the separated complex phase redissolutes completely or
partly, depending on the charge density of the CS. The redissolution of the complex phase
takes place by the charge reversal mechanism

92
SANS indicates that mixed micelles of alkanoates are prolate ellipsoids with the shorter chain
surfactant enriched in the end-cups of the ellipsoid. SANS also indicates that in dilute solutions
CS molecules are roughly cylindrical i.e. have helical conformation. When they associate with
surfactants, aggregates are formed, in which a core of surfactant is surrounded by CS. The
surfactant monomers do not form any micelle-like aggregates in these complexes. The
structure of the complexes resembles the inclusion complexes of amylose and surfactants. In
mixed surfactant systems, the longer chain surfactant is enriched into the surfactant/CS
complex.
As the SAXS results show, the charge equivalence CS/surfactant complexes consist of a
lyotropic liquid crystalline phase. Depending on the chain length of the surfactant, temperature
and salt concentration, the structure of the liquid crystalline phase is hexagonal, lamellar or
cubic. The mesophases are the same as the pure surfactants in forming without any added
polymer, but they form with CS at much lower surfactant concentrations. Thus, the polymer
act as a huge and very effective counter ion that screens repulsion between the surfactant head
groups and the surfactant aggregates.
The gel-like CS/surfactant complex phases have high viscosity and elasticity. They show
pseudoplastic behaviour. The rheological behaviour of the complexes is described by the
Hershel-Bulkley model. The rheological data for the complex phases are compatible with the
finding that the surfactants form liquid crystalline structures with the polymer anchored to the
surfactant aggregates.
93
REFERENCES
Abrahmsen-Alami, S. and Stilbs, P. (1994), 1H NMR self-diffusion and multifield 2H spin relaxation study of model associative polymer and sodium dodecyl sulfate aggregation in aqueous solution, J. Phys. Chem. 98, 6359 - 6367.
Abuin, E. B. and Scaiano, J. C. (1984), Exploratory study of the effect of polyelectrolyte- surfactant aggregates on photochemical behavior, J. Am. Chem. Soc. 106, 6274 - 6283.
Adam, N. K. (1968), The Physics and Chemistry of Surfaces, Dover, New York, 2nd ed., 1968.
Adamson, A. W. (1984), Physical Chemistry of Surfaces, Interscience Publishers, New York, 3rd ed., 1984.
Almgren, M., Hansson, P., Mukhtar, E. and van Stam, J. (1992). Aggregation of alkyltrimethylammonium surfactants in poly(styrene sulfonate) solutions, Langmuir 23, 2405 - 2412.
Ananthapadmanabban, K. P., Leung, P. S. and Goddard, E. D. (1985), Fluorescence and solubilization studies of polymer-surfactant systems, Colloids Surf. 13, 63 - 72.
Anderson, C. F. and Record, M. T. (1982), Polyelectrolyte theories and their applications to DNA, Annu. Rev. Phys. Chem. 33, 191 - 222.
Anthony, O. and Zana. R. (1996), Interactions between water soluble polymers and surfactants: effect of the polymer hydrophobicity. 1. Hydrophilic polyelectrolytes, Langmuir 12, 1967 - 1975.
Antonietti, M., Conrad, J. and Thunemann, A. (1994), Polyelectrolyte_surfactant complexes: a new type of solid, mesomorphous material, Macromolecules 27, 6007 - 6011.
Antonietti, M., Kaul, A. and Thunemann, A. (1995), Complexation of lecithin with cationic polyelectrolytes. 'Plastic membranes' as models for the structure of the cell membrane? Langmuir 11, 2633 - 2638.
Antonietti, M. and Wenzel, A. (1998), Structure control of polyelectrolyte-lipid complexes by variation of charge density and addition of cholesterol. Colloids and Surfaces A 135, 141 - 147.

94
Bakeev, K.N., Chugunov, S.A. , Teraoka, I., MacKnight, W.J., Zezin, A. and Kabanov, V. A., (1994), Complexation of ionomers and surfactant molecules of the same charge in a nonpolar solvent Macromolecules 27, 3926 - 3932.
Bakeev, K. N., Ponomarenko, E. A., Shishkanova, T. V., Tirrell, D. A., Zezin, A. B., Kabanov, V.A.; (1995), Polyelectrolytes and oppositely charged surfactants in organic solvents: From reversed micelles to soluble polymer_surfactant complexes. Macromolecules 28, 3657 - 3663.
Barneveld, P.A., Scheutjens, J.M.H.M.; Lyklema, J. (1992), Bending moduli and spontaneous curvature. 1. Bilayers and monolayers of pure and mixed nonionic surfactants. Langmuir 8, 3122 - 3130.
Barneveld, P.A., Hesselink, D.E.; Leermakers, F.A.M.; Lyklema, J.; Scheutjens, J.M.H.M. (1994). Bending moduli and spontaneous curvature. 2. Bilayers and monolayers of pure and mixed ionic surfactants. Langmuir 10, 1084 - 1092.
Bekturov, E. A., Kudaibergenov, S. E. and Kanapyanova, G. S. (1984), Interaction of synthetic polyampholytes with anionic and cationic detergents in aqueous solution, Polym. Bull. 11, 551 - 555.
Berr, S. S., Coleman, M. J., Jones, R. R. M., Johnson, J. S. (1986) Small angle neutron scattering study of the structural effects of substitution of tetramethylammonium for sodium as the counterion in dodecyl sulfate micelles. J. Phys. Chem. 90, 6492 - 6499.
Bevington, B. R. (1969), Data Reduction and Error Analysis for Physical Sciences; McGraw-Hill: New York, 1969.
Bradstreet, R. B. (1965), The Kjeldahl Method for Organic Nitrogen, Academic Press, New York, 1965.
Brumberger, H. (Ed.), Modern Aspects of Small-Angle Scattering. Kluwer Academic Publishers, The Netherlands, 1995.
Cabane, B., Duplessix, R.(1982), Organization of surfactant micelles adsorbed on a polymer molecule in water: a neutron scattering study. J. Physique 43, 1529 - 1542.
Carlsson, A., Karlström, G. and Lindman, B. (1989), Characterization of the interaction between a nonionic polymer and a cationic surfactant by the Fourier transform NMR self- diffusion technique, J. Phys. Chem. 93, 3673 - 3677.

95
Carnali, J. O. (1993), (Polymer/polymer)-like phase behavior in systems tetradecyltrimethylammonium bromide/sodium polyacrylate/water, Langmuir 9, 2933 - 2941.
Chen, L., Yu, S., Kagami, Y., Gong, J., Osada, Y.(1998), Surfactant binding of polycations carrying charges on the chain backbone: cooperativity, stoichiometry and crystallinity. Macromolecules 31, 787 - 794.
Chen, S. H. (1986) Small angle neutron scattering studies of the structure and interaction in micellar and microemulsion systems. Ann. Rev. Phys. Chem. 37, 351 - 399.
Chevalier; Y., Zemb, T. (1990) The structure of micelles and microemulsions. Rep. Prog. Phys. 53, 279 - 371.
Chu, D. and Thomas, J. K. (1986), Effect of cationic surfactants on the conformational transition of poly(methacrylic acid), J. Am. Chem. Soc. 108, 6270 - 6276.
Codet, M. C., Buleon, A., Tran, V. and Colonna, P. (1993) Structural features of fatty acid-amylose complexes, Carbohydrate Polymers 21, 91 - 95.
Corrin, M. L. and Harkins, W. D. (1947), The effect of salts on the critical concentration for the formation of micelles in colloidal electrolytes, J. Am. Chem. Soc. 69, 683 - 688.
Cotton, J. P. (1991), In Neutron, X-Ray and Light Scattering: Introduction to an Investigative Tool for Colloidal and Polymeric Systems; Lindner, P. and Zemb, T., Eds; North-Holland: Amsterdam, 1991.
de Gennes, P. G. (1990), Interaction between polymers and surfactants, J. Phys. Chem. 94, 8407 - 8413.
Dubin, P. L., Rigsbee, D. R. , Gan, L.-M. and Fallon, M. A. (1988), Equilibrium binding of mixed micelles to oppositely charged polyelectrolytes, Macromolecules 21, 2555 - 2559.
Dubin, P. L., The, S. S., Gan, L.-M. and Chew, C. H.(1990), Static light scattering of polyelectrolyte-micelle complexes, Macromolecules 23, 2500 - 2506.
Effing, J. J., McLennan, I. J. and Kwak, J. C. T. (1994), Associative phase separation observed in a hydrophobically modified poly(acrylamide)/sodium dodecyl sulfate system, J. Phys. Chem. 98, 2499 - 2502.

96
Einstein, A. (1956), Investigation on the Theory of the Brownian Movement, Dovel Publications, New York, 1956, 58 pp.
Eliasson, A. C. and Kim, H. R. (1995), Dynamic rheological method to study the interaction between starch and lipids. J. Rheol. 39, 1519 - 1534.
Evans, D.F. and Wennerström, H. (1999), The Colloidal Domain, VCH Publishers, New York.
Feigin, L.A. and Svergun, D.I. (1987), Structure Analysis by Small-Angle X-Ray and Neutron Scattering, Plenum Press, New York, 1987.
Finch, J. A. and Smith, G. W. (1973), Dynamic surface tension of alkaline dodecylamine solutions, J. Colloid Interface Sci. 45, 81 - 91.
Fixman, M. (1979), The Poisson-Boltzmann equation and its application to polyelectrolytes, J. Chem. Phys. 70, 4995 - 5005.
Flory, J. P. (1953), Principles of Polymer Chemistry, Cornell University Press, Ithaca, New York,1953.
Fontell, K., Fox, K. K., and Hansson, E. (1985), On the structure of the cubic phase I1 in some lipid-water systems. Mol. Cryst. Liq. Cryst., Lett. Sect. 1(1-2), 9-17.
Francois, J., Dayantis, J. and Sabbadin, J. (1985), Hydrodynamical behaviour of the poly(ethylene oxide) - sodium dodecyl sulphate complex, Eur. Polym. J. 21, 165 - 174.
Fundin, J. and Brown, W. (1994), Polymer/surfactant interactions. Sodium poly(styrenesulfonate) and CTAB complex formation. Light scattering measurements in dilute aqueous solution, Macromolecules 27, 5024 - 5031.
Förster, S., Schmidt, M. and Antonietti, M. (1990), Static and dynamic light scattering by aqueous polyelectrolyte solutions: effect of molecular weight, charge density and added salt, Polymer 31, 781 - 792.
Garamus, V. M. (1997), Study of mixed micelles with varying temperature by small_angle neutron scattering. Langmuir 13, 6388 - 6392.
Glatter, O., Kratky, O. (1992). Small Angle X-ray Scattering, Academic Press, London 1992.

97
Goddard, E. D. and Hannan, R. B. (1976), Cationic polymer/anionic surfactant interactions, J. Colloid Interface Sci. 55, 73 - 79.
Goddard, E. D. and Hannan, R. B. (1977), Polymer/surfactant interactions, J. Am. Oil Chem. Soc. 54, 561-566.
Goddard, E. D. and Leung, P. S. (1982), Complexes of cationic polymers and anionic surfactants. Polym. Prepr. Am. Chem. Soc. Div. Polym. 23, 47 - 47.
Goddard, E. D. (1986a) Polymer-surfactant interaction: Part I. Uncharged water soluble polymers and charged surfactants. Colloids Surf. 19, 255 - 300.
Goddard. E. D. (1986b) Polymer-surfactant interaction: Part II. Polymer and surfactant of opposite charge. Colloids Surf. 19, 301 - 329.
Goddard, E. D. and Ananthapadmanadhan, K. P. eds. (1993), Interactions of Surfactants with Polymers and Proteins, CRC Press, USA 1993, 427 pp.
Gorski, N., Gradzielski, M., Hoffmann, H. (1994), Mixtures of nonionic and ionic surfactants. The effect of counterion binding in mixtures of tetradecyldimethylamine oxide and tetradecyltrimethylammonium bromide. Langmuir 10, 2594 - 2603.
Hahn, T., (Ed.) International Tables for Crystallography; D. Reidel Publishing Co., Dortrecht, The Netherlands, 1985, 128pp.
Hansen, J. P., Hayter, J. B. (1982), A rescaled MSA structure factor for dilute charged colloidal dispersions. Molecular. Phys. 46, 651 - 656.
Hansson, P and Almgren, M. (1994), Interaction of alkyltrimethylammonium surfactants with polyacrylate and poly(styrenesulfonate) in aqueous solution. Phase behavior and surfactant aggregation numbers. Langmuir 10, 2115 - 2124.
Hansson, P. and Almgren, M. (1995) Large C12TAB micelles formed in complexes with polyvinyl sulfate and dextran sulfate. J. Phys. Chem. 99, 16694 - 16703.
Hansson, P. (1998), Surfactant self_assembly in polyelectrolyte gels: aggregation numbers and their relation to the gel collapse and the appearance of ordered structures in the NaPa/C12TAB system. Langmuir 14, 4059 - 4064.

98
Harada, A. and Nozakura, S. (1984), Formation of organized structures in systems of polyelectrolyte-ionic surfactants. Polym Bull. 11, 175 - 178.
Harden, J. L., Marques, C., Joanny, J.-F. (1992), Membrane curvature elasticity in weakly charged lamellar phases. Langmuir 8, 1170 - 1175.
Hayakawa, K. and Kwak, J. C. T. (1983 a), Study of surfactant-polyelectrolyte interactions. II. Effect of multivalent counterions on the binding of dodecyltrimethylammonium ions by sodium dextran sulfate and sodium poly(styrenesulfonate) in aqueous solution, J. Phys. Chem. 87, 506 - 509.
Hayakawa, K. , Santerre, J. P. and Kwak, J. C. T. (1983 b), Study of surfactant-polyelectrolyte interactions. Binding of dodecyl- and tetradecyltrimethylammonium bromide by some carboxylic polyelectrolytes, Macromolecules 16, 1642 - 1645.
Hayakawa, K. and Kwak, J.C.T. (1991) in Cationic Surfactants, Rubingh, D.N. and Holland, P.M. eds., Marcel Dekker, New York, 2nd ed., 1991.
Hayter, J. B. and Penfold, J., (1981) Analytical structure factor for macroion solutions. Mol. Phys., 42, 109 - 118.
Herslof, Å., Sundelof, L. -O. and Edsman, K. (1992), Interaction between polyelectrolyte and surfactant of opposite charge. Hydrodynamic effects in the sodium hyaluronate/ tetradecyltrimethylammonium bromide/sodium chloride/water system. J. Phys. Chem. 96, 2345 - 2348.
Holland, P. M. and Rubingh D.N. (1992), Mixed Surfactant Systems, ACS Symposium series 501, American Chemical Society, Washington, 1992.
Huh, C. and Mason, S. G. (1975), A rigorous theory of ring tensiometry, Colloid Polymer Sci. 253, 566 - 580.
Ilekti, P., Piculell, L., Tournilhac, F. and Cabane, B. (1998), How to concentrate an aqueous polyelectrolyte/surfactant mixture by adding water. J. Phys. Chem. B 102, 344 -351.
Ilekti,. P.; Martin, T.; Cabane, B.; Piculell, L. (1999), Effects of polyelectrolytes on the structures and interactions of surfactant aggregates. J. Phys. Chem. 103, 9831-9840.

99
Israelachvili, J. N., Mitchell, D. J. and Ninham, B. W. (1976), Theory of self-assembly of hydrocarbon amphiphiles into micelles and bilayers, J. Chem. Soc. Faraday Trans. 2, 72, 1525 - 1568.
Jones, M. N. (1967), The interaction of sodium dodecyl sulfate with polyethylene oxide , J. Colloids Interface Sci. 23, 36 - 42.
Jönsson, B., Lindman, B., Holmberg, K., Kronberg, B. (1998), Surfactant and Polymers in Aqueous Solution, Wiley: New York, 1998, ch. 3.
Ju, R. T. C, Frank, C. W. and Gast, A. P. (1992), Contin analysis of colloidal aggregates, Langmuir 8, 2165 - 2171.
Kamenka, N., Burgaud, I., Zana, R. and Lindman, B. (1994), Electrical conductivity, self-diffusion and fluorescence probe investigations of the interaction between sodium dodecyl sulfate and ethyl(hydroxyethyl)cellulose, J. Phys. Chem. 98, 6785 - 6789.
Karlström, G., Carlsson, A. and Lindman, B. (1990), Phase diagrams of nonionic polymer- water systems. Experimental and theoretical studies of the effects of the surfactants and other cosolutes, J. Phys. Chem. 94, 5005 - 5015.
Kekicheff, P., Grabielle-Madelmont, C., Ollivon, M. (1989a) Phase diagram of sodium dodecyl sulfate-water system. 1. A calorimetric study. J. Colloid Interface. Sci. 131, 112 - 132.
Kekicheff, P. (1989b) Phase diagram of sodium dodecyl sulfate-water system. 2. Complementary isoplethal and isothermal studies. J. Colloid Interface. Sci. 131, 133 - 152.
Khandurina, Y. V., Rogacheva, V. B., Zezin, A. B., Kabanov, V. A. (1994a), Interaction of net polyelectrolytes with oppositely charged surfactants. Polym. Sci. 36, 184 - 188.
Khandurina, Y. V., Dembo, A. T., Rogacheva, V. B., Zezin, A. B., Kabanov, V. A. (1994b), Structure of polycomplexes composed of cross-linked sodium polyacrylate and cationic micelle forming surfactants. Polym. Sci. 36, 189 - 194.
Khandurina, Y. V., Rogacheva, V. B., Zezin, A. B., Kabanov, V. A. (1994c), Stability of polycomplexes of network polyelectrolytes with surface-active substances in aqueous salt and aqueous organic media. Polym. Sci. 36, 195 - 199.
Kiefer, J.J., Somasundaran, P and Ananthapadmanablan in Polymer Solutions, Blends and Interfaces (I. Noda and D.N. Rubingh, eds.). Elsevier Science Publ., 1992, pp.423 - 444.

100
Kim, R., Ishizawa, M., Gong, J., Osada, Y. (1999), Molecular and supramolecular structures of complexes formed by polyelectrolyte_surfactant interactions: effects of charge density andcompositions. J. Polym. Sci. A 37, 635 - 644.
Klevens, H. B. (1953), Structure and aggregation in dilute solutions of surface active agents, J. Am. Oil Chem. Soc. 30, 74 - 80.
Koene, R. S. and Mandel, M. (1983a), Scaling relations for aqueous polyelectrolyte - salt solutions. 1. Quasi-elastic light scattering as a function of polyelectrolyte concentration and molar mass, Macromolecules 16, 220 - 227.
Koene, R. S., Nicolai, T. and Mandel, M. (1983b), Scaling relations for aqueous polyelectrolyte - salt solutions. 2. Quasi-elastic light scattering as a function of polyelectrolyte concentration and salt concentration, Macromolecules 16, 227 - 231.
Koene, R. S., Nicolai, T. and Mandel, M. (1983c), Scaling relations for aqueous polyelectrolyte - salt solutions. 3. Osmotic pressure as a function of molar mass and ionic strength in semidilute regitime, Macromolecules 16, 231 - 236.
Korobko, T.A., Izumrudov, V. A., Zezin, A. B., Kabanov, V. A. (1994), The role of nonpolar interactions in the reactions of nonstoichiometric interpolyelectrolyte complexes with anionic surfactants. Polym. Sci. 36, 179 - 183.
Kosmella. S., Kötz, J., Friberg, S.E., MacKay, R. (1996) Interactions of polyelectrolytes with the lyotropic liquid crystalline system hexadecyltrimethylammonium bromide/decanol/water. Coll. Surf. A 112, 227 - 231.
Kotlarchyk, M., Chen, S. H.(1983), Analysis of small angle neutron spectra from polydisperse interacting colloids, J. Chem. Phys. 79, 2461 - 2469.
Kubik, S., Höller, O., Steinert, A., Tolksdorf, M. and Wulff, G. (1995), Inclusion compounds of derivatized amyloses. Macromol. Symp. 99, 93 - 102.
Landau, L.D. and Lifshitz, E.M. (1985). Classical Theory of Fields, Pergamon Press, Oxford, 1985.
Lange, H. (1971), Wechselwirkung zwishen natrium alkylsulfaten und polyvinylpyrrolidon in wässrigen lösungen, Kolloid Z. Z. Polym. 243, 101 - 109.

101
Laughlin, R. G. (1994), The Aqueous Phase Behaviour of Surfactants, Academic Press: New York, 1994.
Leung, P. S. , Goddard, E. D. , Han, C. and Glinka, C. J. (1985), A study of polycation - anionic surfactant systems, Colloids Surfaces 13, 47 - 62.
Li, Y. and Dubin, P. L. Havel, H.A., Edwards, S.L., Dautzenberg, H.(1995), Complex formation between polyelectrolyte and oppositely charged mixed micelles. Soluble complexes vs coacervation. Langmuir 11, 2486 - 2492.
Lindman, B. (1984), Structural aspects of surfactant micellar systems, in Surfactants, Tadros, Th. F. , Academic Press, New York, 1984, 83.
Lucassen, J. (1966), Hydrolysis and precipitation in carboxylate soap solutions, J. Phys. Chem. 70, 1824 - 1830.
Madelmont, C. and Perron, R. (1976), Study of the influence of the chain length on some aspects of soap/water diagrams. Colloid Polym. Sci. 254, 581 - 595.
Magny, B. , Iliopoulos, I. , Zana, R. and Audebert, R. (1994), Mixed micelles formed by cationic surfactants and anionic hydrophobically modified polyelectrolytes, Langmuir 10, 3180 - 3187.
Manning, G.S. (1977), Limiting laws and counterion condensation in polyelectrolyte solutions. IV. The approach to the limit and the extraordinary stability of the charge fraction, Biophys. Chem. 7, 95 - 102.
Manning, G.S. (1978), The molecular theory of polyelectrolyte solutions with applications to electrostatic properties of polynucleotides, Q. Rev. Biophys. 11, 179 - 246.
Manning, G.S. (1981), Limiting laws and counterion condensation in polyelectrolyte solutions. VII. Electrophoretic mobility and conductance. J. Phys. Chem. 85, 1506 - 1515.
Merta, J. and Stenius, P. (1995), Interactions between cationic starch and anionic surfactants. 1. Phase equilibria and surface temsions. Colloid Polym. Sci. 273, 974 - 983.
Merta, J. and Stenius, P.(1997), Interactions between cationic starch and anionic surfactants 2. Viscosity and aggregate size in dilute solutions. Colloids Surfaces A: Physicochem. Eng. Aspects 122, 243 - 255.

102
Merta, J., Pirttinen, E., Stenius, P. (1999), Interactions between cationic starch and anionic surfactants. III. Rheology and structure of the complex phase. J. Dispersion Sci. and Techn. 20, 677 - 697.
Merta, J. and Stenius, P. (1999), Interactions between cationic starch and mixed anionic surfactants. Colloids Surfaces A: Physicochem. Eng. Aspects 149, 367 - 377.
Mitchell, D. J. and Ninham, B. W. (1981), Micelles, vesicles and microemulsions, J. Chem. Soc. Faraday Trans. 2, 77, 601 - 629.
Mukerjee, P. (1965), Dimerization of anions of long chain fatty acids in aqueous solutions and hydrophobic properties of the acids, J. Phys. Chem 69, 2821 - 2827.
Mukerjee, P. and Mysels, K. J. (1971), Critical Micelle Concentration of Aqueous Surfactant Systems, NSRDS-NBS 36, National Bureau of Standards, Washington D. C. , 1971.
Murata, M. and Arai, H. (1973), The interaction between polymer and surfactant. The effect of temperature and added salt on interaction between poly(vinylpyrrolidone) and sodium dodecyl sulfate, J. Colloid Interface Sci. 44, 475 - 480.
Musabekov, K. B. , Omarova, K. I. and Izimov, A. I. (1983), Modification of quartz surface with aqueous solutions of polyelectrolytes and surface active substances, Acta Phys. Chem. 29, 89 - 100.
Nagarajan, R. and Kalpakci, B. (1982), Viscosimetric investigation of complexes between polyethylene oxide and surfactant micelles, Polym. Prepr. Am. Chem. Soc. Div. Polym. Chem. 23, 41 - 42.
Nicolai, T. and Mandel, M. (1989), Dynamic light scattering by aqueous solutions of low molecular mass DNA fragments in the presence of NaCl, Macromolecules 22, 2348 - 2356.
Ober, C.K. and Wegner, G. (1997) Polyelectrolyte-surfactant complexis in solid state: Facile building blocks for self-organizing materials. Adv. Mater. 9, 17 - 31.
Odijk, T. (1978), On the theory of the excluded-volume effect of a polyelectrolyte in a 1-1 electrolyte solution, J. Polym. Sci. Polym. Phys. Ed. 16, 627 - 639.

103
Ostanevich, Y. M. (1988), Time-of-flight small-angle scattering spectrometers on pulsed neutron sources. Makromol. Chem. Macromol. Symp. 15, 91 - 103.
Pecora, R., ed. (1985), Dynamic Light Scattering : Applications of Photon Correlation Spectroscopy, Plenum Press, New York, 1985.
Pedersen, J. S., Posselt, D., Mortensen, K. J. (1990) Analytical treatment of the resolution function of small-angle scattering. J. Appl. Cryst. 23, 321 - 333.
Penfold J., Staples E., Thompson L., Tucker I.; Hinea J.; Thomas R. K.; Lu J.R. (1995), Solution and adsorption behavior of the mixed surfactant system sodium dodecyl sulfate/n_hexaethylene glycol monododecyl ether. Langmuir 11, 2496 - 2503.
Penfold, J., Staples, E., Tucker, I. (1996), Study of partitioning in mixed surfactant systems, by neutron scattering techniques. Adv. Colloid Interface Sci. 68, 31 - 55.
Piculell, L.and Lindman, B. (1992), Association and segregation in aqueous polymer/polymer, polymer/surfactant and surfactant/surfactant mixtures: similarities and differences, Adv. Coll. Interface Sci. 41 149 - 178.
Pilsl, H., Hoffmann, H., Hoffmann, J., Kalus, J., Kencono, A. W., Lindner, P., Ulbricht, W. (1993), Shape investigation of mixed micelles by small angle neutron scattering. J. Phys. Chem. 97, 2745 - 2754.
Prowencer, S. W. (1982), Contin: A general purpose constrained regularization program for inverting noisy linear algebraic and integral equations, Comput. Phys. Commun. 27, 229 - 242.
Ranganathan, S. and Kwak, J. T. C. (1996), Effect of polymer charge density on the phase behavior of sodium poly(acrylate_co_acrylamide)_DTAB systems. Langmuir 12, 1381 - 1390.
Rappennecker, G. and Zugenmaier, P. (1981) Detailed refinement of the crystal structure of Vh-amylose. Carbohydr. Res. 89, 11 - 19.
Robb, I. D. (1981), Polymer/surfactant interactions, in Anionic Surfactants - Physical Chemistry of Surfactant Action, Surfactant Sci. Ser., vol. 11, Lucassen-Reynders, E. , ed. , Marcel Dekker, New York, 1981, chap. 3.
Ruppelt, D., Kötz, J., Jaeger, W., Friberg, S.E., MacKay, R. (1997), Influence of cationic polyelectrolytes on structure formation in lamellar liquid crystalline systems. Langmuir 13, 3316 - 3319.

104
Saito, S. (1991), Polymer-surfactant interactions, in Nonionic Surfactants, Schick, M.J., ed. , Marcel Dekker, New York, 1991, 189.
Satake, I., Takahashi, T. , Hayakawa, K , Maeda, T. and Aoyagi, M. (1990), Effect of charge density on the cooperative binding isotherm of surfactant ion to polyelectrolyte, Bull.Chem. Soc. Jpn. 63, 926 - 928.
Schmitz, K. S. (1990), An Introduction to Dynamic Light Scattering by Macromolecules, Academic Press, San Diego, 1990.
Schurr, J. M. and Schmitz, K. S. (1986), Dynamic light scattering studies of biopolymers: effects of charge, shape and flexibility, Annu. Rev. Phys. Chem. 37, 271 - 305.
Sedlak, M. and Amis, E. J. (1992), Concentration and molecular weight-regime diagram of salt-free polyelectrolyte solutions as studied by light scattering, J. Chem. Phys. 96, 826 - 834.
Shuhrmann, H.B.; Burkhardt, N.; Dietrich; G.; Jünemann, R.; Meerwinck, W.; Schmitt, M.; Small-Angle X-ray Scattering; Glatter, O.; Kratky, O., Eds.; Academic Press: New York, 1982.
Smits, R. G., Kuil, M. E. and Mandel, M. (1993), Molar mass and ionic strength dependence of the apparent diffusion coeffient of a flexible polyelectrolyte at dilute and semidilute concentrations: linear poly(ethylenimine), Macromolecules 26, 6808 - 6816.
Snape, C. E., Morrison, W. R. , Marato-Valer, M. M. , Karkalas, J. and Pethrick, R. A. (1998), Solid state c nmr investigation of lipid ligands in v_amylose inclusion complexes. Carbohydrate Polymers 36, 225 - 237.
Sokolov, E.L., Yeh, F., Khokhlov, A. and Chu. B. (1996), Nanoscale supramolecular ordering in gel-surfactant complexes: sodium alkyl sulfates in poly(diallymethylammoinium chloride, Langmuir 12, 6229 - 6234.
Sokolov, E.L., Yeh, F., Khokhlov, A., Grinberg, V.Y. and Chu. B. (1998), Nanostructure formation in polyelectrolyte-surfactant complexes. J. Phys. Chem. B 102, 7091 - 7098.
Stigter, D. (1974), Micelle formation in ionic surfactants. II. Specificity of the head groups, micelle structure, J. Phys. Chem. 78, 2480 - 2485.

105
Tadros, Th. F. (1974), The interaction of cetyltrimethylammonium bromide and sodium dodecylbenzen e sulfonate with polyvinyl alcohol. Adsorption of the polymer-surfactant complexes on silica, J. Colloid Interface Sci. 46, 528 - 540.
Taupin, D. and Luzzati, V. (1982) Information content and retrieval in solution scattering studies: 1. Degrees of freedom and data reduction, J. Appl. Cryst. 15, 289 - 300.
Thalberg, K. and Lindman, B. (1989), Interaction between hyalouran and cationic surfactants, J. Phys. Chem. 93, 1478 - 1483.
Thalberg, K., Lindman, B. and Karlström, G. (1990a) , Phase diagram of a system of cationic surfactant and anionic polyelectrolyte: tetradecyltrimethylammonium bromide - hyalouran -water, J. Phys. Chem. 94, 4289 - 4295.
Thalberg, K. (1990b), Polyelectrolyte-surfactant interactions, University of Lund, Lund 1990.
Thalberg, K., van Stam, J. , Lindblad, C. , Almgren, M. and Lindman, B.(1991 a) , Time-resolved fluorescence and self-diffusion studies in systems of cationic surfactant and an anionic polyelectrolyte, J. Phys. Chem. 95, 8975 - 8982.
Thalberg, K. and Lindman, B.(1991b) , Gel formation in aqueous systems of a polyanion and an oppositely charged surfactant, Langmuir 7, 277 - 283.
Thalberg, K., Lindman, B. and Bergfeld, K. (1991c), Phase behavior of systems of polyacrylate and cationic surfactant, Langmuir 7, 2893 - 2898.
Thalberg, K., Lindman, B. and Karlström (1991d), G., Phase diagram of systems of cationic surfactant and anionic polyelectrolyte: influence of surfactant chain length and polyelectrolyte molecular weight, J. Phys. Chem. 95, 3370 - 3376.
Thalberg, K., Lindman, B. and Karlström, G. (1991e), Phase diagram of systems of cationic surfactant and anionic polyelectrolyte: the effect of salt, J. Phys. Chem. 95, 6004 - 6011.
Tomasik, P., Wang, V. and Jane, J. (1995), Complexes of starch with dioic acids. Starch 47, 91- 95.
van de Steeg, H.G.M. (1992), Cationic Starches on Cellulose Surfaces, University of Wageningen, Netherlands 1992.
106
Verwey, E. J. W.; Overbeek, J. Th. G., Theory of the Stability of Lyophobic Colloids; Elsevier: Amsterdam, 1948.
Vold, R. D. (1939) The phase rule behavior of concentrated aqueous systems of a typical colloidal electrolyte: sodium oleate. J. Phys. Chem. 43, 1213 - 1231.
Wallin, T. and Linse, P. (1996), Monte Carlo simulations of polyelectrolytes at charged micelles. 2. Effects of linear charge density. J. Phys. Chem. 100, 17873 - 17880.
Wallin, T. and Linse, P. (1997), Monte Carlo simulations of polyelectrolytes at charged micelles. 3. Effects of surfactant tail length. J. Phys. Chem. B 101, 5506 - 5513.
Wang, L., Garner, M. M. and Yu, H.(1991), Self-diffusion and cooperative diffusion of a rodlike DNA fragments, Macromolecules 24, 2368 - 2376.
Wadzack, J., Willumeit, R., Zhao, J., Nierhaus, K.H. (1995) Proton- and deuteron spin targets in biological research, Nucl. Instr. Meth. A356, 124 -132.
Wenzel, A. and Antonietti, M. (1997), Superstructures of lipid bilayers by complexation with helical biopolymers. Adv. Mater. 9, 487 - 490.
Wignall, G.D. and Bates, F.S., (1986) Absolute calibration of small-angle neutron scattering data J. Appl. Cryst. 20, 28 - 40.
Yamamoto, M., Sano, T., Harada, S. and Yasunaga, T. (1983) Cooperativity in binding of sodium dedecyl sulfate to amylose. Bull. Chem. Soc. Jpn. 56, 2643 - 2646.
Zhang, K., Jonströmer, M. and Lindman, B. (1994a), Self-assembly in concentrated polymer- surfactant systems - a self-diffusion study of a non-ionic random copolymer - non-ionic surfactant - water system, Colloids Surfaces 87, 133 - 142.
Zhang, K., Karlström, K. and Lindman, B. (1994b), Ternary aqueous mixtures of a nonionic polymer with a surfactant or a second polymer. A theoretical and experimental investigation of the phase behavior, J. Phys. Chem. 98, 4411 - 4421.
Zhang, K. Jonströmer, M. and Lindman, B. (1994c), Interaction between nonionic micelles and a nonionic polymer studied by Fourier transform NMR self-diffusion, J. Phys. Chem. 98, 2459 - 2463.

107
Zhang, K., Carlsson, M., Linse, P. and Lindman, B. (1994d), Phase behavior of copolymer- homopolymer mixture in aqueous solution, J. Phys. Chem. 98, 2452 - 2458.
Zhen, Z. and Tung, C.-H. (1992),, Interaction of sodium carboxymethylamylose with aqueous surfactants in both the presence and the absence of added salt: mixed micelles and inclusion complexes. Polymer 33, 812 - 816.
Zhou, S., Burger, C., Yeh, F., Chu, B (1998), Charge density effect of polyelectrolyte chains on the nanostructures of polyelectrolyte surfactant complexes, Macromolecules 31, 8157 - 8163.
Zhou, S., Yeh, F., Burger, C.; Chu, B.(1999), Formation and transition of highly ordered structures of polyelectrolyte-surfactant complexes. J. Phys. Chem. B 103, 2107 - 2112.
LABORATORY OF FOREST PRODUCTS CHEMISTRY REPORTS, SERIES A 1. Laine, J.,
Surface properties of unbleached kraft pulp fibres, determined by different methods. 142 p. 1994.
2. Merta, J., Interactions between Cationic Starch and Anionic Surfactants. 148 p. 1995.
3. Heimonen, J., The effect of coating components and fillers in the flotation deinking of paper. 148 p. 1995.
4. Mitikka-Eklund, M.,
Sorption of xylans on cellulose fibres. 84 p. 1996.
5. Laurila, M., The adsorption of nonionic surfactants and polyacrylate on talc. 104 p. 1996.
6. Kekkonen, J.,
Adhesional properties of polyamide 6 fibers used in press felts. 167 p. 1996. 7. Laine, J.,
The effect of cooking and bleaching on the surface chemistry and charge properties of kraft pulp fibres. 199 p. 1996. 8. Vikkula, A.,
Hemicelluloses in kraft cooking liquor. 81 p. 1999. 9. Pirttinen, E.,
The effect of deinking chemicals in flotation deinking of paper. 50 p. 1999. 10. Vyörykkä, J.,
Konfokaali-raman-spektrometrin käyttö paperin päällysteen syvyyssuuntaiseen analysointiin. 83 p. 1999. 11. Saarinen, T.,
The surface properties of gels formed by cationic starch and surfactants. 109 p. 2000. 12. Merta, J.,
Interactions between cationic starch and anionic surfactants. 107 p. 2001.
ISBN 951-22-5328-3 ISSN 1457-1382