inter -american tropical tuna commission …aquaticcommons.org/2627/1/vol.2_no.2_bilingual.pdf ·...
TRANSCRIPT

INTER -AMERICAN TROPICAL TUNA COMMISSION
COMISION INTERAMERICANA DEL ATUN TROPICAL
Bulletin - Boletín
Vol. 11, No. 2
A STUDY OF THE EASTERN PACIFIC FISHERY FOR TUNA BAITFISHES, WITH PARTICULAR REFERENCE TO THE
ANCHOVETA (CETENGRAULlS MYSTICETUSJ
ESTUDIO DE LA PESQUERIA DE PECES DE CARNADA PARA EL ATUN EN EL PACIFICO ORIENTAL, CON PARTICULAR
REFERENCIA A LA ANCHOVETA (CETENGRAULlS MYSTlCETUS J
by - por
FRANKLIN G. ALVERSON and - y BELL M. 5HIMADA
La Jolla, California
1957
INTER -AMERICAN TROPICAL TUNA COMMISSION
COMISION INTERAMERICANA DEL ATUN TROPICAL
Bulletin - Boletfn
Vol. II, No.2
A STUDY OF THE EASTERN PACIFIC FISHERY FOR TUNABAITFISHES, WITH PARTICULAR REFERENCE TO THE
ANCHOVETA (CETENGRAULIS MYSTICETUSJ
ESTUDIO DE LA PESQUERIA DE PECES DE CARNADA PARAEL ATUN EN EL PACIFICO ORIENTAL, CON PARTICULAR
REFERENCIA A LA ANCHOVETA (CETENGRAULISMYST'CETUS J
by - por
FRANKLIN G. ALVERSON and - y BELL M. SHIMADA
La Jollar California
1957
25
CONTENTS - INDICE
ENGLISH VERSION - VERSION EN INGLES
Page
Acknowledgements . .... .... ..... 25
The fishery for tuna baitfishes.......................................
Origin and
Methods of catching live Dan.................................. _
Kinds of tuna baitfishes and baiting localities....
Total catch of baitfishes _ _..................
Sources and tabulation of data .
. . 25 25
. 27
28
... 31
31_ _ _......................
Actual and estimated catches by California baitboats keeping logs. 32
Estimated total catch by the entire California tuna fishing fleet.. _ 33
Comparison of logged bait catches, estimated catches of vessels keeping logs, and estimated total catch _ _ _ 33
Estimated total catches by species and area _ 34
Relationship between total catch of yellowfin and skipjack tuna and the total catch of baitfishes _.. 34
The effects of the tuna-bait fishery upon the populations of the Eastern Pacific 35
Consideration of the effects of baiting upon the populations of California sardine, Northern anchovy, Southern anchovy, and Galapago's sardine__ __ 35
Consideration of the effects of baiting upon the populations of anchoveta _ _ 36 Population structure.. _. __ _ __ _ 36
Abundance _._ _ _ _ _ _ _ 36
Total ca~cIl _ _ _ _ _ 37
Total relative fishing intensity._ _ _ _ 37
Relationship between abundance and fishing intensity _ _ 37
38
FIGURES - ILUSTRACIONES._ __ _._ 39
TABLES - TABLAS __ _ _._._ _ __ 46
SPANISH VERSION - VERSION EN ESPAÑOL
Página
62
Reconocimiento _ _ _ _ _. . _62
La pesquería de peces de carnada._ __ _. . _.. __ 62
Origen y desarrollo._........ _ _ _ _...... . 62
Métodos para la pesca de carnada viva........................................................... . 64
Clases de peces de carnada para el atún y localidades en que se pescan._ 65
CONTENTS - INDICE
ENGLISH VERSION - VERSION EN INGLES
Introduction _ .
Acknowledgements .
The fishery for tuna baitfishes
Origin and developmenL .
Methods of catching live baiL .
Kinds of tuna baitfishes and baiting localities....
Page
25
. .. 25
.............. 25
25
.... 27
28
Total catch of baitfishes........................................................ .... 31Sources and tabulation of data..................... 31
Actual and estimated catches by California baitboats keeping logs. 32
Estimated total catch by the entire California tuna fishing fleeL 33
Comparison of logged bait catches, estimated catches of vessels keeping logs,and estimated total catch _....................... 33
Estimated total catches by species and area..... 34
Relationship between total catch of yellowfin and skipjack tuna and the totalcatch of baitfishes 34
The effects of the tuna-bait fishery upon the populations of the Eastern Pacificbaitfishes 35
Consideration of the effects of baiting upon the populations of Californiasardine, Northern anchovy, Southern anchovy, and Galapagoos sardine 35
Consideration of the effects of baiting upon the populations of anchoveta 36Population structure............................. . 36
Abundance...... . 36Total catch 37
Total relative fishing intensity..................... 37
Relationship between abundance and fishing intensity............................ 37
Conclusions .
FIGURES - ILUSTRACIONES__ .
TABLES - TABLAS __ _ .
................................................................... , 38
. _ _ _ _._._._ 39
. __ 46
SPANISH VERSION - VERSION EN ESPANOL
Introducci6n._ .
Reconocimiento .
Pagina
.._ _ __ 62
._ _62
La pesqueria de peces de carnada__ _ _ _................. 62
Origen y desarrollo .__ . _. __ ._ _.......... . 62
Metodos para la pesca de carnada viva _.._........... 64
Claoses de peces de carnada para el atun y localidades en que se pescan._ 65

CONTENTS - INDICE (Confinued)
Página
Pesca total de peces de carnada....................................... . . 69 Origen y tabulación de los datos.................................. . . . 69 Pescas reales y pescas estimadas de los barcos de carnada de California que
llevan registros de bitácora 70
Estimación de la pesca total efectuada por toda la flota atunera de California 71 E'studio comparativo de las pescas de carnada anotadas en los registros de
bitácora, de las pescas estimadas correspondientes a los barcos que llevan registros y de la pesca total estimada . 71
Relación entre la pesca total de atún aleta amarilla y barrilete, y la pesca
Efectos de la pesquería de carnada para el atún sobre las poblaciones de peces-
Consideración sobre el efecto de la pesca en las poblaciones de la sardina de
Consideración sobre los efectos de la captura de carnada en las poblaciones
Estimación de las pescas totales por especies y por áreas . 72
total de peces de carnada . 73
cebo del Pacífico OrientaL . 73
California, anchoa nórdica, anchoa sureña y sardina de las Galápagos 73
de anchoveta......... . " '" 74 Estructura de la población................................. . . 75
75
Pesca totaL 76
Intensidad total de la pe-sca 76
Relación entre la abundancia y la intensidad de la pesca 76
78
LITERATURE CITED - BIBLIOGRAFIA CITADA 78
CONTENTS - INDICE (Continued)
71
72
Pagina
6969
Pesca total de peces de carnada......................................... . .
Origen y tabulacion de los datos.................................. . . .
Pescas reales y pescas estimadas de los barcos de carnada de California quellevan registros de bitacora 70
Estimacion de la pesca total efectuada por toda la flota atunera de California 71E'studio comparativo de las pescas de carnada anotadas en los registros de
bitacora, de las pescas estimadas correspondientes a los bareos que llevanregistros y de la pesca total estimada .
Estimacion de las pescas totales por especies y por areas .
Relacion entre la pesca total de atun aleta amarilla y barrilete, y la pescatotal de peces de carnada 73
Efeetos de la pesqueria de carnada para el atun sobre las poblaciones de peces-cebo del Pacifico OrientaL 73
Consideracion sobre el efecto de la pesca en las poblaciones de la sardina deCalifornia, anchoa nordica, anchoa surefia y sardina de las Galapagos............ 73
Consideracion sobre los efectos de la captura de carnada en las poblacionesde anchoveta.......... 74
Estructura de la poblacion................................. 75Abundancia.......................... 75
Pesca totaL 76
Intensidad total de la pooca..................... . 76
Relacion entre la abundancia y la intensidad de la pesca...... .. 76
Conclusiones................................................................................................ 78
LITERATURE CITED - BIBLIOGRAFIA CITADA 78


A STUDY OF THE EASTERN PACIFIC FISHERY FOR TUNA
BAITFISHES, WITH PARTICULAR REFERENCE TO THE
ANCHOVETA (CETENGRAULlS MYSTlCETUS)
by
Franklin G. Alverson and Bell M. Shimada
INTRODUCTION
Most of the catches of yellowfin and skipjack tuna from the Eastern Pacific Ocean are made by vessels fishing with poIes and lines and live bait. From 1931 to 1954, these baitboats, on the average, accounted for over three-fourths of the total annual California landings of yellowfin and skipjack (Shimada and Schaefer, 1956). With the substantial increase in recent years in the production of the tropical tunas, there have been greater demands for live bait. This increased need for larger amounts of baitfishes has given rise to important questions relating to the manner in which these populations may be most wisely used. The Inter-American Tropical Tuna Commission has been concerned with various aspects of this problem since its establishment in 1950.
This report presents sorne of the results obtained from the Commission's studies of the baitfishes important to the fishery for yellowfin and skipjack tuna. It traces briefly the origin and development of the bait fishery, describes its operations, extent, and yield, and discusses sorne aspects of the efrects of exploitation upon the Eastern Pacific baitfish populations, particularly of the anchoveta (Cetengmulis mysticetus).
ACKNOWLEDGEMENTS
Sincere appreciation is expressed to owners and masters of tuna vesseIs who cooperated by making their fishing records available for study.
THE FISHERY FOR TUNA BAITFISHES
Origin and development
It is difficult to determine exactly how and when the use of live bait carne to be an accepted means of catching tunas in the Eastern Pacific region, but is known from recorded accounts (Pacific Fisherman, 1913) that as early as 1910 albacore tuna were being caught off California by fishermen using handlines baited with live sardines. These handlines were replaced in time by bamboo poles and lines, and the technique of scattering live bait on the surface of the water to attract and induce fish to strike at
25
A STUDY OF THE EASTERN PACIFIC FISHERY FOR TUNA
BAITFISHES, WITH PARTICULAR REFERENCE TO THE
ANCHOVETA (CETENGRAULIS MYSTICETUS)
by
Franklin G. Alverson and Bell M. Shimada
INTRODUCTION
Most of the catches of yellowfin and skipjack tuna from the EasternPacific Ocean are made by vessels fishing with poles and lines and livebait. From 1931 to 1954, these baitboats, on the average, accounted forover three-fourths of the total annual California landings of yellowfinand skipjack (Shimada and Schaefer, 1956). With the substantial increasein recent years in the production of the tropical tunas, there have beengreater demands for live bait. This increased need for larger amounts ofbaitfishes has given rise to important questions relating to the manner inwhich these populations may be most wisely used. The Inter-AmericanTropical Tuna Commission has been concerned with various aspects ofthis problem since its establishment in 1950.
This report presents some of the results obtained from the Commission's studies of the baitfishes important to the fishery for yellowfin andskipjack tuna. It traces briefly the origin and development of the baitfishery, describes its operations, extent, and yield, and discusses someaspects of the effects of exploitation upon the Eastern Pacific baitfishpopulations, particularly of the anchoveta (Cetengmulis mysticetus).
ACKNOWLEDGEMENTS
Sincere appreciation is expressed to owners and masters of tunavessels who cooperated by making their fishing records available for study.
THE FISHERY FOR TUNA BAITFISHES
Origin and development
It is difficult to determine exactly how and when the use of live baitcame to be an accepted means of catching tunas in the Eastern Pacificregion, but is known from recorded accounts (Pacific Fisherman, 1913)that as early as 1910 albacore tuna were being caught off California byfishermen using handlines baited with live sardines. These handlines werereplaced in time by bamboo poles and lines, and the technique of scatteringlive bait on the surface of the water to attract and induce fish to strike at
25
26 ALVERSON AND SHIMADA
artificial lures was also adopted. These fishing methods were carried ayer to the catching of yellowfin and skipjack tuna about 1918, when the California fishery turned from albacore to the more tropical tuna species (Calif. Bur. Mar. Fish., 1949).
The development of the live-bait fishery went hand in hand with the growth and expansion of the yellowfin and skipjack fishery, the general features of which have already been described (Shimada and Schaefer, 1956). The fishery was still of a local nature in the late 1910's and so the first baiting areas were in Southern California, around San Pedro and San Diego. By the early part of the second decade the tropical tuna fishery had moved into Mexican waters as far south as Cape San Lucas (Fig. 1) and by 1925, when the first long-range tuna clipper went into operation, such areas along the Pacific coast of Baja California as Turtle Bay, Abreojos Point, Santa Maria Bay, and Cape San Lucas were established areas of baiting. The importance of Turtle Bay and Magdalena Bay (including adjoining Almejas Bay) increased stcadily as tuna fishing operations centered in these localities, and bait was also taken in limited quantities from numerous intermediate points along the Baja California coast. Baiting in Mexican territorial waters declined in importance, however, in the late 1920's because of large increases by the Mexican government in fees for bait permits. During this period, the Southern California area largely supported the needs of the tuna fishery for live bait.
The yellowfin and skipjack tuna fishery expanded rapidly to the south in the 1930's. This expansion was made possible, to a great extent, by the discovery of abundant bait supplies in tropical waters. From information provided by tuna fishermen and by the trade journal Pacific Fisherman (1931, 1932), it is known that the tuna clippers obtained bait during these years from Socorro Island in the Revilla Gigedo group, from Cocos Island, and from the Galapagos Islands. Mention is also made in these accounts of specific baiting localities along the mainland such as Ceralbo Island, Espiritu Santo Island, Kino Point, and Guayrnas in the Gulf of California; Banderas Bay; the Gulf of Nicoya; the Gulf of Fonseca; and the Gulf of Panama. By the outbreak of World War n, tuna clippers were baiting at various localities throughout their range from San Diego, California to Panama and offshore to the Galapagos Islands.
During the war the tuna fishing fleet was much curtailed in its activities; fishing and baiting were confined mostly to areas north of the Gulf of Tehuantepec. With the end of World War n and the subsequent increase in demand for tuna, the scope of the fishery again expanded southward. As a consequence, baiting activities also shifted in the same direction-down the Colombian coast in 1948, into the Gulf of Guayaquil, Ecuador in 1950, and finally, off northern Peru in 1953.
The present area over which baitfishes are taken by the yellowfin
26 ALVERSON AND SHIMADA
artificial lures was also adopted. These fishing methods were carried overto the catching of yellowfin and skipjack tuna about 1918, when theCalifornia fishery turned from albacore to the more tropical tuna species(Calif. Bur. Mar. Fish., 1949).
The development of the live-bait fishery went hand in hand with thegrowth and expansion of the yellowfin and skipjack fishery, the generalfeatures of which have already been described (Shimada and Schaefer,1956). The fishery was still of a local nature in the late 1910's and so thefirst baiting areas were in Southern California, around San Pedro and SanDiego. By the early part of the second decade the tropical tuna fishery hadmoved into Mexican waters as far south as Cape San Lucas (Fig. 1)and by 1925, when the first long-range tuna clipper went into operation,such areas along the Pacific coast of Baja California as Turtle Bay,Abreojos Point, Santa Maria Bay, and Cape San Lucas were establishedareas of baiting. The importance of Turtle Bay and Magdalena Bay (including adjoining Almejas Bay) increased steadily as tuna fishing operationscentered in these localities, and bait was also taken in limited quantitiesfrom numerous intermediate points along the Baja California coast.Baiting in Mexican territorial waters declined in importance, however, inthe late 1920's because of large increases by the Mexican government infees for bait permits. During this period, the Southern California arealargely supported the needs of the tuna fishery for live bait.
The yellowfin and skipjack tuna fishery expanded rapidly to the southin the 1930's. This expansion was made possible, to a great extent, by thediscovery of abundant bait supplies in tropical waters. From informationprovided by tuna fishermen and by the trade journal Pacific Fisherman(1931, 1932), it is known that the tuna clippers obtained bait during theseyears from Socorro Island in the Revilla Gigedo group, from Cocos Island,and from the Galapagos Islands. Mention is also made in these accounts ofspecific baiting localities along the mainland such as Ceralbo Island,Espiritu Santo Island, Kino Point, and Guaymas in the Gulf of California;Banderas Bay; the Gulf of Nicoya; the Gulf of Fonseca; and the Gulf ofPanama. By the outbreak of World War II, tuna clippers were baiting atvarious localities throughout their range from San Diego, California toPanama and offshore to the Galapagos Islands.
During the war the tuna fishing fleet was much curtailed in itsactivities; fishing and baiting were confined mostly to areas north of theGulf of Tehuantepec. With the end of World War II and the subsequentincrease in demand for tuna, the scope of the fishery again expandedsouthward. As a consequence, baiting activities also shifted in the samedirection-down the Colombian coast in 1948, into the Gulf of Guayaquil,Ecuador in 1950, and finally, off northern Peru in 1953.
The present area over which baitfishes are taken by the yellowfin
27 TUNA BAITFISHES
and skipjack tuna fishing fleet extends from southern California to northern Peru and to the outlying Galapagos Islands.
Meihods of caiching live baH
The baitfishes generally occur in coastal waters. Within territorial waters they are considered to be the property of the adjacent coastal state. The privilege of drawing upon bait populations in Latin America is usually obtained by American tuna fishermen through the purchase of baiting licenses. The cost of these licenses varies from country to country but is generally based upon a fixed fee per unit size of vessel. The sale of these permits provides substantial dollar revenue to sorne Latin-American countries.
The clippers normally go into shallow areas, usually not more than 30 fathoms deep, to obtain bait although it is sometimes taken over deeper water and far offshore. Large encircling nets called "lampara nets" are used to capture the baitfish. A clipper may carry several of these nets ranging in length from 80 to 150 fathoms. The size of the net used and sorne details of its construction depend upon the species to be caught and conditions on the baiting grounds.
The "lampara net", which consists of two wings of large-mesh webbing on either side of a small-mesh bag, is set from a large skiff which is towed around the school of bait by a power boato The free end of the net is anchored by a small skiff during this operation. When the circle is completed, the free end of the net is taken aboard the large skiff and both wings are pulled aboard so that the bag opens out and a shelf of fine-mesh netting is drawn under the fish. The small skiff is positioned to support the far side of the bag and the area of the net is reduced as the wings are pulled in. As the near edges of the bag are brought aboard the large skiff, the bait is completely enclosed in a small pocket of webbing. Depths permitting, the baitboat then comes alongside to take the baitfish aboard. Otherwise, the bait is transferred from the net into a collapsible live-bait box, called a "receiver", which is towed out to the waiting clipper in deep water. There, the bait is loaded by means of small dipnets called "scoops" into large tanks, or "wells", through which sea water is circulated continuously. The amount of bait held by a scoop is the fishermen's unit of measure and is equivalent, on the average, to about 8 pounds of bait.
The bait-carrying capacity of a tuna clipper is determined mainly by its size and the number of live-wells that it has. A large clipper of about 350 tons capacity may carry as many as 5,500 scoops of bait at one time. During the course of one trip, it is not unusual for a vessel to use two or three loads of bait.
The manner in which live bait is used on the fishing grounds for catching tunas has been described by Godsil (1938). Although his account
TUNA BAITFISHES 27
and skipjack tuna fishing fleet extends from southern California to northern Peru and to the outlying Galapagos Islands.
Methods of catching live bail
The baitfishes generally occur in coastal waters. Within territorialwaters they are considered to be the property of the adjacent coastal state.The privilege of drawing upon bait populations in Latin America is usuallyobtained by American tuna fishermen through the purchase of baitinglicenses. The cost of these licenses varies from country to country but isgenerally based upon a fixed fee per unit size of vessel. The sale ofthese permits provides substantial dollar revenue to some Latin-Americancountries.
The clippers normally go into shallow areas, usually not more than 30fathoms deep, to obtain bait although it is sometimes taken over deeperwater and far offshore. Large encircling nets called "lampara nets" areused to capture the baitfish. A clipper may carry several of these netsranging in length from 80 to 150 fathoms. The size of the net used andsome details of its construction depend upon the species to be caught and .conditions on the baiting grounds.
The "lampara net", which consists of two wings of large-mesh webbingon either side of a small-mesh bag, is set from a large skiff which is towedaround the school of bait by a power boat. The free end of the net isanchored by a small skiff during this operation. When the circle is completed, the free end of the net is taken aboard the large skiff and bothwings are pulled aboard so that the bag opens out and a shelf of fine-meshnetting is drawn under the fish. The small skiff is positioned to supportthe far side of the bag and the area of the net is reduced as the wings arepulled in. As the near edges of the bag are brought aboard the large skiff,the bait is completely enclosed in a small pocket of webbing. Depthspermitting, the baitboat then comes alongside to take the baitfish aboard.Otherwise, the bait is transferred from the net into a collapsible live-baitbox, called a "receiver", which is towed out to the waiting clipper in deepwater. There, the bait is loaded by means of small dipnets called "scoops"into large tanks, or "wells", through which sea water is circulated continuously. The amount of bait held by a scoop is the fishermen's unit ofmeasure and is equivalent, on the average, to about 8 pounds of bait.
The bait-carrying capacity of a tuna clipper is determined mainly byits size and the number of live-wells that it has. A large clipper of about350 tons capacity may carry as many as 5,500 scoops of bait at one time..During the course of one trip, it is not unusual for a vessel to use two orthree loads of bait.
The manner in which live bait is used on the fishing grounds forcatching tunas has been described by Godsil (1938). Although his account

28 ALVERSON AND SHIMADA
was written a number of years ago, essentially the sarne methods are used today; no attempt will, therefore, be made here to describe these techniques.
Kinds of tuna baitfishes and baiiing localiiies
A number of species of fish are uscd as live bait in fishing for tuna. Nearly all of these belong to the herring and anchovy families and are, characteristically, small schooling fishes which occur abundantly in inshore waters. The most important baitfishes are the anchoveta (Cetengraulis mysticetus) J the California and Galapagos sardines (Sardinops caerulea and S. sagax)J and the northern and southern anchovies (Engraulis mordax and E. ringens). The principal baiting areas for these species are shown in Figure 2.
Anchoveta (Cetengraulis mysticetus)
The anchoveta, a tropical anchovy which is found from about central Baja California to northern Peru (Peterson, 1956), is the most important of the tuna-bait species because of its wide distribution, its wide range of temperature tolerance, and its ability to live well in the tanks of the fishing vessels.
The main baiting grounds for anchovetas are Almejas Bay in Baja California; Guaymas and Ahorne Point in the Gulf of California; the Gulf of Fonseca; and the Gulf of Panama in Central America (Figs. 1 and 2). In these areas anchovetas are caught in appreciable nurnbers at one season or another throughout the year. The Gulf of Guayaquil also supports a large population, but these waters have been closed to baiting since 1952 by the Ecuadorian governrnent. Other localities where anchovetas are taken in fair quantities in sorne years are Banderas Bay in Mexico, Montijo Bay in Panama, and coastal areas in the vicinity of Buenaventura, Colombia. The Gulf of Nicoya, in Costa Rica, was a very important baiting area for anchovetas until 1947 when the abundance of this species declined abruptly. This sudden decline is reported to have coincided with a heavy bloom of "red water", presumably of the dinoflagellate Gymnodinium (Schaefer, 1954; Peterson, 1956). Whatever the causes, by 1949 the Nicoya population of anchovetas had apparently disappeared. In 1953 the Cornmission attempted to re-establish this population by transplanting half a million sexually maturing anchovetas frorn Panama to the Gulf of Nicoya (Schaefer, 1954). Prelirninary results from the experiment are encouraging; there are indications that sorne of the transplanted individuals reproduced successfully in Nicoya and have established a new resident population. Although the abundance of these anchovetas has been increasing slowly, the population is still (1956) too small to support commercial baiting.
28 ALVERSON AND SHIMADA
was written a number of years ago, essentially the same methods areused today; no attempt will, therefore, be made here to describe thesetechniques.
Kinds of tuna baiifishes and baiting localities
A number of species of fish are used as live bait in fishing for tuna.Nearly all of these belong to the herring and anchovy families and are,characteristically, small schooling fishes which occur abundantly in inshorewaters. The most important baitfishes are the anchoveta (Cetengraulismysticetus) J the California and Galapagos sardines (Sardinops caeruleaand S. sagax)J and the northern and southern anchovies (Engraulis mordaxand E. ringens). The principal baiting areas for these species are shownin Figure 2.
Anchoveta (Cetengraulis mysticetus)
The anchoveta, a tropical anchovy which is found from about centralBaja California to northern Peru (Peterson, 1956), is the most importantof the tuna-bait species because of its wide distribution, its wide range oftemperature tolerance, and its ability to live well in the tanks of the fishingvessels.
The main baiting grounds for anchovetas are Almejas Bay in BajaCalifornia; Guaymas and Ahome Point in the Gulf of California; the Gulfof Fonseca; and the Gulf of Panama in Central America (Figs. 1 and 2).In these areas anchovetas are caught in appreciable numbers at one seasonor another throughout the year. The Gulf of Guayaquil also supports alarge population, but these waters have been closed to baiting since 1952by the Ecuadorian government. Other localities where anchovetas are takenin fair quantities in some years are Banderas Bay in Mexico, Montijo Bayin Panama, and coastal areas in the vicinity of Buenaventura, Colombia.The Gulf of Nicoya, in Costa Rica, was a very important baiting area foranchovetas until 1947 when the abundance of this species declined abruptly.This sudden decline is reported to have coincided with a heavy bloom of"red water", presumably of the dinoflagellate Gymnodinium (Schaefer,1954; Peterson, 1956). Whatever the causes, by 1949 the Nicoya populationof anchovetas had apparently disappeared. In 1953 the Commission attempted to re-establish this population by transplanting half a millionsexually maturing anchovetas from Panama to the Gulf of Nicoya(Schaefer, 1954). Preliminary results from the experiment are encouraging; there are indications that some of the transplanted individualsreproduced successfully in Nicoya and have established a new residentpopulation. Although the abundance of these anchovetas has been increasing slowly, the population is still (1956) too small to support commercialbaiting.

29 TUNA BAITFISHES
Sardines (Sardinops caerulea and Sardinops sagax)
Two species of sardine, the California sardine (8. caerulea) and the Galapagos Island sardine (S. sagax) are taken in large amounts each year by the tuna fleet.
The southern range of the California sardine falls within the scope of California-based tuna fishing vessels, and this species is regularly taken for bait in the Southern California area in the vicinity of San Diego, along the outer coast of Baja California, and along the western side of the Gulf of California as far north as Santa Catalina Island. On rare occasions, sardines are caught by tuna fishermen on the eastern side of the Gulf. Records of capture are available for Guaymas, San Ignacio Farallon Island, and Ahorne Point.
The most important baiting grounds for California sardines are Cedros Island, Santa Maria Bay, and Magdalena Bay in Baja California, and around San Jose Island in the Gulf of California. Baiting for sardines usually takes place in these areas from July to November when tuna fishing is concentrated in "local" waters. Bait sardines are seldom carried to southern fishing grounds because of their limited ability to withstand temperature changes, but sorne baitboats have transported California sardines as far south as the Galapagos Islands by an offshore route along which temperatures more compatible to this species are encountered.
Although the Galapagos Islands are located at the equator, the environment is favorable in sorne areas for the existence of sardines because of the influences of the cold Peru Current and local upwelling. The sardine indigenous to these islands is S. sagax) which is the same species as that found off Peru and Chile. This sardine is by far the most important of all the baitfishes caught in the Galapagos Islands, and the largest quantities are taken from September through February. Although most of these sardines are expended on nearby fishing banks, Galapagos sardines are quite often used for fishing off Ecuador and northern Peru and sometimes, when water temperatures are favorable, off Central America.
Anchovies (Engraulis mordax and Engraulis ringens)
Two anchovies of the genus Engraulis are important as baitfish for catching tunas. These are the northern anchovy (E. mordax) and the southern anchovy (E. ringens).
The northern anchovy, which has been used as bait since the earliest days of the tuna fishery, is taken from San Diego, California to Cape Falso, at the southernmost extremity of Baja California. Major baiting centers for this species are Turtle Bay, Santa Maria Bay, Magdalena Bay, and in sorne years, San Quentin Bay and Abreojos Point. Like the California sardine, E. mordax is caught mainly during the summer and fall months, from
TUNA BAITFISHES 29
Sardines (Sardinops caerulea and Sardinops sagax)
Two species of sardine, the California sardine (8. caerulea) and theGalapagos Island sardine (S. sagax) are taken in large amounts each yearby the tuna fleet.
The southern range of the California sardine falls within the scope ofCalifornia-based tuna fishing vessels, and this species is regularly takenfor bait in the Southern California area in the vicinity of San Diego, alongthe outer coast of Baja California, and along the western side of the Gulfof California as far north as Santa Catalina Island. On rare occasions,sardines are caught by tuna fishermen on the eastern side of the Gulf.Records of capture are available for Guaymas, San Ignacio Farallon Island,and Ahome Point.
The most important baiting grounds for California sardines are CedrosIsland, Santa Maria Bay, and Magdalena Bay in Baja California, andaround San Jose Island in the Gulf of California. Baiting for sardinesusually takes place in these areas from July to November when tuna fishing is concentrated in "local" waters. Bait sardines are seldom carried tosouthern fishing grounds because of their limited ability to withstandtemperature changes, but some baitboats have transported Californiasardines as far south as the Galapagos Islands by an offshore route alongwhich temperatures more compatible to this species are encountered.
Although the Galapagos Islands are located at the equator, theenvironment is favorable in some areas for the existence of sardinesbecause of the influences of the cold Peru Current and local upwelling.The sardine indigenous to these islands is 8. sagax) which is the samespecies as that found off Peru and Chile. This sardine is by far the mostimportant of all the baitfishes caught in the Galapagos Islands, and thelargest quantities are taken from September through February. Althoughmost of these sardines are expended on nearby fishing banks, Galapagossardines are quite often used for fishing off Ecuador and northern Peruand sometimes, when water temperatures are favorable, off CentralAmerica.
Anchovies (Engraulis mordax and Engraulis ringens)
Two anchovies of the genus Engraulis are important as baitfish forcatching tunas. These are the northern anchovy (E. mordax) and thesouthern anchovy (E. ringens).
The northern anchovy, which has been used as bait since the earliestdays of the tuna fishery, is taken from San Diego, California to Cape Falso,at the southernmost extremity of Baja California. Major baiting centersfor this species are Turtle Bay, Santa Maria Bay, Magdalena Bay, and insome years, San Quentin Bay and Abreojos Point. Like the California sardine, E. mordax is caught mainly during the summer and fall months, from
30 ALVERSON AND SHIMADA
June through November, and is used almost exc1usively on adjacent tuna fishing grounds.
The expansion of the yellowfin and skipjack tuna fishery to waters off northern Peru, beginning about 1951, first brought the southern anchovy under exploitation as bait but it was not unti11953 that important quantities of this species were used by tuna fishermen. E. ringens has since continued to be an important baitfish for vessels fishing off northern Peru and southern Ecuador.
Most of the catches of the southern anchovy are made from September through January, and generally in the area from Cape Blanco, Peru to about 100 south latitude.
Herring (Opisthonema libertate and Harengula thrissina)
Three genera of herring, Opisthonema) Sardinella) and Ilisha) have been reported as contributing to the tuna-bait catch (Schaefer, 1953). More recent data indicate, however, that a species formerIy assigned to the genus Sardinella is more correctIy referred to the genus Harengula) and that only Opisthonema and Harengula are of importance as baitfish. Ilisha is taken as bait only infrequently and in very small quantities.
The herrings most frequently used for tuna-bait are Opisthonema libertate) often called "thread herring" because of its long filamentous dorsal ray, and H arengula thrissina. These fish are captured from San Diego Bay in California south to Peru and offshore to the Galapagos Islands. The thread herring appears to be the dominant of the two species in all areas where herring occur, and it is only in the Gulf of California that Harengula is taken in any appreciable quantity.
Salima (Xenocys jessiae)
The "salima" is the only non-c1upeoid fish of importance as tuna-bait. A spiny-rayed fish of the family Xenichthyidae, this species is restricted in distribution to the Galapagos Islands.
Miscellaneous baitfishes
A number of miscellaneous kinds of baitfishes are infrequently used by tuna fishermen. These are listed below, with their common names as applied by fishermen, and with their localities of capture.
Polydactylus sp.-"bobo". Santa Maria Bay, Baja California to the Gulf of Guayaquil, Ecuador.
Etrumeus sp.-"jap sardine". Baja California and the Galapagos Islands.
Anchoa sp.-"bloodless". Southern California to northern Peru and offshore to Galapagos Islands.
30 ALVERSON AND SHIMADA
June through November, and is used almost exclusively on adjacent tunafishing grounds.
The expansion of the yellowfin and skipjack tuna fishery to watersoff northern Peru, beginning about 1951, first brought the southernanchovy under exploitation as bait but it was not until 1953 that importantquantities of this species were used by tuna fishermen. E. ringens has sincecontinued to be an important baitfish for vessels fishing off northern Peruand southern Ecuador.
Most of the catches of the southern anchovy are made from Septemberthrough January, and generally in the area from Cape BIanco, Peru toabout 10 0 south latitude.
Herring (Opisthonerna libertate and Harengula thrissina)
Three genera of herring, Opisthonerna) Sardinella) and IZisha) havebeen reported as contributing to the tuna-bait catch (Schaefer, 1953).More recent data indicate, however, that a species formerly assigned tothe genus Sardinella is more correctly referred to the genus Harengula)and that only Opisthonerna and Harengula are of importance as baitfish.Ilisha is taken as bait only infrequently and in very small quantities.
The herrings most frequently used for tuna-bait are OpisthonemaZibertate) often called "thread herring" because of its long filamentousdorsal ray, and H arengula thrissina. These fish are captured from SanDiego Bay in California south to Peru and offshore to the GalapagosIslands. The thread herring appears to be the dominant of the two speciesin all areas where herring occur, and it is only in the Gulf of Californiathat Harengula is taken in any appreciable quantity.
Salima (Xenocys jessiae)
The "salima" is the only non-clupeoid fish of importance as tuna-bait.A spiny-rayed fish of the family Xenichthyidae, this species is restrictedin distribution to the Galapagos Islands.
Miscellaneous baitfishes
A number of miscellaneous kinds of baitfishes are infrequently usedby tuna fishermen. These are listed below, with their common names asapplied by fishermen, and with their localities of capture.
Polydactylus sp.-"bobo". Santa Maria Bay, Baja California to theGulf of GuayaqUil, Ecuador.
Etrumeus sp.-"jap sardine". Baja California and the GalapagosIslands.
Anchoa sp.-"bloodless". Southern California to northern Peru andoffshore to Galapagos Islands.

31 TUNA BAITFISHES
Xenistius californiensis-"salima". Baja California.
Chloroscombrus sp.-"pompano". Santa Maria Bay, Baja California to Gulf of Guayaquil, Ecuador.
Atherinops sp. - "smelt". Cedros Island and Turtle Bay, Baja California.
Pneumatophorus sp.-"mackerel". Cedros Island and Turtle Bay, Baja California.
Decapturus sp.-"Spanish mackerel". Banderas and Chipequa Bay, Mexico.
Trachurus sp.-"Spanish mackerel". Baja California and Galapagos Islands.
The accuracy with which tuna fishermen are able to identify baitfishes is indicated by the samples which they have collected and returned to the Commission for biological studies. A total of 464 such samples have been obtained since 1951 and a comparison has been made between our identifications and those recorded by the fishermen at the time of collection. The results show that there were very few discrepancies and these few were confined to the less-frequently used species.
TOTAL CATCH OF BAITFISHES
Sources and tabulation of data
The catching of baitfishes is a subordinate but integral part of the primary fishery for yellowfin and skipjack tuna, and its unique feature is that the bait catch is wholly expended at sea. The fishery for tuna baitfishes is, therefore, not pre-disposed to the easy collection of accurate records on the amounts and kinds of bait used by tuna fishermen and where these fishes are captured. The only source of information of this nature is the detailed observations kept by the fishermen in their logbooks. These data have been collected by the Commission since 1951 through the operations of its logbook system; usable information on baiting activities and their results have been obtained each year from over 85 percent of the baitboat fleet based in California ports, for all trips which resulted in catches consisting of two-thirds or more by weight of yellowfin and skipjack tuna. Sorne logbooks for earlier years, which sorne vessel masters had kept for their own use, have also been gathered. The data obtained are sufficient for estimating the abundance and yield of the important bait species since 1946 but are inadequate for earlier years.
From the analysis of these logbook records. for the series of years from 1946 through 1954, it was possible to determine for each trip, the number of days spent in obtaining bait, the areas of baiting and, in most cases, the amount of each kind of bait caught. In order that these data could be conveniently summarized for each year by geographicallocalities,
TUNA BAITFISHES 31
Xenistius califomiensis-"salima". Baja California.
Chloroscombrus sp.-"pompano". Santa Maria Bay, Baja Californiato Gulf of Guayaquil, Ecuador.
Atherinops sp. - "smelt". Cedros Island and Turtle Bay, BajaCalifornia.
Pneumatophorus sp.-"mackerel". Cedros Island and Turtle Bay, BajaCalifornia.
Decapturus sp.-"Spanish mackerel". Banderas and Chipequa Bay,Mexico.
Trachurus sp.-"Spanish mackerel". Baja California and GalapagosIslands.
The accuracy with which tuna fishermen are able to identify baitfishesis indicated by the samples which they have collected and returned to theCommission for biological studies. A total of 464 such samples have beenobtained since 1951 and a comparison has been made between our identifications and those recorded by the fishermen at the time of collection. Theresults show that there were very few discrepancies and these few wereconfined to the less-frequently used species.
TOTAL CATCH OF BAITFISHES
Sources and tabulation of data
The catching of baitfishes is a subordinate but integral part of theprimary fishery for yellowfin and skipjack tuna, and its unique feature isthat the bait catch is wholly expended at sea. The fishery for tuna baitfishes is, therefore, not pre-disposed to the easy collection of accuraterecords on the amounts and kinds of bait used by tuna fishermen andwhere these fishes are captured. The only source of information of thisnature is the detailed observations kept by the fishermen in their logbooks.These data have been collected by the Commission since 1951 through theoperations of its logbook system; usable information on baiting activitiesand their results have been obtained each year from over 85 percent ofthe baitboat fleet based in California ports, for all trips which resulted incatches consisting of two-thirds or more by weight of yellowfin and skipjack tuna. Some logbooks for earlier years, which some vessel masters hadkept for their own use, have also been gathered. The data obtained aresufficient for estimating the abundance and yield of the important baitspecies since 1946 but are inadequate for earlier years.
From the analysis of these logbook records. for the series of yearsfrom 1946 through 1954, it was possible to determine for each trip, thenumber of days spent in obtaining bait, the areas of baiting and, in mostcases, the amount of each kind of bait caught. In order that these datacould be conveniently summarized for each year by geographical localities,
32 ALVERSON AND SHIMADA
a statistical area system was established by dividing the range of the tuna bait fishery into 28 regions. These 28 areas are shown in Figure 3. On this chart, "Gulf of California E. Side", Area (9), includes aH the waters of the eastern side of the Gulf except Kino Point, Guaymas, and Ahorne Point, which are treated as separate areas because they are the principal centers of fishing for anchovetas in this general region. Under "Offshore Areas" have been tabulated the infrequent catches of baitfishes, usually sorne of the miscellaneous species, which are taken far out at sea, outside the normal baiting grounds.
Since vessels of different sizes have different baiting abilities, the large vessels, on the average, being more efficient than the smaHer ones, the logbook information was also grouped by vessel-size, using the same size-categories as employed by Shimada and Schaefer (1956) in their studies of the catch statistics of yellowfin and skipjack tuna. Six different vessel size-classes, based on tuna capacity, were employed: Class 1, fish capacity up to 50 tons; Class 2, 51-100 tons; Class 3, 101-200 tons; Class 4, 201-300 tons; Class 5, 301-400 tons; and Class 6, over 400 tons.
Actual and estimated catches by California baitboats keeping logs
For each year, by means of punch-card summarizations, the amount of effort logged by the several vessel size-classes and the resultant catch of bait, by species, were determined for each baiting area. The yearly catch of bait logged by California baitboats from 1946 to 1954 is tabulated in Table 1 by species and vessel size-class, for all areas combined.
Sometimes, in vessellogbooks, the number of days spent baiting in an area was recorded without the corresponding amounts or kinds of bait caught. It was, therefore, necessary to use the following procedure to estimate for each year, area, and size-class, the quantities of each kind of bait caught on aH logged days, including those [or which such information was missing:
1) In each area, the catch per day's baiting, by species, was caIculated for each vessel size-class by dividing the recorded amounts of bait of each species by the number of days required to make the catch;
2) The catch per day's baiting for each species, and size-class was then multiplied by the total number of days logged, including both baiting days when the catch was logged and those when it was not logged, for that species and size-class.
This gives for each area the estimated amount of bait, by species, taken by each vessel size-class for all baiting days logged. These amounts summed over aH days, size-classes, and areas, represent the total estimated quantities of each bait species taken during the year by vessels on trips for which logbook coverage was obtained. Summaries of the estimated catches by
32 ALVERSON AND SHIMADA
a statistical area system was established by dividing the range of the tunabait fishery into 28 regions. These 28 areas are shown in Figure 3. On thischart, "Gulf of California E. Side", Area (9), includes all the waters of theeastern side of the Gulf except Kino Point, Guaymas, and Ahome Point,which are treated as separate areas because they are the principal centersof fishing for anchovetas in this general region. Under "Offshore Areas"have been tabulated the infrequent catches of baitfishes, usually some ofthe miscellaneous species, which are taken far out at sea, outside thenormal baiting grounds.
Since vessels of different sizes have different baiting abilities, thelarge vessels, on the average, being more efficient than the smaller ones,the logbook information was also grouped by vessel-size, using the samesize-categories as employed by Shimada and Schaefer (1956) in theirstudies of the catch statistics of yellowfin and skipjack tuna. Six differentvessel size-classes, based on tuna capacity, were employed: Class 1, fishcapacity up to 50 tons; Class 2, 51-100 tons; Class 3, 101-200 tons; Class 4,201-300 tons; Class 5, 301-400 tons; and Class 6, over 400 tons.
Actual and estimated catches by California baiiboats keeping logs
For each year, by means of punch-card summarizations, the amountof effort logged by the several vessel size-classes and the resultant catchof bait, by species, were determined for each baiting area. The yearly catchof bait logged by California baitboats from 1946 to 1954 is tabulated inTable 1 by species and vessel size-class, for all areas combined.
Sometimes, in vessel logbooks, the number of days spent baiting in anarea was recorded without the corresponding amounts or kinds of baitcaught. It was, therefore, necessary to use the following procedure toestimate for each year, area, and size-class, the quantities of each kind ofbait caught on all logged days, including those [or which such informationwas missing:
1) In each area, the catch per day's baiting, by species, was calculatedfor each vessel size-class by dividing the recorded amounts of baitof each species by the number of days required to make the catch;
2) The catch per day's baiting for each species, and size-class wasthen multiplied by the total number of days logged, including bothbaiting days when the catch was logged and those when it was notlogged, for that species and size-class.
This gives for each area the estimated amount of bait, by species, takenby each vessel size-class for all baiting days logged. These amounts summedover all days, size-classes, and areas, represent the total estimated quantities of each bait species taken during the year by vessels on trips for whichlogbook coverage was obtained. Summaries of the estimated catches by

33 TUNA BAITFISHES
species and vessel size-class for aH areas combined, for the years 1946-1954, are given in Table 2.
Estimated total catch by the entire California tuna fishing fleel:
In order to estimate the total amount of bait taken by the entire California baitboat fleet for a given year, it was necessary to estimate the amounts and kinds of bait which may have been caught by vessels from which logbook records were not obtained. This was done by multiplying the amount of each kind of bait logged during the year by each size-class, in each area, by the ratio of the total tonnage of tunas landed by aH vessels of a size-class to that caught on trips for which logbook coverage was obtained. This assumes that the amount of tuna caught per unit amount of bait was the same for vessels not providing records as for those from which logbook data were obtained. These estimates, together with the ratios used for each year and size-class, are given in Table 3.
Over the years dealt with in this study, the vessels based in California ports were responsible, each year, for over 90 percent of the total catch of tunas made by means of live bait in the Eastern Tropical Pacifico The data in Table 3 should provide, then, a fairly good estimate of the total catch of the several species used for tuna-bait.
Comparison of logged baH catches, estimated catches of vessels keeping
logs, and estimated total catch
For the more rccent years since 1951, when logbooks were maintained by almost the entire fleet, the error arising from the assumption made in estimating the total bait catch for the whole fleet is probably small. However, for the earlier years, prior to 1951, when the samples of logged data for each year are smaHer, the error may be considerably larger. This difference in extent of logbook coverage is illustrated in Figure 4, which shows for each year from 1946 to 1954, for aH species and size-classes combined, the actual amounts of bait logged, the estimated amounts of bait taken by vessels keeping logbooks (amounts logged plus amounts estimated for days of baiting for which no record of catch was kept) , and the estimated total catch of bait by the entire California-based tuna fishing fleet. It may be seen, from the close agreement between the quantities actuaHy logged and the estimated catches for vessels keeping logs, that from 1946 to 1954, the fishermen who kept logs recorded almost aH their catches of bait. Also for the more recent years from 1951 to 1954, when logbook information was obtained from a majority of vessels, the bait catch for the component of the fleet from which logbook data were obtained is not much lower than the estimated total catch of the whole fleet. By comparison, for years before 1951, when fewer logbooks were coHected, the departures of the logged catches from the estimated total catches are fairly large.
TUNA BAITFISHES 33
species and vessel size-class for all areas combined, for the years 1946-1954,are given in Table 2.
Estimated total catch by the entire California tuna fishing fleet
In order to estimate the total amount of bait taken by the entireCalifornia baitboat fleet for a given year, it was necessary to estimate theamounts and kinds of bait which may have been caught by vessels fromwhich logbook records were not obtained. This was done by multiplyingthe amount of each kind of bait logged during the year by each size-class,in each area, by the ratio of the total tonnage of tunas landed by all vesselsof a size-class to that caught on trips for which logbook coverage wasobtained. This assumes that the amount of tuna caught per unit amount ofbait was the same for vessels not providing records as for those from whichlogbook data were obtained. These estimates, together with the ratios usedfor each year and size-class, are given in Table 3.
Over the years dealt with in this study, the vessels based in Californiaports were responsible, each year, for over 90 percent of the total catch oftunas made by means of live bait in the Eastern Tropical Pacific. The datain Table 3 should provide, then, a fairly good estimate of the total catch ofthe several species used for tuna-bait.
Comparison of logged bait catches, estimated catches of vessels keeping
logs, and estimated total catch
For the more recent years since 1951, when logbooks were maintainedby almost the entire fleet, the error arising from the assumption made inestimating the total bait catch for the whole fleet is probably small. However, for the earlier years, prior to 1951, when the samples of logged datafor each year are smaller, the error may be considerably larger. Thisdifference in extent of logbook coverage is illustrated in Figure 4, whichshows for each year from 1946 to 1954, for all species and size-classescombined, the actual amounts of bait logged, the estimated amounts of baittaken by vessels keeping logbooks (amounts logged plus amounts estimatedfor days of baiting for which no record of catch was kept), and the estimated total catch of bait by the entire California-based tuna fishing fleet.It may be seen, from the close agreement between the quantities actuallylogged and the estimated catches for vessels keeping logs, that from 1946to 1954, the fishermen who kept logs recorded almost all their catches ofbait. Also for the more recent years from 1951 to 1954, when logbookinformation was obtained from a majority of vessels, the bait catch for thecomponent of the fleet from which logbook data were obtained is not muchlower than the estimated total catch of the whole fleet. By comparison, foryears before 1951, when fewer logbooks were collected, the departures ofthe logged catches from the estimated total catches are fairly large.

34 ALVERSON AND SHIMADA
Esf:imated total catches by species and area
The estimated total amounts of baitfishes taken each year from 1946 through 1954 by the California tuna fishing fleet and the breakdown of the total catch by species are given in Table 4 and graphed in Figure 5. It is evident from these data that the anchoveta was the dominant species in the bait catch during the period under study, accounting for an average of about 45 percent of the total quantity of bait used by California tuna fishermeno Other species which averaged at least 10 percent of the total annual bait catch are, in order of importance, the Galapagos sardine, the California sardine, and the northern anchovy.
The relative importance of the different species varies from year to year. These changes in species composition do not necessarily reflect changes in the abundance of certain kinds of baitfishes. The effort expended in catching bait depends largely upon the success of tuna fishing and the areas of tuna fishing and so may vary from place to place between seasons and between years as well. In Table 5, are given for each year from 1946 to 1954, the estimated amounts of each kind of baitfish taken from each baiting area and a list of the areas for which any bait fishing effort was logged. In 1946, for example, when the fishery for yellowfin and skipjack was still more or less restrictcd to the region north of Tehuantepec, the major sources of bait were localities along the Baja California coast and the bait catch consisted predominately of the species available in these areas. By contrast, in 1948, when the long-range tuna fishery resumed fullscale operations, the Galapagos Islands and other southern baiting grounds regained importance, with corresponding increases in the use of the species of baitfishes found on adjacent baiting grounds.
Relationship between total catch of yellowfin and skipjack tuna and the total catch of baitfishes
It might be assumed that the quantities of yellowfin and skipjack tuna landed each year by the baitboats would be proportional to the amounts of live bait used. This, however, is not always the case as may be seen in Figure 6, in which are graphed the total estimated quantities of bait used by California baitboats, and the corresponding catches of tunas for each year from 1946 through 1954. The yellowfin and skipjack catch increased steadily from 1946 to 1950 in response to greater fishing intensity and during these years there was a similar increase in the quantities of bait utilized by the baitboat fleet. When tuna production dropped in 1951, this decline was also accompanied by a decrease in the bait catch. However, in 1952 and 1953, as the tuna catches continued gradually their downward trend, the bait catch rose to a new high level, with most of the increase occurring in 1952. This inverse relationship between the landings of tunas and the amounts of bait used in 1952 and 1953 is believed to reflect a sharp decrease in abundance in yellowfin tuna during these years (Shimada and
34 ALVERSON AND SHIMADA
Estimated total catches by species and area
The estimated total amounts of baitfishes taken each year from 1946through 1954 by the California tuna fishing fleet and the breakdown of thetotal catch by species are given in Table 4 and graphed in Figure 5. It isevident from these data that the anchoveta was the dominant species in thebait catch during the period under study, accounting for an average ofabout 45 percent of the total quantity of bait used by California tuna fishermen. Other species which averaged at least 10 percent of the total annualbait catch are, in order of importance, the Galapagos sardine, the Californiasardine, and the northern anchovy.
The relative importance of the different species varies from year toyear. These changes in species composition do not necessarily reflectchanges in the abundance of certain kinds of baitfishes. The effort expendedin catching bait depends largely upon the success of tuna fishing and theareas of tuna fishing and so may vary from place to place between seasonsand between years as well. In Table 5, are given for each year from 1946to 1954, the estimated amounts of each kind of baitfish taken from eachbaiting area and a list of the areas for which any bait fishing effort waslogged. In 1946, for example, when the fishery for yellowfin and skipjackwas still more or less restricted to the region north of Tehuantepec, themajor sources of bait were localities along the Baja California coast andthe bait catch consisted predominately of the species available in theseareas. By contrast, in 1948, when the long-range tuna fishery resumed fullscale operations, the Galapagos Islands and other southern baiting groundsregained importance, with corresponding increases in the use of the speciesof baitfishes found on adjacent baiting grounds.
Relationship between total caf:ch of yellowfin and skipjack tuna and thetotal catch of baHfishes
It might be assumed that the quantities of yellowfin and skipjack tunalanded each year by the baitboats would be proportional to the amounts oflive bait used. This, however, is not always the case as may be seen inFigure 6, in which are graphed the total estimated quantities of bait usedby California baitboats, and the corresponding catches of tunas for eachyear from 1946 through 1954. The yellowfin and skipjack catch increasedsteadily from 1946 to 1950 in response to greater fishing intensity andduring these years there was a similar increase in the quantities of baitutilized by the baitboat fleet. When tuna production dropped in 1951, thisdecline was also accompanied by a decrease in the bait catch. However, in1952 and 1953, as the tuna catches continued gradually their downwardtrend, the bait catch rose to a new high level, with most of the increaseoccurring in 1952. This inverse relationship between the landings of tunasand the amounts of bait used in 1952 and 1953 is believed to reflect a sharpdecrease in abundance in yellowfin tuna during these years (Shimada and
35 TUNA BAITFISHES
Schaefer, 1956). As the fishermen encountered poorer fishing, they were apparently prone to use more bait in their attempts to catch the tunas than they would have used under more favorable conditions of tuna abundance. In 1954, when fishing for yellowfin improved and the catch of tuna increased markedly, the quantity of bait used was slightly less than the amount used in either of the previous two years.
THE EFFECTS OF THE TUNA-BAIT FISHERY UPON THE
POPULATIONS OF THE EASTERN PACIFIC BAITFISHES
One of the primary objectives of the Commission's studies of the tuna baitfishes of the Eastern Pacific region is to determine whether the populations of the various species used for bait are being adversely affected by the tuna fishery.
Considera:tion of ihe effecis of baiiing upon ihe popula:tions of California sardine, Norihern anchovYI Souihern anchovYI and Galapagos sardine
It has already been noted that the baitfish catch consists predominately of five species: the anchoveta, California sardine, Galapagos sardine, northern anchovy, and southern anchovy. Of these, the California sardine, northern anchovy, and southern anchovy are being utilized by other fisheries in much larger quantities than by the yellowfin and skipjack tuna fishery. In 1954, for example, approximately 83,000 tons of California sardine and 21,000 tons of northern anchovy were processed commercially in California and Mexico (Calif. Eur. Mar. Fish., 1956; Casey, ms.) while the estimates of the total amounts of these species used by the California tuna fleet in the same year are 812 tons and 2,416 tons, respectively, with an additional 260 tons which were not identified by species l. In the case of the southern anchovy, which occurs off Peru, it may be estimated rather conservatively from guano production figures (Compañia Administradora del Guano, 1954) and the conversion factors of guano to raw fish noted by Hutchinson (1950) that the guano birds have, in recent years, consurned about 2,500,000 tons annually. Sorne anchovies have also been processed in recent years for fish meal and oil; the latest available figures (Pesca y Caza, Peru, 1956) indicate that this amount in 1953 was about 40,000 tons. The tuna-bait fishery, by comparison, accounted for only an estirnated 2,212 tons of southern anchovy in 1954. It is therefore obvious that for this species, as well as for the California sardine and northern anchovy, the quantities taken each year by the tuna-bait fishery are negligibly small compared to the amounts caught for other uses and that the effects of baiting upon their abundance must been correspondingly small.
The Galapagos sardine is used at present only by the tuna fishery. It has not yet been definitely established that this population of sardines in
lIn converting "scoops" to weight, a factor of 8 pounds per scoop was used.
TUNA BAITFISHES 35
Schaefer, 1956). As the fishermen encountered poorer fishing, they wereapparently prone to use more bait in their attempts to catch the tunas thanthey would have used under more favorable conditions of tuna abundance.In 1954, when fishing for yellowfin improved and the catch of tuna increased markedly, the quantity of bait used was slightly less than theamount used in either of the previous two years.
THE EFFECTS OF THE TUNA-BAIT FISHERY UPON THEPOPULATIONS OF THE EASTERN PACIFIC BAITFISHES
One of the primary objectives of the Commission's studies of the tunabaitfishes of the Eastern Pacific region is to determine whether the populations of the various species used for bait are being adversely affected bythe tuna fishery.
Consideration of the effects of baiting upon the populations of Californiasardine, Northern anchovy, Southern anchovy, and Galapagos sardine
It has already been noted that the baitfish catch consists predominatelyof five species: the anchoveta, California sardine, Galapagos sardine,northern anchovy, and southern anchovy. Of these, the California sardine,northern anchovy, and southern anchovy are being utilized by other fisheries in much larger quantities than by the yellowfin and skipjack tunafishery. In 1954, for example, approximately 83,000 tons of Californiasardine and 21,000 tons of northern anchovy were processed commerciallyin California and Mexico (Calif. Bur. Mar. l<~ish., 1956; Casey, ms.) whilethe estimates of the total amounts of these species used by the Californiatuna fleet in the same year are 812 tons and 2,416 tons, respectively, withan additional 260 tons which were not identified by species 1. In the caseof the southern anchovy, which occurs off Peru, it may be estimated ratherconservatively from guano production figures (Compania Administradoradel Guano, 1954) and the conversion factors of guano to raw fish noted byHutchinson (1950) that the guano birds have, in recent years, consumedabout 2,500,000 tons annually. Some anchovies have also been processedin recent years for fish meal and oil; the latest available figures (Pesca yCaza, Peru, 1956) indicate that this amount in 1953 was about 40,000 tons.The tuna-bait fishery, by comparison, accounted for only an estimated2,212 tons of southern anchovy in 1954. It is therefore obvious that forthis species, as well as for the California sardine and northern anchovy,the quantities taken each year by the tuna-bait fishery are negligiblysmall compared to the amounts caught for other uses and that the effectsof baiting upon their abundance must been correspondingly small.
The Galapagos sardine is used at present only by the tuna fishery. Ithas not yet been definitely established that this population of sardines in
lIn converting "scoops" to weight, a factor of 8 pounds per scoop was used.

36 ALVERSON AND SHIMADA
the Galapagos Islands is entirely separate from that found along the South American mainland. The extreme variability in the catches of this species from year to year (Table 5) suggests that the population abundance responds mainly to factors other than the amount of bait fishing.
Consideration of the effects of baiUng upon the populations of anchoveta
It has been noted already that the anchoveta (O. mysticetus) contributes importantly to the tuna baitfish catch, and that substantial quantities of this species have been taken yearly from 1946 to 1954. The possibility exists, therefore, that the fishery may have exerted an important effect in sorne years upon the populations of anchovetas in different baiting areas. In order to examine this problem an analysis was made of the logbook data previously described for the period 1946-1954, using the approach employed by Shimada and Schaefer (1956) for the tunas. It is assumed that changes in abundance will be, on the average, inversely associated with changes in fishing intensity, if the cause and effect relationship between the two is large in comparison to other factors affecting the abundance of the anchovetas. From the nature of this relationship, in the light of what is known of the population dynamics of commercially exploited fish stocks, inferences may be drawn concerning the effects of fishing upon the abundance of anchovetas and the current condition of the populations with respect to the level of maximum sustained yield.
Population structure
From studies based on an analysis of meristic characters, Howard (1954) has shown that the anchoveta populations in each of the major baiting areas of Almejas Bay, Ahorne Point, Guaymas, Gulf of Fonseca, and Gulf of Panama (Fig. 2) are probably discrete biological units. It was, therefore, necessary to obtain measurements of abundance, yield, and fishing intensity separately for each of these five populations in order to investigate the effects of the tuna-bait fishery upon the anchovetas.
Abundance
The catch per day's baiting during ayear was assumed to be directly proportional to the average abundance of the anchoveta population in each baiting area. This measure was determined from the Iogged amounts of cffort and corresponding catch for each year, from 1946 to 1954, for each area and vessel size-cIass (Table 6). In order to combine the catch per day's baiting of all size-cIasses into a single index of abundance, which would be comparable from year to year, efficiency factors were computed for converting the catch per day's baiting of anchovetas for each size-cIass into terms of the catch per day's baiting of a selected standard size-cIass, in this case class 4 (vessels of 201-300 tons capacity). These factors, which correct for size-connected differences in baiting ability of tuna boats under
36 ALVERSON AND SHIMADA
the Galapagos Islands is entirely separate from that found along the SouthAmerican mainland. The extreme variability in the catches of this speciesfrom year to year (Table 5) suggests that the population abundance responds mainly to factors other than the amount of bait fishing.
Consideration of the effects of baiting upon the populations of anchoveta
It has been noted already that the anchoveta (C. mysticet7ts) contributes importantly to the tuna baitfish catch, and that substantialquantities of this species have been taken yearly from 1946 to 1954. Thepossibility exists, therefore, that the fishery may have exerted an importanteffect in some years upon the populations of anchovetas in different baitingareas. In order to examine this problem an analysis was made of the logbook data previously described for the period 1946-1954, using the approachemployed by Shimada and Schaefer (1956) for the tunas. It is assumedthat changes in abundance will be, on the average, inversely associatedwith changes in fishing intensity, if the cause and effect relationship between the two is large in comparison to other factors affecting theabundance of the anchovetas. From the nature of this relationship, in thelight of what is known of the population dynamics of commercially exploited fish stocks, inferences may be drawn concerning the effects offishing upon the abundance of anchovetas and the current condition of thepopulations with respect to the level of maximum sustained yield.
Population structure
From studies based on an analysis of meristic characters, Howard(1954) has shown that the anchoveta populations in each of the majorbaiting areas of Almejas Bay, Ahome Point, Guaymas, Gulf of Fonseca,and Gulf of Panama (Fig. 2) are probably discrete biological units. Itwas, therefore, necessary to obtain measurements of abundance, yield, andfishing intensity separately for each of these five populations in order toinvestigate the effects of the tuna-bait fishery upon the anchovetas.
Abundance
The catch per day's baiting during a year was assumed to be directlyproportional to the average abundance of the anchoveta population in eachbaiting area. This measure was determined from the logged amounts ofeffort and corresponding catch for each year, from 1946 to 1954, for eacharea and vessel size-class (Table 6). In order to combine the catch perday's baiting of all size-classes into a single index of abundance, whichwould be comparable from year to year, efficiency factors were computedfor converting the catch per day's baiting of anchovetas for each size-classinto terms of the catch per day's baiting of a selected standard size-class,in this case class 4 (vessels of 201-300 tons capacity). These factors, whichcorrect for size-connected differences in baiting ability of tuna boats under

37 TUNA BAITFISHES
equal conditions of anchoveta abundance, were determined for each area and year by taking the ratio of the catch per day's baiting of each size-class relative to the catch of class 4, using only those size-classes which logged at least five days of baiting effort for the area and year. Since the logbook samples were small for years prior to 1951, and, in sorne years, data were unavailable for certain size-classes and areas, it was decided to employ for each year an average efficiency factor for each size-class rather than to rely upon the yearly efficiency factors. These average efficiency factors, which correspond to the geometric mean of the efficiency factors for each size-class over all years from 1946 to 1954, are given in Table 7 by size-class and area.
The catch per standard day's baiting was computed for each area and year by (1) summing the products of the average efficiency factors and the number of days baiting for each size-class in the sample, over all sizeclasses, to obtain total standard baiting days, and, (2) dividing the total logged catch of anchovetas, summed over all size-classes, by the total number of standard days. The results for each area and year are listed in Table 8 in the first column under each area. For sorne areas, such as Ahorne Point and Fonseca, where the efficiency factor could not be computed for a particular size-class, the average efficiency factor over all areas for which it could be computed (Jast column of Table 7) was employed in determining the catch per standard day's baiting.
Total catch
The methods used in estimating the total catch of anchovetas in each of the major baiting areas for the years under study have already been described (pages 32 to 34), and the results from Table 5 have been retabulated in Table 8 in the second column under each area.
Total relative fishing intensity
The relative total intensity of baiting for each area and year may be calculated by dividing the estimated annual yield by the catch per standard day's baiting for the corresponding area and year. These values are given in Table 8 in the last column under each area.
Relationship between abundance and fishing intensity
In Figures 7-a, b, c, d, and e for Almejas Bay, Ahorne Point, Guaymas, the Gulf of Fonseca, and the Gulf of Panama, respectively, the catch of anchovetas per standard day's baiting, the total estimated yield, and the calculated relative total fishing intensity in class 4 baitboat days are plotted for the period 1946-1954.
In each of these areas there are large year-to-year variations in the apparent abundance of the anchovetas, as measured by the catch per standard day's baiting. There does not, however, appear to be any decline
TUNA BAITFISHES 37
equal conditions of anchoveta abundance, were determined for each areaand year by taking the ratio of the catch per day's baiting of each size-classrelative to the catch of class 4, using only those size-classes which loggedat least five days of baiting effort for the area and year. Since the logbooksamples were small for years prior to 1951, and, in some years, data wereunavailable for certain size-classes and areas, it was decided to employ foreach year an average efficiency factor for each size-class rather than torely upon the yearly efficiency factors. These average efficiency factors,which correspond to the geometric mean of the efficiency factors for eachsize-class over all years from 1946 to 1954, are given in Table 7 by size-classand area.
The catch per standard day's baiting was computed for each area andyear by (1) summing the products of the average efficiency factors andthe number of days baiting for each size-class in the sample, over all sizeclasses, to obtain total standard baiting days, and, (2) dividing the totallogged catch of anchovetas, summed over all size-classes, by the totalnumber of standard days. The results for each area and year are listed inTable 8 in the first column under each area. For some areas, such asAhome Point and Fonseca, where the efficiency factor could not be computed for a particular size-class, the average efficiency factor over allareas for which it could be computed (last column of Table 7) was employedin determining the catch per standard day's baiting.
Total catch
The methods used in estimating the total catch of anchovetas in eachof the major baiting areas for the years under study have already beendescribed (pages 32 to 34), and the results from Table 5 have been retabulated in Table 8 in the second column under each area.
Total relative fishing intensity
The relative total intensity of baiting for each area and year may becalculated by dividing the estimated annual yield by the catch per standardday's baiting for the corresponding area and year. These values are givenin Table 8 in the last column under each area.
Relationship between abundance and fishing intensity
In Figures 7-a, b, c, d, and e for Almejas Bay, Ahome Point, Guaymas,the Gulf of Fonseca, and the Gulf of Panama, respectively, the catch ofanchovetas per standard day's baiting, the total estimated yield, and thecalculated relative total fishing intensity in class 4 baitboat days are plottedfor the period 1946-1954.
In each of these areas there are large year-to-year variations in theapparent abundance of the anchovetas, as measured by the catch perstandard day's baiting. There does not, however, appear to be any decline

38 ALVERSON AND SHIMADA
in abundance during years of more intense fishing. Indeed, the trend of abundance in each of the areas seems to be slightly upward over the years 1946-1954. In order to test this statistically, the mean square linear regression of catch-per-day on time was calculated for each area. In each case, with the exception of Almejas Bay, the slope of the regression Une was found to be not significantly different from zero, judged at the five percent probability leve!. The regression line for the data from Almejas Bay has an upward slope, which is significant at the one percent probability level. From this we may conclude that there has been no average decrease in apparent abundance of this species in any of these major areas during the years 1946-1954 and in Almejas Bay the apparent abundance has significantly increased. In each area, also, most increases in fishing intensity have been accompanied by increases in abundance and total catch. If the tuna-bait fishery were removing sufficiently large quantities of anchovetas to measurabIy affect the abundance of any of the populations, it would be expected that as fishing intensity increased there would be a corresponding decrease in abundance and, if the level of maximum sustained yield was exceeded, a decrease in total catch as well. Conversely, increases in abundance would result from decreascs in fishing effort. The lack of such inverse relationships as these between changes in fishing intensity and abundance in all of the major baiting areas indicates that the tuna-bait fishery has had small effect upon the population abundance of anchovetas during the period 1946 through 1954 and that, at present levels of fishing intensity, there is no immediate danger of overfishing the anchovetas in any of the areas studied. Since the anchovetas are known to be short-lived, reaching sexual maturity in one year and not living for more than 2 to 3 years (Howard and Landa, ms.) the rather wide fluctuations in abundance from year to year found in sorne of the baiting areas suggest that variations in spawning success may, at current levels of exploitation, play a more important role than the effect of fishing in determining the abundance of anchovetas encountered by tuna fishermen.
CONCLUSIONS
It may be concluded from the available data that during the period 1946 to 1954 the California fishery for yellowfin and skipjack tunas did not reach an intensity sufficiently high to markedly affect the abundance of any of the major species of baitfishes in the Eastern Pacific Ocean. Furthermore, at present levels of exploitation, there is no imminent dangcr of these baitfish populations being reduced to sizes below those corresponding to the maximum sustainable harvest.
38 ALVERSON AND SHIMADA
in abundance during years of more intense fishing. Indeed, the trend ofabundance in each of the areas seems to be slightly upward over the years1946-1954. In order to test this statistically, the mean square linear regression of catch-per-day on time was calculated for each area. In eachcase, with the exception of Almejas Bay, the slope of the regression linewas found to be not significantly different from zero, judged at the fivepercent probability level. The regression line for the data from AlmejasBay has an upward slope, which is significant at the one percent probabilitylevel. From this we may conclude that there has been no average decreasein apparent abundance of this species in any of these major areas duringthe years 1946-1954 and in Almejas Bay the apparent abundance hassignificantly increased. In each area, also, most increases in fishing intensity have been accompanied by increases in abundance and total catch. Ifthe tuna-bait fishery were removing sufficiently large quantities of anchovetas to measurably affect the abundance of any of the populations, itwould be expected that as fishing intensity increased there would be acorresponding decrease in abundance and, if the level of maximum sustained yield was exceeded, a decrease in total catch as well. Conversely,increases in abundance would result from decreases in fishing effort. Thelack of such inverse relationships as these between changes in fishingintensity and abundance in all of the major baiting areas indicates that thetuna-bait fishery has had small effect upon the population abundance ofanchovetas during the period 1946 through 1954 and that, at present levelsof fishing intensity, there is no immediate danger of overfishing theanchovetas in any of the areas studied. Since the anchovetas are known tobe short-lived, reaching sexual maturity in one year and not living formore than 2 to 3 years (Howard and Landa, ms.) the rather wide fluctuations in abundance from year to year found in some of the baiting areassuggest that variations in spawning success may, at current levels ofexploitation, play a more important role than the effect of fishing indetermining the abundance of anchovetas encountered by tuna fishermen.
CONCLUSIONS
It may be concluded from the available data that during the period1946 to 1954 the California fishery for yellowfin and skipjack tunas didnot reach an intensity sufficiently high to markedly affect the abundanceof any of the major species of baitfishes in the Eastern Pacific Ocean.Furthermore, at present levels of exploitation, there is no imminent dangerof these baitfish populations being reduced to sizes below those corresponding to the maximum sustainable harvest.
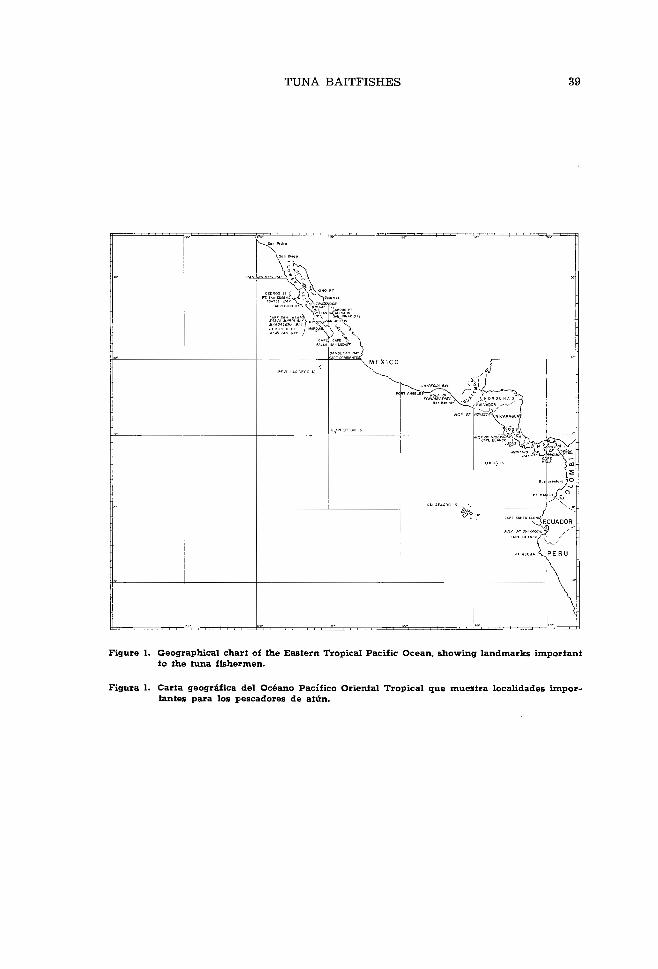
39 TUNA BAITFISHES
MEXICO
--¡"""""'"''
PERU
--------+-------' I-------+------I
Figure l. Geographical chart of the Eastern Tropical Pacific Ocean, showing landmarks important to the tuna fishermen.
Figura 1. Carta geográfica del Océano Pacífico Oriental Tropical que muestra localidades importantes para los pescadores de atún.
TUNA BAITFISHES 39
PERU
Figure 1. Geographical chart of the Eastern Tropical Pacific Ocean, showing landmarks importantto the tuna fishermen.
Figura 1. Carta geogrlifica del Oceano Pacifico Oriental Tropical que muestra localidades importantes para los pescadores de atun.
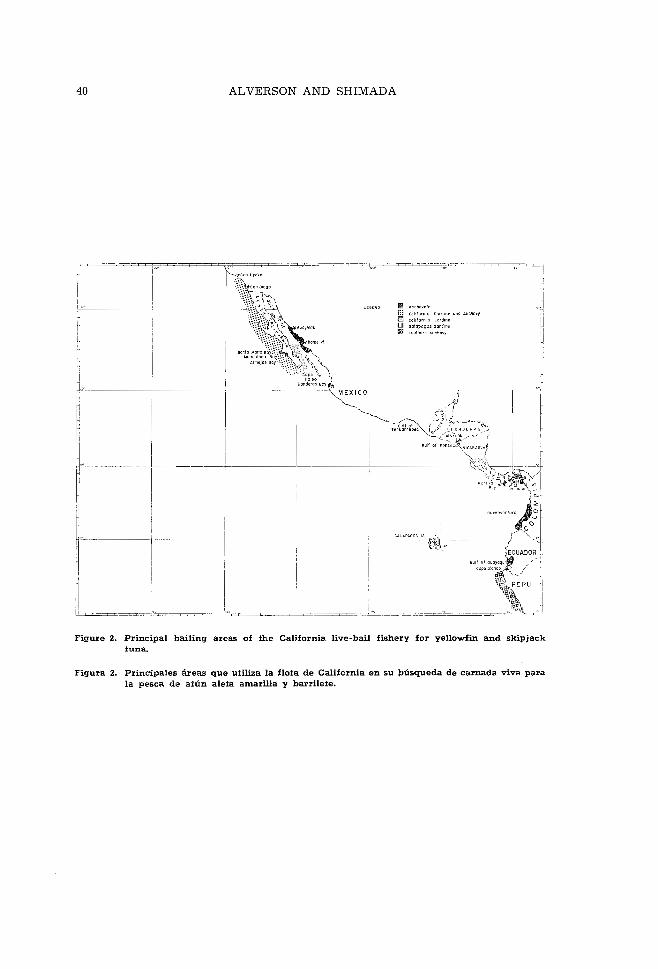
40 ALVERSON AND SHIMADA
11:I Anchovefa
D Col,torn,,, sardme oad Ancho~t
[] CollfomlJ sordme llIl oolopogossordlne ~ ~oulh~rn Ancnovy
MEXICO
G,!lfo! Te~Uonlepec
~=>-:"T,:'T':::-~=~"·_~'~-= ~~
Figure 2. Principal bai1ing areas of the California live-baH fishery for yellowfin and skipjack :tuna.
Figura 2. Principales áreas que utiliza la flota de California en su I>úsqueda de carnada viva para la pesca de atún aleta amarilla y barrilete.
40 ALVERSON AND SHIMADA
11:I Anchovefo
D Coillorn,,, sardme and Ancho~t
[] CollfomlJ sardineIlIl oolopogossardloe~ ~oulh~rn Anchovy
MEXiCO
--I----c------, I
I I
I I
I I-~------,
I I
Figure 2. Principal baiting areas of the California live-bait fishery for yellowfin and skipjack:luna.
Figura 2. Principales areas que utiliza la Uota de California en su pusqueda de carnada viva parala pesca de atun aleta amarilla y barrilete.

41 TUNA BAITFISHES
(1ICALlF WATERS
I
~_I (141 ca~~ cjo;nentes
porlAnge'es
Figure 3. Siaiislical areas employed by luna bailfish sludies.
ihe Inier-American Tropical Tuna Commission in iis
Figura 3. Areas estadísticas empleadas por la Comisión Inieramericana del Atún Tropical en sus estudios sobre los peces de carnada utilizados en la captura del atún.
I
---l _
TUNA BAITFISHES
(II CALIF
W"'TERS
I
~_I
I-}-----+
41
Figure 3. Statistical areas employed by the Inter-American Tropical Tuna Commission in itstuna bailfish studies.
Figura 3. Areas esladisticas empleadas par la Comisi6n Inieramericana del Allin Tropical en susestudios sabre los peces de carnada utilizados en la capiura del allin.

42 ALVERSON AND SHIMADA
4S00
..000
F~~----5000 / .."
g 3000 ¡. ~ /o 2500
2000
,~,/~I1500
,r--- // --./
1000 //./ ..---/.. .
/ ESTINATED BAIT //~
ESTlMATEO eAIT TA/(EN BY VESSELS KFTPING LOGS
" .•" I(NOWN BAIT LOGGED _ ••
~,.,...1947 1948 1952 1953 19~4!'"6 ~"
Figure 4. Actual and estimated amounts logged by baitboats and estimated total catch of bait by the entire California baitboat f1eet. 1946-1954.
Figura 4. Cantidades reales y cantidades estimadas por nosotros anotadas en los registros de bitácora de los barcos de carnada, y pesca total de carnada (estimada) efectuada por la totalidad de la flota de California, 1946-1954.
'000
o ",""",,,""'",0
O
-lID
"00 '""'"'"o,,'"""~.
"""'""" "'""". """'"'''""'"m "'"'"'"""""'''
~ 3000
.9~2 1953 ~"
y E A R
Figure 5. Estimated yearly catch of baitfishes by California baitboats, 1946-1954.
Figura 5. Pesca anual de carnada (estimada) efectuada por los barcos de California, 1946-1954.
42
4S00
ALVERSON AND SHIMADA
4000
5000
o 2~OO
2000
1500
1000
1946 1947 1948 ,... "'"
ESTIMATED BAIT
ESTIMATED BAITTAKEN BYVESSELS KFFPING LOGS
II:NOWN BAIT LOGGED _ ••-
~,.
Figure 4. Actual and estimated amounts logged by baitboats and estimated total catch of bait bythe entire California baitboat fleet. 1946-1954.
Figura 4. Cantidades reales y cantidades estimadas por nosotros anotadas en los registros debitacora de los barcos de carnada. y pesca total de carnada (estimada) efectuada por latotalidad de la flota de California. 1946-1954.
4500
~ 3000
o",,,,,,,,""',,0
oIIIf]
""",,'"'""""e,""""""."""",,,",,,,"',,,"",,,,""',,--
1947
YEA R
Figure 5. Estimated yearly catch of baitfishes by California baitboats. 1946-1954.
Figura 5. Pesca anual de carnada (estimada) efectuada por los barcos de California. 1946-1954.
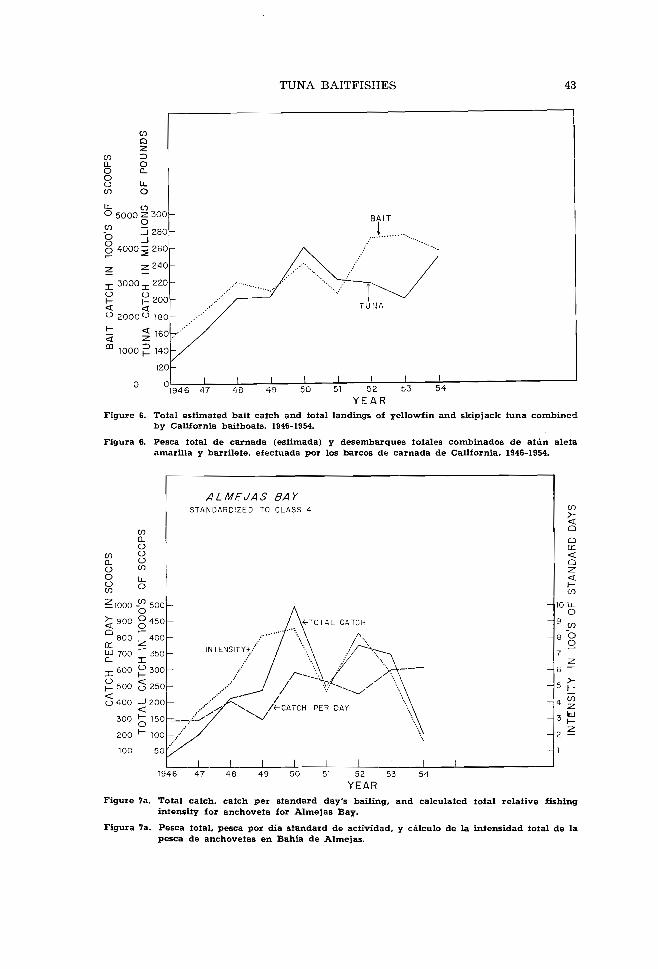
43 TUNA BAITFI8HE8
(f)
el Z
(f) ::> CL o o
CL oU IJ.. (f) o LL (f)
05000 Z 300 O
-~ :i 280 ..JS4000:¡¡ 260
BAIT
.....L..... .....
z Z 240
J: 3000 J: 220 U U 1 1- 200 c:r c:r
1 TUNA
U 2000U 180
1<i c:r Z 160, ..
CD 1000 ¡:: 140
120
o O' 1946
I I I I -
! _.
! _n
!"'
I O"
I
Figure 6. Total estimated baH catch and total 1andings of yellowfin and skipjack tuna combined by California baitboats, 1945-1954.
Figura 6. Pesca total de carnada (estimada) y desembarques totales combinados de atún aleta amarilla y barrilete, efectuada por los barcos de carnada de California, 1946-1954.
ALMEJAS BAY enSTANOAROIZEO TO CLASS 4 >« Oen
CL O O o::
(f) O « CL U O en O O z
1..L « U 1Oen (j)
~1000 -~ 500 101..L O
~ 900 g 450 CATCI-I 9 (f)
O ~
800 400 8 O o:: Z O W 700 - 350 INTENSIT.:.:'.""· 7 CL J:
\z
J: 600 ~ 300 6
>~ 500 (J 250 5 1
(J 400 ...J 200
...................... 4 ~ PER OAY
300 «b 150 3~
200 1- 100 1--; .. 2 Z
100 50 .
47 48 49 51 52 53 54
YEAR Figure 7a. Total catch. catch per standard day's baiting. and ca1cu1ated total re1ative fishing
intensity for anchoveta for Almejas Bay,
Figura 7a. Pesca total, pesca por día standard de actividad. y cálculo de la intensidad total de la pesca de anchovetas en Bahía de Almejas,
TUNA BAITFISHES 43
(f)
a2:
(f) ::>(L 0o (LolJ IJ..(f) 0
......
ITUNA
......../
2:
J: 3000 J: 220
~ ~ 200<t <tlJ 2000 lJ 180
I-
<tCD
LL (f)
050002:300ob :i 280..J
~ 4000~ 260'
2: 240
o oL_.L._.L_..L--:L:--~---f:-----f.::-----;':;-------------'1946
Figure 6. Total estimated bait catch and total landings of yellowfin and skipjack tuna combinedby California baitboats. 1946-1954.
Figura 6. Pesca total de carnada (estimada) y desembarques totales combinados de atun aletaamarilla y barrilete. efectuada por los barcos de carnada de California. 1946-1954.
ALMEJAS BAYSTANDARDIZED TO CLASS 4
z6
5 ~
4 ~
3~2 Z
if)
>«oo0::«oz«Iif)
10 IJ..o
9 if)
8 -0o
54
\52 53
YEAR
CATCH
51
PER DAY
494847
(f)(L
ooo(f)
IJ..o
100
(f)(L
ooo(f)
~IOOO -~ 500
:::t 900 g450o ~
800 4000:: Zis: 700 J: 350 INTENSIT~.:'''/
I 600 ~ 300 ....
5:: ;~:: -7::::~/."
200 I- 100 - ...........
Figure 7a. Total catch. catch per standard day's baiting. and calculated total relative fishingintensity for anchoveta for Almejas Bay.
Figura 7a. Pesca total. pesca por dia standard de actividad. y calculo de la intensidad total de lapesca de anchovetas en Bahia de Almejas.

44 ALVERSON AND SHIMADA
(J)
"o o u AHOME POINT ID
STANDARDIZED TO CLASS 4 " O (f)
(J) >""o gO O
O z a:
<1 :I: O U Z 1
~""u lO(/)1000 ...J <lO 1- 900 9 l.L O CATCH PER DAY--;'///
O 1- 800 -" 8 (/)
~ ;--, ¡" O 700 I -_---, / O
<n •••. / \ I g600 :x... l\.. \ / -'6 z
~ 500 - // INTENSITY-l/ \ I
z /- 400~, ¡,/ '. ¡'1\'" ". \y I 4 f
en~ ::: lv ~ / . >
Z w...........................- f a.. o" TOTAL z
100:I: U 1
"" 1946 47 48U
Figure 7b. Total catch, catch per standard day's baiting. and calculated total relative fishing intensity of anchoveta for Ahorne Point.
Figura 7b. Pesca total, pesca por día standard de actividad, y cálculo de la intensidad total de la pesca de anchovetas en Punta Ahorne.
ID "o o GUAYMASu ID STANDARDIZEQ TO CLASS 4 en " >o
<1 ID O o '" Os;l a: ,; <1
o :I: U z 1- <1 "" f-U
-'lO (J)...J 1000
l.Lb"" 900 ,............... _/ 9 O 1
800 8 en CATCH PER DAY ---7/,,,, \'" /- O~
OID 700 ~".~ - ---/;-,:"g 600 'r-INTENSITY z
u {J1 500 z >- 400 4 ~
>- en ~ 300 3 Z
W
f5 200 f Z
:I: 100 "
u 1<lO u 1946
Figure 7c. Total catch, catch per standard day's baiting, and calculated total relative fishing intensity of anchoveta for Guayrnas.
Figura 7c. Pesca total, pesca por día standard de actividad, y cálculo de la intensidad total de la pesca de anchovetas en Guaymas.
44 ALVERSON AND SHIMADA
(f)
>«oo0:«oz«t-
lQ(f)
9 ~- 8 (f)
oo
4 ~CJ)
Zwtz
z- 6
48
TOTAL
47
AHOME POINTST ANDAROIZE 0 TO CLASS 4
"CATCH PER DAY--;'''''
/'--, fI -_---, /
....... I \ Ij./ ". \ I
.... /······ 'NTENSITY-4!····· \\ /
.I //" .'... \ I.....-;-// \........... . y
....:/
1946
100 ..
400
200
>-~ 300
0:W0.
:I:U
~U
«l700
IJ)
i5 600o~ 500
~
:I:UI-
""u1000
...J
;: 900oI- 800
z
IJ)
0.oouIJ)
"o
Figure 1b. Total catch, catch per standard day's baiting, and calculated total relative fishingintensity of anchoveta for Ahome Point.
Figura 1b. Pesca total, pesca por dia standard de actividad, y calculo de la intensidad total de lapesca de anchovetas en Punta Ahome.
(f)
>«oo0:«oz«f-
lO (f)
lJ..o
By>oo
z
>4 f
(f)
3 ZWtZ
CATCH
'r-'NTENS'TY
GUAYMASSTANDARDIZED TO CLASS 4
800
700<Jl0.0 6000u
500<Jl
~ 400>-"" 300'"a:
200w0.
:I: 100uI-
" 1946u
<Jl0.ooU<Jl
"o
~
:I:UI-
""U
...J 1000
""b 900I-
<Jl
"0o$2
Figure 1c. Total catch, catch per standard day's baiting, and calculated total relative fishingintensity of anchoveta for Guaymas.
Figura 1c. Pesca total, pesca por dia standard de actividad, y calculo de la intensidad total de lapesca de anchovetas en Guaymas.

TUNA BAITFISHES 45
GULF OF FON5ECA STANDARDIZED TO CLASS 4 8
lJ)
lJ) ~
D.. 70 lJ) o
OD.. o o:o u o lJ) 6;3u u... ZlJ) o Z ~
5(f)- 1000 f!l 500 ~ O u...4 9000450 INTENSITY OO O
:I: . 4(f)o: 800 ~ 400 '0
~ 700 ~ 350 Q 3:I: 600 U 300 Z
~ 500!;i 250« U ,. ,,--
U 400 -1 200 ",> 2~t ~
4," ,': (f) 300 1- 150 '."........ CATCH PER DAY.....,I Z
O o·' .... ", /
200 t- 100 .... "..... // ~
... ". / Z
100 50 '~'" ,,,/,.:.....y~ .
1946 47 48 49 50 51 52 53 54
Figure 7d. Total catch, catch per standard day's baiting, and calculaled tolal relative lishing intensity lor anchovela for the Gulf of Fonseca.
Figura 7d. Pesca total, pesca por dia standárd de actividad, y cálculo de la inlensidad tolal de la pesca de anchovetas en el Golfo de Fonseca.
U> Q. o o o GULF OF PANAMA U>
16STANDARDIZED TO CLASS 4 ... o (f)
15 >U> r····························· «'0 14 el o o
INTENSITYj 13 ~
12 ;3":z: Z
~ 11 «<[ o 1
10 lJ)..J 1000 u..6<[
900 O ... 600 / , ..'.. 6 (f)
7 '" 700 /\ . g U> .. // \ ....g 600 . / \ •....
6 ~
o ¡ ./ .A \ '. ""',, " .,- 5500U> t .....,-~ ~
~ 400 4 1CATCH PER DAY--.¡-:-""",/> üi<[ 3 Z<> 300 Wo: ...../ .. 2 1
'" 200 ZQ.
:z: 100 ..o<[ 1946 47 46 49 50 51 52 53 54 o
YEAR
Figure 7e. Total catch, c:atch per standard day's baiting, and calculated lotal relative fishing intensity for anchoveta for the Gulf of Panama.
Figura 7e. Pesca total, pesca por dia standard de actividad, y cálculo de la intensidad total de la pesca de anchovetas en el Golfo de Panamá.
TUNA BAITFISHES 45
GULF OF FONSECASTANDARDIZED TO CLASS 4
~
21(f)
ZWIZ
B(f)
~«70
o0:
6;3Z«I-
5(/)
u..o
4(/)
'0Q
3Z
54535251
TOTAL
50
INTENSITY -
494B471946
(/)D..
(/) 0D.. 0
8 ~u u..(/) 0Z- 1000 f!l 500~ 0~ 9008450
BOO ~ 4000: Z~ 700 - 350
::I:::I: 600 U 300U I-!:i 5005250 >,---u 400 -l 200 /~
« .., CATCH PER DAY""""'// .300 ::; 150 .,><: ... ,....... /200 t- 100 ',.... //, ". ../
100 50 ':.:.: :.,r.: .
Figure 7d. Total catch, catch per standard day's baiting, and calculated total relative fishingintensity for anchoveta for the Gulf of Fonseca.
Figura 7d. Pesca total, pesca por dia standard de actividad, y calculo de la intensidad total de lapesca de anchovetas en el Golfo de Fonseca.
700ell
16(/)
15 >-«14 0
13 00:
12 «0
11Z«
10 ~
9 u..0
8 (/)
7 aS2
6Z
5~
4 I-
3enZ
2WI-Z
5451 52 53
YEAR
INTENSITY!
5049
:.....
48
f······························•.
47
GULF OF PANAMASTANDARDIZED TO CLASS 4
1946
500
400
:I:<.>....""<.>
U>Q. 600goU>
'"~o0:
'"Q.
'":I:~
""oJ 1000
"".... 900o.... BOO
U>Q.oooU>
...o
U>'0oo
Figure 7e. Total catch, catch per standard day's baiting, and calculated total relative fishingintensity for anchoveta for the Gulf of Panama.
Figura 7e. Pesca total, pesca por dia standard de actividad, y calculo de la intensidad total de lapesca de anchovetas en el Golfo de Panama.

46 ALVERSON AND SHIMADA
TABLE 1. Quantities of baH 10gged by California baitboats, by species and vesse1 size·class, 1946-1954 (in scoops).
TABLA 1. Cantidades de carnada registradas por los barcos de California (en "scoops"). por especies y por clase de tamaño de barcos. 1946·1954.
4) ¡;¡Ha iñü
Anchoveta eolif. sardine
Golopagos
5'ordine No.
anchovy So.
clnchovy
Coli!. sardine and No.
Herring Salimo Mise.
anchovy"
~ o "O 'c Sordina Sardino Sardina de ~ o • E Anchoveta de de las Anchoa Anchoa California Arenque Salima Mise.
-" ou- California Galápagos nórdica sureña y anchoa nórdica*
------
YEAR AÑO 1946
1 367 699 170 150 105 10
2 7,524 17,950 6,423 9,474 3,193 746
3 23,679 40,856 11,200 21,298 95
4 5,397 4,850 1,350 800 450 6,475 525
5 61,798 220 4,855 700 6,600 3,620
6 12,390 5,125 8,441 8,107 ----
111,155 64,575 9,980 19,143 31,722 4,543 21,516 13,008
Total 275,642
YEAR AÑO 1947
1 135 1,004 485 1,261 100
2 13,133 15,881 10,262 4,449 1,617 225
3 50,631 43,228 2,200 9,157 25,230 1,122 3,655 3,635
4 61,834 26,234 12,715 4,376 22,176 2,730 16,186 4,355
5 138,037 2,446 8,142 500 11,424 52,668 7,140
6 3,120 ...... 5,350 ...... 2,210 12,783 6,875
266,890 88,793 28,407 24,780 53,116 19,103 85,292 22,330
Total 588,711
YEAR AÑO 1948
1 556 1,655 980 79" 303
2 18,365 23,178 5,360 5,856 1,045 165
3 70,359 55,633 11,829 21,217 44,900 2,230 7,267 8,173
4 198,307 18,743 152,050 5,242 34,418 9,814 26,144 21,737
5 114,669 17,297 95,922 1,455 1,720 1,546 30,365 7,264
6 7,080 60 27,165 200 3,100 21,900 1,700
409,336 116,566 286,966 34,254 87,887 17,735 85,676 39,342
Total 1,077,762
YEAR AÑO 1949
1 320 710 165 110 466 2,115
2 1,330 30,046 6,963 4,755 1,443 3,070
3 59,823 90,319 8,070 21,823 36,492 1,070 6,562
4 293,683 28,349 138,070 10,801 19,455 6,803 14,776 8,965
5 113,939 4,843 54,176 388 8,799 2,150
6 11,004 ...... 9,431 300 1,550 8,436 900
480,099 154,267 209,747 39,752 61,112 11,720 32,011 23,762
Total 1,012,470
46 ALVERSON AND SHIMADA
TABLE 1. Quantities of bait logged by California baitboats, by species and vesselsize-class, 1946-1954 (in scoops).
TABLA 1. Cantidades de carnada registradas por los barcos de California (en"scoops"). par especies y por clase de tamano de barcos. 1946-1954.
~ ~Gala- Calif.
H a Anchoveta Calif. pago; No. So. sardine Herring Selima Misc.V)U sardine s'ordine anchovy anchovy and No.anchovy"
~ 0Sardina Sardina Sardina de"o,c
~ 0 Anchoveta de de las Anchoa Anchoa California Arenque Selima Misc.• E-" 0 California Galapagos nordica surena y anchoau- nordica*
YEAR-ANO 1946
1 367 699 170 150 105 10
2 7,524 17,950 6,423 9,474 3,193 746
3 23,679 40,856 11,200 21,298 95
4 5,397 4,850 1,350 800 450 6,475 525
5 61,798 220 4,855 700 6,600 3,620
6 12,390 5,125 8,441 8,107
111,155 64,575 9,980 19,143 31,722 4,543 21,516 13,008
Total 275,642
YEAR-ANO 1947
I 135 1,004 485 1,261 100
2 13,133 15,881 10,262 4,449 1,617 225
3 50,631 43,228 2,200 9,157 25,230 1,122 3,655 3,635
4 61,834 26,234 12,715 4,376 22,176 2,730 16,186 4,355
5 138,037 2,446 8,142 500 11,424 52,668 7,140
6 3,120 5,350 2,210 12,783 6,875
266,890 88,793 28,407 24,780 53,116 19,103 85,292 22,330
Total 588,711
YEAR-ANO 1948
1 556 1,655 980 79" 303
2 18,365 23,178 5,360 5,856 1,045 165
3 70,359 55,633 11,829 21,217 44,900 2,230 7,267 8,173
4 198,307 18,743 152,050 5,242 34,418 9,814 26,144 21,737
5 114,669 17,297 95,922 1,455 1,720 1,546 30,365 7,264
6 7,080 60 27,165 200 3,100 21,900 1,700
409,336 116,566 286,966 34,254 87,887 17,735 85,676 39,342
Total 1,077,762
YEAR-ANO 1949
1 320 710 165 110 466 2,115
2 1,330 30,046 6,963 4,755 1,443 3,070
3 59,823 90,319 8mO 21,823 36,492 1mO 6,562
4 293,683 28,349 138,070 10,801 19,455 6,803 14,776 8,965
5 113,939 4,843 54,176 388 8,799 2,150
6 11,004 9,431 300 1,550 8,436 900
480,099 154,267 209,747 39,752 61,112 11,720 32,011 23,762
Total 1,012,470

47 TUNA BAITFI8HE8
~ ~ Gala- Calif. " a Anchoveta Calif. pagos No. Sao sordino Herring Salima Mise.Viü sordine sardine anchovy anchovy and No.
anchovy·
o a -a ." Sardina Sordina Anchoa Sardino de ~ a ~ E Anchoveta d. de las Anchoa sureña California Arenque Salima Mise. Ea u- California Galópagos nórdica y anchoa
nórdica*
YEAR - AÑO 1950 1 635 1,559 1,445 1,230 3,479 1,372
2 3,068 18,818 7,216 6,915 3,964 4,634
3 191,541 77,461 28,250 55,275 43,406 7,647 1,122 10,330
4 389,193 9,060 144,467 12,311 4,650 1,921 4,601 8,819
5 141,687 1,321 105,902 650 1,040 2,681 5,124
6
726,124 108,219 278,619 76,247 56,851 18,051 8,404 30,279
Total 1,302,794
YEAR - AÑO 1951 1 466 14,591 10,315 1,003 1,448 665
2 16,574 86,440 33,312 5,110 8,676 12,917
3 385,175 196,893 10,957 63,308 4,595 12,755 1,235 5,930
4 721,Q68 13,262 44,673 16,415 490 7,944 15,236 7,957
5 196,962 7,420 23,614 35,789 23,103 10,875
6 70,125 37,795 44,483 17,596
1,390,370 318,606 79,244 123,350 11,198 104,407 84,057 55,940
Total 2,167,172
YEAR - AÑO 1952
1 1,900 2,731 4,357 430 3,185 1,555
2 23,658 53,759 44,868 5,375 8,133 5,562
3 566,426 158,811 8,275 332,025 33,127 16,400 1,550 11,539
4 1,124,321 33,098 282,436 87,171 6,432 9,305 7,986 6,625
5 336,829 905 109,081 24,386 35,946 12,057 600
6 132,196 76,018 14,228 20,283 6,358
2,185,330 249,304 475,810 492,807 45,364 87,197 41,876 32,239
Total 3,609,927
YEAR - AÑO 1953
1 1,265 2,930 11,539 1,470 1,605
2 33,755 32,203 58,307 5,399 2,329 1,100
3 321,448 250,302 38,139 441,705 700 79,715 9,906 12,894
4 686,080 79,653 439,888 183,498 18,240 57,415 11,622 2,178 12,664
5 263,978 2,353 214,811 400 3,400 11,518 6,890 3,345
6 65,303 990 172,204 3,270 4,431 30,586 13,370 1,065
1,371,829 368,431 865,042 698,719 26,771 143,999 67,566 22,438 31,068
Total 3,595,863
YEAR - AÑO 1954 1 1,045 5,237 13,637 1,080 580 15
2 17,895 16,207 35,227 3,904 640 215
3 370,821 109,193 18,027 308,047 40,972 38,986 8,917 296 8,430
4 817,840 37,488 257,593 134,018 284,258 8,775 13,675 7,860 5,775
5 307,918 2,900 134,896 1,700 63,896 7,728 6,508 3,962
6 92,983 106,804 62,907 8,985 3,900
1,608,502 171,025 517,320 492,629 452,033 52,745 40,525 18,564 18,397
Total 3,371,740
"Mixed catches, not separately identified ·Pescas mezcladas, no identificadas separadamente
TUNA BAITFISHES 47
~ ~ Gala- Colif." 0 Anchoveta Colif. pagos No. So. sardine Herring Selima Misc.V;U sard'ine sardine anchovy anchovy and No.
anchovy·
~
" Sardina Sordina Anchoa Sardina de~ Anchoveta d. de las Anchoa surena California Arenque Selima Misc.CU California Galapagos nordica y anchoa
nordica*
YEAR-ANO 19501 635 1,559 1,445 1,230 3,479 1,372
2 3,068 18,818 7,216 6,915 3,964 4,634
3 191,541 77,461 28,250 55,275 43,406 7,647 1,122 10,330
4 389,193 9,060 144,467 12,311 4,650 1,921 4,601 8,819
5 141.687 1,321 105,902 650 1,040 2,681 5,124
6
726,124 108,219 278,619 76,247 56,851 lR,051 8,404 30.279
Total 1,302.794
YEAR - ANO 19511 466 14,591 10,315 1,003 1,448 665
2 16,574 86,440 33,312 5,110 8,676 12,917
3 385,175 196,893 10,957 63,308 4,595 12,755 1,235 5,930
4 721,Q68 13,262 44,673 16,415 490 7,944 15,236 7,957
5 196,962 7,420 23,614 35,789 23,103 10,875
6 70,125 37,795 44,483 17,596
1,390,370 318,606 79,244 123,350 11,198 104,407 84,057 55,940
Total 2,167,172
YEAR-ANO 1952
1 1,900 2,731 4,357 430 3,185 1,555
2 23,658 53,759 44,868 5,375 8,133 5,562
3 566,426 158,811 8,275 332,025 33,127 16,400 1,550 11,539
4 1,124,321 33,098 282,436 87,171 6,432 9,305 7,986 6,625
5 336,829 905 109,081 24,386 35,946 12,057 600
6 132,196 76,018 14,228 20,283 6,358
2,185,330 249,304 475,810 492,807 45,364 87,197 41,876 32,239
Total 3,609,927
YEAR-ANO 1953
1 1,265 2,930 11,539 1,470 1,605
2 33,755 32,203 58,307 5,399 2,329 1,100
3 321,448 250,302 38,139 441,705 700 79,715 9,906 12,894
4 686,080 79,653 439,888 183,498 18,240 57,415 11,622 2,178 12,664
5 263,978 2,353 214,811 400 3,400 11,518 6,890 3,345
6 65,303 990 172,204 3,270 4,431 30,586 13,370 1,065
1,371,829 368,431 865,042 698,719 26,771 143,999 67,566 22,438 31,068
Total 3,595,863
YEAR-ANO 1954
1 1,045 5,237 13,637 1,080 580 15
2 17,895 16,207 35,227 3,904 640 215
3 370,821 109,193 18,027 308,047 40,972 38,986 8,917 296 8,430
4 817,840 37,488 257,593 134,018 284,258 8,775 13,675 7,860 5,775
5 307,918 2,900 134,896 1,700 63,896 7,728 6,508 3,962
6 92,983 106,804 62,907 8,985 3,900
1,608,502 171,025 517,320 492,629 452,033 52,745 40,525 18,564 18,397
Total 3,371,740
·Mixed catches, not separately identified *Pescas mezcladas, no identificadas separadamente
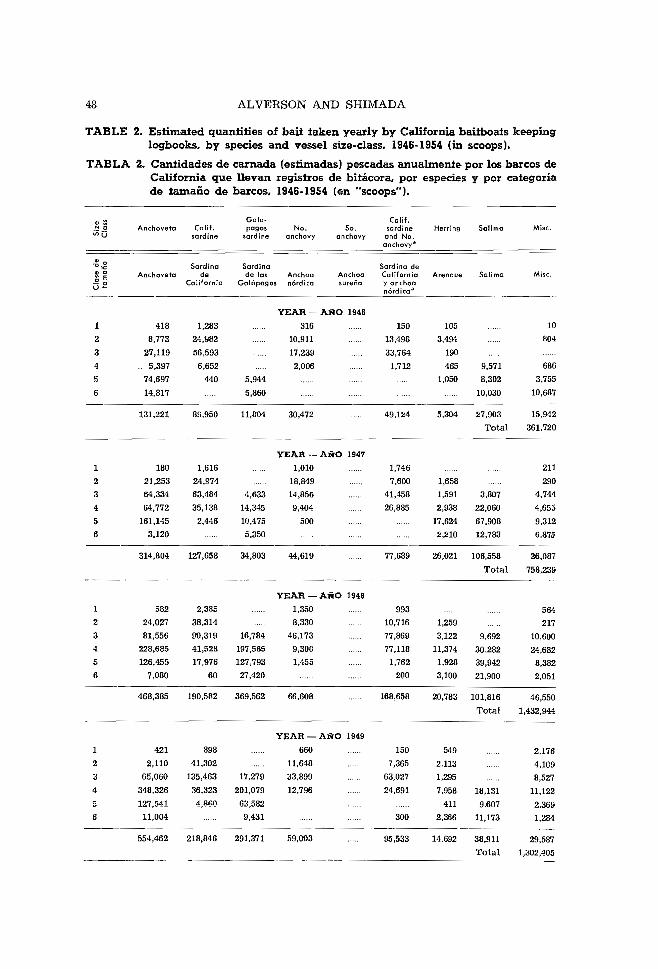
48 ALVERSON AND SHIMADA
TABLE 2. Estimated quantifies of bait taken year1y by California baitboats keeping logbooks. by species and vessel size-class. 1946·1954 (in scoops).
TABLA 2. Cantidades de carnada (estimadas) pescadas anualmente por los barcos de California que llevan registros de bitácor'a. por especies y por categoría de tamaño de barcos. 1946·1954 (en "scoops").
.~
N e iñ U
Anchoveta Calif. sard'ine
Galapagos
sardine No.
anchovy So.
anchovy
Calif . sardine
cnd No. Herring Salima Mise.
anchovy· . "C Sardino Sardina Sardina de ~
e U
Anchoveta de California
de los Galápagos
Anchoa nórdica
Anchoa sureña
California y anchoa nórdica"
Arenque Salimo Mise.
YEAR AÑO 1946
1 418 1,283 316 150 105 10
2 8,773 24,982 10,911 13,498 3,494 804
3 27,119 56,593 ...... 17,239 33,764 190
4 5,397 6,652 2,006 1,712 465 9,571 686
5 74,697 440 5,944 1,050 8,302 3,755
6 14,817 5,860 10,030 10,687
131,221 89,950 11,804 30,472 49,124 5,304 27,903 15,942
Total 361,720
YEAR - AÑO 1947
1 180 1,616 1,010 1,746 211
2 21,253 24,974 18,849 7,600 1,658 290
3 64,334 63,484 4,633 14,856 41,458 1,591 3,807 4,744
4 64,772 35,138 14,345 9,404 26,885 2,938 22,060 4,655
5 161,145 2,446 10,475 500 17,624 67,908 9,312
6 3,120 5,350 2,210 12,783 6.875
314,804 127,658 34,803 44,619 77,689 26,021 106,558 26,087
Total 758,239 ___o
YEAR - AÑO 1948
1 582 2,385 1,350 993 564
2 24,027 38,314 8,330 10,716 1,259 217
3 81,556 90,319 16,784 46,173 77,869 3,122 9,692 10,600 4 228,685 41,528 197,565 9,300 77,118 11,374 30,282 24,682
5 126,455 17,976 127,793 1,455 1,762 1,928 39,942 8,382
6 7,080 60 27,420 200 3,100 21,900 2,051
468,385 190,582 369,562 66,608 168,658 20,783 101,816 46,550
Total 1,432,944
YEAR - AÑO 1949
1 421 898 660 150 549 2,176
2 2,110 41,302 11,648 7,365 2,113 4,109
3 65,060 135,463 17,279 33,899 63,027 1,295 8,527
4 348,326 36,323 201,079 12,796 24,691 7,958 18,131 11,122
5 127,541 4,860 63,582 411 9.607 2.369
6 11,004 9,431 300 2,366 11,173 1,284
554,462 218,846 291,371 59,003 95,533 14,692 38,911 29,587
Total 1,302,405
48 ALVERSON AND SHIMADA
TABLE 2. Estimated quantities of bait taken yearly by California baifboats keepinglogbooks. by species and vessel size-class. 1946·1954 (in scoops).
TABLA 2. Cantidades de ca.rnada (estimadas) pescadas anualmenfe por los barcos deCalifornia que llevan registros de bitacora. por especies y por caiegoriade tamano de barcos. 1946-1954 (en "scoops").
.~Gale- Calif .
~OAnchoveto Calif. pagos Na. So. sardine Herring Selima Mise.
sardine sardine anchovy anchovy end No.anchovy·
•"0 Sardina Sardina Sardina de~ Anchoveta de de las Anchoa Anchea California Arenque Selima Misc.a California Galapagos nordica sureiia y anchoaU nordica" ------
YEAR-ANO 1946
1 418 1,283 316 150 105 10
2 8,773 24,982 10,911 13,498 3,494 804
3 27,119 56,593 17,239 33,764 190
4 5,397 6,652 2,006 1,712 465 9,571 686
5 74,697 440 5,944 1,050 8,302 3,755
6 14,817 5,860 10,030 10,687
131,221 89,950 11,804 30,472 49,124 5,304 27,903 15,942
Total 361,720
YEAR-ANO 1947
1 180 1,616 1,010 1,746 211
2 21,253 24,974 18,849 7,600 1,658 290
3 64,334 63,484 4,633 14,856 41,458 1,591 3,807 4,744
4 64,772 35,138 14,345 9,404 26,885 2,938 22,060 4,655
5 161,145 2,446 10,475 500 17,624 67,908 9,312
6 3,120 5,350 2,210 12,783 6,875
314,804 127,658 34,803 44,619 77,689 26,021 106,558 26,087
Total 758,239
YEAR - ANO 1948
1 582 2,385 1,350 993 564
2 24,027 38,314 8,330 10,716 1,259 217
3 81,556 90,319 16,784 46,173 77,869 3,122 9,692 10,600
4 228,685 41,528 197,565 9,300 77,118 11,374 30,282 24,682
5 126,455 17,976 127,793 1,455 1,762 1,928 39,942 8,382
6 7,080 60 27,420 200 3,100 21,900 2,051
468,385 190,582 369,562 66,608 168,658 20,783 101,816 46,550
Total 1,432,944
YEAR-ANO 1949
1 421 898 660 150 549 2,176
2 2,110 41,302 11,648 7,365 2,113 4,109
3 65,060 135,463 17,279 33,899 63,027 1,295 8,527
4 348,326 36,323 201,079 12,796 24,691 7,958 18,131 11,122
5 127,541 4,860 63.582 411 9.607 2.369
6 11,004 9,431 300 2,366 11,173 1,284
554,462 218,846 291,371 59,003 95,533 14,692 38,911 29,587
Total 1,302,405

---
49 TUNA BAITFISHES
Calif. Gala- Calif.·~ Anchoveta sardine pagos No. Se. scrdine Herring Salima Mise.N e¿niJ
sardine anchovy anchovy cnd No. cnchovy·
'"• 'co Sardina Sardina Sordino de • e Anchoveta de de las Anchoa Anchoa California Arenque Sal:ma Mise. -"'e• E
California Galápagos nórdico sureña y anchoau nórdica*
YEAR - AÑO 19S0 1 915 2.269 2,911 3,554 1,736 2,465
2 7,432 31,233 13,102 13,298 5,433 6,550
3 234,927 116,017 65,352 95,430 73,086 5,866 15,140
4 448,157 16,540 259,419 15,559 8,270 8,041 8,371 12,100
5 146,684 1,321 129,659 650 1,209 3,567 7,660
6
838,115 167,380 454,430 127.002 98,858 22,285 11,938 43,915
Total 1,763,923
YEAR - AÑO 1951 l 466 14,847 10,960 1,047 1,448 667
2 17,708 89,626 34,169 5,296 9,095 13,229
3 396,921 200,508 22,782 63,709 4,675 12,989 1,235 6,706
4 726,953 13,262 61,636 16,415 490 7,944 16,299 9,249
5 198,473 7,420 23,614 35,789 23,626 10,875
6 73,258 41,040 47,746 20,101
1,413,779 325,663 108,032 125,253 11,508 108,305 88,906 60,827
Total 2,242,273
YEAR - AÑO 1952 1 1,900 3,040 5,193 443 3,641 1,752
2 23,658 54,499 45,Q62 5,375 8,288 5,960
3 580,903 163,894 10,343 348,181 35,391 16,561 1,350 11,796
4 1,156,519 33,294 303,243 88,615 6,620 9,305 8,116 6,635
5 338,990 925 119,842 25,221 48,550 13,092 678
6 133,736 81,703 14,228 20,283 6,358
2,235,706 255,652 515,131 512,272 47,829 100,573 42,841 33,179
Total 3,743,183
YEAR - AÑO 1953
1 1,265 2,976 11,850 1,497 1,605
2 34,711 32,854 62,962 5,831 2,343 1,104
3 324,987 258,638 39,291 459,547 700 82,734 10,035 12,894
4 697,155 81,581 481,637 205,654 18,797 62,355 11,678 2,178 13,442
5 266,088 2,353 247,150 400 3,400 11,518 6,890 3,435
83,882 990 175,596 3,270 6,204 30,586 13,370 1,0656
1,408,088 379,392 943,674 743,683 29,101 152,417 67,765 22,438 31,940
Total 3,778,498
YEAR - AÑO 1954
1 1,415 6,249 14,997 1,258 676 15
2 20,691 17,915 42,574 4,856 674 221
3 383,599 119,601 22,640 347,217 50,438 44,068 9,888 321 9,427
4 865,963 40,521 268,426 153,755 326,353 10,271 15,377 9,286 4,433
5 311,416 2,900 137,264 1,700 69,964 8,375 7,147 4,105
6 107,458 106,804 ..... 66,870 8,985 3,900
1,690,542 187,186 535,134 560,243 513,625 60,453 43,975 20,654 18,201
Total 3,630,013
'Mixed catches, not separately identified 'Pescas mezcladas, no identificadas separadamente
TUNA BAITFISHES 49
·~Calif. Gala- Calif.
N 0 Ancho'/eto sardine pagos No. So. sardine Herring Selima Misc.tniJ sardine anchovy anchovy and No.anchovy·
• 0 Sardina'" '0 Sardina Sardine de• 0 Anchoveta de de las Anchoa Anchoa California Arenque Sal:ma Misc.• E-"0 California Galapagos n6rdica surenc y cnchoau- nordico*
YEAR-ANO 19S01 915 2.269 2,911 3,554 1,736 2,465
2 7,432 31,233 13,102 13,298 5,433 6,550
3 234,927 116,017 65,352 95,430 73,086 5,866 15,140
4 448,157 16,540 259,419 15,559 8,270 8,041 8,371 12,100
5 146,604 1,321 129,659 650 1,209 3,567 7,660
6
838,115 167,380 454,430 127,002 98,858 22,285 11,938 43,915
Total 1,763,923
YEAR - ANa 19511 466 14,847 10,960 1,047 1,448 667
2 17,708 89,626 34,169 5,296 9,095 13,229
3 396,921 200,508 22,782 63,709 4,675 12,909 1,235 6,706
4 726,953 13,262 61,636 16,415 490 7,944 16,299 9,249
5 198,473 7,420 23,614 35,789 23,626 10,875
6 73,258 41,040 47,746 20,101
1,413,779 325,663 108,032 125,253 11,508 108,305 80,906 60,827
Total 2,242,273
YEAR-ANa 19521 1,900 3,040 5,193 443 3,641 1,752
2 23,658 54,499 45,062 5,375 8,288 5,960
3 580,903 163,894 10,343 348,181 35,391 16,561 1,350 11,796
4 1,156,519 33,294 303,243 88,615 6,620 9,305 8,116 6,635
5 338.990 925 119,842 25,221 48,550 13,092 678
6 133,736 81,703 14,228 20,283 6,358
2,235,706 255,652 515,131 512,272 47,829 100,573 42,841 33,179
Total 3,743,183
YEAR-ANa 19531 1,265 2,976 11,850 1,497 1,605
2 34,711 32,854 62,962 5,831 2,343 1,104
3 324,987 258,638 39,291 459,547 700 82,734 10,035 12,894
4 697,155 81,581 481,637 205,654 18,797 62,355 11,678 2,178 13,442
5 266,088 2,353 247,150 400 3,400 11,518 6,890 3,435
6 83,882 990 175,596 3,270 6,204 30,586 13,370 1,065
1,408,088 379,392 943,674 743,683 29,101 152,417 67,765 22,438 31,940
Total 3,778,498
YEAR-ANa 1954
1 1,415 6,249 14,997 1,258 676 15
2 20,691 17,915 42,574 4,856 674 221
3 383,599 119,601 22,640 347,217 50,438 44,068 9,888 321 9,427
4 865,963 40,521 268,426 153,755 326,353 10,271 15,377 9,286 4,433
5 311,416 2,900 137,264 1,700 69,964 8,375 7,147 4,105
6 107,458 106,804 66,870 8,985 3,900
1,690,542 187,186 535,134 560,243 513,625 60,453 43,975 20,654 18,201
Total 3,630,013
'Mixed catches, not separately identified 'Pescas mezcladas, no identificadas separadamente

50 ALVERSON AND SHIMADA
TABLE 3. Estimated total quantities of bait, by species and vessel size-class. talten yearly by all California baitboats. 1946-1954 (in scoops).
TABLA 3. Cantidades totales de carnada (estimadas), por especies y por categoría de tamaño de barcos. pescadas anualmente por todos los barcos de California. 1946-1954 (en "scoops").
C/: .~~
VlU Fac::tor* Anchoveta Colíf.
sardina
Gclapagos
sardine No.
anchovy
Calif.••• 50. sardine and
anchovy No. Herring Salima Mise.
anchovy
c/ o."", Sordina Sardina Sordino de .. o ~ E
.!1 o u-Foctor* Anchoveta de
California de las
Galápagos Anchoa nórdico
Anchoa California sureña y anchoa
nórdico··"
Arenque Solimo Mise.
YEAR AÑO 1946
1 5.570 2,383 7,313 1,801 855 598 57 2 4.358 38,230 108,858 47,544 58,818 15,227 3,503 3 3.802 103,112 215,179 65,545 128,380 722 4 8.525 46,007 56,705 17,100 14,594 3,964 81,588 5,848 5 2.287 170,845 1,006 13,595 2,401 18,989 8,589 6 2.496 36,982 14,626 25,034 26,675
397,559 389,061 28,221 131,990 202,647 22,912 125,611 44,672 Total 1,342,673
YEAR AÑO 1947
1 3.596 647 5.811 3,632 6,278 759 2 3.110 66,104 77,675 58,624 23,636 5,157 902 3 3.072 197,659 195,044 14,234 45,644 127,375 4,887 11,696 14,574 4 3.459 224,Q48 121,545 49,619 32,529 92,995 10,162 76,306 16,101
5&6" 2.116 347,546 5,176 33,485 1,058 41,969 170,738 34,251
836,004 405,251 97,338 141,487 250,284 62,175 258,740 66,587 Total 2,117,866
YEAR AÑO 1948
1 3.201 1,862 7,635 4,322 3,178 1,805 2 2.380 57,176 91,175 19,824 25,509 2,995 644 3 2.216 180,716 200,134 37,191 102,311 172,549 6,917 21,476 23,487 4 1.855 424,259 77,043 366,526 17,253 143,070 21,101 56,180 45,791
5 &6" 2.251 300,537 40,593 349,327 3,274 4,415 11,316 139,183 23,479
964,550 416,580 753,044 146,984 348,721 42,329 216,839 95,206 Total 2,984,253
YEAR AÑO 1949
1 4.214 1,774 3,782 2,781 632 2,313 9,169 2 2.753 5,809 113,711 32,068 20,275 5,818 11,313 3 2.387 155,311 323,379 41,249 80.924 150,461 3,092 20,357 4 1.774 617,785 64,420 356,632 22,695 43,791 14,115 32,156 19,724 5 1.825 232,821 8,872 116,067 750 17,537 4,324 6 5.990 65,916 56,492 1,797 14,172 66,929 7,692
1,079,416 514,164 570,440 138,468 216.956 40,260 116,622 72,579 Total 2,748,905
YEAR AÑO 1950
1 2.269 2,076 5,148 6,605 8,065 3,938 5,593 2 2.051 15,247 64,074 26,878 27,278 11,146 13,437 3 1.833 430,544 212,619 119,767 174,888 133,942 10,750 6,063 27,746 4 1.959 878,138 32,4!! 508,316 30,488 16,205 15,757 16,402 23,709
5 & 6" 2.550 374,131 3,369 330,707 1,658 3,083 9,097 19,538
1,700,136 317,621 958,790 238,859 187,148 44,674 31,562 90,023 Total 3,568,813
50 ALVERSON AND SHIMADA
TABLE 3. Estimated total quantities of bait, by species and vessel size-class, takenyearly by all California baitboats, 1946-1954 (in scoops).
TABLA 3. Cantidades totales de carnada (estimadas), por especies y por categoriade tamano de barcos, pescadas anualmente por todos los barcos deCalifornia, 1946-1954 (en "scoops").
,,: Gcla- Calif.··'".~~ Fac:tor* Anc:hoveta Calif. pagos No. 50. sardine and Herring Selima Misc.VlU sardine sardine anchovy anchovy No.
anchovy
"0 Sardina Sardina Sardina de""," a Foctor· Anchoveta de de las Anchoa Anchoa California Arenque Selima Misc.~ E
..'" 0 California Galapagos nordico surefia y anchoau- nordico**'"
YEAR-ANO 1946
1 5.570 2,383 7,313 1,801 855 598 572 4.358 38,230 108,858 47,544 58,818 15,227 3,5033 3.802 103,112 215,179 65,545 128,380 7224 8.525 46,007 56,705 17,100 14,594 3,964 81,588 5,8485 2.287 170,845 1,006 13,595 2,401 18,989 8,5896 2.496 36,982 14,626 25,034 26,675
397,559 389,061 28,221 131,990 202,647 22,912 125,611 44,672Total 1,342,673
YEAR-ANO 1947
1 3.596 647 5.811 3,632 6,278 7592 3.110 66,104 77,675 58,624 23,636 5,157 9023 3.072 197,659 195,044 14,234 45,644 127,375 4,887 11,696 14,5744 3.459 224,Q48 121,545 49,619 32,529 92,995 10,162 76,306 16,101
5&6" 2.116 347,546 5,176 33,485 1,058 41,969 170,738 34,251
836,004 405,251 97,338 141,487 250,284 62,175 258,740 66,587Total 2,117,866
YEAR-ANO 1948
1 3.201 1,862 7,635 4,322 3,178 1,8052 2.380 57,176 91,175 19,824 25,509 2,995 6443 2.216 180,716 200,134 37,191 102,311 172,549 6,917 21,476 23.4874 1.855 424,259 77,043 366,526 17,253 143,070 21,101 56,180 45,791
5 &6'· 2.251 300,537 40,593 349,327 3,274 4,415 11,316 139,183 23,479
964,550 416,580 753,044 146,984 348,721 42,329 216,839 95,206Total 2,984,253
YEAR-ANO 1949
1 4.214 1,774 3,782 2,781 632 2,313 9,1692 2.753 5,809 113,711 32,068 20,275 5,818 11,3133 2.387 155,311 323,379 41,249 80,924 150,461 3,092 20,3574 1.774 617,785 64.420 356,632 22,695 43,791 14,115 32,156 19,7245 1.825 232,821 8,872 116,067 750 17,537 4,3246 5.990 65,916 56.492 1,797 14,172 66,929 7,692
1,079,416 514,164 570,440 138,468 216,956 40,260 116,622 72,579Total 2,748,905
YEAR-ANO 1950
1 2.269 2,076 5,148 6,605 8,065 3,938 5,5932 2.051 15.247 64,074 26,878 27,278 11,146 13,4373 1.833 430,544 212,619 119,767 174,888 133,942 10,750 6,063 27,7464 1.959 878,138 32,411 508,316 30,488 16,205 15,757 16,402 23,709
5&6" 2.550 374,131 3,369 330,707 1,658 3,083 9,097 19,538
1,700,136 317,621 958,790 238,859 187,148 44,674 31,562 90,023Total 3,568,813
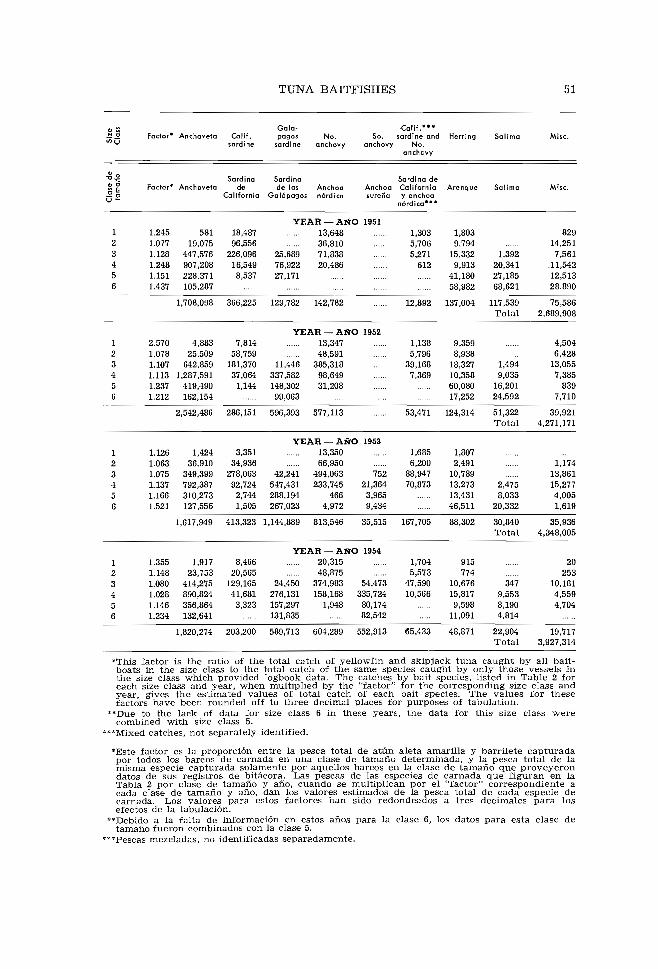
TUNA BAITFISHES 51
Gala- Calif. ••• N e Factor· Anchoveta Calif. pagos No. So. sardine and Herrjng 5alima Mise. ~ ~
;;)Ü sardine sardine anchovy onchovy No. anchovy
-8 1g Sardina Sardina Sardina de ~ e ~ E Factor· Anchoveta de de las Anchoa Anchoa California Arenque Salima Mise. .5!c California Ga lá pagos nórd ica sureña y anchoa u nórdica"·
YEAR - AÑO 1951 1 1.245 581 18,487 13,648 1,303 1,803 829 2 1.077 19,075 96,556 36,810 5,706 9,794 14,251 3 1.128 447,576 226,096 25,689 71,838 5,271 15,332 1,392 7,561 4 1.248 907,208 16,549 76,922 20,486 612 9,913 20,341 .11,542 5 1.151 228,371 8,537 27,171 41,180 27,185 12,513 6 1.437 105,287 58,982 68,621 28,890
1,708,098 366,225 129,782 142,782 12,892 137,004 117,539 75,586 Total 2,689,908
YEAR - AÑO 1952 1 2.570 4,883 7,814 13,347 1.138 9,359 4,504 2 1.078 25,509 58,759 48,591 5,796 8,938 6,428 3 1.107 642,859 181,370 11,446 385,318 39,168 18,327 1,494 13,055 4 1.113 1,287,591 37,064 337,582 98,649 7,369 10,358 9,035 7,385 5 1.237 419,490 1,144 148,302 31,208 60,080 16,201 839 6 1.212 162,154 99,063 17,252 24,592 7,710
2,542,486 286,151 596,393 577,113 53,471 124,314 51,322 39,921 Total 4.271,171
YEAR-AÑO 1953 1 1.126 1,424 3,351 13,350 1,685 1,807 2 1.063 36.910 34,936 66,950 6,200 2,491 1,174 3 1.075 349,399 278,063 42,241 494,063 752 88,947 10,789 13,861 4 1.137 792,387 92,724 547,431 233,745 21,364 70,873 13,273 2,475 15,277 5 1.166 310,273 2,744 288,194 466 3,965 13,431 8,033 4,005 6 1.521 127,556 1,505 267,023 4,972 9,434 46,511 20,332 1,619
1,617,949 413,323 1,144,889 813,546 35,515 167,705 88,302 30,840 35,936 Total 4,348,005
YEAR-AÑO 1954 1 1.355 1,917 8,466 20,315 1,704 915 20 2 1.148 23,753 20,565 48,875 5,573 774 253 3 1.080 414,275 129,165 24,450 374,983 54,473 47,590 10,676 347 10,181 4 1.028 890,824 41,681 276,131 158,168 335,724 10,566 15,817 9,553 4,559 5 1.146 356,864 3,323 157,297 1,948 80,174 9,598 8,190 4,704 6 1.234 132,641 131,835 82,542 11,091 4,814
1,820,274 203,200 589,713 604,289 552,913 65,433 48,871 22,904 19,717 Total 3,927,314
"This factor is the ratio of the total catch of yellowfin and skipjack tuna caught by al1 bait boats in the size class to the total catch of the same species caught by only those vessels in the size class which provided logbook data. The catches by bait species, listed in Table 2 for each size class and year, when multiplied by the "factor" for the corresponding size class and year, gives the estimated values of total catch of each bait species. The values for these factors have been rounded off to three decimal places for purposes of tabulation.
"Due to the lack of data for size class 6 in these years, the data for this size class were combined with size class 5.
"'Mixed catches, not separately identified.
'Este factor es la proporclOn entre la pesca total de atún aleta amarilla y barrilete capturada por todos los barcos de carnada en una clase de tamaño determinada, y la pesca total de la misma especie capturada solamente por aquellos barcos en la clase de tamaño que proveyeron datos de sus registros de bitácora. Las pescas de las especies de carnada que figuran en la Tabla 2 por clase de tamaño y año, cuando se multiplican por el "factor" correspondiente a cada clase de tamaño y año, dan los valores estimados de la pesca total de cada especie de carnada. Los valores para estos factores han sido redondeados a tres decimales para los efectos de la tabulación.
"Debido a la falta de información en estos años para la clase 6, los datos para esta clase de tamaño fueron combinados con la clase 5.
***Pescas mezcladas, no identificadas separadamente.
TUNA BAITFISHES 51
Factor· Anchoveta Calif.sardine
Gala-pagos No.
sardine anchovy
Calif. •••So. sardine and Herring
andovy No.anchovy
Salima Misc.
SardinaFactor'" Anchoveta de
California
Sardinade las
GalapagosAnchoan6rdica
Sardina deAnchoa Californiasureiic y enchoe
n6rdicc u •
Arenque Selima Misc.
11,446337,582148,302
99,Q63
123456
123456
1.2451.0771.1281.2481.1511.437
2.5701.0781.1071.1131.2371.212
58119,075
447,576907,208228,371105,287
1,708,098
4,88325,509
642,8591,287,591
419,490162,154
18,48796,556
226,09616,549
8,537
366,225
7,81458,759
181,37037,064
1,144
YEAR - ANO 195113,64836,810
25,689 71,83876,922 20,48627,171
129,782 142,782
YEAR - ANO 195213,34748,591
385,31898,64931,208
1,3035,7065,271
612
12,892
1,1385,796
39,1687,369
1,8039,794
15,3329,913
41,18058,982
137,004
9,3598,938
18,32710,35860,08017,252
1,39220,34127,18568,621
117,539Total
1,4949,035
16,20124,592
82914,2517,561
.11,54212,51328,890
75,5862,689,908
4,5046,428
13,0557,385
8397,710
2,542,486 286,151 596,393 577,113 53,471 124,314 51,322Total
39,9214,271,171
42,241547,431288,194267,023
54,473335,724
80,17482,542
24,450276,131157,297131,835
123456
123456
1.1261.0631.0751.1371.1661.521
1.3551.1481.0801.0281.1461.234
1,42436,910
349,399792,387310,273127,556
1,617,949
1,91723,753
414,275890,824356,864132,641
3,35134,936
278,06392,724
2,7441,505
413,323
8,46620,565
129,16541,681
3,323
YEAR-ANO13,35066,950
494,063233,745
4664,972
1,144,889 813,546
YEAR-ANO20,31548,875
374,983158,168
1,948
1953
75221,364
3,9659,434
35,515
1954
1,6856,200
88,94770,873
167,705
1,7045,573
47,59010,566
1,8072,491
10,78913,27313,43146,511
88,302
915774
10,67615,8179,598
11,091
2,4758,033
20,332
30,840Total
3479,5538,1904,814
1,17413,86115,2774,0051,619
35,9364,348,005
20253
10,1814,5594,704
1,820,274 203,200 589,713 604,289 552,913 65,433 48,871 22,904Total
19,7173,927,314
"This factor is the ratio of the total catch of yellowfin and skipjack tuna caught by all baitboats in the size class to the total catch of the same species caught by only those vessels inthe size class which provided logbook data. The catches by bait species, listed in Table 2 foreach size class and year, when multiplied by the "factor" for the corresponding size class andyear, gives the estimated values of total catch of each bait species. The values for thesefactors have been rounded off to three decimal places for purposes of tabulation.
"Due to the lack of data for size class 6 in these years, the data for this size class werecombined with size class 5.
"'Mixed catches, not separately identified.
OEste factor es la proporeion entre la pesca total de atim aleta amarilla y barrilete capturadapor todos los bareos de carnada en una clase de tamano determinada, y la pesca total de lamisma especie capturada solamente por aquellos barcos en la clase de tamano que proveyerondatos de sus registros de bitacora. Las pescas de las especies de carnada que figuran en laTabla 2 por clase de tamano y ano, cuando se multiplican por el "factor" correspondiente acada clase de tamano y ano, dan los valores estimados de ]a pesca total de cada especie decarnada. Los valores para estos factores han sido redondeados a tres decimales para losefectos de la tabulacion.
*'Debido a la falta de informacion en estos anos para la clase 6, los datos para esta clase detamano fueron combinados con la clase 5.
:t-**Pescas mezcladas, no identificadas separadamente.

c.nTABLE 4. Estimated total annual tuna bai:tfish catch·, and percentage composi:tion, by species. 1946-1954. l'..:l
TABLA 4. Cantidades totales (estimadas) de peces de carnada· pescadas anualmente y composición del porcentaje, por especies, 1946-1954.
1946 1947 1948 1949 1950 1951 1952 1953 1954 1946-1954
Species %01 % 01 % 01 % 01 % 01 % of % 01 % 01 % 01 % 01 Coteh Total Coteh Total Coleh Total Coteh Catch Coteh Total Coteh Total Calch Tolo1 Coleh Total Ccld Total Coleh Total
% del "/0 del % del % del % del % del % del % del % del % del Especies Pesca totol Pesca total Pesce total Pesca total Pesca total Pesca total Pesca total Pesca totol Pesco tatal Pesca total
Anchoveta 398 29.6 836 39.5 964 32.3 1,079 39.3 1,700 47.6 1,708 63.5 2,542 59.5 1,618 37.2 1,820 46.3 12.665 45.2 rCeteng,aulis mysticetus}
;;. Sardina dE' California 389 28.9 405 19.1 416 13.9 514 18.7 318 8.9 366 13.6 286 6.7 413 9.5 203 5.2 3,310 11.8 t"' California sardine
(Sardincps caerulea) -<l:<j
Galapagos sardine - ::l:I Sardina de las Galápagos 28 2.1 97 4.6 753 25.2 570 20.7 959 26.9 130 4.8 596 14.0 1,145 26.3 590 15.0 4,868 17.4 [fJ
rSardinc'ps sogox) O Z
Northern anchovy-Anchoa nórdica 132 9.8 141 6.7 147 4.9 138 5.0 239 6.7 143 5.3 577 13.5 814 18.7 604 15.4 2,935 10.5 ;;.
(Engrau/is mordo)(} Z tj
Southern Anchovy -Anchoa sureña 36 0.8 553 14.1 589 2.1 [fJ
lEngraulis dngens} ::r: ..... Calif. sardine and ~
Northern anchovy"Sardina dE! California
y anchoa nórdica**
Herring - Arenque (Opisthemema, HorenguJoJ
Salima (Xenocys ;essiaeJ
Mise. and unidentified Mise. y no identificadas
203
23
126
45
15.1
1.7
9.4
3.3
250
62
259
66
11.8
2.9
12.2
3.1
349
42
217
95
11.7
1,4
7.3
3.2
217
40
117
72
7.9
1.5
4.3
2.6
187
45
32
90
5.2
1.3
0.9
2.5
13
137
118
76
0.5
5.1
4.4
2.8
53
124
51
40
1.2
2.9
1.2
0.9
168
88
31
36
3.9
2.0
0.7
0.8
65
49
23
20
1.7
1.2
0.6
0.5
1.505
610
974
540
5.4
2.2
3.5
1.9
;;. tj ;;.
1,344 2,116 2,983 2,747 3,570 2,691 4,269 4,349 3,927 27,996
"In thousands of scoops
··Mixed and not separately identified
'En miles de "scoops"
··Mezcladas y no identificadas separadamente
TABLE 4. Estimated total annual tuna baitfish catch·, and percentage composition, by species. 1946·1954. c.nl'..:l
TABLA 4. Caniidades totales (esiimadas) de peces de carnada· pescadas anualmente y composicion del porcentaje, por especies,1946·1954.
1946 1947 1948 1949 1950 1951 1952 1953 1954 1946-1954
Species %of % of % of % of % of % of % of % of % of % ofCatch Total Catch Total Colch Total Catch Catch Catch Total Catch Total Calch Tala1 Catch Total Cald Total Catch Total
% del "/0 del % del % del % del % del % del % del % del % delEspecies Pesca totel Pesca total Pesce total Pesca total Pesca total Pesca total Pesca total Pesca totol Pesce tatal Pesta total
Anchoveta 398 29.6 836 39.5 964 32.3 1,079 39.3 1,700 47.6 1,708 63.5 2,542 59.5 1,618 37.2 1,820 46.3 12.665 45.2rCetengfaulis mysticetus}
California sardine - ;;.Sardina dE' California 389 28.9 405 19.1 416 13.9 514 18.7 318 8.9 366 13.6 286 6.7 413 9.5 203 5.2 3,310 11.8 t"'
(Sardincps caerulea) -<[:oj
Galapagos sardine - ::l:ISardina de las Galapagos 28 2.1 97 4.6 753 25.2 570 20.7 959 26.9 130 4.8 596 14.0 1,145 26.3 590 15.0 4,868 17.4 [fJ
rSardinc,ps sogox) 0Northern anchovy-
ZAnchoa n6rdica 132 9.8 141 6.7 147 4.9 138 5.0 239 6.7 143 5.3 577 13.5 814 18.7 604 15.4 2,935 10.5 ;;.
(EngrauJis mordo)(J ZSouthern Anchovy -
tj
Anchoa surefia 36 0.8 553 14.1 589 2.1 [fJ(Engraulis dngens) ::r:.....
Calif. sardine and5.2 ~
Northern anchovy" 203 15.1 250 11.8 349 11.7 217 7.9 187 13 0.5 53 1.2 168 3.9 65 1.7 1,505 5.4 ;;.Sardina d£! California tjy anchoa nordica** ;;.Herring - Arenque 23 1.7 62 2.9 42 1.4 40 1.5 45 1.3 137 5.1 124 2.9 88 2.0 49 1.2 610 2.2
(Opisthcmema, HorenguJoJ
Salima 126 9.4 259 12.2 217 7.3 117 4.3 32 0.9 118 4.4 51 1.2 31 0.7 23 0.6 974 3.5(Xenocys ;essiaeJ
Misc. and unidentified 45 3.3 66 3.1 95 3.2 72 2.6 90 2.5 76 2.8 40 0.9 36 0.8 20 0.5 540 1.9Misc. y no identificadas
1,344 2,116 2,983 2,747 3,570 2,691 4,269 4,349 3,927 27,996
"In thousands of scoops 'En miles de "scoops"
,oMixed and not separately identified **Mezc1adas y no identificadas separadamente

__Jo'
TABLE 5. Estimated quantities of bait taken yearly by California baitboats. 1946-1954. by species and area.
TABLA 5. Cantidades de peces de carnada (estimadas) capturadas anualmente por los barcos de California. por especies y áreas. 1946-1954.
Year - Año 1946
Calif. Calif. Gala· No. So. sardine Total
Area Anchoveta sardine pagos Anchovy Anchovy and No. Herring Salima Misc. for orea sardine anchovy
Sardina de Sordino de Sardina de And10a Anchoa California Total por
Area Anchoveta California las nórdica sureña y anchoa Arenque Salima Mise. área Galápagos nórdico
California Waters ........... 8,214 7,367 824 16,405 U.S.-Mexican Border to Pt.San·Eügeiiio 232,175 13,144 2,497 247,816 Pt. San Eugenio to Cape San Lazaro 42,620 98,937 103,425 170 245,152 Santa Maria Bay. 7,407 3,233 10,753 228 1,320 22,941 >-'3Magdalena Bay 730 98,188 9,309 85,148 5,122 1,830 200,327 Almejas Bay ..................... 28,847 28,847 c:: Gulf of California - West Side" ...... 15,494 7,763 23,257 Z Gulf of California - East Side 1,429 . 1,429 > Guaymas ... 184,192 457 184,649 AhomePt........ 47,705 47,705 te Banderas Bay ............ .. ................... 85 85 > Cape Corrientes to Port Ange1es* .... "'" >-'3Gu1f of Fonseca . .............. 39,896 39,896 "%jGu1f of Nicoya ........... 90,190 554 5,848 96,592 Gu1f of Panama .... 5,999 "'"5,999 Ul Galapagos Islands 28,221 125,611 27,741 181,573 ::r:
397,559 389,061 28,221 131,990 202,647 22,912 125,611 44,672 1,342,673 M Ul
Year - Año 1947
California Waters .......... 30,928 46,005 45,020 858 122,811 U.S.-Mexican Border to pt:SaiiEug.;iiio 138,102 6,568 1,688 31 146,389 Pt. San Eugenio to Cape San Lazaro 105,511 49,591 72,413 3,245 230,760 Santa Maria Bay ... 965 57,234 1,611 51,552 261 111,623 Magdalena Bay 72,199 34,097 79,611 1,207 3,403 190,517 Almejas Bay .......... ..... ......... 100,594 221 3,615 529 804 105,763 Gulf of California - West Side 1,056 8,824 9,880 Gulf of California -- East Side ..... 1,866 1,866 Kino Pt.· .. ..... .- ..... ... Guaymas. 325,503 325,503 Ahome Pt................. .......... ... .. ... 149,186 1,290 150,476 Cape Corrientes to Port Angeles' Gu1f of Fonseca .. 36,020 36,020 Gulf of Nicoya 57,536 14,978 4,984 77 ,498 Montijo Bay.. 20,889 20,889 Gulf of Panama 143,445 ...... 538 143,983 Galapagos Islands 97,338 33,690 258,740 54,120 443,888
C1 836,004 405,251 97,338 141,487 250,284 62,175 258,740 66,587 2,117,866 (;>
__.'J.'
TABLE 5. Estimaled quantities of bail laken yearly by Galifornia baitboals. 1946-1954. by species and area.
TABLA 5. Cantidades de peces de carnada (eslimadas) capluradas anualmenle por los barcos de California, par especies y areas,1946-1954.
Year-Ana 1946
Calif.Calif. Ga'a~ No. So. sardine Total
Area Anchoveta sardine pagos Anchovy Anchovy and No. Herring Salima Misc. for areasardine anchovy
Sardina deSardina de Sardina de Ancnoa Anchoa California Total por
Area Anchoveto California los nordica surena y enchoa Arenque Selima Misc. areaGalapagos n6rdica
California Waters ........... 8,214 7.367 824 16,405U.S.-Mexican Border to Bt:Sail·Eiig"nio· 232,175 13,144 2,497 247,816Pt. San Eugenio to Cape San Lazaro 42,620 98,937 103,425 170 245,152Santa Maria Bay.. 7,407 3,233 10,753 228 1.320 22,941 >-'3Magdalena Bay 730 98,188 9,309 85,148 5,122 1,830 200,327 c::::Almejas Bay ................................ 28,847 28,847
~Gulf of California - West Side 15,494 7,763 23,257Gulf of California - East Side 1,429 1,429Guaymas 184,192 457 184,649
t:CAhomept......... 47,705 47,705Banderas Bay............ ..................... .. 85 85 >Cape Corrientes to Port Angeles' .....
39.896 >-'3Gulf of Fonseca.554
39,896 "%jGulf of Nicoya. ........•.••. 90,190 5,848 96,592 .....Gulf of Panama 5,999
125,6115,999 Ul
Galapagos Islands 28,221 27,741 181,573 :r:397,559 389,061 28.221 131,990 202,647 22,912 125,611 44,672 1,342,673 M
Ul
Year-Ana 1947
California Waters 30,928 46,005 45,020 858 122,811U .s,-Mexican Border to Pt. San Eugenio 138,102 6,568 1,688 31 146,389Pt. San Eugenio to Cape San Lazaro 105,511 49,591 72,413 3,245 230,760Santa Maria Bay .. 965 57,234 1,611 51,552 261 111,623Magdalena Bay ...
100,59472,199 34,097 79,611 1,207 3,403 190,517
Almejas Bay.......... ................. 221 3,615 529 804 105,763Gulf of California - West Side 1,056 8,824 9,880Gulf of California - East Side .. 1,866 1,866Kino Pt.'.Guaymas .. 325,503 325.503AhomePt, ................ . ... 149,186 1,290 150,476Cape Corrientes to Port·Angeles···
36,020Gulf of Fonseca .. 36,020Gulf of Nicoya 57,536 14,978 4,984 77 ,498Montijo Bay... 20,889 20,889Gulf of Panama .... 143,445
97,333538 143,983
Galapagos Islands 33,690 258,740 54,120 443,888<:1l
836,004 405,251 97,338 141,487 250,284 62,175 258,740 66,587 2,117,866 w
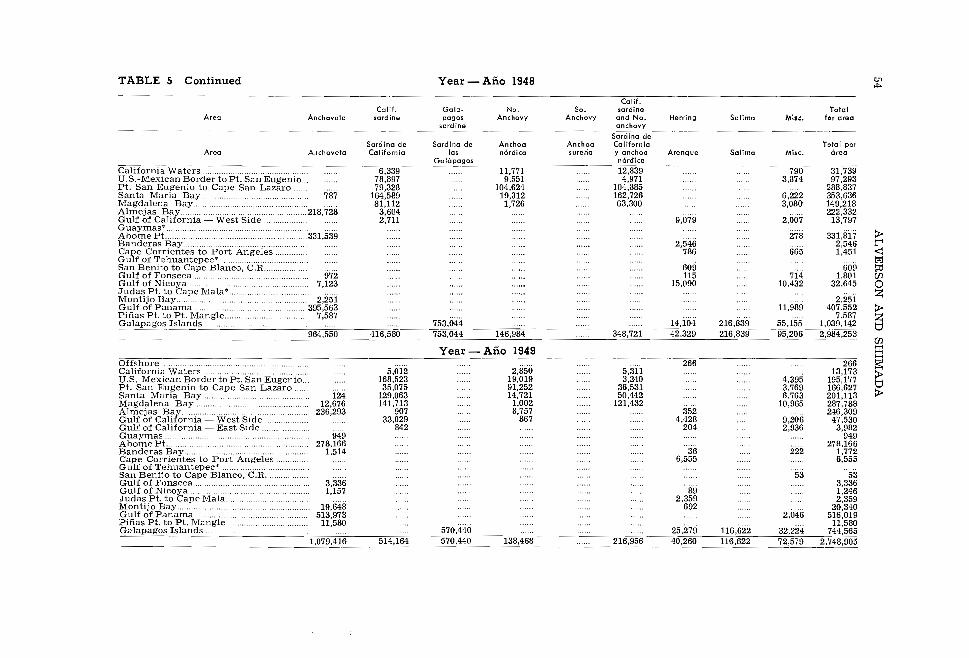
TABLE 5 Continued Year-Año 1948 <:JI ~
Calif. Colif. Gala- No. So. scrdine Total
Are-a Anchoveta sardine pagos Anchovy Anchovy cnd No. Herring Solime M;". for area sardina onchovy
Sardina de Sardina de Sardino de Anchoa Anchoa California Total por
Area Anchoveta California los nórdica sureña y anchoa Arenque Solima Mise. área Galápagos nórdica
California Waters .............................................. U.S.-Mexican Border to Pt. San Eugenio .. Pt. San Eugenio to Cape San Lazara Santa Maria Bay. 787 Magdalena Bay.
·······.·.218,728Almejas Bay...................................... Gulf of California West Side . Guaymas"' .... .
..... ··· ...... ·.·.·.. 331,539AhomePL ....... Banderas Bay........................................... Cape Corrientes to Pori Angeles.Gulf of Tdluantepec' ..................... San Benito to Cape Blanco, C.R. ..
972Gulf of Fonseca . Gulf of Nicoya ....... 7,123Judas Pt. io Cape Mala.·.·.·.···
6,339 78,897 79,328
164,589 81,112
3,604 2,711
11,771 9,551
104,624 19,312 1,726
12,839 4,971
104,885 162,726 63,300
9,079
2,546 786
609 115
15,090
790 3,874
6,222 3,080
2,007
278
665
714 10,432
31,739 97,293
288,837 353,636 149,218 222,332
13,797
33L817 2,546 1,451
609 1,801
32,645
:>t"' <: t':l ~ Ul O ~ Montijo Hay........
G ulf of P anama ................ Piñas Pt. io Pt. Mangle .. Galapagos Islands
2,251 ···· ••• ·•· •.•••• ·395,563
7,587
964,550 416,580 753,044 753,044 146,984 348,721
14,104 42.329
216,839 216,839
11,989
55,155 95,206
2,251 407,552
7,587 1,039,142 2,984,253
:>~ tj
Ul Year-Año 1949 ::r: ......
Offshore .................. 266 266 ~ California Waters U.S.-Mexican Borde~ioPt:sa~Eügenio.· Pt. San Eugenio to Cape San Lazara Sania Mmia Bay.. 124 Magdalena Bay... 12,676 Almejas Bay.................................... 236,293 Gulf of California - Wesi Side ..... Gulf of California East Side ... Guaymas...... 949 AhomePt.......... 278,166 Banderas Bay ......................................... 1,514 Cape Corrientes to Pori AngelesGulf of Tehuaniepec' ................... San Benito to Cape Blanco, C.R. Gulf of Fonseca 3,336 Gulf of Nicoya .......... 1,157Judas Pi. io Cape Mala·.:·'
19,648Montijo Bay......... Gulf of Panama 513,973Piñas Pt. to Pt. Maliiie•• · 11,580Galapag03 Islands .
5,012 168,523 35,075
129,Q63 141,713
907 33,029
842
570,440
2,850 19,019 91,252 14,721
1,002 8,757
867
5,311 3,240
36,531 50,442
121,432 352
4,428 204
36 6,555
89 2,359
692
25,279 116,622
4,395 3,769 6,763
10,965
9,206 2,936
222
53
2,046
32.224
13,173 195,177 166,627 201,113 287,788 246,309 47,530
3,982 949
278,166 1,772 6,555
53 3,336 1,246 2,359
20,340 516,019
11,580 744,565
;t> tj ;t>
1,079,416 514,164 570,440 138,468 216,956 40,260 116,622 72,579 2,748,905
TABLE 5 Continued Year-Ano 1948 <:J1~
Calif.Colif. Gala- No. So. sardine Total
Are-a Anchovetc sardine pagos Anchovy Anchovy end No. Herring Selima M;'G. for areasardine anchovy
Sardina deSardina de Sardina de Anchoa Anchoa California Total por
Area Anchoveta California los ncroke surefia yanchoa Arenque Selima Misc. areaGalapagos nordica
California Waters .............................................. 6,339 11,771 12,839 790 31,739U.S.-Mexican Border to Pt. San Eugenio .. 78,897 9,551 4,971 3,874 97,293Pt. San Eugenio to Cape San Lazaro 79,328 104,624 104,885 288,837Santa Maria Bay. 787 164,589 19,312 162,726 6,222 353,636Magdalena Bay.
·······.·.218,72881,112 1,726 63,300 3,080 149,218
Almejas Bay...................................... 3,6042,ll07
222,332Gulf of California - West Side. 2,711 9,079 13,797Guaymas"' .... .
..... ··..·.·.·.. 331,539 331,817 :>-AhomePL ....... 278Banderas Bay........................................... 2,546 2,546 t"'Cape Corrientes to Port Angeles. 786 665 1,451 <:Gulf of Tdluantepec' ..................... t':lSan Benito to Cape Blanco, c.R. ..
972609 609 ~
Gulf of Fonseca. 115 714 1,801 UlGulf of Nicoya ....... 7,123 15,090 10,432 32,645 0Judas Pt. to Cape Mala.·.·.·.···
2,251 2,251 ~Montijo Bay........11,989Gulf of Panama ................ ···· ••• ·•· •.•••• ·395,563 407,552 :>-
Pifias Pt. to Pt. Mangle .. 7,587753,044 14,104
7,587 ~Galapagos Islands 216,839 55,155 1,039,142 tj964,550 416,580 753,044 146,984 348,721 42.329 216,839 95,206 2,984,253
UlYear-Ano 1949 ::r:......
Offshore ..................5,ll12 2,850
266 266 ~California Waters 5,3114,395
13,173 ;t-U.S.-Mexican Borde~ioPt:sa~Eugenio.· 168,523 19,019 3,240 195,177 tjPt. San Eugenio to Cape San Lazaro 35,075 91,252 36,531 3,769 166,627Santa Mmia Bay.. 124 129,Q63 14,721 50,442 6,763 201,113 ;t-Magdalena Bay... 12,676 141,713 1,002 121,432
35210,965 287,788
Almejas Bay.................................... 236,293 907 8,757 246,309Gulf of California - West Side ..... 33,029 867 4,428 9,206 47,530Gulf of California - East Side ... 842 204 2,936 3,982Guaymas...... 949 949AhomePt.......... 278,166
36278,166
Banderas Bay ......................................... 1,514 222 1,772Cape Corrientes to Port Angeles 6,555 6,555Gulf of Tehuantepec' ...................
53San Benito to Cape Blanco, C.R. 53Gulf of Fonseca 3,336
893,336
Gulf of Nicoya .......... 1,157 1,246Judas Pt. to Cape Mala·.:·'
19,6482,359 2,359
Montijo Bay......... 692 20,340Gulf of Panama 513,973 2,046 516,019Pifias Pt. to Pt. Maliiie•• · 11,580 11,580Galapag03 Islands. 570,440 25,279 116,622 32.224 744,565
1,079,416 514,164 570,440 138,468 216,956 40,260 116,622 72,579 2,748,905

TABLE 5 Continued Year - Año 1950 Calif.
Calif. Gala- No. So. sordine Total Area Anchoveta sordine pagos Anchovy Anchovy and No. Herring Salima Mise. for area
sardine anchovy
Sardina de Sardina de Sordina de Anchoo Anchoo Californio Total por
Area Anchoveta California las nórdica sureña y anchoo Arenque Salimo Mise. área Galópagos nórdico
Offshore.................. 3,429 3,429 California Waters ..... :::::::::::::: ........................... U.S.-Mexican Border to Pt. San Eugenio .. Pt. San Eugenio to Cape San Lazaro . Santa Maria Bay..... Magdalena Bay...... Almejas Bay.......................... Redondo Pt. to Cape Falso ............ Gu1f of California West Side .....
ÜÜ 498,558
6,097 45,804 31,160
188,708 17,243 4,703
410 23,496
3,699 17,804
168,767 12,840 35,515
234
5,413 3.542
62,729 81,120 34,344
625 6
4,660
22,026
507 2.ü42 6,821
20,560 797
19,977
15,209 67,657
264,698 290,114 109,479 508,718
410 65,733
Gulf of California East Side" .. Kino Pt... Guaymas .... Ahorne Pt ......... Banderas Bay........................................... Cape Corrientes to Port Angeles. San Benito to Cape Blanco, C.R... Gulf of Fonseca ...................... Gulf of Nicoya ..................... Judas Pt. to Cape Mala ... Montijo Bay......... Gulf of Panama ................ Piñas Pt. to Pt. Mangle............... Pt. Mangle to Pt. Santa Elena. Gu1f of Guayaquil· ... Ga1apagos Islands..
8,654 481,470 81,830
397,175 641
18,659
8.127 183,378
17,793 2,030
1,700.136 317,621 958,790 958,790 Year
238,859
Año 1951 187,148
1,812 874
6,615 3,773
687
3,596 44,674
31,562 31,562
514 73
2,449
1,902
30,952 90,023
8,654 481,470 81,830
398,987 2,029
73 18,669 9,064 3,773
10,029 184,065
17,793 2,030
1,024,900 3,568,813
>-3 c::: 2': >b:I >1-<
>-3 >:j 1-< Ul :::r::
Offshore...................................... California Waters .............................................. U.S.-Mexican Border to Pt. San Eugenio. Pt. San Eugenio to Cape San Lazaro . Santa Maria Bay.. Magdalena Bay... Almejas Bay............................... Redondo Pt. to Cape Falso .............. Gu1f of California West Side ..
312 2,751
246,077
4,413 44,175 41,150
173,466 76,901
25,996
124 6,286
31,135 70,232 22,029 10,777
2,323
1,944 4,388 5.ü42 1,454
64
960 3,522
508
12,977
149
68 239
1,899 1,516
5,980
273 10,699 77,322
116,969 206,270
93,907 246,077
2,323 45,017
t<:I Ul
Gulf of California East Side* ... Guaymas ...... Ahorne Pt ..........
433,088 419,033
433,088 419,033
Banderas Bay............................................ Cape Corrientes to Port Angeles ... Gulf of Tehuantepec ........................ San Benito to Cape Blanco, C.R. * .. Gu1f of Fonseca .................
3,003
789
172,062
.....
622 232
212
512
761
4,137 232
1,550
172,274 Judas Pt. to Cape Mala. Montijo Bay.. Gulf of Panama ................
2,360 204,479
25 1,114 10,822
2,551
25 14,296
207,030 Piñas Pt. to Pt. Mangle............... Pt. Mangle to Pt. Santa Elena Gu1f of Guayaquil.. .. Ga1apagos Is1ands .
43,970 282
179,892 129,782
1,570 115,262 117,539 51,089
43,970 282
181.462 413,672
<:1l <:1l
1,708,098 366,225 129,782 142,782 12,892 137,004 117,539 75,586 2,689,908
TABLE 5 Continued Year-Ano 1950Calif.
Calif. Gala- No. So. sardine TotalArea Anchoveta sardine pagos Anchovy Anchovy and No. Herring Selima Misc. for area
sardine anchovy
Sardina deSardina de Sardina de Anchoo Anchoa California Total por
Area Anchoveta California la, nordica surena Y anchoa Arenqu& Selima Misc. areaGalapagos nordico
Offshore..................5,413
3,429 3,429California Waters .............................................. 6,097 3,699 15,209U.S.-Mexican Border to Pt. San Eugenio .. 45,804 17,804 3,542 507 67,657Pt. San Eugenio to Cape San Lazaro. 31,160 168,767 62,729 2,042 264,698Santa Maria Bay.....
l,ll11188,708 12,840 81,120 625 6,821 290,114
Magdalena Bay...... 17,243 35,515 34,344 6 20,560 109,479Almejas Bay......................... 498,558 4,703 4,660 797 508,718Redondo Pt. to Cape Falso ............ 410
22,026 19,977410
Gulf of California - West Side ..... 23,496 234 65,733Gulf of California -- East Side" ..
8,654Kino Pt.. 8,654Guaymas. 481,470 481,470Ahome Pt......... 81,830 81,830Banderas Bay.......................................... 397,175 1,812 398,987Cape Corrientes to Port Angeles. 641 874 514 2,029San Benito to Cape Blanco, C.R... 73 73 >-3Gulf of Fonseca .. 18,659 18,669 c:::Gulf of Nicoya ..................... 6,615 2,449 9,064 2':Judas Pt. to Cape Mala.... 3,773 3,773Montijo Bay.... 8.127 1,902 10,029 ;J>Gulf of Panama ................ 183,378 687 184,065 telPinas Pt. to Pt. Mangle ................. 17,793 17,793Pt. Mangle to Pt. Santa Elena... 2,030 2,030 ;J>
......Gulf of Guayaquil· ...958,790 1,024,900 >-3Galapagos Islands.. 3,596 31,562 30,952 >:j
1,700,136 317,621 958.790 238,859 187,148 44,674 31,562 90,023 3,568,813 ......
Year-Ano 1951'(fJ
::r:Offshore.................... 124 149 273 l'=JCalifornia Waters .............................................. 4,413 6,286 10,699 '(fJ
U.S.-Mexican Border to Pt. San Eugenio. 44,175 31,135 1,944 68 77,322Pt. San Eugenio to Cape San Lazaro
:i1241,150 70,232 4,388 960 239 116,969
Santa Maria Bay.. 173,466 22,029 5,042 3,522 1,899 206,270Magdalena Bay.. 2,751 76,901 10,777 1,454 508 1,516 93,907Almejas Bay......................... 246,077 246,077Redondo Pt. to Cape Falso ............ 2,323
5,9ll02,323
Gulf of California - West Side ...... 25,996 64 12,977 45,017Gulf of California - East Side* ...
433,OllllGuaymas .. 433.088Ahome Pt.. 419,033 419,033Banderas Bay......................................... 3,003 622 512 4,137Cape Corrientes to Port Angeles. 232 232Gulf of Tehuantepec ............. ........... 789 761 1,550San Benito to Cape Blanco, C.R. .....Gulf of Fonseca ................... 172,062 212 172,274Judas Pt. to Cape Mala. 25 25Montijo Bay.. 2,360 1,114 10,822 14,296Gulf of Panama ............... 204,479 2,551 207,030Pinas Pt, to Pt. Mangle................ 43,970 43,970Pt. Mangle to Pt. Santa Elena 282 282Gulf of Guayaquil .... 179,892 1,570 181,462 <:nGalapagos Islands. 129,782 115,262 117,539 51,089 413,672 <:n
1,708,098 366,225 129,782 142,782 12,892 137.004 117,539 75,586 2,689,908

TABLE 5 Continued Year-Año 1952 -------- -----------C"'o--,I:-¡I:-.--------------------
Colif. Golo No. So. sardine Total Area Anchoveta sardine pagos Anchovy Anchovy oRd No. Herring 5alima Mise. fer area
sardine anchovy
Sardina de Sardina de Sardina de Anchoa Anchoa California Total por
Area Anchoveta California Jas nórdico sureña y anchoa Arenque Salima Mise. órea Galápagos nórdica
California Waters 495 82,999 83,494 U.S.-Mexican Border to Pt. San Eugenio.. Pt. San Eugenio to Cape San Lazara. . Santa Maria Bay. Magdalena Bay Almejas Bay.. Redondo Pt. to Cape Falso Gulf of California - West Side .
374,115
39,319 72.650 62,240 74,491
217 9,407
26,596
102.682 141,335 182,405
32,257 38
34,802 595
1.176 14.008
8.104 23,378
6,805
1.361 4,608
222
15,922
486 2,313 8.816
115 571 221
4,715
143.663 231.667 266.173 130,241 375,163
51,235 47,828
Gulf of California East Side . 736 302 1,038 Guaymas .. Ahorne Pt. Banderas Hay . Cape Corrientes to PClrt Angeles.. Gulf of Tehuantepec San Benito to Cape Blanco, C.R.' Gulf of Fonseca
584,706 72,460 70,394
775
286,"i48
172
1,092 2,103 9,318
722
4.892
1,057
585,600 72,460 76,378
2,103 11,150
286.148 Gulf of Nieoya Judas Pt. to Cape Mala Montijo Bay Gulf of Panama
.. 4.322 925,689
299 662 216
604 2,462
903 3,124 4,538
925,689 Piñas Pt. to Pt. ManglePt. Mangle to Pt. Santa Elena. Gulf of Guayaquil Galapagos Isla·~d:s
53,038
170.839 596,393
4"'1'2"
22 87.905 51,322
256 401
11,157
53.038 668
171.262 746,777
Cape Blanco io Pt._A_g_U_J_·a =2":.5:..:4=2.:..:4.::.86=-__-=2.::.86.::.,.::.I~:..:r.l=____~~59:..:6:..:,:..:39:..:3=---""""""'"5=-7'_'7"',I==I"'3=----=--cece,,--_-_-_-_.ce5~3:-.4"'7""1:~~~~I=2R_=4;-,:..:3R.::.l;-;4;_~~~~~5,;1.::.,n3=2R.::.2;;-_-_-_-_-ce-;;3~9::.9:..:8n;~;~~~.::.4;-=,2R:::.7~1,_=·~.:..=;: Year-Año 1953
Offshore . 688 837 1,318 2,843 California Waters '.. . . 80 35.866 35,946 U.S.-Mexic-an Border to Pt. San Eugenio. 26,037 98,260 3,314 127,611 Pt. San Eugenio to Cape San Lazara... 87.025 279,751 8,717 221 375,714 Santa Maria Bay. 221,812 121.241 42.610 4.523 5.458 395.654 Magdalena Bay 47.835 268.173 98,258 339 436 415.041
..................... 347.016Almejas Ba" 136 347,152 Redondo Pt. to Cape Falso 7,274 9,567 14,806 31,647 Gulf of CaUfornia - West Side 22,776 12,988 351 36,115 Gulf of CaUfornia - East Side 484 252 79 815 Guaymas 355.580 355,580 Ahomept. ... 165,491 334 165.825 Banderas Hay . 24,580 1,376 215 26,171 Cape Corrientes to Port Angeles 32 32 Gulf of Tehuantepec . 5,255 14,222 19.477 San Benito to Cape Blanco, C.R. -.' Gulf of Fonseca .. ... 5,435 5,436 Judas Pt. to Cape Mala' .. Montijo Bay 3,123 3.123 Gulf of Panama 623,290 713 624,003 Piñas Pt. to Pt. Mangle 92.667 92,667 Gulf of Guayaquil . 767 767 Galapagos Islands ..... . . 1,144,889 61.286 30,840 9,973 1,246,988 Cape Blanco to Pt. Aguja 2,364 3,580 5.944
304 33.455Pt. Aguja s_o::..u'--t_hce··= === .....=;;-;;=__---,=cn<=-__.,....c;-:;-=~--"""""'~=,---_-----.3'"'3c';.Oc15;-;:1c--_.....-;;;;--;= _ 1,617,949 413.232 1,144,889 813,546 35,515 167,705 88.302 30,840 35,936 4,348,Ó05
Totalfor areaMisc.Selima
So.Anchovy
No.Anchovy
Galapagos
sardine
Calif.sardine
Year - Aiio 1952-------- -----------C"'o--,I:-il:-.--------------------
sardineand No. Herringanchovy
AnchovefaArea
TABLE 5 Continued
Area AncnovetaSardina deCalifornia
Sardina delas
Galapagos
ARchaen6rdico
ARchaesurei'ia
Sardina deCaliforniayanchaa Arenque
nordicaSelima Misc.
Total porarea
California Waters 495 82,999 83,494U.S.-Mexican Border to Pt. San Eugenio.. 39,319 102,682 1,176 486 143,663Pt. San Eugenio to Cape San Lazaro. . 72,650 141,335 14,008 1,361 2,313 231,667Santa Maria Bay. 62,240 182,405 8,104 4,608 8,816 266,173Magdalena Bay 74,491 32,257 23,378 115 130,241A1mejas Bay.. 374,115 217 38 222 571 375,163Redondo Pt. to Cape Falso 9,407 34,802 6,805 221 51,235Gulf of California -- West Side. 26,596 595 15,922 4,715 47,828Gulf of California - East Side. 736 302 1,038Guaymas .. 584,706 172 722 585,600Ahome Pt. 72,460 72,460Banderas Bay . 70,394 1,092 4,892 76,378Cape Corrientes to P"rt Angeles.. 2,103 2,103Gulf of Tehuantepec 775 9,318 1,057 11,150San Benito to Cape Blanco, C.R.'Gulf of Fonseca 286,148 286.148Gulf of Nieoya 299 604 903Judas Pt. to Cape Mala 662 2,462 3,124Montijo Bay .. 4,322 216 4,538Gulf of Panama 925,689 925,689Pifias Pt. to Pt. Mangle 53,038 4"'1'2" 53,038Pt. Mangle to Pt. Santa Elena. 256 668Gulf of Guayaquil 170,839 22 401 171.262Galapagos Isla·~d:s 596,393 87,905 51,322 11,157 746,777
Cape Blaneo to Pt._A_g_U_J_·a =2":,5:..:4=2,:..:4.::.86=-__-=2.::.86.::.,.::.I~:..:r.l=____~~59:..:6:..:,:..:39:..:3=---""""""'"5=-7'_'7"',I==I"'3=----=--cccc"--_-_-_-_.cc5~3:-,4"'7""1:~~~~I=2R_=4;-,:..:3R.::.l;-;4;_~~~~~5,;1.::.,n3=2R.::.2;;-_-_-_-_-cc-;;3~9::,9:..:8n;~;~~~.::.4;-=,2R:::.7~1,_=·~.:..=;:Year-Ano 1953
2,84335,946
127,611375,714395,654415,041347,152
31,64736,115
815355,580165,82526,171
3219,477
5,436
3,123624,003
92,667767
1,246,9885,944
33,4554,348,005
35179
5,458436
9,9733,580
304
1,318
35,936
215
14,222
30,840
30,840
713
837
2214,523
339136
12,988252
3341,376
325,255
61,286
88,302
3,3148,717
42,61098,258
14,806
167,705
2,36433,15135,515
68835,86698,260
279,751121,241268,173
9,567
1,144,889
8026,03787,025
221,81247,835
7,27422,776
484
5,435
3,123623,290
92,667767
355,580165,491
24,580
..................... 347,016
Offshore .California Waters '.. . .U.S.-Mexican Border to Pt. San Eugenio.Pt. San Eugenio to Cape San Lazaro...Santa Maria Bay.Magdalena BayAlmejas BayRedondo Pt. to Cape FalsoGulf of CaUfornia - West SideGulf of CaUfornia - East SideGuaymasAhomept. ...Banderas Bay .Cape Corrientes to Port AngelesGulf of Tehuantepec .San Benito to Cape Blanco, c.R. -.'Gulf of Fonseca .. ...Judas Pt. to Cape Mala' ..Montijo BayGulf of PanamaPifias Pt. to Pt. MangleGulf of Guayaquil .Galapagos Islands..... . .Cape Blaneo to Pt. AgujaPt. Aguja s_o::..u'--t_hcc..= === .....=;;-;;=__---,=cn<=-__.,....c;-:;-=~--"""""'~=,---
1,617,949 413,232 1,144,889 813,546

---------
TABLE 5 Continued Year
Calif. Gale-Area Anchoveta sardine pagos
sardine
Sardina de Sardina de Area Anchoveta California las
Galópagos California Waters .... _..... _._ .... _....... ____ .. _. __ .... _...... 184 U.S.-Mexican Border to Pt. San Eugenio_. 35.862 Pt. San Eugenio to Cape San Lazaro_ .. 27,532 Santa Maria Bay._ ....... 1.626 126.682 Magdalena Bay_ 11.238 1.120 Almejas Bay ._ ........................... ......... 101.754 Redondo Pe. to Cape Falso 10,756Gulf of California - West Side.-·· 1,064 Guaymas .. __ . 439,903 Ahorne Pt......... ____ .___ ................. 114.13::> Banderas Bay.... __ ....... __ .. _........ _.. _.. __. 328.814 Cape Corrientes to Port AngelesGulf of Tehuantepec _..... 1,349 Gulf of Fonseca .................. 47,793 Judas Pt. to Cape Mala' .. Gulf of Panama ........ __ .... 760.564 Piñas Pt. to Pt. Mangle. 12.369 Galapagos Islands ... 589.713 Cape Blanco tn Pt. Agüj;¡' 731 Pt. Aguj a south ..
1,820.27-4--203.200 5bu,713
'Some baiting effort but no catch
•Algún esfuerzo dedicado a la pesca de carnada, pero sin resultado.
Año 1954
Na. Anchovy
Anchoa nórdica
26.986 41,390
302,780 138.733 21.636
69,764
604,289
So. Anchovy
Anchoa .sureña
...... 226,751 326,162 552,913
Calif. sordine
and No. anchovy
Sardina de California y anchoa nórdica
35.100 15,674
395
14,264
......
65,433
Herring
Arenque
176 1.167 1.215
561
1.548 1,183 9.527
486
258
32,750
48,871
Solima Mise.
Salimo Mise.
716 20
253 445
1.768 772
9,851
374
22.904 4.599
919 22,904 19,717
Total for orea
Total por área
27.170 77.428
366.579 284,646
37.409 101.754
94,784 1.878
440.348 114.133 332.130
1.955 20.727 48,279
761.196 12.369
649.966 227,482 327.081
3,927,314
>-,3 c:::: Z ;J:>
td ;J:> ..... >-,3 ":J ..... Ul ~
t<:1 Ul
-J '"
TABLE 5 Continued Year-Aiio 1954
Col;l.CoIH. Gale- Na. So. sardine Total
Area Anchoveta sardine pagos Anchovy Anchovy and No. Herring Selima Misc. for areasardine anchovy
------~-
Sardina deSardina de Sardina de Anchea Anchoa California Total por
Area Anchoveta California 10' n6rdica surena y anchoa Arenque Selima Misc. areaGalapagos nordica
California Waters .............................................. 184 26,986176
27,170U.S.-Mexican Border to Pt. San Eugenio. 35,862 41,3S0
35,iOO77,428
Pt. San Eugenio to Cape San Lazaro... 27,532 :102,780 1,167 366,579 >-,3Santa Maria Bay.. 1,626 126,682 138,733 15,674 1,215 716 284,646 c::::Magdalena Bay. 11,238 1,120 21,636 395 20 37,409 ZAlmejas Bay ............................ 101,754
10,756 69,764 14,264101,754 >Redondo Pt. to Cape Falso 94,784
Gulf of California - West side.·.··439,903
1,064 561 253 1,878 tdGuaymas 445 440,348 >AhomePt .. ·.·.·.: ..... 114,13:>
1,548 1,768114,133 .....
Banderas Bay............. .......................... 328,814 332,130 >-,3Cape Corrientes to Port Angeles 1,183 772 1,955 "'.JGulf of Tehuantepec ...... 1,349 9,527 9,851 20,727 .....
UlGulf of Fonseca .................. 47,793 486 48,279 ::r:Judas Pt. to Cape Mala' ..Gulf of Panama ............... 760.564 258 374 761,196 t<:1Pifias Pt. to Pt. Mangle. 12,369 12,369 UlGalapagos Islands ... 589,713
226,75132,750 22,904 4,599 649,966
Cape Blanco to Pt. Aguja" 731 227,482Pt. Aguja south .. 326,162 919 327,081
1,820,274 203,200 5b~,713 604,289 552,913 65,433 48,871 22,904 19,717 3,927,314
'Some baiting effort but no catch
•Algun esfuerzo dedicado a la pesca de carnada, pero sin resultado.

TABLE 6. Catch of anchovetas per day's baiting. by vessel size·class and year. for Almejas Bay. Ahome Point. Guaymas. Gulf of 01 ce
Fonseca. and Gulf of Panama. 1946-1954. based on 10gbook information.
TABLA S. Pesca de anchovetas por día de actividad. por clase de tamaño de barcos y año. en Bahía de Almejas. Punta Ahome. Guaymas. Golfo de Fonseca y Golfo de Panamá. basada en información de los registros de bitácora. 1946-1954.
1946 1947 1948 1949 1950
Catch Catch per Catch Cctch per Catd Catch per Cafch Cotch per Catch Catch per Area and No. days in day's No. days in day's No. dcys in day's No. days in day's No. days in day's size-c1ass baiting scoops baiting bciting scoops bciting bciting 5COOpS boiting baifing scoops baiting bajting scoops baHing
Area y No. de Pesca Pesca por No. de Pesca Pesca por No. de Pesca Pesca por No. de Pesca Pesca por No. de Pesca Pesca por clase de días de en día de días de en día de días de en día de días de en día de días de en día de tamaño actividad "scoops" actividad actividad ' 'sCOOpS" actividad adividad "scoops' , actividad actividad "scoops" actividad actividad "scoops" actividad
Almejas Bay ;J>1 2.0 26 13.0 1.0 103 103.0
2 8.5 2.775 3:ÚÚ¡ 10.0 980 98:0 39.0 5,410 138.7 :i:O 470 156:1 3.0 613 204.3 t"' 3 7.0 1.370 195.7 42.5 10.227 240.6 77.5 27.523 355.1 111.5 29.777 267.0 143.5 64,587 450.1 <: 4 5.0 900 180.0 40.5 11.759 290.3 91.5 41.237 450.7 215.0 64.758 301.2 206.5 127,084 615.4 M 5 6.0 1.332 222.0 20.0 5.751 287.6 33.0 15,157 459.3 72.0 20,677 287.2 49.5 35,795 723.1 ::o 6 3.5 3,120 891.4 Ul
O Ahorne Point Z
1 2.0 530 265.0 1.0 320 320.0 ;J>2 12.5 1,030 82.4 45.5 6,102 134.1 57.0 8.650 151.8 1.0 310 310.0 1.0 O O 3 9.0 4.163 462.6 61.0 17.322 284.0 88.5 36.651 414.1 25.0 19,061 762.4 7.0 5,950 850.0 Z 4 4.0 2.400 600.0 23.0 6.517 283.3 119.5 67,141 564.2 118.0 88,434 749.4 41.0 26,041 635.1 t1 5 3.0 300 100.0 26.5 8.995 339.4 48.0 28.059 584.6 24.0 18.895 787.3 6.0 4.892 815.3
Ul6 13.0 3.030 233.1 :r: ......Guaymas ~ 1 8.0 290 36.2 3.0 135 45.0 2.0 O O 2.0 O O 1.5 532 354.7
2 35.5 3,714 104.6 27.0 5,211 193.0 2.0 O O 3 33.0 13,041 395.2 40.0 15,239 381.0 1.0 O O 65:0 30.564 470::! ~ 4 3.0 2.097 699.0 58.5 22.282 380.9 5.0 O O 7:0 535 76:4 117.0 102.813 878.7 ;J> 5 51.0 32.039 628.2 143.5 64,206 447.4 4.0 O O 60.5 53.435 883.2 6 5.0 3,000 600.0
Fonseca 1 2 1.0 300 300:0 3 8:0 4.205 525.6 8.0 1.130 141.2 5.0 O O 4.0 900 225.0 4.5 640 142.2 4 11.0 3.060 278.2 14.5 524 36.1 90 635 70.6 16.5 6,126 371.2 5 23:0 6.944 301.9 38.5 9.626 250.0 1.0 O O 3.0 1,400 466.7 6 2.0 900 450.0
Panama 1 2 6.0 2.500 416.7 3 3.0 1,800 600.0 18.0 5,770 320.6 7.0 5.700 814.3 39.5 12,347 3ii!:6 4 36.0 12.120 336.7 184.5 85,034 460.9 186.5 124,073 665.3 135.5 52.055 384.2 5 5.0 J.750 350.0 82.0 34.793 424.3 123.5 70.033 567.1 85.5 73,207 856.2 46.0 15,276 332.1 6 2.0 800 400.0 12.0 4.050 337.5 15.0 10.264 684.3
TABLE 6. Catch of anchovetas per day's baiting, by vessel size-class and year, for A1mejas Bay, Ahome Point, Guaymas, Gulf of 01co
Fonseca, and Gulf of Panama, 1946-1954, based on logbook information.
TABLA S. Pesca de anchovetas por dia de actividad, por clase de tamano de barcos y ano, en Bahia de A1mejas, Punta Ahome,Guaymas, Golfo de Fonseca y Golfo de Panama, basada en informacion de los registros de bitacora, 1946-1954.
1946 1947 1948 1949 1950
Catch Catch per Catch Catch per Cetch Catch per Catch Catch per Catch Catch perArea and No. days in day's No. days in day's No. days in day's No. days in day's No. days in day'ssize-class baiting scoops baiting baiting scoops baiting baiting scoops baiting baiting scoops baiting baiting scoops bo'iting
Area y No. de Pesce Pesce por No. de Pesca Pesce por No. de Pesca Pesca por No. de Pesco Pesca por No. de Pesce Pesca porclase de dios de en dlo de dios de en dlo de dlos de en dlo de dies de en die de dfes de en die detomono actividad "scoops" actividod actividad ' 'scoops" actividod adividad "scoops' , aetividad actividad "scoops" actiyidad oetividcd "scoops" cetividcd
A1mejas Bay;J>1 2.0 26 13.0 1.0 103 103.0
2 8.5 2.775 326:5 10.0 980 98:0 39.0 5,410 138.7 io 470 156:7 3.0 613 204.3 t"'3 7.0 1.370 195.7 42.5 10.227 240.6 77.5 27.523 355.1 111.5 29.777 267.0 143.5 64,587 450.1 <:4 5.0 900 180.0 40.5 11.759 290.3 91.5 41.237 450.7 215.0 64.758 301.2 206.5 127,084 615.4 M5 6.0 1.332 222.0 20.0 5.751 287.6 33.0 15,157 459.3 72.0 20,677 287.2 49.5 35,795 723.1 ::06 3.5 3,120 891.4 Ul
0Ahome Point Z
1 2.0 530 265.0 1.0 320 320.0 ;J>2 12.5 1,030 82.4 45.5 6,102 134.1 57.0 8.650 151.8 1.0 310 310.0 1.0 0 03 9.0 4.163 462.6 61.0 17.322 284.0 88.5 36.651 414.1 25.0 19,061 762.4 7.0 5,950 850.0 Z4 4.0 2.400 600.0 23.0 6.517 283.3 119.5 67,141 564.2 118.0 88,434 749.4 41.0 26,041 635.1 t15 3.0 300 100.0 26.5 8.995 339.4 48.0 28.059 584.6 24.0 18.895 787.3 6.0 4.892 815.36 13.0 3.030 233.1 Ul
:r:Guaymas ......
1 8.0 290 36.2 3.0 135 45.0 2.0 0 0 2.0 0 0 1.5 532 354.7 ~2 35.5 3,714 104.6 27.0 5,211 193.0 2.0 0 0
65:0 ~3 33.0 13,041 395.2 40.0 15,239 381.0 1.0 0 0 30.564 470:24 3.0 2.097 699.0 58.5 22.282 380.9 5.0 0 0 7:0 535 76:4 117.0 102.813 878.7 ;J>5 51.0 32.039 628.2 143.5 64,206 447.4 4.0 0 0 60.5 53.435 883.26 5.0 3,000 600.0
Fonseca1
300:028:0
1.0 3003 4.205 525.6 8.0 1.130 141.2 5.0 0 0 4.0 900 225.0 4.5 640 142.24 11.0 3.060 278.2 14.5 524 36.1 90 635 70.6 16.5 6,126 371.25 2io 6.944 301.9 38.5 9.626 250.0 1.0 0 0 3.0 1,400 466.76 2.0 900 450.0
Panama1
6.02 2.500 416.75.700 39.53 3.0 1,800 600.0 18.0 5,770 320.6 7.0 814.3 12,347 3i:i:6
41,750
36.0 12.120 336.7 184.5 85,034 460.9 186.5 124,073 665.3 135.5 52.055 384.25 5.0 350.0 82.0 34.793 424.3 123.5 70.033 567.1 85.5 73,207 856.2 46.0 15,276 332.16 2.0 800 400.0 12.0 4.050 337.5 15.0 10.264 684.3

TABLE 6 Continued
1951 1952 1953 1954
Area and size-c1ass
Area y clase de tamaño
No. days baiting
No. de días de
actividad
Catch in
scoops
Pesca en
"scoops"
Ccfch per doy's;
boiting
Pesca por día de
actividad
No. days baiting
No. de días de
actividad
Catch in
scoops
Pesca en
"scoops' :
Cotch per doy's
baiting
Pesca por díe de
actividad
··"'*.f$:ir0wi:'-/\ No. days boiting
No. de días de
actividad
Cctch in
scoops
Pesca en
"scoops"
Cotch per dey's
boiting
Pesca por día de
actividad
No. days baiting
No. de días de
actividad
Cotch ;n
5COOpS
Pesca en
"scoops' .
Cotch per day's
baiting
Pesca por día de
actividad
Almejas Hay
1 2 3 4 5 6
1l.0 198.0 190.5
18.0
4,303 85,619
106,819 8,700
391::2 432.4 560.7 483.3
9,5 33.0
422.0 241.0
58.5 18.0
1,515 8,577
177,519 100,200 27,011
8,879
159.5 259.9 420.7 415.8 461.7 493.3
1.0 30.5
255.0 192.0 55.0
9.0
400 4,565
122,730 125,742 42,599 6,942
400.0 149.7 481.3 654.9 774.5 771.3
3.0 11.5
116.0 37.0 5.0
400 2,645
65,990 17,945 5,400
133.3 230.0 568.8 485.0
1,080.0
Ahorne
1 2 3 4 5 6
Point
2.0 19.0
197.0 244.5
50.0
190 6,145
103,704 191,226 47,688
95.0 323.4 526.4 782.1 953.8
11:5 106.0
77.0 4.0
1,695 33,471 27,681
2,244
147.4 315.8 359.5 561.0
10:0 86.0 86.0 18.0 2.0
1,809 56,941 66,710 13.573 4,090
180.9 662.1 775.7 754.0
2,045.0
'2:0 9.0
82.0 21.0
245 7,680
68,816 25,455
12:2:5 853.3 839.2
1,212.1
8c:: ~ td ~
H
Guaymas
1 2 3 4 5 6
5.0 7.5
198.0 356.0
66.0 8.0
276 765
100,137 207,561
42,058 7,400
55 ~
L:2l ':;0..:0;(-' •uü .... v
637.2 9_5.0
2.0 22.0
20l.0 492.0
97.0
335 5.009
119,567 324,597
63,054
192.5 227.7 397.2 659.8 659.0
8.0 145.0 217.0
70.0 11.0
2,380 72,406
156,428 66,029 10,171
297.5 499.4 720.9 943.3 924.6
3.0 5.0
172.5 265.0
38.0 27.0
O 2,880
107,192 212,519
36,873 22,716
O 576.0 621.4 802.0 970.3 841.3
~
H Ul ::r: tx:l Ul
Fonseca
1 2 3 4 5 6
122.0 164.0
16.0 16.0
40.699 68,402 12,240 12,950
333.6 417.1 765.0 809.4
146.0 274.0
57.0 25.0
54,223 133,656
39,449 18,400
3714 487.8 692.1 736.0
ü:¡¡ 25.0 ......
1,050 3,790
......
91:3 151.6
......
11.0 51.5 15.0
3,3M 28,877
8,320
307.3 560.7 554.7
Panama
1 2 3 4 5 6
8.5 58.0
104.5 73.5 24.0
2,045 25,896 56.413 55,382 20,850
240.6 446.5 539.8 753.5 868.8
25.0 203.0 703.0 230.5
79.0
4,854 109,373 427,139 163,870 75,075
194.2 538.2 607.6 710.9 950.3
3cúi 98.0
695.0 246.5
79.0
10,124 32,365
291,579 123,386 44,100
33'7':5 330.2 419.5 500.6 558.2
142.5 714.0 279.5
73.0
58,375 368,449 185,105 58.016
409.6 516.0 662.3 794.7
<:J1 (O
TABLE 6 Continued
1951 1952 1953 1954
Catch Catch per Catch Catch per ···q:.f$~;ijwi:'"/\ Catch Catch per Catch Catch perArea and No. days in day's No. days in doy's No. days in dey's No. days ;n day'ssize-class baiting scoops baiting baiting scoops baiting baiting scoops baiting baiting scoops baiting
Area y No. de Pesco Pes co por No. de Pesco Pesco per No. de Pesco Pesco per No. de Pesco Pesco porclose de dies de en die de dies de en die de dies de en dio de dies de en die delomona octividad "scoops" octividod actividad "scoops' : actividad actividad "scoops" octividad C1ctividad "scoops" actividad
Almejas Bay
1i1:(j 4.303 391:2
9.5 1,515 159.5 1.0 400 400.0 3.0 400 133.32 33.0 8,577 259.9 30.5 4,565 149.7 11.5 2,645 230.03 198.0 85.619 432.4 422.0 177,519 420.7 255.0 122.730 481.3 116.0 65.990 568.84 190.5 106.819 560.7 241.0 100.200 415.8 192.0 125.742 654.9 37.0 17.945 485.05 18.0 8.700 483.3 58.5 27,011 461.7 55.0 42.599 774.5 5.0 5,400 1,080.06 18.0 8,879 493.3 9.0 6,942 771.3
Ahome Point 81 2.0 190 95.0
c::2 19.0 6,145 323.4 11:5 1.695 147.4 10:0 1,809 180.9 2:ii 245 12.2:5 ~3 197.0 103.704 526.4 106.0 33,471 315.8 86.0 56,941 662.1 9.0 7.680 853.34 244.5 191.226 782.1 77.0 27.681 359.5 86.0 66.710 775.7 82.0 68.816 839.2 to5 50.0 47.688 953.8 4.0 2.244 561.0 18.0 13,573 754.0 21.0 25,455 1,212.1 :;J>6 2.0 4.090 2,045.0 .....
Guaymas ~1 5,0 276 55 ~ 2.0 385 192.5 3.0 0 0 r:n.2 7.5 765 L2t 22.0 5.009 227.7 8.0 2.380 297.5 5.0 2,880 576.0 ::r:3 198.0 100,137 ~OV :::Ol.O 119,567 397.2 145.0 72,406 499,4 172.5 107,192 621.4 tx:l4 356.0 207.561 ::'(-' . 492.0 324.597 659.8 217.0 156,428 720.9 265.0 212.519 802.0 r:n.<J\),-.V
5 66.0 42.058 637.2 97.0 63,05. 658.0 70.0 66,029 943.3 38.0 36,873 970.36 8.0 7,400 9_5.0 11.0 10.171 924.6 27.0 22.716 841.3
Fonseca
12
40,699 333:6 54,223 3714 i1:5 91:3 3.3803 122.0 146.0 1.050 11.0 307.34 164.0 68,402 417.1 274.0 133,656 487.8 25.0 3.790 151,6 51.5 28,877 560.75 16.0 12.240 765.0 57.0 39.449 692.1 15.0 8,320 554.76 16,0 12,950 809.4 25.0 18.400 736.0
Panama
125:0 337:52 8.5 2,045 240.6 4.854 194.2 30.0 10.124
3 58.0 25,896 446.5 203.0 109,373 538.2 98.0 32.365 330.2 142.5 58.375 409.64 104.5 56,413 539.8 703.0 427.139 607.6 695.0 291.579 419.5 714.0 368.449 516.05 73.5 55,382 753.5 230.5 163.870 710.9 246.5 123.386 500.6 279.5 185.105 662.36 24.0 20,850 868.8 79.0 75,075 950.3 79.0 44,100 558.2 73.0 58.016 794,7
<:J1(0

60 ALVERSON AND SHIMADA
TABLE 7. Efficiency faciors employed io siandardize ihe caich per day's baiiing of anchoveias for Almejas Bay. Ahorne Poini. Guayrnas. Gulf of Fonseca. and Gulf of Panama. 1946·1954.
TABLA 7. Faciores de eficiencia empleados para uniformar la pesca de anchoveias por día de actividad en Bahía de Almejas. Punia Ahorne. Guayrnas. Golfo de Fonseca y Golfo de Panamá. 1946·1954.
Meen EH. '" 5ize Almejas Guoymas Ahorne Pt. Fonseco Panema Factors Clan ---- --------_.
AII Areas
factores pro'lledio'" Clase de Almeias Guaymas Pt. Ahorne Fonsecc Panamá de eficiencia. tamaño Todas las áreas
1 .038 .070 ** .052
2 .509 .333 .297 ** .567 .411
3 .878 .703 .902 .634 .849 .786
4 1.000 1.000 1.000 1.000 1.000 1.000
5 1.150 1.088 1.162 1.233 1.200 1.166
6 1.182 1.163 ** ** 1.254 1.199
Jl:Geometric mean.
"'Mean efficiency factors for all areas used for these size-classes and areas.
"Media geométrica.
• "Los factores promedio de eficiencia para todas las áreas han sido usados para estas clases de tamaño y áreas.
60 ALVERSON AND SHIMADA
TABLE 7. Efficiency faciors employed io Hiandardize ihe caich per day's baitingof anchoveias for Almejas Bay. Ahome Poini. Guaymas. Gulf of Fonseca.and Gulf of Panama. 1946-1954.
TABLA 7. Faciores de eficiencia empleados para uniformar la pesca de anchoveias por dia de aciividad en Bahia de Almejas. Punia Ahome. Guaymas,Golfo de Fonseca y Golfo de Panama. 1946-1954.
Mean Eff. '"Size Almejos Guaymas Ahome Pt. Fonseca Panama FactorsClass All Areas
-----"-Factores pro'lledio*
Clase de Almeios Guaymas Pt. Ahome Fonseca Panama de eficiencia.tamana Todas las areas
1 .038 .070 ** .052
2 .509 .333 .297 ** .567 .411
3 .878 .703 .902 .634 .849 .786
4 1.000 1.000 1.000 1.000 1.000 1.000
5 1.150 1.088 1.162 1.233 1.200 1.166
6 1.182 1.163 ** ** 1.254 1.199
'Geometric mean.
"'Mean efficiency factors for all areas used for these size-classes and areas.
"Media geometrica.
• "Los factores promedio de eficiencia para todas las areas han sido usados para estas clases detamaiio y areas.
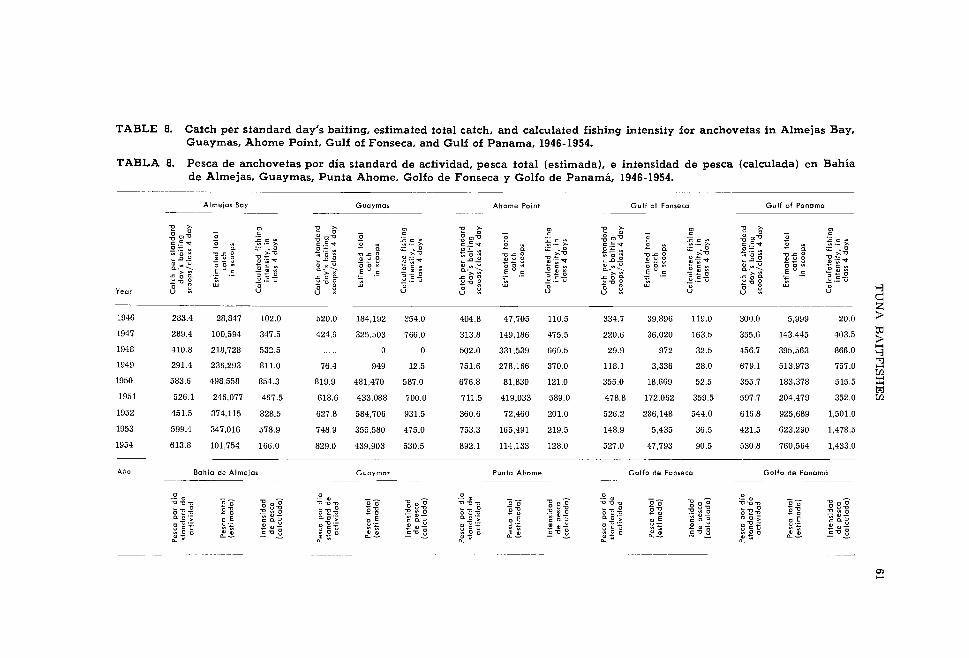
TABLE 8. Catch per standard day's baiting, estimated total catch, and calculated fishing intensity for anchovetas in Almejas Bay, Guaymas, Ahome Point, Gulf of Fonseca, and Gulf of Panama, 1946-1954.
TABLA 8. Pesca de anchovetas por día standard de actividad, pesca total (estimada). e intensidad de pesca (calculada) en Bahía de Almejas, Guaymas, Punta Ahome, Golfo de Fonseca y Golfo de Panamá, 1946-1954.
"-------- ~-~---.----
Almejas Bay Guaymas Ahorne Point Gulf of Fonseca Gu If of Pancma
"O >- "O >- "O >- "O >o o o ~ o g> "E ~ ~ o..g ~
rn"lJ o
o '" ~ rn-8 e '" ..g rn""C o .g el ""C o '" ..g rn"lJ E .~
~o~ ~ o ~ ~ o ~ ~ o ~:c l: '" l: .=""'<t "O - o. ~
"'.-.. >-o l:.:: '<t "O
- o. w::",.-
.. >o e .=""'<t "O
- o. ='-.. ~ l: .=""'<t "O - o. -.:
",.-..
>-o l: .=""t .E O- :'-:' ~2:= '" 2·-:: '" ,E;';; '" 2.-:: '"
~ o ~ "o~o ~."§ ~ ""C.?:'"O ~ o ~ "o~o '"O oC ""'O ~ O ~ "o~o ""C Z- ""C ~ o ~ "O ~ o ""'O oC ""'O "o~o ""C oC ""'O ... .o,S'! .!!~8 ~.;;:¡""'<t ... .c S! ~ ~ 8 2'':;;""'<t ... .c,S'! 2~8 2'¡¡¡"'t .... .c ,S'! 2':: 8 ... .c,S'! 2.::8• ~ u o o ~ o o ~ • ~ u o o ~ • ~ u o o ~ • ~ u o o ~ • ~ u o o ~
0.. "- o o ~ o o ~ ~.~~ ]'~~0.. "- 0.. "- 0.. " >-~ E u o E u o - .~ E u o 0.->.-:;' E u o E u o
>-~ >-~ >-~
~oo. o - o o - o o - o~ .- ~oo. ~oo. ~oo. ..coo.]~~ ~ .- ~ .- ].~~ ~ .- ~ .~.=u ~.=u ~.=u'::"'C g .:: -c g .:: -c g .:: -O g '::"'C g Year U
o u ~ U
o Uo u
~
(j 8 :;: U o 8 :;: (j U
o u ~ U
o 1-3 ~
1946 283.4 28,847 102.0 520.0 184,192 354.0 404.8 47,705 110.5 334.7 39,896 119.0 ~o~ 5,999 20.0 ~ tJ:I1947 289.4 100,594 347.5 424.9 325,503 766.0 313.8 149,186 475.5 220.6 36,020 163.5 W~ 143,445 403.5 >......1948 410.8 218,728 532.5 o 502.0 331,539 660.5 29.9 972 32.5 ~~ 395,563 866.0 1-3 "':l1949 291.4 236,293 811.0 76.4 949 12.5 751.6 278,166 370.0 118.1 3,336 28.0 67~1 513,973 757.0 ...... r.tJ
1950 583.6 498,558 854.3 819.9 481,470 587.0 676.8 81,830 121.0 355.0 18,669 52.5 W~ 183,378 515.5 ::r: t<:I
1951 526.1 246,077 467.5 618.6 433,088 700.0 711.5 419,033 589.0 478.8 172,062 359.5 ~~ 204,479 352.0 r.tJ
1952 451.5 374.115 828.5 627.8 584,706 931.5 360.6 72,460 201.0 526.2 286,148 544.0 6WB 925,689 1,501.0
1953 599.4 347,016 578.9 748.9 355,580 475.0 753.3 165,491 219.5 148.9 5,435 36.5 ~~ 623,290 1,478.5
1954 613.8 101,754 166.0 829.0 439,903 530.5 892.1 114,133 128.0 527.0 47,793 90.5 ~B 760,564 1,433.0
4.r,Q Bahía de Almejas Guaymos Punta Ahorne Golfo de Fonseca Golfo de Panamá
.!:! tt> ,~ (]) ,C::! 111 ,~ (])
"0"0"0 c- o o o ~~] 00 o o o "0"0"0 c- o o o "0"0"0 c- o o o "0"0"0 0 o o o _ o _ o"O - "O _ o "O "O _ o "O _0"0o "Ou"O -"O "Ou"O _0"0o "Ou"O _0"0o "Ou"O _0"0o "O u"O'-"O..g '--c..g... 0 _ Lo..o"E~ "¡¡¡ a1,S'! o"E~ E o '¡;¡ a;.5! o"E~ "¡¡¡ di,S'! o 'Vi ;P.E! o _ ';;¡ a;2o. o > o o. o 0.0> o. O > o o. o o. o > o o o. o 0.0> o o. oe c. =- E"O .- §.~ "O .- 8.~ "O .- §.~ "O .- "O .- §oÉo l: ti 211l~ 211l~ O l: ti .!dJ~ o e ti :;:·z .! 11l~ C l: ti .!! Q)~.~ °Cu .~ .~ .~:::: o o ::::.2 c"'C1 .::"t:I-ª.Oo.~ -="'C--ª. ~ ~ o ~~ ..::"O.-ª. .~
O o.~ ~.g o.~ ~~C o.~ "::"'C-ª. ~-:;; o. o. o.
a> ......
TABLE 8. Catch per standard day's baiting, estimated total catch, and calculated fishing intensity for anchovetas in Almejas Bay,Guaymas, Ahome Point, Gulf of Fonseca, and Gulf of Panama, 1946-1954.
TABLA 8. Pesca de anchovetas por dia standard deactividad, pesca total (estimada). e intensidad de pesca (calculada) en Bahiade Almejas, Guaymas, Punta Ahome, Golfo de Fonseca y Golfo de Panama, 1946-1954.
._._------~~~.-_. -----------
Almejas Boy Guaymas Ahorne Point Gulf of Fonseca Gu If of Panama
Year
1946
1947
1948
1949
1950
1951
1952
1953
1954
283.4
289.4
410.8
291.4
583.6
526.1
451.5
599.4
613.8
28,847
100,594
218,728
236,293
498,558
246,077
374.115
347,016
101,754
102.0
347.5
532.5
811.0
854.3
467.5
828.5
578.9
166.0
520.0
424.9
76.4
819.9
618.6
627.8
748.9
829.0
184,192
325,503
949
481,470
433,088
584,706
355,580
439,903
'"o~ 0 •
<II 0- >_ ,0
>-"
)1]o
U
354.0
766.0
o12.5
587.0
700.0
931.5
475.0
530.5
404.8
313.8
502.0
751.6
676.8
711.5
360.6
753.3
892.1
47,705
149,186
331,539
278,166
81,830
419,033
72,460
165,491
114,133
110.5
475.5
660.5
370.0
121.0
589.0
201.0
219.5
128.0
334.7
220.6
29.9
118.1
355.0
478.8
526.2
148.9
527.0
39,896
36,020
972
3,336
18,669
172,062
286,148
5,435
47,793
119.0
163.5
32.5
28.0
52.5
359.5
544.0
36.5
90.5
300.0
355.6
456.7
679.1
355.7
597.7
616.8
421.5
530.8
5,999
143,445
395,563
513,973
183,378
204,479
925,689
623,290
760,564
20.0
403.5
866.0
757.0
515.5
352.0
1,501.0
1,478.5
1,433.0
Bahia de Almejas Guaymas Punta Ahorne Golfo de Fonseca Golfo de Panama

ESTUDIO DE LA PESQUERIA DE PECES DE CARNADA PARA EL
ATUN EN EL PACIFICO ORIENTAL, CON PARTICULAR
REFERENCIA A LA ANCHOVETA
(CETENGRAULlS MYSTlCETUS)
por
Franklin G. Alverson y Bell M. Shimada
INTRODUCCION
Los barcos que emplean cañas y cuerdas y carnada viva, son los que realizan la mayor parte de la pesca de atún aleta amarilla y barrilete en el Océano Pacifico Oriental. De 1931 a 1954 estos barcos han desembarcado, en promedio, más de las tres cuartas partes de las pescas anuales de ambas especies (Shimada y Schaefer, 1956). Con el aumento sustancial en dicha producción en los últimos años, ha habido una mayor demanda por carnada viva. Esta creciente necesidad de obtener cantidades mayores de pecescebo, ha originado importantes cuestiones relativas a la mejor forma en que estas poblaciones pueden ser utilizadas. A la Comisión Interamericana del Atún Tropical le ha tocado ocuparse de varios aspectos de este problema, desde que fué establecida en el año 1950.
Este informe ofrece algunos de los resultados obtenidos a través de los estudios de la Comisión sobre los peces-cebo importantes para la pesqueria de atún aleta amarilla y barrilete; señala brevemente el origen y desarrollo de la pesqueria de carnada; describe sus operaciones, extensión y rendimiento, y trata algunos aspectos de los efectos de la explotación sobre las poblaciones de dichos peces en el Pacifico Oriental, particularmente de la anchoveta (Cetengraulis mysticetus).
RECONOCIMIENTO
Nuestro sincero reconocimiento a los propietarios y capitanes de embarcaciones atuneras que han cooperado al poner a nuestra disposición sus registros de pesca para su estudio.
LA PESQUERIA DE PECES DE CARNADA
Origen y desarrollo
Es difícil determinar exactamente cómo y cuándo el empleo de carnada viva llegó a ser aceptado como un medio para la captura del atún en la región del Pacífico Oriental, pero se sabe, por reseñas publicadas (Pacific Fisherman, 1913) que ya en 1910 se pescaba la albacora, en aguas frente
62

63 PECES DE CARNADA
a California, mediante el empleo que hacían los pescadores de cuerdas de pescar cebadas con sardinas vivas. Estas cuerdas de pescar con el tiempo fueron reemplazadas por cañas de bambú y líneas; el método de esparcir carnada viva sobre la superficie del agua para atraer a los peces en inducirlos a morder cebos artificiales, fué adoptado también. Estos métodos de pesca se usaron para la captura del atún aleta amarilla y barrilete en los alrededores del año 1918, cuando la pesquería de California dejó la albacora para dedicarse principalmente a las especies tropicales de atún (Calíf. Bur. Mar. Fish., 1949).
El desarrollo de la pesquería de carnada viva siguió mano a mano con el crecimiento y expansión de la pesquería de atún aleta amarilla y barrilete cuyas características generales han sido ya descritas (Shimada y Schaefer, 1956). Las actividades en los últimos años de la década de 1910 eran todavía de naturaleza local y en consecuencia las primeras áreas para carnada se encontraban frente al sur de California, en los alrededores de San Pedro y San Diego. A principios de la segunda década, ya la pesquería de atún tropical se había internado en aguas mexicanas, rumbo al sur hasta Cabo San Lucas (Figura 1), Y en 1925, cuando el primer cliper atunero de largo radio de acción comenzó a operar, otras áreas a lo largo de la costa de Baja California que da al Pacífico, tales como las de la Bahía de Tortuga, Punta Abreojos, Bahía de Santa María y la del propio Cabo San Lucas eran establecidas áreas para la pesca de carnada. La importancia de las Bahías de Tortuga y Magdalena (incluyendo la adyacente Bahía de Almejas) aumentó en forma constante, conforme la pesca de atún se centralizaba en estas localidades, y también se tomó carnada, en limitadas cantidades, de los numerosos puntos intermedios a lo largo de la costa de Baj a California. Sin embargo, la captura de peces-cebo en aguas territoriales mexicanas declinó en importancia en los últimos años de la década de 1920, debido a los aumentos de los derechos que impuso el Gobierno de México sobre la extensión de permisos para la pesca de carnada. Durante este período, el área de la California meridional mantuvo en gran escala las necesidades de la pesquería de atún en cuanto a carnada viva.
Las actividades de la pesquería de atún aleta amarilla y barrilete se expandieron rápidamente hacia el sur desde 1930. Esta expansión se hizo posible, en gran parte, por el hallazgo de abundante provisión de carnada en aguas tropicales. Según la información que proveyeron los pescadores de atún, así como la revista comercial Paci/ic F'isherman (1931, 1932) se sabe que los clipers atuneros obtuvieron carnada durante estos años de la Isla Socorro que pertenece al grupo de las Revilla Gigedo, de la Isla Cocos y de las Islas Galápagos. También se hace mención de localidades específicas de pesca de carnada a lo largo del continente, tales como las Islas Ceralbo y Espíritu Santo, Punta Kino y Guaymas en el Golfo de California; Bahía Banderas; el Golfo de Nicoya; el Golfo de Fonseca y el Golfo de Panamá. Al comenzar la Segunda Guerra Mundial, los clipers atuneros
64 ALVERSON y SHIMADA
pescaban carnada en las diversas áreas a lo largo de su ruta de San Diego, California, a Panamá y mar afuera hasta las Islas Galápagos.
Durante la guerra, la flota atunera sufrió una gran restricción en sus actividades; las pescas de atún y carnada se limitaron casi a las áreas al norte del Golfo de Tehuantepec. Con la terminación de las hostilidades y el subsecuente aumento en la demanda de atún, el radio de acción de la pesqueria se extendió de nuevo hacia el sur. Como consecuencia de ésto, las actividades para la obtención de carnada también cambiaron en la misma dirección - hacia la costa colombiana en 1948, dentro del Golfo de Guayaquil, Ecuador, en 1950, y finalmente en aguas frente al norte del Perú, en 1953.
La presente área en la cual los peces de carnada son capturados por la flota que pesca atún aleta amarilla y barrilete, se extiende desde el sur de California hasta el norte del Perú y las Islas Galápagos.
Métodos para la pesca de carnada viva
Los peces de carnada generalmente se encuentran en aguas costeras; estando dentro de aguas territoriales, se considera que son propiedad del estado adyacente. El privilegio de utilizar las poblaciones de peces de carnada en la América Latina, lo consiguen generalmente los pescadores de los Estados Unidos mediante la compra de licencias. El costo de estos permisos varia de un pais a otro, pero casi siempre está basado en una cuota fija por unidad, según el tamaño del barco. La venta de las licencias constituye una renta apreciable de dólares para algunos paises de Latinoamérica.
Los clipers atuneros normalmente penetran en áreas de aguas bajas, por lo general de una profundidad no mayor de 30 brasas, para pescar la carnada, aún cuando ésta a veces se captura en aguas más profundas y alej adas de la costa. Para la captura se usan grandes redes envolventes o circundantes llamadas "redes lámparas". Un barco atunero puede llevar varias de estas redes, que miden entre 80 y 150 brasas de longitud. El tamaño de la red usada y otros detalles de su construcción dependen de las especies que se van a capturar y de las condiciones de las áreas de pesca.
La "red lámpara", que consiste de dos alas de tejido de malla en cada lado de una bolsa de tejido más fino, se va soltando desde un esquife grande, el cual se hace avanzar alrededor del cardumen de peces, remolcado por una lancha-motor. El extremo libre de la red queda anclado durante esta operación mediante un pequeño bote. Cuando se completa el circulo, dicho extremo de la red es pasado al esquife grande y ambas alas de la red son entonces haladas a esta embarcación, de manera que la bolsa abra, en tanto que una malla de tejido fino queda debajo de los peces. El bote pequeño se sitúa en forma que sostenga el lado opuesto de la bolsa. El espacio de la red se va reduciendo conforme se tira de las alas. Cuando los bordes

65 PECES DE CARNADA
cercanos de la bolsa se colocan a bordo del esquife, la carnada queda completamente encerrada en una pequeña bolsa de tejido. Cuando la profundidad del agua lo permite, el barco atunero se coloca al lado del esquife para recoger la carnada. Si el barco no puede acercarse, los peces son pasados de la red a un vivero plegable llamado "recibidor", el cual es remolcado hasta el barco que espera en aguas más profundas. Allí se trasladan los peces, por medio de pequeñas redes de mano llamadas "scoops", a los grandes tanques o "pozos" dentro de los cuales se hace circular continuamente agua de mar. La cantidad de carnada que recoge un "scoop" es la unidad de medida que usa el pescador y equivale, en promedio, a unas ocho libras de carnada.
La capacidad de un cliper atunero para cargar carnada se determina principalmente por su tamaño y por el número de tanques que tenga instalados. Un barco grande, de unas 350 toneladas de capacidad, puede llevar de una sola vez una cantidad equivalente a 5,500 "scoops" de pecescebo. Durante el curso de un viaje, es corriente que una embarcación llegue a usar dos o tres cargas de carnada.
La forma en que se emplea carnada viva en las áreas de pesca de atún, ha sido descrita por Godsil (1938). A pesar de que la relación de Godsil fué publicada hace muchos años, no intentaremos una descripción de los métodos usados hoy día, porque son esencialmente los mismos a que se refiere el citado autor.
Clases de peces de carnada para el atún y localidades en que se pescan
Varias especies de peces-cebo son usadas como carnada viva para la pesca del atún y casi todas pertenecen a las familias del arenque y la anchoa. Se trata de peces pequeños que se caracterizan por su hábito gregario, presentándose abundantemente en cardúmenes, en aguas costeras. Los peces de carnada más importantes son la anchoveta (Cetengraulis mysticetus)) las sardinas de California y de las Galápagos (Sardinops caerulea y S. sagax) y las anchoas nórdica y sureña (Engraulis mordax y E. ringens). Las principales áreas en que se pescan estas especies se muestran en la Figura 2.
Anchoveta (Cetengraulis mysticetus)
La anchoveta, una anchoa tropical que se encuentra desde la parte central de Baja California hasta el norte del Perú (Peterson, 1956), es la más Importante de las especies de camada para el atún por su amplia distribución, su tolerancia a las temperaturas dentro de un ancho margen, y su habilidad para vivir bien en los tanques de los barcos pesqueros.
Las principales áreas en que se encuentra la anchoveta son las de Bahía de Almejas en Baja California; Guaymas y Punta Ahorne en el Golfo de California; el Golfo de Fonseca y el Golfo de Panamá en la Améríca
66 ALVERSON y SHIMADA
Central (Figuras 1 y 2). En estas áreas se pescan las anchovetas en cantidades apreciables en una u otra estación a través de todo el año. El Golfo de Guayaquil también mantiene una gran población de esta especie, pero sus aguas han estado vedadas a la pesca de carnada desde 1952 por el Gobierno del Ecuador. Otras localidades en que las anchovetas se capturan en buen número, en algunos años, son las de Bahía de Banderas en México, la Bahía de Montijo en Panamá, y las áreas costeras en la vecindad de Buenaventura, Colombia. El Golfo de Nicoya, en Costa Rica, fué una zona muy importante de anchovetas hasta 1947, en que la abundancia de esta especie decayó súbitamente. Se informa que esta abrupta disminución coincidió con la presencia de una fuerte concentración de "agua roja", que se presume es debida al dinoflagelado Gymnodinium (Schaefer, 1954; Peterson, 1956). Cualesquiera que fueran las causas, en el año 1949 la población de anchovetas del Golfo de Nicoya había aparentemente desaparecido. En 1953, la Comisión Interamericana del Atún Tropical intentó restablecer esta población mediante el trasplante de medio millón de anchovetas en proceso de maduración sexual, del Golfo de Panamá al de Nicoya (Schaefer, 1954). Los resultados preliminares del experimento son alentadores; hay indicaciones de que algunos de los individuos trasplantados se han reproducido con buen éxito y han establecido una nueva población residente en el Golfo de Nicoya. Esta población ha ido aumentando despaciosamente pero es todavia (1956) muy pequeña para mantener una pesquería comercial de carnada.
Sardinas (Sardinops caerulea y Sardinops sagax)
Dos otras especies, la sardina de California (S. caerulea) y la sardina de las Islas Galápagos (S. sagax) son pescadas anualmente en grandes cantidades por la flota atunera.
La localización meridional de la sardina de California se encuentra dentro del radio de actividad de los barcos atuneros que tienen su base en los puertos de dicho estado, y la especie es usada regularmente como cebo en el área sur de California en las vecindades de San Diego, a lo largo de la costa oceánica de Baja California y al lado oeste del Golfo de California, hasta tan lejos hacia el norte como la Isla de Santa Catalina. Sólo en muy raras ocasiones los pescadores de atún capturan sardinas en el lado este del Golfo. Se dispone de los records de pesca correspondientes a Guayrnas, al Farallón de San Ignacio y a Punta Ahorne.
Las localidades de pesca de carnada más importantes, con respecto a la sardina de California, son la Isla de Cedros, las Bahías de Santa María y Magdalena en Baja California y alrededor de la Isla San José en el Golfo de California. La pesca de sardinas generalmente se efectúa de julio a noviembre en estas áreas, cuando la pesca de atún se concentra en aguas "locales". Las sardinas, como cebo, muy pocas veces son llevadas a las regiones pesqueras del sur por su limitada resistencia a los cambios de

67 PECES DE CARNADA
temperatura, pero algunos barcos de carnada han transportado sardinas de California hasta un punto tan meridional como las Islas Galápagos, siguiendo una ruta fuera de la costa a lo largo de la cual las temperaturas son más soportables para esta especie.
A pesar de que las Islas Galápagos están situadas a la altura del ecuador, el ambiente es favorable en algunas áreas para la vida de las sardinas debido a la influencia de la Corriente del Perú, que es fría, y al afloramiento local. La sardina originaria de estas islas es la Sardinops sagax) que es la misma especie que se encuentra en aguas frente al Perú y Chile. Esta sardina es la más importante de todos los peces de carnada que se pescan en las Islas Galápagos; las mayores cantidades se logran de setiembre a febrero. Aunque casi todas estas sardinas se utilizan en los bancos de pesca de los alrededores, la de las Galápagos se emplea muy frecuentemente para pescar en aguas afuera del Ecuador y del norte del Perú y, algunas veces, cuando las temperaturas son favorables, a la altura de la América Central.
Anchoas (Engraulis mordax y Engraulis ringens)
Dos anchoas del género Engraulis son importantes como carnada para el atún. Son ellas la anchoa nórdica (E. mordax) y la anchoa sureña (E. ringens).
La anchoa nórdica, que ha sido utilizada como cebo desde los primeros días de la pesqueria del atún, se captura desde San Diego, California, hasta Cabo Falso, en el extremo sur de Baja California. Los centros de pesca más importantes de esta especie son las Bahías de Tortuga, Santa María y Magdalena y, en algunos años, la Bahía de San Quintín y Punta Abreojos. Igual que la sardina de California, Engraulis mordax se pesca principalmente durante los meses de verano y otoño, desde junio hasta noviembre, y se utiliza casi exclusivamente en las áreas adyacentes en donde se captura el atún.
Con la expansión de la pesquería de atún aleta amarilla y barrilete hacia las aguas frente el norte del Perú, que comenzó en los alrededores de 1951, se principió a usar la anchoa sureña como carnada, pero no fué sino hasta 1953 cuando los pescadores de atún emplearon apreciables cantidades de esta especie. Engraulis ringens ha continuado siendo, desde entonces, un pez de carnada de importancia para las embarcaciones cuyas actividades se desarrollan en aguas frente al Ecuador meridional y al norte del Perú.
La mayoría de las pescas de la anchoa sureña se efectúan de setiembre a enero, y generalmente en el área que se extiende desde Cabo Blanco, Perú, hasta cerca de los 100 Sur de latitud.
Arenques (Opisthonema libertate y Harengula thrissina)
Tres géneros de arenques, Opisthonema) Sardinella e Ilisha se informa que han contribuído como carnada en la pesca del atún (Schaefer, 1953).

68 ALVERSON y SHIMADA
Datos más recientes indican, sin embargo, que una especie que anteriormente se atribuía al género Sardinella) en realidad corresponde al género Hareng1¿la) y que solamente Opisthonema y Harengula son de importancia como peces-cebo. Ilisha se emplea como carnada con muy poca frecuencia y en muy pequeñas cantidades.
Los arenques que más frecuentamente se usan para la pesca del atún son Opisthonema libertate-a menudo llamado "arenque de hebra", por el largo filamento de su radio dorsal, y Harengula thrissina. Estos peces se capturan desde la Bahía de San Diego en California hasta el Perú, y mar afuera hasta las Islas Galápagos. El "arenque de hebra" parece ser la dominante de las dos especies en todas las áreas en que se encuentra el arenque, y es solamente en el Golfo de California en donde Harengula se pesca en alguna cantidad apreciable.
Salima (Xenocys jessiae)
La "salima" es el único pez no clupeoide de importancia como carnada para el atún. Es una especie de la familia Xenichthyidae, caracterízada por sus radios espinosos; su distribución geográfica se limita a las Islas Galápagos.
Misceláneos peces de carnada
Varias clases misceláneas de peces-cebo son usadas esporádicamente por los pescadores de atún. A continuación se ofrece una lista de ellos, con los nombres comunes que les dan los hombres de mar y la indicación de sus lugares de captura:
Polydactylus sp.-"bobo". Bahía de Santa María, Baja California, al Golfo de Guayaquil, Ecuador.
Etrumeus sp.-"jap sardine". Baja California y las Islas Galápagos. Anchoa sp.-"bloodless". Del sur de California al norte del Perú y
fuera de la costa hasta las Islas Galápagos. Xenistius californiensis-"salima". Baja California. Chloroscombrus sp.-"pompano". Bahía de Santa María, Baja Cali
fornia, al Golfo de Guayaquil, Ecuador. Atherinops sp.-"smelt". Isla de Cedros y Bahía de Tortuga, Baja
California. Pneumatophorus sp.-"mackerel". Isla de Cedros y Bahía de Tortuga,
Baja California. Decapturus sp.-"Spanish mackerel". Bahías de Banderas y Chipequa,
México. Trachurus sp.-"Spanish mackerel". Baja California e Islas Galápagos.
El acierto con que los pescadores de atún identifican los peces de carnada, se refleja en las muestras que ellos recogen y envían a la Comísión

69 PECES DE CARNADA
para sus estudios biológicos. Un total de 464 muestras ha sido obtenido desde 1951 y se ha hecho una comparación entre nuestras identificaciones y las que han registrado los pescadores en el momento de la recolección. Los resultados de la comparación demuestran que hay muy pocas discrepancias y que éstas sólo se notan con respecto a las especies que se emplean menos frecuentemente.
PESCA TOTAL DE PECES DE CARNADA
Origen y :tabulación de los da:tos
La captura de peces de carnada es una parte subordinada pero integrante de la pesquería principal de atún aleta amarilla y barrilete. Su característica única es la de que esa pesca se efectúa y se dispone de ella totalmente en el mar. La pesquería de carnada no está, en consecuencia, predispuesta a la fácil recolección de records precisos sobre las cantidades y clases de peces usados por los pescadores de atún y sobre las localidades en que han sido capturados. La única fuente de información de esta naturaleza la constituyen las detalladas observaciones que los pescadores anotan en sus registros de bitácora. Estos datos han sido recogidos por la Comisión desde 1951, gracias al sistema adoptado para este propósito; así cada año se ha conseguido información utilizable acerca de las actividades en la captura de carnada y sus resultados sobre más del 85 por ciento de la flota de barcos de carnada que tienen su base en puertos de California, por todos los viajes en los cuales se lograron pescas consistentes en dos tercios o más, por peso, de atún aleta amarilla y barrilete. Algunos registros de bitácora de años pasados que los capitanes de barcos llevaban para uso propio, han sído conseguidos tambíén. Los datos obtenidos son suficientes para estimar la abundancia y rendimiento de las especies importantes de carnada desde 1946; pero son inadecuados con respecto a los prímeros años.
Gracias al análisis de los records de los registros de bitácora correspondientes a la serie de años 1946-1954, ha sido posible determínar, por cada viaje, el número de días empleados en la obtención de carnada, la localización de las áreas de pesca y, en la mayoría de los casos, la cantidad capturada de cada clase de peces-cebo. A fin de que estos datos pudieran ser convenientemente resumidos y ordenados con respecto a cada año por localidades geográfícas, se estableció un sístema estadístico por áreas mediante la dívisión de la zona de la pesquería de carnada en 28 regiones. Estas 28 áreas se muestran en la Figura 3. En ese mapa, el Area (9), "Lado Este del Golfo de California", incluye todas las aguas de la costa oriental del Golfo, excepto Punta Kino, Guaymas y Punta Ahorne, que son tratadas como áreas separadas por ser los centros principales de la pesca de anchovetas en esta región general. Bajo el epígrafe de "Areas fuera de la Costa" han sido tabuladas las pescas no frecuentes de peces-cebo, generalmente de las especies misceláneas, que se capturan en alta mar, fuera de las zonas normales en que se pesca carnada.
70 ALVERSON y SHIMADA
Como las embarcaciones de diferentes tamaños tienen diferente capacidad para la pesca, en promedio, siendo las más grandes más eficientes que las pequeñas, la información obtenida de los registros de bitácora fué también ordenada de acuerdo con la categoría de los barcos, empleando el mismo sistema de Shimada y Schaefer (1956) en sus estudios sobre las estadisticas de pesca de los atunes aleta amarilla y barrilete. Se consideraron seis diferentes clases de tamaño de embarcaciones con base en la capacidad para llevar el atún, a saber: Clase 1, con capacidad para transportar hasta 50 toneladas; Clase 2, de 51 a 100 toneladas; Clase 3, de 101 a 200 toneladas; Clase 4, de 201 a 300 toneladas; Clase 5, de 301 a 400 toneladas; y Clase 6, más de 400 toneladas.
Pescas reales y pescas estimadas de los barcos de carnada de California que llevan registros de bitácora
Para cada año, por el sistema de tarjetas perforadas se determinó en cada área de pesca el volumen del esfuerzo registrado por las diversas clases de tamaño de embarcaciones y la pesca de carnada resultante, por especies. La producción anual de peces-cebo registrada por los barcos de carnada de California, de 1946 a 1954, ha sido tabulada en la Tabla 1, por especies y por categorias de tamaño de las embarcaciones, tomando en cuenta todas las áreas combinadas.
Algunas veces, aparecen en los registros de bitácora las anotaciones sobre el número de días dedicados a la pesca de carnada en un área, sin que se hayan consignado las correspondientes cantidades o clases de peces capturados. En consecuencia, fué necesario emplear el siguiente procedimiento para estimar anualmente, por área y clases de tamaño, las cantidades de cada especie de carnada cogidas en todos los días en que aparecen registros, incluyendo aquellos para los cuales falta esta información:
1)� En cada área, la pesca por dia de actividad en la captura de carnada, por especies, fué calculada para cada clase de tamaño de barcos, dividiendo las cantidades registradas de pesca de cada especie entre el número de días requeridos para lograr esta pesca.
2)� La pesca por cada dia de actividad en la captura de cada especie de carnada y clase de tamaño de los barcos, fué entonces multiplicada por el número total de días registrados, incluyendo los días dedicados a la pesca de carnada, tanto cuando el resultado de ésta fué anotado, como cuando no lo fué para aquella especie y clase de tamaño.
Esto proporciona una estimación de la cantidad de carnada pescada en cada área, por especies, por cada clase de tamaño de barcos, por todos los días utilizados en la pesca de carnada anotados en los registros de bitácora. Estas cifras sumadas en cuanto a todos los días, clases de tamaño y áreas, representan el total de las cantidades estimadas de cada especie de carnada,
71 PECES DE CARNADA
pescadas durante el año por barcos sobre cuyos viajes sus registros de bitácora fueron puestos a nuestra disposición. La Tabla 2 muestra un sumario de las pescas estimadas, por especies y por clases de tamaño de los barcos, en todas las áreas combinadas, durante los años 1946 a 1954.
Estimación de la pesca total efectuada por toda la flota atunera de California
Para estimar la cantidad total de peces-cebo pescada por la flota entera de barcos de carnada de California en un año dado, fué necesario estimar las cifras y clases de carnada que podrían haber capturado los barcos de los que no se obtuvieron anotaciones. Esto se consiguió, multiplicando la cantidad pescada de cada especie de carnada anotada en los registros de bitácora durante el año por cada clase de tamaño de barcos, en cada área, por la proporción del tonelaje total de atún descargado por todas las embarcaciones de una clase de tamaño, en relación con lo capturado en los viajes de los que sí se logró los datos de los registros de bitácora. Esto se hizo bajo la suposición de que la cantidad de atún pescada por unidad de cantidad de carnada, fué la misma en los barcos en los cuales no se obtuvieron records, que en los que si tenían registros. Estos estimados, junto con las proporciones tomadas en cuenta con respecto a cada año y a cada clase de tamaño, se encuentran en la Tabla 3.
Durante los años a que nuestro estudio se refiere, los barcos con base en puertos de California obtuvieron anualmente más del 90 por ciento de la pesca total de atún lograda mediante el sistema de carnada viva en la zona tropical del Pacífico Oriental. Puede entonces considerarse que los datos contenidos en la Tabla 3 representan una estimación bastante acertada de la pesca total de las diversas especies usadas como cebo en la pesca de atún.
Estudio comparativo de las pescas de carnada anotadas en los registros de bitácora, de las pescas estimadas correspondientes a los barcos que llevan registros y de la pesca total estimada
Con respecto a los años más recientes, desde 1951, cuando casi toda la flota llevaba ya registros de bitácora, el error resultante de la suposición hecha al estimar la pesca total de carnada de la flota entera de barcos atuneros, es probablemente pequeño. Sin embargo, en cuanto a los años anteriores a 1951, cuando los registros de bitácora se llevaban en proporción mucho menor, el error puede ser considerablemente más grande. La diferencia en la extensión de las anotaciones de los registros de bitácora se ilustra en la Figura 4, que muestra, por cada año, de 1946 a 1954, con respecto a todas las especies y clases de tamaño de barcos, combinadas, las cantidades exactas de peces-cebo anotadas en los registros de bitácora, las cantidades que se estima han pescado los barcos que llevan estos registros (cantidades anotadas más las estimadas en cuanto a los días de pesca con respecto a los cuales no se registran las cifras de carnada capturada)

72 ALVERSON y SHIMADA
y la estimada pesca total de carnada lograda por toda la flota atunera con base en California. Por la poca discrepancia entre las cantidades anotadas con exactitud en los registros de bitácora y las cifras estimadas de las pescas hechas por embarcaciones que llevan registros, puede verse que, de 1946 a 1954, los pescadores que mantuvieron sus diarios anotaron casi todas sus pescas de carnada. También con respecto a los años más recientes, de 1951 a 1954, cuando la información de los registros de bitácora fué obtenida de la mayoría de los barcos, la pesca de carnada correspondiente a los elementos de la flota que suministraron datos de sus diarios, no es mucho más baja que la pesca total estimada para la flota entera. Comparativamente, en los años anteriores a 1951, la diferencia entre las pescas anotadas y las pescas estimadas es bastante grande.
Estimación de las pes.cas totales por especies y por áreas
Las cantidades totales de peces-cebo que se estima fueron pescadas anualmente por la flota atunera de California, de 1946 a 1954, y la especificación de la pesca total por especies aparecen en la Tabla 4 y tienen su ilustración gráfica en la Figura 5. Estos datos evidencian que la anchoveta fué la especie predominante en la pesca de carnada durante el período en estudio, ya que constituye, en promedio, un 45 por ciento de la cantidad total de pesces-cebo usados por los pescadores atuneros de California. Otras especies que alcanzaron por lo menos un promedio de 10 por ciento del total de la pesca anual de carnada, son, en orden de importancia, la sardina de las Galápagos, la sardina de California y la anchoa nórdica.
La relativa importancia de las diferentes especies varía de un año a otro. Estos cambios en la composición de las especies no reflejan necesariamente los cambios en la abundancia de ciertas clases de pesces de carnada. Del esfuerzo empleado en la captura de carnada depende en gran parte el éxito de la pesca de atún y de las áreas en que éste se captura y así puede variar de una a otra localidad, entre estaciones, o bien, entre años. En la Tabla 5 se dan, para cada año de 1946 a 1954, las cantidades estimadas de cada clase de pesces de carnada obtenidas en cada área y una lista de las áreas en las cuales se hicieron esfuerzos de pesca, sin resultado, pero se anotó este esfuerzo en los registros de bitácora. En el año 1946, por ejemplo, cuando la pesquería de atún aleta amarilla y barrilete se encontraba todavía más o menos limitada a la región al norte de Tehuantepec, las más importantes fuentes de carnada eran localidades a lo largo de la costa de Baja California y la pesca estaba constituída predominantemente por las especies que se encontraban en dichas áreas. Contrastando con esto, en el año 1948, cuando la pesquería de atún de largo radio de acción reanudó sus operatciones en gran escala, la zona de las Islas Galápagos y otras áreas meridionales de pesca de carnada recobraron importancia, con el correspondiente aumento en el uso de las especies de carnada encontradas en las regiones adyacentes.
73 PECES DE CARNADA
Relación entre la pesca total de atún aleta amarilla y barrilete, y la pesca total de peces de carnada.
Podría suponerse que las cantidades de atún aleta amarilla y barrilete descargadas anualmente por los barcos de carnada deberían ser proporcionales a las cantidades de peces-cebo empleadas en su pesca. Sin embargo, éste no es siempre el caso, como puede verse en la Figura 6, la cual presenta un gráfico de las cantidades totales de camada que se estima fueron usadas por los barcos de California, y de las pescas de atún correspondientes, a cada año, de 1946 a 1954. La pesca de atún aleta amarilla y barrilete aumentó constantemente de 1946 a 1950, en respuesta a la mayor intensidad en las actividades pesqueras, y durante esos años también se operó un aumento similar en las cantidades de camada que utilizó la flota atunera. Cuando la producción de atún decayó en 1951, esta merma fué también acompañada de un descenso en la pesca de peces-cebo. Sin embargo, en 1952 y 1953, a medida que las pescas de atún continuaron gradualmente su curso descendiente, la producción de carnada subió a un nuevo alto nivel, marcando el año 1952 el mayor aumento. Esta relación inversa entre los desembarques de atún y las cantidades de carnada empleadas en 1952 y 1953, se considera que refleja un abrupto descenso en la abundancia de atún aleta amarilla durante dichos años (Shimada y Schaefer, 1956). Conforme los pescadores encontraban pescas más pobres, aparentemente se sentían inclinados a usar más cantidad de camada, en su intento de pescar los atunes, que la que habrían podido emplear dentro de condiciones más favorables de abundancia de túnidos. En 1954, cuando la pesca de atún aleta amarilla mejoró y la producción de atún creció notoriamente, la cantidad de peces-cebo usada fué ligeramente menor que la empleada en cualesquiera de los dos años anteriores.
EFECTOS DE LA PESQUERIA DE CARNADA PARA EL ATUN SOBRE LAS POBLACIONES DE PECES-CEBO
DEL PACIFICO ORIENTAL
Uno de los objetivos principales de los estudios de la Comisión acerca de los peces-cebo de la región del Pacífico Este, es determinar si las poblaciones de las diversas especies usadas como carnada están siendo afectadas en forma adversa por la pesquería de atún.
Consideración sobre el efecto de la pesca en las poblaciones de la sardina de California, anchoa nórdica, anchoa sureña y sardina de las Galápagos
Como ha sido ya anotado, la pesca de peces de camada consiste predominantemente de cinco especies: la anchoveta, la sardina de California, la sardina de las Galápagos, la anchoa nórdica y la anchoa sureña. De estas cinco especies, la sardina de California, la anchoa nórdica y la anchoa sureña son utilizadas por otras pesquerías en cantidades mucho mayores que las que se usan para la pesca de atún aleta amarilla y barrilete. En

74 ALVERSON y SHIMADA
1954, por ejemplo, fueron procesadas comercialmente alrededor de 83,000 toneladas de sardina de California y 21,000 toneladas de anchoa nórdica, en California y México (Calif. Eur. Mar. Fish., 1956; Casey, ms.), en tanto que las estimaciones de las cantidades totales de estas especies empleadas por la flota atunera de California, en el mismo año, son 812 y 2,416 toneladas, respectivamente, además de 260 toneladas que no fueron identificadas por especies!. En lo que se refiere a la anchoa sureña, que se encuentra frente al Perú, la estimación puede hacerse más bien conservativamente de acuerdo con las cifras de la producción de guano (Compañía Administradora del Guano, 1954) y los factores de conversión de pescado a guano a que se refiere Hutchinson (1950), pudiendo decirse que las aves guaneras han consumido, en años recientes, unas 2,500,000 toneladas, anualmente. Algunas anchoas también han sido utilizadas en los últimos años en la producción de harina de pescado y aceite; las últimas cifras obtenidas (Pesca y Caza, Perú, 1956), indican que esta producción, en 1953, fué de unas 40,000 toneladas. Comparativamente, la pesquería de carnada para el atún utilizó sólo unas 2,212 toneladas de anchoa sureña, aproximadamente, en 1954. Resulta obvio, en consecuencia, que las cantidades de esta especie, así como las de la sardina de California y anchoa nórdica, pescadas anualmente por la flota atunera para usarlas como carnada, son insignificantes comparadas con las destinadas a otros usos, y que los efectos de la pesca de carnada sobre su abundancia tienen que ser, por ende, muy poco sensibles.
La sardina de las Galápagos actualmente sólo se usa en la pesquería de atún. Todavía no ha llegado a comprobarse definitivamente que esta población de sardinas de las Islas Galápagos es una población completamente separada de la que se encuentra a lo largo de la costa continental sudamericana. La extrema variabilidad que se observa en las pescas de esta especie de un año a otro (Tabla 5), hace pensar que la abundancia de esta población depende principalmente de factores ajenos al volumen de la pesca.
Consideración sobre los efectos de la captura de carnada en las poblaciones de anchoveta
Ya se ha dicho que la anchoveta (O. mysticetus) constituye parte importante de la pesca de carnada para el atún, y que anualmente se han capturado cantidades sustanciales de esta especie de 1946 a 1954. De alli que exista la posibilidad de que la pesquería haya causado efectos de importancia, en algunos años, en detrimento de las poblaciones de anchoveta en las diversas áreas en que ésta se encuentra. Para examinar este problema se hizo un análisis de los datos contenidos en los registros de bitácora correspondientes al período 1946-1954. a que se ha hecho referencia anteriormente, empleando el sistema de Shimada y Schaefer (1956) con respecto al atún.
lPara convertir el término "scoops" a peso, sc usó un factor de 8 libras por "scoop".
75 PECES DE CARNADA
Se supone que los cambios en la abundancia están, en general, relacionados en razón inversa con los cambios en la intensidad de la pesca, si la relación de causa y efecto entre unos y otros es grande en comparación con otros factores que afectan la abundancia de las anchovetas. De la naturaleza de esta relación, a la luz de lo que se conoce con respecto a la dinámica de la población de los stocks de peces que se explotan comercialmente, pueden hacerse deducciones acerca de los efectos de la pesca sobre la abundancia de las anchovetas, y las condiciones en que se encuentran al presente las poblaciones con referencia al nivel del máximo rendimiento sostenible.
Estructura de la población
De acuerdo con los estudios basados en un análisis de los caracteres numéricos, Howard (1954) ha demostrado que las poblaciones de anchoveta en cada una de las áreas de pesca de carnada más importantes como Bahía de Almejas, Punta Ahome, Guaymas, Golfo de Fonseca y Golfo de Panamá (Figura 2), constituyen probablemente unidades bíológicas separadas. Fué necesario, en consecuencia, obtener separadamente medídas de la abundancia, rendimiento e intensidad de la pesca por cada una de estas cinco poblaciones, para investigar los efectos de la pesquería de atún sobre las achovetas.
Abundancia
La pesca por día de actividad en la captura de carnada, durante un año, se asumió que era directamente proporcional al promedio de abundancia de la población de anchovetas en cada una de las áreas de pesca de carnada. Esta medida fué determinada mediante los datos sobre esfuerzo de pesca y correspondiente producción anual contenidos en los registros de bitácora de 1946 a 1954, con respecto a cada área y a cada clase de tamaño de barcos (Tabla 6). A fin de combinar la pesca por día de actividad en la captura de carnada, efectuada por todas las categorías de tamaño de las embarcaciones pesqueras, dentro de un solo índice de abundancia comparable de un año a otro, se computaron los factores de eficiencia al convertír la pesca por día de actividad en la obtención de anchovetas con referencia a cada clase de tamaño, en términos de la pesca por día de actividad de una clase de tamaño standard seleccionada, en este caso la clase 4 (barcos de 201 a 300 toneladas de capacidad). Estos factores, que corrigen las diferencias entre tamaños en cuanto a la capacidad para la pesca de carnada que presentan los barcos atuneros bajo condiciones iguales de abundancia de anchoveta, fueron determinados anualmente en cada área tomando la proporción de la pesca por día de actividad de cada clase de tamaño en relación con la pesca efectuada por la clase 4, pero considerando solamente las clases de tamaño que tenían anotados en sus registros de bitácora por lo menos cinco días de esfuerzo de pesca en la obtención de peces-cebo en cada área y año. Como estos registros no eran suficientes para los años anteriores a 1951, y como en algunos años no se escontraron datos refe

76 ALVERSON y SHIMADA
rentes a ciertas categorias de barcos ni a ciertas áreas, se decidió emplear, para cada año, un factor de eficiencia promedio con respecto a cada clase de tamaño, en vez de confiar en los factores de eficiencia anuales. Estos factores de eficiencia promedio, que corresponden a la media geométrica de los factores de eficiencia para cada clase de tamaño sobre todos los años de 1946 a 1954, se encuentran en la Tabla 7 por categorias de barcos y por áreas.
La pesca de peces-cebo por día standard de actividad se computó anualmente para cada área empleando los siguientes procedimientos: (1) sumando los productos de los factores de eficiencia promedio y el número de días en la pesca de carnada de cada clase de tamaño en la muestra, sobre todas las clases de tamaño, para obtener el total de días standard pescando carnada, y, (2) dividiendo el total de la pesca de anchovetas registrada en todas las clases de tamaño de barcos, entre el número total de días standard. Los resultados de cada área y año están indicados en la Tabla 8 en la primera columna de cada área. Con respecto a algunas áreas, tales como Punta Ahome y Fonseca, en las que no pudo computarse el factor de eficiencia correspondiente a una clase de tamaño en particular, fué empleado el factor de eficiencia promedio en todas las áreas en que sí pudo hacerse la computación (última columna de la Tabla 7) para determinar la pesca por día standard de actividad en la captura de carnada.
Pesca total
Los métodos usados en la estimación de la pesca total de anchovetas en cada una de la áreas más importantes de pesca de carnada, durante los años en estudio, han sido ya descritos anteriormente (páginas 70 a 72), Y los resultados que se indican en la Tabla 5 han sido nuevamente tabulados en la Tabla 8, segunda columna, bajo el área correspondiente.
Intensidad total de la pesca
La intensidad total de la pesca de carnada en cada área y año, puede ser calculada dividiendo la cantidad estimada del rendimiento anual entre la pesca por día standard de actividad durante el año correspondiente en cada zona. Estas cifras se encuentran en la Tabla 8, última columna, bajo el área respectiva.
Relación entre la abundancia y la intensidad de la pesca
En las Figuras 7-a, b, c, d y e, que corresponden, en su orden, a Bahía de Almejas, Punta Ahome, Guaymas, el Golfo de Fonseca y el Golfo de Panamá, la pesca de anchovetas por día standard de actividad, la estimación del rendimiento total y el cálculo de la intensidad total de la pesca en días empleados por la clase 4 de barcos de carnada, han sido graficados por el período 1946-1954.
77 PECES DE CARNADA
En cada una de estas áreas ocurren grandes variaciones, año tras año, en la abundancia aparente de las anchovetas, según lo demuestran los datos referentes a la pesca por día standard de actividad. Sin embargo, no parece que haya habido ninguna merma en la abundancia durante los años de más íntensa actividad pesquera. En realidad, la abundancia en cada una de las áreas parece que tiende a subir ligeramente durante el período 1946-1954. Con el objeto do probar esto con estadísticas, se calculó por cada área la regresión linear del cuadrado medio de la pesca por día sobre el tiempo. En cada caso, con excepción de la Bahía de Almejas, se encontró que el declive de la línea de regresión no se desvía de cero en forma significativa, considerado a un nivel de probabilidad del cinco por ciento. La línea de regresión correspondiente a los datos de la Bahía de Almejas tiene un sesgo ascendente que es significativo a un nivel de probabilidad del uno por ciento. De esto puede sacarse en conclusión que no ha habido, en promedio, una merma en la abundancia aparente de esta especie en ninguna de las áreas importantes de pesca antes citadas, durante los años 1946-1954, y que en la Bahía de Almejas la abundancia aparente sí ha aumentado significativamente. También se ha notado que, en cada área, el aumento en la intensidad de la pesca ha sido acompañado casi siempre de un crecimiento en la abundancia y en la pesca total. Si la pesquería de carnada para el atún estuviera removiendo considerables cantidades de anchovetas como para afectar sensiblemente la abundancia de cualquiera de las poblaciones, sería de esperarse que, conforme la intensidad de la pesca aumentara, se registraría la correspondiente merma en la abundancia, y si se sobrepasara el nivel del máximo rendimiento sostenible, vendría también una disminución en la pesca total. A la inversa, un aumento en la abundancia sería el resultado de un decrecimiento en el esfuerzo de pesca. La falta de relaciones en razón inversa, tales como éstas, entre los cambios en la intensidad de la pesca y la abundancia en todas las importantes áreas de carnada, indica que la pesquería de peces-cebo para el atún ha afectado muy poco la abundancia de la población de anchovetas durante el período 1946-1954 y que, a los niveles que actualmente alcanza la intensidad de las actividades pesqueras, no hay peligro inmediato de caer en una pesca excesiva de esta especie en ninguna de las áreas objeto de nuestro estudio. Como se sabe que la anchoveta tiene muy corta vida, ya que alcanza su madurez sexual en un año y no llega a vivir más de dos o tres (Howard y Landa, ms.), las grandes fluctuaciones en su abundancia de un año a otro encontradas en algunas de las áreas de pesca, hacen pensar que las variaciones en el éxito del desove pueden jugar, a los niveles corrientes de explotación, un papel más importante que el que tienen los efectos de la pesca en la determinación de la abundancia de las anchovetas encontrada por los pescadores de atún.

78 ALVERSON y SHIMADA
CONCLUSIONES
De los datos que se tienen a mano puede sacarse la conclusión de que, durante el período 1946-1954, la pesquería de California para la obtención de atún aleta amarilla y barrilete, no alcanzó una intensidad suficientemente alta como para afectar en forma apreciable la abundancia de ninguna de las especies de carnada más importantes en el Océano Pacífico Oriental. Aún más, a los niveles actuales de explotación, no existe peligro inminente de que estas poblaciones de peces de carnada sean reducidas a tamaños inferiores a aquellos correspondientes a una producción máxima sostenible.
LITERATURE CITED - BIBLIOGRAFIA CITADA
California Bureau of Marine Fisheries 1949 The commercial fish catch of California for the year 1947 with
an historical review 1916-1947. Calif. Div. Fish and Game, Fish Bull. No. 74, 267 pp.
1956 The marine fish catch of California for the years 1953 and 1954 with jack mackerel and sardine yield per area from California waters 1946-47 through 1954-55. Calif. Dept. Fish and Game, Fish Bull. No. 102, 99 pp.
Casey, Harold D. ms. A historical and statistical review of the marine fisheries of the
Pacific coast of Mexico.
Compañia Administradora del Guano 1954 46a. Memoria del Directorio correspondiente al ejercicio 1954.
Compañia Administradora del Guano, Lima, Peru, 29 pp.
Godsil, H. C. 1938 The high seas tuna fishery of California.
Calif. Div. Fish and Game, Fish Bull. No. 51, 41 pp.
Howard, Gerald V. 1954 A study of populations of the anchovetas (Cetengraulis mystice
tus) based on meristic characters. Inter-Amer. Trop. Tuna Comm., Bull., Vol. 1, No. 1, pp. 1-24.
Howard, CeraId V. and Antonio Landa ms. A study of age, growth, sexual maturity and spawning of the
anchoveta, Cetengraulis mysticetus) in the Gulf of Panama.
79 PECES DE CARNADA
Hutchinson, G. E. 1950 Survey of contemporary knowledge of biogeochemistry. 3. The
biogeochemistry of vertebrate excretion. Bull. Amer. Mus. Nat. Hist., Vol. 96, pp. 1-554.
Pacific Fisherman, Seattle, Washington 1913 Vol. 11, No. 12, p. 18. 1931 Vol. 29, No. 12, p. 20. 1932 Vol. 30, No. 4, p. 23.
Pesca y Caza, Peru 1956 Ministerio de Agricultura, Dirección de Pesqueria y Caza, Lima,
Peru, No. 7, p. 27.
Peterson, Clifford L. 1956 Observations on the taxonomy, biology, and ecology of the
Engraulid and Clupeid fishes in the Gulf of Nicoya, Costa Rica. Inter-Amer. Trap. Tuna Comm., Bull., Vol. 1, No. 5, pp. 139-280.
Schaefer, Milner B. 1953 Report on the investigations of the Inter-American Tropical
Tuna Commission during the year 1952. Inter-Amer. Trap. Tuna Comm., Ann. Rept. for 1952, pp. 14-35.
1954 Report on the investigations of the Inter-American Tropical Tuna Commission for the year 1953. Inter-Amer. Trap. Tuna Comm., Ann. Rept. for 1953, pp. 18-50.
Shimada, Bell M. and Milner B. Schaefer 1956 A study of changes in fishing effort, abundance, and yield for
yellowfin and skipjack tuna in the Eastern Tropical Pacific Ocean. Inter-Amer. Trap. Tuna Comm., Bull., Vol. 1, No. 7, pp. 351-469.