intelligent transport systems strategy transport network ... · transport systems (its) on their...
TRANSCRIPT

Local Transport Plan
www.hertsdirect.org
Intelligent Transport Systems Strategy
Transport Network Inventory
2
2009/10 – 2019/20

Hertfordshire ITS Strategy DOC 002
Transport Network Inventor
HERTFORDSHIRE COUNTY COUNCIL
INTELLIGENT TRANSPORT SYSTEM (ITS) STRATEGY
TRANSPORT NETWORK INVENTORY
August 2010
Environment & Commercial Services
www.hertsdirect.org/

Hertfordshire ITS Strategy DOC 002
Transport Network Inventory
Hertfordshire County Council 2010 ii
Contents
Document Control Sheet.................................................. Error! Bookmark not defined.
Contents ........................................................................................................................ ii
1 Introduction ......................................................................................................... 1
1.1 Use of this Report.................................................. Error! Bookmark not defined.
1.2 Background ........................................................................................................... 1
1.3 ITS Vision for Hertfordshire ................................................................................... 1
1.4 Purpose of this report ............................................................................................ 1
2 The Hertfordshire Transport Network ............................................................... 3
2.1 Local Transport Plan ............................................................................................. 3
2.2 The Study Area and existing transport network .................................................... 5
2.3 Constraints and challenges ................................................................................... 9
2.4 Transport Statistics.............................................................................................. 13
2.5 Prime Transport Corridors (PTC) ........................................................................ 23
2.6 Planned Events and Incidents............................................................................. 28
3 Summary ............................................................................................................ 29
Hertfordshire ITS Strategy
Transport Network Inventory
Hertfordshire County Council 1
1 Introduction
1.1 Background Hertfordshire, acting in their role as highway authority and in the delivery of the Local Transport Plan, wish to develop a strategy for increasing the number of Intelligent Transport Systems (ITS) on their network. This will enable them to manage their road network efficiently and will play a key role in the delivery of the current and future Local Transport Plans.
1.2 ITS Vision for Hertfordshire Hertfordshire County Council’s vision for Intelligent Transport Systems is:
‘Hertfordshire County Council will use Intelligent Transport Systems (ITS) to provide safe, efficient, environmentally friendly and affordable multi-modal transport facilities and choices that allow access for all to everyday activities. It is envisaged that in the near future, Hertfordshire will have an integrated transport system and improved traffic and travel information for all travellers using road and rail facilities. This will enhance the mobility and transport of people and goods on Hertfordshire’s road network, to the benefit of individuals, businesses, quality of life and the economy alike.’
1.3 Purpose of this report To assist in achieving the vision as detailed above, Hertfordshire County Council has been preparing a strategy for the future roll out and management for ITS. In doing this Hertfordshire County Council has prepared a number of reports to assist in developing and refining the ITS vision and subsequent deployment plans.
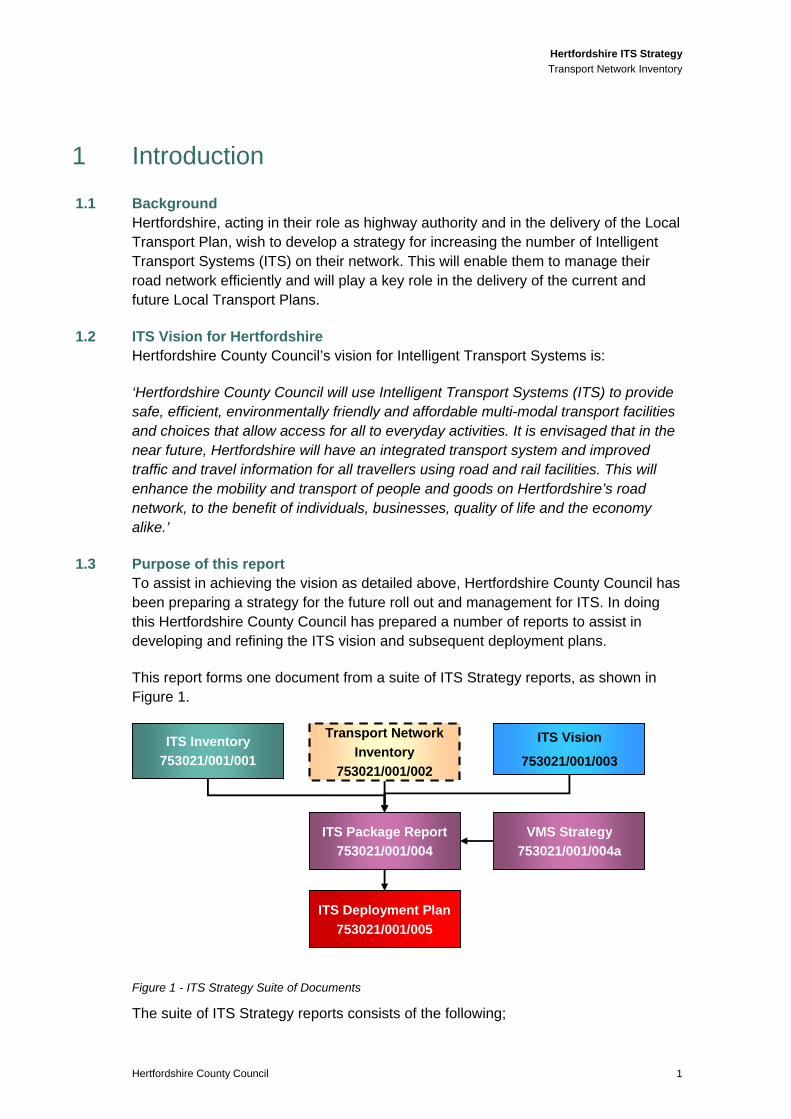
This report forms one document from a suite of ITS Strategy reports, as shown in Figure 1.
ITS Vision
753021/001/003
Transport Network
Inventory
753021/001/002
ITS Inventory
753021/001/001
VMS Strategy
753021/001/004a
ITS Package Report
753021/001/004
ITS Deployment Plan
753021/001/005
Figure 1 - ITS Strategy Suite of Documents
The suite of ITS Strategy reports consists of the following;

Hertfordshire ITS Strategy
Transport Network Inventory
Hertfordshire County Council 2
• The ITS Inventory which details the ITS assets within Hertfordshire
• The Transport Network Inventory – this report
• The ITS Vision details the vision for ITS within Hertfordshire
• The VMS Strategy details the strategy for VMS deployment within Hertfordshire
• The ITS Package Report which details the ITS packages proposed within Hertfordshire
• The ITS Deployment Plan – which outlines a strategy of deployment for the proposed work packages.
The purpose of this report is to describe the current context, characteristics and constraints of the transport network within Hertfordshire. The report will:
• Consider the characteristics of the network
• Provide a summary of transport statistics
• Describe the opportunities, problems and constraints apparent on the network which the ITS Strategy will need to address
In undertaking this study the Hertfordshire Local Transport Plan 2006-2011 (LTP2), associated daughter documents, supporting data reports and the East of England Plan (Regional Spatial Strategy) have been drawn upon.

Hertfordshire ITS Strategy
Transport Network Inventory
Hertfordshire County Council 3
2 The Hertfordshire Transport Network
2.1 Local Transport Plan The Hertfordshire Local Transport Plan (LTP2) sets out a vision for what the future of transport in Hertfordshire over the next 20 years is:
‘To provide a safe, efficient and affordable transport system that allows access for all to everyday facilities. Everyone will have the opportunity and information to choose the most appropriate form of transport and time of travel. By making best use of the existing network we will work towards a transport system that balances economic prosperity with personal health and environmental well being.’
The vision assumes that the car will remain the dominant form of transport in terms of the number of journeys made, but that its physical dominance will be reduced so as to allow everyone a choice of travel mode.
This means:
• People will be and will feel safer travelling on Hertfordshire’s roads.
• Hertfordshire will have a transport network that moves freely and efficiently transporting people and goods.
• Journey times and cost of travel to access key facilities such as education, healthcare, work and shopping, will be reasonable.
• People will have access to information to inform their travel choices by different modes to their choice of destination.
• Hertfordshire will have a network that is managed in a sustainable manner and contributes to an improved quality of life for residents.
2.1.1 The Transport Objectives The transport objectives have evolved from the eight defined in the first Local Transport Plan. These original objectives were developed through consultation with local, regional, national groups and organisations and the public. These were subject to further consultation in Autumn 2003 and Spring 2005 for the development of this second LTP. All eight objectives have been retained (some with slight alterations) and one new objective has been added around the growth of transport.
The objectives below all contribute to the delivery of the shared priorities that the Department for Transport has outlined that Highway Authorities have to deliver. The nine LTP objectives are listed below under the shared priorities:
Safety

Hertfordshire ITS Strategy
Transport Network Inventory
Hertfordshire County Council 4
1. To improve safety for all by giving the highest priority to minimising the number of collisions and injuries occurring as a result of the transport system.
Congestion
2. To obtain the best use of the existing network through effective design, maintenance and management.
3. To manage the network more effectively across the county in the face of growing transport and travel volumes, thereby securing improvements in the predictability of travel time.
4. To develop an efficient, safe, affordable and enhanced transport system which is attractive, reliable, integrated and makes best use of resources.
Accessibility
5. To develop a transport system that provides access to employment, shopping, education, leisure and health facilities for all, including those without a car and those with impaired mobility.
6. To ensure that the transport system contributes towards improving the efficiency of commerce and industry and the provision of sustainable economic development in appropriate locations.
Air Quality
7. To mitigate the effect of the transport system on the built and natural environment and on personal health.
Quality of Life
8. To raise awareness and encourage use of more sustainable modes of transport through effective promotion, publicity, information and education.
9. To reduce the need for the movement of people and goods through integrated land use planning, the promotion of sustainable distribution and the use of telecommunications.
The LTP2 provides a strategic driver for the adoption of greater transport interventions and management practices based on the adoption of ITS. This is supported by the LTP objectives 2, 4, 6 and 8 above.
In addition to the wider context strategy documents, the County Council has also published a number of daughter documents that support the delivery of the LTP. These are bus strategy, rail strategy, road safety plan, accessibility strategy, rights of way improvement plan and strategic environmental assessment report. Elements of

Hertfordshire ITS Strategy
Transport Network Inventory
Hertfordshire County Council 5
these documents provide additional drivers for the development of an ITS strategy for Hertfordshire.
Of specific relevance for the ITS strategy is the Hertfordshire Bus strategy 2006/07 – 2010/11.
This recognises that as the highway authority the County Council has a key role to play in provision of infrastructure to support bus operation. Following extensive consultation in SW Herts as part of the Bus Network Review, it was clear that, taking into account difficulties caused by historic limitations to highway space, preference should be given to bus priority systems at traffic signals and junctions, with supporting automatic vehicle location systems providing information, rather than further introduction of dedicated bus lanes. However, the second Local Transport Plan had placed great emphasis on the role of the bus in tackling congestion. Improved accessibility to services will also demand that facilities at stops are enhanced to meet customer needs.
The strategy for bus priority and infrastructure is therefore to:
• Provide a countywide Automatic Vehicle Location (AVL) system, which will allow the operation of bus services to be managed more effectively by operators and Bus Priority Improvement Partnerships (BPIP’s).
• Develop and implement a programme of targeted bus priority measures, in the form of bus activated signals and bus lanes, based on the information from the AVL system.
• Continue the investment programme in bus stops to improve accessibility to the network and access to the bus.
2.2 The Study Area and existing transport network The transport network considered within this study (Figure 2 below) corresponds to that covered by the Hertfordshire Local Transport Plan (LTP2) and includes the districts and boroughs of Broxbourne, Dacorum, East Herts, Hertsmere, North Herts, St Albans, Stevenage, Three Rivers, Welwyn Hatfield and Watford. The area under consideration has a population of over 1 million making it the second largest urban area in the East of England and the sixth largest population of any highway authority in the country (office for national statistics 2001 census data and Hertfordshire Traffic and Transport Data Report 2005 page 5).

Hertfordshire ITS Strategy
Transport Network Inventory
Hertfordshire County Council 6
Figure 2: Study area and main transport routes in Hertfordshire
2.2.1 Roads Hertfordshire’s roads carry large volumes of traffic with average flows on motorways, trunk roads and A roads almost double the national average. Within the study area there are a number of primary strategic road routes. In general, these routes carry the majority of long distance vehicle and freight movement in a north-south direction. These include A1(M)/A1, A10 and M1 linking local and strategic traffic with London and the north. There are fewer strategic east-west routes in the county with the exception of the heavily congested M25 in the south.
Key east and west routes are shown below:
• A602 (providing a key link between Hitchin and Ware/A10 via Stevenage and crossing A1(M)).
• A41 (located in south west Hertfordshire and runs from the outskirts of London west towards Aylesbury in close proximity to Watford and Hemel Hempstead).
Hertfordshire ITS Strategy
Transport Network Inventory
Hertfordshire County Council 7
• A120 (which provides an east-west link in the east of Hertfordshire linking A10 to the M11)
• A505 (which runs through Luton providing links to Hitchin, Baldock and Royston and connecting into A10 and M11).
• A414 (providing an east-west link from M25 (just north of Watford) through Hertfordshire via Hatfield, Hertford, Stanstead Abbotts and Harlow).
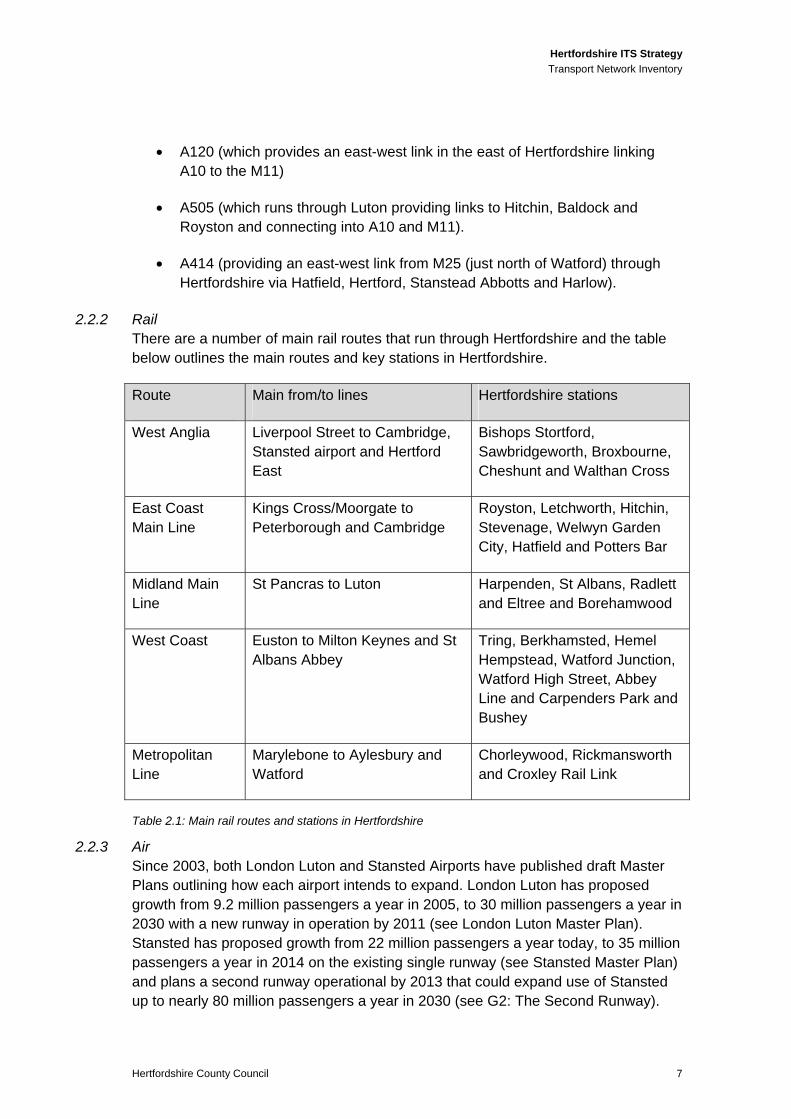
2.2.2 Rail There are a number of main rail routes that run through Hertfordshire and the table below outlines the main routes and key stations in Hertfordshire.
Route Main from/to lines Hertfordshire stations
West Anglia Liverpool Street to Cambridge, Stansted airport and Hertford East
Bishops Stortford, Sawbridgeworth, Broxbourne, Cheshunt and Walthan Cross
East Coast Main Line
Kings Cross/Moorgate to Peterborough and Cambridge
Royston, Letchworth, Hitchin, Stevenage, Welwyn Garden City, Hatfield and Potters Bar
Midland Main Line
St Pancras to Luton Harpenden, St Albans, Radlett and Eltree and Borehamwood
West Coast Euston to Milton Keynes and St Albans Abbey
Tring, Berkhamsted, Hemel Hempstead, Watford Junction, Watford High Street, Abbey Line and Carpenders Park and Bushey
Metropolitan Line
Marylebone to Aylesbury and Watford
Chorleywood, Rickmansworth and Croxley Rail Link
Table 2.1: Main rail routes and stations in Hertfordshire
2.2.3 Air Since 2003, both London Luton and Stansted Airports have published draft Master Plans outlining how each airport intends to expand. London Luton has proposed growth from 9.2 million passengers a year in 2005, to 30 million passengers a year in 2030 with a new runway in operation by 2011 (see London Luton Master Plan). Stansted has proposed growth from 22 million passengers a year today, to 35 million passengers a year in 2014 on the existing single runway (see Stansted Master Plan) and plans a second runway operational by 2013 that could expand use of Stansted up to nearly 80 million passengers a year in 2030 (see G2: The Second Runway).

Hertfordshire ITS Strategy
Transport Network Inventory
Hertfordshire County Council 8
Stansted is easily accessibly from north/south via M11 junction 8 and from east/west via A120. By rail the Stansted express runs regularly (every 15 mins) from London (Liverpool Street) and also calls at Bishops Stortford, Harlow Town and Tottenham Hale. There are also regular national express coach services providing access to the airport.
Luton Airport is easily accessible from the M1 (J10) and also from the A1(M), via the A505. There are also regular train services connecting the airport to central London (Kings Cross and St Pancras) via the Thameslink route services.
2.2.4 Car parking There are a number of towns within Hertfordshire with car parking capacity. Table 2.2 shows key towns and the current number of main car parks (owned and operated by the district/borough councils excluding railway and private car parks).
Town Number of Car Parks
Watford 6
Borehamwood 3
Bishops Stortford 5
St. Albans 5
Hatfield 5
Hemel Hempstead 4
Hertford 5
Hitchin 6
Letchworth 3
Stevenage 5
Waltham Cross 3
Welwyn Garden City 6
Table 2.2 - The main towns within Hertfordshire and the associated number of car parks within them
(Source: Derived from Hertfordshire VMS Strategy)
A VMS strategy has been developed as a separate report. The VMS strategy is formed of two parts, the first looking at strategic level signing for both the County and key towns and the second focussing on a local level at parking within the towns. The VMS parking strategy report details the locations of the car parks within each town,

Hertfordshire ITS Strategy
Transport Network Inventory
Hertfordshire County Council 9
key traffic routes, traffic generators/main influences, railway station parking and urban transport plan/future developments.
2.2.5 Freight The area does not include any passenger and freight ports, although the east-west routes across and around Hertfordshire provide linkages to the A120 in Essex and onto the eastern coast ports of Norfolk.
2.3 Constraints and challenges 2.3.1 Roads
There are unique factors that make Hertfordshire particularly vulnerable to congestion. There is a total road network of 4,900 km in Hertfordshire within a relatively small geographic area, leading to one of the highest road densities in Britain. Settlements within the county are no more than five miles apart and consist of small and medium sized towns creating complicated movements to access facilities and services. Congestion within local towns creates local difficulties for all users and impacts on the quality of the environment and the continuing growth in road traffic in Hertfordshire has adverse effects on the quality of life in the county.
The high level of traffic is a result of many interacting factors:
• Over 1 million residents spread amongst a dozen medium sized towns (more than 25,000 population) and many more smaller towns;
• Villages are generally no more than 5 to 10 miles from a range of towns creating complex journey patterns;
• Neighbouring London generates large commuting flows;
• Rail services provide good north-south movements but do not provide for east-west movements;
• The county sits astride three of the most important national routes (M25, M1 and A1(M));
• Car ownership is the sixth highest in the country;
• 40% of households have 2 or more cars;
• Access to key services, particularly healthcare, is difficult by passenger transport with only 13% of Hertfordshire’s residents being able to reach a hospital within 30 minutes by bus or train.
2.3.2 Rail Significant growth in population is expected across the East of England and the southeast in the period up to 2021. Whilst the overall strategy is to make this growth as sustainable as possible, the London employment market will inevitably have a big impact on future commuting patterns, where the railway is the prime mover.

Hertfordshire ITS Strategy
Transport Network Inventory
Hertfordshire County Council 10
Whilst Hertfordshire will have to accommodate some of this growth, significant increases are also proposed for Communities Plan Growth Areas outside the county (Milton Keynes, Northampton, Harlow, Cambridge). In all of these areas, additional numbers of commuters will put further pressure on already congested services and routes. In many cases, there are insufficient provisions in place to ensure that capacity on rail services will be available.
Within Hertfordshire, the main growth areas are expected to be in the Stevenage, Bishop’s Stortford and west of Hatfield areas. Significant commercial developments are expected in Stevenage, Watford and Hemel Hempstead, which are likely to promote relocation of businesses and employment from areas such as central and north London. (Hertfordshire Rail Strategy, page 2)
2.3.3 Air Hertfordshire has two major civil airports immediately over its borders, Stansted and London Luton, plus Heathrow a relatively short distance to the south-west. Stansted handled over 20 million passengers in 2004 and London Luton about 7.5 million, plus cargo and general aviation traffic. Passenger flows are particularly heavy on the related radial routes, the M11 and the West Anglia railway line from Stansted to Liverpool Street Station London, and the M1 and the Midland main line from Luton to Kings Cross. Employees are more widely spread on a range of routes close to each airport.
The government expects demand for air travel to increase dramatically. Forecasts predict an increase in air passengers in the south east from about 130 million a year to about 300 million by 2030. As a result the Government published a White Paper in December 2003 entitled The Future of Air Transport, which proposed new facilities and runways to meet future demand. The White Paper identified the potential for significant expansion at the two airports on Hertfordshire’s boundary: London Luton and Stansted. However, since this white paper was published, plans for expansion of Luton airport were scrapped in July 2007.
The White Paper proposals for additional runways would take capacity at Stansted to 82 million and Luton to 31 million. The second runway at Stansted is to be constructed by 2012. (A third runway at Heathrow would, if feasible, be post 2015).
2.3.4 Regional Spatial Strategy – Regional Interchange Centres The Regional Spatial Strategy (East of England Plan) is a draft spatial strategy to guide development in the East of England for at least the next 20 years – housing, economic development, the environment, transport, sport and recreation, waste development, mineral extraction and much more.
The Plan is formally a draft revision to the Regional Spatial Strategy for the East of England or RSS for short. It will cover Bedfordshire, Luton, Cambridgeshire, Peterborough, Hertfordshire, Essex, Southend-on-Sea, Thurrock, Norfolk and Suffolk.

Hertfordshire ITS Strategy
Transport Network Inventory
Hertfordshire County Council 11
Chapter 8 of the RSS presents the Regional Transport Strategy (RTS) for the East of England. It sets out the objectives of the RTS together with policies and investment proposals. The policies cover: serving the regional spatial strategy; environment and safety; accessibility; and traffic management.
In total there are 17 policies relating to Transport in the Regional Spatial Strategy, the first of these (T1) sets out the regional transport objectives as follows:
• Improve opportunities for all to access jobs, services and leisure/tourist facilities
• Enable infrastructure programmes and transport service provision to support both existing development (addressing problems of congestion) and that proposed in the spatial strategy (economic regeneration needs and further housing growth)
• Reduce the need to travel
• Reduce the transport intensity of economic activity, including freight
• Minimise the environmental impact of transport provision and travel, protecting and enhancing the natural, built and historic environment
• Improve safety and security.
To achieve these objectives the Regional Transport Strategy (RTS) seeks to:
• Widen travel choice: increasing and promoting opportunities for travel by means other than the private car, particularly walking, cycling and public transport, improving seamless travel through the provision of quality interchange facilities and raising travel awareness
• Promote the carriage of freight by rail and water and encourage environmentally sensitive distribution
• Stimulate efficient use of the existing transport infrastructure, efficiently maintaining and managing existing road, rail, port and airport infrastructure.
The second transport policy (T2) relates to public transport and Regional Interchange Centres. A significantly enhanced level of public transport service provision to, from and within the Regional Interchange Centres (Basildon, Bedford, Cambridge, Chelmsford, Colchester, Harlow, Ipswich, King’s Lynn, Luton/Dunstable, Norwich, Peterborough, Stansted, Stevenage, Thames Gateway (Southend), Thames Gateway (Thurrock) and Watford) will be sought.
Regional Interchange Centres (RICs) have been identified on the basis of the following key public transport characteristics (though not all have all the characteristics):
Hertfordshire ITS Strategy
Transport Network Inventory
Hertfordshire County Council 12
• Access to key mainline railways (north/south routes and actual or potential east/west routes)
• Served by strategic inter-urban bus/coach links
• Major bus hubs with strong sub-regional bus networks
• International airports serving domestic and international destinations direct, and accessed by rail and long distance coach services.
Some also have waterway connections within them or nearby.
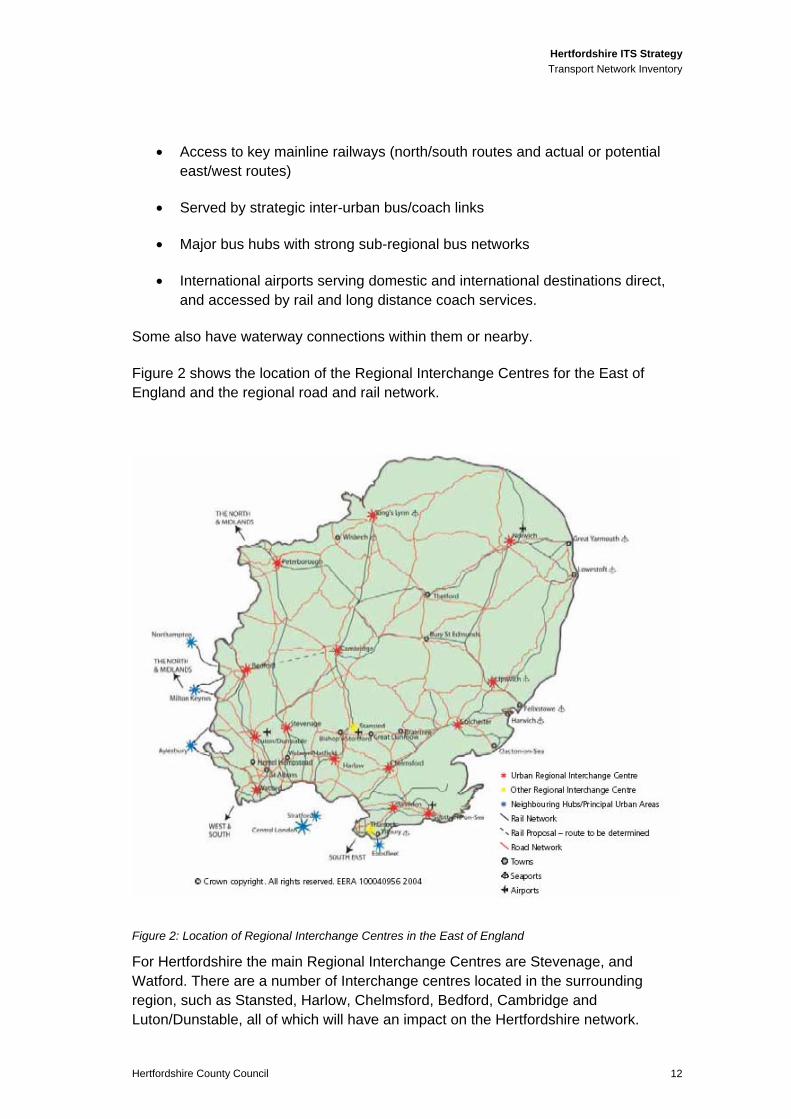
Figure 2 shows the location of the Regional Interchange Centres for the East of England and the regional road and rail network.
Figure 2: Location of Regional Interchange Centres in the East of England
For Hertfordshire the main Regional Interchange Centres are Stevenage, and Watford. There are a number of Interchange centres located in the surrounding region, such as Stansted, Harlow, Chelmsford, Bedford, Cambridge and Luton/Dunstable, all of which will have an impact on the Hertfordshire network.

Hertfordshire ITS Strategy
Transport Network Inventory
Hertfordshire County Council 13
The plan demonstrates the concentration of RICs in Hertfordshire and the south west of the region compared with the rest of the east of England.
2.4 Transport Statistics The LTP2, guided by delivery of the area’s long term transport objective, places great emphasis on interventions with the primary aim of tackling congestion, particularly with the aim of resolving existing issues or supporting development strategies.
Previous policies and interventions have focussed on encouraging modal shift by enhancing the facilities of other forms of transport. However the actual and perceived present level of congestion, combined with the development proposals over the coming years, means the future transport interventions and principally ITS interventions will need to address these issues.
2.4.1 Overview of traffic and commuter movements Hertfordshire produce a traffic and transport data report on a regular basis which analyses the data collected across the county. The key summary points in relation to motorised road traffic are as follows:
• There has been an overall increase in traffic levels between 2005 and 2006 of 1.5% in Hertfordshire, with A roads showing the largest increase of 3.6%.
• The only class of roads to show a decrease was motorway and trunk roads.
• HGV and powered two wheeler flow levels have remained steady.
• Traffic growth on local roads has been observed across all districts. North Hertfordshire and Welwyn Hatfield showed the highest growth.
• Three major motorway works programmes could be contributory factors to some of these increases, with traffic utilising local network routes during works periods.
The Council’s main source of information is obtained from the ongoing Traffic Data Counting Programme which primarily monitors road traffic levels and vehicle type. Automatic Traffic Counters (ATCs) are situated at sites across the county, spread across all road types. There are 237 sites which are monitored at least yearly and are analysed to provide the statistics in the County’s traffic and transport data report

Hertfordshire ITS Strategy
Transport Network Inventory
Hertfordshire County Council 14
Figure 3: Traffic count site locations from Traffic and Transport data report
Figure 3 demonstrates the spread of traffic count sites across the county and indicates where the main changes in traffic flow have occurred.
48 Automatic Traffic Counter (ATC) sites are located around the perimeter of Hertfordshire. The average throughput of these sites is 1.2 million vehicles per day. Vehicle occupancy measurements in the county suggest an average vehicle occupancy factor of 1.24 people per car. This suggests an average of 1.5 million people entering and leaving the county each week day.
Figure 4 below shows the relationship between the Annual Average Week Day flow per unit road length in comparison to the rest of Great Britain. The figures in the graph show that Hertfordshire’s roads carry a significantly higher level of traffic compared to the national average figures, almost double.

Hertfordshire ITS Strategy
Transport Network Inventory
Hertfordshire County Council 15
Figure 4 County and National Average Traffic Flow of All Vehicles by Road Type in 2006
*National figures derived from Tables 7.3 and 7.8 in Transport Statistics Great Britain 2006 Department
for Transport
The county experiences a wide range of flow levels on its main road network. Figures in the 2006 traffic and transport data report show that on the motorway network flows range from 23,000 vehicles per day on the M10 up to 137,000 vehicles per day on the M1. Figure 5 shows the average AAWD for each classified road type in the county, highlighting large differences in flow for the major route network compared to local routes.
Figure 5: Annual Average weekday flow by road classification for Hertfordshire

Hertfordshire ITS Strategy
Transport Network Inventory
Hertfordshire County Council 16
2.4.2 Congestion “Congestion” is a term often utilised in relation to traffic conditions experienced on a day to day basis. The County Council has utilised two methods to assist on providing a more robust definition of congestion:
• An assessment of “Congestion Reference Flow” (based on the physical capacity of the network), which shows which parts of the inter-urban network are likely to experience congestion;
• A review of urban conditions taken from a mix of junction modelling and subjective feedback from motorists and local residents.
This methodology provides a good indication of where problems occur, but it is recognised that it is not a definitive list. The figures overleaf show a projected level of congestion for 2013 which utilised “congestion reference flows” (Figure ). Figure 7 shows a map highlighting perceived congestion on the network.
Figure 6 highlights the main congested roads in Hertfordshire where traffic frequently experiences serious queuing and congestion on a daily basis with small incidents causing long delays. The main congested roads as shown below are:
• A1(M) between Letchworth and Welwyn Garden City and Hatfield and Borehamwood.
• A602 between Stevenage and Ware
• M25 between Borehamwood and Potters Bar
• A600 between Letchworth and Hitchin
• A115 Fairlands way in Stevenage
• A120 North of Bishops Stortford
• A1184 north of Sawbridgeworth
• A1170 Hoddesdon to Cheshunt
• A1000 Hertford/Bessemer Road Welwyn Garden City
• M1 Watford and St Albans/Hemel Hempstead sections
• A4146 from Hemel heading towards Milton Keynes
• A5 and A5183 from St Albans heading towards Milton Keynes
• M25 and A404 around Rickmansworth

Hertfordshire ITS Strategy
Transport Network Inventory
Hertfordshire County Council 17
• A5183 between Borehamwood and St Albans
• A416 Kingshill Way in Berkhamsted
• A411 in west Watford
• A4125 in south east Watford
Figure 6: Congestion reference flow ratios 2013

Hertfordshire ITS Strategy
Transport Network Inventory
Hertfordshire County Council 18
Figure 7: Perceived congestion hotspots in Hertfordshire
The County Council has developed a Congestion Action Plan in response to concerns raised about this issue. As part of the LTP strategy for tackling congestion one of the actions was to develop a telematics (ITS) strategy for the county.

Hertfordshire ITS Strategy
Transport Network Inventory
Hertfordshire County Council 19
2.4.3 Commuter movements Figure 8 below illustrates the total commuting movement in /out of Hertfordshire
Figure 8: Total Commuting flows in Hertfordshire (LTP2)
An analysis of trip purpose shows that one in five (20%) of all journeys were trips to work and a further 6% were transport connections, often as part of a journey to work. The other main reasons for journeys were shopping (13%) and recreation (13%) (see Figure 3).

Hertfordshire ITS Strategy
Transport Network Inventory
Hertfordshire County Council 20
Figure 3: Split of Journey purpose in Hertfordshire
Figure 4 taken from the Census 2001 and included in Hertfordshire’s traffic and transport data report, shows that within Hertfordshire as a whole, almost two thirds of people aged 16 – 74 used the car as their main mode of travel to work. The second most popular mode was train/underground followed by walk.
Figure 4: Travel to work mode share
2.4.4 Speed statistics Speed continues to be a major contributory factor towards accidents in Hertfordshire. “Speed” includes misjudging speed and distance, going too fast for the conditions and travelling over the speed limit.
The County Council is developing a speed management strategy to help address the safety and environmental impacts of inappropriate speed. The strategy will set out a framework to enable a consistent approach to implementing speed limits, and a toolkit for ensuring that these speed limits are respected and enforced.
In a further attempt to reduce the number of speeding vehicles and resultant casualties, a partnership between Hertfordshire County Council, Hertfordshire Police and the Magistrates’ court was set up in 2003 to create the Hertfordshire Safety Camera Partnership. Further details about this partnership and other programmes for casualty reduction can be found in Hertfordshire’s Road Safety Plan.
An annual programme of speed data collection was established in 1996 to monitor the changing patterns of traffic speed in the county. The current programme consists of 31 speed monitoring sites covering different levels of the road hierarchy across all districts. The automated traffic count programme is shown in Figure 5 below.

Hertfordshire ITS Strategy
Transport Network Inventory
Hertfordshire County Council 21
Figure 5: Speed monitoring sites across Hertfordshire
On most roads there is a fairly strong correlation between traffic flow and the proportion of vehicles exceeding the speed limit; generally the higher the flow, the lower the number of speeding vehicles as the flow approaches the road capacity, limiting throughput. There is a greater incidence of speeding vehicles at weekends in comparison with weekdays, reflecting the extra congestion experienced on the network during the working week.
Figure 6 (figures 3.16, 3.17 and 3.18 from the traffic and transport data report 2006) summarise the speed surveys from 2005 and 2006. The mean daily percentage of vehicles exceeding the speed limit is highly variable between sites but relatively stable for a given site.

Hertfordshire ITS Strategy
Transport Network Inventory
Hertfordshire County Council 22
Figure 6: Comparison of speeds in Hertfordshire
Speeds are recorded at the 85th percentile, the speed which 85% of vehicles are travelling below, as this parameter is more stable with respect to local conditions and only significant changes in traffic behaviour will alter the results. Mean speeds are also quoted, as these are closely related to the speed limit at the site.
There has been a marked improvement in the measurements of speed compliance at 30 mph and 40 mph sites between 2005 and 2006. This is evident in the weekday and weekend figures.
There are reductions in nearly all of the 85th percentile speeds and mean speeds for the different speed categories supporting the view that speed compliance has improved in 2006 compared to 2005 across the monitoring programme.
The observed changes are in line with County Council policies to try and improve speed limit compliance in Hertfordshire. A combination of information and enforcement is designed to persuade drivers of the need to adhere to the designated speed limits.
Monitoring will continue through the life of the current Local Transport Plan to gauge if this is part of a long term trend towards reductions in vehicle speeds on the roads of Hertfordshire.

Hertfordshire ITS Strategy
Transport Network Inventory
Hertfordshire County Council 23
2.5 Prime Transport Corridors (PTC) Hertfordshire is unique in its location as it provides a key link into London and the surrounding counties. There are a number of key transport corridors that run through Hertfordshire which are M1, M25, A1, A120, A6, A5, A41, A414, A505. The following section outlines the major schemes planned in Hertfordshire under the current LTP programme.
2.5.1 Major schemes Major schemes are classified as those schemes costing more than £5 million. Given current Government funding levels, it is likely that only one or two Major schemes will be funded during LTP2. The list of schemes being put forward to the DfT are below:
• Croxley Rail Link - this scheme has been bid for in LTP1. This scheme has been prioritised by the East of England Regional Assembly, in advice to Government for the priorities of Regional Funding Allocations;
• Watford Junction Interchange – provisionally accepted by DfT, but funding yet to be confirmed;
• A120 at Little Hadham.
An additional three schemes were consulted upon as part of the process to develop this LTP but were not taken forward after consultation. These schemes remain as key priorities and will be addressed through the measures outlined below:
• A602 Ware to Stevenage Improvements - The County Council has successfully bid and secured Community Infrastructure Funding from the ODPM/DfT. Although, this will not deliver all the benefits of a Major scheme it would address some of the safety and capacity issues, and further details are contained in this section.
• A120 Bishop’s Stortford Bypass Dualling - A new transport study for Bishop’s Stortford is being carried out by Steer Davies Gleave which will consider transport issues for the town and inform the development of the Eastern Herts Area Transport Plan.
• County Telematics Strategy - Although this was identified as a possible Major Scheme through previous consultation, it is now more likely to be delivered as a series of smaller projects across the county.
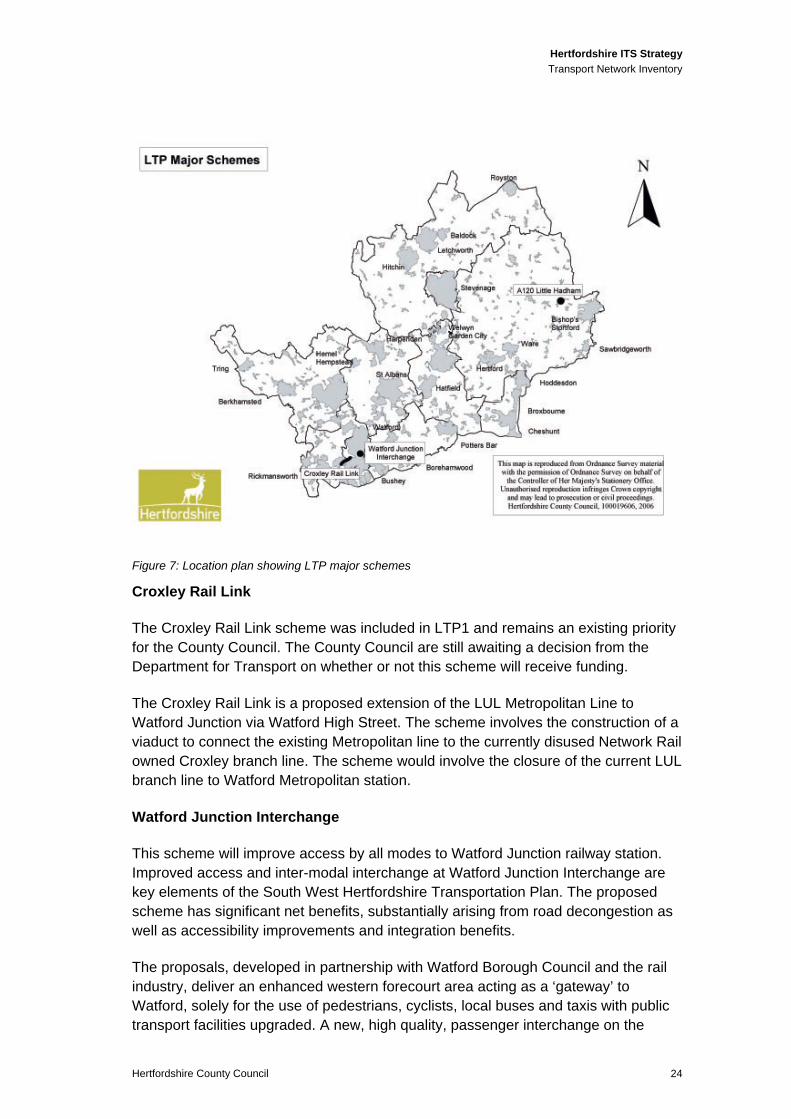
Details of the major schemes are shown in Figure 7 and are described in more detail below. These schemes have been selected due to a consideration of their importance and the ability to deliver the improvements within the next five years.
Hertfordshire ITS Strategy
Transport Network Inventory
Hertfordshire County Council 24
Figure 7: Location plan showing LTP major schemes
Croxley Rail Link
The Croxley Rail Link scheme was included in LTP1 and remains an existing priority for the County Council. The County Council are still awaiting a decision from the Department for Transport on whether or not this scheme will receive funding.
The Croxley Rail Link is a proposed extension of the LUL Metropolitan Line to Watford Junction via Watford High Street. The scheme involves the construction of a viaduct to connect the existing Metropolitan line to the currently disused Network Rail owned Croxley branch line. The scheme would involve the closure of the current LUL branch line to Watford Metropolitan station.
Watford Junction Interchange
This scheme will improve access by all modes to Watford Junction railway station. Improved access and inter-modal interchange at Watford Junction Interchange are key elements of the South West Hertfordshire Transportation Plan. The proposed scheme has significant net benefits, substantially arising from road decongestion as well as accessibility improvements and integration benefits.
The proposals, developed in partnership with Watford Borough Council and the rail industry, deliver an enhanced western forecourt area acting as a ‘gateway’ to Watford, solely for the use of pedestrians, cyclists, local buses and taxis with public transport facilities upgraded. A new, high quality, passenger interchange on the
Hertfordshire ITS Strategy
Transport Network Inventory
Hertfordshire County Council 25
eastern side includes facilities for longer distance passenger transport services as well as taxi and private vehicle ‘drop-off’ points.
A new road link offers improved access to the station from the motorway system, thereby alleviating existing traffic congestion in the immediate vicinity of the Station and within the wider area, benefiting bus operations at the station as well as on the approaches to it. The provision of increased parking capacity will encourage a “parkway” facility for longer distance travellers and reinforce Watford’s role as transport hub north of London.
A120 at Little Hadham
This scheme proposes to address the traffic issues at Little Hadham on the A120. The village lies on a major east-west route linking the M11 with the A10 and A1. Movement of traffic, along the A120 east-west corridor, causes congestion in Little Hadham, and there will be increasing pressure on the route as a result of expansion at Stansted Airport and the completion of the A10 bypass at Wadesmill.
The capacity constraints are compounded by Albury Road, which forms a staggered crossing with the A120 in the middle of the village. Traffic signals operate on four phases causing queueing on the A120 in both directions. Over the last five years there have been twenty-seven accidents: twenty-five were slight and two were serious. The County Council has undertaken full public consultation to investigate all the options to address the issue at Little Hadham setting it within the wider context of the A120 corridor, and is promoting a northern bypass to the village as part of an overall strategy to provide improvement on the A120 corridor.
2.5.2 Longer Term beyond LTP2 There are a number of areas which have previously been consulted on that will not form part of this LTP submission but which the County Council have recognised could be investigated after 2010/11. These areas are (not in priority order):
• A10 Royston;
• A120 Standon;
• A414 Gascoyne Way, Hertford;
• A414 - M11;
• A505 Hitchin to Letchworth;
• A602 Gunnels Wood Road Roundabout, Stevenage;
• A1184 Sawbridgeworth.
The list of major transport infrastructure requirements will be revised when the East of England Regional Spatial Strategy is published later this year. In addition, the

Hertfordshire ITS Strategy
Transport Network Inventory
Hertfordshire County Council 26
County Council has recently commissioned the development of an Infrastructure and Investment Strategy. This emerging Strategy will define the infrastructure requirements across Hertfordshire to meet the challenging targets set by the RSS. It will also provide a comprehensive, robust and transparent infrastructure funding model, whereby costed infrastructure investment requirements across the County can be matched with the means of funding them.
2.5.3 Multi modal studies (taken from LTP2 page 29) The Department for Transport has undertaken a series of ‘multi-modal studies’ to consider future infrastructure needs on the main national transport corridors. The two main studies which affect Hertfordshire are: London Orbital, London and South Midlands. The outcomes of these studies will affect this and future Local Transport Plans.
The London Orbital multi-modal study considered transport movements around the M25 corridor and across the Greater London area. This study recommended the proposals to widen the certain sections of the M25 through Hertfordshire to dual-4 lanes within the existing boundaries. Since April 2004, the Highways Agency has been developing design, programming and procurement arrangements for the M25 Widening. The sections to be widened which pass through Hertfordshire are:
• M25 Jct 16 to 23 (M40 - A1 (M)) - 35 km
• M25 Jct 23 to 27 (A1 (M) - M11) - 27 km
On other sections of the M25 in Herts, the HA are considering various options from their Integrated Demand Management toolkit, which may include ramp metering and hard shoulder running.
The London to South Midlands multi modal study considered the M1, A1 and M11 corridors and adjacent rail links and the needs of east west travel in the area. The study proposed the widening of the M1 between junctions 6a to 13, a project which is in fact now virtually complete. The County Council welcomed the overall scheme for widening these sections, as they are subject to congestion particularly at peak periods and some traffic leaves the motorway to use alternative local routes.
Of particular relevance to Hertfordshire was that recommendations for the A1(M) junctions 6-8 only suggested modest improvements, and should be developed based on a climbing lane north of junction 6, supplemented by active traffic management to mitigate the worst effects of the loss in capacity across this junction. The County Council was disappointed with this decision. There continues to be congestion problems along this stretch of the A1(M), and safety issues around the queuing traffic, therefore the County Council still wish to see it widened.
It should be recognised that these studies were completed before the publication of the East of England Plan which includes plans for major growth in the county. The

Hertfordshire ITS Strategy
Transport Network Inventory
Hertfordshire County Council 27
County Council is concerned that the traffic implication of this growth will have an adverse affect on the anticipated benefits of the above.
Figure 8: East of England plan, Key diagram

Hertfordshire ITS Strategy
Transport Network Inventory
Hertfordshire County Council 28
2.5.4 London arc influence London has a significant impact on the transport network and traffic levels in Hertfordshire. There are a high number of: residents who commute into the capital for work (20% of the county’s employed population), businesses who locate in Hertfordshire to service the Capital’s economy, and through traffic from long-distance journeys who access London, the South East and Europe via Hertfordshire. The county has good radial routes (both road and rail) from London, but these are operating at capacity.
2.6 Planned Events and Incidents The Olympics (taken from LTP2 p31)
For the 2012 London Olympics, the canoeing / kayaking competition is set to be held at the planned Broxbourne White Water Canoe Centre in the Lee Valley Regional Park and there will be pressure on the county for visitors needing to access Stratford. A partnership (including the County Council, Herts Chamber of Commerce, Lea Valley Park Authority, Herts Association of Cultural Officers, Herts Sports Partnership and Sport England) has been set up to identify the overall impact on Hertfordshire and the opportunities it would bring.
The County Council will need to ensure that local transport provision will be able to accommodate the additional visitors to the area. In particular, the Council will need to look at integrated transport at Waltham Cross, Theobalds Grove and potentially Cheshunt Stations, pedestrian access to the site and parking and traffic management issues. The Games will provide benefits to the whole community (residents, businesses and visitors) and to the local economy.
Hertfordshire ITS Strategy
Transport Network Inventory
Hertfordshire County Council 29
3 Summary
This report sets out the current context, characteristics and constraints of the transport network within Hertfordshire. The report:
• Considered the characteristics of the network
• Provides a summary of transport statistics
• Describe the opportunities, problems and constraints apparent on the network which the ITS strategy will need to address.
In undertaking this stage of the study reference has been drawn from the Hertfordshire Local transport plan 2006-2011 (LTP2), associated daughter documents, supporting data reports and the East of England Plan (Regional Spatial Strategy).
The transport network considered within this study corresponds to that covered by the Hertfordshire Local Transport Plan (LTP2) and includes the districts and boroughs of Broxbourne, Dacorum, East Herts, Hertsmere, North Herts, St Albans, Stevenage, Three Rivers, Welwyn Hatfield and Watford. The area includes a number of strategic routes linking the north of England with London and the south east as well as catering for local traffic movements.
Traffic data shows that traffic flows have remained approximately the same with speeds reducing on the lower speed roads. Studies have been carried out and the HCC report “Tackling Congestion” has been produced to identify the issues in Hertfordshire. Congestion is a key area for HCC to address; with 64% of local residents expressing a view in recent surveys that road congestion is a major issue. However, only 30% of people think that the County Council is doing a good job tackling the problem. Congestion hotspots have been identified and strategic plans are being put in place to tackle the issue. The ITS strategy forms a critical part of the overall approach to dealing with congestion.
The identification of key congestion hotspots and key schemes identified in key strategy documents provides an opportunity to target the implementation of ITS to key areas to meet the objectives set out by Hertfordshire.
We have used our reasonable endeavours to provide information that is correct and accurate and have discussed within the document reasonable conclusions that can be reached on the basis of the information available. Having issued the range of conclusions it is for the client to decide upon a course of action.

Hertfordshire County Council
Highways House
41-45 Broadwater Road
Welwyn Garden City AL7 3AX
Related documents
The ITS Strategy is a Daughter Document to the Local Transport Plan 3 which can be accessed directly via the Herts Direct website:
www.hertsdirect.org/ltp
Further Daughter Documents will be published for consultation in 2011:
• Bus Strategy and accompanying Intalink Strategy
• Rural Strategy
• Speed Management Strategy (the current version can be found under the LTP2 link below)
• Inter Urban Route Strategy
Hertfordshire County Council –
making Hertfordshire a better place to live
by providing:
Care for older peopleSupport for schools, pupils and parentsSupport for carersFire and rescueFostering and adoptionSupport for people with disabilitiesLibrariesAdmission to schoolsRoad maintenance and safetyProtection for adults and children at riskTrading standards and consumer protectionHousehold waste recycling centresThese are only some of our services.Find out more at www.hertsdirect.orgor email us at [email protected] Hertfordshire library has free internet accessfor the public
February 2011
Design ref: 060xxx
Printed on recycled paper w
ith a minim
um of 75%
made from
de-inked post consumer w
aste