intelligent debugging for vulnerability analysis and ... · for vulnerability analysis and exploit...
TRANSCRIPT

1
Intelligent Debugging for Vulnerability Analysis and Exploit
Development
Security Research

2
Who am I?● Damian Gomez, Argentina● Being working @ Immunity since early 2006● Security Research focusing on:
– Vulnerability analysis
– Exploit development
● VisualSploit lead developer● Main developer of Immunity Debugger project
3
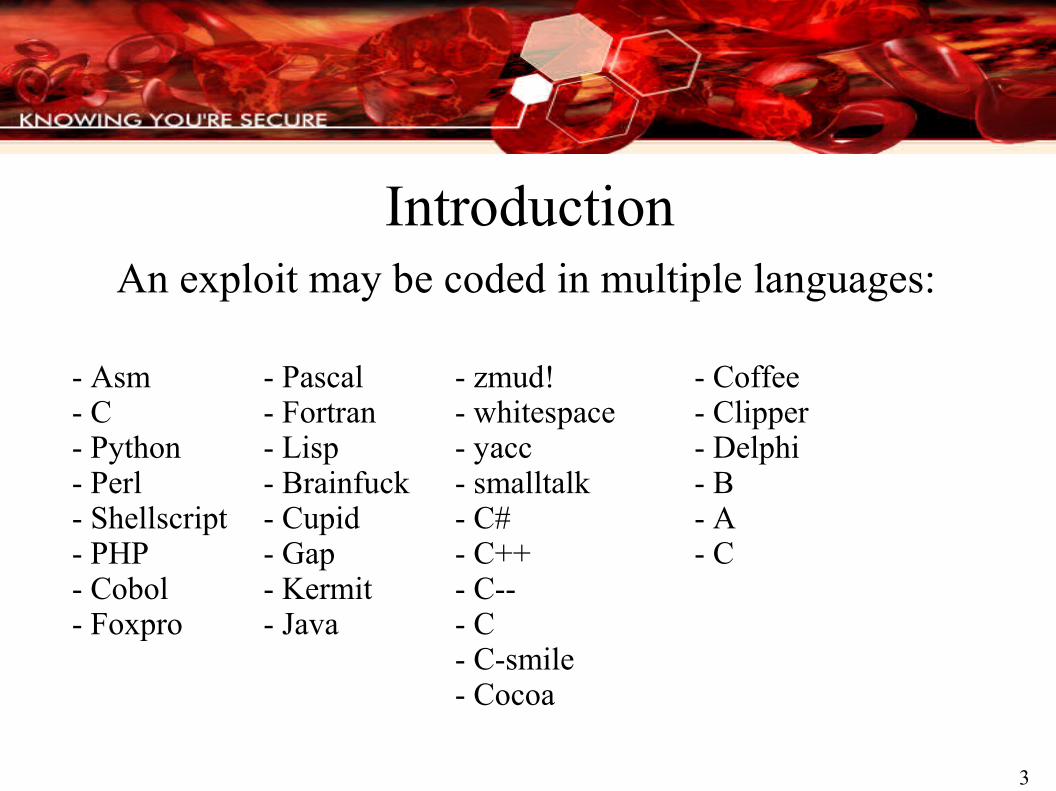
Introduction An exploit may be coded in multiple languages:
- Pascal- Fortran- Lisp- Brainfuck- Cupid- Gap- Kermit- Java
- Asm- C- Python- Perl- Shellscript- PHP- Cobol- Foxpro
- zmud!- whitespace - yacc- smalltalk- C#- C++- C--- C- C-smile- Cocoa
- Coffee- Clipper- Delphi- B- A- C

4
- Clist- Kalkulon- ABC- ADA- ALF- Batch- TOM- OZ- Modula-3
- Lingo- Fortress- elastiC- D- cT- AWK- Felix- Guile - MC#
- VisualBasic- Nemerle- Objetive-C- Phantom- Prolog- Simula- Snobol- Turing- Blue
- Quickbasic- Ruby- S- Obliq- GNU E- COMAL - NetRexx- PL/B- Sather

5
etc

6
Immunity VisualSploit introduced a graphical domain-specific language
for exploit development

7
Exploits are a functional representation of Intelligent
Debugging
Exploit
Input Crafting
Heap Analysis
Memory statemanipulation
Protocol Analysis

8
We want a debugger with a “rich API” for exploit development
● Simple, understandable interface● Robust and powerful scripting language for
automating intelligent debugging● Lightweight and fast debugging so as not to
corrupt our results when doing complex analysis● Connectivity to fuzzers and other exploit
development tools

9
No one user interface model is perfect for all exploit development situations
● These three main characteristics will help us achieve what we want:– GUI
– Command Line
– Scripting language
10
A debugger's GUI can take weeks off the time it takes to write an exploit
● Easy visualization of debugee context– Does EAX point to a string I control? Yes!
● Faster to learn for complex commands● Downside: Slower usage than commandline due to
mice

11
The command line is the faster option
● Example GDB commandline:– x/i $pc-4
● Example WinDBG commandline:– u eip -4
● Example Immunity Debugger commandline:– u eip -4

12
Immunity Debugger's Scripting Language is Python 2.5
● Automate tasks as fast as you can think of them● Powerful included API for manipulating the
debugger– Need another API hook? Email
● Familiar and easy to learn● Clean and reusable code with many examples
13
GUI+CLI+Python = Faster, better exploits
● Immunity Debugger integrates these 3 key features to provide a vuln-dev oriented debugger
● Cuts vulnerability development time in half during our testing (Immunity buffer overflow training)
● Allows for the rapid advancement of state-of-the-art techniques for difficult exploits
14
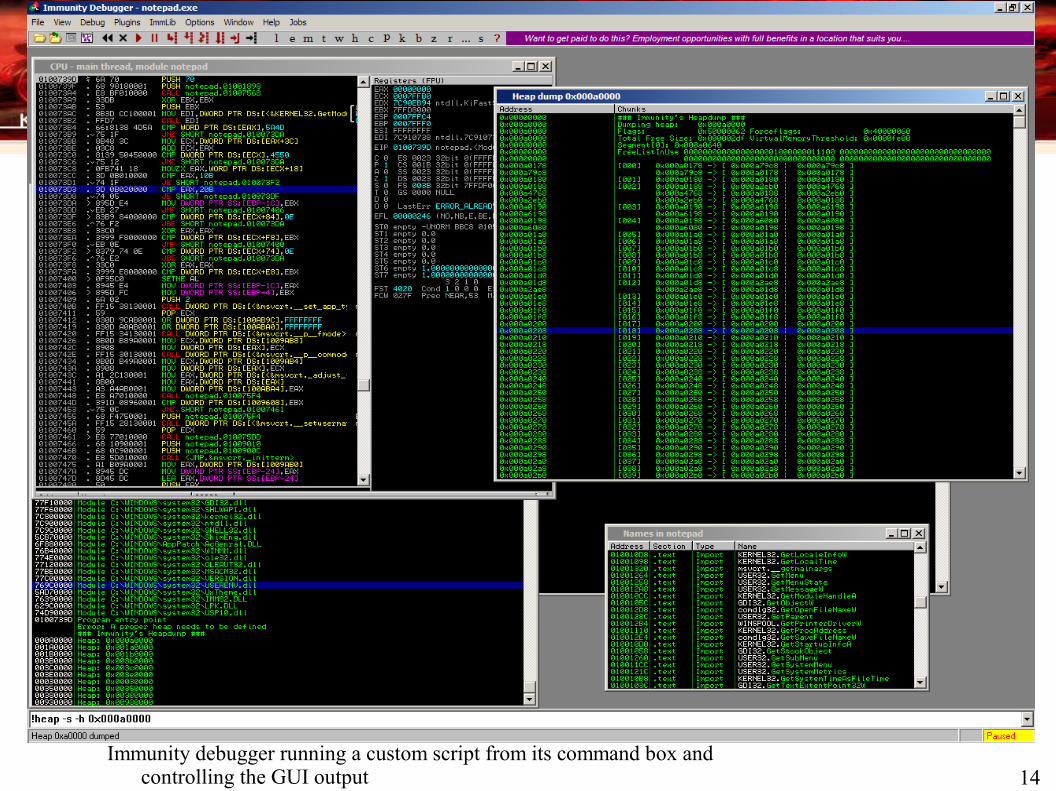
The integration
Immunity debugger running a custom script from its command box and controlling the GUI output

15
The Immunity Debugger API: ● The API is simple● It usually maintains a cache of the requested
structures to speed up the experience (especially useful for search functions)
● It can not only perform debugging tasks, but also interact with the current GUI
● Keep in mind that you are creating a new instance on every command run, so the information in it will be regenerated on each run.

16
How deep can we dive with the API? ● Assembly/Disassembly● Breakpoints● Read/Write Memory● Searching● Execution and stepping● Analysis● Interaction with GUI

17
Interacting with the GUI offer: ● New custom windows for displaying your data● Tables, Dialog boxes, Input dialogs
– Create a wizard for complex scripts like findantidep
● Add functionality to already existent windows● The possibility to create a python based
orthogonal drawing algorithm and get something like this:

18
Python API Orthogonal Grapher

19
Immlib: R/W Memory
● readMemory(address, size)
● readLong(address)
● readShort(address)
● readString(address)
● readUntil(address, ending_char)
● writeMemory(address, buf)

20
Immlib: Searching
● The following search functions return a list of addresses where a particular value was found.
● Search(buf)
● searchLong(long_int)
● searchShort(short_int)

21
Immlib: Searching ● Searching Commands● Commands are sequence of asm instruction
with a bit of regexp support– searchCommands(cmd)
– SearchCommandsonModule(address, cmd)
● Returns a list of (address, opcodes, module)● ex:
imm.searchCommands(“pop RA\npop RB\nret”)

22
Immlib: Searching ● Keep in mind, that SearchCommands use
the disassemble modules to search, so if you want a deeper search (without regexp) you can do:ret = imm.Search(imm.Assemble("jmp EBX"))

23
Immlib: Searching ● Finding a module which an address belongs
to:– findModule(address)
● Finding exported function on loaded addresses– findDependencies(lookfor)
Note: lookfor is a table of functions to search for

24
Immlib: Getting References ● Getting Code XREF:
– getXrefTo(address)
– getXrefFrom(address)
● Getting Data XREF– findDataRef(address)

25
Immlib: Knowledge
● Since every run of a script is ephemeral, there is a way to save some data and use it on a second run of the same script or any other script:– imm.addKnowledge(“nocrash”, cpu_context)
– imm.getKnowledge(“nocrash”)
26
There are three ways to script Immunity Debugger
● PyCommands ● PyHooks ● PyScripts

27
PyCommands are temporary scripts● Decrease developing and debugging time● Non-caching (run , modify, and re-run your
PyCommand at will, without restarting the debugger)
● Accessible via command box, or GUI ● Integrate with debugger's features (including the
GUI)

28
Scripting Immunity Debugger● Writing a PyCommand is easy● command.py
import immlib
def main(args):
imm=immlib.Debugger()
imm.Log(“Done”)
● Place it into PyCommands directory and you are ready to go

29
Scripting Immunity DebuggerPyHooks:● Hooks are Objects that hang on debugger
events and get executed when that event is hit.
● We have 11 different hooks: ● class BpHook(Hook)● class LogBpHook(Hook)● class AllExceptHook(Hook)● class PostAnalysisHook(Hook)● class AccessViolationHook(Hook)● class LoadDLLHook(Hook)
● class UnloadDLLHook(Hook)● class CreateThreadHook(Hook)● class ExitThreadHook(Hook)● class CreateProcessHook(Hook)● class ExitProcessHook(Hook)

30
Scripting Immunity DebuggerCreating a Hook is easy:
Hooks always have CPU context
at runtime

31
Identify common coding problems by running a program under Immunity
Debugger
● strncpy(dest, src, strlen(src))– Common vulnerability primitive
● Similar vulnerabilities, such as memcpy(dest, src, sizeof(src)) are also detectable using slightly more advanced Immunity Debugger API's

32
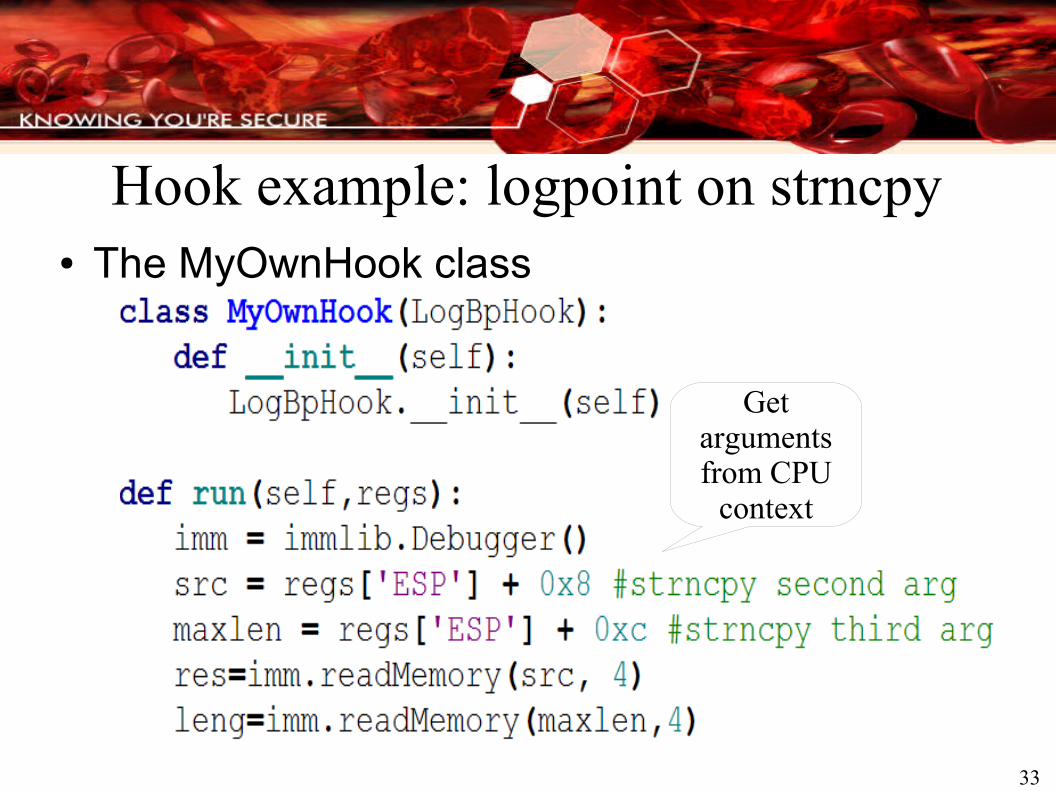
Hook example: logpoint on strncpy● Instantiate debugger class● Set logpoint address [strncpy]● Create logbphook
33
Hook example: logpoint on strncpy● The MyOwnHook class
Get
arguments from CPU
context

34
logpoint on strncpy (continuation)
Log callstack if the size arg is the same
as the src string size

35
Logpoint on strncpy: resultsdebug,debug,debug and check your results:

36
Injecting a hook into your target for debugging
● Logging hook● Much faster, since it doesn't use the debugger● Inject ASM code into debugged process● Hooked function redirects to your asm code● The information is logged in the same page● Used in hippiehippie heap analysis tool

37
There are drawbacks to using injection hooking
● Inject Hooking only reports the result, you cannot do conditionals on it (for now)
● Hooking on Functions:

38
Printing the results of an injection hook
● Get the results directly from the log window

39
Heap analysis is one of the most important tasks for exploit
development● Printing the state of a heap● Closely examining a heap or heap chunk● Saving and restoring heap state for comparison● Visualizing the heap● Automatically analyzing the heap
40
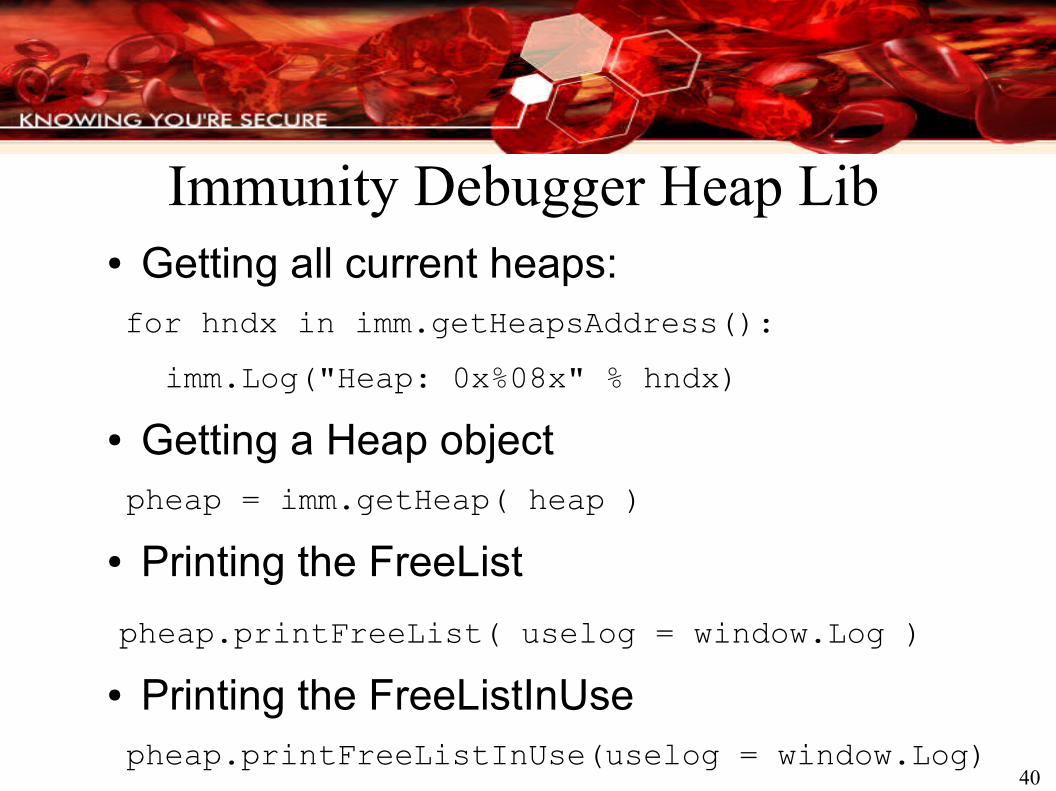
Immunity Debugger Heap Lib ● Getting all current heaps: for hndx in imm.getHeapsAddress():
imm.Log("Heap: 0x%08x" % hndx)
● Getting a Heap object pheap = imm.getHeap( heap )
● Printing the FreeList
pheap.printFreeList( uselog = window.Log )● Printing the FreeListInUse pheap.printFreeListInUse(uselog = window.Log)

41
Immunity Debugger Heap Lib ● Printing chunks
● Accessing chunk information

42
Immunity Debugger Heap Lib ● Searching Chunks SearchHeap(imm, what, action, value, heap = heap, option = chunkdisplay)
what (size,usize,psize,upsize,flags,address, next,prev)
action (=,>,<,>=,<=,&,not,!=)
value (value to search for)
heap (optional: filter the search by heap)
43
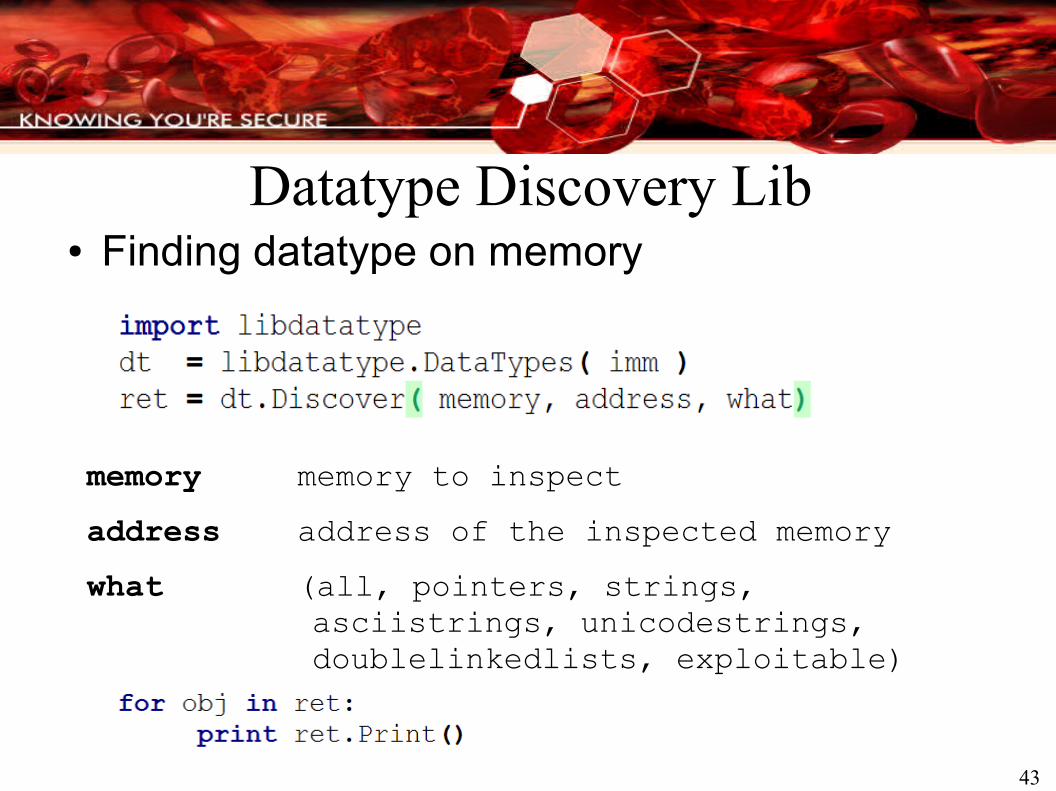
Datatype Discovery Lib● Finding datatype on memory
memory memory to inspect
address address of the inspected memory
what (all, pointers, strings, asciistrings, unicodestrings, doublelinkedlists, exploitable)
44
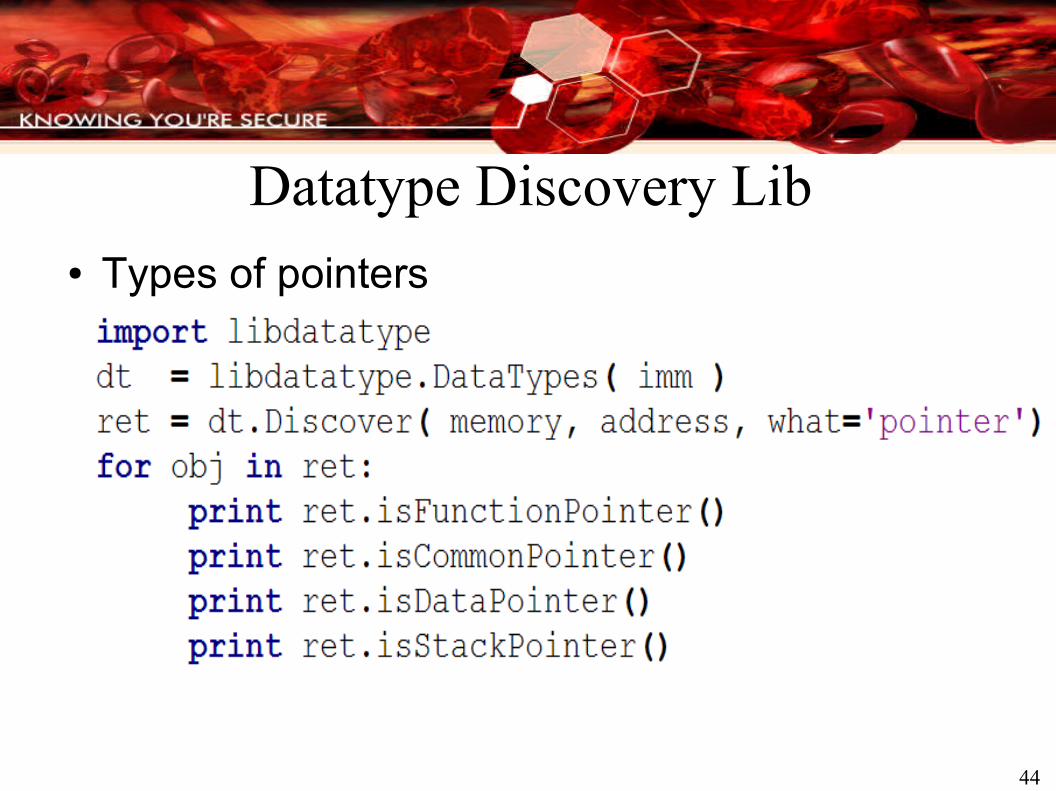
Datatype Discovery Lib● Types of pointers

45
Coast to coast

46
Immunity Debugger Scripts
● Team Immunity has being coding scripts for :– Vulnerability development
– Heap
– Analysis
– Protocols
– Search/Find/Compare Memory
– Hooking

47
Script: Safeseh ● safeseh
– Shows you all the exception handlers in a process that are registered with SafeSEH.
– Code snip:

48
Script: Find anti DEP ● Findantidep
– Find address to bypass software DEP
– A wizard will guide you through the execution of the findantidep script
● Get the result

49
Finding memory leaks magically● leaksniff
– Pick a function
– !funsniff function
– Fuzz function
– Get the leaks

50
Finding datatypes in memory magically
● finddatatype– Specify an address
– Set the size to read
– Get a list of data types

51
Dumping the heap● Heap pycommand
– Give
address
– Dump it

52
Script : Chunk analyze● chunkanalyzehook
– !chunkanalyzehook -a addr_of_rep_mov EDI-8
– Run the script and fuzz
– Get the result (aka, see what of your command on the fuzzing get you a overwrite of a Function Ptr or Double Linked list)

53
Script : Get RPC● getrpc
– !getrpc module.dll
– Access to RPC information
– Functions Pointers of every RPC call

54
Script : duality
● Duality– Looks for mapped address that
can be 'transformed' into opcodes

55
Script : Finding Function Pointers
● !modptr <address>– this tool will do data type recognition looking for all
function pointers on a .data section, overwriting them and hooking on Access Violation waiting for one of them to trigger and logging it

56
Script : CRYPT SEARCH
● !searchcrypt address range– Search for cryptographic routines in given range

57
Case Study: Savant 3.1Stack Overflow
● Savant webserver (savant.sourceforge.net)
● Stack overflow when sent long get request
however...

58
Case Study: Savant 3.1First problem
● Overwritten stack arguments won't allow us to reach EIP

59
Case Study: Savant 3.1First problem
● So we need to find a readable address to place as the argument there....
● And we'll face the second argument: a writable address

60
Case Study: Savant 3.1
To hit EIP:– A readable address
– A writable address
– The arguments offsets in our evilstring:

61
Case Study: Savant 3.1
Finding the offsets...

62
Case Study: Savant 3.1We get something like this:
And with the arguments issue solved we are able to cleanly hit EIP

63
Case Study: Savant 3.1
● Once we hit EIP, in detail we have control over:– EBP value
– EIP value (of course)
– What ESP points to (1 argument)
– What ESP + 4 points to (2 argument)
– More than 200 bytes buffer starting at [EBP – 104H] to [EBP - 8H]

64
Case Study: Savant 3.1And with this context, the
first thing one would think is:
we need to jump back,
but how?
Second Problem....
What ESP points to

65
Case Study: Savant 3.1Since we are controlling what ESP points to, what if we
could find an address to place as the overwritten argument, which:– Is writable [remember first problem]
– Can be “transformed” into opcodes that would be of use here...like a 'jmp -10' (to land into our controlled buffer)

66
Case Study: Savant 3.1 Finding an address with these characteristics might be
pretty tedious...or a matter of seconds using one of the Immunity Debugger scripts we talked a few minutes ago: Duality

67
Case Study: Savant 3.1 How duality works:
– Create a mask of the searched code [jmp -10]
– Get all mapped memory pages
– Find all addresses that match our masked searchcode
– Log results:

68
Case Study: Savant 3.1 Almost there:
– Before finishing crafting our evilstring with the brand new transformable address we'll need to find a jmp esp for EIP:
● Searchcode script will do that in a quick and easy way

69
Case Study: Savant 3.1 Resume:
– Bypassed arguments problem
– Hit EIP
– Searched for a writable address that can be transformed into a desired opcode (0x7ffdf0eb)
– Searched for a jmp esp (0x74fdee63)
– Crafted the string:

70
Case Study: Savant 3.1 Resulting in:

71
Conclusions● ID wont give you an out-of-box exploit (yet) but:
– It will speed up debugging time (gui + commandline)
– Will help you finding the bug (API + libs + scripts)
– Will help you crafting your exploit (make it reliable!)
● ID is not a proof-of-concept application (it has been used for months successfully by our vuln-dev team)

72
Spinning in my head...● API server, to connect to VisualSploit, Canvas,
fuzzers, or whichever application● More graphing stuff, including interaction with the
generated graph● Tons of pycommands● Your script here
Meanwhile....

73
Download Immunity Debugger now!
Get it free at:
http://debugger.immunityinc.com
Comments, scripts, ideas, requests: