intelligent control and operation of distribution...
TRANSCRIPT

Aalborg Universitet
Intelligent Control and Operation of Distribution System
Bhattarai, Bishnu Prasad
Publication date:2015
Document VersionPublisher's PDF, also known as Version of record
Link to publication from Aalborg University
Citation for published version (APA):Bhattarai, B. P. (2015). Intelligent Control and Operation of Distribution System. Department of EnergyTechnology, Aalborg University.
General rightsCopyright and moral rights for the publications made accessible in the public portal are retained by the authors and/or other copyright ownersand it is a condition of accessing publications that users recognise and abide by the legal requirements associated with these rights.
? Users may download and print one copy of any publication from the public portal for the purpose of private study or research. ? You may not further distribute the material or use it for any profit-making activity or commercial gain ? You may freely distribute the URL identifying the publication in the public portal ?
Take down policyIf you believe that this document breaches copyright please contact us at [email protected] providing details, and we will remove access tothe work immediately and investigate your claim.
Downloaded from vbn.aau.dk on: maj 27, 2018

INTELLIGENT CONTROL AND
OPERATION OF DISTRIBUTION
SYSTEM
by
Bishnu Prasad Bhattarai
A Dissertation Submitted to
the Faculty of Engineering and Science at Aalborg University
In Partial Fulfillment for the Degree of
Doctor of Philosophy in Electrical Engineering
August 2015
Aalborg University


III
Copyright © Aalborg University, 2015
Aalborg University
Department of Energy Technology
Pontoppidanstræde 101
Aalborg East, Dk-9220
Denmark
Copyright © Bishnu Prasad Bhattarai, 2015
All rights reserved.
Printed in Denmark by Uniprint
First Edition: August 2015.
The professional software/tools used in this research:
DIgSILENT PowerFactory 15.0
MATLAB R2013a
Real Time Digital Simulator
OMNeT++
Python


V
THESIS DETAILS
Thesis title: Intelligent Control and Operation of Distribution System
Ph.D. Student: Bishnu Prasad Bhattarai
Supervisor(s): Assoc. Prof. Birgitte Bak-Jensen
Assoc. Prof. Jayakrishnan Radhakrishna Pillai
Ph.D. Committee: Prof. Remos Teodorescu, Aalborg University (Chairman)
Prof. Sami Rapo, Tampere University of Technology
Assoc. Prof. Olof Samuelsson, Lund University
Moderator: Prof. Calus Leth Bak, Aalborg University
Scientific Contributions:
J.1. Bhattarai, B.P.; Levesque, M.; Bak-Jensen, B.; Pillai, J. R.; Maier, M.; and
Tipper, D., “Design and co-simulation of a hierarchical control architecture
for demand response coordination”, IEEE Transactions on Power Delivery
(To be submitted).
J.2. Bhattarai, B. P.; Kouzelis, K.; Mendaza, I. D. D. C.; Bak-Jensen, B.; and
Pillai, J. R., “Smart grid constraint violation management for balancing and
regulating purposes,” IEEE Transactions on Smart Grid (To be submitted).
J.3. Bhattarai, B.P.; Levesque, M.; Maier, M.; Bak-Jensen, B.; and Pillai, J. R.,
“Optimizing electric vehicle coordination over a heterogeneous mesh
network in a scaled-down smart grid testbed,” IEEE Transactions on Smart
Grid, vol. 6, no. 2, pp. 784-794, Jan. 2015.
C.1. Bhattarai, B. P.; Bak-Jensen, B.; Mahat, P.; Pillai, J.R.; and Maier, M.,
“Hierarchical control architecture for demand response in smart grid
scenario,” in Proc. IEEE PES Asia Pacific Power and Energy Engineering
Conference (APPEEC), pp. 1-6, Dec. 2013.
C.2. Bhattarai, B. P.; Bak-Jensen, B.; Mahat, P.; Pillai, J. R., “Voltage
controlled dynamic demand response,” in Proc. 4th
IEEE Innovative Smart
Grid Technologies (ISGT) Europe, pp. 1-5, Oct. 2013.
C.3. Bhattarai, B. P.; Bak-Jensen, B.; Mahat, P.; and Pillai, J. R., “Two-stage
electric vehicle charging coordination in low voltage distribution grids,” in
Proc. IEEE PES APPEEC, pp 1-5, Dec. 2014.
VI
C.4. Bhattarai, B. P.; Bak-Jensen, B.; Pillai, J. R.; and Maier, M., “Demand
flexibility from residential heat pump,” in Proc. IEEE PES General Meeting,
pp. 1-5, Jul. 2014.
C.5. Astaneh, M. F.; Bhattarai, B.P.; Bak-Jensen, B.; Hu, W.; Pillai, J. R.; and
Chen, Z., “A novel technique to enhance demand responsiveness: An EV
based test case,” 6th IEEE PES Asia Pacific Power and Engineering
Conference, Nov. 2015.
C.6. Bhattarai, B. P.; Bak-Jensen, B.; Pillai, J. R.; Gentle, J. P.; and Myers, K.
S., “Coordinated control of demand response and grid-tied rooftop
photovoltaics for overvoltage mitigation,” 3rd
IEEE SusTech2015, Jul.–Aug.
2015.
C.7. Bhattarai, B. P.; Mendaza, I. D. D. C.; Bak-Jensen, B.; and Pillai, J. R., “A
local adaptive control of solar photovoltaics and electric water heaters for
real-time grid support,” CIGRE Session2016.
C.8. Bhattarai, B.P.; Bak-Jensen, B.; Chaudhary, S. K.; and Pillai, J. R.; “An
adaptive overcurrent protection in smart distribution grid,” in Proc. IEEE
PES PowerTech, Jun.–Jul. 2015.
This present report combined with the above listed scientific papers has been
submitted for assessment in partial fulfilment of the PhD degree. The scientific
papers are not included in this version due to copyright issues. Detailed publication
information is provided above and the interested reader is referred to the original
published papers. As part of the assessment, co-author statements have been made
available to the assessment committee and are also available at the Faculty of
Engineering and Science, Aalborg University.

VII
To:
My parents,
My wife, and
Whole family
For their exceptional love and support in my life.


IX
PREFACE
I am very thankful to ForskEL for providing financial support for this research as a
part of the project “Control, Protection, and Demand Response in Low Voltage
Distribution Grid”. Further, I am thankful to the project partners, namely Aalborg
University, Danish distribution system operator, SEAS-NVE, and KK-electronics,
for their financial support as well as the technical inputs during entire study.
I would like to express my deepest gratitude and appreciation to my supervisors,
Associate Professor Birgitte Bak-Jensen (main supervisor) and Associate Professor
Jayakrishnan Radhakrishna Pillai for their valuable feedbacks, encouragements, and
exceptional guidance throughout the entire PhD duration. Their invaluable supports,
scientific expertise, and understanding have been very important in accomplishing
this study.
I would also like to express sincere thanks to Jens Ole Pihl-Andersen and Lars
Elmegaard from the SEAS-NVE and Paul Bach Thøgersen from kk-electronics for
their help with required data and discussions during the course of this work. I would
also like to appreciate Pukar Mahat, Professor Martin Maier, Professor Claus Leth
Bak, and Associate Professor Sanjay Chaudhary for providing valuable suggestions
and guidance at different stages of the study. In addition, I would also like to
appreciate Jake P. Gentle and Kurt S. Myers from Idaho National Laboratory for
their encouragements, help and feedbacks.
I would like to thank my friends, especially Martin Levesque, Konstantinos
Kouzelis, Iker Diaz de Cerio Mendaza, and Reza Ahmadi Kordkheili for their
encouragements and supports.
Last but not least, I would like to deeply thank my parents, wife, and rest of the
family members for their unconditional love, patience, understanding, and support
throughout the entire PhD study.


XI
ENGLISH SUMMARY
Increased environmental concern and favorable government policies in the
recent years have resulted in rapid growth of Renewable Energy Sources (RESs),
such as Solar Photovoltaics (PVs) and Wind Turbine Generators. Despite creating
several benefits, the high integration of the RESs in an electrical network imposes
potential problems. In particular, limited dispatchability of the RESs on top of
intermittent generation is creating key scientific challenges to the research
community. On the other hand, increased trends of electrifying heating,
transportation and gas sectors have resulted in new electrical loads, such as Electric
Vehicles (EVs), Heat Pumps (HPs), and Electric Water Heaters (EWH), in the
distribution network. In addition to the increase in power demand, those loads
create high, rapid and random fluctuations in the demand, thereby impacting the
power balancing scenario negatively.
Conventional solutions to address the aforementioned issues include building
excess generation or grid scale storage to compensate the power imbalances
resulting from intermittent generations and fluctuating demands. Even though those
approaches perform technically well, they are capital intensive to be implemented
with the existing technology. One of the potential alternatives is to intelligently
control the electrical loads to make them follow the intermittent generation. This
not only enables the end consumers to get reliable and cheap electricity but also
enables the utility to prevent huge investment in counterpart. Therefore, the
theoretical foundation of this research work is based on a paradigm shift in
‘generation following demand’ to ‘demand following generation’ scenario.
The primary aim of this research work is to develop intelligent control
architecture, control strategies, and an adaptive protection methodology to ensure
efficient control and operation of the future distribution networks. The major
scientific challenge is thus to develop control models and strategies to coordinate
responses from widely distributed controllable loads and local generations. Detailed
models of key Smart Grid (SG) elements particularly distribution network,
controllable loads, namely EV, HP, and EWH, and local generation, namely PV, are
developed. The outcome of the projects is demonstrated mostly by simulations and
partly by laboratory setups. The research outcome will not only serve as a reference
for ongoing research in this direction but also benefit distribution system operators
in the planning and development of the distribution network. The major
contributions of this work are described in the following four stages:
In the first stage, an intelligent Demand Response (DR) control architecture is
developed for coordinating the key SG actors, namely consumers, network
operators, aggregators, and electricity market entities. A key intent of the
architecture is to facilitate market participation of residential consumers and
prosumers. A Hierarchical Control Architecture (HCA) having primary, secondary,
and tertiary control loops is developed to establish coordinated control of widely
distributed loads and generations. Moreover, a heterogeneous communication

XII
network is integrated to the HCA for enabling control and communication within
each control loop of the HCA. In particular, each control loop of the HCA is
designed with specific control latency and time coordinated with the other loops to
establish coordination among each other. The outcome of a power and
communication co-simulation demonstrated that the proposed architecture
effectively integrate responses from widely distributed loads and generations.
Detailed models of the controllable loads, local generation, and distribution
network are done in the second stage. Transportation loads, namely EV, and heating
loads, namely HP and EWH, are modeled as controllable loads, whereas the solar
PV is modeled as local generation. Control strategies are developed to realize
various DR techniques, namely autonomous, voltage controlled, incentive based,
and price based. The performance of the developed models and control strategies
are demonstrated in a low voltage distribution network by utilizing the intelligent
architecture developed in the first stage. Even though the developed models and
control strategies are tested in a particular low voltage network, they are generic to
apply to any network. The outcome from this part of the study enables to exploit
demand flexibility from the consumers/prosumers for technically supporting the
grid as well as for enabling to trade the flexibility in electricity markets.
In the third stage, a scaled down SG testbed is developed and implemented for
practical demonstration of developed DR models and control strategies. A LV test
case network is scaled down to a 1 kVA testbed and is built in a laboratory. An
optical fiber and TCP/IP based communication is integrated on the testbed to enable
data communication and control. Moreover, a centralized and decentralized control
approach is implemented for optimized EV charging coordination in the testbed. As
practical demonstration of the SG is significantly lagging, the developed scaled
down testbed based approach provides not only a novel approach for practical
demonstration of the SG control but also a new research perspective in the SG field.
More importantly, the proposed method provides an economic and riskless
approach compared to the existing pilot project based SG developments.
In the final stage, an adaptive overcurrent protection is developed for the
future distribution system having high share of RESs and Active Network
Management (ANM) activities. In the future grid, the protection is affected not only
by bidirectional power flow due to RESs but also due to the ANM activities such as
demand response, network reconfigurations etc. Therefore, unlike the conventional
protection methodology where the protective settings are made static, an approach
to adapt relay settings based on dynamic network topologies and power infeed is
developed. In particular, the developed methodology integrates the protection and
ANM such that the protection is ensured for every change in network operation
mode and topologies. A two-stage protection strategy, whereby an offline proactive
stage combined with online adaptive stage is designed to realize the intended
protection approach. The proactive stage determines settings of the relays for every
mode of operation using offline short circuit analysis and dispatches the settings to
the respective relays. The adaptive stage in turn identifies the operating status of
distributed energy resources and operating modes (grid-connected, islanded,

XIII
network reconfiguration etc.) in real time to adapt/activate proper settings. The
performance of the developed method is demonstrated in a medium voltage
distribution network using real time digital simulator. The simulation results
demonstrated that the proposed adaptive protection approach reliably discriminate
the faults and establishes protection coordination in dynamic network topologies.
Overall, the research outcomes provide an innovative approach to exploit
demand flexibility from controllable loads and establish the integrated ANM and
protection to ensure effective control and protection of the future distribution grids.
This not only enables the end consumers to get reliable and cheap electricity but
also enables the utility to prevent huge investment in counterpart. Moreover,
distribution system operators can implement the findings of the projects in their
operational stages to avoid grid bottlenecks and in the planning stages to avoid or
delay the grid reinforcements.


XV
DANSK RESUME
Øget interesse for miljøet og favorable regeringspolitikker i de senere år har
resulteret i en hurtig stigning i vedvarende energikilder (VE) såsom solceller (PV)
og vindmøller. Foruden at skabe flere fordele, skaber den store integration af VE
også forskellige problemer for el-nettet, herunder i særdeleshed særlige
videnskabelige udfordringer for forskerne omkring begrænset styring af VE
sammen med deres fluktuerende drift. På den anden side har elektrificeringen af
biler (EV), varmepumper (HP) og el-vandvarmere (EWH) skabt nye laster i
distributionsnettet. Udover at forøge forbruget, skaber disse laster høje, hurtige og
tilfældige fluktuationer i forbruget, og påvirker derved effektbalances negativt.
De konventionelle løsninger til at adressere ovennævnte problemer inkluderer
ekstra produktionsfaciliteter eller energilagre til at kompensere for effektubalancen
fra den fluktuerende produktion og forbrug. Selvom disse løsninger fungerer
udmærket teknisk er de dyre at idriftsætte med den eksisterende teknologi. Et af de
mulige alternativer er intelligent at styre de nye elektriske belastninger så de følger
den fluktuerende el-produktion. Dette vil ikke kun få forbrugerne til at få pålidelig
og billig elektricitet men vil også sikre at forsyningsselskaberne ikke skal have store
investeringer i nye linjer. Derfor er den teoretiske fundering af dette projekt baseret
på et scenarie med et paradigme skifte fra ”produktion følger forbruget” til
”forbruget følger produktionen”.
Det primære mål med projektarbejdet er at udvikle en intelligent
styringsarkitektur, styringsstrategier og en adaptiv beskyttelsesmetode to at sikre
effektiv styring og drift af det fremtidige distributionsnet. Den tekniske
hovedudfordring er at udvikle styrings modeller og strategier til at koordinere
responsen fra distribuerede laster og lokal produktion. Der opstilles detaljerede
modeller af hovedelementerne i det smarte el-net, såsom el-nettet, de styrbare laster
(EV og HP) og lokal produktion fra solceller (PV). Resultaterne fra projektet vil
fortrinsvist blive demonstreret ved simuleringer og til dels via
laboratorieopstillinger. Forskningsresultaterne vil ikke kun kunne anvendes som
reference for den løbende forskning, men også komme distributionsselskaberne til
gode under deres planlægning og udvikling af distributionsnettet. Hovedbidragene
fra projektet beskrives i de følgende fire dele.
I første del er der udviklet en intelligent forbrugsrespons (DR) styringsarkitektur
for at koordinere det intelligent nets aktører i form af forbrugerne, net operatørerne,
net-selskaberne og andre el-markeds aktører. Hensigten med arkitekturen er at
bidrage til at private forbrugere og producenter kan deltage i el-markedet. Der er
opbygget en hierarkisk styringsarkitektur (HCA) med en primær, sekundær og
tertiær sløjfe, til at koordinere styring af distribuerede laster og produktion.
Derudover er der integreret et heterogent kommunikationsnetværk til HCAen for at
muliggøre styring og kommunikation indenfor hver styringssløjfe i HCAen. Hver
styringssløjfe i HCAen er designet med en specifik styringsventetid og

XVI
tidsresponstid koordineret med de andre sløjfer. Resultaterne fra en effekt og
kommunikations co-simulering har vist, at den opstillede arkitektur effektivt
integrere responsen fra distribuerede laster og produktioner.
I anden del af projektet er der opstillet detaljerede modeller for styrbare laster,
lokale produktionsenheder og distributionsnettet, herunder er især elbiler og
varmepumper modelleret som variable laster og solceller er modelleret som en lokal
produktionsenhed. Der er udviklet styringsstrategier til at realisere forskellige DR
teknikker nemlig: autonom, spændingsstyret, incitaments- og prisbaseret.
Virkningen af de forskellige modeller og styringer er demonstreret for et lav-
spændingsnet under anvendelse af den hierarkiske styringsstruktur opstillet i første
del. Selvom de udviklede modeller og styringsstrategier er testet på et bestemt lav-
spændingsnet er de generiske og kan anvendes også for andre net. Resultatet fra
denne del af studiet sikrer at forbrugsfleksibilitet fra forbrugeren/producenten kan
anvendes dels for teknisk at supportere el-nettet men samtidig også for handel på el-
markedet.
I tredje del af projektet er der udviklet en nedskaleret laboratoriemodel af det
intelligente el-net for praktisk demonstration of de udviklede
forbrugsresponsmodeller og styringsstrategier. Et scenarie for et lavspændingsnet er
nedskaleret til en 1 kVA laboratorieopstilling. Et optisk fiber TCP/IP baseret
kommunikationssystem er integreret med laboratorieopstillingen for at sikre data
behandling og styring. Derudover er der opbygget en central og en decentral
styringsmetode for at optimere og koordinere el-bilopladningen i systemet i forhold
til net-betingelserne. Der mangler praktisk demonstration af muligheder i det
intelligente net, som den nedskalerede laboratorieopstilling kan medvirke til at
afdække samtidig med at opbygningen af en sådan model også i sig selv er et
forskningsområde. Det er også vigtigt, at den forslåede metode med en nedskaleret
model giver en økonomisk billig og risikofri analyse i sammenligning med
eksisterende pilotprojekter.
I sidste del af projektet er der udviklet en adaptiv beskyttelse for fremtiden
distributionsnet med en stor andel af vedvarende energikilder og aktiv net
management (ANM). I fremtidens net vil beskyttelsen ikke kun være påvirket af
strømme fra begge retninger pga. vedvarende energikilder, men også af ANM
aktiviteter så som forbrugsrespons, netkoblinger m.m. Derfor i modsætning til den
konventionelle beskyttelse, hvor relæerne er indstillet med statiske værdier, er der
lavet et forslag til en adaptiv relæindstilling baseret på netstrukturen og
effektproduktionen. Den udviklede metode integrerer beskyttelsen og ANM sådan
at beskyttelsen virker ved alle ændringen i driften af nettet og ved alle topologier.
Der er opbygget en to-niveau beskyttelsesstrategi, hvor et off-line proaktivt niveau
kombineret med et on-line adaptivt niveau er designet til at realisere ideen. Det
proaktive niveau udregner indstillingerne på relæet for alle tænkelige måder nettet
kan drives med ud fra kortslutningsberegninger og sender de forskellige
indstillinger til relæerne. Det adaptive niveau identificerer den aktuelle driftsstatus
for de distribuerede energikilder (net-tilsluttet, i ødrift) samt netstrukturen i real tid
og bruger herefter de rigtige indstillinger. Performance for den udviklede metode er

XVII
demonstreret for et mellemspændingsnet scenarie under anvendelse af en ”real time
digital simulator”. Simuleringsresultaterne viser at den foreslåede adaptive
beskyttelse pålideligt er i stand at klarlægge de rigtige fejl og udføre den korrekte
beskyttelse under dynamisk netdrift.
Alt i alt giver projektet et innovativt forslag til at udnytte forbrugsfleksibilitet
fra styrbare laster og til at etablere en integreret ANM og beskyttelse for sikre en
effektiv styring og beskyttelse af fremtiden distributionsnet. Det giver ikke kun
mulighed for forbrugerne til at få pålidelig og billig elektricitet men giver også
forsyningsselskaberne mulighed for at modvirke at skulle bruge store investeringer i
udbyggelsen af nettet. Distributionsselskaberne kan implementere resultaterne af
projektet i deres drift til at modvirke flaskehalse og i planlægning til at undgå eller
udskyde netforstærkninger.


XIX
TABLE OF CONTENTS
Thesis Details v
Preface ix
English Summary xi
Dansk Resume xv
Table of Contents xix
List of Figures xxiii
List of Tables xxv
Acronyms xxvii
THESIS REPORT 1
Chapter 1. Introduction ___________________________________________________ 3
1.1. Background and Motivations 3
1.2. Problem Description 4
1.2.1. RES Integration 4
1.2.2. Electrification of Heating, Gas, and Transportation 6
1.2.3. Intelligent Power Grids 8
1.3. Project Objectives 12
1.4. Project Scope and Limitations 13
1.5. Thesis Organization 14
Chapter 2. Literature Review _____________________________________________ 17
2.1. Introduction 17
2.1.1. Organization of Demand Response Programs 18
2.1.2. Benefits of Demand Response 18
2.2. Intelligent DR Deployment Architecture 19
2.2.1. Multi-disciplinary Aspects of SG Architectures 21
2.3. Modeling of Flexible Loads and Local Generation 21
2.3.1. Electric Vehicles 21
2.3.2. Heat Pump 22
2.3.3. Solar Photovoltaic 23
2.4. Development of DR Control Strategies 24

XX
2.4.1. Impact of Active Load and Generation in LV Grids 24
2.4.2. Active Loads and Generation Control Strategies 25
2.5. Impact of ANM on Protection 28
2.6. Chapter Summary 30
Chapter 3. Intelligent Smart Grid Control Architecture _______________________ 31
3.1. Introduction 31
3.1.1. DR Deployment Framework 32
3.2. Implementation of HCA Architecture 33
3.2.1. HCA Implementation from Power Perspective 34
3.2.2. Communication Perspective of HCA 37
3.2.3. Power and Communication Co-simulation 39
3.3. Test System Modeling and Characterization 40
3.4. Observations and Discussions 42
3.4.1. Power Performance 42
3.4.2. Communication Performance 46
3.5. Chapter Summary 47
Chapter 4. Development of DR Control Strategies ____________________________ 49
4.1. Introduction 49
4.2. Constraints Violations Management 49
4.2.1. Proposed Methodology 50
4.2.2. Observations and Discussions 51
4.3. Voltage Controlled Dynamic DR 53
4.3.1. Proposed Methodology 53
4.3.2. Observations and Discussions 53
4.4. DR Control Strategies for EVs 56
4.4.1. Proposed Methodology 56
4.4.2. Observations and Discussions 56
4.5. DR Control Strategy for HP 58
4.5.1. Proposed Methodology 58
4.5.2. Observations and Discussions 59
4.6. Increasing Demand Responsiveness 61

XXI
4.6.1. Proposed Methodology 61
4.6.2. Observations and Discussions 62
4.7. Chapter Summary 63
Chapter 5. Control of Active Load and Local Generation ______________________ 65
5.1. Introduction 65
5.2. Control Strategies for Solar PV and EV 65
5.2.1. System Modeling 65
5.2.2. Proposed Methodology 66
5.2.3. Observations and Discussions 67
5.3. Integrated Adaptive Control of EWH and PV 69
5.3.1. Modeling of EWH and PV 69
5.3.2. Proposed Adaptive Control Strategies 69
5.3.3. Observations and Discussions 70
5.4. Chapter Summary 72
Chapter 6. Development of Scaled Down SG Testbed __________________________ 73
6.1. Introduction 73
6.2. Development of Smart Grid Testbed 74
6.2.1. Electric Power Distribution Network 74
6.2.2. Communication Network 76
6.2.3. Integration of Power and Communication Network 76
6.3. SGT Performance Demonstration 77
6.3.1. Centralized Control 77
6.3.2. Decentralized Control 78
6.3.3. Coordination of Decentralized and Centralized Control 79
6.4. Observations and Discussions 79
6.4.1. Power Performance 80
6.4.2. Computation Performance 82
6.4.3. Communication Performance 83
6.5. Chapter Summary 83
Chapter 7. Proactive and Adaptive Protection Design _________________________ 85
7.1. Introduction 85

XXII
7.2. Key Issues to Protect Future Distribution Grids 86
7.2.1. Impacts of DERs in Distribution Protection 86
7.2.2. Impacts of Network Operation in Protection 87
7.3. Implementation of Proposed Algorithm 88
7.3.1. State Detection of Distributed Energy Resources 88
7.3.2. Detection of Islanded/Grid-connected Modes 89
7.3.3. Detection of Changes in Network Topologies 89
7.4. Observations and Discussions 89
7.4.1. Adaptive Relay Update for Protection Blinding 91
7.4.2. Adaptive Relay Update for False Tripping 92
7.4.3. Adaptive Updates for Grid-connected/Islanded Mode 93
7.5. Chapter Summary 94
Chapter 8. Conclusion ___________________________________________________ 95
8.1. Summary and Conclusions 95
8.2. Major Contributions 97
8.3. Future Work 98
Bibliography 101

XXIII
LIST OF FIGURES
Fig. 1.1 Danish roadmap to be independent of fossil fuel by 2050............................................ 3
Fig. 1.2 Current and future generation technologies in Denmark .............................................. 4
Fig. 1.3 Estimation of wind and solar PV capacity growth in Denmark . .................................. 5
Fig. 1.4 Intermittency on wind production a) Variation of wind power generation &
consumption in 2050, b) Fast ramping down and up of wind turbines in Horns Rev . .............. 5
Fig. 1.5 Location of heating technologies & Natural gas network, in Denmark ........................ 6
Fig. 1.6 EV charging and battery swapping stations in Denmark .............................................. 8
Fig. 1.7 Anticipated transformations of power system and its potential solutions..................... 9
Fig. 1.8 Expected demand flexibility from various load types .................................................. 9
Fig. 1.9 Nordic power exchange market .................................................................................. 11
Fig. 1.10 Roles and responsibility of different actors in flexibility market . ........................... 12
Fig. 2.1 Demand side management activities .......................................................................... 17
Fig. 2.2 DR classification and potential benefits ..................................................................... 19
Fig. 2.3 Intelligent control architecture. a) Centralized-decentralized and b) HCA ................ 20
Fig. 2.4 a) Coefficient of performance vs. ambient temperature for a HP, b) PV array current
vs. solar irradiance .................................................................................................................. 23
Fig. 2.5 Various perspectives to develop DR control strategies .............................................. 26
Fig. 3.1 DR Interaction framework for SG actors. .................................................................. 32
Fig. 3.2 Hierarchical DR control architecture ......................................................................... 34
Fig. 3.3 Proposed communication infrastructure for HCA implementation. ........................... 38
Fig. 3.4 Proposed co-simulation framework ............................................................................ 39
Fig. 3.5 Single line diagram of test network. ........................................................................... 40
Fig. 3.6 Yearly variation of demand and generation. .............................................................. 41
Fig. 3.7 Daily load profile for maximum and minimum demand day. .................................... 42
Fig. 3.8 EV arrival/departure and availability over a day. ....................................................... 42
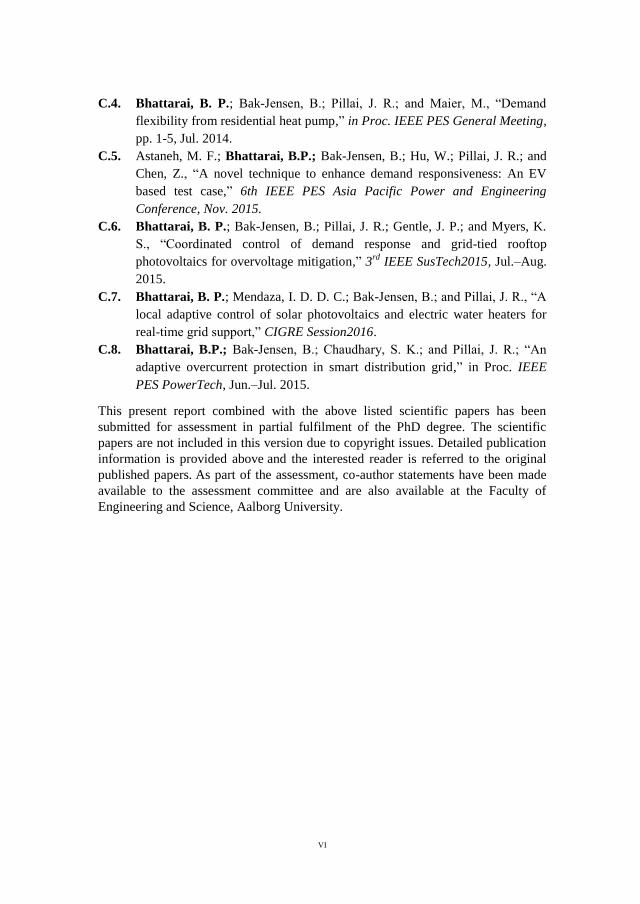
Fig. 3.9 Optimal configuration of electricity price and feeder load demand. .......................... 43
Fig. 3.10 EV charging profiles with and without periodic charging control. ........................... 43
Fig. 3.11 SDRC performance with load and regulation events................................................ 44
Fig. 3.12 SDRC performance in a) 100kW down & b) 75 kW up, regulations. (PI/PF: EV
power before/after SDRC). ...................................................................................................... 44
Fig. 3.13 EV charging profiles demonstrating PDRC performance. ....................................... 45
Fig. 3.14 Amplified plot to illustrate PDRC. ........................................................................... 45
Fig. 4.1 Sample results. a) Minimum voltage at the feeder, b) Maximum overcurrent recorded
at the feeder, c) Transformer load, and d) Available versus activated flexibility .................... 51

XXIV
Fig. 4.2 Simulation results with (green) and without (blue) control a) Flexibility of consumer
14, b) Voltage at N14, c) Flexibility of consumer 26, and d) Voltage at N26. ........................ 52
Fig. 4.3 Demand regulation potential. a) Case I and b) Case II. .............................................. 55
Fig. 4.4 Total demand regulation potential for various cases. ................................................. 55
Fig. 4.5 EV scheduling in scenario-I a) EV charging profiles and b) Electricity prices. ......... 57
Fig. 4.6 EV schedules in scenario II a) EV charging profiles and b) Electricity prices. ......... 57
Fig. 4.7 Terminal voltage at farthest node (N13) for various cases. ........................................ 58
Fig. 4.8 Adaptive update of charging profile based on monitored voltage. ............................. 58
Fig. 4.9 a) HP scheduling with load and price variation, b) Normal and deviated price. ........ 60
Fig. 4.10 a) Impact of voltage on HP schedules and b) Variation of terminal voltage (N13) ... 60
Fig. 4.11 Adaptive control of a single HP connected at Node 13. ........................................... 61
Fig. 4.12 Price modification mechanism. a) Optimal price and b) Corresponding load shift .. 62
Fig. 4.13 Profiles of a) EV demand and b) Sum of EV and base load demand. ...................... 63
Fig. 5.1 Coordination between centralized and decentralized control. .................................... 67
Fig. 5.2 PV power injection and EV charging power. ............................................................. 68
Fig. 5.3 Decentralized control results. ..................................................................................... 69
Fig. 5.4 Simulation results of EWH control. a) SOE, b) Active/reactive power consumption,
c) POC Voltage, and d) Thermal demand, for a consumer. (WC: without & C: With control)
................................................................................................................................................ 71
Fig. 5.5 PV results with/without control a) Active and reactive power b) POC Voltage. ........ 72
Fig. 6.1 Schematic diagram of 13-node scaled down network. ............................................... 74
Fig. 6.2 Laboratory implementation of the testbed. ................................................................. 75
Fig. 6.3 Communication infrastructure implemented in the testbed. ....................................... 76
Fig. 6.4 Optimized EV charging power profile (price based optimization). ............................ 80
Fig. 6.5 EV charging optimization considering network constraints. ...................................... 81
Fig. 6.6 Voltage profile of node 13 with local voltage control. ............................................... 81
Fig. 6.7 Computation time for optimization process. .............................................................. 82
Fig. 6.8 Communication performance. a) Synchronization performance using time-based and
coordinated sensors, and b) Captured traffic of the DMS port to/from optical load terminal .. 83
Fig. 7.1 Protection blinding and false tripping due to DER penetration. ................................. 86
Fig. 7.2 a) Relay settings and b) Time-overcurrent characteristics. ......................................... 90
Fig. 7.3 Maximum fault current seen by relays for different cases. ......................................... 91
Fig. 7.4 a) Protection blinding of relay R34 and b) Solution by proposed adaptive method..... 92
Fig. 7.5 a) False tripping of relay R26 and b) Solution by proposed adaptive method. ............ 92
Fig. 7.6 a) Relay settings for islanded operation and b) Time-current curve of relays. ........... 93

XXV
LIST OF TABLES
Table 1.1 Correlation between the thesis chapters and publications. ___________________ 16
Table 2.1 Key features of different battery technology. _____________________________ 22
Table 3.1 A Novel control requirement based DR categorization. _____________________ 33
Table 3.2 Communication requirements for HCA. _________________________________ 37
Table 3.3 Test network characteristics. _________________________________________ 41
Table 3.4 Line parameters of test network. ______________________________________ 41
Table 3.5 Communication configuration. ________________________________________ 46
Table 3.6 Communication performance in terms of stage delay. ______________________ 47
Table 4.1 Configuration of demand dispatch signals._______________________________ 54
Table 6.1 Network parameters before and after scaling down.________________________ 74


XXVII
ACRONYMS
ADR Autonomous Demand Response
ANM Active Network Management
CA Central Aggregator
CVR Conservative Voltage Reduction
DDDR Demand Dispatch based Demand Response
DER Distributed Energy Resource
DLCDR Direct Load Control based Demand Response
DMS Distribution Management System
DR Demand Response
DRR Demand Response Resource
DSM Demand Side Management
DSO Distribution System Operator
EPON Ethernet Passive Optical Network
EV Electric Vehicle
EWH Electric Water Heater
HAN Home Area Network
HCA Hierarchical Control Architecture
HP Heat Pump
ICT Information and Communication Technology
IFC Informative Control
ISC Instructive Control
IZR Intra-Zone Relay
LAC Local Adaptive Control
LV Low Voltage
NAN Neighborhood Area Network
MV Medium Voltage
PDR Price Based Demand Response
PDRC Primary DR Control
PF Power Factor

XXVIII
POC Point of Connection
PV Photovoltaic
RES Renewable Energy Source
RPM Regulating Power Market
RTDS Real Time Digital Simulator
SDRC Secondary DR Control
SG Smart Grid
SGT Smart Grid Testbed
SOC Stage of Charge
SOE Stage of Energy
SS Substation
TDRC Tertiary DR Control
TMS Time Multiplier Setting
VCDR Voltage Controlled Demand Response
ZSR Zone Separating Relay

1
THESIS REPORT

2

CHAPTER 1. INTRODUCTION
3
Chapter 1. Introduction
This chapter outlines a short summary of project concepts, objectives, and
limitations. The motivation behind this research and its future prospects are also
outlined. Moreover, the project relevance seen from both the Danish and
international perspectives are also emphasized.
1.1. Background and Motivations Increased environmental and energy security concerns in the recent years are
compelling many countries to seek alternatives to fossil fuels based electricity
generation. Accordingly, several countries have set their national targets for
electricity production from RESs. Recently, EU has set the following climate and
energy targets for 2030 as a roadmap for its member states [1].
Reducing EU’s greenhouse gas emissions by at least 40% below 1990 level,
Increasing the share of RES to at least 27% of the EU’s energy consumption,
Increasing energy efficiency by at least 27%.
In addition to these EU targets, its member countries have their own RESs
targets. The targets varies widely, for instance from 10% for Malta to 49% for
Sweden [2]. The increase in RESs production by 83.13% from 2002 to 2012 in EU-
28 clearly demonstrates EU’s future direction [3]. Therefore, the new targets are
expected to create a huge transformation from the existing fossil fuel based
generation to future RESs based generation [4]. Being one of the pioneering
countries of wind power technologies, Denmark stands at the front end on RESs
development. In particular, the Danish Ministry of Climate, Energy, and Building
has set very ambitious targets, illustrated in Fig. 1.1, to make the country
independent of fossil fuel by 2050 [5].
Fig. 1.1 Danish roadmap to be independent of fossil fuel by 2050 [5].
Two major transformations in the Danish electricity sectors are expected while
moving forward to these 2050 targets. First, the conventional fossil-fuel based
generations will be continuously substituted with RES generation [6]. Second,
existing fossil fuel based heating, gas, and transportation sector will be electrified
[7]. On the one hand, the increased RES integration creates intermittency in
generation. On the other hand, the electrification of the heating, gas, and
- 50% of electricity consumption from wind
- 35% greenhouse gas emission reduction
Phase out coal and oil burners
Cover electricity and heat by RES
Cover all energy: heat, electricity, gas, transport, and industry by RES
2020
2030
2035
2050
Years

4
transportation sectors results in several new electrical loads, such as EVs, HPs etc.,
which creates huge and random fluctuations on the demand. Consequently, the
fluctuations on demand add up to the intermittent generation to worsen the power
balancing scenario. The existing generation following demand scenario, whereby the
generation is adjusted to cope with the load variations, will not work due to limited
dispatch capability of the RESs. In this regards, one of the great motivations for this
study is to exploit the demand flexibility from the new electrical loads to move
towards demand following generation, whereby the demand is regulated to
compensate the intermittent generations from the RESs.
1.2. Problem Description The previous section briefly reveals the energy policies and roadmaps set by EU
and Danish government. In this section, technical initiatives taken by Danish
government and concerned authorities to meet the aforementioned targets and their
anticipated challenges on the electrical grids are detailed. Specifically, the initiatives
taken on RES development and electrification of the heating, gas, and transportation
are investigated to identify their key technical impacts on future distribution system.
1.2.1. RES Integration
Over the last few decades, Danish power system has undergone significant
transformation in relation to electricity generation technologies. In particular,
conventional centralized power plants are continuously displaced by increased
penetration of DER technologies, namely by combined heat and power plants and
wind turbine generators [8]. As illustrated in Fig. 1.2 several conventional power
plants have already substituted by thousands of combined heat and power plants and
onshore/offshore wind turbines. This trend is expected to continue further in the
upcoming years, thereby substituting more conventional plants as in Fig. 1.2 [8].
Fig. 1.2 Current and future generation technologies in Denmark [8], [9].
Undoubtedly, the wind power constitutes a major share in Danish electricity
production, thereby playing a key role on the substitution of the conventional power

CHAPTER 1. INTRODUCTION
5
plants [10]. In fact, the wind turbine generators provided 39.1% of the total
electricity consumption of the country in 2014 from the installed capacity of 4845
MW. It was a world record in relation to the highest percentage consumption from
wind [11]. It can be seen from the wind power predictions made by the Danish
transmission system operator, Energinet.dk, as shown in Fig. 1.3a) that an
accelerated growth of wind power production is expected in the years to come.
Consistent with the wind, the growth of the solar PV is also very promising. Indeed,
the PV generation is projected to grow steadily as shown in Fig. 1.3b) [12].
Fig. 1.3 Estimation of wind and solar PV capacity growth in Denmark [12].
Despite having several technical and environmental benefits of those RESs, their
increased share creates a number of control and operational complexities in the
existing power system. In particular, greater dependency of the power generation
from the wind and PV on weather condition creates a potential problem on the
system balancing. Fig. 1.4a) illustrates an electricity generation and consumption
scenario by 2050 in Denmark. It is seen that power generation from wind farms
exceeds the consumption. More importantly, the predicted fluctuations in the wind
power range from few MWs to thousands of MWs which inherently results in
potential issues to maintain system balance.
Fig. 1.4 Intermittency on wind production a) Variation of wind power generation &
consumption in 2050 [7], b) Fast ramping down and up of wind turbines in Horns Rev [13].
The condition is even worse when those variations occur very rapidly as shown
in Fig. 1.4b) where 80 Vestas V80 wind turbines, each having 2MW in Horns Rev
2015 2020 2025 2030 20354000
6000
8000
Year
Po
wer
(MW
)
2015 2020 2025 2030 20350
1000
2000
YearP
ow
er
(MW
)a) Wind power b) Solar PV
0
2
4
6
8
12
10
14 Wind power production
Electricity consumption
Year (2050)
a) b)
Po
wer
(G
W)
-500
0
500
1000
1500
2000
02:30 02:35 02:40 02:45 02:50 02:55 03:00-50
0
50
100
150
200T
ota
l P
ow
er (
MW
)
Tu
rbin
e P
ow
er (
MW
)

6
offshore wind farm in Denmark, has shut down due to wind storm. As a result, a
ramping down of about 140 MW is seen in less than 4 minutes [13]. In the case of
high wind penetration, ramping amount could be significant high and can severely
threaten the power balance scenario. Consequently, reliable spinning reserves are
desired to alleviate such rapid ramping up/down in the generation.
In addition, the power system is progressively losing rotational inertia due to
continuous displacement of the conventional large power plants [5]. Consequently,
system stability and security get threatened as conventional power plants are
responsible for the stability [14]. Moreover, the loss of conventional power plants
from the system results in significant decrement on the short circuit current [15]. As
a result, the existing protection system which is designed based on the short circuit
current level needs renovation. Furthermore, the addition of distributed energy
resources (DERs) in the distribution system disturbs direction and distribution of the
fault current. Consequently, the conventional protection design faces several issues
to discriminate faults.
1.2.2. Electrification of Heating, Gas, and Transportation
Total energy consumption in the heating, gas, and transport sectors constitute a
major portion of the national energy consumption in Denmark [12]. Therefore, to
move towards fossil fuel independent state, electrification of the sectors consuming
huge amount of the fossil fuels is inevitable. Key initiatives taken by the Danish
government on those sectors and their implication in the future electrical system is
outlined in this section.
Fig. 1.5 Location of heating technologies [16] & Natural gas network [18], in Denmark.
1.2.2.1 Electrification of heating
Currently, heating demand, comprising space heating and hot water, in Denmark
is fulfilled by a combination of district heating and individual heating. Typically, the
district heating covers the majority of the urban population; amounting 60% of the
Danish households [16]. In fact, 670 centralized and decentralized combined heat
and power plants are distributed throughout the country as in Fig. 1.5a) to fulfill
urban heating demand.
a) Heating system b) Natural Gas system

CHAPTER 1. INTRODUCTION
7
As the district heating may not be cost-effective in the rural areas where the
consumers are widely spread, most of the rural populations in Denmark are still
using oil-fired boilers for the heating purpose [17]. However, the Danish
government has banned to use oil-burner and natural gas furnaces in new homes
from January 2013 and in existing buildings from beginning of 2016 [5]. Similarly,
as can be seen from Fig. 1.5a), the majorities of the combined heat and power plants
are based on coal, oil, and natural gas and should be shifted towards renewables.
Such anticipated transformation in the heating will greatly impact the existing
electrical system as it results in new electrical loads such as HPs and EWHs
particularly in distribution systems. As a result, many of the electrical distribution
systems need upgrades or reinforcement to accommodate anticipated load growth.
1.2.2.2 Electrification of Gas
The gas system comprising natural gas and biogas constitutes a significant
energy share in Danish energy consumption [12]. In particular, the gas system is
serving a majority of the country through several transmission and distribution links
as shown in Fig. 1.5b). However, Energinet.dk estimates that the gas supplies from
the North Sea, the main source of the natural gas in Denmark, will decline during
2019 – 2042 and most likely be exhausted by 2045–2050 [19]. Therefore, immediate
technological alternatives are desired not only to move towards 100% fossil-fuel
free but also to seek alternatives to natural gas. On one hand, initiatives are taken to
decrease the consumption of natural gas by electrifying natural gas based combined
heat and power plants, cooking, and heating. As a result, new types of electrical
loads such as the HPs (individual or central), electric ovens, electric boilers, are
increasing. On the other hand, initiatives are taken to reduce the natural gas
dependency by substituting it with renewable fuels such as hydrogen, biogas etc. In
particular, biogas is a growing technology and is expanding very rapidly in
Denmark. According to the estimates, the biogas production will increase with more
than 300% (6.6 PJ in 2013 to 20 PJ in 2022) within the coming decade [20].
Recently, generating hydrogen using renewable energy and injecting it to the current
natural gas system is emerging as an alternative solution [21]. With the advancement
of this hydrogen fuel based technology, new electrical loads such as electrolyzer is
expected to increase in the system. As such, the electrification of the gas system also
results in new loads which were not foreseen when electrical networks were built.
1.2.2.3 Electrification of Transportation
Being one of the largest energy consuming sectors in the Danish energy mix,
electrification of the existing fossil-fuel based transportation possesses significant
challenges. According to the 2010 statistics, the fleets in the road transport constitute
around 2.16 million private vehicles, 14496 busses, and coaches, and 148766
motorcycles [22]. The Danish government has taken various initiatives such as tax
exemptions and development of infrastructures to boost the number of electric cars
[5]. In particular, stations for battery charging and battery swapping are built to
overcome the driving distance limits possessed by a vehicle battery. Distribution of
EV charging and battery swapping stations throughout Denmark is illustrated in Fig.

8
1.6 [23]. The effects of those initiatives have started to be seen with the increased
penetration of electric cars in the road. According to the prediction made by the
Energinet.dk, the number of EVs is expected to grow from 1.390 in 2013 to 400.000
in 2035 [12]. This anticipated EV growth impacts the existing electric grids by
introducing new loads having sizable ratings.
Fig. 1.6 EV charging and battery swapping stations in Denmark [23].
Therefore, one of the common issues with the electrification of the heating, gas,
and transport sector is that they result in new electrical loads in the existing
system, perhaps the loads having significant rating compared to the normal
household loads. Those loads not only congest the network but also increase random
and rapid fluctuations on the demand. As the existing networks were not designed to
accommodate those loads, several distribution networks might need reinforcement.
1.2.3. Intelligent Power Grids
The anticipated transformation of the electrical system due to the increased
integration of RESs and the electrification of the heating, gas, and transport sectors,
as shown in Fig. 1.7, demands an intelligent grid so called SG. Considering existing
and anticipated changes in the power system, Energinet.dk has set the following
strategies to address the future power system issues [24].
Building large energy storages exploiting new technologies,
Expansion and upgrade of existing network and cross-border interconnections,
Development of advanced techniques for accurate wind power forecast, and
Exploit flexibility from the electrical loads using various DR techniques.
Studies regarding grid support capabilities from battery storage have shown that
large scale power storage can be a technically viable option to compensate the
intermittency on generation [25]. However, the exploitations of large storages for
system level balancing are economically less attractive with the existing

CHAPTER 1. INTRODUCTION
9
technologies and market structure. Building new infrastructure to upgrade or
expand the existing grids and international connections can help maintain the
system balance with import/export of the electricity with the neighboring countries.
However, it should also be noted that the interconnection increases the country’s
energy dependency.
Fig. 1.7 Anticipated transformations of power system and its potential solutions [24].
More importantly, this concept might face technical challenges when the energy
mix in the neighboring countries is similar to that of Denmark. Similarly, the
development of advanced wind power forecast techniques helps to make better
operational plans and to better utilize and trade the wind power in the electricity
markets. However, it serves as a planning tool, rather than regulating the power.
Therefore, one of the potentially attractive approaches is to activate DR for
exploiting the demand flexibility from various electrical loads.
Fig. 1.8 Expected demand flexibility from various load types [8].
1.2.3.1 Technical Challenges to Deploy DR
According to the Nordic power market, DR is a voluntary and temporary
adjustment of the electricity consumption in response to an electricity price or
reliability requirements [26]. The DR can not only support the electrical network in
several ways but also decrease the country’s energy dependencies to the other
System level
unbalance
Local
congestion &
large demand
fluctuations
TRANSFORMATION
PROBLEM
ALTERNATIVE
Conventional Generation
Fossil fuel based, heating, gas & transportation
New elecrical loads: EVs, HPs,
EHWs, EOs
RES Generation
Large scale
storages
Expansion of
cross-boarder
connections
Improvement
of wind power
forecast
Activation of
Demand
Response
Electric boilers
Central heatpumps
Individual heatpumps
Electric vehicles
2012 2015 2018 2021 2024 2027 2030
200
400
600
800
1000
0
Pow
er (
MW
)
Year

10
country. Currently, common consumer loads such as freezers, refrigerators, washing
machines, tumble dryer etc. are considered as key resource for providing demand
flexibility. However, new electrical loads such as HPs, EWHs, EVs etc. resulting
from the electrification of heating, gas and transport sectors are foreseen as potential
resource to provide great amount demand flexibility in the future [12]. According to
the estimates, the demand flexibility from major flexible loads is expected to
increase as per the projection presented in Fig. 1.8. It can be observed that the
demand flexibility from HPs (both centralized and individual) and EVs is expected
to increase exponentially in the upcoming years.
However, the introduction of such anticipated loads inherits both challenges and
opportunities. Due to the sizable ratings of those loads, most of the existing
distribution networks get congested as they were not designed with those scenarios
accounted. As a result, many DSOs are forced to invent on the grid reinforcement.
Nevertheless, due to sizable rating and storage capability, those loads provide great
demand flexibility. The flexibility can not only be used to manage the grid
congestion but also be applied for system level balancing. A key idea is to exploit
the demand flexibility to compensate the intermittent generation from the RESs and
to delay or defer grid reinforcement. Nonetheless, there are several technical
challenges, listed below, that need to be addressed prior to the DR deployment.
Assessment of the demand flexibility potential of different load types,
Quantification of the impacts of active loads in existing distribution grids,
Development of intelligent architectures for control and coordination of widely
distributed loads,
Control strategies development to maximize technical benefits of the DR, and
Development of control strategies to deploy DR for network applications.
1.2.3.2 Financial Challenges to Deploy DR
In addition to the aforementioned technical challenges, financial aspects also
impose potential barriers to the DR deployment. As consumers normally want
financial benefits in return to their participation in DR programs, development of
proper market frameworks to aggregate and trade the flexibility is very essential. As
illustrated in Fig. 1.9, there are primarily three market platforms available for
trading in NordPool electricity market, where Denmark trades and exchanges most
of its energy. Spot and balancing market are owned and managed by NordPool,
while RPM is owned by the TSOs of different countries. The RPM is owned and
managed by Energinet.dk particularly for Danish case.
The spot market is a day ahead hourly market which trades almost 80% of the
energy consumption in the Nordic countries [27]. Every interested seller and buyer
of electrical energy submits its demand/supply bid to the Elspot from 8:00 until
12:00. Based on the demand and supply bids, the hourly electricity prices for the
following day are computed between 12:00 through 13:00 and all the traders are
invoiced between 13:00 to 15:00 [28].

CHAPTER 1. INTRODUCTION
11
Fig. 1.9 Nordic power exchange market [27].
As the trading in Elspot takes place from 24 to 36 hours ahead of the actual
delivery of the bids, deviations in the supply and/or demand of the electricity from
the Elspot trading may be observed while moving closer to the power delivery. As a
result, the balancing market so called Elbas is designed to compensate power
imbalances during near actual operation. Basically, this is an hour ahead market,
whereby different parties make their offers for buying and selling the balancing
power until one hour before delivery [29]. The Elbas prices are set based on a first-
come, first-served principle where the lowest selling price and the highest buying
price come first, regardless of when an order is placed [29].
Even though Elbas ensures an hour ahead balance in the system, power
imbalance may occur even after Elbas closes. Therefore, RPM is designed to
maintain power balance in the system during actual operation (real-time). In
particular, the RPM accept bids for up-regulation and down-regulation separately
until 45 minutes before the operating hour [30]. The bids are then sorted with
increasing prices for up-regulation and with decreasing price for down-regulation.
The transmission system operator activates the cheapest regulating bid as per up-
/down-regulation requirement. The accepted parties get paid for both the energy
(based on the activation) and the capacity (for being available for regulation) [30].
In order to maximize the DR potential and financial incentives to the
participating consumers, there must exists a proper framework to trade the demand
flexibility on every market. As the payment from RPM and Elbas is normally higher
compared to the Elspot, deployment of DR types and DR control strategies to ensure
their participation on those markets could be an effective approach to provide
additional incentives to the consumer to participate in DR programs.
1.2.3.3 Danish Roadmap for Flexibility Market
Even though the aforementioned market framework provides a transparent
platform for electricity trading, it is not favorable especially for residential
consumers to trade the flexibility. Indeed, market regulation such as minimum limit
on the amount to be traded is becoming a key barrier to trade flexibility directly

12
from the customers. As such, Energinet.dk and Danish energy association jointly
developed a roadmap to trade flexibility from the residential consumers [31]. The
roadmap has defined distribution of roles of major actors, namely private players,
commercial players, and system operators, as depicted in Fig. 1.10.
Fig. 1.10 Roles and responsibility of different actors in flexibility market [31].
The private players are basically the customers who are having flexible loads and
are capable of offering flexibility. The commercial actors handle the flexibility offer
from the private players and provide the flexibility to the system operators such as
grid companies and transmission system operator. In the proposed roadmap, the grid
companies will no longer be in direct contact with the consumers. A third party,
such as an aggregator or retailer, takes an intermediate role to act on their behalf to
provide aggregated flexibility to the grid companies. Nevertheless, proper
algorithms need to be designed not only to deploy demand flexibility from
individual customers but also to aggregate the flexibilities for system support in
accordance with the proposed roadmap of the flexibility market.
1.3. Project Objectives As mentioned in the previous section, exploitation of the demand flexibility
provides a great opportunity not only to manage congestion in the local network but
also to establish system level power balancing. However, there are several
challenges related to quantification of the demand flexibility potential, development
of proper DR control architecture and strategies, which needs to be addressed to
exploit the flexibility. The overall objective of this research is to solve the
aforementioned issues by intelligent control and operation of the flexible loads in a
distribution system. More specifically, the objectives of this research are as follows:
Develop suitable control architectures for exploiting demand flexibility from
residential consumers in LV distribution networks,
Develop proper models of potential flexible loads and suitable control
strategies for activating DR considering a dynamic electricity market,
Coordinated control of active loads and local generation to provide economic
and efficient operation of the LV grid,

CHAPTER 1. INTRODUCTION
13
Develop a smart grid testbed considering multi-disciplinary aspects of the
smart grid for practical demonstration of the developed DR models and control
strategies, and
Develop an adaptive and proactive protection scheme to ensure protection
coordination in a MV distribution grid during varied network topologies.
1.4. Project Scope and Limitations
The scope and limitations of this research are as follows:
The consumer demand is modeled as a three-phase balanced load and the studies
are performed assuming three-phase balanced system. One of the main reasons
for this assumption is the lack of phase-wise data of the test network.
Nonetheless, this assumption also helps to make the network analysis simpler.
Unlike in distribution systems where the consumers are supplied with single-
phase connection and are widely sparse, the extent of unbalancing is very low in
the Danish network as the consumers are supplied with a three-phase connection
and settled closely. Therefore, the considered assumption does not alter the
findings of the research.
The consumer demand is modeled using the hourly electricity consumption,
where the hourly demand in a specific hour is assumed to be same as the total
energy consumption on that hour. Therefore, the consumers load profile is same
as the hourly energy consumption profile. Any demand peaks within a specific
hour are neglected. However, while analyzing from the grid perspective those
individual peaks are compensated due to consumer’s diversity.
This study is based on a deterministic load model, where the consumer
load/profile is modeled with the deterministic demand/profile. The stochastic
behavior of the consumers is not considered in this study. However, the
developed methods and control strategies are made adaptive such that any load
models can be used simply by changing the existing deterministic load input by
any desired load models.
The application of active demand control is demonstrated in relation to its
capability for supporting the network for voltage control and congestion
management. However, the DR application for supporting the frequency is not
demonstrated. A major reason behind this consideration is that the frequency is a
system level parameter and does not change significantly with small changes on
the demand. Nonetheless, the proposed architecture and control strategies can be
applied for frequency support with no or minimal modification.
The intelligent SG architecture is developed to establish coordination and control
of the small scale consumers for utilizing their demand flexibility.
Communication infrastructure is integrated and power and communication co-
simulation is performed to realize the control and exchange data in the proposed

14
architecture. However, the communication performance is demonstrated in terms
of the latency and bandwidth only. Other parameters like throughput, jitter, and
error rates are not explicitly considered.
1.5. Thesis Organization The thesis is written as a collection of papers and is structured in two parts. The
first part contains description on research contribution of this study as a brief report
and the second part contains the scientific publications in relation to this research. In
particular, the first part of the thesis is structured as eight chapters as follows:
Chapter 1 introduces the ongoing transformation on electric grid due to
increased penetration of the RESs and electrification of gas, heating, and
transport sectors. The opportunities and challenges of this transformation to the
future electric grid have been presented. Further, the research scope, objectives,
and limitations are defined and its relevance seen from the Danish and
international perspective is described.
Chapter 2 is the state of the art which summarizes major scientific contribution
made in SG research area. In particular, this chapter focuses on the ongoing
developments on smart grid architecture, multi-disciplinary aspects of the SG,
modeling of active loads and local generations, and adaptive protection in the
future distribution system. Finally, the chapter outlines the scientific contribution
of this study on top of the current state of the art.
Chapter 3 introduces the intelligent control architecture for the future
distribution grids. In particular, a HCA is developed to establish control and
coordination of various DR techniques and exploitation of the demand flexibility
for grid applications. A multi-disciplinary aspect of the SG is demonstrated in a
power and communication co-simulation environment.
Chapter 4 summarizes control strategies developed during the course of this
study to exploit demand flexibility from residential consumer. First, control
strategy is developed to manage constraints violations in SG using two-stage
control. Next, a voltage controlled dynamic DR is developed to realize demand
flexibility at substation level without impacting consumer. Control strategy to
exploit demand flexibility from active loads, namely EVs and HPs, are then
developed. Finally, a strategy to increase consumer’s demand responsiveness is
implemented. In this chapter, both the technical and economic aspects of the DR
deployment have been addressed.
Chapter 5 presents integrated control of active loads and local generation so as
to increase both load and generation hosting capacity of the LV grid. First,
coordinative control of EVs and PVs is developed to alleviate both under-voltage
and overvoltage issues in the network. As EVs are mobile loads which are
unavailable at home during the day when PV has maximum production, an
adaptive control of EWH and PV is developed to alleviate overvoltage issues.

CHAPTER 1. INTRODUCTION
15
Chapter 6 summarizes a scaled-down SG testbed developed for practical
demonstration of the DR control strategies and intelligent control architecture
developed in this study. A detailed description on testbed implementation,
integration of power and communication infrastructure, and implementation of
local and central control scheme are included. The testbed performance is
demonstrated from both power and communication perspectives.
Chapter 7 summarizes the adaptive protection designed to ensure protection
coordination in the varied network condition. In particular, an integrated local
and central communication assisted protection strategy is developed for
dynamically setting the protective devices based on ON/OFF status of the DGs
and changes in network topologies. Impact of ANM on the protection of the
medium voltage network is also described briefly.
Chapter 8 is the concluding chapter which summarizes the project and
underlines the major outcomes and scientific contribution of this research. In
addition, the chapter outlines the future prospect of this research and presents the
potential extension.
The second part of this thesis contains manuscripts prepared along the course of
this study. In particular, the research contribution is documented with the following
peer-reviewed conference proceedings and journal publications. The relationship
between the manuscripts and thesis chapters is illustrated in the Table 1.1.
Journal Contributions
J.1. Bhattarai, B. P.; Levesque, M.; Bak-Jensen, B.; Pillai, J. R.; Maier, M.; and
David Dipper, “Design and co-simulation of a hierarchical control architecture
for demand response coordination,” IEEE Transaction on Power Delivery (To
be submitted).
J.2. Kouzelis, K.; Bhattarai, B. P.; Mendaza, I. D. D. C.; Bak-Jensen, B.; and
Pillai, J. R., “Smart grid constraint violation management for balancing and
regulating purposes,” IEEE Transaction on Power System (Under Review).
J.3. Bhattarai, B. P.; Levesque, M.; Maier, M.; Bak-Jensen, B.; and Pillai, J. R.,
“Optimizing electric vehicle coordination over a heterogeneous mesh network
in a scaled-down smart grid testbed,” IEEE Transaction on Smart Grid, vol. 6,
no. 2, pp. 784-794, Jan. 2015.
Conferences Contributions
C.1. Bhattarai, B. P.; Bak-Jensen, B.; Mahat, P.; Pillai, J.R.; and Maier, M.,
“Hierarchical control architecture for demand response in smart grid scenario,”
in Proc. IEEE PES Asia Pacific Power and Energy Engineering Conference
(APPEEC), pp. 1-6, Dec. 2013.
C.2. Bhattarai, B. P.; Bak-Jensen, B.; Mahat, P.; Pillai, J. R., “Voltage controlled
dynamic demand response,” in Proc. 4th
IEEE Innovative Smart Grid
Technologies (ISGT) Europe, pp. 1-5, Oct. 2013.

16
C.3. Bhattarai, B. P.; Bak-Jensen, B.; Mahat, P.; and Pillai, J. R., “Two-stage
electric vehicle charging coordination in low voltage distribution grids,” in
Proc. IEEE PES APPEEC, pp 1-5, Dec. 2014.
C.4. Bhattarai, B. P.; Bak-Jensen, B.; Pillai, J. R.; and Maier, M., “Demand
flexibility from residential heat pump,” in Proc. IEEE PES General Meeting,
pp. 1-5, Jul. 2014.
C.5. Astaneh, M. F.; Bhattarai, B. P.; Bak-Jensen, B.; Hu, W.; Pillai, J. R.; and
Chen, Z, “A novel technique to enhance demand responsiveness: An EV based
test case,” IEEE PES APPEEC 2015. (Under review)
C.6. Bhattarai, B. P.; Bak-Jensen, B.; Pillai, J. R.; Gentle, J. P.; and Myers, K. S.,
“Coordinated control of demand response and grid-tied rooftop PVs for
overvoltage mitigation,” in Proc. IEEE SusTech2015, pp. 1-7, Jul.–Aug. 2015.
C.7. Bhattarai, B. P.; Mendaza, I. D. D. C.; Bak-Jensen, B.; and Pillai, J. R., “A
local adaptive control of solar photovoltaics and electric water heaters for real-
time grid support,” To be submitted to CIGRE Session2016 (synopsis
accepted).
C.8. Bhattarai, B.P.; Bak-Jensen, B.; Chaudhary, S. K.; and Pillai, J. R.; “An
adaptive overcurrent protection in smart distribution grid,” in Proc. IEEE PES
PowerTech, pp. 1-6, Jun.–Jul. 2015.
Table 1.1 Correlation between the thesis chapters and publications.
Chapters 1 2 3 4 5 6 7 8
Related Publication - - C1, J1J2, C2, C3,
C4, C5C6, C7 J3 C8 -

17
Chapter 2. Literature Review
This chapter summarizes current knowledge about intelligent control and operation
of future distribution networks. Specifically, the state of the art in relation to:
intelligent control architecture of SG, modeling of controllable loads, control
strategies to deploy flexible demand, and protection of distribution systems, are
presented to illustrate research gaps from which the key contributions of this study
are developed. Additionally, recent progresses in multi-disciplinary aspects of the
SG to exploit DR are presented.
2.1. Introduction Conventionally, DSM has been practiced by electric utilities to efficiently utilize
their electricity consumption [32], [33]. Several programs, such as energy
efficiency, energy conservation, strategic load growth, peak shaving/shifting etc.,
were designed as a part of the DSM to influence the electricity consumption in the
long run [33], [34]. Nevertheless, the conventional DSM approaches as illustrated
in Fig. 2.1a) were not designed for short-term load regulation, for instance, to
compensate intermittent generation [35]. DR is a concept which is designed for
intentional modifications in consumption patterns of the consumers for altering the
timing, level of instantaneous demand, or total electricity consumption [36]-[38].
As illustrated in Fig. 2.1b), a key idea of the DR is to make temporary load
adjustment, such as turning off, adjusting, or deferring power consumptions of
electrical loads for various applications, such as to smooth-out intermittent
generations, decongest network, support frequency and voltage regulations, and so
forth. The DR is essentially a subset of the DSM [39].
Fig. 2.1 Demand side management activities [33], [34].
There are two potential issues to deploy DR in the existing system. First, a
majority of today’s electrical loads at the customer level are passive. Second, the
Peak Shaving Energy Conservation
Load shifting Valley filling
4 8 12 16 20 24
a) Conventional DSM activities b) Demand response
Po
wer
Pri
ce
without DR
with DR

18
demand of consumer rarely stay constant, rather it varies rapidly and randomly over
time [40]. Therefore, controlling the consumer’s loads to make them follow the
intermittent generation is challenged themselves by their intermittent consumption.
Nevertheless, proper mobilization of currently unused flexible electricity
consumption is foreseen as a potentially cheaper resource for balancing the
intermittent generations as well as supporting the local grids [38].
2.1.1. Organization of Demand Response Programs
Several DR programs have been designed based on consumer preference, load
types, and intended applications, to exploit demand flexibility. At first, existing DR
programs are broadly classified into incentive based DR and price based DR, as
illustrated in Fig. 2.2a) [38]. The DR techniques which act in response to change in
electricity price are basically the PDR. Demand price elasticity of the consumers is
exploited in PDRs for shifting electrical loads from peak or any critical periods to
off-peak periods. Depending on utility strategy and available infrastructure,
different types of PDR as illustrated in Fig. 2.2a) can be implemented.
Nevertheless, a key intent of the PDRs is to influence the consumer consumption
pattern via dynamic electricity pricing without forcing the consumers to do so [41].
Consequently, PDR response is non-dispatchable and is accompanied with high
level of uncertainties in consumer responsiveness.
The DR programs in which consumers get incentives in return to their demand
flexibility belongs to incentive based DRs. Based on prior contract with the
consumers, the DR enabling entity, hereafter called aggregator, executes one or
more incentive based DRs, [42]-[44]. A key advantage of the incentive based DRs
is that they have dispatchable response, for instance, the amount of regulation from
say DLCDR is more predictable than that of the PDRs [45]. In addition to the
incentive based DRs and PRDs, recently a new DR category, called ADR, is
becoming increasingly popular. The ADR is basically a technique which acts in
response to a variation in system parameters, such as frequency or voltage [46],
[47]. Device continuously monitors the given parameters and automatically adjusts
its setting once the monitored parameter goes beyond preset limits [37].
2.1.2. Benefits of Demand Response
As depicted in Fig. 2.2b), DR programs provide several technical and economic
benefits to customers, DSOs, and system operators, they get benefited quite
differently though [48], [49]. The system operators can deploy the DR to balance
supply and demand, thereby lowering electricity cost in wholesale markets. This,
indeed, avoids the need of expensive reserves and helps to reduce price volatility in
the market [50], [51]. Similarly, the grid operators or DSOs can use the DR as a
resource to avoid grid congestions expected to be created due to increased
integration of new electrical loads such as EVs, HPs [52]. The DR can additionally
be applied for local network support in several ways, such as peak reduction,
congestion management, real-time voltage support etc. [53]. Therefore, the grid
operator can get not only operational benefits by effectively using the DR for
network support, but also financial savings by delaying or avoiding grid expansion
or reinforcement. Similarly, the electrical customers are expected to be benefited
mainly in two ways. First, they can have savings on their electricity bills by

CHAPTER 2. LITERATURE REVIEW
19
reducing the consumption during peak or critical periods. Second, they can trade
their flexibility to the market, thereby getting financial gain in return [38].
Fig. 2.2 DR classification and potential benefits [38].
In addition to the aforementioned benefits, several system wide benefits, such as
improved reliability and market performances can also be realized. As illustrated in
Fig. 2.2b), improved reliability can be achieved through reduced outages, whereas,
improved market performance can be realized through reduced price volatility.
Despite having several benefits, the DR deployment especially for residential
consumers is still at a primitive stage [54]. Several technical issues, such as
intelligent control architecture, control models, and control strategies, need to be
designed to effectively deploy the DR for residential consumers [55].
2.2. Intelligent DR Deployment Architecture The supply of and demand for electricity must be kept in balance in real-time to
keep a secure operation of the electric power system. Therefore, the primary
objective of power system control is to maintain system parameters, namely voltage
and frequency within pre-defined operational limits during normal as well as
abnormal operating conditions [56]. Traditionally, the distribution system is treated
as a passive network. So, most of the controls are implemented in the generation
and transmission system. However, increased integration of RESs and controllable
loads in the distribution network are turning the traditional passive distribution into
an active [57], [58], thereby providing various control possibilities.
A centralized and decentralized control architecture is a well-established
concept in the power system particularly for transmission and generation. The
centralized control has been used for better controllability, predictability, and wider
network visibility, whereas, the decentralized control has been implemented for
autonomous and prompt responses [59]. Fig. 2.3a) illustrates a brief summary of
key characteristics of the centralized and decentralized controls presented in [59].
As the combination of a centralized and a decentralized control scheme has been
successful in generation and transmission for years, it has also shed some light on
Demand Response
Incentive basedDR
PricebasedDR
Direct control
Interruptible/Curtailable load
Demand bidding
Emergency DR
Capacity market
Ancillary service market
Time of use
Critical peak pricing (CPP)
Extreme day pricing
Extreme day CPP
Real time pricing
Demand Responsebenefits
Market-wide
Reliability
Price reduction
Bill savings
Capacity increase
Avoided cost
Reduced outages
Incentive payments
Customer participation
Diversified resources
Reduced market power
Options to customers
Reduces price volatility
Participant
Market-performance
a) DR classification b) Benefits of DR

20
the design considerations for the future distribution system, especially for the DR
deployments [59].
Control architectures for deploying DR vary greatly depending on the utility
strategy, available infrastructure, and type of DR to be deployed [60]. For instance,
if the utility strategy is just to exploit the DR for peak shifting/clipping, a simple
time of rate based strategy might be sufficient, whereas, an extensive approach is
needed provided the DR is applied for real-time network support. A centralized
control is implemented when dispatchable demand regulation is desired, such as
DLCDRs. On the contrary, consumers decide themselves about the control action in
response to the DR signal in decentralized control architectures, such as PDRs and
ADRs [61]. The authors in [59] demonstrated that coordinated centralized and
decentralized control can capture both prompt response and better controllability.
Fig. 2.3 Intelligent control architecture. a) Centralized-decentralized [59] and b) HCA [63].
Recently, several architectures have been developed to integrate advantages of
both the centralized and decentralized control. The authors in [62] implemented a
simplified HCA to exploit the demand flexibility from HPs and EVs, where the
higher level controller ensures equalization of SOC of the EVs and SOE of the HPs
and the lower level controller acts in real-time to support the network locally. A
very similar HCA strategy can be realized by using primary and secondary control
loops of the micro-grid control hierarchy as illustrated in Fig. 2.3b) [63].
Nevertheless, proper design of time and level of control interactions among the
hierarchical loops significantly impact the performance of the HCA architecture.
The assumption of real-time data availability at the centralized controller, as
proposed in [62], may not be realistic. In [64], the authors presented theoretical
prospects on coordination strategy among various multi-objective actors, namely
fleet operator, DSOs, consumers, and market entities, for realizing EV charging. It
has been shown that the presence of several multi-objective actors greatly
complicates required DR architectures. Despite some architecture, such as
OpenADR [65], has been practiced in the recent years, formally accepted standards
to deploy various DR under a single framework are still unavailable.
Secondary Control
Centralized Control
DR CONTROL SCHEMES
Advantages
Drawbacks
Decentralized Control
Advantages
Drawbacks
Better controllability
Better predictability
Wider network visibility
Slow response, not suit for contingencies
Performance depends on communication
Prompt response
Local decision making
Suits to respond at abnormal operations
Limited visibility of the network
Control nay not be as required
b) Microgrid hierarchical control architecturea) Centralized vs. Decentralized control
Tertiary
Control
Secon-
dary
Control
Microgrid
Network
PrimaryControl
PrimaryControl
PrimaryControl
ss
s
Main Grid
Maingrid N
Maingrid 2
Maingrid 1

CHAPTER 2. LITERATURE REVIEW
21
2.2.1. Multi-disciplinary Aspects of SG Architectures
As stated in IEEE P2030 standard [66], the SG is a multi-disciplinary field
comprising the power system, information technology, and communication
perspectives. Therefore, deployment of DR depends not only on the power
performance, but also on the performance of the ICT. Given this multidisciplinary
aspect, several co- and multi-simulation frameworks were proposed for detailed
multidisciplinary studies [67]. A co-simulation of power and ICT for EV
coordination was investigated in [68] to maximize RESs utilization. Moreover, the
authors in [69] developed a multi-agent simulation environment to meet the cross-
disciplinary requirements of the SG, particularly DR. In [70], authors investigated
impacts of ICT on power system using power and communication co-simulation.
Very few studies, [67]-[70], have been done in investigating the
multidisciplinary architecture to deploy various DR schemes. These researches
presented co-/multi- simulations to deploy a specific DR, which may not be the case
in the future distribution system. The future system will rather have a number of
DR programs running simultaneously. In particular, presence of a new DR program
may significantly impact the performance of the existing DR and vice versa.
Therefore, a HCA is designed and the power and communication co-simulation is
performed in this thesis to control and coordinate a number of DR programs under a
single architecture. This provides a novel approach to integrate responses from
various loads considering both power and communication aspects.
One of the greatly lagging parts in SG, particularly in DR, is the practical
demonstration and investigation of the multi-disciplinary aspects. Indeed, very few
attempts, [71]-[73], have been done towards practical implementation of
multidisciplinary aspects of the SG in physical setups. University laboratory setups,
[74]-[76] often involve several real-time or offline simulators rather than having a
complete physical setup. Therefore, one of the best approaches to demonstrate their
practical implementation and to avoid huge investments in large pilot projects is to
downscale the system in the laboratory environment. Indeed, this forms a riskless
way to investigate new control and coordination mechanisms for integrating DR.
2.3. Modeling of Flexible Loads and Local Generation Demand flexibility potential greatly depends on load type, their characteristics,
and consumer behaviors. For instance, the demand flexibility of lighting load is
significantly low compared to high rated flexible loads provided with storage
capacity, such as EVs, HPs etc. Therefore, proper load models are desired to satisfy
consumer comforts/requirements and to extract flexibility potential. State of the art
on modeling of active loads and local generation is presented as follows.
2.3.1. Electric Vehicles
The sizable ratings provided with energy storage capability makes EV to stand
as a potential DR resource [79]. From the power system perspective, an EV is
essentially a battery which acts as an electrical load while charging and a source
while discharging back to the grid. Therefore, battery model (e.g., electrical,
chemical, electro-chemical etc.) often forms a core of the EV modeling [80].
Electrochemical models normally involve non-linear algebraic and partial
differential equations for verification of the battery performances [81]-[83]. In fact,

22
the model performance varies greatly per battery technology. In particular, key
parameters, such as efficiency, energy and power density, cycle life etc., for
different battery technologies are illustrated in Table 2.1[84]. Due to high power
and energy density, longer life time, and high efficiency, Lithium-ion is the most
commonly used for EVs [84], and is also the considered technology in this study.
Table 2.1 Key features of different battery technology [84].
Nevertheless, electrical models are undoubtedly the most common in studying
the impacts and grid support capabilities of the EVs [84]. Indeed, an electrical
model of the EV is an equivalent circuit comprising voltage source, resistors,
capacitors, etc. [84], [86]. Among several existing electrical models, a Thevenin
model consisting of an ideal voltage source in series with an internal resistance and
parallel RC circuits is the common one [86]. However, despite having simplicity in
the model, its accuracy, for instance for SOC estimation might need to be
compromised [86]. As the EV can be seen both as a load and a generator, separate
models are normally designed. A common method is to model the EV as a constant
power load. Different statistical or stochastic models, as in [87], [88], are used to
create EV demand, availability, and charging profiles. Similarly, a static generator
model is used for the EV while feeding energy back to the grids [89]-[90].
Currently, there are no established standards in Denmark on EV capability curve;
rather the capability curves of the general static generators are applicable [90]. In
this study, the EV has been modeled as a constant power load having unity PF.
2.3.2. Heat Pump
The HP is a thermostatic load working in either heating or cooling mode to
supply thermal demand of the customers. It transfers heat energy from lower
temperature to the higher temperature in heating mode and vice versa. Since the
primary use of HPs in Denmark is heating, the entire study has seen the HPs from
heating perspective. Depending on the modes of heat transfer, the HPs are broadly
classified into: Ground to Water, Air to Water, and Air to Air [9]. The first medium
is a source from where heat is extracted and the second refers to the sink. The
modeling of HP is primarily seen from two perspectives: thermal and electrical.
Thermo-dynamic models include thermodynamic cycles and thermal models of the
room, and thermal demand of the consumers [92], [93].
However, thermos-electric models play a greater role since the focus of this
study is on accessing the demand flexibility from the HPs for supporting electrical
network. In particular, coefficient of performance which is defined as a ratio of
thermal energy demand to electrical energy demand performs an interface between
the thermal and electrical models [94]. In order to simplify the HP models, many
studies assumed constant coefficient of performance [95]-[97]. Nevertheless, in
Technology Li-ion Lead-Acid Ni-CD Ni-MH Nas
Efficiency (%) 70-85 70-80 60-90 50-80 70
Energy Density (Wh/kg) 100-200 20-35 40-60 60-80 120
Power Density (Wh/kg) 360 25 140-180 220 120
Life (no of cycles) 500-2000 200-2000 500-2000 <3000 2000
Self-discharge High Low Low High Medium

CHAPTER 2. LITERATURE REVIEW
23
reality, the coefficient of performance depends greatly on ambient conditions,
namely on the temperature difference between source and sink [98]. Authors in
[99]-[100] have developed a mathematical model of the coefficient of performance
as a function of source and sink conditions. The coefficient of performance as a
function of ambient temperature for an air source HP is shown in Fig. 2.4a).
Fig. 2.4 a) Coefficient of performance vs. ambient temperature for a HP [101], b) PV array
current vs. solar irradiance [102].
Since a thermal storage tank is often integrated to provide thermal demand of
the consumers, a storage tank model is also included in the thermo-electrical model
[103]-[104]. Indeed, the storage tank provides two functionalities. First, the storage
tank provides operational flexibility, and hence the electrical demand flexibility to
the HPs. In addition, it helps to decouple the thermal and electrical system, thereby
providing simplified HP models for electrical studies. Nevertheless, the tank size is
becoming a key factor in determining cost and technical performance of the HPs.
For instance, if the tank size is very small, the HP may not fulfill the consumers
demand during worst climate conditions even with full operation, whereas, if the
tank size is very large, stratification problem might occur in the tank [9].
2.3.3. Solar Photovoltaic
In Denmark, integration of rooftop solar PV is increasing significantly over the
last few years. The PV modeling is basically seen from technological development
and application perspectives. There are significant developments on PV technology
over the last few years [105], thereby resulting in continuous decrement on cost of
the PV cells/modules. Nevertheless, PV modeling seen from electrical application
perspectives is the major focus for this study. While seeing the PV from electrical
perspective, it is modeled as a static generating source whose power output is a
function of environmental factors, such as solar irradiance and ambient
temperatures [106], [107]. In particular, the power output varies widely with those
parameters. Typical variation of the PV power array current per solar irradiance is
illustrated in Fig. 2.4b). In [106], authors presented a probabilistic model to
compute power output of the PV considering geostrophic wind variations and in
[107], the authors developed artificial intelligence based models for PV power
forecast. A key objective of such models is to better estimate the PV power output
to ease better operational planning [106].
-25 -20 -15 -10 -5 0 5 15 20
1.4
1.6
2
2.4
1.8
2.2
Tamb
CO
P
b)a)

24
Solar PV is normally modeled as a current source while studying from grid
perspectives. Nevertheless, significant progress on the control capability of the grid-
tied PV inverter provides several operational flexibilities to the PVs, thereby
different modeling possibilities. In particular, depending on grid application and
modes of controls, several detailed electrical models of the PVs, as presented in
recent literatures [108] - [110], can be implemented. The authors in [109] have
developed a dynamic PV model for local voltage support in the network and the
authors in [110] presented very similar modeling approach for congestion
management. As this study is intended to deploy DR for residential consumers, the
PV is modeled as a static generator integrated with controllable loads.
2.4. Development of DR Control Strategies Integration of flexible loads and local generation in the distribution system come
up with several potential issues. A method of accessing and quantifying those
impacts is the foremost step in developing the DR control strategies. The following
sections first present potential impacts of flexible loads and generations and
subsequently control strategies to overcome those issues are presented.
2.4.1. Impact of Active Load and Generation in LV Grids
Electrification of the heating, gas, and transport sector, introduce new electrical
loads, such as EVs, HPs, and EWHs. Due to their sizable ratings, the distribution
system particularly the LV networks get greatly affected followed by their higher
penetration [111]. Consequently, many of the grids are expected to face one or
many problems, such as voltage deviations beyond limits, unacceptable voltage
unbalances, voltage flicker, thermal overloading and so on. The authors in [112] has
pointed out that some of the LV networks in the Netherlands have already faced
such problems due to increased penetration of HPs. Many LV grids which are near
to the thermal or voltage limits get congested even with low or moderate
penetration of the HPs [113].
Similar to the HPs, simultaneous charging of EVs can easily overload the LV
feeder and distribution transformers [114]. Several researches, [115]-[117], has
shown that uncontrolled charging of EVs result in several power quality issues,
such as excessive voltage drops during peak periods, voltage flicker due to
simultaneous switching of EVs etc. The extent of impacts becomes even more when
both EVs and HPs are integrated in the LV network since many of the LV networks
were not designed to address such scenario. A combined analysis of HPs and EVs
in LV showed that uncontrolled operation of such loads leads to immediate
reinforcement of majority of the LV networks [9].
On contrary to the impacts of loads, high integration of rooftop PVs, which is an
expected scenario in Denmark, will create additional issues, such as overvoltage
and harmonic distortions in the network [118]. It has been shown in [119] that the
voltage rise is observed as the foremost issue in residential feeders having relatively
longer feeder length. Consequently, several rural feeders face overvoltage issue
even under relatively low PV penetration. Authors in [120] have further
demonstrated that the PVs not only cause overvoltage in the network, but also
create intermittent voltage rises on the network due to intermittency in generations.

CHAPTER 2. LITERATURE REVIEW
25
Reverse power flow and introduction of harmonics in the system are additional
issues contributed due to integration of the PVs [120].
The impact assessments of those loads and generations in the network are of
great importance especially from DSO’s perspective as they should ensure the
hosting capacity of the network within limit to maintain reliability and quality of
supply. Normally, DSO performs worst case analysis, often deterministically, [121],
to identify maximum hoisting capacity of the network. Nevertheless, the worst case
analysis may be pessimistic, thereby allowing lower penetration of the loads or
generation. This will in turn lead to higher economic investments on the grid
reinforcement. As the distribution of the EVs, HPs, and PVs in a feeder
significantly vary the level of impacts, stochastic studies considering random load
distribution often gives better results [122]. Nevertheless, the study may end up
without capturing the worst case.
The impacts of loads and generation on the network are often complementary to
each other. Nevertheless, their operation rarely coincides. The PVs normally
produce maximum power during the day when the consumption is very low.
Similarly, active loads, such as EV, HP, EWH etc., normally consumes high power
in the morning and evening when the PV has low/no generation. Nevertheless,
exploiting the thermal storage of the HPs and the electrical storage of the EVs,
proper control strategies can be designed to complement those conflicting impacts.
2.4.2. Active Loads and Generation Control Strategies
Intelligent control strategies are desired not only to address the aforementioned
impacts but also to deploy the demand flexibility for various grid applications.
However, there are very limited control possibilities in existing distribution,
particularly, in LV distribution systems. Commonly available options are off-load
tap changing of the secondary transformer, voltage regulator and/or capacitor banks
[123]. Nevertheless, those control techniques are pretty passive since their operation
cannot adapt to dynamic operating conditions. Moreover, such control techniques
have several technical limitations in relation to regulation capacity, stepwise
control, mean lifetime, tracing difficulties and so on [9]. Active control techniques
are therefore desired to establish coordinated control and automation of various
DERs and loads [124]. As shown in Fig. 2.5 control strategies can be developed and
designed from different perspectives. In particular, various control strategies for
potential DR resources for grid applications and objectives, are presented next.
2.4.2.1 Control Strategies for EVs
In the recent years, significant attentions from researchers, academia, and
government has been invested to develop control methods and strategies to manage
high EV penetration, particularly in the LV distribution grids. Price based charging
strategies, as proposed in [125], [126], form simple and basic control techniques,
whereby consumers reduce their consumptions during high price periods, and
consequently shift their loads towards low price periods. A very similar approach,
where an optimum EV charging algorithm is seen from the consumer perspectives,
is proposed in [127]-[128]. Nevertheless, implementation of purely price based
control does not respect network constraints and creates peaks at low price periods.

26
Fig. 2.5 Various perspectives to develop DR control strategies.
On contrary to the aforementioned techniques, several control strategies, [129]-
[132], are developed for EV charging management considering network constraints;
particularly the voltage and thermal constraints. A flexible EV charging
optimization using a reference load curve is proposed in [131] to consider network
constraint, particularly the thermal constraints. Similarly, a local voltage and
current sensitivity based EV charging algorithm is proposed in [130] to address
both the thermal and voltage constraints in the network. In addition, EV charging
strategies are developed for several network applications, such as for peak clipping,
maximization of load factor, and minimization of feeder loss [130]-[132]. However,
seeing the EV charging only from technical perspectives is often insufficient since
the EV owners do not concern about the network condition, they rather have
financial motivation in return of operational flexibility.
In order to complement the shortcomings of economic and technical
perspectives in EV charging, control strategies integrating both aspects are
desirable. The authors in [129] presented a two stage optimum EV charging
strategy taking thermal loading as a constraint. However, the network constraint,
simply taken as the feeder capacity, is often insufficient since voltage is a foremost
concern in majority of the LV networks. To address this issue, the authors in [132]
presented EV charging algorithms considering voltage, overloading, and electricity
costs. In particular, a coordinative EV charging algorithm where an offline
scheduling is performed for charging cost minimization and a shadow pricing is
performed for congestion management. The proposed approach perfectly suits to
formulate optimum EV charging schedules which simultaneously respect both the
voltage and thermal constraints. Nevertheless, optimum scheduling based on the
forecasted loads and EV arrival/departure might need to be adjusted during actual
operations as the loads may vary rapidly and randomly over time.
2.4.2.2 Control strategies for HPs
The sizable rating provided with energy storage capability of the HP possesses
substantial demand flexibility. In addition, large thermal time constant further
provides operational flexibility, without impacting the consumers’ comfort [9].
Nevertheless, proper control strategies are desired for exploiting the demand
flexibility not only to provide grid support in several ways but also to ensure the
financial motivations of the consumers. Authors in [133] presented optimum HP
Control Strategies
Flexible Loads
Local Generation
Electric Vehicle
Heat Pump
Solar PV
Consumer/Prosumer
Aggregator/system
operator
Grid operator
Economic
Economic & Technical
Technical
Type of ressource/load Control perspectives Objectives
Local network support
System level balancing
Market support
Applications

CHAPTER 2. LITERATURE REVIEW
27
scheduling by minimizing total energy cost of the HPs. Similarly, the authors in
[134] presented a distributed HP scheduling to optimally shift the operation of HP
according to local generation from wind and solar PV. It has been assumed that the
HP is provided with sufficient storage capability so that its operation can be shifted
to any period of the day, which may not always be the case since the storage
capacity depends greatly on the tank size. Moreover, those price based control
strategies ignore one of the important aspects, the network constraints.
In order to address the network technical limitations, the authors in [135]-[136]
proposed different control techniques incorporating network constraints and
consumer comforts. The authors in [135] proposed a methodology to ensure
maximum utilization of the local network by simultaneously respecting the
consumer comfort. Similarly, the authors in [136] proposed an aggregated approach
for the thermostatic loads and EVs for the frequency support. Even though the
aforementioned methods perform technically better than price based strategies,
integration of the economic aspects is vital especially to incentivize the consumers.
To support the network in real-time, a direct load control approach has been
proposed in [137] where the HPs get disconnected for 1-2 hours for several times
per day, provided the storage tank has full energy before the next disconnection. A
very similar approach is presented in [138] where a load dispatch algorithm based
on an ON-OFF control strategy is implemented to control HPs for supporting the
network in real-time. Even though the direct load control based methods respect the
electricity prices as well as provides the dispatchable demand regulation, consumer
flexibility and comforts needs to be compromised. Alternatively, the authors in
[139] proposed a simple voltage control strategy for peak shaving in distribution
feeder. This method provides an adaptive control to the HPs, and hence has great
potential for grid support without noticeable impact to the consumers. Nevertheless,
as the HP compressor is supplied normally by induction motors, the decrease in
voltage may degrade the HP performance.
2.4.2.3 Coordinated control of PVs and EVs
As mentioned in the previous section, increased PV penetration creates several
impacts in the existing electrical grid. In particular, voltage rise is one of the
foremost concerns that need immediate attention even under moderate PV
penetration [119]. Several control strategies have been developed recently to
alleviate the grid overvoltage resulting from the PV penetration. Authors in [140] -
[141] presented various reactive power control techniques to alleviate grid
overvoltage, where the key idea is to increase reactive power consumption of the
grid-tied PV inverter during overvoltage. However, increased reactive power
consumption to alleviate OV creates additional power loss in the grid. To overcome
this issue, the authors in [142] proposed a droop based active power curtailment
method. Despite its superior performance for voltage support, it incurs revenue loss
to PV owners, thereby reducing the probability of acceptance by the PV owners.
Alternatively, integration of battery storage is presented in [143] and a
coordinated control of distributed energy storage and transformer tap changer is
proposed in [144] for the voltage control in distribution grids. In spite of their better
grid support capability, extra investment in storage makes them economically less

28
attractive. To avoid additional investment on storage, battery storage of the EVs is
often integrated with the PV control. Utilization of battery storage of EVs is
proposed in [145] to reduce reverse power flow from the PVs. Similarly, a real-time
EV charging control is proposed in [146] to reduce impacts of solar irradiance
intermittency. Nevertheless, both the forecasting based predictive control, [145],
and real-time based adaptive control, [146], are desired to effectively address the
overvoltage issue. Therefore, a combined predictive and real-time control of the EV
charging to mitigate grid OV due to PVs is developed in [147]. However, the
proposed EV control is often insufficient to fully mitigate the overvoltage in
residential feeders due to the fact that EVs are normally unavailable at home when
PV has maximum production.
2.4.2.4 Voltage control DR
CVR is a technique conventionally deployed by many electric utilities as a mean
of energy conservation [148]. The authors in [149] - [154] proposed CVR for
various applications, for instance, peak shaving, energy conservation etc.
Nevertheless, a key idea of the CVR is to reduce the consumer demand and hence
the consumption by reducing the operating voltage. Exploiting the fact that the
demand of a device is a function of voltage, both up/down regulation can be
realized by voltage control. This method gained less attention over the last few
decades due to the risk of voltage deviations beyond the limits [155]. Moreover,
lack of accurate estimation of voltage dependency of loads is acting as additional
barriers on its easy acceptance. Nevertheless, this method is gaining relatively
increased attention with the advancement on automatic metering infrastructure and
with a greater need of demand flexibility in the future grids.
The actual demand regulation potential of the voltage control is subjected to the
voltage dependencies of the loads and available range of voltage control [156]. The
authors in [157] performed voltage control experiments by changing the voltage of
the secondary smart transformer on a representative urban LV feeder to compute
the voltage dependency. They have demonstrated significant demand regulation
potential with the proposed techniques. The variations on regulation potential are
dependent of with season, geographical location, and loading conditions of the
network. Typical variations of voltage dependencies of feeder loads for different
seasons are listed in [158]. Therefore, an adaptive control method is anticipated to
determine real-time voltage dependencies of the load.
This method serves as a potentially effective tool in regulating the demand as
most of the existing DR techniques are accompanied with greater uncertainties and
lack of dispatchability [155]. Moreover, a clear advantage of this technique is that
the consumers get minimally affected due to its deployment and it cause very low
energy recovery effect [157]. Therefore, this technique serves as an effective tool
for the various applications such as emergency DR, peak reduction, participating in
regulating market etc. However, in order to make it easily acceptable, voltage at
every consumer POC should be within the acceptable limits.
2.5. Impact of ANM on Protection Future distribution systems are expected to be characterized with high
adaptation of DERs and ANM activities, such as DR, dynamic network

CHAPTER 2. LITERATURE REVIEW
29
reconfiguration. Despite having several technical benefits of the DERs, their high
penetration inherits several control and operational complexities in the existing
system. Protection of the electric distribution network is considered as one of the
potential issues caused due to high penetration of the DERs. Conventional
protection approaches where the protective devices use static settings may not
properly discriminate the fault in the future grids characterized with high DER
penetration [159]. In addition, presence of various ANM approaches also threatens
the existing protection practice since they may change the network topology.
Therefore, unlike the conventional approach where the protection is decoupled from
the network control, an integrated protection and ANM is desired. Particularly, the
protection should be a part of the ANM such that protection coordination is ensured
dynamically consistent with the ANM activities.
Recent studies have developed various algorithms to address the protection
problem in the distribution system due to DER integration. The authors in [159]
proposed a simplified method to disconnect all the DERs followed by fault
detection. A key idea behind this approach is to keep protection settings intact as
that of without having DERs. Nevertheless, disconnecting all the DERs after fault is
undesirable since it causes significant revenue loss and decreased reliability.
Alternatively, authors in [160], [161] proposed techniques to determine the
maximum penetration of DERs without impacting the protection system. In line
with this, various faults current limiting methods, [162] - [163], are recently
proposed to limit the fault current contributions from the DERs such that the
existing protection can be used without modification. For the inverter interfaced
DERs, the authors in [163] demonstrated that the fault current contribution can be
reduced to zero. Particularly, the main idea on those techniques, [160]-[163], is to
limit the fault current to such an extent that it does not demand change in setting.
Therefore, an AP scheme, where the relay settings are updated dynamically
consistent with varying network topologies, is gaining increased momentum in the
recent years. Authors in [164] presented a local adaptive overcurrent protection
where each relay locally detect connection status of the DERs and update their
setting. Similarly, local adaptive protection where the relay settings are updated
based on locally measured voltage is proposed in [165]. Even though those local
adaptive protection approaches effectively updates the relay settings based on the
connection status of the DERs, any changes in network topologies due to ANM or
connection of additional DERs cannot be addressed by those techniques.
In order to resolve those issues with the local adaptive protection, the authors in
[166] proposed communication assisted adaptive protection integrated with ANM.
Similarly, communication assisted protection for micro-grids is proposed in [167],
[168]. Nevertheless, those approaches used a centralized communication assisted
protection, in which a central protection unit gather data from every DER and relay
to update relay settings consistent with the change in network topology. Such
centralized protection scheme not only requires increased communication burden
but also creates a single point of failure. To simplify the problems of the centralized
schemes, authors in [169], [170] proposed zonal based decentralized protection,
whereby each zone separating breaker communicate to the others [169] and to the
central relay [170] to identify the faulted section.

30
2.6. Chapter Summary Despite having significant research efforts, deployment of DR at the residential
consumer level is still at the developmental stage. As discussed in the previous
sections, intelligent DR control architecture, proper DR control strategies, and
adaptive and proactive protection are the key issues that need to be addressed to
realize intelligent control and operation of the future distribution system. State of
the art on DR architecture has shown that there is no standard common framework
for deploying various types of DR. Moreover, multi-disciplinary aspect for DR
exploitation is still unsolved. Therefore, an intelligent hierarchical DR control
architecture is developed in this study to provide a common framework to establish
control of different DR types. A communication infrastructure is integrated to the
HCA to address the multi-disciplinary aspect of the DR deployments.
It has been seen from the state of the art that DR strategies simultaneously
addressing both technical as well as economic perspective are still under
development. Therefore, a novel two-stage algorithm, where the first stage prepares
an economic optimization considering electricity price, network constraints, and
consumer requirement and the second stage makes a real-time network support by
adjusting power consumption from active loads, namely EVs and HPs based on a
locally monitored voltage is proposed in this study. Moreover, periodic interaction
between two stages is established to adapt any operational uncertainties.
As existing DR control strategies are mainly based on directly/indirectly
controlling the consumer loads, there are always very high uncertainties in the
consumer responsiveness and participation. To address this aspect, a new voltage
control dynamic DR is presented in this study, whereby SS voltage is adaptively
regulated consistent with need of demand regulation.
The state of the art has shown that practical demonstration of the DR is one of
the greatly lagging parts in the SG development. As such, a scaled down SG testbed
is developed in this study for practical investigation of the developed DR solutions.
Additionally, multi-disciplinary aspects of the DR deployment are demonstrated
from power and communication perspective by implementing a combination of
centralized and decentralized control strategy.
The state of the art on protection of future distribution system reveals that both
the local adaptive protection and centralized protection approach inherits limitations
in terms of their fault discrimination capability. Moreover, protection is normally
decoupled with ANM activities, which is not realistic in future. Therefore, a two-
stage protection strategy is proposed in this study to address protection issues
resulting from increased DERs and ANM integration. Particularly, a combination of
local adaptive and communication assisted centralized protection scheme is
implemented.

31
Chapter 3. Intelligent Smart Grid
Control Architecture
This chapter presents intelligent control architectures to apprehend anticipated
control and operations of the future distribution grids for deploying DR. In
particular, the key functionalities of an HCA, documented in manuscripts C1 and
J1 are summarized and the effectiveness of the HCA to deploy existing DR
techniques is demonstrated. Moreover, multi-disciplinary aspects to the DR
deployment are investigated through power and communication co-simulation in a
LV test network considering EVs as potential DRRs.
3.1. Introduction One of the major objectives of the SG is to deploy DR for enabling consumers
to interact with the power system by means of intelligent control of their electrical
appliances. However, lack of standardized DR architecture is becoming a key
barrier to deploy DR, particularly for residential consumers. Further, the passive
nature of most of the current LV distribution networks and electricity consumers is
being a potential issue for practical deployment of the DR. Therefore, intelligent
DR control architecture is designed in this study to effectively deploy various types
of DR programs with the aim of producing the following functionalities:
Commercial functionality: A key idea of the commercial functionality is to ensure
profitability to the participating consumers. Therefore, the architecture provides a
coordination framework among key SG actors, namely consumer, aggregator, and
DSO, to facilitate trading of consumers’ demand flexibility in the dynamic
electricity markets.
Technical functionality: A key purpose of the technical functionality is to utilize the
flexible demand from widely distributed consumers/prosumers for supporting the
electrical network. Proper coordination among the actors is established to exploit
the demand flexibility in supporting the network at the local level (e.g. local voltage
support, congestion management etc.) as well as at the system level (e.g. system
level balancing). Moreover, consumer’s comfort, operational preferences, and
needs are ensured through coordinated control of the potential DRRs.
This chapter presents intelligent DR control architecture designed for realizing
the aforementioned technical and commercial goals. In particular, the HCA
proposed in the publications C1 and J1 is implemented to maximally exploit
demand flexibility, particularly, from the residential consumers. First, a control-
requirement based classification of the existing DR techniques is presented to
quantify control needs of each DR category. The HCA containing three DR control
loops, namely primary, secondary, and tertiary, is then designed to establish
coordinated control among all DR categories. As control latency of HCA loops

32
increase from the inner primary towards the outer tertiary loop, every outer loop
provides time-delayed backup to the immediate inner loop. Moreover, every inner
loop supports the outer loop by activating their control with shorter latencies. This
indeed leads to increased control and operational flexibility to every loop, thereby
supporting the network maximally. More importantly, a heterogeneous
communication network is integrated into the HCA to realize anticipated control.
The HCA performance is demonstrated from power and communication
perspectives in a LV test network considering EV as a potential DRR.
3.1.1. DR Deployment Framework
In general, a DR deployment framework as illustrated in Fig. 3.1 is required to
establish coordination among major SG actors, namely DRR, DSO, aggregator,
RPM, and electricity market. In particular, the RPM and electricity market are
system level actors, whose influences to deploy DR are taken in the form of
regulating signal or price signal. On the other hand, DRR, DSO, and aggregator are
local actors, which play key roles to deploy DR in a particular distribution system.
Indeed, the DRR is a consumer or directly controllable load, which receives DR
control signals, such as electricity price, power/temperature set-points etc., from the
higher level and reacts to them as per the instruction contained in the signal. The
DRR either adjust or shift the consumption in response to the DR signal.
Fig. 3.1 DR Interaction framework for SG actors.
Similarly, the aggregator is a commercial actor who is responsible for ensuring
coordination among the actors to execute DR. As illustrated in Fig. 3.1, the
aggregator plays an intermediate role to enable market participation of DRRs,
which otherwise cannot directly trade their flexibility to the market. The aggregator
additionally ensures coordination with the DSO to avoid grid bottlenecks that might
result from DR deployments. Similarly, the DSO, who is an owner of a physical
network, is responsible for ensuring operational constraints within the limits.
In particular, a novel control requirement based DR categorization is proposed
in this study to establish a common framework to deploy DR. In particular, existing
DR techniques are categorized into ADR, DLCDR, DDDR, and PDR, on the basis
DSO
Aggregator
MW
$/MW
DR
monitoringControl
Demand Response Resource
Informative Signal
DR signal
Measurements
Power Flow
Regulating Market
Regulat
ion
biddin
g
Regulation
signal
Measurement
Electricity PriceEnergy bidding
Network data
DR control
Energy Market

CHAPTER 3. INTELLIGENT SMART GRID CONTROL ARCHITECTURE
33
of control schemes, response time, and communication requirement. In ADR, DRR
continuously monitors system parameter, such as frequency or voltage, and
automatically adjusts their setting once the monitored parameter deviates beyond
the preset limits. Prompt response in the range of fraction of seconds can be
realized by the ADR as monitoring and control take place locally at the DRR level.
Similarly, DLCDR is realized by directly controlling status of individual devices.
As the aggregator executes the DR control centrally, the DLCDR has slower
response ranging from few seconds to minutes.
Similarly, in DDDR, the aggregator centrally dispatches a DR signal invoking a
specific instruction, such as power/temperature set-points, to candidate DRRs, who
in turn takes the final control action. Depending on load characteristics, the
response time of the DDDR varies from few minutes to several hours. Similarly,
DR techniques which act in response to electricity price belong to PDR. In
particular, the electricity price is regulated centrally by the aggregator and
dispatched to every DRR such that consumers are free to respond to the electricity
price. The PDRs typically exhibit slower response (in order of several hours) since
consumer should know the price in advance to be able to shift or reschedule their
loads. Key characteristics of each DR category are summarized in Table 3.1 and
details are presented in Section II of C1.
Table 3.1 A Novel control requirement based DR categorization.
The aforementioned DR categorization is done such that limitations of each DR
category are compensated by the other. For instance, high uncertainties in consumer
responsiveness of the PDRs can be compensated by exploiting the specific demand
regulation capability of the DDDR, whereby the consumers are instructed to
regulate their demand by a specific amount. Similarly, the DLCDR is designed as a
potential resource to provide demand regulations during emergency conditions
when the PDRs and DLCDRs are unable to do so due to their longer control
latencies. Moreover, the ADR is designed for real-time network support which
otherwise cannot be realized from other DR categories.
3.2. Implementation of HCA Architecture A HCA is designed in this study to establish coordination among the
aforementioned DR categories, especially to compensate limitations of the
individual DR categories as well as to maximize demand regulation potential. In
particular, implementation of the HCA is realized in three stages. First, the HCA is
designed to establish coordinated control among aforementioned DR categories
from power perspectives. Second, appropriate ICT infrastructure is integrated into
the HCA. Finally, a power and communication co-simulation is performed
considering multi-disciplinary aspects of the HCA.
DR Type Control SignalSignal
type
Decision
place
Control
action
Response
time
Communic-
ation need
ADR Frequency/Voltage Directive Local Local < 1 sec No
DLCDR ON/OFF, Setpoints Directive Central Central sec. - min Yes
DDDR Demand dispatch Instructive Central Local min. - hour Yes
PDR Price Informative Central Local hour - day Yes

34
3.2.1. HCA Implementation from Power Perspective
As illustrated in Fig. 3.2, the HCA is designed with three DR control loops,
namely primary, secondary, and tertiary, such that each loop is responsible for
deploying a specific DR category. In particular, each loop exhibits a specific
response time which increases from the inner primary loop towards the outer
tertiary loop. Therefore, every outer loop provides time-delayed backup to the
immediate inner loop and hence the increased control and operational flexibility.
Similarly, every inner loop backup the performance of the immediate outer loop by
compensating their uncertainties in shorter time resolutions. Indeed, the HCA loops
run in succession to back-up each other and maximally exploit the DR potential.
However, the HCA loops are not identical to the frequency regulation loops; the
same naming is intentionally used to emphasize that each HCA loop can serve the
respective frequency regulation. For instance, the primary DR loop can serve the
primary frequency regulation and so on. Nevertheless, the HCA loops can
additionally be applied to support the network in several ways, such as peak
shaving, congestion management, local voltage support etc.
Fig. 3.2 Hierarchical DR control architecture.
3.2.1.1 Tertiary DR control
The TDRC loop is the slowest, outermost loop in the HCA which is primarily
designed to execute the PDRs and DDDRs. Depending on desired response time the
TDRC executes IFC to deploy the PDRs or ISC to deploy the DDDRs. In particular,
the ISC is executed when faster responses ranging from few minutes to an hour are
desired, thereby leaving the IFC to work for DR where slow response is acceptable.
Informative control: The IFC is designed to optimally adjust hourly electricity
prices so as to incentivize the consumers for reducing or rescheduling their
consumption. Since the consumers should know the electricity price well in
advance to be able to shift their loads, the IFC normally exhibits slow response.
Power supply
V/F in limit?
Compute droop parameters
droop control
No
DR need?
DR urgent
? Yes
Fetch status of DRRs
Yes
DR monitoring
Compute optimum set-
points to meet desired
regulation
DRlatency < 1 hr?
No
Compute optimum schedules Yes
Compute optimal price
No
Execute PDRs
Consumer reading
Execute DLCDRs
Execute DDDRs
DR management and control
center
DR
R
sta
tus
DR
R
sta
tus
?
Distribution system operator
Demand response
Ressource (DRR) Primary
loop
Secondary loop
Tertiary loop
No
dis
pa
tch
pri
ce
dis
pa
tch
se
t-p
oin
ts
dis
pa
tch
p
rice
Electricity price
Regulationsignal
Net
wo
rkd
ata
DR
co
ntr
ol
Aggregator
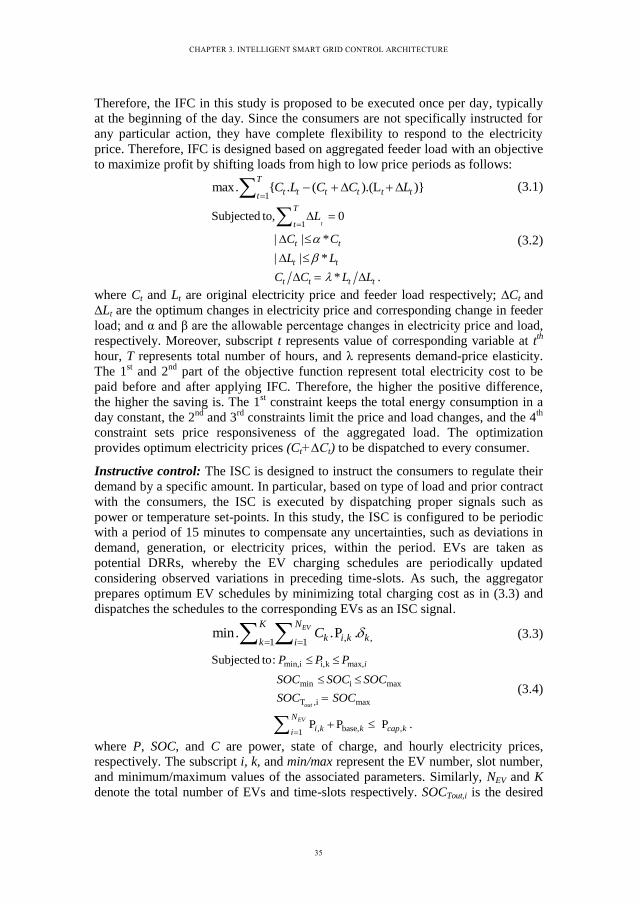
CHAPTER 3. INTELLIGENT SMART GRID CONTROL ARCHITECTURE
35
Therefore, the IFC in this study is proposed to be executed once per day, typically
at the beginning of the day. Since the consumers are not specifically instructed for
any particular action, they have complete flexibility to respond to the electricity
price. Therefore, IFC is designed based on aggregated feeder load with an objective
to maximize profit by shifting loads from high to low price periods as follows:
1max. . ( ).(L )
T
t t t t t ttC L C C L
(3.1)
1Subjected to, 0
| | *
| | *
* .
t
T
t
t t
t t
t t t t
L
C C
L L
C C L L
(3.2)
where Ct and Lt are original electricity price and feeder load respectively; ∆Ct and
∆Lt are the optimum changes in electricity price and corresponding change in feeder
load; and α and β are the allowable percentage changes in electricity price and load,
respectively. Moreover, subscript t represents value of corresponding variable at tth
hour, T represents total number of hours, and λ represents demand-price elasticity.
The 1st and 2
nd part of the objective function represent total electricity cost to be
paid before and after applying IFC. Therefore, the higher the positive difference,
the higher the saving is. The 1st constraint keeps the total energy consumption in a
day constant, the 2nd
and 3rd
constraints limit the price and load changes, and the 4th
constraint sets price responsiveness of the aggregated load. The optimization
provides optimum electricity prices (Ct+∆Ct) to be dispatched to every consumer.
Instructive control: The ISC is designed to instruct the consumers to regulate their
demand by a specific amount. In particular, based on type of load and prior contract
with the consumers, the ISC is executed by dispatching proper signals such as
power or temperature set-points. In this study, the ISC is configured to be periodic
with a period of 15 minutes to compensate any uncertainties, such as deviations in
demand, generation, or electricity prices, within the period. EVs are taken as
potential DRRs, whereby the EV charging schedules are periodically updated
considering observed variations in preceding time-slots. As such, the aggregator
prepares optimum EV schedules by minimizing total charging cost as in (3.3) and
dispatches the schedules to the corresponding EVs as an ISC signal.
, ,1 1min. .P .
EVK N
k i k kk iC
(3.3)
min,i i,k max,
min i max
T ,i max
, base, ,1
Subjected to:
P P P .
out
EV
i
N
i k k cap ki
P P P
SOC SOC SOC
SOC SOC
(3.4)
where P, SOC, and C are power, state of charge, and hourly electricity prices,
respectively. The subscript i, k, and min/max represent the EV number, slot number,
and minimum/maximum values of the associated parameters. Similarly, NEV and K
denote the total number of EVs and time-slots respectively. SOCTout,i is the desired

36
SOC by plug-out time and Pcap,k and Pbase,k are the feeder capacity and feeder base
load respectively. The objective function is formulated to minimize the sum of
electricity cost for EV charging. Further, the 1st constraint ensure that the EV
charging power stay within the charger limits, whereas the 2nd
and 3rd
constraints are
used to fulfill charging requirement of the EV owner such that the EV get fully
charged by its plug-out time. The 4th
constraint ensures that the EV charging does
not violate the feeder capacity. A linear optimization is then implemented to
determine the optimum schedules Pi,k. The optimization is repeated periodically at
every 15 minutes by considering observed variations in demand, electricity prices,
and plug-in and plug-out of the EVs in the preceding slot(s).
3.2.1.2 Secondary DR control
A SDRC is implemented to execute the DLCDRs, whereby the DRRs are
directly controlled by the aggregator. Typically, the SDRC is executed when
emergency demand regulation is desired and the TDRC is incapable to meet the
strict up/down regulations requirements. Exploiting the prompt response capability,
ranging from few seconds to minutes, the SDRC can be realized as an intra-hour or
intra-day balancing resources. As illustrated in SDRC loop in Fig. 3.2, the
aggregator optimally distribute the demand to be regulated among the candidate
DRRs based on their current operating mode. The desired demand regulation, PDR, is
optimally allocated among the candidate EVs as follows:
'
1
min. .( )EVN
i i i
i
C P P
(3.5)
'
1
'min, max,
0
(1 ) 0
( )
.
EV
i DRi
i DR
N
i i DR
i
i i i
SOC if Psuchthat C
SOC if P
P P P
P P P
(3.6)
where Pi and P’i denote charging power of ith
EV before and after SDRC execution,
and Ci is an optimization coefficient which is (1-SOCi) for up-regulation and SOCi
for down-regulation. The objective is formulated such that EVs having lower SOC
contribute first during down-regulation and vice versa. The constraints are designed
to ensure the desired demand regulation as well as to respect the charger limits. It
should be noted that the PDR is limited to the maximum regulation capacity of the
EVs if the PDR exceeds the regulation capacity of the EVs.
3.2.1.3 Primary DR control
A PDRC is implemented for executing the ADRs, where the DRRs
automatically adjust their power when locally monitored system parameter deviates
beyond the preset limits. The PDRC is suitable for real-time local voltage support
leading to its prompt response (in the order of seconds). The PDRC is designed
with a power-voltage (P-V) droop and is implemented at every DRR such that the
DRR continuously monitors voltage at the POC to adaptively adjust the power as:

CHAPTER 3. INTELLIGENT SMART GRID CONTROL ARCHITECTURE
37
,
,, min,
, min,
min,
1
i th i
th ii th i i
th i i
i
P V V
V VP P V V V
V V
o V V
(3.7)
where Pi is the charging power, Vth,i is the threshold voltage beyond which the
droop starts operating, Vmin,i is the minimum allowable voltage beyond which the
EV stop operation, and the subscript ‘i’ depicts the EV index. It should be noted
that EVs connected to different nodes in the network have different voltage
thresholds. Particularly, the EV connected to a node closer to a SS has higher Vth
and Vmin compared to the EV connected to the node far from the SS. This is
established to enable a fair participation of every EV in supporting the network
rather than stressing the farthest node EV by using constant Vth and Vmin. Procedure
to compute Vth and Vmin sets for every EV is described in Section II.C of J1.
3.2.1.4 Coordination among the HCA loops
The aforementioned DR control loops are designed such that action of each loop
provides time delayed backup to the others, thereby creating increased operational
flexibility to every loop. Any deviations that might be caused due to TDRC can be
compensated in real-time by the PDRC, thereby providing increased operational
flexibility to the TDRC. Similarly, any deviations in the operational schedules of
the DRRs due to PDRC get compensated while updating the schedules by the
TDRC in the succeeding slot, thereby providing time-delayed backup to the PDRC.
In addition to the TDRC and PDRC, an event driven SDRC is integrated to take
care of any emergency conditions requiring up/down regulations. As such, the HCA
establish coordination among the loops to exploit the demand flexibility for
supporting network from day ahead planning up to the real-time operation.
3.2.2. Communication Perspective of HCA
A combination of wired and wireless technologies should be integrated to the
HCA to establish bidirectional communications among the actors. In particular, a
robust fiber-wireless access network and a wired optical network are implemented
to exploit high capacity, longevity, and reliability of optical networks with the
ubiquity and availability of their wireless counterparts. Communication
technologies are selected based on the requirement at various control levels of the
proposed HCA. As presented in Table 3.2, the message interval and required
latency are specified for each control loop to exploit them for various grid
applications, such as real-time voltage, congestion management, peak saving etc. In
addition, communication distance is chosen on the basis of maximum expected
distance between the involved actors to execute the particular control action.
Table 3.2 Communication requirements for HCA.
Level From To Distance (km) Interval Latency (sec)
TDRC CA DRR 0-25 15 min 60
SDRC CA DRR 0-25 Variable 15
PDRC HEM DRR 0-0.05 Variable 1

38
The communications infrastructure for the proposed control scheme depicted in
Fig. 3.3 is selected on the basis of aforementioned communication requirement as
well as the cost of currently available communication technologies. In particular, a
ZigBee for HANs, WiMAX for cost-effective NAN coverage, and dedicated optical
fibers for reliable interconnection of CA and data concentrator, are integrated into
the HCA to make it operational. Basically, communication framework as illustrated
in Fig. 3.3, has been used to realize the proposed HCA control and coordination.
However, the whole framework may not be needed for execution of every control
level. For instance, HAN is adequate to execute PDRC, whereas, all HAN,
WiMAX, and dedicated fiber are desired to execute the TDRC and SDRC. The
communication technologies which are presented in detail in Section IV of the ‘J1’
are briefly outlined as follows.
Fig. 3.3 Proposed communication infrastructure for HCA implementation.
1) HAN - ZigBee: ZigBee compliant with IEEE 802.15.4 is used for HANs with a
capacity of 250 Kbps per zone (e.g., per home). According to Eq. (2) in [16], the
access delay of IEEE 802.15.4 can be approximated by
( )acHAN BO frame TA ACK IFSD T T x T T T (3.8)
where TBO takes into account the backoff period, Tframe(x) is the transmission delay
for a payload of x bytes, TTA is the turnaround time, TACK is the transmission time
for an acknowledgement frame, and TIFS is the interframe space time. For payload
sizes of L greater than xmax, the adjusted access delay is approximated as follows:
max. . .acHAND a L L x b (3.9)
where ‘a’ denotes the delay to transmit a single byte, ‘b’ is the overhead delay
while transmitting a frame, and L is the number of bytes in the message. The
maximum achievable throughput in a given household is approximated by
.8 acHANL D and the overall delay corresponds to
acHAN HAND D .
2) DRRs and data concentrator – WiMAX: For the access network area, which
interconnects the DRRs and data concentrator, WiMAX is used. The overall
transmission process in WiMAX consists of successive upstream and downstream
sub-frames, whereby both form a WiMAX frame. In the upstream direction, a given
Smart applicance
HEM
EV
Smart applicance
HEM
EV
Smart applicance
HEM
EV
Central aggregator
WiMAX WiMAX
Data concentrator
Optical WiMAX ZigBee
Consumers

CHAPTER 3. INTELLIGENT SMART GRID CONTROL ARCHITECTURE
39
subscriber station first competes for sub-channels by sending a bandwidth request
frame to the base station at the beginning of a WiMAX frame. Note that WiMAX
frames have a fixed duration of Twi frame. Then, the base station sends back a
bandwidth response containing the scheduling allocations to the subscriber station.
Therefore, the approximate upstream delay Dwi
up consists of a number of WiMAX
frames with duration Twi, which largely depends on the traffic intensity.
3) Interconnection of CA and Data Concentrator – Dedicated Fiber: For reliable
communication between the CA and data concentrator, dedicated fiber links with 1
Gbps (denoted by c) duplex capacity is considered. Since point-to-point optical
links are deployed, the upstream delay is estimated as follows:
,
,
dL.8( ) .
200000
l caopup lD l
c (3.10)
where Ø(pl) corresponds to the queuing delay with a traffic intensity of pl from a
data concentrator l to the CA, the second term is the transmission delay, and the last
term is the propagation delay (including the distance (km) from data concentrator l
to the CA, dl,ca). The downstream delay (from CA to a data concentrator) Dop
down,l
can be defined similarly, but based on the traffic intensity pca,l at the CA interface.
Therefore, a message from a given node in the HAN to CA will experience a total
delay equal to (3.11) and a delay equal to (3.12) from the CA to a node in the HAN.
,opwi
HAN CA HAN up up lD D D D (3.11)
,op wi
CA HAN down HANdown lD D D D (3.12)
3.2.3. Power and Communication Co-simulation
To investigate the performance of the proposed HCA, a power and
communication co-simulation model is developed using off-the-shelf simulators,
particularly using RTDS for the power simulation and OMNeT++ for
communication simulation. In addition, MATLAB is used for computations and to
make interface between the OMNeT++ and RTDS, thereby establishing overall co-
simulation framework as depicted in Fig. 3.4.
Fig. 3.4 Proposed co-simulation framework.
In particular, droop based PDRC is implemented at every EV location in the
RTDS, whereas the TDRC and SDRC are implemented in MATLAB for computing
optimum set-points for every EV. The computed set-points are then channeled
RTDSOMNeT++ MATLAB
(computation & interfacing)Socket
send(m, src, dest, t)
m, src, dest, t+∆ = rcv( )
Time frame Time frame
(power simulation)
(P1 , P2,.….PNEV )
(SOC1 ,.….SOCNEV )
(communication simulation)

40
through the OMNeT++ to the respective EVs in the RTDS for control realization.
Moreover, MATLAB continuously records actual charging power and SOC of each
EV and voltages at every node from the RTDS using ‘Listenonport’ feature of the
RTDS. The optimization is updated periodically in MATLAB based on the
recorded data from the RTDS and dispatched to the respective EVs using the
aforementioned procedure.
The overall co-simulation is application-driven. At the beginning of a co-
simulation, a TCP socket between MATLAB and OMNeT++ is established so that
both simulators interact each other. Both simulators maintain a time frame as the
co-simulation progresses. As the application written in MATLAB runs the HCA
model, when a message must be send from a given source ‘src’ to destination
‘dest’, a message is sent to the OMNeT++ co-simulation scheduler containing the
message ‘m’ and current time ‘t’. Then, OMNeT++ progresses until a delay ‘∆’ and
sends back message m to MATLAB when it has reached the destination. As delays
are experienced in the communication network, the delay ∆ is specified such that
MATLAB is aware of the exact reception time (t + ∆). Whenever the message from
the OMNeT++ is received by the MATLAB, the message is dispatched to the
respective EV(s) at the RTDS. By doing so, the communication end-to-end delay is
quantified and both simulators affect each other.
3.3. Test System Modeling and Characterization As illustrated in Fig. 3.5, a LV distribution grid fed by a 10/0.4kV, 400 kVA
distribution SS is taken as a test case network. It should be noted that same network
is used unless specified. The test network supplies 45 detached residential houses.
Fig. 3.5 Single line diagram of test network.
Key technical parameters of the transformer and cable are illustrated in Table
3.3 and detailed line parameters of each cable branch is depicted in Table 3.4. Since
the cable lengths are relatively short, ‘short-line model’ has been used for modeling
the cables. Due to relatively shorter length and higher cable size, the test network is
2 3 4 51
6 7 8 9
12 13 14 1511 16 1710
44 45 43 40
41 39 3842 36 34
21 19 18
25 23 22 20
33 31 28 26 29 2724
37 35 32 30
N1
N3
N4
N5
N6
N15
N14
N8N7
N9
N10
N12N11
N13
N2
L_
2-3
L_3-4
L_
5-6
L_
9-1
0
L_3-7
L_7-8 L_8-9
L_
10
-11
L_
4-5
L_
14
-15
L_
7-1
4
L_
12
-13
L_11-12
Non-
flexible
Load
Flexible
load (PV/
EV/HP)

CHAPTER 3. INTELLIGENT SMART GRID CONTROL ARCHITECTURE
41
significantly strong with regards to accommodate additional load and/or generation.
Therefore, minimum and maximum voltage limits in this study are taken as 0.94
and 1.04 pu respectively even though permissible voltage in Denmark is ±10%.
Table 3.3 Test network characteristics.
Table 3.4 Line parameters of test network.
Moreover, consumer loads are modeled as three phase constant power loads
with a lagging PF of 0.95, unless specified. First, peak demand of every consumer
is computed using Velander correlation as follows.
max, *PiD W q W (3.13)
where DP
max,i is the peak demand of ith
consumer (kW), W is the annual electricity
consumption (MWh), and ρ and q are Velander coefficients which are taken as 0.29
and 2.09 respectively for this study. Those values correspond to values used by the
DSO (SEAS-NVE) for planning. Fig. 3.6 illustrates a yearly variation, March 2012
through February 2013, of demand and generation in the test feeder. Demand
profile of a maximum demand day over the year, Fig. 3.7a), is taken for analyzing
worst case scenario from demand perspective. Similarly, generation profile of a
maximum generation day Fig. 3.7b) is used for analyzing worst case scenario from
generation perspectives.
Fig. 3.6 Yearly variation of demand and generation.
It can be observed that generation is very low during maximum demand day and
vice versa. Therefore, maximum demand with no generation is considered as the
worst case from demand perspective and maximum generation is considered as the
worst case from generation perspective.
Modeling of EVs: From the power system perspective, EVs are basically seen as
electrical loads. In particular, two types of EVs, namely 11 kW, 25 kWh and 4 kW,
Equipment Rating Ressistance/Reactance Type
Transformer 400 kVA 4.64/18.64 mΩ 10/0.4 kV
Main Cable 335 A 4.64/18.64 mΩ 4*150 mm2 (AL PEX)
Consumer Cable 25 A - 4*10 mm2 CU/ 4*16 mm2 AL
S. N. 1 2 3 4 5 6 7 8 9 10 11 12 13 14
From N1 N2 N3 N4 N5 N3 N7 N8 N9 N10 N11 N12 N7 N14
To N2 N3 N4 N5 N6 N7 N8 N9 N10 N11 N12 N13 N14 N15
R (Ω) 0.00464 0,0232 0,0101 0,0132 0,0180 0,0166 0,0052 0,0083 0,0072 0,0075 0,0072 0,0072 0,0095 0,0077
X (Ω) 0.01864 0,0087 0,0038 0,0050 0,0068 0,0062 0,0020 0,0031 0,0027 0,0028 0,0027 0,0027 0,0036 0,0029
Mar May Jul Sep Nov Jan0
30
60
90
120
150
Months
Dem
an
d (
kW)
Mar May Jul Sep Nov Jan0
20
40
60
80
Months
Gen
era
tio
n (
kW)
Yearly consumption proflie Yearly generation profile

42
16 kWh, are considered for the analysis. The EVs are modeled as constant power
load whose power changes dynamically over time as follows:
Fig. 3.7 Daily load profile for maximum and minimum demand day.
,
,
[0,
0
]Ratedi i i max
i
i i max
P SOC SOCP
SOC SOC
(3.14)
where Pi and PiRated
are charging power and rated power of the ith
EV. Demand
flexibility (Pi) provided by an ith
EV is computed as provided the SOC of the EV
stay within the predefined limits (i.e., SOCi,min<SOCi<SOCi,max).
, ,min
, ,max
.i up i i
i down i i
P P P
P P P
(3.15)
where Pi,up and Pi,down are the up and down regulation potentials, which depends
greatly on current operating state of the EVs. Therefore, the demand flexibility of
the EVs depends on their availability, namely arrival and departure time, and varies
as a function of time. In this study, the EV availability data are configured based on
national transportation survey of light cars in Denmark [15]. In particular, arrival
and departure time of light cars and their availability in a typical working day in
Denmark is illustrated in Fig. 3.8. In this study, plug-in and plug-out times for the
EVs are configured as illustrated in Fig 4 of ‘J1’ by considering national statistical
data presented in Fig. 3.8.
Fig. 3.8 EV arrival/departure and availability over a day.
3.4. Observations and Discussions 3.4.1. Power Performance
The performance of the HCA is investigated by means of 24 hours of power
and communication co-simulation. As described in Section 3.2.1.1, the IFC of the
TDRC is executed once per day, typically at the beginning of the simulation, to
optimally adjust the electricity price. In particular, the IFC maximize the profit by
4 8 12 16 20 24
30
60
90
120
150
a). Maximum demand DayTime (hr.)
Dem
an
d (
kW)
4 8 12 16 20 24
-75
-50
-25
0
25
b) Maximum generation day
Time (hr.)
Dem
an
d (
kW)
Demand
Generation
Total
Demand
Generation
Total
0 4 8 12 16 20 240
0.04
0.08
0.12
0.16
0.2
Hour of day
Pro
bab
ilit
y
a) EV Arrival & Departure
Departure
Arrival
0 4 8 12 16 20 2492
94
96
98
100
b) Availability of EVs for charging over a dayHours of day
EV
av
aila
bil
ity
(%
)
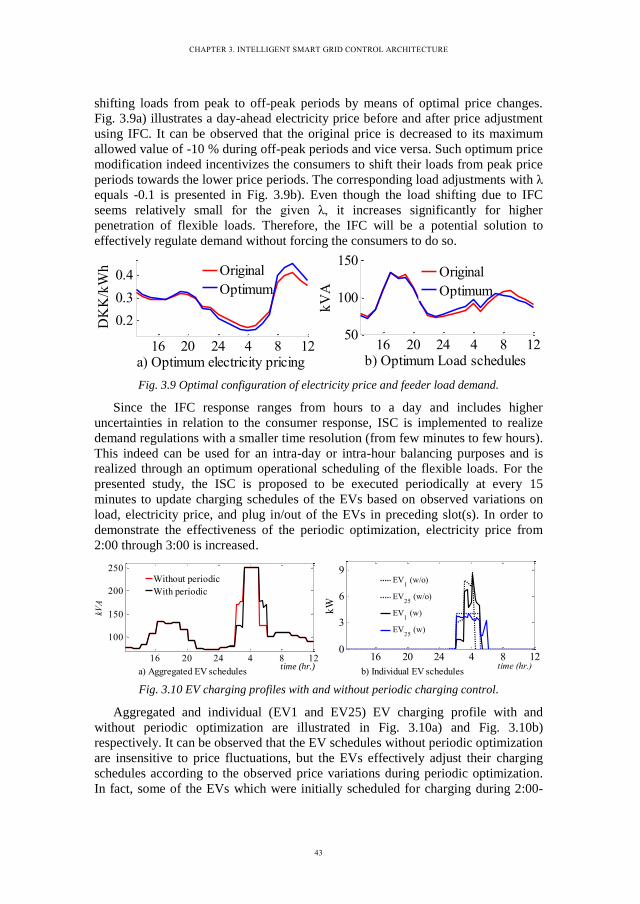
CHAPTER 3. INTELLIGENT SMART GRID CONTROL ARCHITECTURE
43
shifting loads from peak to off-peak periods by means of optimal price changes.
Fig. 3.9a) illustrates a day-ahead electricity price before and after price adjustment
using IFC. It can be observed that the original price is decreased to its maximum
allowed value of -10 % during off-peak periods and vice versa. Such optimum price
modification indeed incentivizes the consumers to shift their loads from peak price
periods towards the lower price periods. The corresponding load adjustments with λ
equals -0.1 is presented in Fig. 3.9b). Even though the load shifting due to IFC
seems relatively small for the given λ, it increases significantly for higher
penetration of flexible loads. Therefore, the IFC will be a potential solution to
effectively regulate demand without forcing the consumers to do so.
Fig. 3.9 Optimal configuration of electricity price and feeder load demand.
Since the IFC response ranges from hours to a day and includes higher
uncertainties in relation to the consumer response, ISC is implemented to realize
demand regulations with a smaller time resolution (from few minutes to few hours).
This indeed can be used for an intra-day or intra-hour balancing purposes and is
realized through an optimum operational scheduling of the flexible loads. For the
presented study, the ISC is proposed to be executed periodically at every 15
minutes to update charging schedules of the EVs based on observed variations on
load, electricity price, and plug in/out of the EVs in preceding slot(s). In order to
demonstrate the effectiveness of the periodic optimization, electricity price from
2:00 through 3:00 is increased.
Fig. 3.10 EV charging profiles with and without periodic charging control.
Aggregated and individual (EV1 and EV25) EV charging profile with and
without periodic optimization are illustrated in Fig. 3.10a) and Fig. 3.10b)
respectively. It can be observed that the EV schedules without periodic optimization
are insensitive to price fluctuations, but the EVs effectively adjust their charging
schedules according to the observed price variations during periodic optimization.
In fact, some of the EVs which were initially scheduled for charging during 2:00-
16 20 24 4 8 12
0.2
0.3
0.4
a) Optimum electricity pricing
DK
K/k
Wh
16 20 24 4 8 1250
100
150
b) Optimum Load schedules
kV
A
Original
Optimum
Original
Optimum
16 20 24 4 8 12
100
150
200
250
time (hr.)
kVA
Without periodic
With periodic
16 20 24 4 8 120
3
6
9
time (hr.)
kW
EV1 (w/o)
EV25
(w/o)
EV1 (w)
EV25
(w)
a) Aggregated EV schedules b) Individual EV schedules
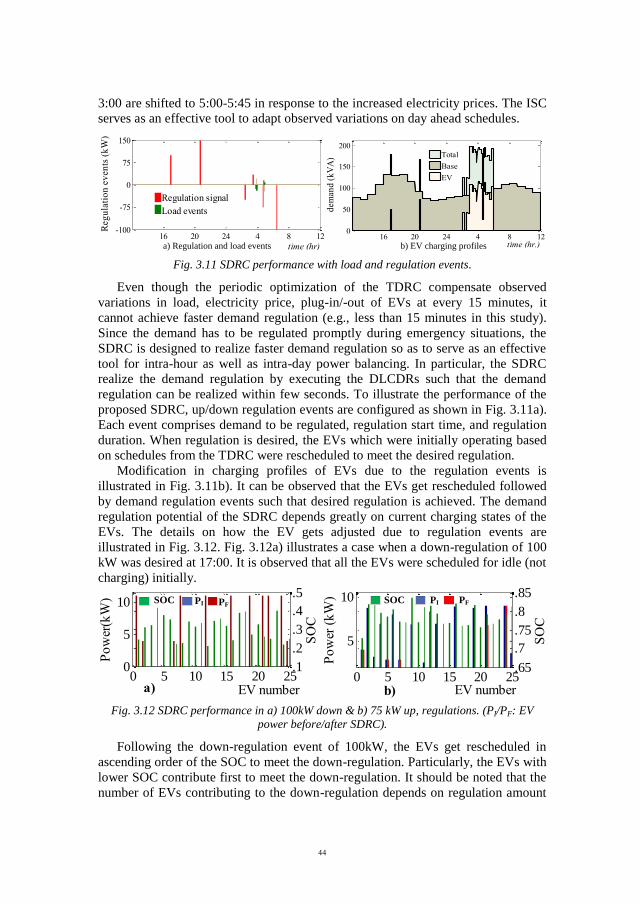
44
3:00 are shifted to 5:00-5:45 in response to the increased electricity prices. The ISC
serves as an effective tool to adapt observed variations on day ahead schedules.
Fig. 3.11 SDRC performance with load and regulation events.
Even though the periodic optimization of the TDRC compensate observed
variations in load, electricity price, plug-in/-out of EVs at every 15 minutes, it
cannot achieve faster demand regulation (e.g., less than 15 minutes in this study).
Since the demand has to be regulated promptly during emergency situations, the
SDRC is designed to realize faster demand regulation so as to serve as an effective
tool for intra-hour as well as intra-day power balancing. In particular, the SDRC
realize the demand regulation by executing the DLCDRs such that the demand
regulation can be realized within few seconds. To illustrate the performance of the
proposed SDRC, up/down regulation events are configured as shown in Fig. 3.11a).
Each event comprises demand to be regulated, regulation start time, and regulation
duration. When regulation is desired, the EVs which were initially operating based
on schedules from the TDRC were rescheduled to meet the desired regulation.
Modification in charging profiles of EVs due to the regulation events is
illustrated in Fig. 3.11b). It can be observed that the EVs get rescheduled followed
by demand regulation events such that desired regulation is achieved. The demand
regulation potential of the SDRC depends greatly on current charging states of the
EVs. The details on how the EV gets adjusted due to regulation events are
illustrated in Fig. 3.12. Fig. 3.12a) illustrates a case when a down-regulation of 100
kW was desired at 17:00. It is observed that all the EVs were scheduled for idle (not
charging) initially.
Fig. 3.12 SDRC performance in a) 100kW down & b) 75 kW up, regulations. (PI/PF: EV
power before/after SDRC).
Following the down-regulation event of 100kW, the EVs get rescheduled in
ascending order of the SOC to meet the down-regulation. Particularly, the EVs with
lower SOC contribute first to meet the down-regulation. It should be noted that the
number of EVs contributing to the down-regulation depends on regulation amount
16 20 24 4 8 12-100
-75
0
75
150
time (hr)
Reg
ula
tio
n e
ven
ts (
kW
)
Regulation signal
Load events
16 20 24 4 8 120
50
100
150
200
time (hr.)
dem
and
(k
VA
)
Total
Base
EV
a) Regulation and load events b) EV charging profiles
5
10
Po
wer
(k
W)
EV number
0 5 10 15 20 25.65
.7
.75
.8
.85
SO
C
0
5
10
Po
wer
(kW
)
EV number
0 5 10 15 20 25.1
.2
.3
.4
.5
SO
C
data1
data2
data3
data1
data2
data3
b)a)
PI PFPI PFSOCSOC

CHAPTER 3. INTELLIGENT SMART GRID CONTROL ARCHITECTURE
45
as well as initial operating states of the EVs. Similarly, Fig. 3.12b) illustrates the
case when an up-regulation of 75 kW was executed at 5:00. It is observed that most
of the EVs which were initially scheduled for charging get adjusted to meet the
desired up-regulation. In particular, the EVs contribute to the up-regulation
according to descending order of the SOC, for instance, the EV having higher SOC
contribute first to meet the up-regulation.
Fig. 3.13 EV charging profiles demonstrating PDRC performance.
Despite having superior performance of the periodic control capability of the
TDRC and an event driven capability of the SDRC, they cannot provide real-time
network support. Therefore, a droop based PDRC, as described in Section 3.2.1.3,
is implemented at every EV location for real-time voltage support. In particular, the
EV droop continuously monitors local voltage and automatically adjusts the EV
charging once the monitored voltage deviates beyond predefined limits. Fig. 3.13
illustrates EV charging profile considering the PDRC and voltages at far end nodes
(N13 and N15) respectively. It can be observed that the EV charging adapts their
charging power when voltage has dropped below the acceptable limits of 0.94 pu
due to load change events illustrated in Fig. 3.11a).
Fig. 3.14 Amplified plot to illustrate PDRC.
An amplified view of load events (Fig. 3.11a)), node voltages (Fig. 3.13b)), and
charging profiles of single EV (EV18 connected to far end node N13) are illustrated
12 16 20 24 4 8 12.92
0.94
0.96
0.98
1
Vo
ltag
e (
pu
)
time (hr.)
N13
N15
16 20 24 4 8 12
100
150
200
250
time (hr.)
Dem
an
d (
kW
)
without primary
with primary
a) EV charging schedules b) Voltage profiles
3.30 3.45 4.00 4.15 4.30 4.45
.94
.96
.98
Vo
ltag
e (
pu
)
a) Voltage at far end nodes 13 and 15
3.30 3.45 4.00 4.15 4.30 4.45-25
0
25
b) Load events
kW
3.45 4.00 4.15 4.30 4.450
5
10
c) EV18
profile with and without primary control
kW
N13
N15
withoutwith

46
in Fig. 3.14 to provide closer view on how the PDRC adapts to real-time load
variations. It is observed that the EV droop is insensitive to a load variations (Fig.
3.14b)) unless the load change lead to violations in voltage. However, if the load
variations event lead to the voltage violations, as seen from (Fig. 3.14a)), the EVs
whose voltage at the POC get violated adjust their charging power to adapt to the
load variations. In particular, the adaptiveness of the EV charging based on the
voltage is presented in Fig. 3.14c). It can be seen that, following the voltage
deviations at 3:34 and at 4:32, the EV is adjusting its charging power with an effort
to bring the voltage back to limits. Thus, the primary control effectively support the
network in real-time by acting on the voltage locally.
3.4.2. Communication Performance
The communication infrastructure proposed in Section 3.2.2 is implemented in
OMNeT++ and the performance is demonstrated in terms of latency. In particular,
delays at each stage namely primary, secondary, and tertiary are recorded for the
entire simulation and the performance is evaluated in terms of average and
maximum delays. The configurations of different communication technologies,
namely ZigBee IEEE 802.15.4 HANs, WiMAX NAN, and dedicated fibers, are
presented in terms of average distance and upstream/downstream capacity as shown
in Table 3.5. Similarly, Table 3.6 shows the average and maximum delays observed
at all stage levels. The stage delay is measured as the time elapsed between the first
generated message and last message received in a given stage (PDRC, SDRC, or
TDRC). The presented results represent the maximum and average delays of the
entire 24 hours simulation. As shown, all stages meet the requirements listed in
Table 3.5, even by taking the maximum stage delays.
Table 3.5 Communication configuration.
As shown in Table 3.6, the PDRC response is very prompt (approximately 10
milliseconds by considering maximum delays), thereby facilitates the DRRs to be
effective for real-time voltage support. Similarly, the maximum delay of
approximately 250 milliseconds in the SDRC shows that the SDRC can be
effectively implemented to realize faster demand regulation particularly for
emergency up/down-regulations. Similarly, the observed delay in TDRC is low
enough to be implemented for tertiary frequency regulations as well as for other
grid applications such as peak shaving, load shifting etc. due to time requirement
for dispatching the optimal EV charging schedules and electricity prices from the
CA to every consumer. It is observed that the delay in SDRC is higher than that of
the PDRC and TDRC. In particular, the higher delays in the SDRC are observed as
SDRC execution desire round trip communication between the CA and consumer.
Network Average distance Upstream/Downstream capacity
ZigBee 50m 250 Kbps
WiMAX 10km 23.5/11.4 Mbps
Dedicated fibers 30km 1/1 Gbps

CHAPTER 3. INTELLIGENT SMART GRID CONTROL ARCHITECTURE
47
Table 3.6 Communication performance in terms of stage delay.
For instance, to execute the SDRC, the CA has to fetch the status of individual
EVs, make the decision followed by receipt of the status from them, and dispatch
the final schedules to the candidate EVs again. Nevertheless, the delay is reasonably
lower to be implemented for secondary frequency regulations and for other
emergency regulation requirements. Therefore, it can be seen that the proposed
communication infrastructure and control strategies perform effectively to deploy
various DR categories as well as to establish coordination among their response as
intended for the HCA implementation.
3.5. Chapter Summary A key idea of the DR is to make temporary load adjustment by reducing or
rescheduling electricity consumption pattern of the consumers. Indeed,
simultaneous deployment of multiple DRs is desired to deploy the flexibility for
maximal network support. Therefore, a HCA is developed as a platform to establish
coordinated control among simultaneously existing DRs in this study. Different
control strategies, ranging from a day ahead to real-time, are executed by the HCA
to maximize the grid support from the DRRs. The HCA ensures a time-graded
coordination among available DRs such that actions of each DR category provides
time-delayed backup to each other. In particular, the coordination among the DR
categories is established by using three DR control loops, namely primary,
secondary, and tertiary. As response time increases from inner primary loop
towards the outer tertiary, each inner loop backup the outer loop by executing
controls in shorter time resolutions. Moreover, every outer loop provides a time
delayed back-up to the inner loop such that any deviation in the operation from the
scheduled value is compensated using periodic control capability of the outer loops
in the succeeding slots.
To investigate the proposed HCA in a multidisciplinary manner, power and
communication co-simulation has been performed. In particular, the performance of
the proposed HCA is demonstrated through power simulation performed in RTDS
and the communication simulation performed in OMNeT++. Interface between the
OMNeT++ and RTDS is ensured through MATLAB. The co-simulation results
demonstrated that the HCA effectively coordinates simultaneously existing DRs,
thereby facilitating maximum utilization of the DR potential. Moreover, the
proposed communication infrastructure based on ZigBee, WiMAX, and dedicated
fiber facilitates the HCA to operate as desired.
The HCA demonstrates an effective framework to exploit various DR programs
for supporting network. In particular, the TDRC, which is deployed to execute
PDRs and DDDRs, is used for day ahead operational planning. By using the
periodicity of the TDRC, any intra-day power imbalances can be addressed.
Further, any emergency demand regulation need is taken care of by the SDRC by
Metric Average delay (sec.) Maximum delay /sec.)
PDRC 0.008923 0.010088
SDRC 0.2271 0.2313
TDRC 0.0389 0.0413

48
executing DLCDRs. As the SDRC response varies from few seconds to few
minutes, the SDRC can be used as spinning reserve for intra-hour/-day balancing.
Moreover, the PDRC acts to support the network in real-time by adjusting the
consumption once the monitored network parameters deviates beyond limits.
Therefore, the PDRC serve as an effective resource to support the network locally
by acting to voltage. As such, the coordinated operation of three loops maximizes
not only the network support capability of the DRRs but also the financial benefits
to the consumers.
Detailed control strategies to manage constraint violations in the LV network
are presented in the following chapter presents. Furthermore, further investigation
on strategies to exploit demand flexibility from active loads, namely EVs and HPs,
are presented in the following chapter such that the developed strategies fit to HCA
framework presented in this chapter.

49
Chapter 4. Development of DR Control
Strategies
This chapter presents device specific DR control strategies designed for exploiting
demand flexibility from various residential loads. In particular, the chapter
contains a summary of DR control strategies documented in the publications J2,
C2, C3, C4, and C5, and presents detailed on their effectiveness.
4.1. Introduction As mentioned in the preceding chapter, control strategies to exploit demand
flexibility are contingent to load characteristics and operational behaviors of the
consumers. For instance, the control strategies for HP may differ significantly
compared to the one for EV due to difference in the nature of their operation. In
addition, the DR control strategies also depend on applications. For instance,
application of demand flexibility for real-time network support such as real-time
voltage support desires control latency of fraction of seconds, whereas, for
applications such as peak shaving, load shifting, congestion managements etc.,
control strategies with latencies of few minutes to few hours may be enough. To
this end, control strategies are designed per load type and applications.
First, a DR control strategy is developed for management of constraint
violations in SG. In particular, a combination of centralized and decentralized
control scheme is implemented to exploit demand flexibility of the consumer to
maintain voltage and current constraints within limits. Next, a voltage based
dynamic DR, whereby the demand regulation is realized by regulating supply
voltage at the SS level is presented. Load type specific DR control strategies are
then presented considering EV and HP as potential flexible loads. In particular, the
DR control strategies are designed to i) address anticipated issues due to high
penetration of flexible loads (EVs and HPs) and ii) exploit the demand flexibility
from them for various network supports, such as real-time voltage support and
congestion management etc. Finally, a simple and effective approach to increase
demand responsiveness of the consumers in a residential distribution system is
presented. A brief summary of the control strategies presented in J2, C2, C3, C4,
and C5, are described chronologically as follows:
4.2. Constraints Violations Management This section presents a summary of control strategies developed for constraint
violation management in LV distribution grids, which is documented in detail in J2.
In particular, a combined centralized and decentralized control is implemented to
exploit flexible demand of consumers to keep the grid constraints within limits. The
details of the proposed methods and observed outcomes are presented as follows:

50
4.2.1. Proposed Methodology
The proposed active load control strategy to manage constraint violations in LV
distribution grids is realized in two steps, namely a proactive centralized and a
reactive decentralized control. The former is used to manage constraints violations
(voltage and current) in a proactive way considering estimated operational scenarios
while the latter is used to react to the observed voltage violations in real time. The
key idea of implementing the combined centralized-decentralized control scheme is
to deploy better controllability and network visibility of the centralized control
together with prompt response capability of the decentralized control.
The centralized control operates every hour and is responsible for managing an
hour ahead load distribution so as to relieve any upcoming grid limit violations.
Thus, the controller utilizes expected load consumption at every node. Particularly,
given the consumers’ forecasted load, a load flow calculation is conducted to
identify any current and/or voltage problems. If any violation exists, optimization is
performed to compute minimum amount of flexibility to be deployed to alleviate
the grid violation. The outcome of this optimization, which is flexibility offer
requests to consumers, is then dispatched to the consumers. The detailed
mathematical formulation of the centralized control is included in Section II of J2.
It is worth mentioning that consumers located at weak spots in the network have
higher impacts in resolving the grid constraints. Therefore, minimization of total
flexibility to be activated for resolving given grid constraints always utilizes
flexibility from the consumers connected at the weak spot, which is not fair
especially from consumer’s perspective. Therefore, to ensure a fair utilization of
flexibility from every consumer, their optimization coefficients are computed
utilizing the history of flexibility utilization. This gives higher coefficient for the
consumer whose flexibility is used more and vice versa and hence ensures fairness
in terms of flexibility activation from different consumers.
Since the centralized control is executed periodically to exploit the average
hourly flexibility, it does not facilitate intra-hour controllability. As such, any intra-
hour power volatility stemming from forecast errors or load variations might lead to
network violations during actual operation. Therefore, a decentralized control is
implemented to provide real-time voltage support by adapting the observed
variations. The decentralized control, which is designed as a linear P-V droop, is
implemented at every consumer so as to execute control actions once the monitored
voltage deviates beyond the predefined limits. The details of the decentralized
control are presented in Section III of J2.
One of the potential challenges in designing the droop for the decentralized
control is to enable every consumer to participate to support voltage. As the voltage
is local problem, constant droop setting forces the consumers at the weak spot,
normally the farthest end node, to use its flexibility at every voltage violations. To
ensure fair participation of every consumer, droop parameters are set differently for
the consumers connected at different nodes. In particular, higher threshold voltage
(the voltage beyond which the droop start operation) and minimum voltage (beyond
which the droop uses full flexibility) are set for the nodes closer to SS. The
procedure of the aforementioned voltage assignment is detailed in Section III in J2.

CHAPTER 4. DEVELOPMENT OF DR CONTROL STRATEGIES
51
Exploiting the capability of the proposed control scheme, the centralized control
can additionally be used to trade flexibility in balancing market while the
decentralized control can be used to trade flexibility in the regulating market.
4.2.2. Observations and Discussions
To demonstrate the performance of the proposed method, a LV distribution grid
as shown in Fig. 2 in J2 is used. To create violations in the grid, the consumption of
each consumer is increased. Moreover, the flexibility limits of each consumer are
set to 20% of the load. This might be a somewhat big number for contemporary
grids, but might be more rational in the near future, when flexible device
penetration will increase. The details of the test network and data used for
simulation are presented in Section IV.A in J2.
Simulation results of the centralized control from the 22nd to the 31st of January
are displayed in Fig. 4.1. In this figure, blue corresponds to the grid behavior
without control whereas green refers to results obtained after applying the
centralized control. Judging from Fig. 4.1a), it is apparent that the grid is heavily
loaded, that is to say voltages up to 0.93 pu are recorded. By implementing the
centralized control scheme, this threshold was respected most of the times.
Nevertheless, there were some incidences where the available flexibility did not
suffice to sustain the voltage at 0.95 pu, i.e., the voltage limit experienced
relaxation. This is depicted by the gray spikes which can be observed in the green
area. Similarly, Fig. 4.1b) illustrates the recorded overloading before control. In all
occasions the relevant current problem is resolved using the centralized control.
Then, Fig. 4.1c) depicts the total load at the transformer connection before and after
implementing the control. In this figure, it is evident that the proposed framework
resulted in peak shaving. Finally, the total available (blue) versus the total activated
(green) flexibility is presented in Fig. 4.1d). As can be seen, only a percentage of
the available flexibility is employed to solve most grid issues, except for some
instances when voltage relaxation is needed.
Fig. 4.1 Sample results. a) Minimum voltage at the feeder, b) Maximum overcurrent
recorded at the feeder, c) Transformer load, and d) Available versus activated flexibility
As described in the preceding section, different weights are assigned to different
consumers, using the procedure described in Section II in J2, to alleviate those
violations in a fair way. To exhibit this feature, a problematic time, namely 8 p.m.
January 28th, was chosen and the problem was repetitively resolved by the
centralized control for different weights i.e. 0.1, 0.4, and 0.9. Since the weight
0.96
22
0.95
0.94
0.93
23 25 26 27 28 29 30 31January day
(a)
(b)
(c)
January day(d)
0.05
0.04
0.03
0.02
0.01
0
Min
. V
olt
age
(pu)
Max
. O
ver
curr
ent
(kA
)
250
200
150
100
Dem
and
(k
W)
50
40
30
20
10Fle
xib
ilit
y (
kW
)
24 22 23 25 26 27 28 29 30 31240

52
emulates a “forgetting” factor in exponential smoothing procedures, the simulation
is performed with moderate weight, (0.4) to keep reasonable history of flexibility
used by the consumer. The impacts of different weights in the fairness realization
are depicted in Fig. 4 of J2 and their significance is described in Section IV of J2.
To demonstrate the performance of the decentralized control, a 48 hour time-
sweep simulation (28th
to 30th
January) is performed for three different cases. The
first case is used to demonstrate the performance of the decentralized control in the
perfect system where forecasting error and load variations are absent. In this case,
the voltages throughout the network remain within the limit even without using the
decentralized control as there are no load variations in the loads after the centralized
control is executed. As shown in Fig. 6 of J2, the decentralized control utilizes
flexibility at certain time slots and increases the voltage, even though there are no
violations. The extra flexibility utilized by the decentralized control provides a safe
operational margin to compensate any unexpected real-time variations of the load.
12 24 360
1
2
Fle
xib
ilit
y (
kW
)
Time (h)
(a)
12 24 36
0.96
0.965
0.97
Volt
age
(pu)
Time (h)
(b)
12 24 360
1
2
Fle
xib
ilit
y (
kW
)
Time (h)
(c)
12 24 36
0.945
0.95
0.955
0.96
Volt
age
(pu)
Time (h)
(d) Fig. 4.2 Simulation results with (green) and without (blue) control a) Flexibility of consumer
14, b) Voltage at N14, c) Flexibility of consumer 26, and d) Voltage at N26.
The second case is used to demonstrate the performance of the decentralized
control when random variations in load are present. In particular, random noise of
±20% is created to emulate the load variations. It is observed from Fig. 4.2 that the
random noise leads to voltage violations if no control is implemented. However,
when decentralized control is implemented, every consumer provides their
flexibility based on availability to improve the voltage quality. It is observed that
the voltage is improved significantly compared to the case without control. In
particular, consumer 26 uses a significant amount of flexibility in an effort to
support the voltage. Nevertheless, as illustrated in Fig. 4.2a) and Fig. 4.2b),
upstream consumers also contributes towards voltage support. The contribution of
upstream consumers to voltage support is clearly seen by the increase in voltage of
consumer 26 when having no available flexibility. It should be noted that if the

CHAPTER 4. DEVELOPMENT OF DR CONTROL STRATEGIES
53
voltage deviations are very large, the decentralized control improves the voltage
with its available flexibility, but may not be able to fully solve the problem. This
fact is depicted by small deviations of voltage at node 26 even using the control.
Finally, the last case is used to demonstrate impacts of voltage thresholds to the
performance of the droop. Particularly, low, medium, and high values of voltage
threshold are investigated. As observed in Fig. 8 of J2, high threshold voltage
forces the consumer to use higher flexibility despite the voltage is above the limit.
However, activating a lot of flexibility when not needed is undesirable. On the
contrary, low threshold settings activate a very low amount of flexibility, thus
restricts the use of extra flexibility when not needed. To avoid excess or limited
activation of available flexibility, the aforementioned cases were studied with
moderate threshold voltage. Thus, the combined centralized and decentralized
control scheme is an effective way to manage grid violations. In addition, the
proposed method can be used for trading flexibility in hourly balancing market
through the centralized and in regulating market through the decentralized control.
4.3. Voltage Controlled Dynamic DR The key idea of VCDR is based on the fact that power consumption of an
electrical load is a function of operating voltage. As a result, demand of the load
can be regulated to some extent by regulating the operating voltage. Since the
degree of voltage dependency is contingent on load type (e.g., constant current,
constant power, constant impedance, hereafter called ZIP), this study realizes
demand regulation by exploiting the voltage dependencies of the loads. The
effectiveness of the proposed method is investigated for various proportions of load
types. The proposed methodology and outcomes, summarized on the basis of
publication C2, are described in the following:
4.3.1. Proposed Methodology
The implementation of VCDR is accomplished in three stages. First, an adaptive
model is developed to determine voltage dependency of the feeder level aggregated
load. This is the foremost important step as demand regulation potential depends
greatly on the voltage dependency of the loads. In particular, an adaptive voltage
dependency computation method is implemented to compute near real-time voltage
dependency of the load. Following the voltage dependency computation, the
required voltage setting at MV/LV substation is computed to realize desired
demand regulation by using the voltage dependency of the load computed in the
first stage. Finally, a new voltage estimation technique, whereby the voltage
estimate of nodes is updated with periodic measurement data, is implemented to
ensure that node voltages are within acceptable limits following the realization of
the proposed control methodology. The details of the mathematical formulation of
each stage are described in Section II of C2 and the details about the
implementation of the proposed VCDR are illustrated in Fig. 2 of C2.
4.3.2. Observations and Discussions
The implementation of VCDR is accomplished in three stages. First, an adaptive
model is developed to determine composite voltage dependency of the feeder level

54
aggregated load. This is the foremost important step as demand regulation potential
depends greatly on the voltage dependency of the loads. In particular, an adaptive
voltage dependency computation method is implemented to compute near real-time
voltage dependency of the load. Following the voltage dependency computation,
the required voltage setting at MV/LV SS is computed to realize desired demand
regulation by using the voltage dependency of the load computed in the first stage.
Finally, a new voltage estimation technique, whereby the voltage estimate of nodes
is updated with periodic measurement data, is implemented to ensure that node
voltages are within acceptable limits following the realization of the proposed
control methodology. The details of the mathematical formulation of each stage are
described in Section II of the C2 and the details about the implementation of the
proposed VCDR are illustrated in Fig. 2 of the C2.
The performance of the proposed method is investigated through simulation
studies performed for different compositions of ZIP loads as shown in Table II of
the C2. Particularly, four different cases as illustrated in Table 4.1 are presented to
demonstrate the effectiveness of the proposed method.
Table 4.1 Configuration of demand dispatch signals.
In order to demonstrate the performance of the proposed method, each case is
configured with different demand dispatch signals as illustrated in Table 4.1. Fig.
4.3 illustrates the demand regulation in case I and case II. It is observed that when a
demand dispatch signal of 133 kVA is dispatched from an aggregator at 60 min.,
the proposed method regulate the SS voltage by exploiting real-time voltage
dependency of the loads as per the technique described in Section II of C2 so as to
decrease the aggregated demand from 135 to 133 kVA. Similarly, following the DD
signal of 144 kVA at 120 min., the model determines the corresponding voltage to
increase the demand to 144 kVA. Nevertheless, with the dispatched demand of 125
kVA at 180 min., the estimated voltage at the farthest end node violates Vmin.
Therefore, the model fixes the voltage at the limit violating node to Vmin (0.9 pu)
and back estimate the SS voltage according to the method presented in Section II of
the C2. In this case, even though the dispatched demand is 125 kVA, a demand
regulation of 131 kVA is realized. For the given load compositions and voltage
limits, approximately 5.88% and 3.68% of up and down regulation can be realized.
The demand regulation potential increases significantly when the percentage of
constant impedance load increases. Fig. 4.3c) and Fig. 4.3d) illustrate results of case
II, where the percentage of constant impedance loads is increased as shown in Table
4.1. It is demonstrated that total demand regulation potential has increased from
9.5% in Case I to 14.82% in Case II. Similar to Case I, the dispatched demand
cannot be met fully when a DD signal of 150 kVA is dispatched at 60 min.,
therefore the minimum voltage limits are violated at consumer POC. Similarly,
Case III and Case IV represent cases with same load proportions as case II but with
Case I Case II Case III Case IV
60 133 150 160 190
120 144 144 175 200
180 125 125 185 180
Dispatch Time (min)Dispatched Demand (kVA)

CHAPTER 4. DEVELOPMENT OF DR CONTROL STRATEGIES
55
increased demand. Indeed, those cases have been analyzed to access impact of load
growth due to increased penetration of new loads, such as EV and HP, on the
demand regulation potential. For the same load composition, increased demand
results in decreased demand regulation potential. Fig 7 and Fig. 8 in C2 illustrates
regulation potential of the proposed algorithm in case III and case IV respectively.
In fact, the total regulation potential has decreased to 11.31% for 25% increase in
loads and to 10.59% for the case of 40% increase in loads.
Fig. 4.3 Demand regulation potential. a) Case I and b) Case II.
Demand regulation potential for various study cases subjected to ±10% voltage
variations are summarized in Fig. 4.4. It can be observed that the demand regulation
potential increase significantly for the higher share of constant impedance loads. In
addition, the regulation potential is a function of initial loading condition and
allowable voltage variations. The higher the network loading, the lower the
regulation potential is, whereas, the higher the allowable voltage variations, the
higher the demand regulation potential. Unlike existing DR techniques which has
greater uncertainty in consumer responsiveness, the proposed method exploits
significant demand regulation without noticeable effect to the consumers.
Fig. 4.4 Total demand regulation potential for various cases.
Moreover, the proposed method results in very low energy recovery effect after
its deployment, which is often not the case with the existing DR techniques.
Furthermore, the proposed algorithm can easily be implemented to any feeder
provided real time measurement and on-load voltage control facility are available at
20 40 60 80 100 120 140 160 180 200120
125
130
135
140
145
Time (min.)
Dem
an
d (
kV
A)
20 40 60 80 100 120 140 160 180 2000.88
0.93
0.98
1.03
1.08
Time (min.)
Vo
ltag
e (
p.u
.)
20 40 60 80 100 120 140 160 180 200124
129
134
144
149
Time (min.)
Dem
an
d (
kV
A)
20 40 60 80 100 120 140 160 180 2000.88
0.93
0.98
1.03
1.08
Time (min.)
Vo
ltag
e (
p.u
.)
Dispatched demand
Actual demand
Dispatched demand
Actual demand
Predicted voltage
Actual voltage
Predicted voltage
Actual voltage
a)
b)
c)
d)
'Case I' 'Case 2' 'Case 3' 'Case 4'0
5
10
15
Cases
Perc
en
tag
e o
f re
gu
lati
on
Up regulation
Down regulation
Total regulation

56
its SS. Moreover, the VCDR potential can be used for system level balancing as
well as for local network support, such as peak reduction, congestion management
etc. More importantly, the VCDR can effectively be used in combination with other
DR techniques, thereby acting as back up resource to existing DR techniques.
4.4. DR Control Strategies for EVs Due to sizable rating provided with storage capability, EVs can provide a
significant amount of flexibility in future intelligent grids provided proper EV
charging control strategies are developed. A summary of the proposed methodology
and observed outcomes presented in C3 are described in the following.
4.4.1. Proposed Methodology
A two-stage EV charging algorithm, namely local adaptive control encompassed
by a central coordinative control, is proposed in this study to exploit the flexibility
offered by the EV. In particular, the central coordinative charging prepares
optimum EV charging schedules and the local adaptive control adaptively adjusts
the EV charging in real-time according to monitored voltage. As such, the optimal
EV charging scheduling is a centralized control stage, whereby an aggregator
develops the charging schedule for every EV considering both technical as well as
economic aspects. As EV owners want to minimize the EV charging cost and
aggregator also tries to maximize its profit, the primary goal of the centralized stage
is to minimize total EV charging cost. Technical requirements are considered by
imposing constraints in the optimization. The EV schedules satisfying both voltage
and thermal limits are finally dispatched to every EV.
In the second stage, a local adaptive EV control is implemented at every EV
location to make real-time adjustment of EV charging power according to the
consumer requirements and local network condition, namely voltage. Particularly, a
simplified ON-OFF control is implemented to act over voltage in real-time. To
avoid voltage oscillation resulting from frequent switching ON/OFF of the EVs, the
EVs which are once turned off by the local controller are kept OFF until the next
slot. This provides a simple but effective approach to avoid straining the EV battery
as well as voltage oscillation due to frequent switching. Any deviations in the EV
charging resulting from the local control are taken care of during updating EV
schedules at the next slot. The centralized scheduling and local adaptive control
work in coordination as illustrated in Fig. 3 of the C3 to exploit the demand
flexibility from the EV. The detailed formulation of the centralized and local
adaptive control as well as their coordination is described in Section III of the C3.
4.4.2. Observations and Discussions
The effectiveness of the proposed algorithm is demonstrated through time sweep
simulations for two different EV penetration scenarios. Scenario I is configured to
investigate moderate EV penetration which is taken as 33% EV on top of feeder
base loading. Fig. 4.5 illustrates electricity price and corresponding charging
schedules of EVs for normal and deviated day ahead electricity price cases. The
electricity prices at certain hours, particularly 18:00, 22:00, and 3:00, as shown in
Fig. 4.5b) are adjusted to investigate adaptiveness of the proposed method. It is
observed from Fig. 4.5a) that the EV scheduling is primarily influenced by

CHAPTER 4. DEVELOPMENT OF DR CONTROL STRATEGIES
57
electricity price since most of the EVs have charged at lower price hours. Charging
of some of the EVs even during high price periods (15:00 through 21:00is due to
EV owner’s travelling requirement, such as emergency charging whereby the EV
should be charged anyway irrespective of the network and electricity price.
Moreover, following the price deviations, the proposed periodic scheduling
algorithm adapts to the adjusted electricity price for scheduling for downstream
slots. In particular, the EV charging schedules are shifted to up/down stream slots
depending on positive or negative price deviation. Note that voltage limits were not
violated in this scenario due to relatively lower penetration of EVs.
Fig. 4.5 EV scheduling in scenario-I a) EV charging profiles and b) Electricity prices.
Scenario II is configured to emulate high EV penetration in a heavily loaded
feeder, which is realized by increasing the feeder base load by 50% and EV
penetration to 66%. Electricity price and corresponding EV charging profiles in
scenarios II are illustrated in Fig. 4.6a). In order to demonstrate adaptiveness of the
proposed algorithm, the electricity price has been changes as shown in Fig. 4.6b)
and feeder load has increased (shown by dotted red line in Fig. 4.6a).
15 18 21 24 3 6 9
60
120
180
240
Time of day
Lo
ad
(k
VA
)
15 18 21 24 3 6 9
0.05
0.1
0.15
0.2
0.25
0.3
Time of day
Pri
ce(D
KK
/kW
h)
Normal price
Deviated price
15 18 21 24 3 6 9
0.89
0.9
0.91
0.92
0.93
0.94
0.95
Time of day
Vo
ltag
e (
PU
)
Voltage at normal price Voltage at deviated price
Adjusted load profile
Adjusted EV shceduling
EV scheduling
data4
data5
b)a)
Adjusted load profile
EV charging with adjusted price
EV charging at normal price
Nominal Load profile
Charging profile with
adaptive control
a) b) Fig. 4.6 EV schedules in scenario II a) EV charging profiles and b) Electricity prices.
It can be observed that the EV schedules adapts to the variation in electricity
price as well as load. In particular, increase in load at 24:00 causes to decrease
number of EV charging at that period. Further, decrease in electricity prices in
upstream slots has shifted the EV charging to earlier slots. Charging of some of the
EVs during high price periods is due to travel requirements of the EV owners.
Regardless of the adaptiveness to electricity price and/or load, the EV charging
is subjected to real-time adjustment with network voltage. In particular, voltage
based local adaptive control make real-time adjustment of EV charging when
monitored voltage deviates beyond pre-defined limit. It can be seen from Fig. 4.7
that network voltage gets violated due to sudden increment in load (seen at hour 24
in Fig. 4.6a)). In response, some of the EVs whose voltage at POC was violated
15 18 21 24 3 6 90
50
100
150
200
Time of day
Lo
ad
(k
VA
)
Nominal Load profile
Adjusted EV shceduling
EV scheduling
15 18 21 24 3 6 9
0.05
0.1
0.15
0.2
0.25
0.3
Time of day
Pri
ce(D
KK
/kW
h)
Normal price
Deviated price
a) b)

58
adjust their charging power to bring the voltage back to the limit. In fact, two EVs
whose voltage at the POC got violated were disconnected to support the voltage.
Fig. 4.7 Terminal voltage at farthest node (N13) for various cases.
The charging power profiles and SOC of a particular EV connected to farthest
end node N13 are illustrated in Fig. 4.8. It can be observed that the voltage violation
at hour 24 causes the EV to reduce its charging power to zero. The deviation in
charging power resulted from the adaptive control is corrected by the centralized
scheduling at the next time slot and thus schedule EV for charging at later time
slots, mainly at 3:00. As such, any deviation resulting from the local adaptive
control gets compensated by updating the EV schedules. In particular, the
centralized scheduling periodically updates EV schedules at the beginning of each
slot accounting for the observed variations in price and load.
Fig. 4.8 Adaptive update of charging profile based on monitored voltage.
The proposed two-stage EV control is a simple and effective approach not only
to support the network to accommodate increased EV penetration but also to
support the network in various ways, such as real-time voltage regulation,
congestion management etc. Moreover, the proposed method provides economic
benefits to the participating consumers by reducing their EV charging cost.
4.5. DR Control Strategy for HP Being a sizable load provided with thermal storage capability, HP is considered
as a potential DR resource. A summary of the proposed methodology, HP
modeling, and observed outcomes presented in C4 are described in this section.
4.5.1. Proposed Methodology
Similar to the EV control strategies described in the preceding section, the
exploitation of demand flexibility from HPs is also realized in two stages, namely
centralized coordinative control and local adaptive control. This is done to keep the
15 18 21 24 3 6 9
60
120
180
240
Time of day
Lo
ad
(k
VA
)
Nominal Load profile
Adjusted EV shceduling
EV scheduling
15 18 21 24 3 6 9
0.05
0.1
0.15
0.2
0.25
0.3
Time of day
Pri
ce(D
KK
/kW
h)
Normal price
Deviated price
15 18 21 24 3 6 9
0.89
0.9
0.91
0.92
0.93
0.94
0.95
Time of day
Vo
ltag
e (
PU
)
Voltage at normal price Voltage at deviated price
a) b)
15 18 21 24 3 6 90
3
6
9
12
Time (hr.)
Po
wer
(kW
)
15 18 21 24 3 6 90.2
0.4
0.6
0.8
1
Time (hr.)
SO
C
Without adaptive control
With adaptive control
Without adaptive control
With adaptive control
Maximum SOC
Minimum SOC
a) EV charging profile with and without adaptive control b) SOC of EV with and without adaptive control
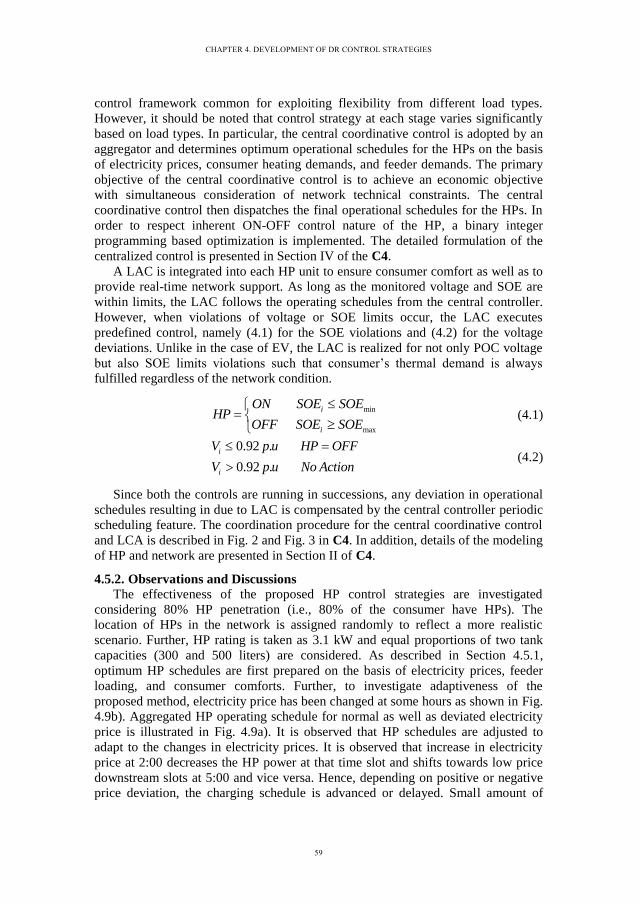
CHAPTER 4. DEVELOPMENT OF DR CONTROL STRATEGIES
59
control framework common for exploiting flexibility from different load types.
However, it should be noted that control strategy at each stage varies significantly
based on load types. In particular, the central coordinative control is adopted by an
aggregator and determines optimum operational schedules for the HPs on the basis
of electricity prices, consumer heating demands, and feeder demands. The primary
objective of the central coordinative control is to achieve an economic objective
with simultaneous consideration of network technical constraints. The central
coordinative control then dispatches the final operational schedules for the HPs. In
order to respect inherent ON-OFF control nature of the HP, a binary integer
programming based optimization is implemented. The detailed formulation of the
centralized control is presented in Section IV of the C4.
A LAC is integrated into each HP unit to ensure consumer comfort as well as to
provide real-time network support. As long as the monitored voltage and SOE are
within limits, the LAC follows the operating schedules from the central controller.
However, when violations of voltage or SOE limits occur, the LAC executes
predefined control, namely (4.1) for the SOE violations and (4.2) for the voltage
deviations. Unlike in the case of EV, the LAC is realized for not only POC voltage
but also SOE limits violations such that consumer’s thermal demand is always
fulfilled regardless of the network condition.
min
max
i
i
ON SOE SOEHP
OFF SOE SOE
(4.1)
0.92 .
0.92 .
i
i
V p u HP OFF
V p u No Action
(4.2)
Since both the controls are running in successions, any deviation in operational
schedules resulting in due to LAC is compensated by the central controller periodic
scheduling feature. The coordination procedure for the central coordinative control
and LCA is described in Fig. 2 and Fig. 3 in C4. In addition, details of the modeling
of HP and network are presented in Section II of C4.
4.5.2. Observations and Discussions
The effectiveness of the proposed HP control strategies are investigated
considering 80% HP penetration (i.e., 80% of the consumer have HPs). The
location of HPs in the network is assigned randomly to reflect a more realistic
scenario. Further, HP rating is taken as 3.1 kW and equal proportions of two tank
capacities (300 and 500 liters) are considered. As described in Section 4.5.1,
optimum HP schedules are first prepared on the basis of electricity prices, feeder
loading, and consumer comforts. Further, to investigate adaptiveness of the
proposed method, electricity price has been changed at some hours as shown in Fig.
4.9b). Aggregated HP operating schedule for normal as well as deviated electricity
price is illustrated in Fig. 4.9a). It is observed that HP schedules are adjusted to
adapt to the changes in electricity prices. It is observed that increase in electricity
price at 2:00 decreases the HP power at that time slot and shifts towards low price
downstream slots at 5:00 and vice versa. Hence, depending on positive or negative
price deviation, the charging schedule is advanced or delayed. Small amount of

60
scheduled HP power even at high price periods are due to the deviations imposed
by consumer comfort, namely SOE and local voltage.
Fig. 4.9 a) HP scheduling with load and price variation, b) Normal and deviated price.
In addition, HP operation is subjected to real time adjustment based on voltage
at POC and SOE in the tank. When voltage at POC of a HP drops below specified
limit (taken as 0.92 pu), the LAC disconnects the HP as an effort to bring voltage
back to the acceptable limit. Fig. 4.10a) illustrates HP operation profiles with and
without LAC operation and Fig. 4.10b) illustrates the corresponding voltage at the
farthest node (N13) in the feeder. In particular, violation of voltage at 5:00, as shown
in Fig. 4.10b), results in disconnection of 5 HPs to bring the voltage back to the
acceptable limit. The disconnection of the HPs reduces power at 5:00 and shifts that
power to later lower price slots. Similarly, violation of voltage at 16:00 results in
disconnection of several HPs whose voltage got violated.
Fig. 4.10 a) Impact of voltage on HP schedules and b) Variation of terminal voltage (N13)
The variation of operational profiles of a single HP is illustrated in Fig. 4.11. It
is clearly observed from Fig. 4.11a) and Fig. 4.11b) that the HP operational
schedules have changed during 5:00-8:00 and 16:00-20:00 due to violations of
terminal voltage. Particularly, the HP is turned OFF several times during the
voltage violation periods to respond to the voltage violations. The actual turning off
period is constrained due to the minimum and maximum SOE limits (illustrated in
Fig. 4.11c) and thermal demand of the house (Fig. 4.11d)). The observed deviations
on operational profiles due to LAC are compensated while updating the schedules
by the central controller at next time-slot.
The proposed two-level control algorithm effectively exploits demand flexibility
from HPs for supporting the grid in several ways. In particular, the central
scheduling supports the network for congestion management, peak-shaving etc. by
optimally scheduling the HPs, whereas the LAC provides a real-time voltage
0 4 8 12 16 20 240
50
100
150
200
250
a) Time of day
Dem
an
d k
VA
Scheduled power
Adjusted Schedule
Feeder load
0 4 8 12 16 20 240
60
120
180
240
300
(b) Time of day
Pric
e D
KK
/MW
Normal Price Deviated Price
0 4 8 12 16 20 2450
100
150
200
250
(a) Time of day
Dem
an
d k
VA
0 4 8 12 16 20 240.9
0.92
0.94
0.96
0.98
1
(b) Time of day
Volt
age
(PU
)
Normal voltage Adjusted voltage
Scheduling with load variation
Scheduling with voltage control

CHAPTER 4. DEVELOPMENT OF DR CONTROL STRATEGIES
61
support to the network. Therefore, the combination of the two controls helps to
realize both economic as well as technical objectives. Moreover, simulation results
demonstrated that any variations in electricity price, loads etc., are adapted by
running two controls in successions.
Fig. 4.11 Adaptive control of a single HP connected at Node 13.
4.6. Increasing Demand Responsiveness Lack of active consumer participation to DR program is becoming one of the
potential barriers for DR deployment, particularly at residential consumer level. A
novel algorithm which works on the basis of optimal pricing adjustment is
developed in this study to increase consumers’ demand responsiveness. The
effectiveness of the suggested method is investigated for a high EV penetration case
in the test network.
4.6.1. Proposed Methodology
The proposed method is realized in two stages, namely optimal price adjustment
to increase demand responsiveness and optimal EV charging. In the first stage, a
day ahead electricity price is optimally adjusted using demand price elasticity of the
consumers. It is assumed that the aggregator, who is responsible for DR control and
management, has the right to optimally adjust the price before dispatching to the
consumers. The key idea of the proposed technique is to incentivize consumers to
create intended load shifts by offering lower electricity prices during off-peak or
non-critical periods. This is realized by creating price differences between peak and
off-peak hours. In fact, hours 18:00-21:00 are taken as peak period and hours 1:00-
4:00 are taken as off-peak period. The details of the formulations of this study are
presented in Section II in C5.
In the second stage, optimal EV scheduling is integrated with the optimal
electricity pricing to investigate a deep insight into the functionality of the proposed
method. In particular, the optimally adjusted electricity price is used for making
optimum EV schedules. The optimal EV scheduling is designed not only to support
network for congestion management but also to exploit EV flexibility for peak
4 8 12 16 20 240
0.5
1
1.5
2
2.5
3
Time (hr.)
Po
wer
(kW
)
4 8 12 16 20 240
0.5
1
1.5
2
2.5
3
Time (hr.)
Po
wer
(kW
)
4 8 12 16 20 24
0.6
0.65
0.7
0.75
0.8
Time (hr.)
SO
E
4 8 12 16 20 240
1
2
3
4
5
Time (hr.)
Th
erm
al
dem
an
d (
kW
)
SHD
HWD
Total
Without With SOEmax
SOEmin
a) Operation profile of a HP without adaptive control
b) Operation profile of a HP with adaptive control d) Thermal demand profiles of a typical residential household.
c) SOE of the HP with and without adaptive control

62
shaving and valley fillings. Since EV owners normally want to have minimum
electricity bill, the proposed method is formulated as a minimization problem which
minimizes total EV charging cost. The details of the optimal EV charging
formulation are presented in Section III of C5.
The integration of optimal pricing and optimal EV scheduling is realized per
procedure presented in Fig. 6 of C5. First, day-ahead electricity prices are optimally
adjusted using the procedure presented in Section 4.6.1. The new price sets are then
dispatched to every consumer to allow them to shift their loads in response to the
price changes. Since EVs are fully flexible loads, optimum scheduling is proposed
in this study to realize desired load shift.
4.6.2. Observations and Discussions
The performance of the proposed method is demonstrated through a 24 hour
time-simulation considering average electricity price of a week in February 2014.
Modified electricity price sets when different price modification percentages are
allowed are illustrated in Fig. 4.12. It is observed that price during lower price
periods has further reduced with consequent increment in price during peak periods,
thereby creating higher price difference between peak and off-peak price to
incentivize the consumers to shift their loads. In addition, Fig. 4.12b) illustrates
aggregated demand profile under different pricing scenarios. It is observed that the
higher the percentage change in electricity prices, the higher the load shifting from
peak to off-peak periods is. Consequently, load during peak hours is lowered with
corresponding increment in off-peak hours, which indeed forms a simple but
effective load shifting approach to increase demand responsiveness.
a)
b)
Fig. 4.12 Price modification mechanism. a) Optimal price and b) Corresponding load shift
To demonstrate the impacts of high EV penetration in the distribution system,
an uncontrolled EV charging approach, where EVs start charging once they arrive
at home and continue until fully charged, is implemented. In this case, most of the
EVs are charged between 15:00 to 24:00 as shown in Fig. 8 of C5, thereby adding
the EV charging demands to the feeder peak. This indeed creates network
congestion. It can be observed from Fig. 9 of C5 that the voltage profile of the far
end node drops below allowable voltage limit during the peak periods (18:00
through 21:00). Therefore, technical as well as economic performance of the
0 5 10 15 20 25100
150
200
250
300
350
Time (hours)
Pri
ce (
DK
K)
original
5% Modification
10% Modification
15% Modification
20% Modification
0 5 10 15 20 2570
80
90
100
110
120
130
140
Time (hours)
Dem
an
d (
MW
)
original demand
5% price modification
20% price modification

CHAPTER 4. DEVELOPMENT OF DR CONTROL STRATEGIES
63
proposed EV charging strategy is demonstrated with respect to i) no change, ii) 5%
change, and iii) 20% change, in day ahead electricity price are allowed.
The EV charging profile for the aforementioned three cases is illustrated in Fig.
4.13. It can be observed from Fig. 4.13a) and Fig. 4.13b) that the EV charging
profile is distributed more evenly when higher percentage of price change is
allowed. For instance, compared to the base case, the EV charging profile is shifted
more evenly when price change is allowed. It should be noted that EVs are
considered as fully flexible loads such that the EV charging can be shifted to any
periods provided the EV owner’s requirements are fulfilled.
Fig. 4.13 Profiles of a) EV demand and b) Sum of EV and base load demand.
Fig. 12 of C5 illustrates total EV charging cost for three different cases plus
with the uncontrolled EV charging. It can be observed that the total EV charging
cost gets significantly decreased for optimal pricing cases compared to the
uncontrolled case, thereby providing additional incentives for end-users to shift
their loads. Therefore, the proposed integrated EV charging optimization and
electricity pricing approach is well suited to address the impact of future electrical
loads in the network by properly shifting their demand to the off-peak periods.
4.7. Chapter Summary This chapter summarized various DR control strategies developed for exploiting
demand flexibility from residential consumer. A combination of centralized and
decentralized control approach is presented in the first part of this chapter to
manage constraints violations in LV distribution grids. The centralized control is
executed hourly and acts proactively to distribute amount of flexibility among the
consumers for alleviating expected grid violations. While, the decentralized control
acts reactively in real-time once the voltage at the POC deviates beyond the pre-
defined limits. As such, the centralized and decentralized controls can additionally
be used to trade flexibility in balancing as well as regulating markets.
In addition, a novel voltage controlled dynamic DR strategy is developed in the
second part of this chapter to avoid need of controlling individual loads/devices. In
particular, a control strategy whereby voltage at MV/LV SS is regulated to realize
up/down-regulation of the demand is implemented. The proposed method first
calculates near real-time voltage dependency of the loads. Following the dispatch of
demand regulation signal, required tap setting at intelligent MV/LV SS is computed
using computed voltage dependency of the loads. A simplified adaptive voltage
estimation technique is implemented to ensure network voltages are within limits.
4 8 12 16 20 240
20
40
60
80
100
Hours of day
Dem
an
d (
kW
)
Original price
5% change is allowed
20% electricity price allowed
4 8 12 16 20 2460
80
100
120
140
160
180
Hours of day
Dem
an
d (
kW
)
Original price
5% change allowed
20% change allowed
a) b)Hours of day

64
A two stage control strategy, namely a central optimum scheduling and an
adaptive local control has been implemented to exploit demand flexibility from
EV/HP. The central scheduling extracts the major portion of the flexibility by
optimally scheduling EV/HP operation. This indeed ensures economic benefits to
the consumer by minimizing total electricity cost as well as technical requirements
by satisfying consumer’s and DSO’s constraints. In addition, the adaptive control is
implemented for real-time adjustment of EV/HP operation. Particularly, the
adaptive control locally monitors local voltage and adjust EV/HP operation when
voltage at its POC gets violated beyond the pre-specified limits.
Finally, in order to increase consumer’s demand responsiveness, a novel optimal
pricing algorithm is proposed, where a price difference is created between peak and
off peak periods for incentivizing consumers to shift their loads from peak to off-
peak periods. To realize the concept, a day ahead electricity price is optimally
adjusted such that the price at off-peak or non-critical periods gets decreased and
vice versa. Moreover, the effectiveness of the proposed method is demonstrated for
a high penetration of flexible load to emulate the future scenario.
The control strategies presented in this chapter deal mainly with the active
loads. As future SGs are anticipated to have significant penetration of generations,
namely rooftop PV systems, the following chapter presents integrated control
strategies for active loads and active generations.

65
Chapter 5. Control of Active Load and
Local Generation
This chapter presents integrated control of active loads and local generation for
better exploitation of the demand flexibility from residential consumers/prosumers.
In particular, the chapter contains a summary of control strategies documented in
C6 and C7. The effectiveness of the control strategies are demonstrated through
integrated control of solar PV and DR considering EV and EWH as potential DRR.
5.1. Introduction Recently, attractive feed-in tariffs and declining costs of PV systems are causing
rapid growth of rooftop solar PV in Denmark. Such increased integration of solar
PV is introducing several power quality issues, such as overvoltage, reverse power
flow, harmonic injections etc. in the distribution grids. On the contrary, increased
penetration of sizable loads, such as EVs, HPs, EWHs etc., introduce grid
congestion issues, particularly under-voltage and thermal overloading. As grid
impacts of solar PV and active loads are often complementary to each other, control
strategies are designed to neutralize their impacts. In particular, proper operation
scheduling of flexible loads can absorb power generation from the solar PV,
thereby increasing PV hosting capacity of the distribution networks. In turn, load
hosting capacity of the grid also gets increased due to voltage support provided by
PV for alleviating the under-voltage issues. Therefore, the key idea of this chapter
is to design control strategies such that solar PV and active load becomes
supportive to each other. In particular, this chapter summarizes integrated control of
active loads and local generation documented in the publications C6 and C7. In the
first part, a coordinative control of DR (considering EV as potential DRR) and local
generation (solar PV) is presented. The second part of the chapter contains an
integrated LAC of active load, namely EWH, and solar PV to implement fully
decentralized control for real-time grid support.
5.2. Control Strategies for Solar PV and EV Since common methods to alleviate overvoltage problems, such as P and/or Q
control of the PV system, normally create revenue loss and/or inverter cost increase,
a coordinated control of DR and PV is proposed in this study not only to alleviate
the overvoltage issues but also to avoid the aforementioned economic loss. A
combination of centralized and decentralized control strategy is implemented.
System modeling, proposed methodology and outcomes are presented as follows:
5.2.1. System Modeling
The LV test network, described in the Chapter 3, is used for the simulation
studies. In particular, every cable branch is modeled by a short line model and loads
are modeled as 3-phase loads. Similarly, EVs are modeled as three phase constant

66
power loads with unity PF, provided with an 11 kW charger and 25 kWh batteries.
Solar PV is modeled as a static generator where the PV system operates as a
constant power source at specified PQ set-point. Each PV system is rated with 6
kW peak. The PQ capability curve of the solar PV system is designed in
compliance with VDE-AR-N 4105 standard [12]. As per the standard, the reactive
power limits for the grid-tied inverters are set by limiting PF of the PV system
within ±0.95. In addition, an auto regressive moving average model is used for
forecasting consumer demand and PV production. The details of the modeling are
presented in Section II of C6.
5.2.2. Proposed Methodology
As mentioned in the preceding section, a combination of centralized and
decentralized control approach is implemented to realize the coordinative control of
PV and EV. The centralized stage is executed by an aggregator or entity responsible
for DR management and designed to control the EVs and PVs via optimal
operational scheduling. Indeed, the optimal scheduling is formulated as an
optimization problem where total electricity cost (difference of EV charging cost
and revenue collected from PV production) is minimized.
In the first step, power injection from the PV is considered as non-controllable.
So, the optimization is performed by taking the charging power of EV as control
variables. However, if grid constraints still persist, rescheduling is done by
considering both EV charging power as well as PV power injections as control
variables. Such rescheduling lets the PVs to contribute prior to EV for the under-
voltage violations and EVs to contribute prior to PV for the overvoltage violations.
The EV and PV schedules after rescheduling correspond to final schedules to be
dispatched as operating set-points to the corresponding EVs and PVs. The detailed
formulation is presented in Section III.A of C6.
As the centralized control provides periodic inter-slot control with 15 minutes
intervals, any intra-slot variations cannot be addressed by it. Therefore, the
decentralized control is implemented at every EV and PV location to continuously
monitor the voltage at the POC and adjusts the charging power of EVs or power
injection from the PVs in real-time. The decentralized control for the PV is modeled
as a piecewise linear droop such that the power injection by the PV varies with
voltage at the POC. The key idea is that the power injection by the PV should be
decreased for overvoltage and increased (if applicable) during under-voltage.
The decentralized controller for the EV is also designed as a piecewise-linear
droop such that it adaptively adjusts the EV charging power according to the
voltage at the POC. The key idea is to increase the EV charging power for
overvoltage violations and decrease for the under-voltage violations as per the
assigned droop. The PV and EV droops remains non-operational for the normal
operating voltage range, however reacts to the under-voltage or overvoltage
violations according to the assigned droop. The details of droop formulation,
parameter assignment, and droop settings for different nodes are presented in
Section III.B of C6. As such, both control stages runs in a coordinated manner as
illustrated in Fig. 5.1. As can be seen, both controllers run successively with a
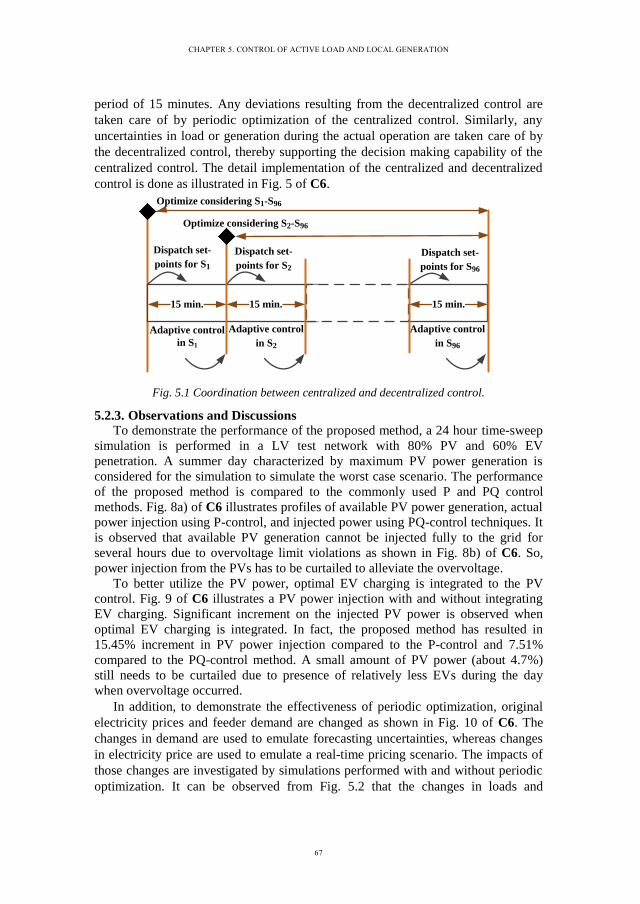
CHAPTER 5. CONTROL OF ACTIVE LOAD AND LOCAL GENERATION
67
period of 15 minutes. Any deviations resulting from the decentralized control are
taken care of by periodic optimization of the centralized control. Similarly, any
uncertainties in load or generation during the actual operation are taken care of by
the decentralized control, thereby supporting the decision making capability of the
centralized control. The detail implementation of the centralized and decentralized
control is done as illustrated in Fig. 5 of C6.
Adaptive control
in S1
Dispatch set-
points for S1
Optimize considering S2-S96
Optimize considering S1-S96
15 min. 15 min. 15 min.
Dispatch set-
points for S2
Dispatch set-
points for S96
Adaptive control
in S2
Adaptive control
in S96
Fig. 5.1 Coordination between centralized and decentralized control.
5.2.3. Observations and Discussions
To demonstrate the performance of the proposed method, a 24 hour time-sweep
simulation is performed in a LV test network with 80% PV and 60% EV
penetration. A summer day characterized by maximum PV power generation is
considered for the simulation to simulate the worst case scenario. The performance
of the proposed method is compared to the commonly used P and PQ control
methods. Fig. 8a) of C6 illustrates profiles of available PV power generation, actual
power injection using P-control, and injected power using PQ-control techniques. It
is observed that available PV generation cannot be injected fully to the grid for
several hours due to overvoltage limit violations as shown in Fig. 8b) of C6. So,
power injection from the PVs has to be curtailed to alleviate the overvoltage.
To better utilize the PV power, optimal EV charging is integrated to the PV
control. Fig. 9 of C6 illustrates a PV power injection with and without integrating
EV charging. Significant increment on the injected PV power is observed when
optimal EV charging is integrated. In fact, the proposed method has resulted in
15.45% increment in PV power injection compared to the P-control and 7.51%
compared to the PQ-control method. A small amount of PV power (about 4.7%)
still needs to be curtailed due to presence of relatively less EVs during the day
when overvoltage occurred.
In addition, to demonstrate the effectiveness of periodic optimization, original
electricity prices and feeder demand are changed as shown in Fig. 10 of C6. The
changes in demand are used to emulate forecasting uncertainties, whereas changes
in electricity price are used to emulate a real-time pricing scenario. The impacts of
those changes are investigated by simulations performed with and without periodic
optimization. It can be observed from Fig. 5.2 that the changes in loads and

68
electricity prices significantly alter the charging profiles of the EVs and the total
power injection from the PVs. Followed by the price change, several EVs which
were initially scheduled for charging during midnight (3:00 through 5:00) are
shifted to day (13:00 through 17:00), thereby contributing positively to increased
PV power injection. The periodic optimization enables the EVs to adjust their
charging according to the adjusted price. For the given configuration, the periodic
optimization results in 25.73% decrement on EV charging cost with simultaneous
19.23% increment on the revenue to the PV owners.
Fig. 5.2 PV power injection and EV charging power.
In order to investigate the real-time voltage support capability of the
decentralized control, few load change events are created as shown in Fig. 5.3c) of
C6. Indeed, the load change events emulate transient variability in PV production.
It is observed form Fig. 5.3b) that load decrement at event 2 creates an overvoltage
on the grid. In order to act over the overvoltage, some of the PVs whose voltage at
the POC gets violated curtail their injected power to avoid the overvoltage. Fig.
13a) in C6 illustrates an amplified view of Fig. 5.3 from 14:00 through 14:45. It is
observed from Fig. 5.3a) of C6 that the injected power is reduced by approximately
14 kW to bring back the voltage to limit. Similarly, increase in load at event 4 in
Fig. 5.3b) creates under-voltage violation as most of the EVs were charging during
that event. Therefore, the EVs whose voltage at the POC get violated, adjust their
charging power to support alleviating under-voltage. As illustrated in Fig. 13b) of
C6 (amplified view of event4), the EV charging power is decreased by
approximately 12 kW to increase voltage above Vmin.
As such, the proposed two-stage coordinated control of EV and PV effectively
mitigate overvoltage issue under high PV penetration, particularly by efficient
utilization of the PV generation for EV charging. Moreover, it provides real-time
grid support by adapting EV charging power as well as PV power injection
according to monitored voltage at the POC. Therefore, the proposed method
demonstrates improvements in both technical and economic performance. From a
technical perspective, it effectively mitigates the grid overvoltage, whereas from the
economic perspective it efficiently utilizes the PV power, thereby providing
increased PV power revenue and/or decreased EV charging cost.
12 16 20 24 4 8 12
-200
-100
0
100
200
Time (hr.)
Dem
an
d (
kW
)
EVI
EVF
PVI
PVF
EV power without periodic
EV power with periodic
PV injected power without periodic
PV injected power with periodic

CHAPTER 5. CONTROL OF ACTIVE LOAD AND LOCAL GENERATION
69
Fig. 5.3 Decentralized control results.
5.3. Integrated Adaptive Control of EWH and PV In order to investigate deeper insights about local adaptive control, integrated
adaptive control of solar PV and EWH is implemented. In particular, this section
summarizes EWH and PV modeling, proposed adaptive control, and corresponding
findings on the basis of publication C7.
5.3.1. Modeling of EWH and PV
The modeling of test network and solar PV system is similar to that in the
preceding section and is presented in detail in Section II of C7. In addition, EWH is
modeled as a constant power thermostatic load provided with a thermal storage
tank. The proposed model is done such that the EWH provides flexibility in two
ways. First, exploiting the constant power feature of the EWH, demand flexibility is
realized by adjusting the power consumption of the EWH. In addition, the
flexibility can be realized by adjusting temperature settings of the EWH such that
the EWH consumes less power for lower temperature settings and vice versa. Thus,
the flexibility is very dependent on size of the thermal storage tank and consumer’s
thermal demand. The modeling details are presented in Section II of C7.
5.3.2. Proposed Adaptive Control Strategies
The proposed adaptive control strategy is designed such that overvoltage
resulting from solar PV gets compensated by EWH and under-voltage resulting
from high EWH demands gets compensated by properly scheduling them to operate
in the period of high PV generations. In particular, the control strategy for EWH
and PV are designed separately so as to enable them to contribute differently in
overvoltage and under-voltage violations.
As mentioned in preceding section, EWH adaptive control is designed to exploit
flexibility in two ways. First, the flexibility is exploited by implementing power
versus voltage droop. In particular, P-V and Q-V droops are assigned separately to
every EWH such that the P-V droop decreases the active power consumption and
0
100
200
kW
0.95
1
1.05P
U
16 20 24 4 8 12
-20
0
20
kW
N13
N10
PV generation EV demand
Overvoltage
1
2
4
6
7
3
a) PV & EV power profiles
b) Voltage of Node 13 and 10
c) Load change events
Undervoltage
PV power adapt
EV poweradapt
5

70
Q-V droop increases the reactive power injection whenever voltage at the POC
drops below the predefined thresholds. Even though high R/X ratio of the LV
distribution grids make active power control more effective in providing voltage
support, the active power control incurred with deviations in electricity cost. For
instance, active power curtailment of PV systems leads to revenue loss to the PV
owner or decrease of active power consumption of the EWH may lead to consumer
demand violations. The droops are designed such that the Q-V droop operates prior
to the P-V for the under-voltage violations. This prevents adjustment of active
power consumption by the EWH as long as the reactive power is sufficient to
resolve the under-voltage. On the contrary, the P-V droop operates prior to the Q-V
for the overvoltage violations, thereby letting the EWH to consume more power.
The Q-V droop increases reactive power consumption only if the P-V droop is
incapable to resolve the overvoltage issues. Such operational priorities are realized
by introducing delays in the P-V and Q-V droops. Even though EWH provide lower
demand flexibility compared to the EV, it is always available at home. So, it is
effective to provide grid support during the day when PV has maximum generation.
An adjustable temperature band, expressed in terms of SOE, is implemented for
exploiting additional flexibility when voltage violations occur. In particular, the
allowable SOE limits (SOEmin and SOEmax) are increased in case of the overvoltage
violations, thereby letting the EWH to operate for longer periods before its inherent
thermostatic control turned it off. Similarly, for the under-voltage violation, the
allowable temperature limits are decreased to let the EWH to operate for shorter
periods. Particularly, SOEmin and SOEmax are increased by 0.1 pu for the overvoltage
violations and decreased by the same amount for the under-voltage violations.
Similar to the EWH control, the adaptive control of the PV is designed with
droops, namely P-V and Q-V. Both the droops are non-operational for the normal
operating voltage. For the overvoltage violations, the Q-V droop operates prior to
P-V to increase reactive power consumption. Such strategy prevents active power
curtailment as long as reactive power is able to resolve the overvoltage issue.
However, in the under-voltage violations, the P-V droops operates prior to Q-V to
let the P-V droop to increase the active power injection to maximum possible value
(if feasible). In addition to the operational priorities for P-V and Q-V droops,
priorities are also set for EWH and PV operation as illustrated in Table I of C7. For
instance, the EWH is allowed to operate prior to PV in the overvoltage violations
whereas the PV operates first in the under-voltage violations. The detailed
formulation of the proposed method is presented in Section III of C7.
5.3.3. Observations and Discussions
The effectiveness of the proposed adaptive control is demonstrated through a 24
hour time-sweep simulation performed in a LV distribution network. In particular,
the performance is investigated for three scenarios, namely i) EWH penetration
only, ii) PV penetration only, and iii) both EWH and PV penetration.
The first scenario is performed to investigate the performance of the EWH
adaptive control. With and without adaptive control cases are simulated for
maximum feeder loading (worst case scenario from loading perspective) condition

CHAPTER 5. CONTROL OF ACTIVE LOAD AND LOCAL GENERATION
71
with high (50%) EWH penetration. It is observed from Fig. 5.4 that whenever
voltage at the POC goes below the threshold voltage, the adpative control adjusts
active and reactive powers consumption of the EWH. First, reactive power is
injected to provide voltage support. The active power consumption of the EWH is
also reduced according to the P-V droop since the reactive power is insufficient to
alleviate the under-voltage problem. In addition, the power consumption of the
EWH is reduced by adaptatively updating the SOE limits. As can be seen from Fig.
5.4, the SOE limits are decreased by 0.1 pu followed by the under-voltage violation,
thereby providing additional flexibility. More importantly, EWHs at different nodes
are contributing to voltage improvement as shown in Fig. 10 of C7 unlike in the
case of constant voltage settings. The detailed observation on EWH adaptive
control capability is presented in Section IV of C7.
Fig. 5.4 Simulation results of EWH control. a) SOE, b) Active/reactive power consumption,
c) POC Voltage, and d) Thermal demand, for a consumer. (WC: without & C: With control)
In the second scenario, the performance of the PV control is investigated for
minimum feeder loading with high (80%) PV power penetration. As illustrated in
Fig. 5.5, the PV power injection is adjusted according to voltage at the POC. It is
observed that whenever the monitored voltage goes above threshold, the adaptive
control consumes reactive power as shown in Fig. 5.5. Since reactive power is
insufficient to solve the overvoltage issue for the given configuration, active power
is curtailed to keep voltage at the POC above limit. Both active power curtailments
as well as reactive power consumption contribute to bring the voltage below the
maximum allowable voltage. It is clearly seen that voltage is improved significantly
compared to the case without having control.
Scenario III is performed with both EWH and PV in order to investigate the
interaction between EWH and PV in addressing voltage issues. To realize better
investigation of the control approaches, simulations are performed for two cases,
namely for light loading (worst case from PV penetration perspective) and high
loading (worst case from EWH penetration perspective) conditions. Adaptive
adjustment of EWHs power consumption as well as PVs power injection for light
loading condition is illustrated in Fig. 13 of C7. It is observed that the active power
consumption of the EWH is increased first to support the overvoltage. In addition,
the reactive power consumption from the EWH is also increased as active power is
insufficient to alleviate the overvoltage completely. However, as seen from Fig.
13c) of C7, there is no active power curtailment of the PV. Indeed, the power to be
curtailed is compensated by adjustment of the EWHs consumptions.
.65
.75
.85
SO
E
.93
.95
.97
Vo
ltag
e (p
u)
0
1
2
P/Q
ew
h
4 8 12 16 20 24
2
4
6
Qhw
d
SOE SOEmin/max
PWC
PC
QWC
QC
a)
b)
.65
.75
.85
SO
E.93
.95
.97
Vo
ltag
e (p
u)
0
1
2
P/Q
ewh
4 8 12 16 20 24
2
4
6
Qhw
dVWC VC Vth/min
Hot water
demand
c)
d) Time (hr.)
V (
pu
)
4 8 12 16 20 24
Time (hr.)

72
Fig. 5.5 PV results with/without control a) Active and reactive power b) POC Voltage.
Similarly, in order to demonstrate the solar PV support to the under-voltage
problem, a simulation is performed for both EWH and PV with high loading
conditions. It is observed from Fig. 14 of C7 that the under-voltage violations are
alleviated completely by active power injection from PVs. As such, it can be
concluded that the integrated control of the solar PV and EWH provides better
network support as well as results in better utilization of the available flexibility.
5.4. Chapter Summary This chapter summarizes control strategies developed to realize integrated
control of active loads and local generation. The key idea is to neutralize the
impacts of solar PV and active loads (EV and EWH) by better operational
scheduling of the loads and generation.
A two-level control strategy is implemented to demonstrate coordinative control
of EV and solar PV. The first level control is a centralized control designed for
optimum scheduling of the EVs and PVs. It considers electricity cost, network
constraints (thermal and voltage), and consumer requirements to make the optimum
schedules. The second level control is a decentralized real-time adaptive control
which acts as an inner loop to provide real-time voltage support to the grid. A P-V
is designed for every PV and EV to make their generation/demand adaptively
adjusted per locally monitored voltage. The combined centralized and decentralized
control demonstrates better technical as well as economic benefits.
In order to investigate deep insight of real-time network support capability of
the adaptive control, an integrated EWH and PV control is developed. The proposed
control is fully decentralized and works on the basis of locally measured voltage
and power. In particular, P-V droops are designed for every EWH and PV to adjust
active/reactive power consumption/injection by the EWH and/or solar PV. In
addition to the droops, the energy bands, namely SOEmin and SOEmax, of the EWH
are adaptively adjusted followed by the voltage violations. Particularly, energy band
is increased by 0.1 pu following the overvoltage violations, while decreased by the
same amount for the under-voltage violations.
As most of the current researches on SG are simulation based, practical
demonstration and validation of DR control strategies is significantly lagging. To
address this issue, a scaled-down SG testbed is developed in the following chapter.
-1
1
3
5
a)
P/Q
(k
W/k
VA
R)
4 8 12 16 20 24
1
1.05
b)
Vo
ltag
e (p
u)
PWC
PC
QWC
QC
VWC
VC
Vth/min
Time (hr.)
V (
pu
)

73
Chapter 6. Development of Scaled Down
SG Testbed
This chapter demonstrates multi-disciplinary aspects of the SG by developing a
scaled-down SGT, which is described as a part of manuscript J3. In particular,
details on the SGT development and implementation of the proposed centralized-
decentralized control schemes and ICT infrastructure for deploying DR in the
physical testbed are presented. Moreover, the capability of the SGT is demonstrated
from both power and communication perspectives through an optimized EV
charging coordination over a heterogeneous network.
6.1. Introduction As mentioned in previous chapter, significant efforts have recently been
invested by electric utilities, governments, and researchers to develop DR as a
potential solution in the future grids integrating increased penetration of RESs and
active loads. Nevertheless, very few attempts have investigated DR deployment
capability from multi-disciplinary aspects. In particular, DR implementation not
only involves power system but also comprises the ICT infrastructure. Therefore,
the ICT plays a crucial role in the practical realization of the DR.
In addition, practical realization of the DR at residential consumer level is
significantly lagging due to lack of testing and validation mechanism of the
developed DR control strategies in real-world networks. Therefore, practical
demonstration and validation of the DR techniques are key aspects to accelerate the
DR deployment. However, several potential issues are being barriers to the practical
demonstration and validation of the DR techniques. First, it is practically difficult to
test and validate DR on the real distribution network due to consumers’ concerns,
namely power quality and reliability requirements. In addition, direct
implementation of the DR on the real network might cause huge damage and
economic loss to the utility. Second, it is practically and financially infeasible to
setup utility scale networks for testing and validating the DR solutions due to huge
investment, efforts, and time requirements.
Recently, pilot project is becoming a potential solution to deploy DR in a real-
world network by extracting real-behavior of electricity consumers [111], [171].
However, developing a distribution network as a pilot project requires huge
investments of money, time, and efforts. In addition, enabling the consumers to
participate in DR programs is often the hardest part especially during the
development phase due to their inherent restiveness to any changes and fear of
losing operational flexibility, comforts, power quality, and reliability.
In this regard, a SGT is an effective approach to develop, analyze, and
demonstrate various SG solutions, such as DR, congestion management etc. A
novel method, whereby a larger electrical distribution network is scaled down into a
low power and LV equivalent SGT, is developed. In particular, the SGT is

74
developed by scaling down a 250 kVA, 0.4 kV, LV distribution feeders down to 1
kVA, 0.22 kV. Next, anticipated DR controls and coordination are established by
integrating a heterogeneous ICT infrastructure into the SGT. Therefore, a key intent
of this study is to develop a cost-effective and efficient test platform for SG
solutions. The SGT additionally provides an effective and riskless approach for
deployment of the DR accounting the multi-disciplinary aspects of the SG. In
particular, this chapter summarizes the SGT development presented in J3.
6.2. Development of Smart Grid Testbed Similar to a real-world SG, the proposed SGT development comprises three
major aspects, namely, power network, communication network, and integration of
the power and communication network, as described in the following.
6.2.1. Electric Power Distribution Network
A 13-node LV distribution network fed by a 10/0.4 kV LV transformer
substation is taken as a test network. In particular, the network is scaled down from
250 kVA, 0.4 kV LV to 1 kVA, 0.22 kV testbed and a single phase equivalent of
the scaled-down SGT is implemented as an experimental SGT in a laboratory. The
scaling parameters used to scale-down the LV network are summarized in Table
6.1. The voltage scaling factor is chosen to match the SGT with a nominal supply
voltage at the site where the SGT was implemented. This is particularly done to
avoid voltage conditioning equipment such as voltage converter and/or regulators.
Additionally, the scaling factor for the power is chosen to enable the economy and
readily availability of equipment on that range.
Table 6.1 Network parameters before and after scaling down.
Parameter Before SD After SD
Feeder Capacity 250 (kVA) 1 (kVA)
Feeder Voltage 0.4 kV 0.22 kV
Transformer R/X 4.64/18.64 (mΩ) 0.314/1.26 (Ω)
Cable R/X 207/78 (mΩ/km) 13.99/5.27(mΩ/km)
Fig. 6.1 Schematic diagram of 13-node scaled down network.
As illustrated in Fig. 6.1, the scaled down LV distribution feeder is configured
such that every node consists of different load types (controllable loads, base load,
Variable AC
Power
Supply
Central Controller/DMS
Optical Fiber
Router
Local
Controller
Measurement
ControllableLoad
BaseElectric Vehicle
Controll-
able
switches
Distribution
Branch
Control &
commun-
ication
Node Details
R X
Z
N2N1
N5N4
N3
N6
N7
N8
N9 N10 N11
N12
N13
N10 N11
load

CHAPTER 6. DEVELOPMENT OF SCALED DOWN SG TESTBED
75
and EVs), smart meter, local controller, and smart controllable switches. Further, a
variable AC supply with a capability to regulate supply voltage is implemented as a
primary source of power to the SGT. This is intended to keep the input to SGT
constant irrespective of supply voltage variations. Every feeder branch is modeled
using an equivalent lumped series impedance as depicted in the Fig. 6.1. Similarly,
the transformer is implemented with its corresponding scaled down series
impedance. Scaled down values of line parameters and loads are computed on the
basis of per unit techniques as presented in the Section II of J3. It should be noted
that the load at each node of the SGT corresponds to an aggregated load of the
consumers connected to that particular node. Based on the actual values of the
scaled down load, small electrical loads (batteries, chargers, lamps, small motors,
etc.) are connected at each node.
Fig. 6.2a) illustrates the experimental SGT implemented in the laboratory and
Fig. 6.2b) illustrates an amplified view of a particular node. It can be seen that
every node comprises a combination of controllable and non-controllable loads. In
particular, each node consists of a local controller (Raspberry Pi model B), smart
meter (TP4000ZC digital meter), electrical sensor (TP4000ZC digital meter),
controllable load (TS5003, 0.21A, 115V), EV (12V, 4/7 Ah battery), an
incandescent bulb, and two controllable switches (USB Net Power 8800 power
controller). The two controllable switches are used to control flexible loads, namely
the EV charger and motor (TS5003, 0.21A, 115V).
Fig. 6.2 Laboratory implementation of the testbed.
In addition, each EV (emulated by 12 V 4/7 Ah capacity battery) are supplied
with two types of chargers (2/4/8A and 0.9A) to simulate different charging
schemes. In particular, EVs having 4 Ah capacities are provided with 0.9A chargers
whereas EVs having 7 Ah capacities are provided with a 2/4/8A charger. The EV
travel is emulated by discharging the battery through a 25 W incandescent bulb
connected at every EV connected node. Power consumption by local controller,
smart meter, sensor, and incandescent bulb constitute base loads at each node.
a) Scaled down SGT composed of DMS server (1), DMS (2), EPON (2), and Power network
(nodes 1- 13)
b) Smart node composed of line (1), discharging load (2), seonsors/meters (3), battery (4), local controller (5), dynamic load (6), controllable switches (7), and charger (8)

76
6.2.2. Communication Network
As depicted in Fig. 6.3, the ICT infrastructure primarily comprises a backhaul
network based on an EPON and mesh NAN based on an IEEE 802.3 Ethernet. In
particular, the EPON consists of 4 optical network units located 20 km from the
optical load terminal, each having bidirectional data rate of 1 Gbps. Similarly, each
link in the NAN is full duplex with 1 Gbps capacity. The optical network units
aggregate the traffic from/to the Ethernet meshed network towards the nano-
computers based on Raspberry Pi model B, hereafter called LAC. In particular, the
DMS reaches every household or device via multiple routers namely the optical
load terminal, EPON, and meshed NAN. Therefore, end-to-end delay between any
source node to any destination node is computed by:
,
, .200000
s d
is d i
ii I
dLD
c
(6.1)
where Is,d is the set of network interfaces from s to d, Øi is the queuing delay at
interface i, L is the frame size, ci is the capacity in bps at interface i, di is the
distance in km at interface i through the adjacent node, and 200000 is the
propagation speed in km at the speed of light through a wire (fiber). The queuing
delay (first term) remains negligible as the traffic load is low. Whereas, the
transmission delay (second term) remains significantly low since ci equals 1 Gbps.
The propagation delay component (third term) depends on the distance between
nodes, for instance, communications between the optical load terminal and optical
network units takes 0.1 ms for 20 km fiber length.
Fig. 6.3 Communication infrastructure implemented in the testbed.
6.2.3. Integration of Power and Communication Network
As mentioned in the preceding section, the LAC which is installed at each node
provides a physical interface between the power and ICT network. It establishes
bidirectional communication between the central DMS and the consumer in a pre-
defined time interval and data format. In the proposed SGT, the communication
frequency is limited to 15 minutes and the data format comprises a data matrix
(e.g., power, current, voltage) encrypted with control data, as explained in detail in
ONU ONU
OLT
DMS
LC LC LC LC LC LC LC LC LC LC LC LC
Ethernet Router
Ethernet Router
Ethernet Router
Ethernet Router
Ethernet Router
Backhaul
Network
Meshed
NAN
20 km fibre

CHAPTER 6. DEVELOPMENT OF SCALED DOWN SG TESTBED
77
Section II of J3. In addition to the interface functionality of the LAC, it serves as a
controller and data hub to every consumer. In particular, the LAC at a particular
node ensures measurement and control of every controllable devices connected to
that node. Two separate meters are connected to the LAC to monitor battery SOC
and node voltage. The LAC reads both meters twice per second. Based on the
monitored data, the LAC executes the control of the load once the monitored
voltage goes beyond the pre-set limits.
Whenever the central DMS need to execute any control on a particular load, it
sends the control signal and the LAC of the particular node executes the actual
control on the load as per the instruction contained in the signal. In fact, two
controllable switches (USB Net Power 8800 power controller) are used to execute
control (ON/OFF) of the controllable loads (EV charger and motor). In addition, in
real-time, the LAC monitors the network conditions and performs the control action
once the voltage at the POC deviates beyond the pre-specified limits. Therefore, the
LAC plays a key role to bridge the power and communication in the testbed.
6.3. SGT Performance Demonstration
Optimized EV charging coordination realized through a combination of a
centralized and a decentralized control algorithm is implemented for demonstrating
the SGT performance. The details of each control are described in the following.
6.3.1. Centralized Control
The centralized control is implemented centrally at the DMS for determining
optimum charging schedules for the entire EVs considering EV owners
requirements, electricity price, and network conditions. In particular, the centralized
control is implemented under the following framework:
Every EV sends SOCi, Tin,i, Tout,i, position in the network, battery capacity
(BCi), and minimum/maximum charger rating (Pmax) to the DMS at plug-in.
Any unusual travel requirement should also be specified at the plug-in.
Unless specified any EV plug-in between k and k+1 time-slots is considered
for optimization on the (k + 1) th
slot.
At the end of each slot, every EV sends updated SOCi, charging power,
charging current, and voltage to the DMS and the DMS re-compute the
optimum charging schedules.
After receiving the aforementioned data from entire plugged-in EVs, the DMS
first prepare optimum schedules for every EV considering their individual
requirements and electricity prices. Mathematically, the problem is formulated as a
minimization problem as:
,
,
, ,. . , . .
out i
in i
T
i k i k k K
k T
Min P x t C
(6.2)
,
,
,
:
.out
min i k max
i avg max
i T max
P P P
P P
SO
Subj
C
ect
S
ed to
OC
(6.3)

78
where Pi,k, xi,k, tk, and Ck are the charging rate, operating state, slot duration, and
electricity price for the kth
slot and ith
EV. Pi,min and Pi,max are the limiting values of
EV charging rates, Pi,avg is an average charging rate required to fully charge the EV
by the plug-out time (i.e. SOCi = SOCi,max by Tout), and Tin,i and Tout,i are the plug-in
and expected plug-out time respectively. The first constraint is used to ensure the
charging power is within the charger ratings, whereas, the second and third
constraints are used to ensure that the EV should be fully charged by plug-out time.
A binary integer programming is implemented for the optimization. The
optimization gives a solution vector xk comprising optimum charging states of EVs.
Nevertheless, as the network constraints are not included in this optimization,
there remains a possibility that the optimum EV charging might not be supported
due to network constraints. Therefore, following the optimization of the individual
EVs, the feeder capacity is checked to make sure whether or not the feeder loading
is within limit. If the feeder capacity gets violated, the optimization is done for all
EVs considering the network limits as depicted in flow chart in Fig. 5 in J3. In this
case, the optimization problem is formulated as follows:
, ,
1 1
,. . . .slt EVN N
i k i k k K
k i
Min P x t C
(6.4)
,
1
: ,EVN
i k k
i
Subjected to P FL FC
(6.5)
where NEV is the number of plug-in EVs, Nslt is the total number of time slots, FLk is
the feeder load at kth
slot, and FC is the maximum feeder capacity. A feeder
capacity limit constraint (6.5) is additionally included together with the constraints
(6.3) to respect the thermal limit. Consequently, the optimization problem is solved
as a minimization problem using the objective function (6.4) and the constraints
(6.3) & (6.5). It should be noted that such rescheduling may changes the charging
schedules of some of the EVs, thereby increasing total EV charging cost. Fig. 5 of
J3 graphically illustrates major steps involved in the proposed EV charging.
6.3.2. Decentralized Control
The decentralized LAC is implemented locally at each EV to adapt their
charging based on real-time monitored voltage at their POC. Irrespective of the
scheduled operating states from the DMS, the LAC adjusts the EV states if
monitored voltage deviates beyond pre-specified limits as follows:
,
0.95.
Ni N
ON if VEV
OFF Otherwise
(6.6)
where EVi,N, is the operating state of ith
EV connected to Nth
node and VN is the
voltage at Nth
node. If the VN goes beyond the limits (0.95 pu), the LAC switches
OFF the EV connected to that node to support the network. Thus, the LAC action
may override the optimum OSs initially set by the DMS. In order to limit frequent
switching (ON/OFF) of the EVs, the maximum number of switching within a slot is

CHAPTER 6. DEVELOPMENT OF SCALED DOWN SG TESTBED
79
limited to one. This will further help to prevent voltage oscillations that might result
from frequent ON/OFF switching of the EVs.
Even though the proposed threshold based LAC provides real-time network
support, two potential problems could arise. First, a large number of EVs could
simultaneously switch ON/OFF, thereby leading to voltage oscillation. Second, EVs
at the far end on the feeder suffer more compared to the EVs in the upstream. To
solve the first problem, random response time (from 0 to 10 sec) is assigned to
every LAC. Whereas, to address the second problem, SOC based prioritization is
used during the optimization. Therefore, irrespective of the EV location in the
network, the SOC based prioritization favor the EVs whose Pavg is lower than
required to fully charged by its Tout.
6.3.3. Coordination of Decentralized and Centralized Control
As described previously, the centralized control periodically prepares optimum
schedules and acts as inter slot control whereas the decentralized LAC acts as an
intra-slot control to adapt to local voltage deviations in real-time. At the beginning
of each slot, the optimized EV schedules are sent to every plugged-in EV centrally.
Once the schedules are dispatched, the centralized control does not have any
controllability to the EV. However, any voltage limits violation which might occur
during actual operation gets compensated by the LAC action. Specifically, the LAC
executes the control as per Eq. (6.6) to revert the voltage back once the monitored
voltage goes beyond pre-defined thresholds. It should be noted that every EV is
assigned with different response time to avoid the simultaneous switching.
As illustrated in Fig. 6 of J3, the LAC sends the updated SOC and charging
state to the DMS at the end of each time slot and the DMS performs the
optimization for the remaining slots. Therefore, any deviations on EV schedule
resulting from the voltage based LAC are compensated while performing
optimization by the next slot. Moreover, any uncertainties such as load variations,
EV plugged-in/out which cannot be considered during centralized optimization are
addressed by the LAC’s real-time control. The key idea is to use the two controllers
in coordinated manner as an intra- and inter-slot control.
6.4. Observations and Discussions This section presents the SGT performance from power, communication, and
computation perspectives by optimized EV charging coordination. As mentioned in
the previous section, performance of the SGT is demonstrated through optimized
EV charging coordination for 24 hours starting from noon until the noon of the next
day. In particular, the 24 hours charging period is first discretized into 96 numbers
of 15 minute slots. Each 15 minute slot is subsequently scaled down to 40 seconds.
Therefore, all computation parameters are adjusted accordingly by time scale factor
of 22.5 (15*60/40 =22.5). For performing experiment, Tin and Tout are assigned to
each EV as illustrated in Fig. 7a) and a day-ahead electricity price as depicted in Fig
7b) of J3 are considered. Further, daily load profile is created by controlling 5
motors in a pre-defined sequence as shown in Fig. 5 of J3. All parameters are kept
constant throughout the experiment to facilitate comparison of various cases.

80
6.4.1. Power Performance
Three sets of experiments are performed to access the performance of the
testbed from power perspectives. First, a price based optimization, whereby total
charging cost of the EVs is minimized without considering the network condition is
demonstrated. As the EV owner normally do not concern about the network
conditions; they rather want to minimize their charging cost, the price based
optimization forms a benchmark for rest of the cases. The charging profile of the
EVs for the price based optimization is illustrated in Fig. 6.4. The time expressed
on the x-axis corresponds to the scaled down time starting from 12 noon. It can be
observed that the EV charging is closely following the electricity price (Fig. 7b of
J3), thereby charging most of the EVs during the low price periods i.e. between
2000 to 3000 sec (1:00-5:00). Such simultaneous charging of EVs corresponds to
approximately 200 W on top of the base load. In order to avoid testbed congestion,
the experiment was performed using small base loads (LAC, sensors/meters,
controllable switches, routers etc.) which correspond to approximately 12 W.
Fig. 6.4 Optimized EV charging power profile (price based optimization).
In order for the optimum EV schedules to be acceptable from DSO perspectives,
the network constraints should be taken into account. For that reason, the network
constraints are explicitly considered during optimization in the second case to
respect the feeder capacity. Actually, a network limit of 300 W is considered to
avoid feeder capacity violation due to simultaneous charging of EVs. Therefore, the
experiment is performed with a predefined base load profile shown in Fig. 5 of J3.
The power profile comprising the EV charging power and feeder base load is
depicted in Fig. 6.5a). It can be observed that the EV charging profile closely
follows the electricity price as well as respect the feeder capacity limit. Indeed, the
charging profile of the EVs in this case is very similar to the case without
considering the network constraints. The minor differences are that some of the
EVs which were initially scheduled for charging at low price periods get
rescheduled to higher prices, thereby resulting in an increase in total EV charging
cost. For the given configuration, the consideration of network limit results in
increased charging cost by 27.8 % compared to without consideration of the
network constraints. It should be noted that the feeder load slightly exceeds beyond
the feeder limit of 300W (Fig. 6.5a)) due to feeder loss and operational variations
on the efficiency of the EV charger, which were not considered while optimizing.
1200 1800 2400 3000 36000
60
120
180
240
Time in sec.
Lo
ad (
VA
)
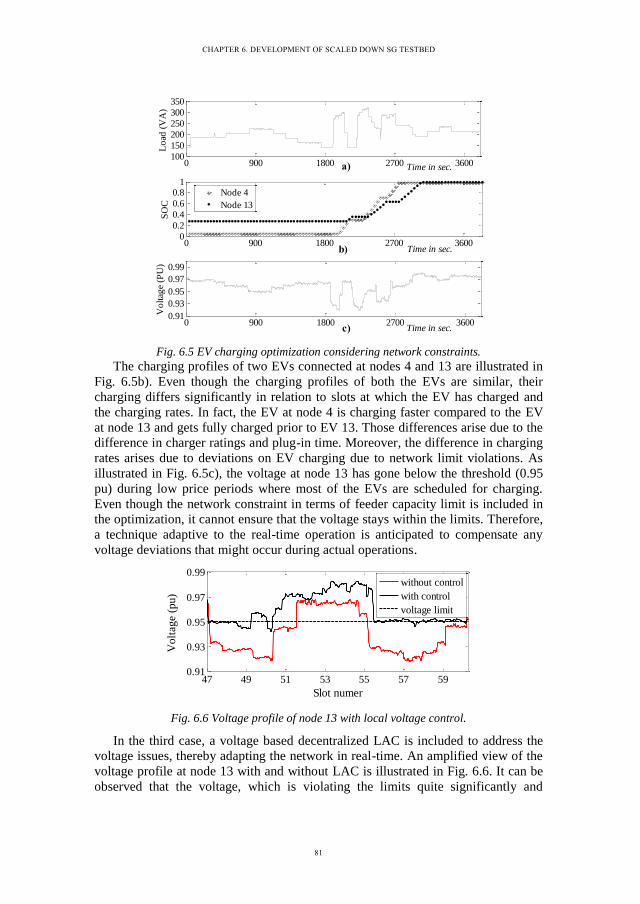
CHAPTER 6. DEVELOPMENT OF SCALED DOWN SG TESTBED
81
Fig. 6.5 EV charging optimization considering network constraints.
The charging profiles of two EVs connected at nodes 4 and 13 are illustrated in
Fig. 6.5b). Even though the charging profiles of both the EVs are similar, their
charging differs significantly in relation to slots at which the EV has charged and
the charging rates. In fact, the EV at node 4 is charging faster compared to the EV
at node 13 and gets fully charged prior to EV 13. Those differences arise due to the
difference in charger ratings and plug-in time. Moreover, the difference in charging
rates arises due to deviations on EV charging due to network limit violations. As
illustrated in Fig. 6.5c), the voltage at node 13 has gone below the threshold (0.95
pu) during low price periods where most of the EVs are scheduled for charging.
Even though the network constraint in terms of feeder capacity limit is included in
the optimization, it cannot ensure that the voltage stays within the limits. Therefore,
a technique adaptive to the real-time operation is anticipated to compensate any
voltage deviations that might occur during actual operations.
Fig. 6.6 Voltage profile of node 13 with local voltage control.
In the third case, a voltage based decentralized LAC is included to address the
voltage issues, thereby adapting the network in real-time. An amplified view of the
voltage profile at node 13 with and without LAC is illustrated in Fig. 6.6. It can be
observed that the voltage, which is violating the limits quite significantly and
0 900 1800 2700 36000
0.2
0.4
0.6
0.81
Time in sec.
SO
C
Node 4
Node 13
0 900 1800 2700 3600100
150
200
250
300
350
Time in sec.L
oad
(V
A)
0 900 1800 2700 36000.91
0.93
0.95
0.97
0.99
Time in sec.
Vo
ltag
e (P
U)
c)
b)
a)
47 49 51 53 55 57 590.91
0.93
0.95
0.97
0.99
Slot numer
Volt
age
(pu)
without control
with control
voltage limit

82
frequently without LAC, stays very close to the pre-defined limit of 0.95. Slight
deviations in the voltage beyond the preset limits are due to discrete control
(ON/OFF) and different response time of the EVs and controllable loads. It
demonstrates that the proposed simple LAC (ON/OFF) helps significantly for real-
time network support. Indeed, the proposed method provides an effective way to
promptly react to the voltage violation in real-time and to provide substantial
backup to the centralized scheduling.
The aforementioned experimental results demonstrate that the testbed is capable
of implementing anticipated controls designed as per centralized-decentralized
control schemes. Successful implementation of the centralized control for
optimization and decentralized control for real-time local control demonstrates the
effectiveness and applicability of the proposed method to in the future electrical
grids maximizing the network support capability.
6.4.2. Computation Performance
Computation performance primarily depends on complexity of the algorithm,
capabilities of the computing machines, and size of the problem. In particular, it
plays a great role on the performance of the testbed as the higher computation time
creates additional delays and consequently impact timely execution of control such
as dispatch of optimum schedules to the EVs. In this study, the computation
performance has been evaluated in terms of computation time required for the
optimization. For a given slot s, the computation time is determined as:
T c rC t t (6.7)
where CT is the computation time, tc is the time when the optimization solver at
MATLAB is called from Python, and tr is the time when Python received back the
optimized schedule. A lower value of CT ensures better computation capability,
thereby faster optimization.
Fig. 6.7 Computation time for optimization process.
The computation time as a function of time slot is depicted in Fig. 6.7 for a
given configuration. It can be observed that the computation time decreases from a
maximum of 0.3 sec to as low as 0.02 sec with increase in the slot number. Such
low computation time demonstrates that the proposed algorithm and optimization
works well for DR execution in the future SG.
0 20 40 60 800.01
0.1
1
Slot number
Tim
e in
sec
.

CHAPTER 6. DEVELOPMENT OF SCALED DOWN SG TESTBED
83
6.4.3. Communication Performance
The communication is responsible not only for exchange of data but also for
timely execution of the control actions. Therefore, reliable communication is
essential for proper functioning of the testbed since the higher communication delay
might cause undesired control and operation. In this study, the communication
performance is demonstrated in terms of data traffic and synchronization methods.
In particular, the synchronization performance of the two synchronization methods
(time-based and coordinated sensor based) expressed in terms of average time
interval between the received measurements (∆m) are depicted in the Fig. 6.8a). For
both mechanisms, measurements are sent every second. It can be seen that the
coordinated synchronization method performs better than the time-based one, with
the ∆m in the range of [1.5 - 4] ms, compared to up to 500 ms using time-based
sensors. The time-based sensors ∆m performance varies from 100 to 400 ms, since
sensors get desynchronized over time due to local processing delays.
Fig. 6.8 Communication performance. a) Synchronization performance using time-based and
coordinated sensors, and b) Captured traffic of the DMS port to/from optical load terminal
As mentioned in the section II-A4 of J3, the polling-based communications
protocol generates low traffic. At low loads, the end-to-end delay remains low and
stable. Fig. 6.8b) depicts the traffic profile (using the Wireshark packet analyzer4)
at the beginning of the experiment. From 0 to 20 seconds, LACs connects to the
DMS in order to register. Then, the DMS interrogates LACs at the beginning of
each slot (50 - 60 and 90-100 sec. in Fig. 6.8b). During these interrogations a peak
transmission of 450 Kbps is observed. To decrease this peak transmission,
broadcast messages could be used instead of one TCP message per LAC.
6.5. Chapter Summary The major contribution presented in this chapter can be categorized into three
parts. First, unlike most of the current SG studies performed from either power or
communication perspectives; this study has demonstrated the multidisciplinary
aspects of the SG. As stated in the IEEE2030P standard about the SG requirement,
this study considers power, communication, and information aspects. A key intent
a) b)

84
of this consideration is to develop the SG solutions which better reflect the real-
world problem and hence possess higher probability of acceptance.
Second, this study has proposed a new algorithm for development of a scaled
down SGT to enable testing and validating key SG features. Specifically, a real-
world 13 nodes, 250kVA, 0.4 kV LV distribution feeder is scaled down to 1 kVA,
0.22 kV and developed in the laboratory as an SGT. The ICT network based on
EPON and meshed NAN is integrated in the scaled down power network to
establish real-time monitoring and control. This novel scaled down based approach
not only fosters faster and cost-effective testbed development but also provides an
effective and riskless method for testing and validating various SG solutions.
Last, an effective centralized-decentralized control algorithm is designed and
integrated in the SGT for exploiting DR. In particular, the performance of this two-
stage algorithm is demonstrated through optimum EV charging coordination in the
SGT. The testbed performance is evaluated by experimenting optimized EV
charging coordination under three scenarios. It is shown that the proposed
centralized and decentralized control approach for EV charging respect the charging
cost, network congestion, and local voltage simultaneously. Furthermore, the real-
time control and coordination among DMS, LAC and EVs is realized in the SGT
through a synchronized exchange of power and control signals through a
heterogeneous meshed network. More importantly, the SGT fosters SG research
and development and facilitates researchers and utilities to analyze and compare
various algorithm and protocols for the future SG.
Wide adaptation of ANM activities, such as DR, network reconfigurations,
impacts protection of distribution system. As such, an adaptive protection algorithm
is developed in the following chapter consideration high penetration of ANM and
DERs in the MV networks.

85
Chapter 7. Proactive and Adaptive
Protection Design
This chapter first outlines key protection issues in distribution system and presents
a detailed methodology to address those issues. In particular, a summary of the
proactive and adaptive overcurrent protection algorithm developed in C8 is
presented to address the protection issues resulting from increased DERs
penetration. Additionally, integration of ANM and adaptive protection is proposed
for addressing protection challenges resulting from increased ANM activities.
7.1. Introduction The increased integration of DERs in a distribution system not only increase
fault current magnitude but also alters the distribution of fault current over the
network, thereby jeopardizing existing protection system. In addition, increased
adaptations of ANM activities, such as network reconfiguration, DR etc., may
changes network topologies which in turn impact the existing protection system.
Therefore, conventional protection schemes, whereby the protective device settings
are computed by decoupling protection from system operation, may render both
ANM and protection system vulnerable which may lead to incorrect operation due
to their interdependencies. As a result, single parameter settings of protective
devices are insufficient to maintain selectivity and sensitivity to fault in a dynamic
network environment and demand an effective adaptive protection.
Current practices to address the protection issues with high DER penetration
include: limiting fault current [160]-[163], local adaptive protection [164]-[165],
and communication assisted centralized protection [166]-[168]. A key idea of the
first approach is to keep same protection settings with and without DERs
connection. This is normally realized either by limiting the DER penetration [160],
[161] or by limiting the fault current via fault current limiters [162], [163]. In the
second approach, centralized communication assisted protection is established,
whereby every protective device report measurements to a central protection unit
for assisting fault identification. Consecutively, the central protection unit computes
relay settings to adapt to post-fault network topology and send the updated settings
to respective protective relays. On the contrary, local adaptive protection provides
an adaptive update of the relay settings consistent with varying network topologies.
In particular, faults are identified on the basis of locally measured current and/or
voltages. Even though the local adaptive protection approaches effectively updates
the relay settings for a particular network topology, they have limited network
visibility. Therefore, any topological changes, such as addition of DERs or network
reconfiguration, may easily lead the local adaptive protection to mal-operate.
Therefore, a two-stage protection strategy is designed in this study to address
key protection issues. First, an offline fault analysis is performed to compute relay
setting for every operating mode, such as grid-connected/islanded, with/without

86
DERs connection, with/without network reconfiguration etc., and then those
settings are stored in respective relay memories. In the second stage, an online state
detection algorithm is realized to detect the operating mode of the network and
operating status of the DERs in real-time, thereby adapting proper relay settings
consistent with the network topology and operating modes. A combination of local
adaptive and communication assisted centralized protection scheme is implemented
for online identification of the network status.
7.2. Key Issues to Protect Future Distribution Grids Protection of a distribution grid is expected to be impacted due to increased
integration of DERs as well as changes in control and operational practice of the
existing networks. The following sections illustrate the key protection challenges
resulting from wide adaptation of DERs and ANM activities at distribution level.
7.2.1. Impacts of DERs in Distribution Protection
Increased DERs penetration alters not only the fault currents magnitude but also
their distribution in the network; thereby challenging the existing protection system.
Nevertheless, the severity of the impact depends greatly on type, size, and location of
the DERs as well as the strength of the grid (weak/strong). For instance, the fault
current contribution from a rotating machine based DER is significantly large and
sustained compared to a small fault current contribution from an inverter interfaced
DER. Similarly, the higher the DER size, the greater the impact is. Nevertheless,
protections blinding and false tripping are foreseen as two key challenges in relation
to maintaining selectivity for permanent faults [164].
7.2.1.1 Protection Blinding
Protection blinding is a case in which the fault current seen by a relay get
changed (increased or decreased) due to connection of DERs in a network, thereby
leading to mal-operate the relay. For instance, a fault current seen by relay R1 for a
fault FP1 gets reduced because of connection of a DER at node 2 as in Fig. 7.1. So,
relay R1 see fault far from the actual location, thereby facing under-reach problem.
Fig. 7.1 Protection blinding and false tripping due to DER penetration.
As a result, relay R1 is prevented to operate for the faults towards the ends of its
protection zone. Similarly, the fault current seen by relay R2 for the fault FP2 gets
increased because of the DER connection. This causes overreach of the relay R2,
12
3 4R
5 6
DER
FP1
FP2
FP3
R1 R2 R3
R4

CHAPTER 7. PROACTIVE AND ADAPTIVE PROTECTION DESIGN
87
thereby operating R2 for out of zone fault FP2. In either fault conditions (FP1 and FP2),
the relays are partially blinded to the fault; upstream relays face under-reach,
whereas the downstream relays face overreach. An effective method to dynamically
adjust the relay reach is adaptive update of relay pickup current on the basis of DER
connection status. For a given operation time, the pickup current should be increased
for upstream and decreased for downstream relays followed by DER connection.
7.2.1.2 False Tripping
False tripping is a case in which connection of a DER causes a relay connected to
a feeder to operate for a fault in an adjacent feeder. If a fault contribution from the
DER exceeds the pick-up current of the relay in healthy feeder, it can lead to a trip of
a healthy feeder before the fault is cleared by the relays in the faulted feeder. For
example, the fault current contribution from the DER for a fault FP3 in Fig. 7.1 might
cause the relay R1 to trip if the fault current seen by relay R1 exceeds its pickup
value. In this case, depending upon the fault current contribution from the DER and
pickup settings of relays R1 and R4, the relay R1 might get falsely tripped. The fault
tripping is a major concern mainly in weak grids having long feeder length since the
relay settings in this case have relatively small pick-up current, thereby leading to
slow response time. The false tripping is commonly dealt by employing a directional
protection integrated with an adaptive relay update per DER connection status.
7.2.2. Impacts of Network Operation in Protection
Wide adaption of the SG concept is leading to significant change in control and
operation of the existing system, such as active network reconfiguration, changes in
mode of network operation (grid-connected/islanded), DR activities etc. Such
transformations in turn impact the network protection in the following ways:
7.2.2.1 Intentional/Unintentional Islanding
Islanding is basically a condition where DER continues to supply power for a
particular area during loss of supply from the utility or for any economic reason.
Typically, the short circuit current during islanded operation is very low compared to
grid-connected mode. This lead to a condition that the relays provided with grid-
connected settings may fail to discriminate fault during islanded operations and vice
versa. As such, dynamic relay setting is desired to adapt the mode of operation. An
approach, whereby the relay settings are changed based on the online identification
of the network operating mode, is presented in this study.
7.2.2.2 Active Network Management
Exploiting controllability of SG, various ANM activities, such as DR, network
reconfiguration etc., are foreseen to be widely integrated in the distribution system.
Such anticipated changes may lead to changes in network topology, thereby causing
mis-coordination of the protective devices. For instance, distribution feeder
reconfiguration done for decongesting the network may change the fault current
distribution and may demand to update settings of protective devices to maintain
selectivity. Such issue is dealt with by integrating the ANM activities into the
protection philosophy such that the protective device settings are updated to adapt
to the dynamic network topology.

88
7.3. Implementation of Proposed Algorithm The proposed protection methodology is realized in two stages. The first stage is
proactive protection; whereby an offline fault analysis is performed to compute
relay settings for various operation modes and the second stage is an adaptive
protection, in which an online state detection algorithm is implemented to detect
correct operating state of the network for activating proper relay settings. First,
offline fault analysis as illustrated in Fig. 3 of C8 is performed to compute relay
settings, namely TMS and relay pickup current ‘IP’, for the following modes.
Grid connected operation without DERs (base case)
Grid connected operation with DERs
Islanded operation with DERs
Network reconfiguration
It should be noted that some operating modes may have more than single
settings, for instance, settings of the relays for grid connected operation with DERs
could have multiple settings depending on (N-1) DERs contingencies. The relay
settings for all operating modes are then assigned to respective relay memories and
the proper setting get activated during actual operation per online identification of
the network operating mode.
A modified zonal concept based state detection algorithm is implemented to
facilitate online identification of the network operating states. The distribution
network is decomposed into various zones, as shown in Fig. 2 of C8, such that fault
current contributions from the DERs in a zone has minimal impact on fault
discrimination of the relays in other zones. In particular, (N-1) DER contingency in
a zone does not demand changes on the settings of the relays in the other zones. For
example, if the fault current contribution from the DER, in Fig. 7.1 does not impact
relay R4, then the feeder F1−2−3−4 is taken as a single zone and the rest as another
zone. However, if the DER impact the setting of R4, both the feeders, F1−2−3−4 and
F1−5−6, should be a single zone. An extensive fault analysis considering (N-1) DER
contingency for different fault types, fault locations, and fault impedance, forms a
basis of the zone formulation.
A key idea of zone formation is to let the protective devices within a zone to
operate independent of the DER status in the other zones. Particularly, each relay
within a zone, called IZRs, is designed to detect ON/OFF states of the DERs within
that zone and the relays at zone boundaries, called ZSRs, are designed to detect
major topological changes, namely grid-connected/islanded, network
reconfiguration etc. In fact, a central protection unit uses an event driven
communication to ZSRs during major topological changes, and the ZSRs in turn
transmit the event to every IZRs within their zone. Indeed, relays which are at zone
boundaries act as IZR as well as ZSR. The proactive protection is followed by
online fault identification as illustrated in Fig. 3 of C8 and described as follows.
7.3.1. State Detection of Distributed Energy Resources
As zones are formed such that (N-1) contingency within a zone does not impact
setting of the relays in other zones and vice versa, IZRs need to be updated based
on the ON/OFF status of DERs within that zone only. Thus, every IZR is

CHAPTER 7. PROACTIVE AND ADAPTIVE PROTECTION DESIGN
89
configured with an event driven local communication for every change in operating
status of DERs within the zone. Indeed, following any changes in DER status
within a zone, IZRs communicates with adjacent relay(s) to adapt their setting,
particularly the IP and TMS accordingly. Unlike conventional communication
assisted protection, where every relay talk back and forth with a central
coordinating unit, the proposed algorithm use limited event driven communication
where ON/OFF states of the DERs within the zone are communicated with the
adjacent IZR(s). It should be noted that there is no need of inter-zone
communication, thereby avoiding fault discrimination issues resulting from
communication delays and jitters. Additionally, single point of failure in the
centralized communication assisted protection approach is avoided since the
protection failure is limited maximally to a zone.
7.3.2. Detection of Islanded/Grid-connected Modes
Switching of network operation from grid-connected to islanded mode and vice
versa significantly alters the fault current seen by relays. Therefore, it is desirable to
promptly identify the operating mode such that relays update their settings to the
respective mode of operation. A simplified interlocking approach is implemented in
this study for online detection of the operation mode, whereby grid connecting relay
R12 identifies the operating state (grid-connected/islanded) of the network.
Whenever relay R12 trips for any reason, such as an upstream fault, upstream
network maintenance, or intentionally letting the downstream network to run in
islanded mode, the switching status of R12 is communicated to all ZSRs, which
enables the relays to switch their setting to islanded mode. Similarly, when grid
switches back to the grid-connected mode, the R12 status is communicated to the
every ZSRs so as to switch back the relay settings to grid-connected mode.
7.3.3. Detection of Changes in Network Topologies
As wide adaptation of ANM may lead to selectivity issues to the protection
coordination, it is desirable to integrate network operation and network protection.
Therefore, an approach, whereby the ANM is integrated to the protection, is
proposed in this work such that any ANM activity requiring update of relay settings
is taken care of by the protection unit. In particular, such integrated approach lets
the relays to adapt their setting per ANM and provides increased operational
flexibility to ANM activities. Following the ANM activity, the centralized
protection unit communicates the reconfiguration status to the respective relays
using centralized communication assisted protection and direct the relays to switch
their settings. For instance, whenever a network reconfiguration is done as shown in
Fig. 4 of C8 (connect R64 & R46 and disconnect R23 & R32), then respective relays
(R12, R23, and R26) gets information from the central protection unit and update their
settings to ensure protection coordination during dynamic network topology.
7.4. Observations and Discussions In order to demonstrate the performance of proposed method, MV (10 kV)
distribution feeder as illustrated in Fig. 4 of C8 is used. The details of the test
network including loading, line parameters, and DER types and connections are
presented in Section IV.A of C8.

90
Relay settings, namely pickup current (instantaneous pick-up, IPIns
, and time-
overcurrent pickup, IPTOC
) and TMS are first computed for all relays for every
network configurations. A key idea of having IPIns
and IPIns
setting is to
instantaneously clear the high fault-currents and provide time delay to maintain
selectivity during lower fault-currents. The IPIns
for instantaneous trip is set such
that any bolted fault within the relay’s protection zone is cleared instantaneously. In
this study, an instantaneous operating time of 35 milliseconds is taken for
accounting operation delay of the physical relays as well as for avoiding relay trip
for temporary faults. Additionally, the IPTOC
for the time-over current protection is
set as 1.5 times nominal load current. A key intent to set IPTOC
equals 1.5 times
nominal load current is for avoiding overload tripping as well as maintaining
sensitivity to faults. Selectivity is established by assigning proper time of operation
to each relay. In particular, TMS of each relay is calculated using IEC very inverse
characteristics described in (7.1) such that every relay provides backup protection
with a margin of 50 milliseconds or more [172].
*
1r
P
AT TMS B
I I
(7.1)
where Tr is operating time of relay; IP and I are pickup current and actual fault
current through the relay; and A, B, and ρ are constants whose values equals 13.5,
0, and 1 respectively. The parameters are selected based on IEC very inverse
characteristics and are kept constant provided fault discrimination is realized by
adjusting IP and TMS settings. Fig. 7.2 illustrates relays settings and corresponding
characteristics for a base case, where the network is connected to the main grid and
has no DERs integration.
Fig. 7.2 a) Relay settings and b) Time-overcurrent characteristics.
It is observed that each relay is properly coordinated with both upstream and
downstream relays such that each upstream relay provides time delayed backup to
the downstream relays. However, relays may lose selectivity during instantaneous
modes of operation. For instance, if the fault current exceeds 3 kA, it forces the
.1 1 10 4.01
.1
1
10
I PIns
I PTOC
R 12 15.77 .345 .03
R 23 5.66 .259 .062
R 34 3.15 .195 .1043
R 45 1.786 .088 .1342
R 26 2.02 .093 .078
R 67 1.78 .044 .03
Relay
Pickup
current (kA) TMS
R12
R34
R23
R26
R45
R67
a) b) Current (kA)
Tim
e (s
ec.)

CHAPTER 7. PROACTIVE AND ADAPTIVE PROTECTION DESIGN
91
relays R34 and R45 to enter to their instantaneous operation, thereby leading them to
operate inappropriately. To avoid such problem, instantaneous as well as time
overcurrent settings are adapted per the procedure described in the following. It
should be noted that settings of relays Rd1, Rd2 and Rd3 is fully dependent on
corresponding DER type and rating and does not get impacted due to
connection/disconnection of DGs in other parts of the network. Therefore, their
fault trip mechanism is simply set according to the low voltage ride through
capability as presented in [164]. Explicit examination of DER relay (Rd1, Rd2, and
Rd3) coordination with the other relays is not the focus of this study.
7.4.1. Adaptive Relay Update for Protection Blinding
The changes in fault current seen by relays due to DER(s) integration impact the
relay reach and in turn cause relay mal-operation. In particular, fault current seen by
various relays in the test feeder with and without having DER integration is
illustrated in Fig. 7.3. Indeed, it is depicted that some relays are facing under-reach
issues due to decrease in fault current flowing through them, whereas the others are
facing overreach issues due to increase in fault current flowing through them. For
instance, relay R12 face the under-reach problem as the fault current seen by it gets
decreased due to fault current contribution from the DERs, whereas the other relays
face overreach due to increased fault current seen by them. Particularly, every relay
gets partially blinded to faults due to fault current contribution from the DERs.
Nevertheless, the extent of blinding and hence the mal-operation of the relay
depends greatly on relay settings, network strength, fault type, and location.
Fig. 7.4a) illustrates a fault current seen by relays R34 and R45 (as in Fig. 4 of
C8), fault signal, and tripping signals for corresponding relays for a bolted fault F1
as illustrated in Fig. 4 of C8. It can be observed that the fault current seen by R34
increases due to DER contribution. Such condition increase the relay reach and lead
the relay to instantaneously trip for out of zone fault, F1. In particular, the fault F1
forced both the relays R34 and R45 into instantaneous operating modes, thereby
undesirably tripping R34 as shown in Fig. 7.4a) for the out of zone fault.
Fig. 7.3 Maximum fault current seen by relays for different cases.
To overcome the protection blinding issue, pickup settings of the relays are
updated adaptively on the basis of the connection status of the DERs identified as
per the online state detection algorithm presented in section 7.3. In fact, the pickup
settings, IPIns
& IPTOC
, of the relays R34 and R45 are increased followed by detection
of DER connection to avoid their overreach, thereby discriminating out-of-zone
R12 R23 R34 R45 R26 R67 R12 R23 R34 R45 R26 R67a) b)
R12 R23 R34 R45 R26 R67
5
10
15
20
Cu
rren
t (k
A)
1 2 3 4 5 6
5
10
15
20
Cu
rren
t (k
A)
Without DERs
With DERs
Grid connected
Islanded

92
faults. The response of relays R34 and R45 for the same fault, F1, after implementing
the proposed adaptive algorithm is illustrated in Fig. 7.4b). It can be clearly
observed that relay R45 gets tripped well before R45 to clear the fault F1, thereby
avoiding the overreach of R34. This indeed clears the fault by isolating the section of
the network downstream to R45, thereby leaving the rest of the network, network
upstream to R45, to operate normally.
Fig. 7.4 a) Protection blinding of relay R34 and b) Solution by proposed adaptive method.
7.4.2. Adaptive Relay Update for False Tripping
False tripping of a relay occurs when fault current contribution from DER on a
healthy feeder cause to trip it for fault in the adjacent feeder. Fault current
contribution from DER3 for a bolted fault F2 in the test network (Fig. 4 of C8)
causes the relay R26 to operate before R23 since the pickup current of the R23 is
significantly higher than that of the R26. The 1st subfigure in Fig. 7.5a) depicts
breaker status corresponding to relays R23 and R26, whereas the 2nd
and 3rd
subfigures illustrates the fault current seen by the respective relays for the fault F2.
It is seen that both R23 and R26 enters into instantaneous tripping modes for the
bolted fault F2, thereby causing a false tripping of the healthy feeder F2-6-7.
Fig. 7.5 a) False tripping of relay R26 and b) Solution by proposed adaptive method.
To overcome the false tripping problem, directional blocking mechanism
0 .025 .05 .075 .1 .125 .15
-4.4
.2
.4
.6
.81
-1.4
1.6
4.5
-4.5
-1.5
1.7
4.6
a) Time (sec.)
kA
kA
0
Time (sec.)b)0 .025 .05 .075 .1 .125 .15
BRK34 BRK45 FLT_apply BRK34 BRK45 FLT_apply
IBRK45A IBRK45B IBRK45C IBRK45A IBRK45B IBRK45C
IBRK34A IBRK34B IBRK34C IBRK34A IBRK34B IBRK34C
0 .025 .05 .075 .1 .125 .15 0 .025 .05 .075 .1 .125 .15
-20.1
.2.4.6.81
-6.2
7.7
21.6
-1.8
-0.6
0.5
1.7
0
kA
kA
a) Time (sec.) Time (sec.)b)
BRK23 BRK26 FLT_apply BRK23 BRK26 FLT_apply
IBRK23A IBRK23B IBRK23C IBRK23A IBRK23B IBRK23C
IBRK26A IBRK26B IBRK26CIBRK26A IBRK26B IBRK26C

CHAPTER 7. PROACTIVE AND ADAPTIVE PROTECTION DESIGN
93
integrated with an adaptive update of the pickup current is implemented.
Irrespective of the previous operating conditions, relay R26 and R62 are set to
forward and reverse directional mode respectively and the setting of relay R62 is
increased once the state detection algorithm detects DERs connection. In particular,
IPIns
and IPTOC
of the R62 are adaptively updated to 2.23 kA and 0.302 kA
respectively to overcome the false tripping. The operation of the corresponding
relays (R26 and R23) after implementing proposed algorithm is presented in Fig.
7.5b). It is clearly seen from Fig. 7.5b) that the online state detection algorithm
based adaptive relay updates avoid the false tripping of healthy feeder F2-6-7.
7.4.3. Adaptive Updates for Grid-connected/Islanded Mode
As illustrated in Fig. 7.3b), fault currents seen by relays vary greatly while
switching from grid-connected to island mode and vice versa. The fault current
distribution in the network also varies significantly from grid-connected to islanded
modes. For instance, fault current seen by the relay R23 is significantly higher than
the fault current seen by R34 in grid connected mode, whereas it is significantly
lower in islanded mode. In addition, the changes in fault current seen by relay R23 is
significantly large compared to the changes seen by the R45. It leads to a condition
where the relays lost their coordination during islanded condition unless their
settings are updated adaptively.
Fig. 7.6 a) Relay settings for islanded operation and b) Time-current curve of relays.
A centralized interlocking mechanism described in Section 7.3 has been
implemented to switch the relay settings once the islanded condition is detected. In
particular, the feeder connecting relay detects the islanded/grid-connected modes
and communicates that status to each relay. Each relay then update their settings
based on the status received from the centralized protection unit. The relay settings
for the islanded mode of operation are illustrated in Fig. 7.6a) and their
corresponding characteristics are presented in Fig. 7.6b). It can be observed from
the relay settings that they have changed significantly and are quite different.
Therefore, both the TMS and IP settings have adapted to establish coordination
among the relays in islanded mode. The proposed centralized communication
0.1 1 410
-2
10-1
100
101
Fault current (kA)
Tim
e (s
ec.)
R45
R34
R23
R26
R67
I PIns
I PTOC
R 23 1.65 .251 .0702
R 34 1.05 .215 .0253
R 45 0.85 .0485 .05
R 26 1.86 .302 .1204
R 67 0.65 .044 .03
Relay
Pickup
current (kA) TMSR34
R23
R62
R45
R67
a) b) Current (kA)
Tim
e (s
ec.)

94
assisted transfer-trip method adaptively switches the relay settings depending on the
connection status of the grid, thereby ensuring fault selectivity. Unlike existing
centralized communication assisted protection, whereby central protection unit talk
back and forth to every protecting units, the proposed event driven transfer trip
method demonstrates better performance.
7.5. Chapter Summary Protection of future distribution system has been challenged not only due to
increased DER integration but also due to wide adoption of ANM activities. In
particular, increased DER penetration alters fault current magnitude as well as its
distribution in the network, thereby changing the reach of the relays. In general, the
upstream relays face under-reach, whereas the downstream relays face overreach
problems. Moreover, ANM activities, namely network reconfigurations, DR, may
lead to modification in network topology and jeopardize the protection. Therefore,
conventional relay commissioning approach, whereby relays are assigned with a
single setting for the entire operating scenarios, faces serious issues to discriminate
fault in the future distribution system.
To address the issue, a two-stage protection approach is developed along the
course of this study, whereby an offline fault analysis is firstly performed to
compute relay settings for every possible operating mode which are then stored in
respective relay memories. In second stage, an online state detection algorithm is
implemented to detect the operating state of the network such as ON-OFF status of
individual DERs and/or modes of operation of the network (grid-
connected/islanded or reconfigured network). In particular, a local adaptive
protection was implemented to detect small topological changes in the network,
namely the ON/OFF states of a DER within a zone. This is done by establishing an
event driven communication of the relay to the adjacent relays within the zone. For
instance, whenever there is change in operating states of any DER, the state is
transferred to the adjacent relays within that zone. Upon receipt of DER status, each
relay activates proper settings to adapt to the changed network topology.
A centralized communication assisted protection is implemented to detect
large topological changes, such as grid-connected/islanded or reconfiguration status
of the network. The grid connecting relay is equipped with an islanding and grid-
reconnection detection algorithm. Therefore, any changes in the network operation
modes is detected by the grid connection relay and transferred to every ZSR for
directing them to update their settings accordingly. Similarly, the central protecting
unit, coordinated with the ANM activities, transfers the network status to respective
ZSRs provided the ANM activity desire the relay updates. The simulation results
demonstrate that the proposed method effectively eliminate major protection issues,
namely the protection blinding and false tripping. Therefore, the proposed proactive
and adaptive protection approach demonstrates better performance to establish
selectivity and sensitivity in dynamic network topology, thereby providing a
framework for protecting future SG.

CHAPTER 8. CONCLUSION
95
Chapter 8. Conclusion
This chapter presents a summary and draws conclusions based on the outcomes of
the entire PhD thesis. In particular, major scientific contributions with respect to
novelty and applications are presented. Since this study opened a new research
window on SG area, perspectives for the future works are also presented.
8.1. Summary and Conclusions This dissertation has addressed various technical issues in relation to the
utilization of flexible demand and local generation for supporting LV networks.
Moreover, the study address issues related to the protection of MV networks in
presence of DER and ANM activities. Therefore, the key objectives of this research
is to develop suitable control architecture for exploiting DR, quantify impact of DR
to the LV network, develop DR control methods and strategies for network support,
demonstrate the developed DR methods in a physical testbed, and develop an
adaptive protection algorithm for varied network topologies. In particular, those are
the major issues to be resolved to make the DR deployment technically and
economically viable.
In the first part of this study, an intelligent control architecture a so called the
HCA is developed for coordinating the key SG actors, namely consumers, DSOs,
aggregators, and market entities. On the one hand, the architecture exploits flexible
demand for supporting the network, whereas, on the other hand, it facilitates market
participation to enable commercial trading of the flexibility. Three DR control
loops, primary, secondary, and tertiary, are developed for enabling the flexible
loads to support the distribution network in various ways. The primary loop is
capable of supporting the network in real-time, such as real-time voltage support
and power balancing, due to its prompt response (range of fraction of seconds)
capability. Similarly, the secondary loop is suitable for economic dispatch of
flexible loads leading to its response in the ranges of few minutes, thereby acting as
a potential resource for congestion management and intra-day balancing. Finally,
the response time of the tertiary loop ranges from few minutes up to a day, thereby
making it suitable for day ahead or intraday scheduling. As each control loop has
different latency, time-coordination is established to enable each control loop to
backup each other. For example, any deviations resulting from real-time primary
control is backed-up by instant up/down regulation capability of the secondary
control and so on.
In order to deploy demand flexibility, existing DR techniques are categorized
into ADR, DLCDR, DDDR, and PDR, which are then assigned to respective
control loop of the HCA. More specifically, the primary loop executes ADR, the
secondary loop executes DLCDR, and the tertiary loop executes DDDR and PDRs.
Moreover, a heterogeneous communication infrastructure is integrated to the HCA
to realize the anticipated control and communication in the HCA. The performance

96
of the architecture is demonstrated in a power and communication co-simulation
environment. The co-simulation results demonstrated that the proposed architecture
is capable of effectively integrating responses from widely distributed loads and
provide a technical and commercial framework for exploiting the flexibility.
Next, DR control strategies are developed to exploit flexibility from key
flexible loads and local generation. In particular, EVs HPs, and EWHs are
considered as potential flexible loads as they are anticipated new loads resulting
from electrification of the heating and transportation sector, while solar PV is
considered as local generation due to its wide penetration at residential consumer
level. Impacts of high integration of those anticipated loads and generation is
accessed in relation to a LV distribution network. Moreover, the performance of the
developed models and DR control strategies are demonstrated in the LV network.
Even though benefits and impacts of the proposed DR control strategies are
quantified with reference to a particular LV network, the developed models, control
strategies, and algorithms are generic which can be applied to any network. The
outcome from this part of the study consists of algorithms to exploit the demand
flexibility from the EVs, HPs, and EWH for supporting the LV network in various
ways. Indeed, sizable rating together with storage capability of those loads
demonstrated great potential for supporting the future grid. In order to present more
realistic scenarios particularly in Denmark, integrated control of active loads and
local generation are developed. The outcomes demonstrated that operation of the
EVs and PVs can be made supportive to each other through the proposed DR
control strategies.
Furthermore, despite having significant research on SG, the practical
demonstration considering multi-disciplinary aspects of the SG is still lagging. In
this regards, a novel approach is developed in this study to scale down a larger
distribution network into a small scale testbed. In fact, a LV test case network is
scaled down to a 1 kVA testbed and the scaled down testbed is built in a laboratory
for practical demonstration of developed DR models and control strategies. An
optical fiber and TCP/IP based communication is integrated in the testbed to enable
control and communication of the data. The testbed performance is demonstrated by
adapting combined centralized-decentralized control algorithms for EV charging
coordination. In particular, the decentralized control is implemented at each
consumer location and is realized by nano-computers capable of real-time
monitoring and control. Similarly, the centralized control is implemented at central
place and realized using DMS. The centralized control prepares and dispatches
optimum charging schedules to every EV with 15 minutes latency and the
decentralized control adaptively adjust the charging power on real-time based on
locally monitored voltage. At the end of each time slot, the decentralized control
sends actual data (charging power, current, and POC voltage) back to the
centralized control using ‘TCP/IP – optical fiber’ to facilitate the centralized control
to update EV charging schedules. The centralized and decentralized control work as
inter-slot and intra-slot control respectively for realizing the proposed algorithm.

CHAPTER 8. CONCLUSION
97
Finally, an adaptive overcurrent protection is designed for a MV distribution
system having high share of RESs. In the future grid, the protection is affected not
only by bidirectional power flow due to RESs but also due to the ANM activities,
such as demand response, network reconfigurations etc. Therefore, unlike the
conventional protection methodology where protective settings are made static, an
approach to adapt relay settings based on dynamic network topologies is desired. In
particular, an integrated local and central communication assisted protection
strategy is developed for dynamically setting the protective devices based on the
ON/OFF status of the DGs and changes in network topologies. The developed
methodology integrates the protection and ANM such that the protection settings
are investigated and ensured for every network operating mode and topology. The
performance of the developed method is demonstrated in a MV distribution
network using RTDS. The proposed protection algorithm provides a new dimension
on protection as the protection of the future grid is expected to be impacted by
various ANM and DERs integrations.
In summary, the outcomes from this research provide a framework for
exploiting demand flexibility from widely distributed consumers/prosumers, which
in turn are potential solutions for DSOs to deal with network technical issues. In
addition, the outcomes provide economic incentives to the consumers to trade their
flexibility to electricity markets. Therefore, this study provides a framework to
integrate heating, gas, and transportation sectors into the electrical system, thereby
supporting Danish government’s 100% renewable energy goal by 2050.
Furthermore, this study serves as a reference for future researches on DR control
and utilizations for various network support activities.
8.2. Major Contributions The major contributions of this dissertation are as follows:
HCA to provide a framework for exploiting demand flexibility from the
residential consumers and enable their participation in the electricity marketsis
developed. A primary, secondary, and tertiary control loop are designed to
activate various DRs and establish their time-coordination. Those control loops
exploit demand flexibility to support the network in several ways, such as local
voltage support, congestion management, peak saving, economic optimizations,
and so forth.
Detailed models of the key flexible loads, local generation, and distribution
network are developed. Potential impacts of the integration of the electrical,
heating, and transport sectors in relation to the LV distribution network are
accessed.
Various DR control strategies for exploiting the demand flexibility from
different load types are developed. In particular, voltage controlled dynamic
DR, ADRs, DDDRs, PDRs, and DLCDRs are realized to support the network.
An optimization algorithm to control key residential loads, namely EV, HP, and
EWH, and local generation, namely solar PV is developed. Both the technical

98
and economic aspects are addressed by accounting consumer comfort, network
constraints, and electricity cost.
A novel two-stage control algorithm is developed, whereby the central stage
activates a control using optimum set-points resulting from the optimizations
and the local stage adaptively perform real-time control using predefined control
logic based on local voltage variations.
An algorithm to integrate multi-disciplinary aspects of the DR by performing
power and communication co-simulation is developed. As the DR performance
in the future grid depends on the performance of power and communication
aspects, the developed solutions from the co-simulation environment hold
higher probability of acceptance for real-world applications.
Demonstration of the developed DR control strategies in smart grid testbed is
performed. A scaled-down smart grid testbed is developed, whereby a
centralized and decentralized control algorithm is demonstrated. A
heterogeneous communication infrastructure is integrated to the testbed to
enable the control of the physical loads and exchange of data between local and
central controllers.
Adaptive protection algorithm for ensuring protection coordination in dynamic
network topologies is developed. The protection algorithm also integrates ANM
such that the protection is ensured following the activation of ANM activities.
8.3. Future Work Even though various aspects of DR control and coordination in the future grids
have been covered in this study, further investigation of some of the other aspects is
interesting. Some aspects that are deemed potential for future work are as follows:
Additions of new loads, namely HPs, Evs, and EWHs, and local generation,
namely PVs, have several consequences on power quality. Frequent control of
inverter interfaced EV and PV might inject harmonics, whereas the high starting
currents of the HPs might contribute to the voltage flicker. In addition to the
steady state voltage deviations considered in this study, detailed investigation on
impacts of those loads and generation on the power quality would be interesting.
The electricity consumption behavior of the consumers is stochastic; their
demand varies randomly over time. It would be interesting to implement
probabilistic models to quantify their flexibility and impacts to the grids.
The application of active demand control is demonstrated in relation to its
capability for supporting the network for voltage control and congestion
management. It would be interesting to investigate the application of the
developed architecture and DR control methodologies for frequency support.
The future smart grid will be a multi-disciplinary field comprising power,
information, and communications. The communication performance in this

CHAPTER 8. CONCLUSION
99
study is demonstrated in terms of the latency and delay. However, detailed
investigation of the communication performance including latency, delay,
throughput, jitter, and error rates would be interesting to better access the
practical viability of the developed DR control methods.
As various storage technologies are becoming competitive for grid supports, it
would be interesting to develop a hybrid control algorithm considering DR and
storage technologies.
An adaptive overcurrent protection for the MV network is developed in this
study. An integration of the LV network protection with the ANM activities
would be an interesting study that could support the DR deployment better.
Detail investigation on the need of actual control instrumentation to realize the
proposed control strategies as well as observability and controllability of the
grid would be an interesting study.


ERROR! REFERENCE SOURCE NOT FOUND.
101
BIBLIOGRAPHY [1]. European Commission, “2030 framework for climate and energy policies,”
[Online]. Available: http://ec.europa.eu/clima/policies/2030/index_en.htm,
2014.
[2]. European Commission, “European 20-20-20 Targets,” [Online]. Available:
http://ec.europa.eu/clima/policies/package/index_en.htm, 2013.
[3]. Eurostat, “Renewable energy statistics,” [Online]. Available:
http://ec.europa.eu/eurostat/statistics-
explained/index.php/Renewable_energy_statistics.
[4]. International Energy Agency, “World energy outlook 2014,” [Online].
Available: http://www.worldenergyoutlook.org/publications/weo-2014/,
2014.
[5]. The Danish government, “Our future energy,” Technical Report, Nov.
2011.
[6]. The European Wind Energy Association, “Wind in power,” Technical
Report, Feb. 2014.
[7]. The Danish Ministry of Climate, Energy, and Building, “Smart grid
strategy: The intelligent energy system of the future,” Technical report,
May 2013.
[8]. P. Sorknæs, H. Mæng, T. Weiss, and A. N. Andersen, “Overview of the
Danish power system and RES integration,” Technical report, Jul. 2013.
[9]. I. D. D. C. Mendaza, “An interactive energy system with grid, heating, and
transportation systems”, PhD Dissertation, Aug. 2014.
[10]. Global wind energy council, “Global wind statistics 2014,” Technical
report, Feb. 2015.
[11]. Energinet.dk, “Wind turbines reached record level in 2014,” [Online].
Available:http://www.energinet.dk/EN/El/Nyheder/Sider/Vindmoeller-
slog-rekord-i-2014.aspx , Jan. 2015.
[12]. Energinet.dk, “Energinet.dk’s analysis assumptions 2013-2035,”
Technical report, Apr. 2013.
[13]. J. R. Kristoffersen, “The horns rev wind farm and the operational
experience with the wind farm main controller,” in Proc. Copenhagen
Offshore Wind 2005, pp. 1-9, Oct. 2005.
[14]. D. V. Vittal and T. Harbour, “Impact of increased penetration of DFIG-
based wind turbine generators on transient and small signal stability of
power systems,” IEEE Trans. Power System, vol. 24, no. 3, pp. 1426-1434,
Aug. 2009.

102
[15]. E. Muljadi, N. Samaan, V. Gevorgain, J. Li, and S. Pasupulati, “Short
circuit current contribution for different wind turbine generator,” in Proc.
IEEE PES General Meeting, pp. 1-8, Jul., 2010.
[16]. Danish Energy Agency and Danish Board of District Heating, “District
heating - Danish and Chinese experience,” Technical Report, 2012.
[17]. Danish Ministry of Climate, Energy, and Building, “DK Energy
Agreement,” Technical document, March, 2012.
[18]. Energinet.dk, “Natural gas transmission and distribution system,”
[Online] Available: http://www.energinet.dk/EN/GAS/, 2014.
[19]. Energinet.dk, “Gas consumption and supplies 2015-2050,” [Online]
Available: http://www.energinet.dk/EN/GAS/ , Dec., 2015.
[20]. Energitnet.dk, “Natural gas and Biogas consumption trend,” [Online].
Available: http://www.energinet.dk/EN/GAS/ , 2014.
[21]. Energinet.dk, “Hydrogen injection in the natural gas network,” [Online].
Available: http://www.energinet.dk/EN/GAS/ , 2014.
[22]. Ministry of Transport and Statistics Denmark, “Key figures for transport
2011,” Statistical Survey, Jun. 2012.
[23]. North Sea Region Electric Mobility Network, e-mobility NSR, “Danish
experiences in setting up charging infrastructure for electric vehicles with
special focus on battery swap stations,” Technical report, Mar. 2013.
[24]. Energinet.dk, “Strategy plan 2010,” Technical report, 2010.
[25]. X. Xiu and B. Li, “Study on energy storage system investment decision
based on real option theory,” in Proc. IET Sustainable Power Generation
and Supply, pp. 1- 4, Sep. 2012.
[26]. F. M. Andersen et al., “Analysis of demand response in Denmark,” Risø-
R-1565(EN), Risø National Laboratory, Oct. 2006.
[27]. NordPool Spot, “Trade at the Nordic Spot Market (NordPool Spot AS) -
The world’s first international spot power exchange,” Technical report,
Apr. 2004.
[28]. NordPool Spot, “Annual report 2013,” Technical report, 2013.
[29]. NordPool spot, “Intraday Market Elbas,” [Online]. Available:
http://www.nordpoolspot.com/TAS/Intraday-market-Elbas/.
[30]. Energinet.dk, “Regulation C2: The balancing market and balance
settlement,” Technical regulation, Dec. 2008.
[31]. Energinet.dk, “Smart grid in Denmark 2.0,” Technical report, [Online].
Available:http://energinet.dk/SiteCollectionDocuments/Engelske%20doku
menter/Forskning/Smart%20Grid%20in%20Denmark%202.0.pdf
[32]. International Energy Agency, “Demand-side management,” [Online].
Available: https://www.iea.org/techinitiatives/end-use-electricity/demand-
sidemanagement/.

ERROR! REFERENCE SOURCE NOT FOUND.
103
[33]. I. Lampropoulos, W. Kling, P. Ribeiro, and J. van den Berg, “History of
demand side management and classification of demand response control
schemes,” in Proc. IEEE PES General Meeting 2013, pp. 1-5, Jul. 2013.
[34]. P. Rowles, “Demand response and demand side management” [Online].
Available: http://www.energyadvantage.com/blog/2010/02/demand-
response-demand-side-management-what%E2%80%99s-difference/.
[35]. B. Davito, H. Tai, and R. Uhlaner, “The smart grid and the promise of
demand-side management,” Technical report, 2010.
[36]. US Department of Energy, “Demand Response.” [Online] Available:
http://energy.gov/oe/technology-development/smart-grid/demand-response
[37]. V. S. K. M. Balijepalli, V. Pradhan, S. A. Khaparde, and R. M. Shereef,
"Review of Demand Response under Smart Grid Paradigm," in Proc.
IEEE PES Innovative Smart Grid Technologies, pp. 236 – 243, Dec. 2011.
[38]. M. H. Albadi and E. F. El-Saadany, "Demand response in electricity
markets: An overview," in Proc. IEEE PES General Meeting 2007, pp. 1-
5, Jun. 2007.
[39]. F. Boshell and O. P. Veloza, “Review of developed demand side
management programs including different concepts and their results,” in
Proc. IEEE/PES Transmission and Distribution Conference and
Exposition: Latin America, pp. 1-7, Aug. 2008.
[40]. P. V. Dievel, K. D. Vos, R. Belmans, and K. D Vos, “Demand response
in electricity distribution grids: regulatory framework and barriers,” in
Proc. International Conference on the European Energy Market, pp. 1-5,
May 2014.
[41]. O. Erdinc, N. G. Paterakis, T. D. P. Mendes, A. G. Bakirtzis, and J. P. S.
Catalao, “Smart household operation considering bi-directional EV and
ESS utilization by real-time pricing based DR,” IEEE Trans. Smart Grid,
vol. 6, no. 3, pp. 1281-1291, Sep. 2014.
[42]. C. P. S. Gill, Y. S. Brar, and K. Singh, “Incentive based demand response
program: An effective way to tackle peaking electricity crisis,” in Proc.
IEEE Canadian Conference on Electrical and Computer Engineering, pp.
1-6, 2012.
[43]. P. Khajavi, H. Abniki, and A. B. Arani, “The role of incentive based
demand response programs in smart grid,” in Proc. 10th
international
Conference on Environment and Electrical Engineering, pp. 1-4, May
2011.
[44]. L. Ying-chen, C. Lu, and C. Xing-ying, “Economic benefit analysis of
incentive-based demand response,” in Proc. International Conference on
E-product, E-service and E-Entertainment, pp. 1-4, Nov. 2010.
[45]. M. A. A. Pedrasa, M. M. Oro, N. C. R. Reyes, and J. R. I. Pedrasa,
“Demonstration of direct load control of air conditioners in high density
residential buildings,” in Proc. Innovative Smart Grid Technology-Asia,
pp. 400-405, May 2014.
104
[46]. S. R. Mattix, M. K. Donnelly, D. J. Trudnowski, and J. E. Dagle,
“Autonomous demand response for frequency regulation on a large-scale
model of an interconnected grid,” in Proc. IEEE PES General Meeting, pp.
1-8, Jul. 2012.
[47]. N. Forouzandehmehr, M. Esmalifalak, H. Mohsenian-Rad, and Z. Han,
“Autonomous demand response using stochastic differential games,” IEEE
Trans. Smart Grid, vol. 6, no. 1, pp. 291-300, Sep. 2014.
[48]. J. Hansen, J. V. Knudsen, and A. M. Annaswamy, “Demand repsonse in
smart grids: Parcitipants, challenges, and a taxonomy,” in Proc. IEEE 53rd
Annual conference on Decision and Control, pp. 4045-4052, Dec. 2014.
[49]. N. Zhu, X. Bai, and J. Meng, “Benefits analysis of all parties participating
in demand response,” in Proc. IEEE PES Asia Pacific Power and Energy
Engineering Conference, pp. 1-4, Mar. 2011.
[50]. L. Chang-Chien, L. N. An, T. Lin, and W. Lee, “Incorporating demand
response with spinning reserve to realize an adaptive frequency restoration
plan for system contingencies,” IEEE Trans. on Smart Grid, vol. 3, no. 3,
pp. 1145-1153, Sep. 2012.
[51]. C. Sahin, M. Shahidehpour, and I. Erkmen, “Allocation of hourly reserve
versus demand response for security constrained scheduling of stochastic
wind energy,” IEEE Trans. Sustainable Energy, vol. 4, no. 1, pp. 219-228,
Sept. 2012.
[52]. W. Liu, Q. Wu, F. Wen, and J. Østergaard, “Day-ahead congestion
management in distribution system through household demand response
and distribution congestion prices,” IEEE Trans. Smart Grid, vol. 5, no. 6,
pp. 2739-2747, Jul. 2014.
[53]. H. Johal, K. Anaparthi, and J. Black, “Demand response as a strategy to
support grid operation in different time scales,” in Proc. IEEE Energy
Conversion Congress and Exposition, pp. 1461-1467, Sept. 2012.
[54]. S. N. Singh and J. Østergaard, “Use of Demand Response in Electricity
Markets: An overview and key issues,” in Proc. International Conference
on the European Energy Market, pp. 1-6, Jun. 2010.
[55]. Z. Baharlouei and M. Hashemi, “Demand side management challenges in
smart grid: A review,” in Proc. Smart Grid Conference, pp. 96-101, Dec.
2013.
[56]. P. Kundur, “Power system stability and control”, McGraw-Hill Inc.,
1994.
[57]. K. M. Muttaqi, A. D. T. Le, M. Negnevitsky, and G. Ledwich, “A
coordinated voltage control approach for coordination of OLTC, voltage
regulator, and DG to regulate voltage in a distribution feeder,” IEEE
Trans. Industry Applications, Vol. 51, no. 2, pp. 1239 - 1248, Mar.-Apr.
2015.
[58]. M. Nick, R. Cherkaoui, and M. Paolone, “Optimal allocation of dispersed
energy storage systems in active distribution networks for energy balance
and grid support,” IEEE Trans. Power Systems, vol. 29, no. 5, pp. 2300-
2310, Feb. 2014.

ERROR! REFERENCE SOURCE NOT FOUND.
105
[59]. N. S. Lu et al., “Centralized and decentralized control for demand
response,” in Proc. IEEE PES Innovative Smart Grid Technologies, pp. 1-
8, Jan. 2011.
[60]. C. L. Siebert et al., “Centralized and decentralized approaches to demand
response using smart plugs,” in Proc. IEEE PES Transmission and
Distribution Conference and Exposition, pp. 1-5, Apr. 2014.
[61]. E. K. Akuacom, and M. A. Piette, “Direct versus facility centric load
control for automated demand response” in Grid-Interop Forum, Nov.
2009.
[62]. I. D. D. C. Mendaza, I. G. Szczesny, J. R. Pillai, and B. Bak-Jensen,
“Flexible demand control to enhance the dynamic operation of low voltage
networks,” IEEE Trans. Smart Grids, vol. 6, no. 2, pp. 705-715, Dec.
2014.
[63]. C. A. Canizares et al, “Trends in microgrid control,” IEEE Trans. Smart
Grid, vol, 5, no. 4, pp. 1905-1919, Jul. 2014.
[64]. P. B. Andersen, J. Hu, and K. Heussen, “Coordination strategies for
distribution grid congestion management in a multi-actor, multi-objective
setting,” in Proc 3rd IEEE PES Innovative Smart Grid Technologies
(ISGT), pp. 1-8, Oct. 2012.
[65]. OpenADR alliance, “OpenADR 2.0 specification,” [Online]. Available:
http://www.openadr.org.
[66]. IEEE P2030, “Guide for smart grid interoperability of energy Technology
and information technology operation with the electric power system
(EPS), and end-Use applications and loads,” IEEE Standards Association,
Sep. 2011.
[67]. K. Mets, J. A. Ojea, and C. Develder, “Combining power and
communication network simulation for cost-effective smart grid analysis,”
IEEE Communications Surveys & Tutorials, vol. 16, no. 3, pp. 1771-1796,
Mar. 2014.
[68]. D. Q. Xu, G. Jo´os, M. L´evesque, and M. Maier, “Integrated V2G, G2V,
and renewable energy sources coordination over a converged fiber-
wireless broadband access network,” IEEE Transactions Smart Grid, vol.
4, no. 3, pp. 1381–1390, Sep. 2013.
[69]. X. Wang et al., “Interfacing Issues in multiagent simulation for smart grid
applications,” IEEE Transactions Power Delivery, vol. 28, no. 3, pp.
1918–1927, Jul. 2013.
[70]. X. Sun, Y. Chen, J. Liu, and S. Huang, “A co-simulation platform for
smart grid considering interaction between information and power
systems,” in Proc., IEEE Innovative Smart Grid Technologies (ISGT), pp.
1-6, Feb. 2014.
[71]. W. Song, D. De, S. Tan, S. K. Das, and L. Tong, “A wireless smart grid
testbed in lab,” IEEE Wireless Communications, vol. 19, no. 3, pp. 58–64,
Jun. 2012.
[72]. I. Georgievski, V. Degeler, G. A. Pagani, T. A. Nguyen, A. Lazovik, and
M. Aiello, “Optimizing energy costs for offices connected to the smart
grid,” IEEE Trans. Smart Grid, vol. 3, no. 4, pp. 2273–2285, Dec. 2012.

106
[73]. R. C. Qiu et al., “Cognitive radio network for the smart grid: experimental
system architecture, control algorithms, security, and microgrid testbed,”
IEEE Trans. Smart Grid, vol. 2, no. 4, pp. 724–740, Dec. 2011.
[74]. Aalborg University, “Smart grid laboratory,” [Online]. Available:
(http://www.et.aau.dk/research-programmes/intelligent-energy-systems-
and-active-networks/).
[75]. Technical university of Denmark, “PowerLabDK,” [Online]. Available:
http://www.powerlab.dk/
[76]. Royal Institute of Technology, “SmartTS Lab,” [Online]. Available:
https://www.kth.se/en/ees/omskolan/
[77]. F. W. Fuchs et al., “Research laboratory for grid integration of distributed
renewable energy resources - design and realization,” in Proc. IEEE
Energy Conversion Congress and Exposition, pp. 1974-1981, Sept. 2012.
[78]. F. W. Fuchs et al., “Research laboratory for grid-integration of distributed
renewable energy resources - integration analysis of DERs,” in Proc. 15th
International Conference on Power Electronics and Motion Control
(EPE/PEMC), pp. LS7a.4-1 – LS7a.4-8, Sep. 2012.
[79]. J. Soares, H. Morais, T. Sousa, Z. Vale, and P. Faria, “Day-ahead
resource scheduling including demand response for electric vehicles,”
IEEE Trans. Smart Grid, vol. 4, no. 1, pp. 596-605, Mar. 2013.
[80]. M. Chen and G. Rincon-Mora, “Accurate electrical battery model capable
of predicting runtime and I-V performance,” IEEE Trans. Energy
Conversion, vol. 21, no. 2, pp. 504 – 511, Jun. 2006.
[81]. D. W. Dees, V. S. Battaglia, and A. Bélanger, “Electrochemical modeling
of lithium polymer batteries,” Journal of Power Sources, vol. 110, no. 2,
pp. 310 – 320, 2002.
[82]. J. Newman, K. E. Thomas, H. Hafezi, and D. R. Wheeler, “Modeling of
lithium-ion batteries,” Journal of Power Sources, vol. 119, pp. 838–843,
2003.
[83]. P. Rong and M. Pedram, “An analytical model for predicting the
remaining battery capacity of lithium-ion batteries,” IEEE Trans. on Very
Large Scale Integration Systems, vol. 14, no. 5, pp. 441–451, May 2006.
[84]. S. Vazquez, S. Lukic, E. Galvan, L. Franquelo, and J. Carrasco, “Energy
storage systems for transport and grid applications,” IEEE Trans.
Industrial Electronics, vol. 57, no. 12, pp. 3881 – 3895, Dec. 2010.
[85]. R. C. Kroeze and P. T. Krein, “Electrical battery model for use in
dynamic electric vehicle simulations,” in Proc. IEEE Power Electronics
Specialists Conference, pp. 1336–1342, Jun. 2008.
[86]. O. Tremblay, L. A. Dessaint, and A. I. Dekkiche, “A generic battery
model for the dynamic simulation of hybrid electric vehicles,” in Proc.
IEEE Vehicle Power and Propulsion Conference, pp. 284–289, Sept. 2007.
[87]. K. Qian, C. Zhou, M. Allan, and Y. Yuan, “Modeling of load demand due
to EV battery charging in distribution systems,” IEEE Trans. Power
Systems, vol. 26, no. 2, pp. 802-810, Aug. 2010.

ERROR! REFERENCE SOURCE NOT FOUND.
107
[88]. S. Yang, M. Wu, X. Yao, and J. Jiang, “Load modeling and identification
based on ant colony algortihms for EV charging stations,” IEEE Trans.
Power Systems, vol. 30, no. 4, pp. 1997–2003, Sept. 2014.
[89]. S. Wang, N. Chang, Z. Li, and M. Sahidehpour, “Modeling and impact
analysis of large scale V2G electric vehicles on the power grid,” in Proc.
IEEE PES Innovative Smart Grid Technologies - Asia, pp. 1-6, May 2012.
[90]. A. H. Foosnæs, J. Rasmussen, C. A. Andersen, O. Gehrke, and G.
Isbrandt, “Grid codes and regulation related to EVs,” Technical report,
Oct. 2011.
[91]. A. Briones et al., “Vehicle-to-grid (V2G) power flow regulations and
building codes review by AVTA,” Technical report, Sept. 2012.
[92]. Z. Yang, G. Pedersen, L. Larsen, and H. Thybo, “Modeling and control of
indoor climate using a heat pump based floor heating system,” in Proc.
33rd Annual Conference on IECON, pp. 2985–2990, Nov 2007.
[93]. P. Andersen, T. Pedersen, and K. Nielsen, “Observer based model
identification of heat pumps in a smart grid,” in Proc. IEEE International
Conference on Control Applications, pp. 569–574, 2012, Oct 2012.
[94]. J. M. Nyers and A. J. Nyers, “COP of heating-cooling system with heat
pump,” in Proc. IEEE 3rd
international Symposium on Exploitation of
Renewable Energy Sources (EXPRES), pp. 17-21, Mar. 2011.
[95]. L. Totu, J. Leth, and R. Wisniewski, “Control for large scale demand
response of thermostatic loads,” in Proc. American Control Conference
(ACC), pp. 5023–5028, Jun. 2013.
[96]. E. Veldman, M. Gibescu, H. Slootweg, and W. Kling, “Impact of
electrification of residential heating on loading of distribution networks,”
in Proc. IEEE Trondheim PowerTech, pp. 1–7, Jun. 2011.
[97]. S. Koch, M. Zima, and G. Andersson, “Potentials and applications of
coordinated groups of thermal household appliances for power system
control purposes,” in Proc. IEEE PES/IAS Conference on Sustainable
Alternative Energy (SAE), pp. 1–8, Sept. 2009.
[98]. R. Yokoyama, S. Okagaki, T. Wakui, and K. Takemura, “Performance
Analysis of a CO2 heat pump water heating system by numerical
simulation with a simplified model,” in Proc. 19th International
Conference on Efficiency, Cost, Optimization, Simulation and
Environmental Impact of Energy Systems, pp. 1–6, May 2012.
[99]. C. Verhelst, D. Degrauwe, F. Logist, J. Van Impe, and L. Helsen, “Multi-
objective optimal control of an air-to-water heat pump for residential
heating,” Building Simulation, vol. 5, no. 3. pp. 281–291, Apr. 2012.
[100]. E. Vrettos, K. Lai, F. Oldewurtel, and G. Andersson, “Predictive control
of buildings for demand response with dynamic day-ahead and real-time
prices,” in Proc. 2013 European Control Conference (ECC), pp. 2527–
2534, Jul. 2013.
[101]. ESS Model, “CO2 air source heat pump,” [Online]. Available:
http://www.esru.strath.ac.uk/EandE/Web_sites/10-
11/ASHP_CO2/modelling_EESmodel.html.

108
[102]. N. Mohammad, M. Quamruzzaman, M. R. T. Hossain, and M. R. Alam,
“Parasitic effects on the performance of DC-DC SEPIC in photovoltaic
maximum power point tracking applications,” Smart Grid and Renewable
Energy, vol. 4, no. 1, pp. 113-121, Apr. 2013.
[103]. R. W. Wimmer, “Regelung einer Wärmepumpenanlage mit Model
Predictive Control,” PhD Dissertation, ETH Zürich, 2004.
[104]. M. A. Bianchi, “Adaptive modellbasierte prädiktive regelung einer
kleinw armepumpenanlage,” PhD Dissertation, ETH Zürich, 2006.
[105]. K. Rapolu, P. Singh, S. P. Shea, and D. L. Meier, “Numerical two
dimensional modeling of silicon solar cells with experiment validation,” in
Proc. 10th
International Conference on Numerical Simulation of
Optoelectronic Devices, pp. 75-76, Sept. 2010.
[106]. P. Mathiesen, J. M. Brown, and J. Kleissl, “Geostrophic wind dependent
probabilistic irradiance forecasts for coastal California,” IEEE Trans.
Sustainable Energy, vol. 4, no. 2, pp. 510-518, Jul. 2012.
[107]. V. P. Singh, V. Vijay, M. S. Bhatt, and D. K. Chaturvedi, “Generalized
neural network methodology for short term solar power forecasting,” in
Proc. 13th
International Conference on Environment and Electrical
Engineering, pp. 58-62, Nov. 2013.
[108]. X. Su, M. A. S. Masoum, and P. Wolfs, “Comprehensive optimal
photovoltaic inverter control strategy in unbalanced three-phase four wire
low voltage distribution networks,” IET Generation, Transmission and
Distribution, vol. 8, no. 11, pp. 1848-1859, Nov. 2014.
[109]. A. Samadi, R. Eriksson, L. Soder, and B. G. Rawn, “Coordinated active
power-dependent voltage regulation in distribution grids with PV
systems,” IEEE Trans. Power Delivery, vol. 29, no. 3, pp. 1454-1464, Jan.
2014.
[110]. M. J J. E. Alam, K. M. Muttaqi, and D. Sutanto, “Mitigation of rooftop
solar PV impacts and evening peak support by managing available
capacity of distributed energy storage systems,” IEEE Trans. Power
Systems, vol. 28, no. 4, pp. 3874-3884, May 2013.
[111]. Energinet.dk, “Cell Controller Overview and Future Perspectives,”
Technical Report, Doc. ID 20735/12, Sep. 2012.
[112]. P. Kadurek, J. Cobben, and W. Kling, “Overloading protection of future
low voltage distribution networks,” in Proc. IEEE Trondheim PowerTech,
pp. 1–6, Jun. 2011.
[113]. M. Arnold, W. Friede, and J. Myrzik, “Investigations in low voltage
distribution grids with a high penetration of distributed generation and heat
pumps,” in Proc. 48th International Universities Power Engineering
Conference (UPEC), pp. 1–6, Sept. 2013.
[114]. R. A. Verzijlbergh, Z. Lukszo, J. G. Slootweg, and M. D. Ilic, “The
impact of controlled electric vehicle charging on residential low voltage
networks,” in Proc. IEEE International Conference on Networking,
Sensing and Control (ICNSC), pp. 14–19, Apr. 2011.
[115]. A. Masoum, S. Deilami, P. Moses, and A. Abu-Siada, “Impact of plug-
in electrical vehicles on voltage profile and losses of residential system,”

ERROR! REFERENCE SOURCE NOT FOUND.
109
in Proc. 20th Australasian Universities Power Engineering Conference
(AUPEC), pp. 1–6, Dec. 2010.
[116]. M. A. S. Masoum, P. Moses, and K. Smedley, “Distribution transformer
losses and performance in smart grids with residential plug-In electric
vehicles,” in Proc. IEEE PES Innovative Smart Grid Technologies (ISGT),
pp. 1–7, Jan. 2011.
[117]. F. Marra, M. Jensen, R. Garcia-Valle, C. Traholt, and E. Larsen, “Power
quality issues into a Danish low-voltage grid with electric vehicles,” in
Proc. 11th International Conference on Electrical Power Quality and
Utilisation (EPQU), pp. 1 – 6, Oct. 2011.
[118]. M. Brandao, A. Panosyan, and R. Walling, “Potential strategies to
increase rooftop solar PV penetration in LV networks in Australia,” in
Proc. IEEE PES Innovative Smart Grid Technology-Asia, pp. 1-7, Nov.
2011.
[119]. E. Demirok, “Control of grid interactive PV inverters for high
penetration in low voltage distribution networks,” Ph.D. Dissertation,
Department of Energy Technology, Aalborg University, Aalborg, 2012.
[120]. K. A. Joshi and N. M. Prndoriya, “Impact investigation of rooftop solar
PV system: A case study in India,” in Proc. IEEE PES Innovative Smart
Grid Technology-Europe, pp. 1-8, Oct. 2012.
[121]. P. Richardson, D. Flynn, and A. Keane, “Impact assessment of varying
penetrations of electric vehicles on low voltage distribution systems,” in
Proc. IEEE PES General Meeting, pp. 1–6, Jul. 2010.
[122]. P. Mancarella, C. K. Gan, and G. Strbac, “Evaluation of the impact of
electric heat pumps and distributed CHP on LV networks,” in Proc. IEEE
PES Trondheim PowerTech, pp. 1–7, Jun. 2011.
[123]. T. A. Short, “Electric Power Distribution Handbook,” Taylor and
Francis Group, CRC Press, 2014.
[124]. A. Kulmala, S. Repo, and P. Jarventausta, “Coordinated voltage control
in distribution networks including several distributed energy resources,”
IEEE Trans. Smart Grid, vol. 5, no. 4, pp. 2010-2020, Jul. 2014.
[125]. P. Mahat, M. Handl, K. R. Kanstrup, A. P. Lozano, and A. Sleimovits,
“Price based electric vehicle charging” in Proc. IEEE PES Society General
Meeting, pp. 1 – 8, Jul. 2012.
[126]. P. Richardsen, D. Flynn and A. Keane,“Optimal charging of electric
vehicle in low voltage distribution grid”, IEEE Trans. Power System, vol.
27, no. 1, pp. 268-279, Feb. 2012.
[127]. C. Wen, J. Chen, J. Teng, and P. Ting, “Decentralized plug-in electric
vehicle charging selection algorithm in power systems,” IEEE Trans.
Smart Grid, vol. 3, no. 4, pp. 1779–1789, Dec. 2012.
[128]. C. Jin, J. Tang, and P. Ghosh, “Optimizing electric vehicle charging: A
customer’s perspective,” IEEE Trans. Vehicular Technology, vol. 62, no.
7, pp. 2919–2927, Sep. 2013.
[129]. B. Geng, J. K. Mills and D. Sun, “Two-stage charging strategy for plug-
in electric vehicles at the residential transformer level,” IEEE Trans. Smart
Grid, vol. 4, no. 3, pp. 1442–1452, Sep. 2013.

110
[130]. P. Richardson, D. Flynn, and A. Keane, “Local versus centralized
charging strategies for electric vehicles in low voltage distribution
systems,” IEEE Trans. Smart Grid, vol. 3, no. 2, pp. 1020–1028, Apr.
2012.
[131]. O. Sundstrom and C. Binding, “Flexible charging optimization for
Electric Vehicles Considering Distribution Grid Constraints,” IEEE Trans.
Smart Grid, vol. 3, no. 1, pp. 26-37, Mar. 2012.
[132]. J. Hu, S. You, M. Lind, and J. Østergaard, “Coordinated charging of
electric vehicles for congestion prevention in the distribution grid,” IEEE
Trans. Smart Grid, vol. 5, no. 2, pp. 703-711, Mar. 2014.
[133]. K. M. Nielsen, T.S. Pedersen and P. Andersen, “Heat pumps in private
residences used for grid balancing by demand response methods”, in Proc.
IEEE PES Transmission and Distribution Conference and Exposition, pp.
1–6, May 2012.
[134]. M. Diekerhof, S. Vorkampf, and A. Monti, “Distributed optimization
algorithm for heat pump,” in Proc. IEEE PES innovative smart grid
technologies Europe (ISGT-Europe), pp. 1-6, Oct. 2014.
[135]. T. Masuta and A. Yokoyama, “Supplementary load frequency control by
use of a number of both electric vehicles and heat pump water heaters”,
IEEE Trans. Smart Grid, vol. 3, no. 3, pp. 1253–1262, Sept. 2012.
[136]. P. T. Bjerregaard, I. G. Szczesny, I. D. C. Mendaza, and J. R. Pillai,
“Intelligent control of flexible loads for improving low voltage grids
utilization” in Proc. IEEE PES Innovative Smart Grid Technologies -
Europe, pp. 1-5, Oct. 2013.
[137]. T. Buber, S. V. Roon, A. Gruber, and J. Conard, “Demand response
potential of electrical heat pumps and electric storage heaters,” in Proc.
IEEE IES IECON, pp. 8028-8032, Nov. 2013.
[138]. B. Biegel et al., “Smart grid dispatch strategy for ON/OFF demand-side
devices”, in Proc. European Control Conference (ECC), pp. 2541–2548,
Jul. 2013.
[139]. R. Jia, M. H. Nehrir, and D. A. Pierre, “Voltage control of aggregate
electric water heater load for distribution system peak load shaving using
field data”, in Proc. 39th North American Power Symposium, pp. 492–497,
Sept. 2007.
[140]. M. Brandao, A. Panosyan, and R. Walling, “Potential strategies to
increase rooftop solar PV penetration in LV networks in Australia,” in
Proc. IEEE PES Innovative Smart Grid Technologies – Asia, pp. 1-6, Nov.
2011.
[141]. E. Demirok et al., “Local reactive power control methods for
overvoltage prevention of distributed solar inverters in low-voltage grids,”
IEEE Journal of Photovoltaics, vol. 1, no. 2, pp. 174 - 182, Dec. 2011.
[142]. R. Tonkoski, L. A. C. Lopes, and T. H. M. El-Fouly, “Coordinated
active power curtailment of grid connected PV inverters for overvoltage
prevention,” IEEE Trans. Sustainable Energy, vol. 2, pp. 139-147, Apr.
2011.

ERROR! REFERENCE SOURCE NOT FOUND.
111
[143]. M. J. E. Alam, K. M. Muttaqi, and D. Sutanto, “Mitigation of rooftop
solar PV impacts and evening peak support by managing available
capacity of distributed energy storage systems,” IEEE Trans. Power
System, vol. 29, pp. 3874-3884, Nov. 2013.
[144]. X. Liu, A. Aichhorn, L. Liu, and H. Li, “Coordinated control of
distributed energy storage system with tap changer transformers for
voltage rise mitigation under high photovoltaic penetration,” IEEE Trans.
Smart Grid, vol. 3, pp. 879-906, Jun. 2012.
[145]. A. Mustapha, O. Takashi, T. Yumiko, and J. G. S. Fonseca, “Reduction
of PV reverse power flow through the usage of EV’s battery with
consideration of the demand and solar radiation forecast,” in Proc. IEEE
International Electric Vehicle Conference, pp. 1-3, Oct. 2013.
[146]. J. Traube et al., “Mitigation of solar irradiance intermittency in
photovoltaic power systems with integrated electric-vehicle charging
functionality,” IEEE Trans. Power Electronics, vol. 28, pp. 3058-3067,
Jun. 2013.
[147]. J. M. Foster, G. Trevino, M. Kuss, and M. C. Caramanis, “Plug-In
electric vehicle and voltage support for distributed solar: theory and
application,” IEEE System Journal, vol. 7, pp. 881-888, Dec. 2013.
[148]. B. W. Kennedy and R. H. Fletcher, "Conservation voltage reduction
(CVR) at Snohomish County PUD," IEEE Trans. Power Systems, vol. 6,
no. 3, pp. 986 - 998, Aug. 1991.
[149]. M. E. Baran and M.Y Hsu, “Volt/Var control at distribution substation,”
IEEE Trans. Power System, vol. 14, no. 1, pp. 312–318, Feb. 1999.
[150]. R. Liang and Y. Wang, “Fuzzy-based reactive power and voltage control
in a distribution system,” IEEE Trans. Power Delivery, vol. 18, no. 2, pp.
610–618, Apr. 2003.
[151]. J. C. Erickson and S. R. Gilligan, "The effects of voltage reduction on
distribution circuit loads," IEEE Trans. Power Apparatus and Systems,
vol. PAS-101, no. 7, pp. 0018-2018, Jul. 1982.
[152]. T. L. Wilson, "Energy conservation with voltage reduction - fact or
fantasy," in Proc. IEEE Rural Electric Power Conference, pp. C3_1 –
C3_6, May 2002.
[153]. M. Khurmy and B. Alshahrani, “Measurement & verifications of voltage
optimization for conserving energy,” in Proc. 10th International
Conference on Environment and Electrical Engineering, pp. 1-5, May
2011.
[154]. R. Singh, F. Tuffner, J. Fuller, and K. Schneider, “Effects of distributed
energy resources on conservation voltage reduction (CVR)” in Proc. IEEE
PES General Meeting, pp. 1–7, Jul. 2011.
[155]. J. Solanki, N. Venkatesan, S. K. Solanki, “Coordination of demand
response and volt/var control algorithm using multi agent system,” in
Proc. IEEE PES Transmission and Distribution Conference and
Exposition, pp. 1–4, May 2012.

112
[156]. N. Markushevich and E. Chan, “Integrated voltage, var control and
demand response in distribution systems,” in Proc. IEEE PES Power
System Conference and Exposition (PSCE), pp. 1-4, Mar. 2009.
[157]. P. Kadurek, M. M. Sarab, J. F. G. Cobben, and W. L. Kling,
“Assessment of demand response possibilities by means of voltage control
with intelligent MV/LV distribution substation,” in Proc. IEEE PES
General Meeting, pp. 1–6, Jul. 2012.
[158]. H. Lee Willis, “Electric Transmission and Distribution Reference
Book”, ABB, p. 787, 1997.
[159]. I. Xyngi and M. Popov, “An Intelligent Algorithm for the Protection of
Smart Power Systems,” IEEE Trans. Smart Grid, vol. 4, no. 3, pp. 1541-
1548, Aug. 2013.
[160]. V. R. Pandi, H. H. Zeineldin, and X. Weidong, “Determining optimal
location and size of distributed generation resources considering Harmonic
and protection coordination limits,” IEEE Trans. Power Systems, vol. 28,
no. 2, pp. 1245-1254, Apr. 2013.
[161]. J. Chen, R. Fan, X. Duan, and J. Cao, “Penetration level optimization for
DG considering reliable action of relay protection device constrains,” in
Proc. International Conference on Sustainable Power Generation and
Supply, pp. 1-5, Apr. 2009.
[162]. B. Li, C. Li, F. Guo, and Y. Xin, “Overcurrent protection coordination in
a power distribution network with the active superconductive fault current
limiter,” IEEE Trans. Applied Superconductivity, vol. 24, no. 5, pp. 1051-
5223, Oct. 2014.
[163]. H. Yazdanpanahi, Y. W. Li, and W. Xu, “A new control strategy to
mitigate the impact of inverter based DGs on protection system,” IEEE
Trans. Smart Grid, vol. 3, pp. 1427-1436, Sept. 2012.
[164]. P. Mahat, Z. Chen, B. Bak-Jensen, and C. L. Bak, “A simple adaptive
overcurrent protection of distribution system with distributed generation,”
IEEE Trans. Smart Grid, vol. 2, pp. 428-437, Sept. 2011.
[165]. J. Ma, W. Ma, X. Wang, and Z Wang, “A new adaptive voltage
protection scheme for distribution network with distributed generations,”
Canadian Journal of Electrical and Computer Engineering, vol. 36, no. 4,
pp. 142-151, Fall 2013.
[166]. F. Coffel, C. Booth, and A. Dysko, “An adaptive overcurrent protection
scheme for distribution networks,” IEEE Trans. Power Delivery, vol. 30,
no. 2, pp. 0885–8977, Feb. 2014.
[167]. M. Khederzadeh, “Adaptive setting of protective relays in micro-grids in
grid-connected and autonomous operation,” in Proc. IET International
Conference on Developments in Power System Protection, pp. 1- 4, Apr.
2012.
[168]. M. A. Zamani, A. Yazdani, and T. S. Sindhu, “A communication-
assisted protection strategy for inverter based medium voltage micro-
grids,” IEEE Trans. Smart Grid, vol. 3, no. 4, pp. 2088-2099, Dec. 2012.
[169]. F. A. Ituzaro, R. H. Douglin, and K. L. Butler-purry, “Zonal overcurrent
protection for smart radial distribution systems with distributed

ERROR! REFERENCE SOURCE NOT FOUND.
113
generation,” in Proc. 2013 IEEE PES Innovative Smart Grid Technologies,
pp. 1-6, Feb. 2013.
[170]. M. Brahma and A. A. Girgis, “Development of adaptive protection
scheme for distribution system with high penetration of distributed
generation,” IEEE Trans. Power Delivery, vol. 19, no. 1, pp. 56-63, Dec.
2004.
[171]. Y. Ding, S. Pineda, P. Nyeng, J. Østergaard, E. M. Larsen, and Q. Wu,
“Real-time market concept architecture for EcoGrid EU - A prototype for
European smart grids,” IEEE Trans. Smart Grid, vol. 4, pp. 2006–2016,
Jul. 2013.
[172]. RTDS Technologies, “Power System User Manual”, Dec. 2012.