intelligent camera aided railway emergency system (i-cares)
TRANSCRIPT

Intelligent Camera Aided Railway Emergency System (i-CARES)
Final Report
by
Yu Qian Assistant Professor
Department of Civil and Environmental Engineering The University of South Carolina
300 Main Street-C228 Columbia, SC 29208 Office: (803)777-8184 Email: [email protected]
Yi Wang, University of South Carolina
Dimitris Rizos, University of South Carolina
February 2021
Center for Connected Multimodal Mobility (C2M2)
200 Lowry Hall, Clemson University Clemson, SC 29634

Intelligent Camera Aided Railway Emergency System (i-CARES), 2021
Center for Connected Multimodal Mobility (C2M2) Clemson University, Benedict College, The Citadel, South Carolina State University, University of South Carolina
Page ii
DISCLAIMER The contents of this report reflect the views of the authors, who are responsible for the facts and the accuracy of the information presented herein. This document is disseminated in the interest of information exchange. The report is funded, partially or entirely, by the Center for Connected Multimodal Mobility (C2M2) (Tier 1 University Transportation Center) Grant, which is headquartered at Clemson University, Clemson, South Carolina, USA, from the U.S. Department of Transportation’s University Transportation Centers Program. However, the U.S. Government assumes no liability for the contents or use thereof.
Non-exclusive rights are retained by the U.S. DOT.

Intelligent Camera Aided Railway Emergency System (i-CARES), 2021
Center for Connected Multimodal Mobility (C2M2) Clemson University, Benedict College, The Citadel, South Carolina State University, University of South Carolina
Page iii
ACKNOWLEDGMENT The research team greatly thank C2M2 for partially supporting this project. The CSX Corporation and the City of Columbia also provided significant support and a lot of useful advice during the development.

Intelligent Camera Aided Railway Emergency System (i-CARES), 2021
Center for Connected Multimodal Mobility (C2M2) Clemson University, Benedict College, The Citadel, South Carolina State University, University of South Carolina
Page iv
Technical Report Documentation Page
1. Report No. 2. Government Accession No.
3. Recipient’s Catalog No.
4. Title and Subtitle
Intelligent Camera Aided Railway Emergency System (i-CARES)
5. Report Date
February 2021
6. Performing Organization Code
7. Author(s)
Yu Qian, Ph.D. ORCID: 0000-0001-8543-2774 Yi Wang, Ph.D. ORCID: 0000-0002-5750-3181 Dimitris Rizos, Ph.D. ORCID: 0000-0001-5764-7911
8. Performing Organization Report No.
9. Performing Organization Name and Address
University of South Carolina
300 Main St.
Columbia, SC 29208
10. Work Unit No.
11. Contract or Grant No.
69A3551747117
12. Sponsoring Agency Name and Address
Center for Connected Multimodal Mobility (C2M2) Clemson University 200 Lowry Hall, Clemson, SC 29634
13. Type of Report and Period Covered
Final Report February 2019-March 2020 14. Sponsoring Agency Code
15. Supplementary Notes
16. Abstract
The highway-railroad grade crossings are a hot spot in terms of vehicle-train collisions. The unexpected crossing blockage not only brings traffic congestion but also raises serious safety concerns for commuters. Previous researchers have already investigated the accident loss and frequency of the accidents around the crossing areas. However, there is no dedicated research to facilitate the information exchange between the railroad and street traffic. In this study, researchers at the University of South Carolina initiated the effort of evaluating traffic conditions at the grade crossings and establish two-way communication between the railroad and street traffic to assist the railroad and drivers in their decision making. A customized detection and tracking algorithm based on deep learning was developed. Results presented in this report indicate the traffic during and after the crossing blockage does follow a pattern. 17. Keywords
Machine vision, Objective Tracking
18. Distribution Statement
No restrictions.
19. Security Classif. (of this report)
Unclassified
20. Security Classif. (of this page)
Unclassified 21. No. of Pages
32 22. Price
NA

Intelligent Camera Aided Railway Emergency System (i-CARES), 2021
Center for Connected Multimodal Mobility (C2M2) Clemson University, Benedict College, The Citadel, South Carolina State University, University of South Carolina
Page v
Table of Contents DISCLAIMER ...................................................................................................................ii ACKNOWLEDGMENT .................................................................................................... iii EXECUTIVE SUMMARY ................................................. Error! Bookmark not defined. CHAPTER 1 .................................................................................................................... 2
Introduction .................................................................................................................. 2
CHAPTER 2 .................................................................................................................... 4
Literature Review ......................................................................................................... 4
2.1 Existing Object Detection Algorithm Review ...................................................... 4
2.2 Evolution of the Previous Algorithm ................................................................... 6
2.3 Selected Algorithm in this Study ......................................................................... 6
CHAPTER 3 .................................................................................................................... 8
Methodology ................................................................................................................ 8
3.1 Featured Training ............................................................................................... 8
3.2 Program Design and Procedure Flow ................................................................ 9
CHAPTER 4 .................................................................................................................. 11
Field Test Conditions ................................................................................................. 11
4.1 Site and Video Data Collection......................................................................... 11
4.2 Vehicle Detection and Tracking ........................................................................ 11
4.3 Field Performance Evaluation .......................................................................... 13
CHAPTER 5 .................................................................................................................. 15
Results and Discussions ............................................................................................ 15
5.1 Vehicle Waiting Behavior ................................................................................. 15
5.2 Queue Clearing Time ....................................................................................... 19
CHAPTER 6 .................................................................................................................. 23
Concluding Remarks ................................................................................................. 23
REFERENCES .............................................................................................................. 24

Intelligent Camera Aided Railway Emergency System (i-CARES), 2021
Center for Connected Multimodal Mobility (C2M2) Clemson University, Benedict College, The Citadel, South Carolina State University, University of South Carolina
Page vi
List of Tables Table 3.1 Hyperparameters of experiment …………………………………………………..9 Table 3.2 Parameters of training accuracy…………………………………………………...9 Table 4.1 Performance assessment of detection and tracking system………………….13 Table 5.1 P and R values between Ground truth vehicle number (GT), Tracking vehicle
number (Tr) and Clearance time ….……………………………………………...22 List of Figures Figure 2.1 YOLO model used in the present work…………………………………………..5 Figure 2.2 Neural network architecture of YOLO used in this work……………………….5 Figure 2.3 Synthesized network structures of Darknet19 and Darknet53: (a)
Synthesized Darknet19; (b) Synthesized Darknet53…………………………….7 Figure 3.1 Training results for a custom dataset: loss over training epochs……………..9 Figure 3.2 Procedure flow of SORT tracking approach…………………………………….10 Figure 4.1 Research site of grade crossing at Columbia, SC, U.S. (Map data @ 2019
Google maps)……………………………………………………………………….11 Figure 4.2 Real time vehicle detection and tracking system: (a)&(b) Morning condition
during and after blockage; (c)&(d) Noon condition during and after blockage; (e)&(f) Night condition during and after blockage……………………………….12
Figure 5.1 Number of blockages happened in the specified grade crossing within the 96 hours video records………………………………………………………………...15
Figure 5.2 Number of vehicles with different choices when there was a blockage in the grade crossing: (a) Blockages happened during Nov 19 to Nov 21; (b) Blockages happened during Dec 03 to Dec 05………………………………….16
Figure 5.3 Relationship between train passing time, vehicle number of turning left, and vehicle number of keeping waiting. (a) 3D-scatter distribution of train passing time, vehicle number of turning left and vehicle number of keeping waiting; (b) Vehicle number of turning left versus train passing time; (c) Vehicle number of keeping waiting versus train passing time; (d) Vehicle number of turning left versus vehicle number of keeping waiting……………………………………….19
Figure 5.4 The relationship between clearance time and waiting car number: (a) Number of congested vehicles versus clearance time with ground truth data and tracking data; (b) Fitting results for the number of congested vehicle with ground truth data versus clearance time; (c) Fitting result for the number of congested vehicle with tracking data versus clearance time………………….21

Intelligent Camera Aided Railway Emergency System (i-CARES), 2021
Center for Connected Multimodal Mobility (C2M2) Clemson University, Benedict College, The Citadel, South Carolina State University, University of South Carolina
Page 1
EXECUTIVE SUMMARY
Slow-moving or stopped trains at highway-railroad grade crossings, especially in the populated metropolitan areas, not only cause significant traffic delays to commuters but also prevent first responders from timely responding to emergencies. In this study, the researchers introduce an automated video analysis, detection, and tracking system to evaluate the traffic conditions, analyze blocked vehicle behaviors at grade crossings, and predict the vehicle clearing time under a simplified scenario. The results indicate the traffic during and after the crossing blockage does follow a pattern. A good linear correlation between the decongestion time (time needed for the traffic goes back to normal or before a train pass) and the number of blocked vehicles has been observed at the monitored grade crossing at the City of Columbia, SC. The observed patterns could potentially enable automated prediction of the time it takes for the traffic to become normal for a blocked grade crossing and assist the first responders for route planning and dispatching reconfiguration.

Intelligent Camera Aided Railway Emergency System (i-CARES), 2021
Center for Connected Multimodal Mobility (C2M2) Clemson University, Benedict College, The Citadel, South Carolina State University, University of South Carolina
Page 2
CHAPTER 1 Introduction
Highway-railroad grade crossing connects the highway and railroad, which makes it unique and important during service. According to the Federal Railroad Administration (FRA)(B. D. Ogden, Cooper, C., 2019), there were about 210,000 public and private grade crossings nationwide and most of them were public-approachable. Since the 1980s, the highway-rail collisions at grade crossings have been decreasing continuously as a result of upgrading many unprotected grade crossings. However, the cost of upgrading existing systems, including signaling units and gate arms, can easily exceed $200,000 per crossing (Roop et al., 2005). Although, there are significant improvements for railroad safety over the past decades, crashes at grade crossings are still one of the leading causes of railroad-related fatalities. According to the FRA (Baron & daSilva, 2019; Sharma & Associates, 2017), from 2010 to 2014, there were approximately 2,100 collisions between trains and motor vehicles per year in the country. More than 250 people were killed per year, which translates to an average of about five fatal accidents per week. In addition, these collisions disrupt both highway and rail operations and incurred negative impacts on the economy and the local communities.
Trespass casualties represent roughly 70% of accidents on railroad right-of-way (ROW) in North America at present. Ironically, more than 60% of collisions occur at crossings with automatic warning systems, and 34.7% occur at crossings that have flashing lights and gates (FRA 2019). There are several issues with the existing grade crossing warning system, including: 1) the flashing and gate arm only indicate an approaching train without quantitative information of estimated arrival time of the train. Out of all the highway-rail collisions, 94% can be attributed to driver behavior or poor judgment (FRA 2019). On many occasions, wrong judgment was mostly caused by the lack of quantitative situational awareness, especially when the approaching train is beyond the range of vision of the drivers or pedestrians. The availability of such information and corresponding alerts could potentially enhance situational assessment and rational decisions made by the drivers before they enter the crossing or abandon a vehicle promptly to avoid catastrophic consequences (FOX News 2016) the current grade crossing systems are limited by “one-way” communication, that is, they only offer warning signals to the vehicles and pedestrians while the trains are not notified about any real-time information at the crossings. The onboard engineers can respond only when unusual activities at the crossing occur within their sights, which often is too late for taking effective countermeasures. Indeed collisions under many circumstances could be prevented if the early, real-time traffic information can be exchanged between the train and the vehicles and pedestrians through “two-way” communication; and 3) the current grade crossing system does not have self-diagnosis capabilities and relies on fixed schedules of inspection and maintenance to ensure proper operation (https://youtu.be/PUqZR4HkGJw). For instance, FRA requires railroads to perform monthly tests of automatic warning devices. Therefore, an “intelligent” system for automatic grade crossing surveillance, mutual and quantitative information sharing, and self-diagnosis for condition-based maintenance (CBM), is strongly needed.

Intelligent Camera Aided Railway Emergency System (i-CARES), 2021
Center for Connected Multimodal Mobility (C2M2) Clemson University, Benedict College, The Citadel, South Carolina State University, University of South Carolina
Page 3
Many studies (Eluru, Bagheri, Miranda-Moreno, & Fu, 2012; Haleem, 2016; McCollister & Pflaum, 2007; B. D. Ogden, 2007; Yan, Richards, & Su, 2010) for highway-railroad grade crossing safety leading by the FRA, U.S. Department of Transportation (USDOT), and/or public/private educational institutions have been conducted, aiming to understand and reduce collisions at the grade crossings. However, most of those studies focused on accident severity or frequency analysis.
Some researchers have investigated the impact of traffic congestions on highway
safety (Marchesini & Weijermars, 2010; Meyer, 2008; C. Wang, 2010). However, at present, there is no systematic study to quantify traffic congestion in front of the grade crossing and assess its impact on railroad safety or public concerns.
To address such an urgent need, we proposed to initiate the effort to develop the
first-ever Intelligent Camera Aided Railway Emergency System (i-CARES) based on image-based monitoring and surveillance, quantitative situational awareness assessment, and direct “two-way” communication and information sharing. i-CARES features salient wireless communication, computer vision, Artificial Intelligence (AI) innovation, and in-situ preventive actions on an embedded and autonomous “cyber-physical systems/CPS” platform installed at grade crossings, and represents a holistic solution to grade crossing safety that has never been explored before for railroad engineering. Other innovations and benefits offered by i-CARES include automatic fault detection and notification for CBM, and imagery evidence for trespassing violation (similar to the Electronic Police Reports Online (ePRO) system). This project will be focusing on developing the automatic target recognition algorithm and the AI to track vehicles to analyze vehicle behavior at railroad crossings.

Intelligent Camera Aided Railway Emergency System (i-CARES), 2021
Center for Connected Multimodal Mobility (C2M2) Clemson University, Benedict College, The Citadel, South Carolina State University, University of South Carolina
Page 4
CHAPTER 2
Literature Review 2.1 Existing Object Detection Algorithm Review YOLO (Redmon, Divvala, Girshick, & Farhadi, 2016) is a deep learning algorithm newly developed for real-time object detection and recognition. It unifies the target classification and localization within a single convolutional neural network (CNN) and achieves end-to-end object detection based on bounding box prediction and class probabilities. The basic YOLO can process images at a rate of 45 frames per second (FPS) on a Titan X GPU while with 63.4 mean average precision (mAP) (Redmon et al., 2016). Due to its high speed and accuracy of object detection, YOLO has being applied to a variety of applications, such as real-time detection of apples in orchards, real-time detection of steel strip surface defects, and real-time detection of road damages, etc. (Alfarrarjeh, Trivedi, Kim, & Shahabi, 2018; Li, Su, Geng, & Yin, 2018; Tian et al., 2019).
The network of YOLO contains 24 convolution layers and two fully connected
layers (Redmon et al., 2016). It divides each input image in a training set of 𝑆𝑆 × 𝑆𝑆 grids. Specifically, if the center of the target falls into a grid, then this grid is responsible for predicting 𝐵𝐵 boundary boxes with certain confidence scores, meanwhile, it will predict 𝐶𝐶 classes conditional class probabilities. To assess the performance of YOLO on Pattern Analysis, Statistical Modelling and Computational Learning Visual Object Classes (PASCAL VOC) dataset, this study sets 𝑆𝑆 as 7, 𝐵𝐵 as 2, and 𝐶𝐶 as 20, which means the final prediction is a 𝑆𝑆 × 𝑆𝑆 × (𝐵𝐵 ∗ 5 + 𝐶𝐶) = 7 × 7 × 30 tensor. The model in this study is shown in Figure 2.1, and Figure 2.2 presents the network architecture. Eq. 1-Eq. 3 define the confidence, the conditional class probability, and the class confidence score, respectively. 𝐶𝐶𝐶𝐶𝐶𝐶𝐶𝐶𝐶𝐶𝐶𝐶𝐶𝐶𝐶𝐶𝐶𝐶𝐶𝐶 = 𝑃𝑃𝑟𝑟(𝐶𝐶𝑜𝑜𝑜𝑜𝐶𝐶𝐶𝐶𝑜𝑜) × 𝐼𝐼𝐶𝐶𝐼𝐼𝑝𝑝𝑟𝑟𝑝𝑝𝑝𝑝𝑡𝑡𝑟𝑟𝑡𝑡𝑡𝑡ℎ,𝑃𝑃𝑟𝑟(𝐶𝐶𝑜𝑜𝑜𝑜𝐶𝐶𝐶𝐶𝑜𝑜) ∈ {0,1} (1) 𝐶𝐶𝐶𝐶𝐶𝐶𝐶𝐶𝐶𝐶𝑜𝑜𝐶𝐶𝐶𝐶𝐶𝐶𝐶𝐶𝐶𝐶 𝐶𝐶𝐶𝐶𝐶𝐶𝐶𝐶𝐶𝐶 𝑃𝑃𝑃𝑃𝐶𝐶𝑜𝑜𝐶𝐶𝑜𝑜𝐶𝐶𝐶𝐶𝐶𝐶𝑜𝑜𝑃𝑃 = 𝑃𝑃𝑟𝑟(𝐶𝐶𝐶𝐶𝐶𝐶𝐶𝐶𝐶𝐶𝑖𝑖|𝐶𝐶𝑜𝑜𝑜𝑜𝐶𝐶𝐶𝐶𝑜𝑜) (2) 𝐶𝐶𝐶𝐶𝐶𝐶𝐶𝐶𝐶𝐶 𝐶𝐶𝐶𝐶𝐶𝐶𝐶𝐶𝐶𝐶𝐶𝐶𝐶𝐶𝐶𝐶𝐶𝐶𝐶𝐶 𝐶𝐶𝐶𝐶𝐶𝐶𝑃𝑃𝐶𝐶 = 𝑃𝑃𝑟𝑟(𝐶𝐶𝐶𝐶𝐶𝐶𝐶𝐶𝐶𝐶𝑖𝑖|𝐶𝐶𝑜𝑜𝑜𝑜𝐶𝐶𝐶𝐶𝑜𝑜) × 𝑃𝑃𝑟𝑟(𝐶𝐶𝑜𝑜𝑜𝑜𝐶𝐶𝐶𝐶𝑜𝑜) × 𝐼𝐼𝐶𝐶𝐼𝐼𝑝𝑝𝑟𝑟𝑝𝑝𝑝𝑝𝑡𝑡𝑟𝑟𝑡𝑡𝑡𝑡ℎ = 𝑃𝑃𝑟𝑟(𝐶𝐶𝐶𝐶𝐶𝐶𝐶𝐶𝐶𝐶𝑖𝑖) × 𝐼𝐼𝐶𝐶𝐼𝐼𝑝𝑝𝑟𝑟𝑝𝑝𝑝𝑝𝑡𝑡𝑟𝑟𝑡𝑡𝑡𝑡ℎ (3) where, 𝑃𝑃𝑟𝑟(𝐶𝐶𝑜𝑜𝑜𝑜𝐶𝐶𝐶𝐶𝑜𝑜) is the probability that the box contains an object, 𝐼𝐼𝐶𝐶𝐼𝐼 is the intersection over the union between the ground truth and the predicted box, 𝑃𝑃𝑟𝑟(𝐶𝐶𝐶𝐶𝐶𝐶𝐶𝐶𝐶𝐶𝑖𝑖|𝐶𝐶𝑜𝑜𝑜𝑜𝐶𝐶𝐶𝐶𝑜𝑜) is the probability that the object belongs to 𝐶𝐶𝐶𝐶𝐶𝐶𝐶𝐶𝐶𝐶𝑖𝑖 given the presence of an object, 𝑃𝑃𝑟𝑟(𝐶𝐶𝐶𝐶𝐶𝐶𝐶𝐶𝐶𝐶𝑖𝑖) is the probability that the object belongs to 𝐶𝐶𝐶𝐶𝐶𝐶𝐶𝐶𝐶𝐶𝑖𝑖.
Technically, the confidence score should be zero if there is no object in the grid, in
which case 𝑃𝑃𝑟𝑟(𝐶𝐶𝑜𝑜𝑜𝑜𝐶𝐶𝐶𝐶𝑜𝑜) equals 1 and the confidence score equals to 𝐼𝐼𝐶𝐶𝐼𝐼 between the predicted box and the ground truth. The high confidence score allows us to make the final decisions. It is noteworthy that, no matter how many boxes there are, for each grid cell,

Intelligent Camera Aided Railway Emergency System (i-CARES), 2021
Center for Connected Multimodal Mobility (C2M2) Clemson University, Benedict College, The Citadel, South Carolina State University, University of South Carolina
Page 5
only one set of class probabilities is predicted. In the end, the confidence in the classification and localization of an object is given by the class-specific confidence score.
Figure 2.1 YOLO model used in the present work
Figure 2.2 Neural network architecture of YOLO used in this work

Intelligent Camera Aided Railway Emergency System (i-CARES), 2021
Center for Connected Multimodal Mobility (C2M2) Clemson University, Benedict College, The Citadel, South Carolina State University, University of South Carolina
Page 6
2.2 Evolution of the Previous Algorithm Although YOLO has a fast processing speed on object detection compared with other region-based detectors, such as R-CNN (Gidaris & Komodakis, 2015), Fast-RCNN (Girshick, 2015), and Faster-RCNN (Ren, He, Girshick, & Sun, 2015), YOLO also yields higher localization errors. YOLOv2 (Redmon & Farhadi, 2017), the second version of YOLO, significantly improves the localization accuracy while maintaining the fast processing speed and high classification accuracy. For example, at 67 FPS, YOLOv2 achieves 76.8 mAP on VOC 2007, while its strong competitor, Faster-RCNN only runs at 7 FPS with 73.2 mAP. YOLOv2 runs far faster than other detectors while maintaining accuracy.
YOLOv2 is based on a new network architecture, Darknet-19, which contains 19
convolutional layers and 5 max-pooling layers and uses a convolutional layer to replace the fully connected layer in the output layer. The synthesized information of the network architecture of Darknet19 is shown in Figure 2.3a. To address the issue of the larger localization error, YOLOv2 introduced the idea of the anchor box to predict bounding boxes and raise the detection accuracy. Besides, YOLOv2 integrated batch normalization, higher resolution classifier, multiple scale training, fine-grained features, direct location prediction, and other methods to greatly enhance training performance and detection accuracy. 2.3 Selected Algorithm in this Study The latest version of YOLO, YOLOv3 (Redmon & Farhadi, 2018), is trained on a much more comprehensive network than its predecessor, Darknet-53, which contains 53 convolutional layers as the feature extractor as shown in Figure 2.3b, making it more efficient to utilize GPU for even faster speed. To further improve its object detection performance, in particular, for small or adjacent objects, YOLOv3 applied an independent logistic classifier to replace the Softmax function, achieved multi-scale prediction, and changed the way in calculating the cost function, etc., aiming to make it more effective on training and testing.
The prior region-based object detection systems, which adopt the selective search
algorithm and take a large amount of time to train the neural network to localize regions of the high probability as the target detections, will trigger many redundant calculations, leading to high overlapping and memory occupation in the training and testing. Therefore, it is not suitable to address the research needs of this study for the detection of vehicles and assessing the traffic congestions at grade crossings in real-time. In contrast, YOLOv3 employs the feature pyramid network (FPN) and independent logistic classifiers for multiple classification detection, thus, runs more efficiently along with salient accuracy of the real-time detection. In the following section, the tracking system was developed based on the trained YOLOv3 with our customized data framework, which can facilitate automatic tracking and counting of vehicles from the traffic monitoring videos at grade crossings.

Intelligent Camera Aided Railway Emergency System (i-CARES), 2021
Center for Connected Multimodal Mobility (C2M2) Clemson University, Benedict College, The Citadel, South Carolina State University, University of South Carolina
Page 7
(a)
(b)
Figure 2.3 Synthesized network structures of Darknet19 and Darknet53: (a) Synthesized Darknet19; (b) Synthesized Darknet53

Intelligent Camera Aided Railway Emergency System (i-CARES), 2021
Center for Connected Multimodal Mobility (C2M2) Clemson University, Benedict College, The Citadel, South Carolina State University, University of South Carolina
Page 8
CHAPTER 3 Methodology
3.1 Featured Training YOLOv3 has many advantages, but it is not universal for all applications. Particularly, this study needs to customize and improve the basic YOLOv3 from two aspects: 1) be able to detect vehicles that are far away from the crossings, and 2) be able to detect vehicles under low visibility conditions. To adapt the illumining condition variation from day to night in the field, a customized dataset was used to train YOLOv3. Specifically, the training tests were completed by using Pytroch which is an open-source machine learning library developed by Facebook’s AI Research Lab. In detail, the workstation configurations in this training include i7 processor, GTX 1080 Ti, 16GB memory, Nvidia CUDA 9.0 and cuDNN 7.0, etc. During the training, 1,090 images/frames from the videos were used as input data. The ratio of training data to validation data is 5:1, which means there were 980 training images and 110 validation images. The training and validation processes took eight hours and 400 epochs. Specifically, the initial model was well-trained on the COCO dataset (a commonly used public training dataset), more specifically, the street vehicles. The training hyperparameters can be seen in Table 3.1. To improve the detection accuracy by ignoring the box scores below 0.5, Non-Maximum Suppression (Cheng, Zhang, Lin, & Torr, 2014) was used to remove additional anchors produced by predictions. Three parameters, namely the precision, recall, and F1 score, were used to describe the training accuracy in Table 3.2. The equations to calculate these three parameters are listed in Eq. 4-Eq. 6. Figure 3.1 shows the decreasing trends with the increases of epochs, indicating a good training process and performance. It is worth noting that each epoch means going through all input data in a batch. In Figure 3.1, both loss curves dropped smoothly, indicating the training processes were successful. Besides, Table 3.2 shows the precision, recall, and F1 score are 82.5%, 83%, and 82.7%, respectively. All of them are high than 80%, indicating they can perform well in the field. 𝑝𝑝𝑃𝑃𝐶𝐶𝐶𝐶𝐶𝐶𝐶𝐶𝐶𝐶𝐶𝐶𝐶𝐶 = 𝑇𝑇𝑃𝑃/(𝑇𝑇𝑃𝑃 + 𝐹𝐹𝑃𝑃) (4)
recall = 𝑇𝑇𝑃𝑃/(𝑇𝑇𝑃𝑃 + 𝐹𝐹𝐹𝐹) (5)
F1 score = (2 × 𝑝𝑝𝑃𝑃𝐶𝐶𝐶𝐶𝐶𝐶𝐶𝐶𝐶𝐶𝐶𝐶𝐶𝐶 × 𝑃𝑃𝐶𝐶𝐶𝐶𝐶𝐶𝐶𝐶𝐶𝐶)/(𝑝𝑝𝑃𝑃𝐶𝐶𝐶𝐶𝐶𝐶𝐶𝐶𝐶𝐶𝐶𝐶𝐶𝐶 + 𝑃𝑃𝐶𝐶𝐶𝐶𝐶𝐶𝐶𝐶𝐶𝐶) (6)
where TP is the true positive, FP is the false positive, and FN is the false negative for each image. For example, in our case, “vehicle” is a positive class, and “No vehicle” is a negative class. The TP is an outcome where our model correctly predicts the positive class. The FP is an outcome where our model incorrectly predicts the positive class and the FN is an outcome where the model incorrectly predicts the negative class.

Intelligent Camera Aided Railway Emergency System (i-CARES), 2021
Center for Connected Multimodal Mobility (C2M2) Clemson University, Benedict College, The Citadel, South Carolina State University, University of South Carolina
Page 9
Table 3.1 Hyperparameters of experiment
Hyperparameter Value Description Batch size 16 The number of training examples utilized in one
iteration Momentum 0.937 Parameter to improve both training speed and
accuracy Weight decay 0.000484 Parameter causing the weight to exponentially decay
to zero to prevent overfitting Initial learning
rate 1E-2 Parameter to control the rate or speed at which the
model learns in the beginning Final learning rate 1E-4 Parameter to control the rate or speed at which the
model learns in the end Image size 416X416 Default image size of YOLOv3 training
Table 3.2 Parameters of training accuracy
Parameter Value Precision 82.5%
Recall 83% F1 score 82.7%
Figure 3.1 Training results for a custom dataset: loss over training epochs
3.2 Program Design and Procedure Flow Object tracking is a challenging task, which includes motion detection, object localization, motion segmentation, background clutters, etc. With the marching in deep learning, more and more tracking algorithms start to use the features identified by the training process rather than the low-level, hand-crafted features. Inspired by the research of video tracking

Intelligent Camera Aided Railway Emergency System (i-CARES), 2021
Center for Connected Multimodal Mobility (C2M2) Clemson University, Benedict College, The Citadel, South Carolina State University, University of South Carolina
Page 10
conducted by Ning, etc. (Ning et al., 2017), YOLOv3 and SORT (an object tracker) are implemented to track vehicles in real-time to automatically detect and count the number of vehicles and predict the decongestion time at a selected grade crossing. SORT (Bewley, Ge, Ott, Ramos, & Upcroft, 2016) is an algorithm using the tracking and detection method to address the issue of multiple object tracking (MOT). In particular, multiple pedestrians and vehicles can be tracked simultaneously. In this study, the YOLOv3 framework is selected as the detector, while the state of each object is modelled by SORT as described in Eq 7. The procedure flow of the tracking system developed in this study is shown in Figure 3.2. X = [𝜇𝜇, 𝜐𝜐, s, r, �̇�𝜇, �̇�𝑣, �̇�𝐶]𝑇𝑇 (7) where, 𝜇𝜇 and 𝜐𝜐 represent the horizontal and vertical pixel location of the center of the target, 𝐶𝐶, and 𝑃𝑃 represent the scale and the aspect ratio of the target’s bounding box.
Figure 3.2. Procedure flow of SORT tracking approach 3.2.1 Data association Note that when the detection is associated with a target, the bounding box with the detected object will be updated to reflect the target state by a Kalman filter (an optimal estimator). Otherwise, the state of the target is predicted by the linear velocity model without any rectification. In addition, when the detection is assigned to an existing target, the target’s bounding box geometry is predicted as a new location in the current frame and the cost matrix is computed as the intersection-over-union (IOU) distance. The threshold of a minimum IOU is proposed to reject the assignments, where the overlap of detection is less than IOUmin. By default, the IOUmin value is 0.3 in this research. 3.2.2 Operation of tracker The operation of the tracker includes its creation and deletion. Specifically, when the objects enter the image, their unique identities will be created. Meanwhile, when the objects leave the image, their identities will be discarded, and the tracker will be terminated. For creating the tracker, if the overlap between the detection and the target is less than IOUmin then this track will be deleted, otherwise, it will be kept. Besides, if there is no match between the target and the detection in the Tlost frames, the track will also be terminated.

Intelligent Camera Aided Railway Emergency System (i-CARES), 2021
Center for Connected Multimodal Mobility (C2M2) Clemson University, Benedict College, The Citadel, South Carolina State University, University of South Carolina
Page 11
CHAPTER 4 Field Test Conditions
4.1 Site and Video Data Collection The test grade crossing in this research is located at the intersection between Catawba St. and Assembly St. in Columbia, South Carolina, near the campus of the University of South Carolina. Location details can be seen in Figure 4.1. Traffic video data was collected using the COUNTcam2 traffic recorder provided by the City of Columbia. The surveillance camera was installed on a power pole of which tag number is 490915 assisted by the City of Columbia. A total of 96 hours of video records were collected in two sets, from 10:44 AM, Nov. 19, 2019, to 10:44 AM to Nov. 21, 2019 (data set 1), 12:03 AM, Dec. 03, 2019, to 12:03 AM Dec. 05, 2019 (data set 2). The camera can continuously monitor the traffic for up to 50 hours due to battery life. Note that the incoming trains do not follow any specific schedule. Therefore, the time of a train approaching the selected crossing in this study is random which is typical for most of the crossings. In the future, a telecommunication unit facilitating the communication with the onboard positive train control (PTC) system will be integrated with the camera to automatically trigger the video recording when a train is approaching the crossing.
Figure 4.1 Research site of grade crossing at Columbia, SC, U.S. (Map data @ 2019 Google maps) 4.2 Vehicle Detection and Tracking After retracting video from the camera mounted on the designated power pole, clips including the blockage conditions caused by the train passing were manually selected and processed by the developed system. Figure 4.2 shows sample frames from our detection and tracking system.

Intelligent Camera Aided Railway Emergency System (i-CARES), 2021
Center for Connected Multimodal Mobility (C2M2) Clemson University, Benedict College, The Citadel, South Carolina State University, University of South Carolina
Page 12
a) b)
c) d)
e) f) Figure 4.2 Real-time vehicle detection and tracking system: (a)&(b) Morning condition during and after blockage; (c)&(d) Noon condition during and after blockage; (e)&(f) Night condition during and after a blockage Figure 4.2 presents six frames during and after crossing blockage under different illumination conditions within 24 hours. Comparing the results of the developed system with visual observation, the detection and tracking performance was consistently good in different lighting environments, especially in dim conditions, in which typical systems could struggle. In addition, Figure 4.2 provides different information under four

Intelligent Camera Aided Railway Emergency System (i-CARES), 2021
Center for Connected Multimodal Mobility (C2M2) Clemson University, Benedict College, The Citadel, South Carolina State University, University of South Carolina
Page 13
categories, including counter, detector, time, and control line. Specifically, the counter shows how many vehicles have already passed the control line in the current frame. The detector shows how many vehicles were detected by the system in the current frame. The time is the recording time for the video data. The red line shown in Figure 4.2 is the control line where the gate arm is located. When the centroid of the detected vehicle passed the line, the counter’s value would increase by one. 4.3 Field Performance Evaluation To assess the performance of the detection and tracking system in the field, accuracy was calculated with randomly selected video clips. In this study, accuracy is defined as the ratio of real-time tracking results in experiments to the ground truth data. The ground truth is the results from manually counting from the test video clips. There were 18 video clips selected from data set one and data set two and each video set contributed nine video clips. To take as many illumination conditions as possible into consideration, the time interval between each test video clip was two to four hours. Eq 8 demonstrates the calculation of the accuracy of the tracking function. The performance of the test results is provided in Table 4.1. 𝐴𝐴 = 𝑇𝑇/𝐺𝐺 × 100 (8) where 𝐴𝐴 is the accuracy of tracking results in the field tests; 𝑇𝑇 is the tracking result based on our system passed the control line in the test video clip; 𝐺𝐺 is the ground truth of vehicles passed the control line. Table 4.1 Performance assessment of detection and tracking system
Item Time Ground truth Tracking result 𝐴𝐴 (%) 1 02:44 – 02:45 (Dec 04) 2 2 100.00 2 04:39 – 04:40 (Dec 04) 1 1 100.00 3 06:54 – 06:55 (Dec 04) 7 6 85.71 4 10:00 – 10:01 (Dec 05) 16 14 87.50 5 12:14 – 12:15 (Dec 05) 8 8 100.00 6 14:16 – 14:17 (Dec 05) 11 11 100.00 7 18:39 – 18:40 (Dec 04) 12 10 83.33 8 20:49 – 20:50 (Dec 05) 9 7 77.77 9 10:00 – 10:01 (Dec 05) 5 4 80.00 10 00:15 – 00:16 (Nov 21) 4 3 75.00 11 04:37 – 04:38 (Nov 20) 1 1 100.00 12 06:45 – 06:46 (Nov 20) 2 2 100.00 13 10:24 – 10:25 (Nov 20) 13 13 100.00 14 12:25 – 12:26 (Nov 20) 14 14 100.00 15 14:20 – 14:21 (Nov 20) 15 15 100.00 16 18:22 – 18:23 (Nov 20) 30 30 100.00 17 20:18 – 20:19 (Nov 20) 12 10 83.33 18 22:19 – 22:20 (Nov 20) 10 9 90.00
Mean value of accuracy 92.37

Intelligent Camera Aided Railway Emergency System (i-CARES), 2021
Center for Connected Multimodal Mobility (C2M2) Clemson University, Benedict College, The Citadel, South Carolina State University, University of South Carolina
Page 14
Table 4.1 presents the performance of our detection and tracking system. Both ground truth data and tracking data vary from one to 30. Besides, the maximum and minimum accuracies are 100% and 77.7%, respectively. Ten tests achieved maximum accuracy, and they took place under different illumination conditions in 24 hour-period. Because the mean value of accuracy is 92.37%, so it is confident to believe the performance of the developed system is. Video clips with a low accuracy score that below 80% were double-checked. The missing counts were due to the large size of cars such as SUVs and pickup trucks blocking the view of small sedans, which caused the dropped accuracy.
Intelligent Camera Aided Railway Emergency System (i-CARES), 2021
Center for Connected Multimodal Mobility (C2M2) Clemson University, Benedict College, The Citadel, South Carolina State University, University of South Carolina
Page 15
CHAPTER 5 Results and Discussions
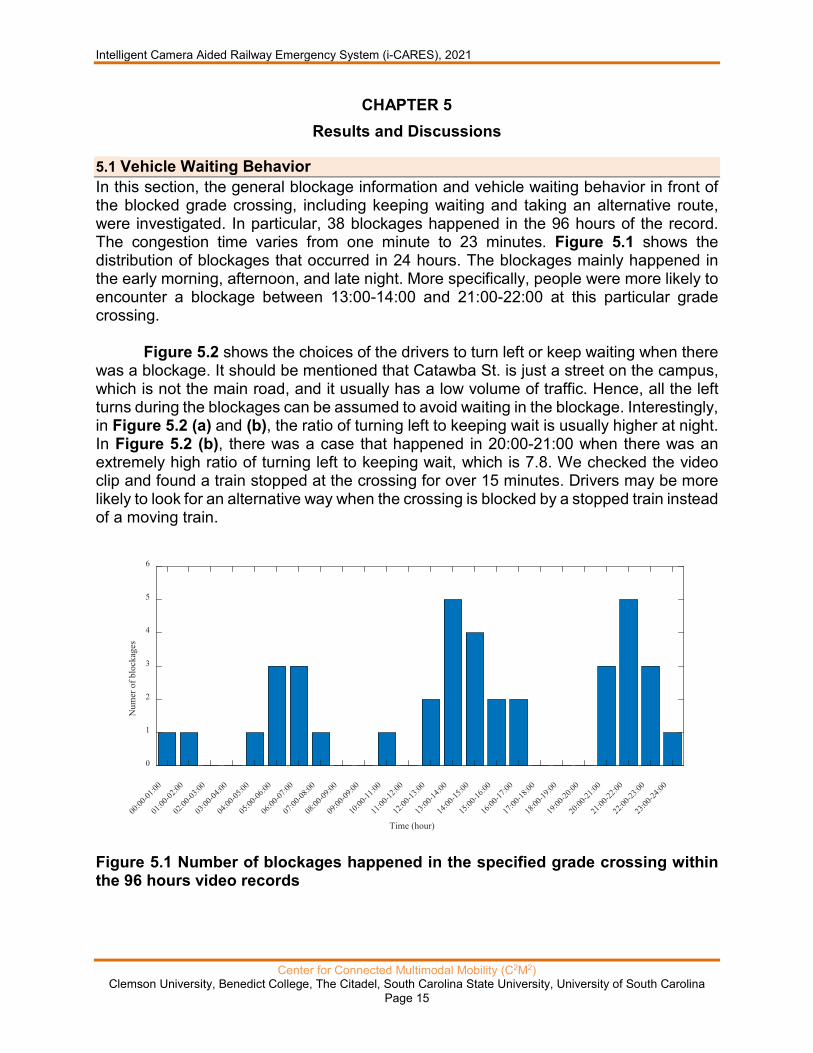
5.1 Vehicle Waiting Behavior In this section, the general blockage information and vehicle waiting behavior in front of the blocked grade crossing, including keeping waiting and taking an alternative route, were investigated. In particular, 38 blockages happened in the 96 hours of the record. The congestion time varies from one minute to 23 minutes. Figure 5.1 shows the distribution of blockages that occurred in 24 hours. The blockages mainly happened in the early morning, afternoon, and late night. More specifically, people were more likely to encounter a blockage between 13:00-14:00 and 21:00-22:00 at this particular grade crossing.
Figure 5.2 shows the choices of the drivers to turn left or keep waiting when there
was a blockage. It should be mentioned that Catawba St. is just a street on the campus, which is not the main road, and it usually has a low volume of traffic. Hence, all the left turns during the blockages can be assumed to avoid waiting in the blockage. Interestingly, in Figure 5.2 (a) and (b), the ratio of turning left to keeping wait is usually higher at night. In Figure 5.2 (b), there was a case that happened in 20:00-21:00 when there was an extremely high ratio of turning left to keeping wait, which is 7.8. We checked the video clip and found a train stopped at the crossing for over 15 minutes. Drivers may be more likely to look for an alternative way when the crossing is blocked by a stopped train instead of a moving train.
Figure 5.1 Number of blockages happened in the specified grade crossing within the 96 hours video records
00:00
-01:00
01:00
-02:00
02:00
-03:00
03:00
-04:00
04:00
-05:00
05:00
-06:00
06:00
-07:00
07:00
-08:00
08:00
-09:00
09:00
-09:00
10:00
-11:00
11:00
-12:00
12:00
-13:00
13:00
-14:00
14:00
-15:00
15:00
-16:00
16:00
-17:00
17:00
-18:00
18:00
-19:00
19:00
-20:00
20:00
-21:00
21:00
-22:00
22:00
-23:00
23:00
-24:00
Time (hour)
0
1
2
3
4
5
6
Num
er o
f blo
ckag
es

Intelligent Camera Aided Railway Emergency System (i-CARES), 2021
Center for Connected Multimodal Mobility (C2M2) Clemson University, Benedict College, The Citadel, South Carolina State University, University of South Carolina
Page 16
(a)
(b)
Figure 5.2 Number of vehicles with different choices when there was a blockage in the grade crossing: (a) Blockages happened during Nov 19 to Nov 21; (b) Blockages happened during Dec 03 to Dec 05
Figure 5.3 shows the relationship between the train passing time, vehicle number of turning left, and vehicle number of keeping waiting in 3D and 2D scatters. Figure 5.3 (b) shows the relationship between the vehicle number of turning left and train passing time. Train passing time varies from one minute to 23 minutes. The number of turning left varies from 0 to 57. In our experiments, only two trains that passed this grade crossing
00:00
-01:00
01:00
-02:00
02:00
-03:00
03:00
-04:00
04:00
-05:00
05:00
-06:00
06:00
-07:00
07:00
-08:00
08:00
-09:00
09:00
-09:00
10:00
-11:00
11:00
-12:00
12:00
-13:00
13:00
-14:00
14:00
-15:00
15:00
-16:00
16:00
-17:00
17:00
-18:00
18:00
-19:00
19:00
-20:00
20:00
-21:00
21:00
-22:00
22:00
-23:00
23:00
-24:00
Time (hour)
0
50
100
150N
umbe
r of v
ehic
les
Vehicles of keeping waitVehicles of turning left
00:00
-01:00
01:00
-02:00
02:00
-03:00
03:00
-04:00
04:00
-05:00
05:00
-06:00
06:00
-07:00
07:00
-08:00
08:00
-09:00
09:00
-09:00
10:00
-11:00
11:00
-12:00
12:00
-13:00
13:00
-14:00
14:00
-15:00
15:00
-16:00
16:00
-17:00
17:00
-18:00
18:00
-19:00
19:00
-20:00
20:00
-21:00
21:00
-22:00
22:00
-23:00
23:00
-24:00
Time (hour)
0
50
100
150
200
250
Num
ber o
f veh
icle
s
Vehicles of keeping waitVehicles of turning left

Intelligent Camera Aided Railway Emergency System (i-CARES), 2021
Center for Connected Multimodal Mobility (C2M2) Clemson University, Benedict College, The Citadel, South Carolina State University, University of South Carolina
Page 17
took more than 15 minutes, which were 17 minutes and 23 minutes, respectively. Meanwhile, the numbers of turning left were 71 and 147, respectively. The data points of the vehicle number of turning left are concentrated in the left down corner, indicating people would like to choose an alternative path immediately when there is a blockage at a grade crossing. It meets our observations from the video records.
Figure 5.3 (c) shows the relationship between the vehicle number of keeping waiting and train passing time. The vehicle number of keeping waiting varied from one to 53. Notably, within five minutes, the maximum vehicle number of keeping waiting is 29. In the time domain of five to 10 minutes, the vehicle number of keeping waiting increases, and the maximum number is 53. It is reasonable because the longer the crossing is blocked, the more cars would be waiting on the street. After 10 minutes, there was a rapid drop in waiting, and only 19 cars kept waiting in front of the grade crossing. Interestingly, most of the blocked vehicles arrived late, and vehicles blocked earlier chose to turn left or make a U-turn, indicating the maximum waiting time for a traveler could be around 10 minutes, suggesting the maximum waiting time for a traveler could be around 10 minutes.
Figure 5.3 (d) shows the relationship between the vehicle number of turning left
and the vehicle number of keeping waiting. It shows that a long train passing time introduces more vehicles to the queue. Meanwhile, more vehicles prefer to turn left to avoid the blockage. The data shown in Figure 5.3 depicts the traveler’s waiting behavior when there is a blockage at a grade crossing, which is associated with the decongestion time. All data here is the foundation for further analysis.
(a)

Intelligent Camera Aided Railway Emergency System (i-CARES), 2021
Center for Connected Multimodal Mobility (C2M2) Clemson University, Benedict College, The Citadel, South Carolina State University, University of South Carolina
Page 18
(b)
(c)

Intelligent Camera Aided Railway Emergency System (i-CARES), 2021
Center for Connected Multimodal Mobility (C2M2) Clemson University, Benedict College, The Citadel, South Carolina State University, University of South Carolina
Page 19
(d)
Figure 5.3 Relationship between train passing time, vehicle number of turning left, and vehicle number of keeping waiting. (a) 3D-scatter distribution of train passing time, vehicle number of turning left and vehicle number of keeping waiting; (b) Vehicle number of turning left versus train passing time; (c) Vehicle number of keeping waiting versus train passing time; (d) Vehicle number of turning left versus vehicle number of keeping waiting 5.2 Queue Clearing Time In this study, queue clearing time means the clearance time of the blocked vehicles. It is worth noting the difference between total delay time and queue clearing time. The total delay time is the train passing time plus the vehicle clearance time, but decongestion time in this study only represents the vehicle clearance time and does not equal the total delay time. More specifically, the train passing time is defined as the time between the gate arm moves down, and the gate arm rises. The vehicle clearance time is defined as the duration between the moment the first car passes the gate arm (or control line), and the last car waiting in the queue passes the grade crossing. The last vehicle is the farthest vehicle that fully stopped and kept waiting in the queue before the gate arm rose. When the last vehicle passed the control line, it meant that all the blocked vehicles were cleared up.
Figure 5.4 (a) shows the relationship between the vehicle clearance time and the
number of cars waiting in the queue with the ground truth (GT) data and the tracking (Tr) data. The clearance time of congested vehicles varies from six seconds to 90 seconds. Correspondingly, the ground truth data, which was manually counted varies from one to 53, and the tracking data varies from one to 51. From the data shown in Figure 6 (a), the

Intelligent Camera Aided Railway Emergency System (i-CARES), 2021
Center for Connected Multimodal Mobility (C2M2) Clemson University, Benedict College, The Citadel, South Carolina State University, University of South Carolina
Page 20
maximum difference between the ground truth data and the tracking data is six, and the minimum difference between ground truth data and tracking data is zero. Further, for the majority (84%) of the difference between the ground truth and the tracking data is less than three. To confirm there is a strong correlation between the ground truth data, the tracking data, and the clearance time, the P-value and R-value were calculated based on Pearson’s correlation. Table 5.1 presents the P-values and R-values between the ground truth data, the tracking data, and the clearance time. It is noticeable that the R-values in Table 5.1 are all zeros, which are much lower than 5%, indicating the correlation coefficients are statistically significant. In the column of P-value, all data close to one, which means strong correlations are among these variables. To better present the relationship between the clearance time and the vehicle number of GT and Tr, the linear regressions are shown in Figures 5.4 (b) and (c). Figure 5.4 (b) presents the linear fitting result of the number of congested vehicles (ground truth data) and the clearance time. The R-square value is 0.91, which is high enough to believe there is a linear correlation between these two variables. Figure 5.4 (c) shows the linear fitting result of the number of congested vehicles (filed tracking data) and the clearance time. The R-square value is 0.88, which also indicates a good correlation between tracking data and clearance time. In the current state, to some extent, the clear time can be predicted based on this fitting model. In our next phase, we will dynamically and continually capture the blockage information in front of the grade crossing by combining the PTC data. The congested number of vehicles will be detected immediately, and the total delay time will be calculated in real-time in the future.
(a)
0 10 20 30 40 50 60 70 80 90
Clearance time (sec)
0
5
10
15
20
25
30
35
40
45
50
55
60
Num
ber o
f con
gest
ed v
ehic
les
Tracking data
Ground truth

Intelligent Camera Aided Railway Emergency System (i-CARES), 2021
Center for Connected Multimodal Mobility (C2M2) Clemson University, Benedict College, The Citadel, South Carolina State University, University of South Carolina
Page 21
(b)
(c)
Figure 5.4 The relationship between clearance time and waiting car number: (a) Number of congested vehicle versus clearance time with ground truth data and tracking data; (b) Fitting result for number of congested vehicle with ground truth data versus clearance time; (c) Fitting result for number of congested vehicle with tracking data versus clearance time
10 20 30 40 50 60 70 80 90Clearance time (sec)
0
5
10
15
20
25
30
35
40
45
50N
umbe
r of c
onge
sted
veh
icle
s (G
T)
Number of congested vehicles (GT)
Fitting curve
10 20 30 40 50 60 70 80 90Clearance time (sec)
0
5
10
15
20
25
30
35
40
45
50
Num
ber o
f con
gest
ed v
ehic
les (
Tr)
Number of congested vehicles (Tr)
Fitting curve

Intelligent Camera Aided Railway Emergency System (i-CARES), 2021
Center for Connected Multimodal Mobility (C2M2) Clemson University, Benedict College, The Citadel, South Carolina State University, University of South Carolina
Page 22
Table 5.1 P and R values between Ground truth vehicle number (GT), Tracking vehicle number (Tr) and Clearance time P-value R-value Vehicle number (GT) – Clearance time 0.8955 0 Vehicle number (Tr) – Clearance time 0.8707 0 Vehicle number (GT) – Vehicle number (Tr) 0.9874 0
Intelligent Camera Aided Railway Emergency System (i-CARES), 2021
Center for Connected Multimodal Mobility (C2M2) Clemson University, Benedict College, The Citadel, South Carolina State University, University of South Carolina
Page 23
CHAPTER 6 Concluding Remarks
This project presents findings from the assessment of traffic conditions at highway-railway grade crossings through real-time object detection and tracking techniques. This is the first step to develop a field-deployable system that integrates computer vision, traffic assessment, and PTC communication to improve grade crossing safety to avoid collisions due to miscommunications between the trains and the surface traffic at the grade crossings. An automatic detection and tracking system was developed based on YOLOv3 and SORT framework. Based on the preliminary results obtained, the following conclusions can be drawn:
By comparing the results from the manual counting approach, the developed system has reasonable accuracy in object detection and tracking in real-time. The clearance time and waiting vehicle number show a good correlation and can be used to predict clearance time when we know the number of blocked vehicles in the queue.
This study was based on YOLOv3, which was available during the period of this
project. However, it is worth noting the development of computer vision detectors is very rapid. At the end of this project, YOLOv4 and YOLOv5 are already available. Future studies should make the best use of the advancement of computer vision. Also, for increasing the accuracy, possible approaches include using an infrared camera or developing a detector head that can detect objects in different scales. For example, differently sized objects like a pedestrian, a sedan, and a semi-truck will have a different number of pixels in an image, so they would need to be considered for three different scales in the detector.
Future work will focus on integrating PTC communication with the locomotives to
establish two-way communication channels in order to automatically calculate the collision probability. This calculated time would assist the railroad and the drivers to make appropriate decisions in case of emergencies.

Intelligent Camera Aided Railway Emergency System (i-CARES), 2021
Center for Connected Multimodal Mobility (C2M2) Clemson University, Benedict College, The Citadel, South Carolina State University, University of South Carolina
Page 24
REFERENCES Alfarrarjeh, A., Trivedi, D., Kim, S. H., & Shahabi, C. (2018). A Deep Learning Approach
for Road Damage Detection from Smartphone Images. Paper presented at the 2018 IEEE International Conference on Big Data (Big Data).
Baron, W., & daSilva, M. (2019). Effects of In-Pavement Lights on Driver Compliance with Grade Crossing Safety Equipment. Retrieved from
Bewley, A., Ge, Z., Ott, L., Ramos, F., & Upcroft, B. (2016). Simple online and realtime tracking. Paper presented at the 2016 IEEE International Conference on Image Processing (ICIP).
Cheng, M.-M., Zhang, Z., Lin, W.-Y., & Torr, P. (2014). BING: Binarized normed gradients for objectness estimation at 300fps. Paper presented at the Proceedings of the IEEE conference on computer vision and pattern recognition.
Eluru, N., Bagheri, M., Miranda-Moreno, L. F., & Fu, L. (2012). A latent class modeling approach for identifying vehicle driver injury severity factors at highway-railway crossings. Accident Analysis & Prevention, 47, 119-127. Retrieved from http://www.sciencedirect.com/science/article/pii/S0001457512000474. doi:https://doi.org/10.1016/j.aap.2012.01.027
Fox News. (2016). Moment of impact: Train smashes into truck stuck on track Retrieved from https://www.youtube.com/watch?v=nTJw284whlc++%29&feature=youtu.be
FRA. (2019). '' Highway-Rail Grade Crossings Overview '' United States. Federal Railroad Administration. Accessed May 9, 2020. https://railroads.dot.gov/program-areas/highway-rail-grade-crossing/highway-rail-grade-crossings-overview.Gidaris, S., & Komodakis, N. (2015). Object detection via a multi-region and semantic segmentation-aware cnn model. Paper presented at the Proceedings of the IEEE International Conference on Computer Vision.
Girshick, R. (2015). Fast r-cnn. Paper presented at the Proceedings of the IEEE international conference on computer vision.
Gunderson, D. (2014). As train traffic hassles mount, Moorhead seeks solutions, money. Retrieved from As train traffic hassles mount, Moorhead seeks solutions, money
Haleem, K. (2016). Investigating risk factors of traffic casualties at private highway-railroad grade crossings in the United States. Accident Analysis & Prevention, 95, 274-283. Retrieved from http://www.sciencedirect.com/science/article/pii/S0001457516302536. doi:https://doi.org/10.1016/j.aap.2016.07.024
Li, J., Su, Z., Geng, J., & Yin, Y. (2018). Real-time detection of steel strip surface defects based on improved yolo detection network. IFAC-PapersOnLine, 51(21), 76-81.
Liu, Q., Wang, T., & Souleyrette, R. R. (2017). A 3D Evaluation Method for Rail–Highway Hump Crossings. Computer‐Aided Civil and Infrastructure Engineering, 32(2), 124-137.
Marchesini, P., & Weijermars, W. A. M. (2010). The relationship between road safety and congestion on motorways: SWOV Institute for Road Safety Research Leidschendam.

Intelligent Camera Aided Railway Emergency System (i-CARES), 2021
Center for Connected Multimodal Mobility (C2M2) Clemson University, Benedict College, The Citadel, South Carolina State University, University of South Carolina
Page 25
Matt Gephardt, M. P. (2018). Trains blocking roadway creates dangerous situations, first responders say. Retrieved from https://kutv.com/news/get-gephardt/trains
McCollister, G. M., & Pflaum, C. C. (2007). A model to predict the probability of highway rail crossing accidents. Proceedings of the Institution of Mechanical Engineers, Part F: Journal of Rail and Rapid Transit, 221(3), 321-329. Retrieved from https://doi.org/10.1243/09544097JRRT84. doi:10.1243/09544097JRRT84
Meyer, M. D. (2008). Crashes vs. Congestion–What’s the Cost to Society? A Report prepared for the American Automobile Association by Cambridge Systematics.
NAMIGADDE, A. (2017). Wrong Side Of The Tracks: Railroads Trap First Responders In Circleville. Retrieved from https://radio.wosu.org/post/wrong-side-tracks-railroads-trap-first-responders-circleville#stream/0
Ning, G., Zhang, Z., Huang, C., Ren, X., Wang, H., Cai, C., & He, Z. (2017). Spatially supervised recurrent convolutional neural networks for visual object tracking. Paper presented at the 2017 IEEE International Symposium on Circuits and Systems (ISCAS).
Njus, E. (2016). How long can trains block railroad crossings?. Retrieved from https://www.oregonlive.com/commuting/2016/11/how_long_can_trains_block_rail.html
Ogden, B. D. (2007). Railroad-highway grade crossing handbook. Retrieved from Ogden, B. D., Cooper, C. (2019). Railroad-highway grade crossing handbook. United
States: Federal Highway Administration. Redmon, J., Divvala, S., Girshick, R., & Farhadi, A. (2016). You only look once: Unified,
real-time object detection. Paper presented at the Proceedings of the IEEE conference on computer vision and pattern recognition.
Redmon, J., & Farhadi, A. (2017). YOLO9000: better, faster, stronger. Paper presented at the Proceedings of the IEEE conference on computer vision and pattern recognition.
Redmon, J., & Farhadi, A. (2018). Yolov3: An incremental improvement. arXiv preprint arXiv:1804.02767.
Ren, S., He, K., Girshick, R., & Sun, J. (2015). Faster r-cnn: Towards real-time object detection with region proposal networks. Paper presented at the Advances in neural information processing systems.
Roberts, C. A., & Brown-Esplain, J. (2005). Congestion Mitigation at Railroad-Highway At-Grade Crossings. Retrieved from
Sharma & Associates, I. (2017). In-Depth Data Analysis of Grade Crossing Accidents Resulting in Injuries and Fatalities. Retrieved from
Sun, D. J., Liu, X., Ni, A., & Peng, C. (2014). Traffic congestion evaluation method for urban arterials: case study of Changzhou, China. Transportation Research Record, 2461(1), 9-15.
Tian, Y., Yang, G., Wang, Z., Wang, H., Li, E., & Liang, Z. (2019). Apple detection during different growth stages in orchards using the improved YOLO-V3 model. Computers and Electronics in Agriculture, 157, 417-426.
Wang, C. (2010). The relationship between traffic congestion and road accidents: an econometric approach using GIS. © Chao Wang,
Wang, T. (2016). 3D Infrastructure Condition Assessment For Rail Highway Applications.

Intelligent Camera Aided Railway Emergency System (i-CARES), 2021
Center for Connected Multimodal Mobility (C2M2) Clemson University, Benedict College, The Citadel, South Carolina State University, University of South Carolina
Page 26
Yan, X., Richards, S., & Su, X. (2010). Using hierarchical tree-based regression model to predict train–vehicle crashes at passive highway-rail grade crossings. Accident Analysis & Prevention, 42(1), 64-74. Retrieved from http://www.sciencedirect.com/science/article/pii/S0001457509001687. doi:https://doi.org/10.1016/j.aap.2009.07.003