intelligent approaches in improving in-vehicle network ... · intelligent approaches in improving...
TRANSCRIPT

UNCLASSIFIED: Dist A. Approved for public release
INTELLIGENT APPROACHES IN IMPROVING
IN-VEHICLE NETWORK ARCHITECTURE AND
MINIMIZING POWER CONSUMPTION IN COMBAT
VEHICLES
MACAM S. DATTATHREYA
DISSERTATION PROPOSAL
Submitted to the Graduate School of Wayne State University
Detroit, Michigan
in partial fulfillment of the requirements for the degree of
DOCTOR OF PHILOSOPHY
2011
MAJOR: COMPUTER ENGINEERING
Approved by:
Advisor Date

Report Documentation Page Form ApprovedOMB No. 0704-0188
Public reporting burden for the collection of information is estimated to average 1 hour per response, including the time for reviewing instructions, searching existing data sources, gathering andmaintaining the data needed, and completing and reviewing the collection of information. Send comments regarding this burden estimate or any other aspect of this collection of information,including suggestions for reducing this burden, to Washington Headquarters Services, Directorate for Information Operations and Reports, 1215 Jefferson Davis Highway, Suite 1204, ArlingtonVA 22202-4302. Respondents should be aware that notwithstanding any other provision of law, no person shall be subject to a penalty for failing to comply with a collection of information if itdoes not display a currently valid OMB control number.
1. REPORT DATE 22 NOV 2011
2. REPORT TYPE Academic Dissertation
3. DATES COVERED 22-11-2011 to 22-11-2011
4. TITLE AND SUBTITLE INTELLIGENT APPROACHES IN IMPROVING IN-VEHICLENETWORK ARCHITECTURE AND MINIMIZING POWERCONSUMPTION IN COMBAT VEHICLES
5a. CONTRACT NUMBER
5b. GRANT NUMBER
5c. PROGRAM ELEMENT NUMBER
6. AUTHOR(S) Macam Dattathreya
5d. PROJECT NUMBER
5e. TASK NUMBER
5f. WORK UNIT NUMBER
7. PERFORMING ORGANIZATION NAME(S) AND ADDRESS(ES) U.S. Army TARDEC ,6501 E.11 Mile Rd,Warren,MI,48397-5000
8. PERFORMING ORGANIZATIONREPORT NUMBER #22354
9. SPONSORING/MONITORING AGENCY NAME(S) AND ADDRESS(ES) U.S. Army TARDEC, 6501 E.11 Mile Rd, Warren, MI, 48397-5000
10. SPONSOR/MONITOR’S ACRONYM(S) TARDEC
11. SPONSOR/MONITOR’S REPORT NUMBER(S) #22354
12. DISTRIBUTION/AVAILABILITY STATEMENT Approved for public release; distribution unlimited
13. SUPPLEMENTARY NOTES Academic dissertation submitted to Wayne State University, Detroit, Michigan
14. ABSTRACT Our modern world is very different from few decades due to tremendous technological advancements. Theworld has state of the art technology solutions in electronics, software, and computer networks that havemany practical user applications. Our daily activities are dependent on many technologies such asautomotive, computers, cell phones, emails, television, video games, movies, and satellites. Multiple aspectsof human life in the areas of transportation, medicine, education, manufacturing, entertainment, security,and communication are improving. One technology innovation leads to multiple spinouts and thisphenomenon is trending upwards.
15. SUBJECT TERMS
16. SECURITY CLASSIFICATION OF: 17. LIMITATIONOF ABSTRACT
Same asReport (SAR)
18. NUMBEROF PAGES
89
19a. NAME OFRESPONSIBLE PERSON
a. REPORT unclassified
b. ABSTRACT unclassified
c. THIS PAGE unclassified
Standard Form 298 (Rev. 8-98) Prescribed by ANSI Std Z39-18

UNCLASSIFIED: Dist A. Approved for public release
© COPY RIGHT
MACAM S DATTATHREYA
2011
ALL RIGHTS RESERVED

ii UNCLASSIFIED: Dist A. Approved for public release
ACKNOWLEDGEMENTS
iii UNCLASSIFIED: Dist A. Approved for public release
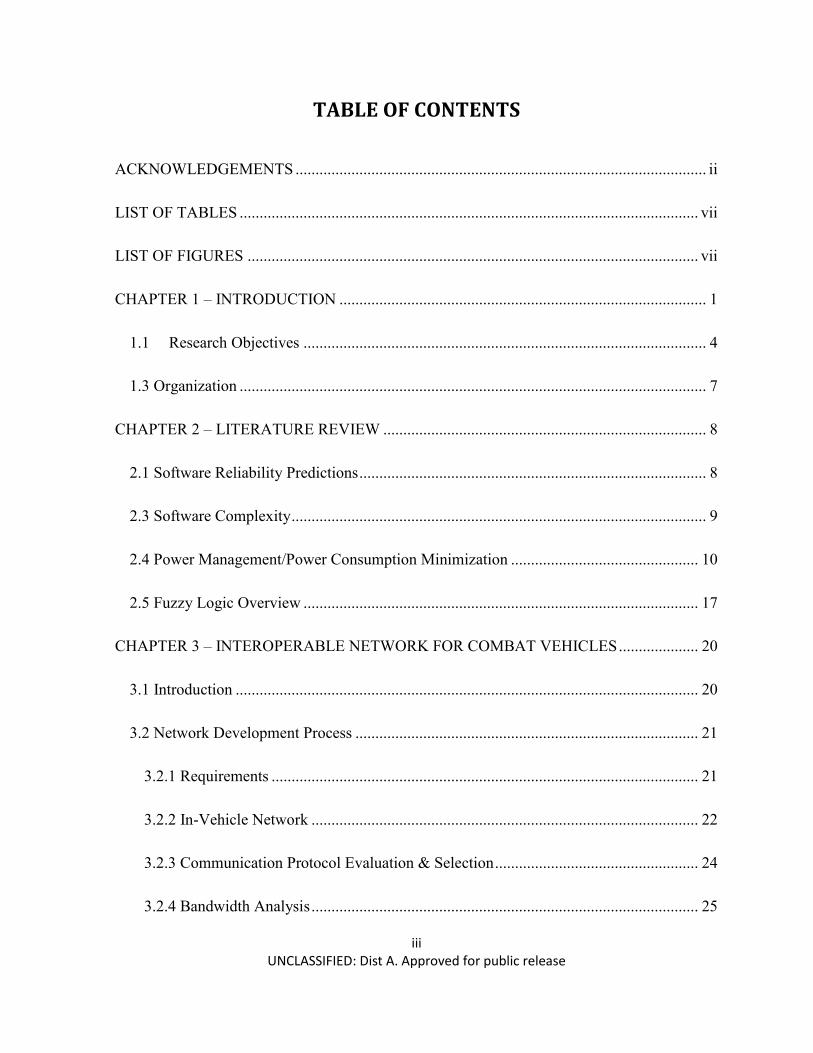
TABLE OF CONTENTS
ACKNOWLEDGEMENTS ....................................................................................................... ii
LIST OF TABLES ................................................................................................................... vii
LIST OF FIGURES ................................................................................................................. vii
CHAPTER 1 – INTRODUCTION ............................................................................................ 1
1.1 Research Objectives ..................................................................................................... 4
1.3 Organization ..................................................................................................................... 7
CHAPTER 2 – LITERATURE REVIEW ................................................................................. 8
2.1 Software Reliability Predictions ....................................................................................... 8
2.3 Software Complexity ........................................................................................................ 9
2.4 Power Management/Power Consumption Minimization ............................................... 10
2.5 Fuzzy Logic Overview ................................................................................................... 17
CHAPTER 3 – INTEROPERABLE NETWORK FOR COMBAT VEHICLES .................... 20
3.1 Introduction .................................................................................................................... 20
3.2 Network Development Process ...................................................................................... 21
3.2.1 Requirements ........................................................................................................... 21
3.2.2 In-Vehicle Network ................................................................................................. 22
3.2.3 Communication Protocol Evaluation & Selection ................................................... 24
3.2.4 Bandwidth Analysis ................................................................................................. 25

iv UNCLASSIFIED: Dist A. Approved for public release
3.2.5 Network Topology Evaluation & Selection............................................................. 26
3.2.6 Network Devices Selection ................................................................................. 26
3.3 Network Proposal Process .............................................................................................. 27
3.3.1 Network Proposals ................................................................................................... 27
3.3.2 Network Proposals Analysis .................................................................................... 29
3.3.3 Proposed Network.................................................................................................... 30
3.4 Conclusion .................................................................................................................. 32
CHAPTER 4 – SOFTWARE RELIABILITY PREDICTION FOR COMBAT VEHICLES . 33
4.1 Introduction .................................................................................................................... 33
4.2 AVS Reliability Metrics ................................................................................................. 34
4.2.1 Data Handling .......................................................................................................... 34
4.2.2 Interoperability......................................................................................................... 35
4.2.2 Configurability ......................................................................................................... 36
4.2.3 Fault Handling ......................................................................................................... 37
4.3 AVS Reliability Prediction Algorithm ........................................................................... 38
4.4 Conclusion ...................................................................................................................... 44
CHAPTER 5 - SOFTWARE COMPLEXITY PREDICTION FOR COMBAT VEHICLES . 45
5.1 Introduction .................................................................................................................... 45
5.2 Software Complexity ...................................................................................................... 45
v UNCLASSIFIED: Dist A. Approved for public release
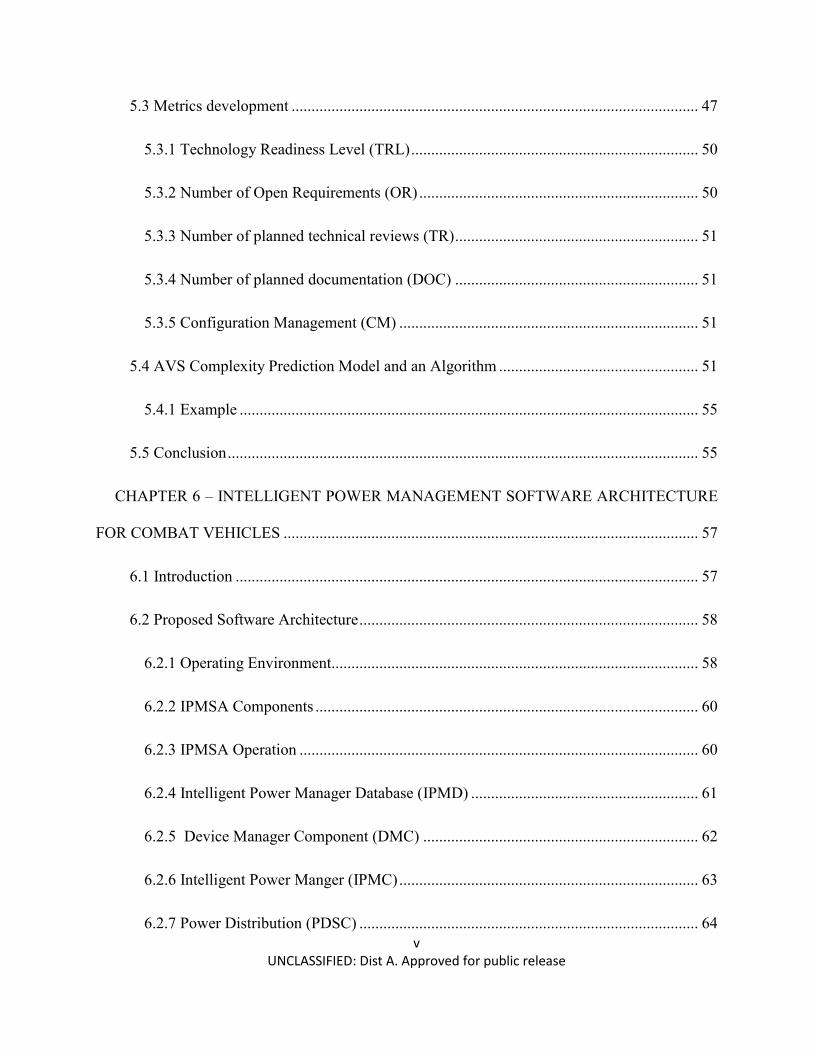
5.3 Metrics development ...................................................................................................... 47
5.3.1 Technology Readiness Level (TRL) ........................................................................ 50
5.3.2 Number of Open Requirements (OR) ...................................................................... 50
5.3.3 Number of planned technical reviews (TR) ............................................................. 51
5.3.4 Number of planned documentation (DOC) ............................................................. 51
5.3.5 Configuration Management (CM) ........................................................................... 51
5.4 AVS Complexity Prediction Model and an Algorithm .................................................. 51
5.4.1 Example ................................................................................................................... 55
5.5 Conclusion ...................................................................................................................... 55
CHAPTER 6 – INTELLIGENT POWER MANAGEMENT SOFTWARE ARCHITECTURE
FOR COMBAT VEHICLES ........................................................................................................ 57
6.1 Introduction .................................................................................................................... 57
6.2 Proposed Software Architecture ..................................................................................... 58
6.2.1 Operating Environment............................................................................................ 58
6.2.2 IPMSA Components ................................................................................................ 60
6.2.3 IPMSA Operation .................................................................................................... 60
6.2.4 Intelligent Power Manager Database (IPMD) ......................................................... 61
6.2.5 Device Manager Component (DMC) ..................................................................... 62
6.2.6 Intelligent Power Manger (IPMC) ........................................................................... 63
6.2.7 Power Distribution (PDSC) ..................................................................................... 64

vi UNCLASSIFIED: Dist A. Approved for public release
6.2.8 Coolant Control (CCSC) ......................................................................................... 64
6.2.9 Environment Control (ECSC) .................................................................................. 65
6.2.10 Individual Devices Software (IDSC) ..................................................................... 65
6.4 Algorithms (IPMA) ........................................................................................................ 66
6.5 Conclusions ................................................................................................................... 68
CHAPTER 7 MATERIALS AND METHODS ....................................................................... 70
7.1 Materials and Methods ................................................................................................... 70
7.1.1 Source of Materials .................................................................................................. 70
7.1.2 Method ..................................................................................................................... 70
7.1.3 Experimental Setup .................................................................................................. 72
CHAPTER 8 – SUMMARY .................................................................................................... 73
DISCLAIMER ......................................................................................................................... 76
REFFERENCES ...................................................................................................................... 76

vii UNCLASSIFIED: Dist A. Approved for public release
LIST OF TABLES
TABLE 3. 1: Protocol selection factor and weighting .................................................................. 24
TABLE 3. 2: Protocol evaluation ................................................................................................. 25
TABLE 3. 3: Bandwidth analysis ................................................................................................ 26
TABLE 3. 4: Proposed Architecture devices ................................................................................ 26
TABLE 4. 1: Metric elements and its default values .................................................................... 34
TABLE 4. 2 Linguistic triangular membership ranges ................................................................. 40
TABLE 5. 1: Rotated Factor Loadings ......................................................................................... 48
TABLE 5. 2: Eigen Values ........................................................................................................... 48
TABLE 5. 3 Proposed metric elements ........................................................................................ 49
TABLE 5. 4: AVS metric data from various documents .............................................................. 49
TABLE 5. 5: Fuzzy Variables ...................................................................................................... 53
LIST OF FIGURES
Fig.1. 1 A notional CV‘s in-vehicle network .................................................................................. 4
Fig.1. 2 Thesis outline ..................................................................................................................... 6
Fig. 2. 1 Triangular membership function plot ............................................................................. 19
Fig . 3.2. 1 A notional network overview ..................................................................................... 22
Fig. 3.3. 1 Network proposal#1 .................................................................................................... 27
Fig. 3.3. 2 Network proposal#2 and the proposed network (LAN) .............................................. 28
Fig. 3.3. 3 Network proposal#3 .................................................................................................... 29
viii UNCLASSIFIED: Dist A. Approved for public release
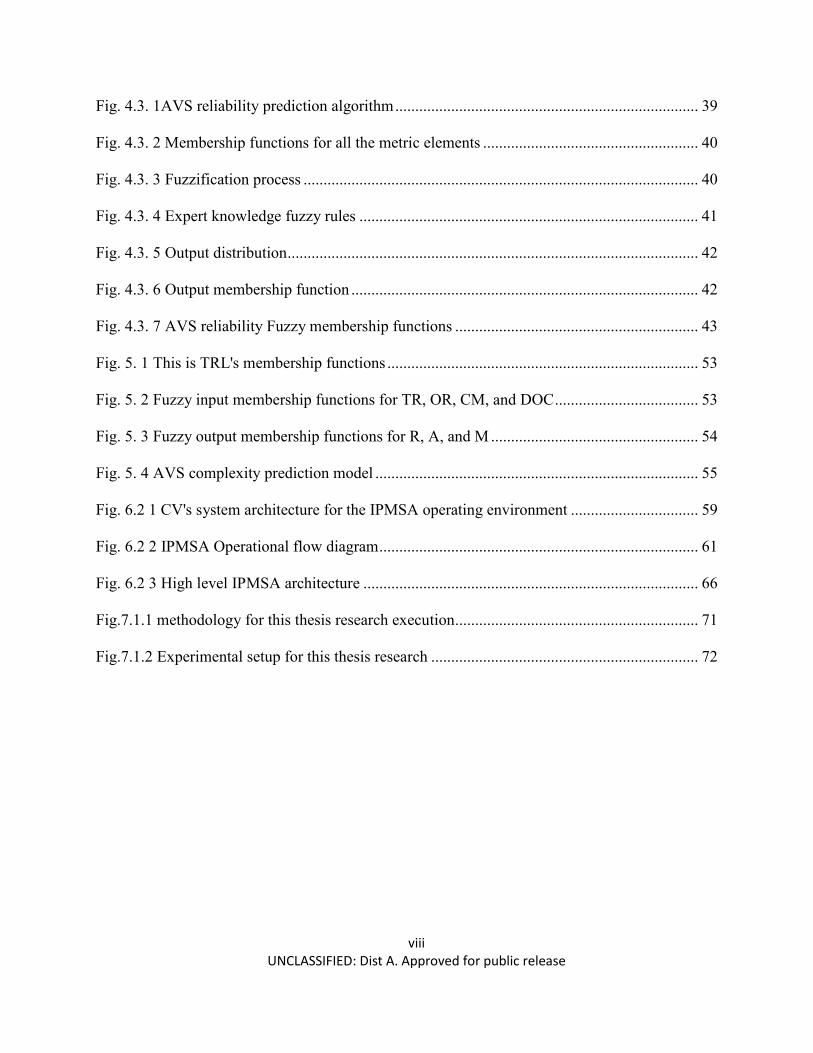
Fig. 4.3. 1AVS reliability prediction algorithm ............................................................................ 39
Fig. 4.3. 2 Membership functions for all the metric elements ...................................................... 40
Fig. 4.3. 3 Fuzzification process ................................................................................................... 40
Fig. 4.3. 4 Expert knowledge fuzzy rules ..................................................................................... 41
Fig. 4.3. 5 Output distribution ....................................................................................................... 42
Fig. 4.3. 6 Output membership function ....................................................................................... 42
Fig. 4.3. 7 AVS reliability Fuzzy membership functions ............................................................. 43
Fig. 5. 1 This is TRL's membership functions .............................................................................. 53
Fig. 5. 2 Fuzzy input membership functions for TR, OR, CM, and DOC .................................... 53
Fig. 5. 3 Fuzzy output membership functions for R, A, and M .................................................... 54
Fig. 5. 4 AVS complexity prediction model ................................................................................. 55
Fig. 6.2 1 CV's system architecture for the IPMSA operating environment ................................ 59
Fig. 6.2 2 IPMSA Operational flow diagram ................................................................................ 61
Fig. 6.2 3 High level IPMSA architecture .................................................................................... 66
Fig.7.1.1 methodology for this thesis research execution ............................................................. 71
Fig.7.1.2 Experimental setup for this thesis research ................................................................... 72

1
UNCLASSIFIED: Dist A. Approved for public release
CHAPTER 1 – INTRODUCTION Our modern world is very different from few decades due to tremendous technological
advancements. The world has state of the art technology solutions in electronics, software, and computer networks that have many practical user applications. Our daily activities are dependent on many technologies such as automotive, computers, cell phones, emails, television, video games, movies, and satellites. Multiple aspects of human life in the areas of transportation, medicine, education, manufacturing, entertainment, security, and communication are improving. One technology innovation leads to multiple spinouts and this phenomenon is trending upwards.
Advancements in the field of semiconductor materials enabled the development of a wide variety of large-scale electronic systems and devices such as satellites, smart phones, computers, video game consoles, video and audio devices such as DVD players, IPods, and radios. Electronic devices perform both simple and complex operations. Each device has multiple components to perform its functions. A function has data inputs, outputs, and both of them needs processing. Software enables data processing through a collection of instructions, algorithms, and processes. The improved electronics necessitated the advancement in software technology in the areas of application software, middleware, firmware, and device drivers. Software provides streamlined instructions to allow an electronic device to perform its functions and enables data processing and distribution. The software and state of the art electronics influenced the creation of complex systems to address various aspects of the transportation, communication, military, banking, and manufacturing areas.
The complex solutions created a data dependency between multiple standalone software and electronic systems. A system can be a single device (e.g., computer) or a software module (diagnostic software), or a group of devices (e.g., suite of sensors). The concept of Local Area Network (LAN) enabled new uses for standalone systems and components to work together in a collaborative environment by sharing common resources and data. Networking enabled distributed data processing. The invention of the Internet enabled information or data flow and its processing across multiple networks spanning the greater part of the globe. It connected the entire world together and caused a 360-degree spin of the technology advancement for software, electronics, and network. Currently billions of users depend on the internet to conduct their daily activities. The Internet enhanced the fields of telecommunication, military, and navigation areas in managing their globalized complex operations. A LAN can have wired and wireless connections. Wireless networks are becoming very popular nowadays due to the emergence of economical products and reduced logistics and cabling burdens. Wireless sensor networking is one of the most widely used LAN topologies for collaborative monitoring applications such as predicting natural calamities including rain, snow, tornadoes, and earthquakes.
In the modern world, a combination of software, electronics, and networking has become a default solution to address any problems that surface. We can cite examples such as, a network of sensors and its software to predict earthquakes, a network of telecommunication devices, its software, and satellites engaged in communication and weather predictions, and a network of computers and its software to enable collaborative satellite launches. As a problem gets more complicated, the solution resolving it becomes more complex as well. Any inefficiency in
2
UNCLASSIFIED: Dist A. Approved for public release
solving a problem by integrating multiple software modules and electronic devices may yield incorrect complex solutions.
As the software, electronics, and network technology advance, they introduce many challenges in the areas of interoperability, reliability, complexity, electric power consumption, performance, security, quality of service, and safety. Each electronic device requires electric power to operate, software to perform functions, and a network to share and collaborate with other devices.
To address and resolve the multitude of challenges and concerns in integrating several electronic devices and software modules in a networked environment, the concept of ―network architecture‖ is used. The network architecture interfaces with many elements of a solution and resolves several hindrances to implementing an efficient solution for a problem.
The network architecture consists of the following: 1. A set of interoperable, reliable, and less complex software modules 2. A set of interoperable electronic devices, which are built using open standards and
specifications 3. A set of algorithms for minimizing devices‘ power consumption 4. A set of interoperable interface specifications for systems (e.g., software modules and
devices), 5. An interoperable LAN, which uses open architecture, standards, and specifications 6. A set of rules and configurations governing the network architecture
The network architecture is very important because it facilitates collaborative data and resource handling between multiple software and electronic systems or devices. It also addresses the following important aspects of a solution:
1. Interoperable data communication between the devices 2. Software reliability and complexity 3. Device‘s electrical power consumption
In critical applications such as military, weather predictions, and satellite launches, the interoperability between the devices, software reliability and complexity, and power consumption are very crucial concerns. A network is interoperable when it facilitates secure and accurate data exchanges between the devices or software modules within the predefined data access restrictions and operating environments. A network that fails to account for interoperability can abruptly end the communication between the devices and can cause failed operations. This directly affects mission success. For example, during a satellite-launching mission, multiple devices such as communication systems and sensors collaborate and complete their tasks. Any failed operation results in mission failure and causes numerous problems in terms of safety, cost, time, and wasted effort.
The network architecture addresses a device‘s software. During use, devices perform complex operations. Each device has its own software to perform its tasks. The software performs its intended functions when needed and is critical to a successful mission. Therefore, software reliability is a key factor. As the functionalities of software get complex, the software gets complex too.

3
UNCLASSIFIED: Dist A. Approved for public release
The network architecture directly influences the devices‘ power consumption, because when it proposes some devices, they must operate efficiently, else it draws unnecessary power. The devices demand an uninterrupted electric power supply to perform their operations. Due to the energy crisis in the world and the state of the power availability, providing an uninterrupted power supply to devices is difficult. The devices have to work under power constraints all the time.
The network architecture is a very important area to address before implementing any solutions to any data handling problem domain. It addresses software reliability, software complexity, network of devices, and power consumption of devices. The network architecture improvements to solve practical problems are a necessity to have successful and economical solutions for a problem domain.
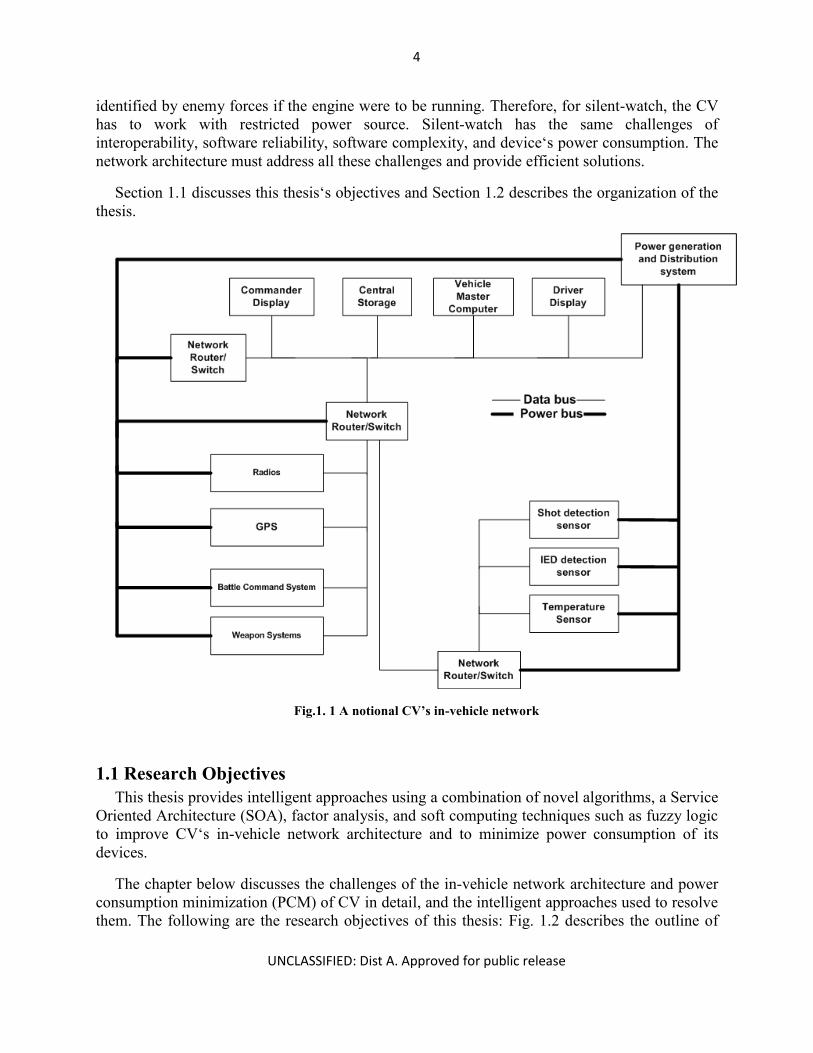
Current state of the art technologies can even threaten national security challenging nations to protect themselves by investing effort and money in a secure technology integration and usage. The military is responsible for protecting its national resources and people from both natural disasters and harmful enemy invasions. The Army, a department of the military protects the nation‘s ground surfaces using combat vehicles of several variants such as fighting, medical, and reconnaissance. A diagram in Fig.1.1 represents a notional combat vehicle‘s (CV) in-vehicle network, in which, a power bus supplies electric power to devices and a data bus facilitates communications between the devices. A CV‘s network allows soldiers to perform collaborative functions. The soldiers inside a CV conduct mission operations predominantly using the in-vehicle technologies consisting of network, software, and electronic devices. The network architecture is also responsible for protecting the resources and the soldiers inside a CV. Therefore, the Army needs efficient network architectures to conduct successful missions and protect the nation‘s resources and people.
In Chapter 2, the author discusses the literature review of several standard approaches used in developing certain aspects of current in-vehicle network architectures and techniques for minimizing power consumption in electronic devices. The standard approaches in the current literature have certain drawbacks and present challenges to improving many aspects of the in-vehicle network architecture of CVs. The challenges include the frequent changes of ground missions requiring the Army to add additional capabilities ad hoc to the CVs. The ad hoc device integration challenges the interoperability of the network, software reliability and complexity, and devices‘ power consumption. The devices are vendor specific and they have unique software interfaces and power consumption requirements. The CV‘s have challenging environment for the network due to size, weight, and power constraints. To handle all the challenges and perform successful missions, the network architecture of a CV must incorporate intelligent approaches and techniques to build an interoperable LAN, and reliable and less complex systems (e.g., software and devices). The intelligent approaches must minimize the CV devices‘ power consumption also. These are very challenging aspects of a CV‘s in-vehicle network architecture development. Therefore, intelligent approaches and techniques are required to handle them.
This thesis focuses on providing intelligent approaches and techniques in improving in-vehicle network architectures and minimizing electric power consumption of a CV‘s devices, especially for conducting silent-watch surveillance missions. During a silent-watch, all devices run on battery power. Soldiers cannot recharge the batteries at will due to the risk of being
4
UNCLASSIFIED: Dist A. Approved for public release
identified by enemy forces if the engine were to be running. Therefore, for silent-watch, the CV has to work with restricted power source. Silent-watch has the same challenges of interoperability, software reliability, software complexity, and device‘s power consumption. The network architecture must address all these challenges and provide efficient solutions.
Section 1.1 discusses this thesis‘s objectives and Section 1.2 describes the organization of the thesis.
Fig.1. 1 A notional CV’s in-vehicle network
1.1 Research Objectives This thesis provides intelligent approaches using a combination of novel algorithms, a Service
Oriented Architecture (SOA), factor analysis, and soft computing techniques such as fuzzy logic to improve CV‘s in-vehicle network architecture and to minimize power consumption of its devices.
The chapter below discusses the challenges of the in-vehicle network architecture and power consumption minimization (PCM) of CV in detail, and the intelligent approaches used to resolve them. The following are the research objectives of this thesis: Fig. 1.2 describes the outline of

5
UNCLASSIFIED: Dist A. Approved for public release
this thesis research and shows the current work and the proposed future work. Chapter 2 discusses the literature review to identify shortcomings in the current technology or research.
An intelligent SOA based approach and network design techniques to develop an open architecture based CV LAN with nonproprietary solutions to enable interoperability, security, scalability, and performance benefits.
An intelligent fuzzy logic based approach for investigating IT architecture documents to formulate software reliability metrics and develop reliability prediction algorithms. Software reliability prediction is important before developing any software.
An intelligent fuzzy logic and factor analysis based approach for investigating project management documents for software development to formulate software complexity metrics and then develop complexity prediction algorithms. Software complexity prediction is important before developing any software.
An intelligent SOA based approach for investigating and developing an Intelligent Power Management Software Architecture (IPMSA) to reduce a device‘s power consumption. This lowers implementation cost, overhead, and complexity.
An intelligent approach and algorithms based on a combination of fuzzy logic and other novel methods for investigating silent-watch operations and developing algorithms to minimize electric power consumption of the CV‘s devices.

6
UNCLASSIFIED: Dist A. Approved for public release
Fig.1. 2 Thesis outline
I . Ne!Work 2 Eleeiroffof;s a sottwar<>
•l'lleltlgent powe< nJII(•inljJ!itiUt:lf\ ~1gboll~ for
av·. d""""""'"' ltl->~lclo; , .. ~
lcenlliy Rese-a~t:t> scopeKl
Nelworl< 'ln:hlleclure
p~ CUttSUtllptlon m1nimaation
1 l'felw<l<k 2.. Sonware rel~at.tl!y
> --41:3 Softwam CC!11!>1&Xi1Y 4-. BecttOfUC ~evices
Yes
Proposed Soluoon (C<lapter 3)

7
UNCLASSIFIED: Dist A. Approved for public release
1.3 Organization Chapter 2 describes the literature review of in-vehicle networking, fuzzy logic, software
reliability and complexity, minimizing power consumption, and power management architectures.
Chapter 3 describes the author‘s current work on an intelligent approach to developing open architecture based CV LAN with nonproprietary solutions.
Chapter 4 describes the author‘s current work on an intelligent fuzzy logic based approach for software reliability metrics and development of reliability prediction algorithms.
Chapter 5 describes the author‘s current work on an intelligent fuzzy logic and factor analysis based approach for software complexity metrics and development of complexity prediction algorithms.
Chapter 6 describes the author‘s current work on an intelligent SOA based approach for investigating and developing IPMSA to reduce a device‘s power consumption. This chapter also discusses the author‘s proposal for future contributions for this thesis.
Chapter 7 describes the materials, methods, and the experimental setup used for conducting, validating, and verifying the results of this thesis‘s proposal.
Chapter 8 summarizes this thesis proposal and highlights the future contributions of this thesis.

8
UNCLASSIFIED: Dist A. Approved for public release
CHAPTER 2 – LITERATURE REVIEW
2.1 Software Reliability Predictions Most of the architecture related software reliability predictions surveyed in [4] are dependent
on the software structure or the type of modeling languages used.
Mohanta et al. provide an approach in [5] to derive design metrics and use them in a Bayesian Belief Network to predict software reliability. In this approach, the prediction accuracy depends on the derived design metrics accuracy. In many cases, it is overkill and restrictive.
Wang et al. recommend a state model framework in [6] using software architecture as a basis for reliability prediction. In this approach, designers create a Unified Modeling Language (UML) state model for individual components of a software program and then solve a Markov Chain process problem to predict reliability. Although this is a good approach, dissecting the UML architecture to identify its structure to evaluate future problems is cumbersome and error prone. It also has a dependency on the type of architecture style used to document software architecture.
Goseva-Popstojanova et al. propose a prediction method [7] using component interaction within software architectures. This methods basis is on analytical approaches using control graphs. Possible execution paths within software programs predict reliability. Identifying and analyzing the architecture construct is time consuming and complex. It also depends on the style used to develop software architectures.
Gokhale et al. provide a framework for predicting software reliability [8] using composite models built from individual architecture components and their failure behavior. A prediction using this method is accurate only when one understands all the component interfaces and their failure behaviors. The model used in this approach is too analytical and it is very hard to collect data and process it to predict reliability.
Nagappan et al. provide a list of metrics [9] for early software tests and reliability early warning. However, this method derives most of the metrics after writing the software and its test cases. Therefore, the early prediction here only serves to predict reliability before fielding or using the software.
Smidts et al. recommend a fault tree based Bayesian quantification framework [10] to evaluate software reliability using software functional architectures, which represent both functional and non-functional requirements. This framework concentrates on studying or experimenting with software, which is already developed. One cannot predict software reliability early using this method.
Kong et al. provide a cause and effect Graphing Analysis [11] approach for early software reliability prediction by identifying errors in the software requirements specification (SRS) document. Every SRS documents differently, and this method does not provide any techniques to identify defects in terms of incompleteness, inconsistencies, ambiguities, and redundancies in each software requirement.

9
UNCLASSIFIED: Dist A. Approved for public release
Yacoub et al. propose a scenario based reliability analysis [12] technique for component-based software using the path-based approach introduced in [7]. This approach models component interactions using a component-dependency graph. This technique is too analytical and the complexity grows as the number of components within the software increases. Furthermore, the data collection process is cumbersome.
2.3 Software Complexity Honglei et al [13] summarizes the software complexity definition as difficulty of
understanding the program, difficulty of correcting the defects and maintaining the software, difficulty of explaining the software to other people, difficulty of updating the program according to some assigned rules, work load of writing programs ac-cording to the design, and availability of necessary re-sources when programs are executing. Kearney et al [14] defines software complexity as applying to the interaction between a program and a programmer working on some programming task.
McCabe [16] bases software complexity metrics on a software program‘s control flow. It introduces the concept of Cyclomatic Complexity by combining number of flow graph edges, nodes, and predicate nodes. The Cyclomatic Complexity of a source code is the linearly independent paths count through the source code. It is mathematically de-fined as C = E - N +2P, where E = number of edges of the graph, N = number of nodes in the graph, and P = number of predicate nodes.
Halstead [17] software complexity metric provides the measure of software algorithm complexity. It measures the complexity by counting number of operators and operands in software. It measures the software's ability to understand and estimates the effort required to develop a software algorithm. It also indicates the amount of time to implement an algorithm. Halstead metrics are difficult to calculate and it is very hard to count the distinct and total operators and operands in a software program.
Software complexity metric from Henry et.al [18] provides the measure of couplings between modules in terms of number of parameters, global variables, and function calls. It measures given software‘s procedure, module, and interfaces. Henry et al. believe that measurement of software quality for large-scale systems using information flow to represent the system interconnectivity is an important visible technique.
The Entropy based software complexity measure [19] bases the average information content of each operator in a software program's source code.
The Cognitive weights software complexity metrics [20] from J. Shao et al. models the software complexity based on the cognitive functional size of the software. The cognitive functionalize provides a foundation for cross-platform analysis of complexities, sizes and comprehension effort of software specifications in various design phases.
The Relative complexity metrics [21] represents a single, unified measure on the structure of a software program. It serves to classify a set of software programs in order of their increasing complexity in relation to each other.

10
UNCLASSIFIED: Dist A. Approved for public release
The [16], [17], [18], [19], [20], and [21] metrics discussed earlier are too technical and focus only on technical structure of a software program. These data are hard to compute and requires many skilled resources to understand and implement solutions.
2.4 Power Management/Power Consumption Minimization In general, researchers have developed static and dynamic power consumption minimization
(PCM) techniques. The static methods normally define several low power-consuming states for a system and provide software functions to control it [22]. The dynamic methods follow runtime collection and analysis of historical or current idle periods to determine the appropriate low power state for a system e.g., [22], [24], and [25].
Currently, researchers have proposed timeout as one of the approaches to minimize a system‘s power consumption. A timeout policy has a general limitation of mandated idle time until the timeout triggers. This mandated time consumes power. Greenawalt [23] proposes a static PCM timeout policy using a system‘s historical request arrival distribution. For example, shutdown a hard drives when it is idle for 30 minutes. However, finding the optimal ‗timeout‘ is always seems to be a challenge for the system designers. Y.-H. Lu et al. proposes [24] another timeout approach. Both the techniques [23], [24] seem to be lacking mechanisms to transition the whole system‘s power state. For silent-watch with varying workloads, setting a static timeout value is not optimal.
Some researchers have proposed predictive techniques. The prediction helps to remove the mandatory idle time. Srivastava et al. [25] propose a predictive technique to shutdown systems based on their idle periods. In [25], the technique creates a regression model of the historical idle periods to determine future idle periods. The system response time is the trading parameter to justify a system‘s shutdown. This technique depends on historical data. Hwang et al. [26] propose another adaptive technique for a system to analyze its previous idle periods and determine its future idle period. Hwang et al. suggests taking the average of the historical weighted idle periods using exponential average approach. In [26], the solution suggests a pre-wakeup time to minimize the miss prediction impacts. Both [24] and [26] considers a single system‘s idle periods. It does not include system idleness contributing factors.
Simunic et al. [27] propose a renewal theory based power management model. In the model, they consider that the optimal PCM policy can be controlled using a stochastic process. Simunic et al. consider that the first work request follows Pareto and later on, it follows exponential distribution. The model lets the system to transition to low power state when it is idle until it receives its next work request. In [27], the only lower power state used is sleeping. The sleep state has its power consumption also; it would be beneficial if a system could shut down and wakeup when new work arrives.
Chung et al. [28] propose a static adaptive learning tree technique that decides a low power state for a sys-tem (with multiple sleep states) when it enters an idle state. The previous idle periods and the state transitioning power consumption parameters determine the appropriate low power state for a system, which experiences an idle state. The technique creates a data tree to map idle period sequences to tree nodes. When a system enters an idle state, the technique predicts the current idle time based on the tree. This solution has low fidelity predictions and it may not be optimal. In [29], Chung et al. proposes a sliding window and an interpolation

11
UNCLASSIFIED: Dist A. Approved for public release
technique to determine the best power minimization policy for a system, which experiences non-stationary work requests.
Poll et al. [30] propose to use energy events based configurable power policies to reduce energy waste. In this solution, policies are rigid and a central process determines when to exercise this on networked systems. Configuring individual system‘s policy is a maintenance nightmare and may disrupt the overall operations of a given system. There is no flexibility in this solution to handle unidentified events e.g., a network request for the system came in when the policy has switched of a system‗s power supply.
Enokido et al. [31] propose a technique to select a minimum power-consuming server from a group of servers for executing a given process. Although the algorithms proposed by Enokdo et al. provide the total execution time and the power consumption rate of a given process or a server, determining it for every process is challenging and time consuming. In silent-watch, if video processing time is long and undefined, this technique cannot determine a best sever to process it. The additional limitation is that the algorithm tends to allocate processes to the minimum power-consuming server until it is overloaded and then it allocates to the next minimum power-consuming server. If most of the processes have same computation and power consumption laxity, then the cumulative power reduction may not be substantial. In this algorithm, there might be a situation where a single server executes all the processes other severs are idle and consuming power. If one server tends to process more tasks then the latency will be higher. Although not all systems may be executing any processes but they are still powered on, idle, and consuming power.
Zhu et al. [32] propose a doze-timer to minimize wireless LAN‘s power consumption. Doze-timer allows stations to sleep until the timer elapses. This has a mandatory idle timer, if this timer is too long then more frames might transmit and the system may not have the opportunity to initiate the doze-timer. Deriving optimal doze timer is a big challenge for the vendors.
Lue et al. [33] propose a network traffic based low-power technique. In this solution, a module monitors the network data flow and identify minimum processing tasks to handle a given task. Since minimum processing elements are used, processor can consume minimum power. Although this techniques implies that it has less impact on data loss or throughput, but the literature has less results details to prove the data packet loss and the throughput impacts are minimum. This solution lacks quantitative information to determine the number of processing elements required to handle a given data traffic load.
Lee et al. [34] propose to transition systems to a lower power states based on the user movements. Although this is very interesting concept for home networks, it has many complications to use within a CV, because the space is very restrictive and the occupants may not leave their position for a long time. In this situation, there is no chance to minimize power consumption within the vehicle. This proposal lacks flexibility in adjusting the management strategy to utilize additional parameters to control the power usage.
In a CV, one can apply the PCM techniques in the following order:
1. Elements e.g. logic gates and transistors 2. Components e.g. processor, memory, microchips, and hard drives
12
UNCLASSIFIED: Dist A. Approved for public release
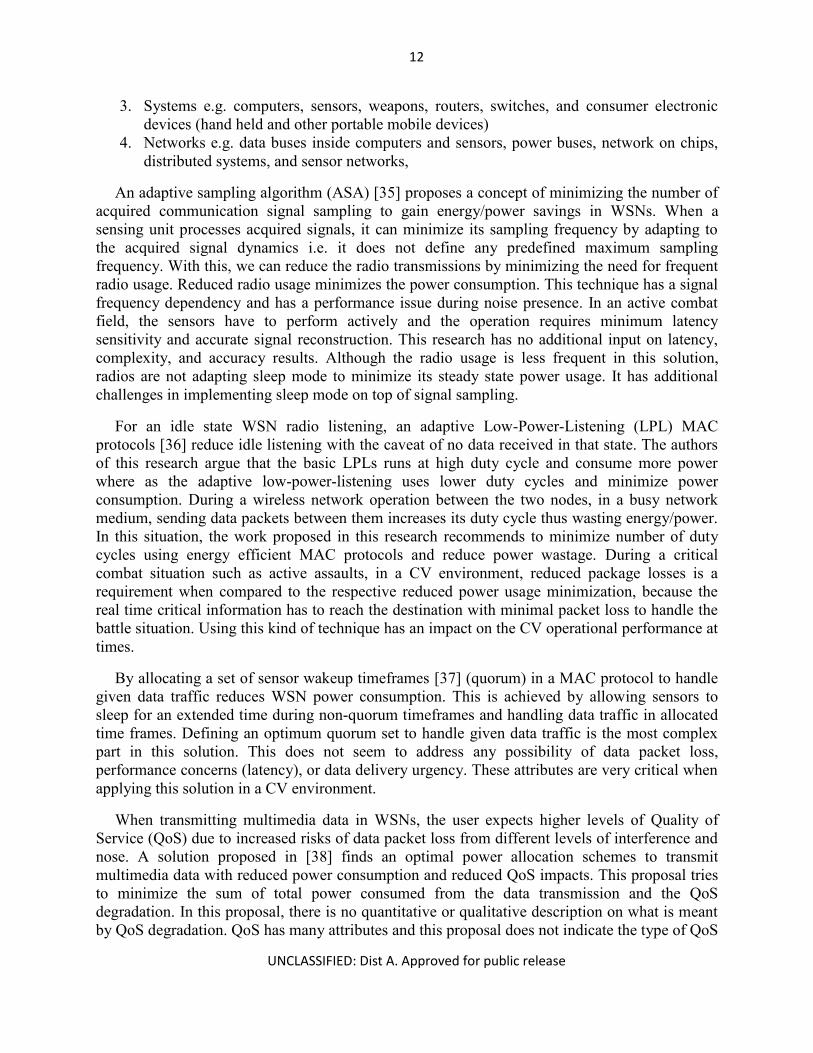
3. Systems e.g. computers, sensors, weapons, routers, switches, and consumer electronic devices (hand held and other portable mobile devices)
4. Networks e.g. data buses inside computers and sensors, power buses, network on chips, distributed systems, and sensor networks,
An adaptive sampling algorithm (ASA) [35] proposes a concept of minimizing the number of acquired communication signal sampling to gain energy/power savings in WSNs. When a sensing unit processes acquired signals, it can minimize its sampling frequency by adapting to the acquired signal dynamics i.e. it does not define any predefined maximum sampling frequency. With this, we can reduce the radio transmissions by minimizing the need for frequent radio usage. Reduced radio usage minimizes the power consumption. This technique has a signal frequency dependency and has a performance issue during noise presence. In an active combat field, the sensors have to perform actively and the operation requires minimum latency sensitivity and accurate signal reconstruction. This research has no additional input on latency, complexity, and accuracy results. Although the radio usage is less frequent in this solution, radios are not adapting sleep mode to minimize its steady state power usage. It has additional challenges in implementing sleep mode on top of signal sampling.
For an idle state WSN radio listening, an adaptive Low-Power-Listening (LPL) MAC protocols [36] reduce idle listening with the caveat of no data received in that state. The authors of this research argue that the basic LPLs runs at high duty cycle and consume more power where as the adaptive low-power-listening uses lower duty cycles and minimize power consumption. During a wireless network operation between the two nodes, in a busy network medium, sending data packets between them increases its duty cycle thus wasting energy/power. In this situation, the work proposed in this research recommends to minimize number of duty cycles using energy efficient MAC protocols and reduce power wastage. During a critical combat situation such as active assaults, in a CV environment, reduced package losses is a requirement when compared to the respective reduced power usage minimization, because the real time critical information has to reach the destination with minimal packet loss to handle the battle situation. Using this kind of technique has an impact on the CV operational performance at times.
By allocating a set of sensor wakeup timeframes [37] (quorum) in a MAC protocol to handle given data traffic reduces WSN power consumption. This is achieved by allowing sensors to sleep for an extended time during non-quorum timeframes and handling data traffic in allocated time frames. Defining an optimum quorum set to handle given data traffic is the most complex part in this solution. This does not seem to address any possibility of data packet loss, performance concerns (latency), or data delivery urgency. These attributes are very critical when applying this solution in a CV environment.
When transmitting multimedia data in WSNs, the user expects higher levels of Quality of Service (QoS) due to increased risks of data packet loss from different levels of interference and nose. A solution proposed in [38] finds an optimal power allocation schemes to transmit multimedia data with reduced power consumption and reduced QoS impacts. This proposal tries to minimize the sum of total power consumed from the data transmission and the QoS degradation. In this proposal, there is no quantitative or qualitative description on what is meant by QoS degradation. QoS has many attributes and this proposal does not indicate the type of QoS

13
UNCLASSIFIED: Dist A. Approved for public release
it is trying to reduce. Without that information and the complexity involved in formalizing it makes it hard to use it for any CV implementations.
Many wireless mobile stations are battery operated and some of them implement power saving mechanisms i.e. Power Saving Class (PSC) I defined in IEEE 802.16e and 802.16m standards. In this standard, the stations save power by transitioning to sleep mode based on predefined time frame. Sleep transitions has to process sleep request and sleep response messages for both transmit and decode functions. This activity consumes power. A broadband wireless access power saving mechanism [39] recommends a solution to improve PSC I power saving mechanism. In this a base station sends periodic positive or negative TRF –IND (traffic) condition messages to the mobile stations. When the mobile stations are awake or became awake, the negative TRF-IND message allows them to go back to sleep immediately. The positive TRF-IND message makes them to work. This minimizes power consumption in wireless mobile stations depending on traffic conditions. Although this sounds good, but, in a CV sometimes the traffic is too heavy and base stations has to frequently send TRF-IND messages. When the traffic is too heavy there is a possibility that too many TRF-IND messages be sent. This solution is purely based on analytical and simulation results. This proposal has complexity in aligning mobile station‘s listening interval and TRF-IND message transfer interval. If they are not optimized, there will be an impact on quality of service (QoS) and there may not be any power improvement over PSC type I scheme. This proposal saves power in mobile stations only but the base station and other connected systems may be awake and consuming power.
When IEEE 802.11 Wireless LAN (WLAN) is not actively communicating, the wireless stations usually doze/sleep to minimize power consumption. But, they lack optimized time durations for both sleep time and wakeup times. A doze timer based solution proposed in [40] minimizes wakeup time and maximizes sleep time to reduce WLAN power consumption. Doze timer allows stations to sleep until the timer elapses. To effectively implement this, a mandatory idle timer has to elapse before the doze timer can be started. If the idle timer is too long, there is a possibility that more frames might transmit and the doze timer never gets initiated. There is no discussion available in this research about how to arrive at optimal doze timer duration.
An optimal power control policy [41] in wireless relay network minimizes power consumption in all relays of a given wireless network and realizes its energy efficiency. Stochastic optimization method are used to understand relay's fading channels dynamically and derive optimal power control schemes and reduce power consumption in relays. Most of the analysis and optimization policy in this proposal assumes that each source node transmits fixed power and each relay nodes in the network knows its local CSI information. In a wireless network, the transmitters and the receivers can have different current channel state information (CSI) i.e. the signal propagation details between the transmitter and the receiver. They are represented as CSIT and CSIR. CSIs are short term /instantaneous CSI i.e. current channel conditions are known, or long term /statistical CSI i.e. statistical characterization of the channel conditions are known. In this research, there is no discussion on the type of CSI information will be known and how it is used. The CSI gathering has a big dependency on the speed or the frequency of channel condition changes over time. Although this research assumes time-varying fading channels but none of the analysis seems to use time dependency parameters or maybe The author were not able to infer any discussions on the channel condition changes impacts over time. Most of the power savings were at the relay part of the network.

14
UNCLASSIFIED: Dist A. Approved for public release
A technique using user living patterns such as user location and user movements [42] proposes a way of power consumption minimization in networked systems. Based on the pattern that user exhibits, the certain systems will be powered off or moved to a lower power states. Although this is very interesting concept for home networks, it has a lot of complications to use within CVs, because the space within a CV is restricted and the occupants may not leave their position for a long time. In this situation, there is no chance to minimize power consumption within the vehicle. This proposal lacks flexibility in adjusting the management strategy to utilize additional parameters to control the power usage.
Many network processors are used in CV networks and they have a lot of processing elements. A network traffic based low-power technique [43] can reduce network processor‘s processing element's power consumption. A module monitors the network data flow and identify minimum processing tasks to handle a given task. Since minimum processing elements are used, processor can consume minimum power. Although this techniques implies that it has less impact on data loss or throughput, but the literature has less results details to prove the data packet loss and the throughput impacts are minimum. In a CV, the network traffic is random and no substantial power savings is gained if the traffic is too much for too long. Also there is no discussion available in this research to determine the complexity impacts of using less processing elements to perform a given job. No quantitative information is provided to determine the number of processing elements to handle a given data traffic load.
The DPM for WSN [44] focuses on switching sensor nodes to a sleeping state solely based on the work load predictions. This technique has no capability to influence sleep mode transition other than work load predictions. In this solution the sleep state time is static and it is node specific. Its value cannot be altered dynamically in response to various other external conditions. Static solutions may not gain power consumption savings in a CV environment.
Power management architecture for sensor nodes [5] uses a concept of dispatching, delaying or discarding energy consuming tasks if the power supply unit determines that the system is running on the battery and waiting for renewable energy. This solution does not take any actions while the renewable energy is being lost, and has no preemptive PM policy. Dispatching tasks completely depend on the power state manager which has no knowledge of anything else other than the available renewable energy.
In a service specific power management solution [46] for networks, systems are assigned to a specific service. When a given service is accessed, the power is supplied to its associated systems. This solution has a problem in a CV case. Assume a given system‘s power was turned off manually. If a service associated with this system is invoked, the policy applied for this service automatically powers on all its associated systems including the manually powered off device. This solution has no awareness of the manually powered off systems.
Network based power management (PM) architecture [47] proposes to use energy events based configurable power policies to reduce energy waste. In this solution, policies are rigid and a central process determines when to exercise PM on networked systems. Configuring individual system‘s PM policy is a maintenance nightmare and may disrupt the overall operations of a given system. There is no flexibility in this solution to handle unidentified events e.g. a network request for the system came in but the system was switched off per a configured PM policy. An

15
UNCLASSIFIED: Dist A. Approved for public release
ideal condition to handle this situation would be to provide a solution to power on systems automatically when a given system is needed for a given function.
In an Internet Protocol (IP) based packet wired networks, node level network data traffic consumes a lot of power and energy. A research in this area [48] proposes a network power consumption reduction based on a given network‘s data traffic, data flow channels between paths and nodes, and network QoS requirements. This solution is purely network load based; a network switch or a router is powered off when there is a low network load is detected. The main power savings comes from dynamically selecting the network configuration which meets QoS requirement and uses minimum power. But, this is always a challenging task and it requires prior knowledge of all systems in the network. In a CV environment, systems are added ad-hoc and keeping up with power aware network configuration is challenging.
CVs can have many peer to peer distributed systems to achieve several combat mission processing tasks. A peer-to-peer (P2P) system‘s Power Consumption Laxity Based (PCLB) algorithm [49] reduces power consumption in synchronous overlay network of scalable heterogeneous (servers). Authors in this work describe power saving method for servicing web requests. In a P2P network, a given system can act as a server or client depending on what process needs to be completed. Client systems request and server systems complete the request for a given process. The PCLB algorithm minimizes total power consumption of a P2P system for a given process by using a minimum power-consuming server from a group of servers for executing a given process. PCLB depends on determining a computation and power consumption laxity for each of the P2P system executable processes. Although they provide the total execution time and the power consumption rate of a given process or a server, determining it for every process is challenging and time consuming. In a CV, if video processing time is long and undefined, the PCLB cannot determine a best sever to process it. The additional limitation is that the algorithm tends to allocate processes to the minimum power-consuming server until it is overloaded and then it allocates to the next minimum power consuming server. If most of the processes have same computation and power consumption laxity, then the cumulative power reduction may not be substantial. In this algorithm, there might be a situation where a single server executes all the processes other severs are idle and consuming power. A real time with minimal latency is a must requirement for a CV. If one server tends to process more tasks then the latency will be higher. Although not all P2P systems may be executing any processes but they are still powered on, idle and consuming power.
Many server systems workload based power/energy consumption minimization techniques are discussed in [50]. PCLB algorithm in [49] keeps all servers powered on and utilizes minimum power consuming servers, but there is a related work in [50], where authors propose to power down servers if they are not being used to fulfill a given process. A configuration based design [51] is proposed for heterogeneous server cluster, where servers can balance its request messages based on a preset configuration and save the consumed power from them. An optimization technique [52] proposes to reduce power consumption in large and complex information technology (IT) systems such as data centers. This technique uses historical IT systems CPU and disk resource usage data and predicts future demands from them. The power consumption is reduced by revising or optimizing power usage policies based on the predicted resource usages. In static IT infrastructures such as data centers, many times similar workloads are expected and this enables for relatively easy resource usage data collection. Due to combat situation dependent

16
UNCLASSIFIED: Dist A. Approved for public release
random workloads and constantly varying duty cycles, collection of resource usage data from CVs are very hard and sometimes not practical. In CVs, many times duty cycles and resource estimations are done purely based on simulations and analytical evaluations only. CV‘s IT infrastructure may change depending on the type of mission and using historical data to predict future demands by them may be inaccurate and may not realize any estimated power savings from it.
The Fuel Efficient Ground Vehicle Demonstrator program [53] for U.S. Department of Defense recommends using a hybrid technology to meet the high in-vehicle power demands and the increased requirements to stay operational during silent watch operations (running completely from the battery with engine turned off). This program articulates the benefits of using systems engineering approach to obtain fuel efficiency and better understanding of the in-vehicle energy/power consumption needs. This program defines systems engineering values to each of the development phases and recommends appropriate trade spaces to get a good fuel efficient product. Although this meets the need for higher power generation with reduced impact on operational performance, it seems to neglect the fact that the methods could be applied to minimize in-vehicle power consumption to gain fuel efficiency and other heat related concerns than thriving for more power generation.
An intelligent online neural network power control [54] is proposed for vehicle power management using road type and traffic conditions. This research‘s results are evaluated using PSAT software and the drive cycles defined in them. In this proposal, vehicle's speed, power demands, electrical load, and the battery's charge state are acquired online and feed into neural network. The neural network then interacts with the engine controller and determines the required torque to generate the demanding power needs. Again, this power management is focusing on controlling the power generation based on the requirement than optimizing the power consumption from the demanding power consumers. This works on a reactive mode than proactive. In a given combat situation, if a CV is running at lower idle (< 800 RPM), it cannot compensate for any required torque to produce additional power. So this solution is more suitable when the engine is capable of running at required RPM and capable of producing required torque. This realized power control is drive cycle dependent. There is no complexity is discussed for the frequently changing drive cycles in a duration of T hours. The solution assumes constant drive cycle for proposed power control.
A power management strategy for a conventional drive train and manual transmission vehicles is proposed in [55]. In this, the alternator power is controlled to minimize fuel consumption with minimal driving disruption. The overall power/energy and fuel savings from reducing the energy losses during internal combustion engine, alternator, and battery charge operations. Controlling alternator power, fuel economy can be obtained. This proposal also focuses mainly on controlling the power generation and minimizing fuel consumption with no control over the power consuming systems in the vehicle. For CV, the power consumption minimization offers more advantages than maximizing the power generation with less fuel.
Hybrid electric vehicle‘s energy management using 3-D terrain preview [56] proposes to use online terrain information through vehicle navigation technologies (e.g. maps and GPS) and manage battery charge/recharges within the vehicle. In this proposal 2-D terrain slope is predetermined based on the acquired 3-D terrain information. This research‘s proof of concept is

17
UNCLASSIFIED: Dist A. Approved for public release
just to the constant vehicle velocity. Using this solution, the battery charge/discharge tasks can be reduced and thereby the battery life is extended and the fuel is saved from excessive charging tasks. This proposal has certain limitations when implementing it in a CV. In combat fields, the terrain might not change frequently and CV might not gain any fuel savings. Terrain preview alone cannot provide substantial fuel savings while keeping all the systems operational at high performance. This proposal has no alternative strategy to handle if the combat situation changes while the battery is discharged and the engine has to stop to go on silent watch mode for CV. In this situation, the battery is discharged, engine is not running, the systems have no generated/stored power to operate.
For military heavy vehicles, an electric power flow optimization using cognitive knowledge is proposed in [57]. This solution proposes to extract the cognitive information such as operational modes and the load requests from the onboard systems and use it to train the power controller. The power controller then sets the optimum power settings for each of the road types used by the i.e. city, urban, and interstate road (also known as drive cycles). The mission plan is the main input for the optimization. Although this research sounds relevant to CV, its focus is limited to drive train components and does not extend its cognitive information to other in-vehicle network systems.
In [58] a Fuzzy Logic Controller for Hybrid Electric Vehicle is proposed to maximize fuel savings. This proposal discusses the optimal way of managing the required torque to generate required power, but no quantitative information is provided to describe what is meant by ―optimal torque value‖. All the 121 rules in this fuzzy logic controller are static and have no flexibility to manipulate online. There is no capability to adjust the rules based on a given situation. There are different types of CVs available and configuring a vehicle specific controller rules to get vehicle specific optimal torque causes a maintenance concern.
In a software-based vehicle dynamic power management algorithm [59] a master node monitors and controls all other slave nodes power management in all the networks in the vehicle. The algorithm prioritizes the system‘s PM based on the source of the demand and vehicle conditions at the time. Although this solution manages power consumption, it does not offer any solutions or validations to minimize power consumption while keeping the high CV operational performance.
An optimal trip based power management [60] has a strategy to model PM based on the trips a vehicle makes. This kind of solution is suitable for consumer vehicles. In a combat environment, the terrain is unknown, it can be urban or mountainous, and there are no guaranteed local or freeway situations. The trip based PM strategy has no benefits to CVs. Although this try to manage power based on trip, it does not handle the performance requirements from in-vehicle networked systems.
2.5 Fuzzy Logic Overview Fuzzy logic is a soft computing technique that computes with words [61] to solve a vague real
problem. Unlike Boolean logic, fuzzy logic [62] incorporates fuzzy set theory [63] to develop heuristic approximation reasoning to solve vague, non-deterministic problems.

18
UNCLASSIFIED: Dist A. Approved for public release
In a conventional set, an element of the set either belongs to it or does not. In other words, an element has full membership in a set or no membership at all. In a fuzzy set, an element can have a degree of membership (μ). The degree ranges between 0 and 1. For example, an element ―a ―of a fuzzy set can have a μ of 0.8.
Formally, a fuzzy set is an ordered pair of elements with an appropriate membership degree within the range assigned for it. In other words, let ―a‖ be an individual element in a universal set ―S‖, a fuzzy set ―F‖ can be derived from ―S‖ using a set of ordered pairs F = {(a, μF(a)) | a Є S } [63]. A membership function μF(a) describes the numerical membership degree between 0 and 1 for example, 0.1, 0.12, 0.2, and .99.
Fuzzy logic is a cognitive or soft computing decision-making process. Control theory uses fuzzy logic to develop approximation-decision making techniques to control vague or subjective parameters of a system. Instead of analytical models using complex mathematics, fuzzy logic models systems based on expert knowledge of the system. Fuzzy logic describes the expert knowledge of a system, process, or situation using linguistic variables, i.e., words expressed in natural languages, e.g., hot, cold, very narrow, etc. In general, fuzzy logic describes systems or problems using fuzzy sets, a knowledgebase governing the constraints and the expert if-then rules to assess a set of variables of a system.
Many practical applications and systems have used fuzzy logic solutions. Some of the major applications include washing machines, rice cookers, image processing applications, anti-lock brake controls, and steering controls.
In general, fuzzy logic related research or solutions use a fuzzy logic system as a problem domain. Fuzzy logic systems [64] provide solutions using the following steps: fuzzification expert rules application rule- results aggregation defuzzification. Mendel describes the details of fuzzy logic system in [64].
Each fuzzy set represents elements with different degrees of membership. One can determine an element‘s membership characteristics with respect to a fuzzy set using membership function plots that are triangular, trapezoidal, bell-shaped, or Gaussian. A triangular membership function is the simplest of all in terms of computation. Figure 1 represents the triangular membership function plot. In Figure 1,‖s‖ represents the start range and ―e‖ represents the end range of a given fuzzy set. Let μF(a) be the membership grade represented on the y axis and ―a‖ is the element‘s actual values on the x axis. At s and e, the membership grade of an element a is 0. Let c be the center point between s and e where the membership grade of an element a is 1. The values between s and e, represent different grades of membership according to position on the triangular plot. The membership grades of an element using the triangular function plot shown in Figure 1.

19
UNCLASSIFIED: Dist A. Approved for public release
eaif
eacifscas
casifscsa
saif
aF
0
0
)(
Fig. 2. 1 Triangular membership function plot
(2.1)

20
UNCLASSIFIED: Dist A. Approved for public release
CHAPTER 3 – INTEROPERABLE NETWORK FOR COMBAT VEHICLES
3.1 Introduction In Chapter 1, the author discussed that the CV‘s in-vehicle network architecture is very
important, because it has to facilitate collaborated data and resource handling between multiple software and electronic devices. It also mentioned that the network architecture should provide an open architecture based interoperable LAN for data communication between the devices. In this chapter, the author proposes an interoperable network (LAN) for CVs addressing interoperability aspect of network architecture.
A CV has multiple complex in-vehicle networks such as automotive sensors, surveillance sensors, weapon systems, video distribution, and power distribution. Fig 1.1 presents a notional in-vehicle network. Each individual in-vehicle network has multiple vendor specific devices and its unique software interfaces. CV requires all the networks to communicate each other and facilitate a collaborated combat operation. Therefore, CVs require 100% network uptime and security, compliant with multiple military standards, an interoperable environment between multiple networks. The in-vehicle network must also reduce vehicle-clutter and focus on saving Soldiers lives, minimize latency when communicating data between devices across networks, and reduce logistics footprint. Combat requirements change frequently and additional devices are added ad-hoc to the existing networks. In general, proprietary kit/appliqué from various vendors is added ad-hoc to save time and cost. Interoperability, performance, and scalability analysis for this are significantly complicated and costly. For this situation, the author presents an open standard architecture approach, which offers nonproprietary solutions with good interoperability, security, scalability, performance benefits, and cost savings. Open standard architectures are public specifications, not requiring any subscriptions to use it or modify it. This allows anybody to design add on products to mature the technology and ultimately reduce the cost.
In the modern electronic warfare, In a CV, using multiple sensor networks to fight combats is becoming a norm. Networks perform collaborated functions to allow soldiers to perform their combat operations and achieve successful missions. The in-vehicle networks in a CV use Ethernet, USB, and CAN base networks. Many devices on the network such as display systems, weapons, radios, and GPS supports Ethernet, USB, and CAN features. All the vendors are showing significant interest in building systems to support interoperability and security inside a CV's in-vehicle network. Unless there is an efficient interoperable network architecture design to connect all the various networks inside a CV, vendors are unable to develop devices to support it. An in-vehicle interoperable network will allow soldiers to access data from multiple networks inside a CV. For example, from their workstations, soldiers can obtain data from other networks such as the driver's view of the terrain from the automotive network, shot detected location from surveillance sensor network, and enemy locations from other sensors.
An in-vehicle network is interoperable when it facilitates the secure and accurate data exchanges between nodes/devices in an operating environment within predefined data access restrictions. We need to design a CV‘s in-vehicle network properly for interoperability. An in-vehicle network lacking interoperability fails communication between the devices and causes failed combat operations. This directly influences mission success. Therefore, we need an interoperable network to enable successful combat missions for CVs and provide them an

21
UNCLASSIFIED: Dist A. Approved for public release
efficient communication mechanism for better combat operations and vehicle management functions.
A CV‘s network is susceptible to frequent ad-hoc device additions; therefore, the implementation or the design of an interoperable network must focus on scalability and growth challenges. Additionally, the CV is constrained with size, weight, power, and cooling (SWaP-C) requirements. Therefore, future add-ons must focus on minimizing the SWaP-C challenges also.
In this chapter, the author presents interoperable in-vehicle network for CVs. This network uses open standards approach and hence promotes open specifications. Therefore, the military vendors can develop products using open standard specifications. This proposal has both software and hardware combined solutions for interoperability within the network. This network minimizes SWaP-C constraints, promotes easy scalability, and minimizes future integration of ad-hoc devices.
The author proposed network focuses on the following high-level requirements: An in-vehicle network shall:
1. Provide a secure and interoperable data handling. 2. Not fail the entire network when an individual device fails. 3. Provide an economical and simple scalability solution 4. Have a minimum logistics/maintenance footprint. 5. Minimize SWaP-C challenges.
All current commercial network architectures are proprietary and CV is showing considerable interest in utilizing open standards.
3.2 Network Development Process The CV‘s network development process consists of gathering requirements for selecting
appropriate communication protocols, network topology, and bandwidth. This section discusses the evaluation process and selection rationale for each of the elements. For simplicity, the author assumes four sensors, four display devices, and one weapon station for developing a CV‘s in-vehicle network.
3.2.1 Requirements A network development for a CV must start with identifying the requirements. In this thesis
research, the author assumes the following requirements:
1. Provide secure and interoperable data handling. 2. Individual device failures shall not fail the entire network. 3. Provide economic and simple scalability solutions. 4. Allow minimum logistics/maintenance footprint. 5. Reduce size, weight, and power –cooling (SWaP-C) requirements.

22
UNCLASSIFIED: Dist A. Approved for public release
3.2.2 In-Vehicle Network In-vehicle network for CV‘s identifies all the network entities contexts before developing a
network design; Fig 3.2.1 represents an overview of all the CV‘s entities using an architecture overview diagram. Subsequent sections of this chapter provides a brief overview of each entities used in the In-vehicle network.
Fig . 3.2. 1 A notional network overview
3.2.2.1 Users: Typical users of a CV are Soldiers (crew), maintenance personnel, and off vehicle
commanders. Soldiers operate onboard devices during battle missions. Maintenance personnel perform routine maintenance. Off vehicle commanders, communicate with the vehicle crew to carry out battle missions.
3.2.2.2 Software components: The data collectors, data processors, data storage, and data distributors are the high-level
software building blocks for the proposed network. The data collectors receive data from various sensors and other devices. The data processors process the data per request or automatic to meet a specific functionality. The data storages assist in storing the data to a specific location to meet a specific function. The data distributors distribute data to various devices on demand or automatic. All these components are distributed and designed for redundancy to improve availability.

23
UNCLASSIFIED: Dist A. Approved for public release
3.2.2.3 Hardware components: The CVs have multiple hardware components as described in the Figure 3.2.1. The sensors
gather and sense various awareness data and feed to the appropriate devices for data collection and processing. The power distribution equipment supplies power to the various devices. Crew requires display devices to view and analyze battle conditions, and to take actions. The computers process data and distribute it to meet mission needs. The weapons handle hostile mission conditions. The network products allow data configuration, communication, and distribution.
3.2.2.4 Standards: Various military standards are required for a vehicle network. The standards are required to
meet the open standard and architecture requirements for CVs.
3.2.2.5 Requirements: Every network design has to meet certain requirements to fulfill the needs of an army mission.
3.2.2.6 Standards and compliance: The proposed architecture must be compliant with the military standards described below.
The proposed architecture section will evaluate and choose the applicable standards. The TCSEC is a US Department of Defense (DoD) standard for setting requirements to evaluate, classify and select computer systems to process, store and retrieve sensitive or classified data. This standard demands implementation of mandatory or discretionary security policies, user‘s accountability through identification, authentication, and auditing, for providing operational assurance, life cycle assurance and continuous protection assurance.
Multiple Independent Levels of Security (MILS) is a new approach to build secure systems in contrast to the DoD Orange Book. The MILS architecture was to resolve high assurance systems certification difficulty by separating out the security mechanisms and concerns into manageable components. A MILS system isolates processes into partitions. To support these partitions, the MILS architecture is divided into three layers; separation kernel, middleware services and applications. MILS architecture reduces the security functionality into four security policies i.e. information flow, data isolation, periods processing and damage limitation.
Department of defense architecture framework (DODAF) v1.5 provides guidance for architects to begin representing net-centric architectural constructs. Net-centricity is an information superiority-enabled concept of operations that generates increased combat power by networking sensors, decision makers, and shooters to achieve shared awareness, increased speed of command, higher tempo of operations, greater lethality, increased survivability, and a degree of self-synchronization. The following is the guidance list.
1. Populate and utilize the net-centric environment 2. Accommodate the unanticipated user 3. Promote the use of communities of interest and support shared infrastructure
Information assurance Implementation (Document# DOD 8500.2), the DoD Information
Assurance Certification, and Accreditation Process (DIACAP) ensures the risk management
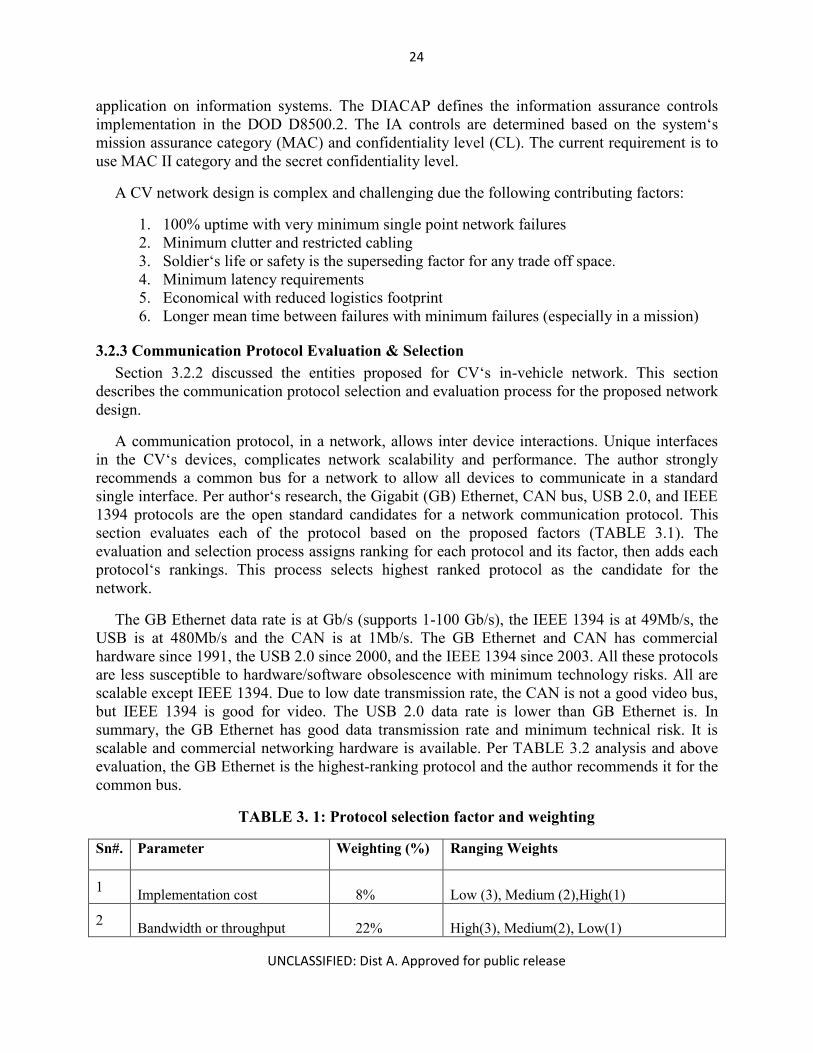
24
UNCLASSIFIED: Dist A. Approved for public release
application on information systems. The DIACAP defines the information assurance controls implementation in the DOD D8500.2. The IA controls are determined based on the system‘s mission assurance category (MAC) and confidentiality level (CL). The current requirement is to use MAC II category and the secret confidentiality level.
A CV network design is complex and challenging due the following contributing factors:
1. 100% uptime with very minimum single point network failures 2. Minimum clutter and restricted cabling 3. Soldier‘s life or safety is the superseding factor for any trade off space. 4. Minimum latency requirements 5. Economical with reduced logistics footprint 6. Longer mean time between failures with minimum failures (especially in a mission)
3.2.3 Communication Protocol Evaluation & Selection Section 3.2.2 discussed the entities proposed for CV‘s in-vehicle network. This section
describes the communication protocol selection and evaluation process for the proposed network design.
A communication protocol, in a network, allows inter device interactions. Unique interfaces in the CV‘s devices, complicates network scalability and performance. The author strongly recommends a common bus for a network to allow all devices to communicate in a standard single interface. Per author‘s research, the Gigabit (GB) Ethernet, CAN bus, USB 2.0, and IEEE 1394 protocols are the open standard candidates for a network communication protocol. This section evaluates each of the protocol based on the proposed factors (TABLE 3.1). The evaluation and selection process assigns ranking for each protocol and its factor, then adds each protocol‘s rankings. This process selects highest ranked protocol as the candidate for the network.
The GB Ethernet data rate is at Gb/s (supports 1-100 Gb/s), the IEEE 1394 is at 49Mb/s, the USB is at 480Mb/s and the CAN is at 1Mb/s. The GB Ethernet and CAN has commercial hardware since 1991, the USB 2.0 since 2000, and the IEEE 1394 since 2003. All these protocols are less susceptible to hardware/software obsolescence with minimum technology risks. All are scalable except IEEE 1394. Due to low date transmission rate, the CAN is not a good video bus, but IEEE 1394 is good for video. The USB 2.0 data rate is lower than GB Ethernet is. In summary, the GB Ethernet has good data transmission rate and minimum technical risk. It is scalable and commercial networking hardware is available. Per TABLE 3.2 analysis and above evaluation, the GB Ethernet is the highest-ranking protocol and the author recommends it for the common bus.
TABLE 3. 1: Protocol selection factor and weighting
Sn#. Parameter Weighting (%) Ranging Weights
1 Implementation cost 8% Low (3), Medium (2),High(1)
2 Bandwidth or throughput 22% High(3), Medium(2), Low(1)

25
UNCLASSIFIED: Dist A. Approved for public release
3 Extensibility 10% Easy(3),Moderate(2), Complex(1)
4 Size, weight & Power(SWAP) 10% Lightest(3),Lighter (2), Light(1)
5 Commercial Availability 11% Surplus(3),Available (2),Scarcity(1)
6 Latency 12% Minimum(3),Medium (2), High(1)
7 Open standard/architecture 12%
Available(3),Some Proprietary(2), Proprietary(1)
8 Technical risk 15% Minimum(3),Medium(2) High(1)
Total 100%
TABLE 3. 2: Protocol evaluation
3.2.4 Bandwidth Analysis In general, electronic devices process video, image, and other mission critical data. The
network must satisfy each data type‘s bandwidth requirements. TABLE 3.3 presents the author assumed data types, its bandwidth and frequency requirements from the assumed core devices.
To support a continuous 3 Gb/s and a frequent 0.37 Gb/s data transfer rate (per TABLE 3.3), to reduce re acquisition cost for future expansion / scalability, the author strongly recommends a 10Gb network bandwidth and the network devices to support it.
Parameter Gigabit Ethernet
CAN Bus
IEEE 1394 USB 2.0
Implementation cost 3* .08 = .24 3* .08 = 24 3* .08 = .24 3* .08 = .24
Bandwidth or Throughput 3 * .22 = .66 1 *.22 =.22 2 *.22 = .44 1*.22 = .22
Extensibility 3 * .10 =.30 1 * .10 =.10 1 * .10 = .10 1 * .10 = .10
Size, weight & Power(SWaP) 2 * .10 = .20 2 * .10 = .20 2 * .10 = .20 3 *.10 = .30
Commercial Availability 3 * .11 = .33 1 *.11 = .11 3 * .11 = .33 3 * .11 = .33
Latency 3 * .12 = .36 3 * .12 = .36 1 *.12 = .12 1 *.12 = .12
Open source/architecture 3 * .12 = .36 3 * .12 = .36 3 * .12 = .36 3 * .12 = .36
Technical risk 3 *.15 = 0.45 3 * .15 = .45 3 * .15 = .45 3 *.15= 0.45
Total 2.9 2.04 2.24 2.02

26
UNCLASSIFIED: Dist A. Approved for public release
TABLE 3. 3: Bandwidth analysis
Data type Frequency Date Rate
Video Continuous 0.5 Gb/s/device
Image Continuous 0.25 Gb/s/device
Text Frequent 0.02Gb/s/device
Navigation Frequent 0.12Gb/s/device
Mission Critical Frequent 0.02Gb/s/device
3.2.5 Network Topology Evaluation & Selection Per author‘s research, a star network topology offers greater advantages over ring, mesh, tree,
and bus. It is scalable and has minimal performance or operational impacts. Star networks are tolerant to single device failures. Request messages do not pass through multiple devices before reaching the target. A link that connects it to and the central hub isolate each device. A network can use multiple cable types.
Based on this evaluation, the author recommends a multiple star networks for device connections. Every device goes through either a router or a switch. Each device has at least two network paths to reach other devices (redundancy).
3.2.6 Network Devices Selection TABLE 3.4 lists the author recommended devices to develop network to support the core
device‘s operation and networking. Section 3.3 describes the details.
TABLE 3. 4: Proposed Architecture devices
Data type Comments
Storage Data storage
Master computers Data handling
Routers Data routing between networks
Switches Creating a network
Gateways Protocol conversions
Common time module Synchronized time across the network
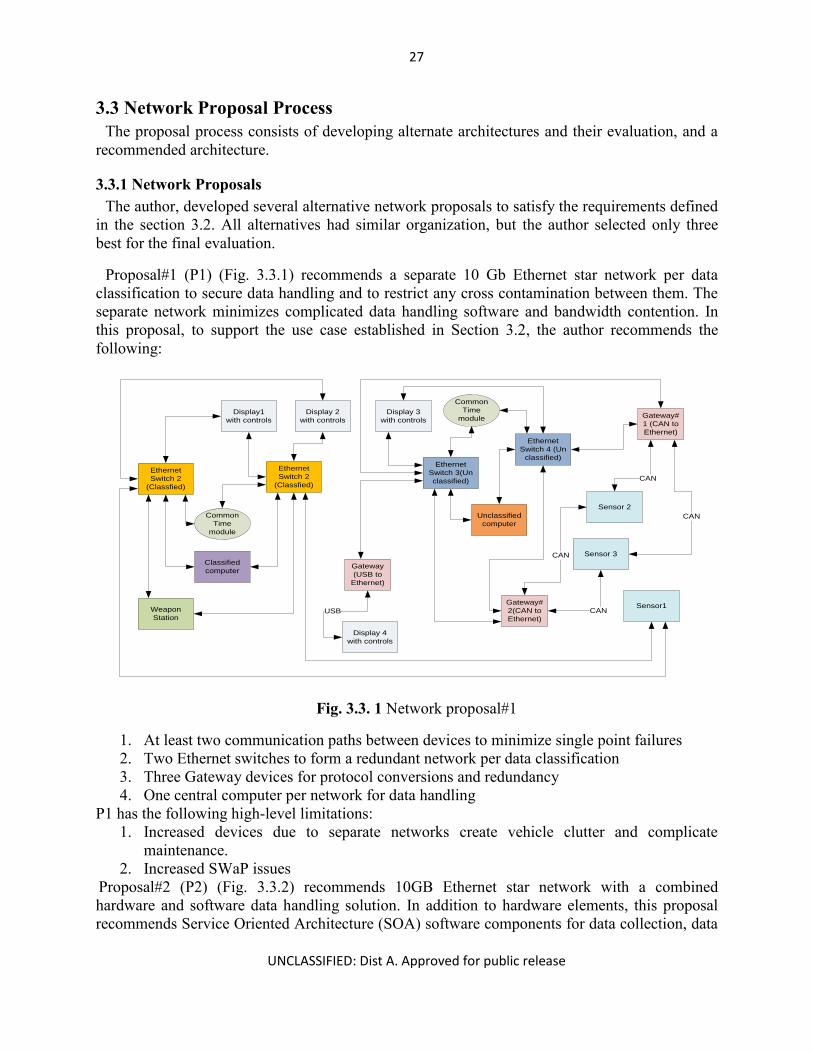
27
UNCLASSIFIED: Dist A. Approved for public release
3.3 Network Proposal Process The proposal process consists of developing alternate architectures and their evaluation, and a
recommended architecture.
3.3.1 Network Proposals The author, developed several alternative network proposals to satisfy the requirements defined
in the section 3.2. All alternatives had similar organization, but the author selected only three best for the final evaluation.
Proposal#1 (P1) (Fig. 3.3.1) recommends a separate 10 Gb Ethernet star network per data classification to secure data handling and to restrict any cross contamination between them. The separate network minimizes complicated data handling software and bandwidth contention. In this proposal, to support the use case established in Section 3.2, the author recommends the following:
Ethernet
Switch 3(Un
classified)
Sensor1
Sensor 2
Sensor 3
Display1
with controls
Display 2
with controls
Display 3
with controls
Classified
computer
Weapon
Station
Unclassified
computer
Ethernet
Switch 2
(Classfied)
Gateway#
1 (CAN to
Ethernet)
CAN
CAN
Ethernet
Switch 4 (Un
classified)
Common
Time
module
Display 4
with controls
Gateway
(USB to
Ethernet)
USB
Gateway#
2(CAN to
Ethernet)
CAN
CAN
Ethernet
Switch 2
(Classfied)
Common
Time
module
Fig. 3.3. 1 Network proposal#1
1. At least two communication paths between devices to minimize single point failures 2. Two Ethernet switches to form a redundant network per data classification 3. Three Gateway devices for protocol conversions and redundancy 4. One central computer per network for data handling
P1 has the following high-level limitations: 1. Increased devices due to separate networks create vehicle clutter and complicate
maintenance. 2. Increased SWaP issues
Proposal#2 (P2) (Fig. 3.3.2) recommends 10GB Ethernet star network with a combined hardware and software data handling solution. In addition to hardware elements, this proposal recommends Service Oriented Architecture (SOA) software components for data collection, data

28
UNCLASSIFIED: Dist A. Approved for public release
processing, data storing, data security, and data distribution. In this proposal, to support the use case established in Section 3.2, the author recommends the following:
Vehicle
Master
Computer
Ethernet
Switch 1
Ethernet
Router#1
Sensor1
Sensor 2
Sensor 3
Display1
with controls
Display 2
with controls
Display 3
with controls
Clustered
Master
Computer
Weapon
Station
Central
Storage
Ethernet
Switch 2 Gateway#
1 (CAN to
Ethernet)
CAN
CAN
Link#7
Link#3
Link#6
Ethernet
Switch 3
Link#4
Common
Time
module
Ethernet
Router#2
Link#8
Link#1
Link#2
Display 4
with controls
Gateway
(USB to
Ethernet)
USB
Link#5
Link#10
Link#0
Gateway#
2(CAN to
Ethernet)
Link#9
CAN
CAN
Fig. 3.3. 2 Network proposal#2 and the proposed network (LAN)
1. At least two communication paths between devices to minimize single point failures 2. Three Ethernet switches to form a redundant network 3. Two routers with built in firewalls and network management software to connect
Ethernet switched networks and any other devices. 4. Three Gateway devices for protocol conversions and redundancy 5. One central data storage device, two vehicle master computers for data handling and to
provide load balancing 6. Centralized SOA based data handling software.
P2 has the following high-level limitations:
1. Requires complex configuration and secure data handling software 2. If we add more number of devices then more Ethernet Switches required. This creates
SWaP issues. Proposal#3 (P3) (Fig. 3.3.3) recommends a modified P2 with reduced number of network
devices and wiring. This proposal recommends redundancy at the Ethernet switch level and minimizes SWAP issues. In this proposal, to support the use case established in Section 3.2, the author recommends the following:

29
UNCLASSIFIED: Dist A. Approved for public release
Vehicle
Master
Computer
Ethernet
Switch 1
Ethernet
Switch 4
Sensor1
Sensor 2
Sensor 3
Display1
with
controls
Display 2
with
controls
Display 3
with
controls
Clustered
Master
Computer
Weapon
Station
Central
Storage
Ethernet
Switch 2Gateway
#1 (CAN
to
Ethernet)
CAN
CAN
Common
Time
module
Ethernet
Switch 5
Display 4
with
controls
Gateway
(USB to
Ethernet)
USB
Fig. 3.3. 3 Network proposal#3
1) At least two communication paths between Ethernet switches to minimize single point failures.
2) Four Ethernet switches to form a redundant network 3) Two Gateway devices for protocol conversions and no additional redundant device 4) One central data storage device, two vehicle master computers for data handling and to
provide load balancing 5) Centralized SOA based data handling software 6) Secure data transmission with no data contamination between multiple data
classifications P3 has the following high-level limitations:
1) Display devices have to hop through three switches to reach sensors. This has additional latency.
2) The redundancy is at the Ethernet switch level and if a device link to switch is broken, the device will be off line.
3.3.2 Network Proposals Analysis The following factors evaluate each of the three proposals.
1) Data Security (Information Assurance) 2) Redundancy 3) Single point failures 4) Size, weight & power consumption(SWaP) 5) Scalability

30
UNCLASSIFIED: Dist A. Approved for public release
Each factor is given a ranking 1- 3 (1 is the lowest). The P1 recommends separate network per data classification and provide highest data security. The P2 and P3 recommend software based highest data security. The P1 creates maintenance and SWAP complexities. The software-based security allows more control with less maintenance and SWAP complexities. Per this rationale, the P1, for data security, ranks as 2, P2 and P3 ranks as3.
The P1 recommends redundant network per data classification, which requires more network devices. The P2 recommends redundant networks and the chances of adding more devices are slim unless huge number of devices in the network. The P3 recommends redundancy at the Ethernet switch level and if a device link to the switch is broken, the device will be off the network. Per this rationale, the P1, for redundancy, ranks as 2, P2 ranks as 3, and P3 ranks as 1.
The P1and P2 recommends redundancy at both the Ethernet switch and the device level, which contributes to minimal single point failures. The P3 recommends redundant links at the Ethernet switch level; this contributes to more single point failures for devices. Per this rationale, for single point failures, the P1 & P2 ranks as 3 and P3 ranks as 1.
The P1 recommends redundant network per data classification, which creates additional number of network devices, which contributes to SWAP issues. The P2 recommends redundant network at both Ethernet switch and device level and does not recommend more switches. It still contributes some SWAP issues. The P3 proposes minimal Ethernet level redundancy and recommends minimal network devices. The P3 contributes size, minimal SWAP issues. Per this rationale, for SWAP, the P1 ranks as 1, P2 ranks as 2 and P3 ranks as 3.
The P1 is scalable but it complicates the network, adds too much clutter in the vehicle, and the maintenance is complicated too. The P2 and P3 shares the same scalability issues as P1, but to a less degree due to the software based data security features. Per this rationale, for scalability, the P1 ranks as 1, P2 and P3 ranks as 2.
The author adds each proposal‘s rankings and selects the network with the highest ranking as the best candidate. The P2 has the highest ranking of 15. The author recommends P2 as the best architecture proposal among the three alternatives.
3.3.3 Proposed Network A CV moves infantry to a combat field quickly. The vehicle operates in different terrains. The
devices on this vehicle continuously monitor and feed mission critical information to the crew. Each vehicle has electronic devices and weapons to carry out missions. For an effective operation of these devices, CV requires a fault tolerant network. The Fig. 3.3.2 shows the proposed network diagram.
Sensors in a CV continuously or on demand capture, process, store, distribute, and display data. The captured data enables crew to take actions and eliminate enemy forces using on board weapons.
In addition to hardware elements, the author proposes SOA based software components for data collection, data processing, data store, data security, and data distribution. This section discusses high-level software details and does not provide any low-level implementation, logic or code

31
UNCLASSIFIED: Dist A. Approved for public release
details. The author proposes two 10 GB Ethernet router networks with three 10 GB Ethernet switch networks for fault tolerance and reduced single point failures. The author proposes physical connection schemes (refer Fig. 3.3.2) for sensors, displays, weapon station, storage, and computer resources.
The sensor network connections allow continuous or on demand data capture. Two router networks connect sensors, which provide high availability and redundancy. They minimize single point failures. Ethernet switch allows easy expansion of additional sensors. If any one of the network channels is broken, the system can access sensors via available redundant channels. Gateways convert CAN data to Ethernet. The router connections allow other devices to interact with sensors.
The display devices network allows continuous or on demand data capture from sensors and vehicle master computer. Two router networks connect displays, which provide high availability and redundancy. They minimize single point failures. Ethernet switch#2 allows easy expansion of additional display devices. If any one of the network channels is broken, the displays can access the network via available redundant channel. Gateways convert USB data to Ethernet The router connections allow these devices to interact with sensors, weapon station and vehicle master computer.
Weapon station is capable of operating on its own without a network resource. A weapon station does not need many redundant channels.
The vehicle computers are the master processing power for data recording, processing, storage, and distribution. The storage device is the media captured data storage. The proposed physical connection allows these devices to access sensors, displays, and weapon stations. The network provides redundant channels to access other devices. The author proposes using two computers for load balancing and a common time module for synchronized time across the network.
The author proposes SOA software components for data capturing, processing, storing and distributing. The display device‘s software provides human factors engineered user interfaces. The display devices are the clients, and the vehicle master computers are the service providers for the requested data. The display devices have the capability to interact with any devices in the network with proper access controls.
The author proposes two types of sensor data capturing mechanisms i.e. batch mode (automatic) and user initiated. The user initiated capture client software resides in all the onboard display devices. The client interfaces with the service software in the master computer. The client component will have a display device specific unique id. Crew requests sensor-data using client software‘s controls. The client software executes a request for data from the service running on the master computer. The request input will have the user id, password, sensor type, and the unique id. The service software accepts requests and validates it. If the requested sensor is a secure data, the service software validates the access authority and then fulfils the request. The sensors send data to the display device and then it is stored in the central storage for playback later. The batch (automatic) capture service software running on the master computer, automatically captures all the sensors data continuously and stores in the central storage for later playback.

32
UNCLASSIFIED: Dist A. Approved for public release
The data processing software resides in the vehicle master computer. It is invoked when display controls issue appropriate commands to execute a specific function. It validates user credentials, encrypt data, and provide processing modules for data distribution, storage, compression, validation, event logging, sensor data recording, executing weapon controls. This software controls the data distribution and data-storage software modules.
The data distribution software resides in the vehicle master computer. It takes care of all the controls and algorithms to distribute data between the various displays and the sensor devices. It provides mechanisms for secure and controlled data distribution.
3.4 Conclusion As an improvement to the in-vehicle network architecture of CVs, this chapter presented the
following contributions for the interoperable in-vehicle LAN for a CV.
1. Open in-vehicle network (LAN) for a CV with a 10 GB Ethernet data bus for faster, scalable, and capability to handle at least five additional sensors and displays (scalability).
2. Devices allocate optimal and minimal SWaP. The common data bus approach promotes easy expansion, provides good interoperable solution, and is compliant with the military standards. The built in firewalls and network management software on router devices reduce risks and development costs.
3. The proposed SOA software modules control the data security and distribution between the devices.
4. The proposed network enables successful combat missions with high availability and faster data transfer. The data is secure and the access is restricted to the authorized personnel only.
5. The proposed technologies are less susceptible to hardware/software obsoleteness.
This chapter proposed a new interoperable in-vehicle LAN using open architecture and standard specifications. This LAN design allows the in-vehicle network architecture to provide the soldiers to perform their tasks efficiently with no impacts to a LAN‘s availability, future device integration, and ability for the device vendors to manufacture products to standard specifications. This proposal facilitates economical solutions for integrating additional capabilities for a CV. This LAN proposed network devices are well under SWaP restrictions of a CV. The proposed SOA software modules controls the data security and distribution between the devices and it enables successful combat missions with high availability and faster data transfer.

33
UNCLASSIFIED: Dist A. Approved for public release
CHAPTER 4 – SOFTWARE RELIABILITY PREDICTION FOR COMBAT VEHICLES
4.1 Introduction In Chapter 1, the author discussed that the CV‘s in-vehicle network architecture is very
important, because it has to facilitate collaborated data and resource handling between multiple software and electronic devices. It also mentioned that the network architecture should enable reliable software development.
In Chapter 3, the author proposed an interoperable LAN, which uses intelligent SOA software modules for data processing within the network. To ensure the SOA modules are reliable, the project managers have to make sure very early in the development process that the software will be reliable. In this chapter, the author proposes intelligent approaches in building software reliability metrics and prediction techniques for CVs software addressing reliability aspect of network architecture. Throughout this thesis, the author refers to software as Army Vehicle Software (AVS).
An AVS is reliable when it exhibits all its designed features with no defects at all times when operated in multiple predefined environments and conditions. This theses use the term AVS reliability to refer to a probability of defect-free condition for a given AVS. As the probability of defects increases, the AVS reliability decreases.
Normally, testing reveals software defects and the developers correct them before using them in practice. This process assures that the software is reliable when used in a combat mission. However, fixing the defects after finding them during testing is costly; it is always better to apply intelligent techniques during early development phases and avoid future defects in the software. For early development phases, researchers have proposed several complex mathematical and statistical techniques to predict the probability of future defects in the software. These techniques require skilled resources to use them. Chapter 2 discusses the literature review of standard approaches used in the reliability prediction techniques. It also highlights the shortcomings in those approaches, which necessitates the need for intelligent approaches. The Army tends to react to a dynamic situation and they need easy to understand techniques for software reliability prediction.
Multiple factors during a software development process influences AVS reliability. The Army pays considerable attention to predict AVS reliability using easy to understand techniques. The AVS reliability measures software quality. Software architects develop IT architecture documents (ITAD) during early design phases of an AVS development project. ITAD reflects software implementation testing details. Therefore, ITAD captures necessary details for a successful software development project. One can investigate ITAD, formulate reliability metrics, and then use them to develop AVS reliability prediction techniques.
In this thesis, the author proposes the following to enable in-vehicle network architecture of CV to provide reliable software.
1. Derive AVS reliability metrics from ITAD. 2. Develop AVS reliability prediction algorithm.

34
UNCLASSIFIED: Dist A. Approved for public release
4.2 AVS Reliability Metrics ITAD captures the information required to transform user requirements into tangible
implementation. Some ITAD are pure text documents and some use modeling languages such as UML. ITAD describes requirements realization without providing low-level implementation details. The developers use ITAD for developing specific solution designs.
At any point of time during a software development project, any person with ordinary computer skill can take a snapshot of information from ITAD and derive fault handling (F) mechanisms, data handling (D), interoperability (I), and configurability (C) details documented in the ITAD.
At any phase of an AVS development project, project managers can use derived ‗D‘, ‗I‘, ‗C‘, and ‗F‘ values as metrics, and then use them to predict AVS reliability. Project managers can rectify issues and predict reliability again to determine if the reliability has improved.
Section 4.3 describes how to use the metrics defined in this section to predict AVS reliability. Each AVS development project must measure or asses all four metric elements. Each metric element has a default value as shown in Table 4.1.
TABLE 4. 1: Metric elements and its default values
4.2.1 Data Handling One can quantify data handling to represent the understanding of the required data and its
characteristics, and the test cases planned for them. Using this, one can determine the impact of ‗D‘ on AVS reliability. As the ‗D‘ value calculated from (4.1) increases, the AVS reliability decreases.
1
1
1
323DT
DDD
D
(4.1)
Where,
D1 = required number of distinct data elements. D2 = number of distinct data elements captured with necessary details. D3 = number of distinct data elements that have captured required data characteristics. T1 = total test cases for all the data elements (using (4.2)).
1
1
11
1
D
I c
N
iIi
N
TT
c
(4.2)

35
UNCLASSIFIED: Dist A. Approved for public release
Where, T1I = number of test cases that are planned for testing all data characteristics per data element. I.e., every data element must have at least one test case planned for every data characteristic. Nc = total number of data characteristics. I = Ith data element in D1, and i= ith data characteristic in Nc. For example, assume Nc = 3 and D1 = 3, Then the T1Ii can be represented as: T111, T112, T113, T121, T122, T123, T131, T132, and T133. For the 1st data element, if the 1st data characteristic has a test case planned, then T111 takes the value of 1 else it takes the value of 0. Using (4.2), one can calculate all T1xx values similarly.
The most important data characteristics for data handling are processing requirements, data format, the security constraints, data size limitations, and the data storage requirements. Understanding the data elements during early phases of an AVS development improves the quality of AVS design, and it reduces future defects. In the case of knowing fewer data elements and planning fewer test cases than the actual required data elements, the ‗D‘ poses a major negative impact on achieving AVS reliability. Each required data element with its details should have at least one test case planned to test each of the data characteristics. This avoids any future surprises.
4.2.2 Interoperability Based on the IEEE definition, interoperability is the capability of an AVS to exchange and
use data in an operating environment within predefined access restrictions. An interoperable AVS must understand all the available interfaces when exchanging data with other AVSs. This capability enables an AVS to produce reliable operations.
One can quantify interoperability to represent the understanding of the required inputs and outputs, and the test cases planned for them. Using this, one can determine the impact of ‗I‘ on AVS reliability. As the ‗I‘ value calculated from (4.3) increases, the AVS reliability decreases.
1
1063
1
2
1
842
1
28O
TTTOO
ITTT
II
I (4.3)
Where,
I1 = required number of distinct inputs. I2 = number of distinct inputs captured with necessary details. O1 = required number of distinct outputs. O2 = number of distinct outputs captured with necessary details. T2 = total test cases planned for testing all the details for all the inputs (using (4.4)).
1
1
12
2
I
I i
N
iIi
N
TT
i
(4.4)
T3 = total test cases planned for testing all the details for all the outputs (using (4.5)).

36
UNCLASSIFIED: Dist A. Approved for public release
1
1
13
3
O
I o
N
iIi
N
TT
o
(4.5)
Where, T2I and T3I are the number of test cases planned for testing all the details per input
and output, respectively. I.e., every input and output must have at least one test case planned for every detail. Ni and No are the total number of input and output details, respectively. I = Ith input in I1 and Ith output in O1, respectively. i= ith detail in Ni and ith detail in No, respectively. For the Ith input, if the 1st detail has a test case planned, then T211 takes the value of 1 else it takes the value of 0. The same rule applies toT311 also. Using (4.4) and (4.5) one can calculate all T2xx and T3xx similarly.
T4 = number of distinct inputs planned for testing its event logging. T6 = number of distinct outputs planned for testing its event logging. T8 = number of distinct inputs planned for testing its fault handling. T10 = number of distinct outputs planned for testing its fault handling. An AVS may have one or many input sources and one or many output destinations. The
complete knowledge of the following reduces defect rates and increases AVS reliability:
1. From where are the inputs received and to where will the outputs be delivered? 2. The security constraints between the input sources AVS and AVS output destinations. 3. What transport mechanism for all inputs and output deliveries used (e.g., frequency, mode
of initiation (automatic push or pull))?
Understanding the inputs and outputs early in the design phase improves the quality of AVS design and development, and it reduces future defects. In the case of knowing fewer inputs or outputs details and planning fewer test cases than the actual inputs or outputs, the ‗I‘ poses a major negative impact on achieving AVS reliability. Each required input and output with should have at least one test case planned to test each of the details. This avoids any future surprises.
4.2.2 Configurability One can quantify configurability to represent the configurability planned for each data
elements, inputs, and outputs, and the test cases planned for them. Using this, one can determine the impact of ‗C‘ on AVS reliability. As the ‗C‘ value calculated from (4.6) increases, the AVS reliability decreases.
1
117
1
42
1
95
1
318O
TTO
CCI
TTI
CCC (4.6)
Where,
C1 and C2 are the number of distinct inputs and outputs, respectively planned for configurable event logging.
C3 and C4 are the number of distinct inputs and outputs, respectively planned for configurable fault handling.

37
UNCLASSIFIED: Dist A. Approved for public release
T5 and T7 are the number of distinct inputs and outputs, respectively planned for testing its configurable event logging.
T9 and T11 are the number of distinct inputs and outputs, respectively planned for testing its configurable fault handling.
Event logging mechanisms minimize confusion in dealing with operational faults.
Configurable event logging enables the users or the maintainers to understand what really went wrong or why a specific scenario executed when something else was expected. When developers or testers exercise this feature, it enables them to understand and fix problems correctly. It enhances the defect removal process and increases AVS reliability.
Planning configurability for each of the data elements, inputs, and outputs, it enables an AVS to operate in multiple operating environments and conditions. Planning no configurability does not allow AVS to work in multiple operating environments without changing the code. Using configurability in an AVS improves the quality of AVS design and development, and it reduces the abrupt failures when operated in an unknown environment for which no code exists. Planning fewer configurability contingencies and fewer test cases than the actual required inputs or outputs or data elements, then ‗C‘ poses a major negative impact on achieving AVS reliability. Each required input, output, and data element with its details should have at least one test case planned to test each configurable option. This avoids any future surprises and problems.
4.2.3 Fault Handling One can quantify fault handling to represent the fault handling mechanisms planned for each
data elements, input, and output, and the test cases planned for them. Using this, one can determine the impact of ‗F‘ on AVS reliability. As the ‗F‘ value calculated from (4.7) increases, the AVS reliability decreases.
1
10
1
8
1
22
1
116OT
IT
OFE
IFEF (4.7)
Where,
E1 = number of distinct inputs planned for event logging. F1 = number of distinct inputs planned for fault handling. E2 = number of distinct outputs planned for event logging. F2 = number of distinct outputs planned for fault handling. T8 = number of distinct inputs planned for testing its fault handling. T10 = number of distinct outputs planned for testing its fault handling. Fault handling mechanisms allow users to get graceful notifications during a failure through
readable messages instead of ending the program abruptly. Using proper fault handlers indicates problem areas and the reasons for it. This allows users to take corrective actions to increase the reliability of AVS operations e.g., when the user enters invalid data in an AVS, instead of ending the AVS operation abruptly, a fault handling mechanism in an AVS notifies the user to rectify the data and allow re-execution of the operation. This allows successful operation and increases AVS reliability.

38
UNCLASSIFIED: Dist A. Approved for public release
Planning fault handing mechanisms each of the data elements, inputs, and outputs enables developers to understand the details of when and how a fault happens. Planning no fault handling cannot gracefully inform the user of any faults or errors. Using fault handling improves the quality of AVS design and development, and it reduces abrupt failures. Planning fewer fault handlings and fewer test cases than the actual required inputs or outputs or data elements then the ‗F‘ poses a major negative influence achieving AVS reliability. Each required input, output, and data element with its details should have fault handling and they should have at least one test case planned to test each fault handling mechanism.
4.3 AVS Reliability Prediction Algorithm This section describes the proposed AVS reliability prediction algorithm. The author uses
fuzzy logic to develop this algorithm using AVS reliability metrics. In Chapter 2, the author discusses the advantages of using fuzzy logic as an approximation technique and an intelligent approach. Fig. 4.3.1 depicts an outline of the prediction algorithm for an AVS development project. The following is the algorithm:
1. For every AVS project 2. Docs Collect ITAD() 3. Begin
a. Data Populate Data (Docs) b. MetricData ReadInputs (Data) c. D Compute DataHandling(Metricdata) d. I Compute Interoperability (Metricdata) e. F Compute FaultHandling(Metricdata) f. C Compute Configurability (Metricdata) g. Fuzzy_inputs fuzzify (D,I,F,C) h. Fuzzy_rules GetFuzzyRules () i. Y AppliedFuzzyRule j. For each fuzzy_rule in the Fuzzy_rules
i. Begin 1. Y ApplyFuzzyRules (D,I,F,C, Fuzzy_rule)
ii. Y AggregateUsingMoM(Y) iii. End for
k. R ComputeReliabilityFromDefuzzfiation (Y) 4. End for
This section describes the prediction portion of the algorithm. Earlier sections described calculating the metric elements.
A fuzzy logic approximation process in the algorithm predicts AVS reliability using the vague metrics values from ‗D‘, ‗I‘, ‗C‘, and ‗F‘.
After the metric values are calculated, the algorithm uses the following main steps to predict AVS reliability as a number.
1. Fuzzify inputs 2. Apply fuzzy rules
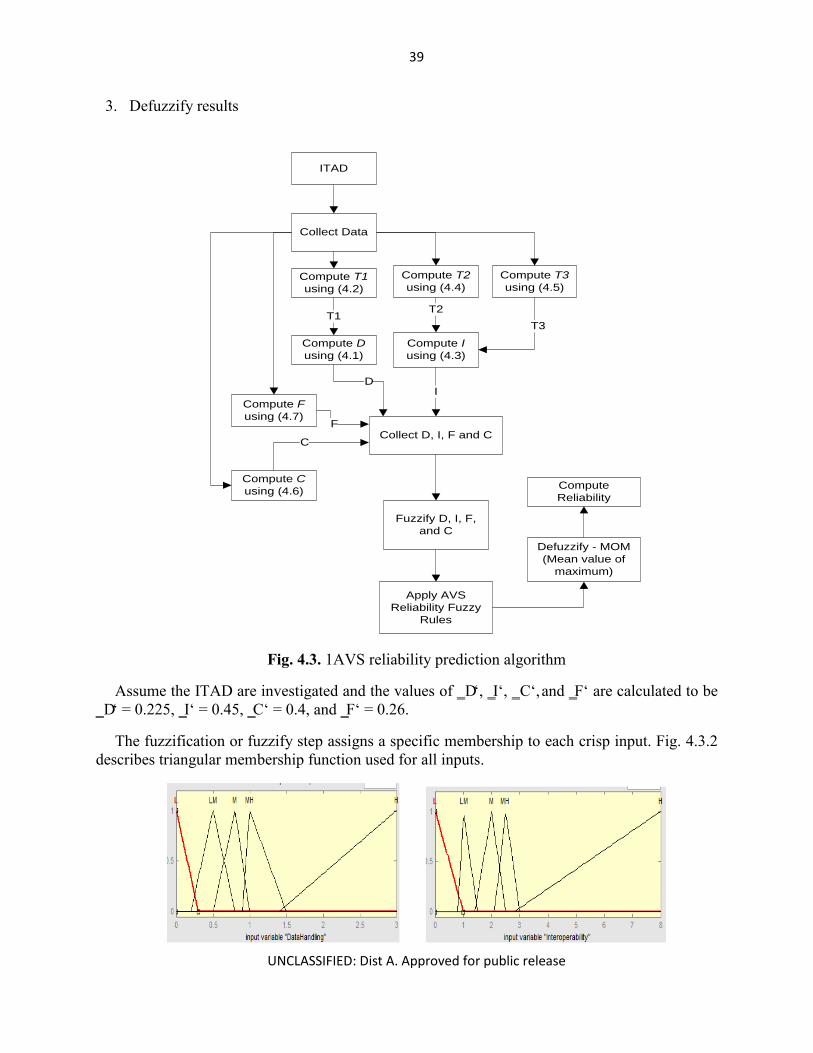
39
UNCLASSIFIED: Dist A. Approved for public release
3. Defuzzify results
ITAD
Collect Data
Collect D, I, F and C
D
Apply AVS
Reliability Fuzzy
Rules
Defuzzify - MOM
(Mean value of
maximum)
Compute
Reliability
Compute T1
using (4.2)
Compute T2
using (4.4)
Compute T3
using (4.5)
Compute D
using (4.1)
T1
Compute I
using (4.3)
T2
T3
I
Compute F
using (4.7)
Compute C
using (4.6)
Fuzzify D, I, F,
and C
C
F
Fig. 4.3. 1AVS reliability prediction algorithm
Assume the ITAD are investigated and the values of ‗D‘, ‗I‘, ‗C‘, and ‗F‘ are calculated to be ‗D‘ = 0.225, ‗I‘ = 0.45, ‗C‘ = 0.4, and ‗F‘ = 0.26.
The fuzzification or fuzzify step assigns a specific membership to each crisp input. Fig. 4.3.2 describes triangular membership function used for all inputs.
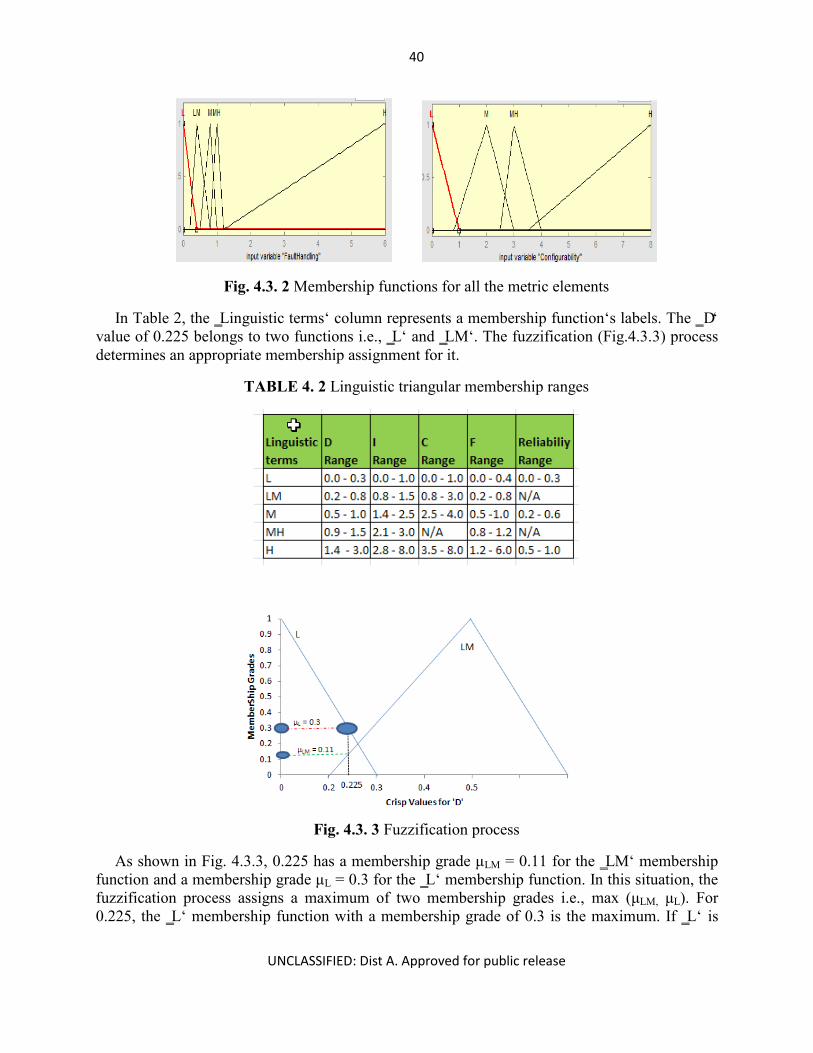
40
UNCLASSIFIED: Dist A. Approved for public release
Fig. 4.3. 2 Membership functions for all the metric elements
In Table 2, the ‗Linguistic terms‘ column represents a membership function‘s labels. The ‗D‘ value of 0.225 belongs to two functions i.e., ‗L‘ and ‗LM‘. The fuzzification (Fig.4.3.3) process determines an appropriate membership assignment for it.
TABLE 4. 2 Linguistic triangular membership ranges
Fig. 4.3. 3 Fuzzification process
As shown in Fig. 4.3.3, 0.225 has a membership grade μLM = 0.11 for the ‗LM‘ membership function and a membership grade μL = 0.3 for the ‗L‘ membership function. In this situation, the fuzzification process assigns a maximum of two membership grades i.e., max (μLM, μL). For 0.225, the ‗L‘ membership function with a membership grade of 0.3 is the maximum. If ‗L‘ is

41
UNCLASSIFIED: Dist A. Approved for public release
not overlapping with ‗LM‘, then there is no need for a maximum function check and the fuzzification process assigns μL to value of 0.3. Similar process fuzzifies ‗I‘, ‗F‘, and ‗C‘.
In the next step of the algorithm, expert knowledge based fuzzy rules (Fig 4.3.4) verifies all the inputs using a fuzzy reasoning process also known as a fuzzy inference. Every rule applies to all the fuzzy inputs and it aggregates the results from each rule using a ―maximum of mean value‖ function.
Fuzzy rules represent how the algorithm decides to assign a fuzzy input to a fuzzy output space. For example, in rule #1 (Figure 7), ―if (D is L) and (I is L) and (C is L) then the reliability is H,‖ L and H are linguistic labels used to represent membership functions. When the ‗and‘ operator is used in a rule, the result of the rule application will get the minimum membership value out of all the fuzzy inputs used in the rule. For example, assume the following membership grades/values are assigned based on the fuzzify step for each input (‗D‘, ‗I‘, ‗F‘, ‗C‘): µD = 0.3, µI = 0.4, µF = 0.2, and µC = 0.1. With these membership grades, when the rule#1 is applied, the result will be as follows:
D & I & F & C = min (µD µI µF µC) (4.8)
Fig. 4.3. 4 Expert knowledge fuzzy rules
When the ‗or‘ operator is used in a rule, the result of the rule application will get the maximum membership value out of all the fuzzy inputs used in the rule. For example, assume the following membership grades/values are assigned based on the fuzzify step for each input (‗D‘, ‗I‘, ‗F‘, ‗C‘): µD = 0.3, µI = 0.4, µF = 0.2, and µC = 0.1. With these membership grades, when the rule#12 is applied, the result will be as follow:
D || I || F || C = max (µD µI µF µC) (4.9)
From (4.8), the result of the rule#1 is min (0.3 0.4 0.2 0.1) = 0.1. From (4.9), the result of the rule #12 is min (0.3 0.4 0.2 0.1) = 0.4. Applying all the rules, the algorithm obtains output distribution as shown in Fig. 4.3.5.

42
UNCLASSIFIED: Dist A. Approved for public release
Fig. 4.3. 5 Output distribution
Defuzzification or defuzzify step in the algorithm obtains a crisp output number from the output distribution obtained in the previous step using a mean of maximum (MOM) function Fig. 4.3.6 shows AVS reliability output membership functions. Using the output membership functions, the MOM process maps a crisp output number. The number obtained from the defuzzification process is the AVS reliability prediction number. This number is the predicted probability that the AVS will work defect-free. For example, if AVS reliability prediction number is 1, then it means an AVS is 100% defects-free. If the number is 0, then the AVS is full of defects. If the number is 0.5, then the AVS is 50% defect-free. Fig.4.3.7 shows the entire fuzzy logic process to obtain AVS reliability prediction number. Based on the example dataset, the predicted AVS reliability number is 0.615 (Fig.4.3.7).
Fig. 4.3. 6 Output membership function

43
UNCLASSIFIED: Dist A. Approved for public release
Fig. 4.3. 7 AVS reliability Fuzzy membership functions

44
UNCLASSIFIED: Dist A. Approved for public release
Based on the current AVS reliability number obtained during a given development phase, project managers can take corrective measures to improve the current development situation by planning to capture missing details. Higher the predicted AVS reliability number, lesser the probability of defects.
4.4 Conclusion Several standard approaches use complex mathematical and statistical techniques to predict
software reliability. Those techniques require skilled resources to use them. The Army tends to react to a dynamic situation and they need easy to understand techniques for software reliability prediction. Therefore, intelligent and easy to use approaches are required to predict software reliability. In this chapter, the author presented the following contributions of this thesis:
1. Analytical models to determine data handling, fault handling, configuration, and interoperability aspects of an AVS from ITAD.
2. An intelligent fuzzy logic algorithm to predict AVS reliability using the results obtained from the analytical models of data handling, fault handling, configuration, and interoperability, and a simulation model to predict AVS reliability.
The AVS reliability prediction is very important for the in-vehicle network architecture to make sure the soldiers can have reliable software to achieve successful missions. By understanding the metrics, the project managers can focus their attention to minimize impacts from the factors, which influence unreliability in an AVS. In this chapter, the author demonstrated that the in-vehicle network architecture could provide reliable software by allowing project managers to predict software reliability using this intelligent approach throughout the development lifecycle and ensure final reliable software.

45
UNCLASSIFIED: Dist A. Approved for public release
CHAPTER 5 - SOFTWARE COMPLEXITY PREDICTION FOR COMBAT VEHICLES
5.1 Introduction In Chapter 1, the author discussed that the CV‘s in-vehicle network architecture is very
important, because it has to facilitate collaborated data and resource handling between multiple software and electronic devices. It also mentioned that the network architecture should enable developing less complex software.
In Chapter 3, the author proposed an interoperable LAN, which uses intelligent SOA software modules for data processing within the network. To ensure the SOA modules are less complex, the project managers have to make sure very early in the development process that the software will not be complex. In this chapter, the author proposes intelligent approaches in building software complexity metrics and prediction techniques for CVs software addressing complexity aspect of network architecture.
CV‘s devices are real-time and the operating systems control their operations. AVS has programs written in programming languages such as Ada, Java, C, and C. CVs have software related to radios, communications, navigation, fighting, training, and diagnostics. For the Army, AVS is crucial and any complexity in it hinders the mission success. AVS development goes through intense tight requirements using multiple vendors. Some AVSs have millions of lines of code. They require efficient integration to minimize possible software complexity. The Army has to focus more on its vehicle software complexity than any other commercial software, because, the Army environment is dynamic and its requirements are changing frequently to meet mission needs. Complex software in CV introduces many defects. It is difficult to understand and correct any defects in a relatively faster pace. Army cannot afford to have defects in any critical functions. If the software cannot accommodate frequent changes faster, the vehicles cannot perform its intended function and it is not acceptable to the Army.
Software complexity is a major concern for any AVS to maintain its peak performance at all time. There is a bigger need for identifying metrics to predict the AVS complexity in very early stages of its development cycle. Many researchers have postmortem historical software and identified the reasons why a given software structure is complex, but, to the author‘s knowledge, no body has identified AVS complexity contributing factors by inspecting a software development process. Many researchers have defined several software complexity metrics but they all are historical technical data dependent and may not work in all software development.
Many factors prior to software development influence AVS complexity. Understanding, predicting and resolving complexity of vehicle software prior to its development is a necessity for Army mission success. In this thesis, the author proposes intelligent approaches to predict AVS complexity using fuzzy logic and factor analysis techniques.
5.2 Software Complexity The author defines software complexity as a combination of reliability, availability, and
maintainability (RAM). Many features may be qualified as software complexity elements, but from author‘s experience, the main complexity is truly a result of RAM. Reliability (R) is the

46
UNCLASSIFIED: Dist A. Approved for public release
―probability of performing a required function under stated conditions for a specified period of time ―[15]. Availability (A) is a ―measure of the degree to which software is in an operable state and can be committed at the start of a mission when called for at an unknown (random) point in time.‖ Availability as measured by the user is a function of how often failures occur and corrective maintenance is required, how often preventative maintenance is performed, how quickly indicated failures can be isolated and repaired, and how quickly preventive maintenance tasks can be performed [15]. Maintainability (M) is the ―ability of software to be retained in, or restored to, a specified condition when personnel having specified skill levels, using prescribed procedures and resources, at each prescribed level of maintenance and repair [15], perform maintenance.‖ The software complexity influences many software defects and introduces unknowns when it comes to fixing them. If the software is complex, its reliability is hard to achieve, due to this, the software may suffer availability issues. If the software is hard to understand, hard to fix defects, then the maintainability suffers. The bottom-line is, the RAM controls the entire software dependability, and without it, the Army cannot perform its intended functions. These arguments confirm that the software complexity is really consisting of RAM elements.
Many existing software complexity metrics are historical data distribution dependent and they focus only on software & its technical structure with no consideration of its influencing factors. These metrics provide unique software attributes to define complexity and they are programming language or industry specific. These complexity metrics require skilled resources to understand, implement, and resolve complexity. Identifying complexity based on one source of software historical data and applying it to another may not work for all software. There are multiple factors, which contribute to its complex structure. Management may not understand the technical complexity data obtained from the historical data. In many cases, the developers may not be skilled enough to understand this to implement a good solution. Convincing management to spend resources on resolving problems in the development phase just based on the technical complexity data is very hard. To fix issues, skilled developers and designers are required. This could be expensive. Due to tight schedules and wrong historical data, solving the problems may not be an issue. Basing decisions on these metrics and attempting to reduce complexity may work in some but not in all cases because the factors, which contributed to complexity still not examined. Historical data change when the contributing factors and the target software are changed. These metrics are complex mathematical formulations and need tools to find the elements proposed by these researchers to collect data from the historical complex software. All applicable parties may not easily understand these metrics. There is a need for intelligent approaches to develop non-technical metrics, which are common to any software development, and for any industry.
If early software planning predicts AVS complexity, one can apply preventive measures such as revisiting the requirements, restructuring the development team, scheduling for reviews, and modifying the testing strategy. Early predictions put less effort on software development and restructuring executing plan. The author proposes AVS complexity prediction metric in the following sections.
1. Intelligent metrics development - using factor analysis approach 2. Intelligent Prediction algorithm - using fuzzy logic approach 3. Prediction model development - using fuzzy logic
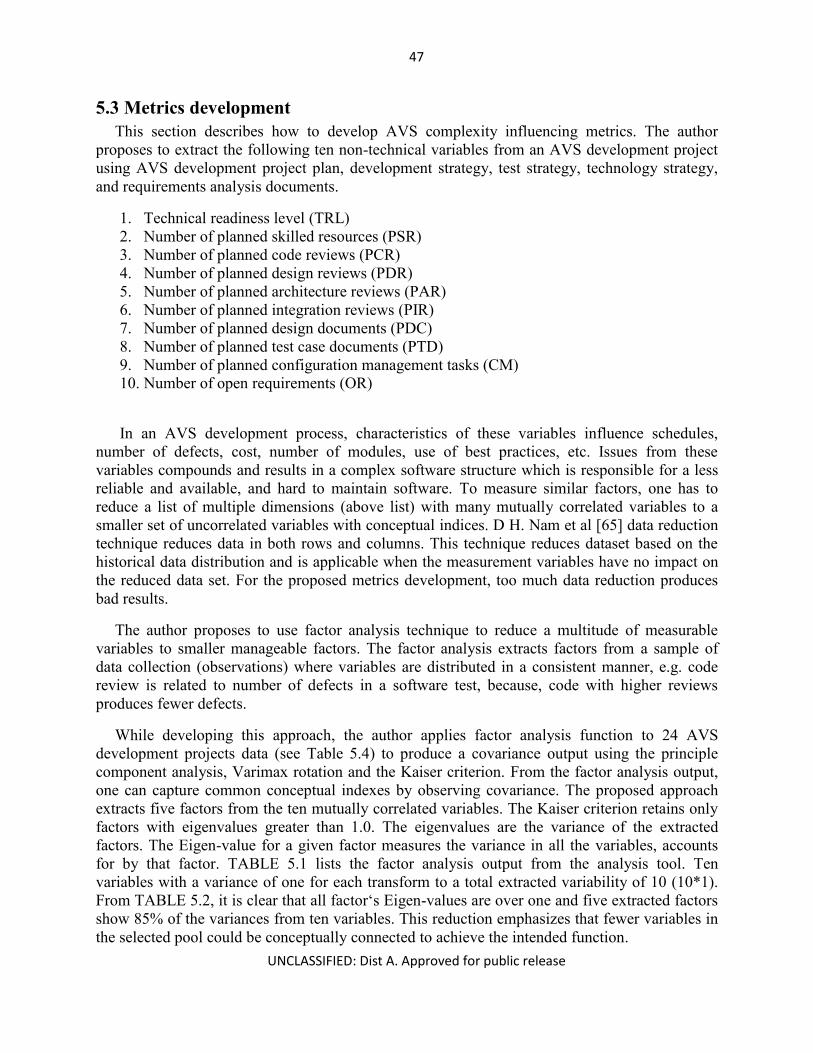
47
UNCLASSIFIED: Dist A. Approved for public release
5.3 Metrics development This section describes how to develop AVS complexity influencing metrics. The author
proposes to extract the following ten non-technical variables from an AVS development project using AVS development project plan, development strategy, test strategy, technology strategy, and requirements analysis documents.
1. Technical readiness level (TRL) 2. Number of planned skilled resources (PSR) 3. Number of planned code reviews (PCR) 4. Number of planned design reviews (PDR) 5. Number of planned architecture reviews (PAR) 6. Number of planned integration reviews (PIR) 7. Number of planned design documents (PDC) 8. Number of planned test case documents (PTD) 9. Number of planned configuration management tasks (CM) 10. Number of open requirements (OR)
In an AVS development process, characteristics of these variables influence schedules, number of defects, cost, number of modules, use of best practices, etc. Issues from these variables compounds and results in a complex software structure which is responsible for a less reliable and available, and hard to maintain software. To measure similar factors, one has to reduce a list of multiple dimensions (above list) with many mutually correlated variables to a smaller set of uncorrelated variables with conceptual indices. D H. Nam et al [65] data reduction technique reduces data in both rows and columns. This technique reduces dataset based on the historical data distribution and is applicable when the measurement variables have no impact on the reduced data set. For the proposed metrics development, too much data reduction produces bad results.
The author proposes to use factor analysis technique to reduce a multitude of measurable variables to smaller manageable factors. The factor analysis extracts factors from a sample of data collection (observations) where variables are distributed in a consistent manner, e.g. code review is related to number of defects in a software test, because, code with higher reviews produces fewer defects.
While developing this approach, the author applies factor analysis function to 24 AVS development projects data (see Table 5.4) to produce a covariance output using the principle component analysis, Varimax rotation and the Kaiser criterion. From the factor analysis output, one can capture common conceptual indexes by observing covariance. The proposed approach extracts five factors from the ten mutually correlated variables. The Kaiser criterion retains only factors with eigenvalues greater than 1.0. The eigenvalues are the variance of the extracted factors. The Eigen-value for a given factor measures the variance in all the variables, accounts for by that factor. TABLE 5.1 lists the factor analysis output from the analysis tool. Ten variables with a variance of one for each transform to a total extracted variability of 10 (10*1). From TABLE 5.2, it is clear that all factor‘s Eigen-values are over one and five extracted factors show 85% of the variances from ten variables. This reduction emphasizes that fewer variables in the selected pool could be conceptually connected to achieve the intended function.
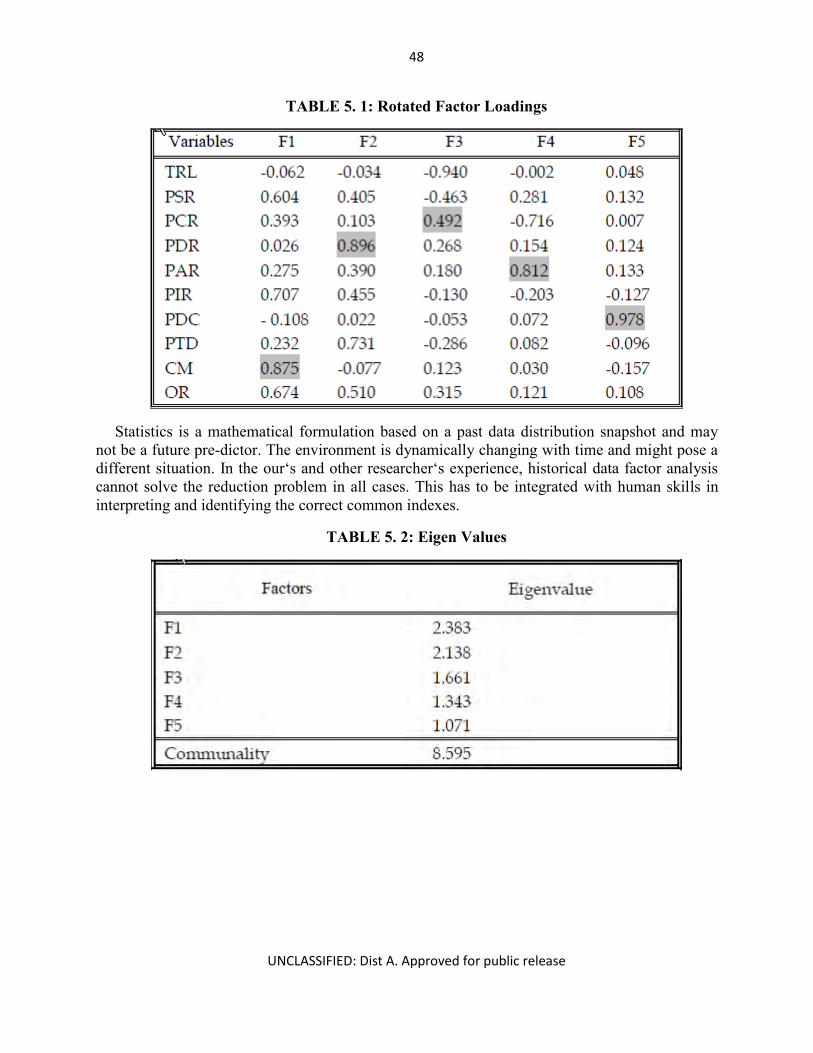
48
UNCLASSIFIED: Dist A. Approved for public release
TABLE 5. 1: Rotated Factor Loadings
Statistics is a mathematical formulation based on a past data distribution snapshot and may not be a future pre-dictor. The environment is dynamically changing with time and might pose a different situation. In the our‘s and other researcher‘s experience, historical data factor analysis cannot solve the reduction problem in all cases. This has to be integrated with human skills in interpreting and identifying the correct common indexes.
TABLE 5. 2: Eigen Values

49
UNCLASSIFIED: Dist A. Approved for public release
TABLE 5. 3 Proposed metric elements
Per TABLE 5.1 (gray highlighted text), PCR, PDR, PAR, PDC, and CM show higher covariance among other variables. If one were to choose purely on this analysis, it would be badly judged, as PCR, PDR, and PAR can be linked to a single factor. In addition to analysis data and our experience dealing with software, the proposed soft-ware complexity prediction factors are listed in TABLE 5.3. F1 can consist of PCR, PDR, PAR, PIR and PSR. F2 can consist of PDC & PTD. F3 can consist of TRL which plays a big role in any software development. F4 can consist of OR alone because ORs create a greater impact on any software development. F5 can consist of CM alone because CM is very important in making sure the developed software is properly controlled and configured.
TABLE 5. 4: AVS metric data from various documents

50
UNCLASSIFIED: Dist A. Approved for public release
Based on the earlier discussions, The author propose the following five factors metric to predict software complexity.
1. Technical readiness level (TRL) 2. Number of open requirements (OR) 3. Number of planned technical reviews (TR) 4. Number of planned documentation tasks (DOC) 5. Number of planned configuration management tasks (CM)
As previously stated, the true software complexity is a combination of R, A, and M. The DOD‘s RAM guide [15] defines RAM essentialness to military systems and soft-ware and describes various affecting factors. Subsequent paragraphs describe the proposed metric elements and its association with R, A, and M.
For predicting the AVS complexity, all the five factors must be considered because the combination of factors predicts R, A, and M component of the software complexity as shown below.
1) TRL, TR, and OR factors predict reliability 2) TRL and TR factors predict availability 3) DOC and CM factors to predict maintainability
5.3.1 Technology Readiness Level (TRL) TRL measures evolving technologies maturity prior to its implementation. One to nine levels
indicates readiness of technology.
TRL1: Basic principles observed and reported TRL2: Technology concept and/or application formulated TRL3: Analytical and experimental critical function and/or characteristic proof of concept TRL4: Breadboard validation in laboratory environment TRL5: Breadboard validation in relevant environment TRL6: Model or prototype demonstration in a relevant environment TRL7: Prototype demonstration in an operational environment TRL8: Actual system completed and 'flight qualified' through test and demonstration TRL9: Actual system 'flight proven' A technology with a lower TRL contributes to frequent failures when the software is
developed. This creates lower mean time between failures (MTBF), increased downtime, lower meantime between repairs (MTBR), etc. When the TRL level is more than six then it is mature enough to provide good reliable software. Higher MTBF indicates software that is more reliable and decreased downtime. Lower MTBR reduces the availability of software to perform intended functions. To make lower TRL technology work, one needs more resources and efforts. TRL is a very good indicator of future R & A of given software.
5.3.2 Number of Open Requirements (OR) Open requirements have issues & unanswered questions. Unknown clarity on the
requirements contributes to misunderstood requirements, increased redesigns, missed schedules, skipped technical documentation, cutting design corners, unmaintainable complex modules
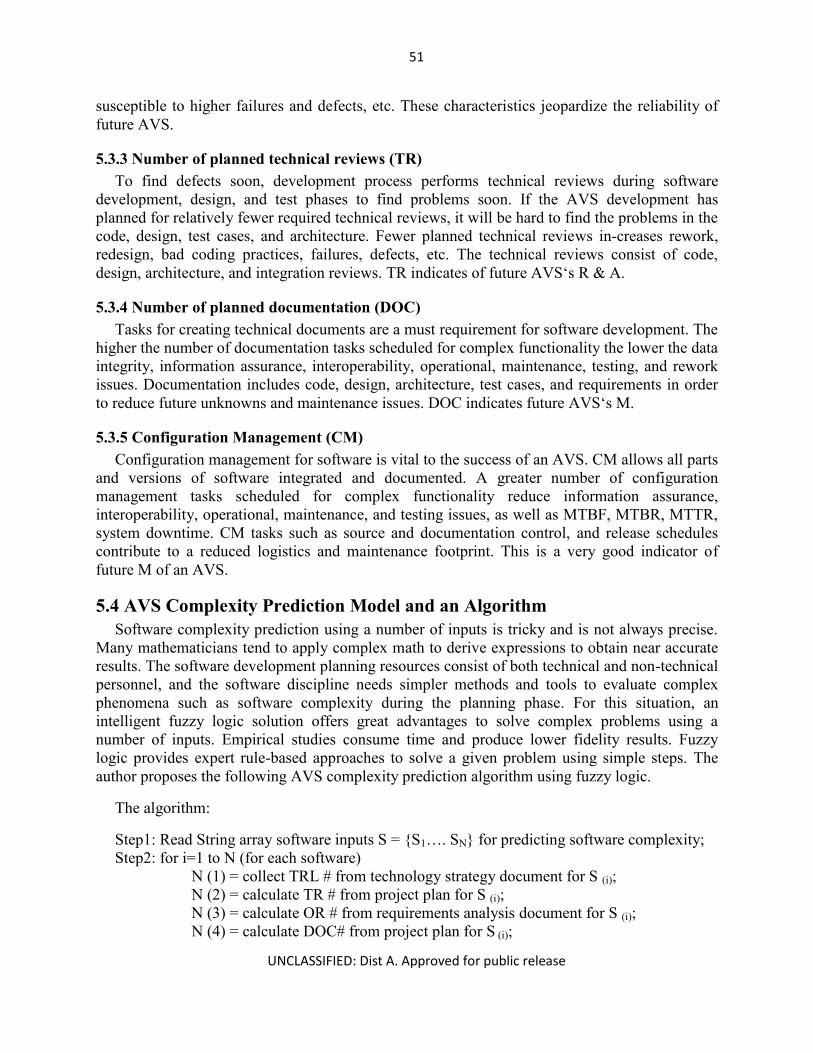
51
UNCLASSIFIED: Dist A. Approved for public release
susceptible to higher failures and defects, etc. These characteristics jeopardize the reliability of future AVS.
5.3.3 Number of planned technical reviews (TR) To find defects soon, development process performs technical reviews during software
development, design, and test phases to find problems soon. If the AVS development has planned for relatively fewer required technical reviews, it will be hard to find the problems in the code, design, test cases, and architecture. Fewer planned technical reviews in-creases rework, redesign, bad coding practices, failures, defects, etc. The technical reviews consist of code, design, architecture, and integration reviews. TR indicates of future AVS‘s R & A.
5.3.4 Number of planned documentation (DOC) Tasks for creating technical documents are a must requirement for software development. The
higher the number of documentation tasks scheduled for complex functionality the lower the data integrity, information assurance, interoperability, operational, maintenance, testing, and rework issues. Documentation includes code, design, architecture, test cases, and requirements in order to reduce future unknowns and maintenance issues. DOC indicates future AVS‘s M.
5.3.5 Configuration Management (CM) Configuration management for software is vital to the success of an AVS. CM allows all parts
and versions of software integrated and documented. A greater number of configuration management tasks scheduled for complex functionality reduce information assurance, interoperability, operational, maintenance, and testing issues, as well as MTBF, MTBR, MTTR, system downtime. CM tasks such as source and documentation control, and release schedules contribute to a reduced logistics and maintenance footprint. This is a very good indicator of future M of an AVS.
5.4 AVS Complexity Prediction Model and an Algorithm Software complexity prediction using a number of inputs is tricky and is not always precise.
Many mathematicians tend to apply complex math to derive expressions to obtain near accurate results. The software development planning resources consist of both technical and non-technical personnel, and the software discipline needs simpler methods and tools to evaluate complex phenomena such as software complexity during the planning phase. For this situation, an intelligent fuzzy logic solution offers great advantages to solve complex problems using a number of inputs. Empirical studies consume time and produce lower fidelity results. Fuzzy logic provides expert rule-based approaches to solve a given problem using simple steps. The author proposes the following AVS complexity prediction algorithm using fuzzy logic.
The algorithm:
Step1: Read String array software inputs S = {S1…. SN} for predicting software complexity; Step2: for i=1 to N (for each software)
N (1) = collect TRL # from technology strategy document for S (i); N (2) = calculate TR # from project plan for S (i); N (3) = calculate OR # from requirements analysis document for S (i); N (4) = calculate DOC# from project plan for S (i);

52
UNCLASSIFIED: Dist A. Approved for public release
N (5) = calculate CM # from project plan for S (i); M (i) = N; (Store N array for S(i) in M array).
end for Step3: Read integer inputs array from M array; Step4: Store Fuzzy rules in array X = {rule1.... rule15}; Step5: for i = 1 to N // Loop for computing software complexity for each software
W = M(i) //get the ith element from W array for j=1 to 5
Y(i) = fuzzify (W(i)); end for
Step6: for i = 1 to 15 if i <=11 then
Z(i) = apply fuzzyrule(X(i)) on Y(1) & Y(2) & Y(3); else
Z(i) = apply fuzzyrule(X(i)) on Y(4) & Y(5); end if
end for Step7: Compute Reliability, R = centroid De-fuzzufication of Z(1) to Z(11);
Compute Availability, A = centroid De-fuzzufication of Z(1) to Z(10); Compute Maintainability, M = centroid De-fuzzufication of Z(12) to Z(15);
Step8: Predict Software complexity from R, A, and M values end for
The author proposes an intelligent fuzzy logic based AVS complexity prediction model using the proposed five factors metrics. TABLE 5.5 lists the fuzzy variables and its mapping with the proposed metric elements.
The prediction model has three components fuzzification, rule-based fuzzy inference engine, and de-fuzzification. The model consists of five inputs, three out-puts and 15 rules. According to the predefined rules, the model predicts the appropriate software complexity in terms of RAM. Fuzzy inputs and outputs uses trapezoidal membership functions. The membership grades for TRL are described by LOW, MEDIUM, and HIGH membership functions (see Fig. 5.1) and all other the fuzzy inputs are described by NOTHING, SOME and FULL membership functions (See Fig. 5.2). RED, YELLOW, and GREEN membership functions (See Fig. 5.3) defines fuzzy output variables.
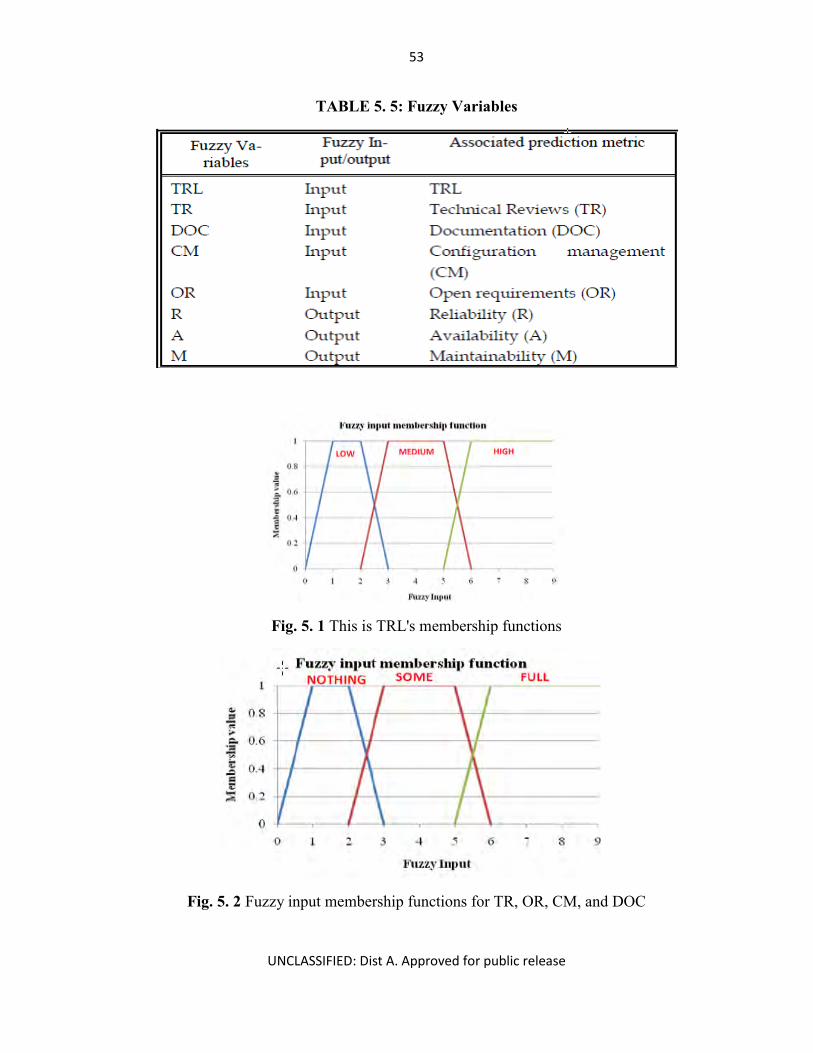
53
UNCLASSIFIED: Dist A. Approved for public release
TABLE 5. 5: Fuzzy Variables
Fig. 5. 1 This is TRL's membership functions
Fig. 5. 2 Fuzzy input membership functions for TR, OR, CM, and DOC

54
UNCLASSIFIED: Dist A. Approved for public release
Fig. 5. 3 Fuzzy output membership functions for R, A, and M
Fuzzy logic toolbox provides a rule-based model as a software prototype to analyze all the inputs and compute the output. The de-fuzzification rules are for the proposed five factors metrics. The list below shows the 15 fuzzy rules to predict the software complexity using five inputs and three outputs.
1. If TRL= LOW & TR = NOTHING & OR =NOTHING then R = RED & A = RED 2. If TRL= LOW & TR = SOME & OR = NOTHING then R = RED & A = RED 3. If TRL = LOW & TR=FULL & OR=NOTHING then R=RED & A=YELLOW 4. If TRL=MEDIUM & TR=NOTHING & OR=NOTHING then R=RED &
A=YELLOW 5. If TRL=MEDIUM & TR=SOME & OR=NOTHING then R=RED & A=YELLOW 6. If TRL=MEDIUM & TR=FULL & OR=NOTHING then R=YELLOW &
A=YELLOW 7. If TRL=HIGH & TR=NOTHING & OR=NOTHING then R=RED & A=YELLOW 8. If TRL=HIGH & TR=SOME & OR=NOTHING then R=YELLOW & A=YELLOW 9. If TRL=HIGH & TR=FULL & OR=NOTHING then R=GREEN & A=GREEN 10. If OR=SOME then R=YELLOW 11. If OR=FULL then R=RED 12. If DOC=NOTHING || CM=NOTHING then M=RED 13. If DOC=SOME & CM=SOME then M=YELLOW 14. If DOC=SOME & CM=FULL then M=YELLOW 15. If DOC=FULL & CM=FULL then M=GREEN
R in the RED membership grades indicates that the reliability component of the AVS complexity is in trouble and needs significant improvements in ―TRL‖ or ―TR‖ or ―OR‖. A in the RED membership grades indicates that the availability component of the AVS complexity is in trouble and needs significant improvements in ―TRL‖ or ―TR‖ factors. Similarly, M in the RED membership grades indicates that the maintainability component of the AVS complexity is in trouble and needs improvements in ―CM‖ or ―DOC‖ factors. The output values of YELLOW indicate the need for some improvements for the associated factors. The output values of

55
UNCLASSIFIED: Dist A. Approved for public release
GREEN indicate no improvements needed for the associated factors. The Fig. 5.4 describes the model elements.
Fig. 5. 4 AVS complexity prediction model
The fuzzification model element fuzzifies the model inputs via a max function evaluation based on the membership functions defined to determine its appropriate membership grades.
5.4.1 Example This section explains the AVS complexity prediction model using a simple example. The
following are the example data: TRL = 5, TR=4, OR=1, DOC=3 and CM=4.
Per the proposed AVS complexity prediction algorithm, the fuzzified inputs using the max function values are TRL = 1 (MEDIUM), TR = 1 (SOME), OR = 1 (NOTHING), DOC = 1 (SOME), CM = 1 (SOME).
After applying 15 fuzzy rules to the fuzzified inputs, per rule#5, If TRL=MEDIUM & TR=SOME & OR=NOTHING then R=RED & A=YELLOW. Per rule#13, If DOC=SOME & CM=SOME then M=YELLOW. From the two fuzzy rules #5 & #13, the AVS complexity results indicate that the reliability part of the software complexity as RED (crisp values between 0 & 3). Availability part of the software complexity is YELLOW (crisp values between 2 & 6). The maintainability part of the software complexity is YELLOW (crisp values between 2 & 6). Depending on the output membership grades appropriate fuzzy value for the output can be determined from the fuzzy logic toolbox output.
5.5 Conclusion Several standard approaches use complex mathematical and statistical techniques to predict
software complexity. The standard approaches of identifying AVS complexity based on one source of software historical data and applying it to another may not work for all software. The Army tends to react to a dynamic situation and the management may not understand the

56
UNCLASSIFIED: Dist A. Approved for public release
technical data of the complexity obtained from the historical data. They need easy to understand techniques for software complexity prediction. Therefore, intelligent and easy to use approaches are required to predict software complexity using non-technical factors. In this chapter, the author presented the following contributions of this thesis:
1. Factor analysis approach to reduce the number of factors harvested from various project management documents, and identify the non-technical factors as software complexity influencing metrics.
2. An intelligent fuzzy logic algorithm to predict AVS complexity using the results obtained from the factor analysis approach and a simulation model to predict AVS complexity.
The AVS complexity prediction is very important for the in-vehicle network architecture to make sure the soldiers can have less complex software to achieve successful missions and allow maintainers to fix the defects very easily. By understanding the metrics, the project managers can focus their attention to minimize impacts from the factors, which influence complexity in an AVS. In this chapter, the author demonstrated that the in-vehicle network architecture could provide less complex software by allowing project managers to predict software complexity using this intelligent approach throughout the development lifecycle and ensure final less complex software.

57
UNCLASSIFIED: Dist A. Approved for public release
CHAPTER 6 – INTELLIGENT POWER MANAGEMENT SOFTWARE ARCHITECTURE FOR COMBAT VEHICLES
6.1 Introduction In Chapter 1, the author discussed that the CV‘s in-vehicle network architecture is very
important, because it has to facilitate collaborated data and resource handling between multiple software and electronic devices and minimize power consumption of the devices. It also mentioned that the network architecture should provide intelligent approaches to minimize CV‘s power consumption.
In Chapter 2, the author discussed the various standard traditional approaches used in developing power management solutions to minimize power consumption in devices. The Chapter 2 also discussed that the standard approaches in the current technology have challenges when handling CV‘s in-vehicle networked devices.
In this chapter, the author proposes intelligent approaches in building Intelligent Power Management Software Architecture (IPMSA) for CVs devices addressing power consumption aspect of the network architecture.
The CVs are predominantly used in complex ground military missions. A CV has multiple electric powered devices such as sensors, automatic weapons, communication and navigation systems, computers, displays, storage systems, environment controlling system, air conditioner, and coolant control systems. The space restrictions inside a CV create a crowded confined space for the devices and the soldiers. In a CV, all the active, idle, and potentially even faulted devices dissipate excessive heat when the CV keeps all the devices powered on. The combined heat from the devices increases temperature inside the vehicle, excessive heat generation can create a challenging operational environment for the crew and the electronic devices. A continuous power consumption of a device generates heat inside any confined space such as a CV. The power generation directly influences the fuel consumption. To minimize the generated heat, power generation, cooling requirements, and fuel consumption, the Army is showing significant interest in reducing the power consumption inside a CV. In this situation, we need intelligent approaches in managing the power management (PM) of a CV to mitigate the gaps in the standard approaches used to manage power. The PM can also address the Army‘s bigger questions of designing compact power generation systems to mitigate the size, weight, and cooling concerns inside a CV.
The term ―intelligent‖ in this context is a concept used in the author‘s research. An intelligent approach in the PM automatically recognizes the predetermined CV parameters and warns of the overheating possibility. It also initiates appropriate actions to minimize overheating situations. Unlike commercial electronics, devices inside the CVs are crowded and operate in an uncontrolled environment with varying outside climates. The devices inside a CV handle random events in a given mission. The soldiers‘ use some devices seldom in a mission and they use some devices all the time. This randomness is a great challenge to the author‘s research to find an optimal PM solution.
An intelligent approach can minimize the number of power consuming devices to reduce the temperature inside a CV. The easier solution is to train Soldiers to shutdown or power off idle and faulted devices when they feel the uncomfortable heat. They can always power on the devices when needed for a task, assuming that the devices have smaller startup latency. During a

58
UNCLASSIFIED: Dist A. Approved for public release
combat mission, the soldiers perform many mission related tasks inside the vehicle and they will not have the time or the patience to monitor these devices and take actions. We need an intelligent approach, which can automatically monitor the CV parameters mentioned earlier and take timely actions to minimize the future damages. The other simple solution is to use the existing environment control system to monitor the temperature and use the air conditioner, fans, or the coolant control systems to cool the vehicle temperature. When the room temperature is constantly increasing, the air conditioner, fans or the coolant systems overwork and they consume more power. The cooling systems also start emitting heat. The refrigerant used in the air conditioner and the liquid coolants may run out of stock soon due to over working or leaky faulted devices. Due to weight restrictions, the CVs may carry limited supplies. During a combat mission, replacing them is very difficult and may not be possible.
Currently, the individual devices inside a CV are not aware of any Army mission requirements and its usage scenarios. Even though the devices have a built-in PM functions, the device manufacturers do not develop any CV specific PM solution to respond to a globally controlled CV‘s PM strategy. The manufacturers minimally provide software Application Programming Interfaces (API) to execute a desired PM function remotely, such as transitioning a device‘s power state to a sleep or standby mode. The individual devices have unique PM policies to control its power usage, but, again they may not be able to align with the vehicle level PM strategy unless a global intelligent PM solution and its architecture exists.
6.2 Proposed Software Architecture In this section, the author proposes IPMSA using three topics i.e., operating environment,
IPMSA components, and the algorithms. The IPMSA defines three PM global rules and it organizes all its software components to work with it and provides an automatic intelligent PM function. The rules are 1) power off faulty and idle devices during abnormal vehicle parameters detection, 2) On demand power on the required devices per CV‘s function performed, and 3) transition idle devices to a lower power state when the vehicle is operating at its normal conditions. Fig.6.2.1 described the IPMSA operational flow.
The IPMSA has the following intelligent approaches when compared with standard approaches described in Chapter 2.
1. Automated vehicle data collection and its processing algorithms using the distributed SOA software components and a centralized remote controlled PM function.
2. Individual devices detect and notify their idle and the fault states. 3. A vehicle level configuration enables or disables a PM function and prevents the PM
function from powering off the device when it is idle. 4. Minimum cost overhead due to reuse of existing CV software components and its
integration with the new IPMSA components.
6.2.1 Operating Environment
This section describes IPMSA operating environment. A CV functions using a group of networked devices. During a mission, the software components collaborate and achieve the mission intended functions using one or more LANs inside a CV. In general, the non-automotive devices inside a CV use Ethernet networks, and the software components use Common Object Request Broker Architecture (CORBA) for dynamic data interchanges between them. The CORBA is from the
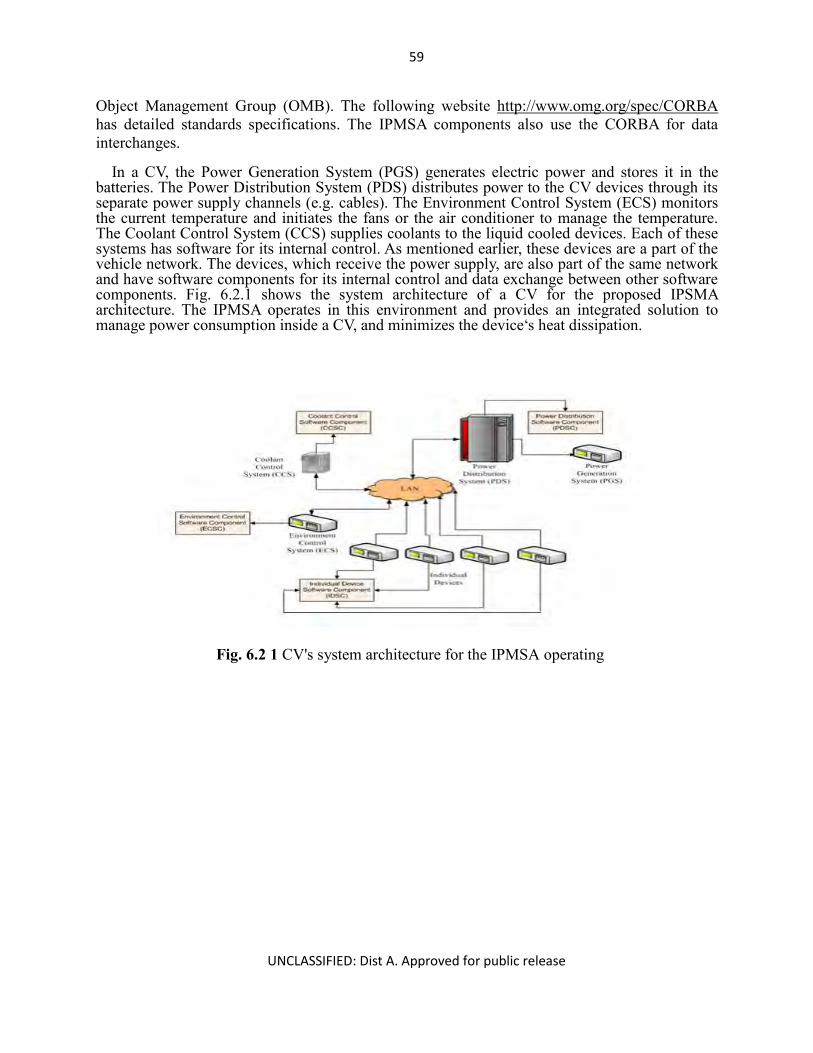
59
UNCLASSIFIED: Dist A. Approved for public release
Object Management Group (OMB). The following website http://www.omg.org/spec/CORBA has detailed standards specifications. The IPMSA components also use the CORBA for data interchanges.
In a CV, the Power Generation System (PGS) generates electric power and stores it in the batteries. The Power Distribution System (PDS) distributes power to the CV devices through its separate power supply channels (e.g. cables). The Environment Control System (ECS) monitors the current temperature and initiates the fans or the air conditioner to manage the temperature. The Coolant Control System (CCS) supplies coolants to the liquid cooled devices. Each of these systems has software for its internal control. As mentioned earlier, these devices are a part of the vehicle network. The devices, which receive the power supply, are also part of the same network and have software components for its internal control and data exchange between other software components. Fig. 6.2.1 shows the system architecture of a CV for the proposed IPSMA architecture. The IPMSA operates in this environment and provides an integrated solution to manage power consumption inside a CV, and minimizes the device‘s heat dissipation.
Fig. 6.2 1 CV's system architecture for the IPMSA operating
environment

60
UNCLASSIFIED: Dist A. Approved for public release
6.2.2 IPMSA Components This section describes the overall operation of the IPMSA architecture to achieve the PM
objectives, and then describes the individual components in detail. The IPMSA has the following software components
1. Intelligent Power Manager Database (IPMD) 2. Device Manager (DMC) 3. Intelligent Power Manager (IPMC) 4. Power Distribution (PDSC) 5. Environment Control (ECSC) 6. Coolant Control (CCSC) 7. Individual Device Software (IDSC)
6.2.3 IPMSA Operation Fig. 6.2.2 shows the high level IPMSA operation. During a mission, when a CV starts, the
PGS generates electricity and the PDS distributes power to its critical devices such as workstation computers and its associated display devices. The IPMSA activates its components and starts implementing the intelligent PM functions as described in the following paragraphs.
The IPMSA powers on the required devices when the users use their workstation to initiate a CV function. After completing this function and as soon as the devices are idled, the IPMSA removes power supply from them.
The IPMSA identifies abnormal temperature, coolant usage, and power usage, faulty or idle devices and removes power supply from them and the CV‘s mission continues.
If the abnormal conditions are repeating and the IPMSA did not find any idle or faulted devices, and if the air conditioner has sufficient refrigerant, then IPMSA increases air conditioners cooling cycle to cool the vehicle. If the air conditioner is running low on the refrigerant, IPMSA takes no PM action and the CV‘s mission continues.
When the devices show fault signs, the IPMSA evaluates fault indicator and it removes the device‘s power if the fault code is critical and it indicates the device as non-operational.
Fig.2.2.3 shows the software architecture diagram with some high-level data flow between them.
During the IPMSA operation, the air conditioner performs its own cooling cycle, but the IPMSA reduces its frequency as the temperature is dropping when the devices are shutting down. If the devices are not shutdown, the air conditioner works its cycle based on the temperature.
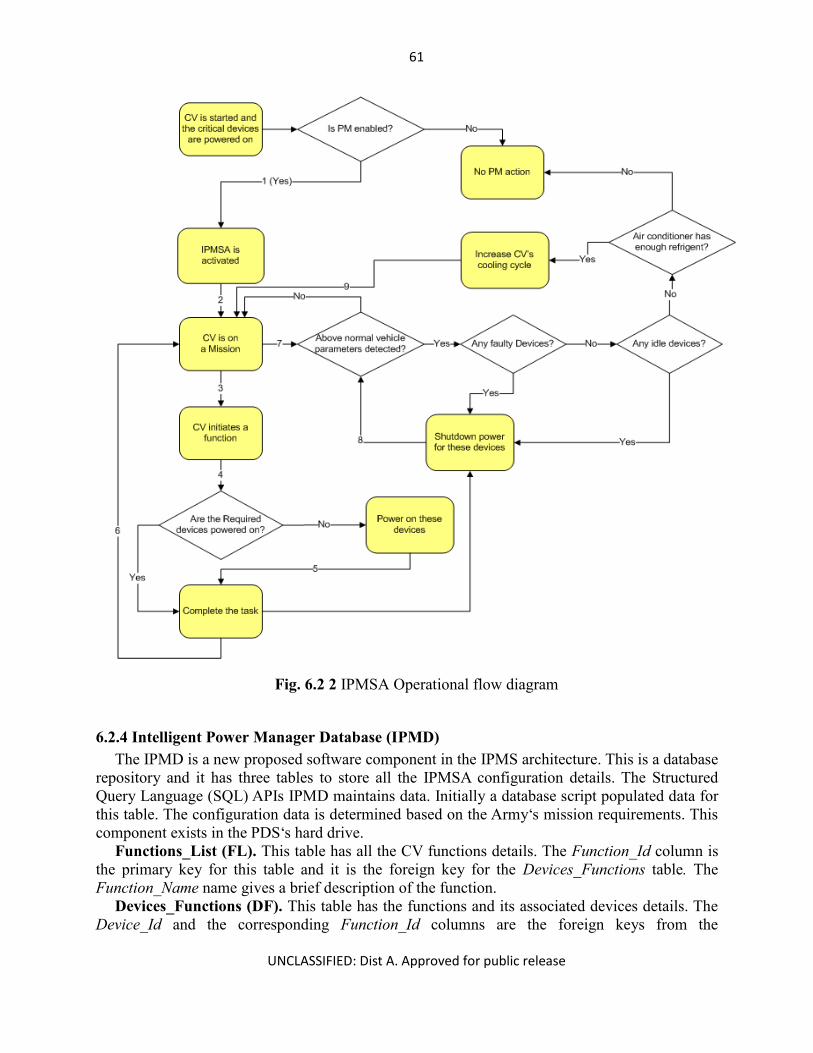
61
UNCLASSIFIED: Dist A. Approved for public release
Fig. 6.2 2 IPMSA Operational flow diagram
6.2.4 Intelligent Power Manager Database (IPMD) The IPMD is a new proposed software component in the IPMS architecture. This is a database
repository and it has three tables to store all the IPMSA configuration details. The Structured Query Language (SQL) APIs IPMD maintains data. Initially a database script populated data for this table. The configuration data is determined based on the Army‘s mission requirements. This component exists in the PDS‘s hard drive.
Functions_List (FL). This table has all the CV functions details. The Function_Id column is the primary key for this table and it is the foreign key for the Devices_Functions table. The Function_Name name gives a brief description of the function.
Devices_Functions (DF). This table has the functions and its associated devices details. The Device_Id and the corresponding Function_Id columns are the foreign keys from the

62
UNCLASSIFIED: Dist A. Approved for public release
Device_Configuration and the Functions_List tables, respectively. Device_Configuration (DC). This table has all the CV devices details. The Device_Id
column is the primary key for this table. The Device_Name column gives a brief description of the devices. The Power_Off column indicates if a given device ―can be powered off‖ during an IPMSA operation. The values for this column are either true or false. The Startup_Time column sets the actual startup time for a given device. This column‘s value is in seconds. The Critical_Fault_Code column indicates the fault code for the faulty and not operational devices. The value for this column is pre determined based on a given device‘s critical fault codes. This column has an integer value.
IPM_Configuration (SC). This table has all the IPMSA operations configuration details. The Optimum_Temp column indicates the optimum vehicle temperature in degrees Fahrenheit and this column has an integer value. The Coolant_Threshold column indicates the coolant usage threshold in percentage and has an integer value. The Power_Threshold column indicates the power usage threshold in percentage and has an integer value. The TurnOff_PM column indicates intelligent PM function is ―enabled‖ or ―disabled.‖ The values for this column are either true or false. If this column is set to false, the IPMSA components do not perform any PM functions. The StartUp_Time_Limit column sets start up time limit for a device in integer seconds. If a given device‘s start up time is more than what is set in this column, the IPMSA does not shut the power for this device when it is idle. The Refrigerent_Threshold column sets the refrigerant threshold value in integer percentage. If the air conditioner has refrigerant less than the value set in this column, the IPMSA does not indicate ECSC to increase its cooling cycle.
6.2.5 Device Manager Component (DMC) The DMC is a new software component in the proposed IPMS architecture. This component
exists in the PDS‘s hard drive. When the DMC initializes, it reads the SC table and stores the Optimum_Temp (To), Coolant_Threshold (Co) and Power_Threshold (Po) columns values in its local variables. It also reads the TurnOff_PM column and determines if a given PM function is disabled or not. If the value is false, then DMC executes no PM function. Initially, in all the IPMSA components, except DMC, until the DMC broadcasts the enable PM function, the devices disables the PM functions.
Every time the DMC reads the SC table, it invokes the following. 1. setOptimumTemp (String temp) method on the ECSC and sends ‗To‘ value to it. 2. setCoolantThreshod (int threshold) method on the CCSC and sends ‗Co‘ value to it. 3. setPowerThreshold (int threshold) method on the PDSC and sends ‗Po‘ value to it. 4. setPMOff(boolean pm) method on every software component in the IPMSA to
indicate if the PM is enabled or disabled for this session. The methods such as getOptimumTemp (), getPowerThreshold (), and getCoolantThreshold ()
allow other IPMSA components to get ‗To‘, ‗Po‘, and ‗Co‘ values, respectively. The refresh () method allows DMC to refresh its configurations when the SC table columns
are updated. The turnOffDevice (int deviceId) method allows IPMC to turn off a device‘s power supply
based on a given device Id. The DMC invokes turnOffDevice (int deviceId) in the PDSC and turn off a device‘s power supply.
The turnOnDevicesFor (int functionId) method retrieves the device ids for a given functionId from the DF table and then for each of those devices, and it invokes the turnOnDevice (int deviceId) method to supply power from PDSC. The IDSCs when it is executing a given CV
63
UNCLASSIFIED: Dist A. Approved for public release
function. The faultCodeDevice (int deviceId, int faultCode) method allows a given IDSC to indicate a
given device‘s fault code. The DMC uses the faultCode and invokes IPMC‘s evaluateFault (int deviceId, int faultCode) method. The IPMC evaluates it and takes proper actions. If it receives a true value from IPMC, it considers the device as a powered off else it means that IPMC did not take any action.
The highTemperature () method allows ECSC to indicate the high temperature condition inside the CV. The ECSC invokes this method when the SC table has enabled PM function. When the high temperature condition is set, the DMC invokes its evaluatePMStrategy () method and performs an intelligent PM action.
The lowPowerSupply () method allows PDSC to indicate the low power supply condition inside the CV. The PDSC invokes this method when the SC table has enabled PM function. When the low power supply condition is set, the DMC invokes its evaluatePMStrategy () method and performs a Intelligent PM action.
The lowCoolantSupply () method allows CCSC to indicate the low coolant supply condition. The CCSC invokes this method when the SC table has enabled PM function. When the low coolant supply condition is set, the DMC invokes its evaluatePMStrategy () method and performs a Intelligent PM action.
The evaluatePMStrategy () method allows DMC to evaluate a PM strategy when ECSC, PDSC, and CCSC indicate abnormal vehicle conditions. In this method, the DMC invokes getCurrentFault () and amIIdle () methods on each of the IDSCs, and then it uses the returned values to further evaluate it. First, it invokes IPMC‘s evaluateFault (int deviceId, int faultCode) method. The IPMC returns a true value for a powered off device. If the value was false, then DMC invokes IPMC‘s evaluateDevice (int deviceId) method. If the IPMC returns a true value that means the device is powered off else the DMC invokes the getAvailableRefrigent() method on the ECSC. If the refrigerant value is more than the value set in Refrigerent_Threshold column of the SC table, the DMC then invokes the increaseCoolingCycle () method on the ECSC to increase its cooling cycle to cool the vehicle. If the available refrigerant is low, then it takes no PM action.
The deviceIsIdle (int deviceId) method allows a given IDSC to indicate its host device‘s idle condition. The DMC uses the deviceId and invokes IPMC‘s evaluateDevice (int deviceId) method. The IPMC evaluates it and takes proper actions. If it receives a true value from IPMCfor a powered off device else no action was taken from the IPMC.
During a mission, sometimes, there are no idle or faulted devices. In this situation, if the vehicle parameters are showing abnormal conditions, the DMC invokes getAvailableRefrigent() method on the ECSC. If the refrigerant value is more than the value set in Refrigerent_Threshold column of the SC table, then the DMC invokes increaseCoolingCycle () on the ECSC method to increase its cooling cycle to cool the vehicle. If the available refrigerant is low, it takes no PM action.
6.2.6 Intelligent Power Manger (IPMC) The IPMC is another new software component in the proposed IPMS architecture. This
component installs in the PDS‘s hard drive. The IPMC provides the following methods to allow DMC to execute it.
The evaluateFault (int deviceId, int faultCode) method allows DMC to evaluate a device‘s fault condition. This method reads the DC table and retrieves the Critical_Fault_Code column

64
UNCLASSIFIED: Dist A. Approved for public release
value for the deviceId. The IPMC then utilizes the IPMA algorithm and determines if a given fault is critical or not. If the device is faulty then it invokes turnOffDevice (int deviceId) method on the DMC to turn off the power supply for this device. It compares the Critical_Fault_Code value with the actual fault code sent from the device to determine if this code is valid enough to power off the device. If the IPMC determines that the code is not a critical code then it returns a false value to indicate a ―not powered off‖ device. It returns a true value for the powered offdevice.
The evaluateDevice (int deviceId) method allows the DMC to evaluate a device‘s settings before cutting its power supply. This method reads the DC table and retrieves the Power_Off and Startup_Time column values for the deviceId. If the Power_Off value is set to true, then it checks the Startup_Time value. If it is less than the value set in the StartUp_Time_Limit column of the SC table, then it invokes the turnOffDevice (int deviceId) method on the DMC to turn the power supply for this device. The IPMC returns a false value to indicate a not powered off device and a true value for the powered off device.
6.2.7 Power Distribution (PDSC) The PDSC is an existing software component, which performs PDS‘s internal power
distribution functions. The IPMS architecture modifies this component. The modifications are as follows.
The setPowerThreshold () method allows DMC to set the ‗Po‗value in PDSC. setPMOff(boolean pm) method allows DMC to set the PM function enabled or disabled value.
If the PM function is disabled, this component does no PM function. Until the DMC invokes this method and changes the value, the IPMSA disables the PM function in this component.
The turnOffDevice (int deviceId) method allows DMC to inform PDSC to turnoff the power supply for the given deviceId.
The turnOnDevice (int deviceId) method allows DMC to inform PDSC to supply power for the given deviceId. The PDSC then uses its internal controls and turns off power supply for this device.
The getCurrentPowerSupply() method allows IPMSA components to get the current available power supply reading.
The PDSC invokes DMC‘s lowPowerSupply () method when the current available power supply is lower than ‗Po‘ value set from the DMC.
6.2.8 Coolant Control (CCSC) The CCSC is an existing software component, which performs CCS‘s internal coolant
distribution functions. The IPMS architecture modifies this component. The modifications are as follows.
The setCoolantThreshod () method allows DMC to set the ‗Co‗value in CCSC. The setPMOff(boolean pm) method allows DMC to set the PM function enable or disable. If
the PM function is disabled, this component does no PM function. Until the DMC invokes this method and changes the value, the IPMSA disables the PM function in this component.
The getCurrentCoolant () method allows IPMSA components to get the current available coolant reading.
The CCSC invokes DMC‘s lowCoolantSupply () method when the current available coolant supply is lower than ‗Co‘ value set from the DMC.

65
UNCLASSIFIED: Dist A. Approved for public release
6.2.9 Environment Control (ECSC) The ECSC is an existing software component, which performs ECS‘s internal environment
control functions. The IPMS architecture modifies this component. The modifications are as follows.
The setOptimumTemp () method allows DMC to set the ‗To‘ value in ECSC. The setPMOff(boolean pm) method allows DMC to set the PM function enable or disable. If
the PM function is disabled, this component does no PM function. Until the DMC invokes this method and changes the value, the IPMSA disables the PM function in this component.
The increaseCoolingCycle () method allows DMC to inform ECSC to increase the cooling cycle of the air conditioner.
The getAvailableRefrigent() method allows IPMSA components to get the current reading of the available refrigerant. This method returns the available refrigerant in the air conditioner. This method returns the percentage remaining reading.
The getCurrentTemperature() method allows IPMSA components to get the current temperature reading.
The ECSC invokes DMC‘s highTemperature () method when the current vehicle temperature is greater than ‗To‘ value set from the DMC.
6.2.10 Individual Devices Software (IDSC) The IDSC is an individual device‘s existing software component, which performs each
device‘s internal functions. The IDSC has a built-in function to log fault codes when the device is not operational. Each IDSC has its unique fault codes, which indicate that the device is not operational. The IPMS architecture modifies this component. The modifications are as follows.
The amIIdle () method allows other IPMSA components to determine if a given IDSC is idle. This method returns IDLE variable‘s value. When a given IDSC is working, the IDLE variable is set to ‗false‘ else, it is set to ‗true‘.
The getCurrentFault () method allows other components to get the current fault codes. This method returns the recent fault code thrown by the IDSC.
The setToSleep () allows DMC to transition a given device to its lower power mode. The setPMOff(boolean pm) method allows DMC to set the PM function to be enabled or
disabled. If the PM function is disabled, this component does no PM function. Until the DMC invokes this method and changes the value, the IPMSA disables the PM function in this component
The IDSC invokes DMC‘s faultCodeDevice (int deviceId, int faultCode) method when the IDSC is faulty. The IPMSA configures each IDSC to invoke DMC for some critical faults.
The IDSC also invokes DMC‘s deviceIsIdle (int deviceId) method to indicate that the device has finished its intended task. Every time the IDSC is operating, it sets IDLE to false.
Some of the IDSCs initiate CV functions for the devices that need power. Then it invokes turnOnDevicesFor (int functionId) method on the DMC. The DMC determines when to power on the devices and then it supplies power to them.

66
UNCLASSIFIED: Dist A. Approved for public release
Fig. 6.2 3 High level IPMSA architecture
6.4 Algorithms (IPMA)
The IPMA has four parts; the first part determines which next three parts to execute. The second part is for the abnormal vehicle conditions determined. The third is for the devices, which are becoming faulty or idle. The fourth is based on the devices that needs power for a given function id.
IPMA Part 1: Update FL, DF, DC, and SC tables; set Pm_Enabled = read PM enabled (); if PM_Enabled == true then enable IPMSA components PM(); set Ot = read optimum temperature from SC (); set Oc = read coolant threshold from SC(); set Op = read power supply threshold from SC (); set Tc = monitor current vehicle temperature (); set Pc = monitor current power supply (); set Cc = monitor current vehicle temperature (); set Di = device i idle (); set Dif = device i faulty (); set Dwi = power devices for a given function id (); if Tc > Ot || Pc > Op || Cc > Oc then set pwrOffList = Use IPMA Part 3; if pwrOffList == 0 then

67
UNCLASSIFIED: Dist A. Approved for public release
set Ra = get available Refrigerant (); set Ri = get refrigerant threshold from SC (); if Ra > Ri then increase CV cooling cycle (); end if end if end if if Di ==true ||Dif ==true then Use IPMA Part 2; end if if Dwi ==true then Use IPMA Part 4; end if else disable IPMSA components PM(); end if When a given IDSC sends a dynamic faulty, idle, or working state notification, the IPMSA
uses the IPMA part 2.
IPMA Part 2:
if Di ==true then set St = get device i’s start up time from DC (); set Li = get start up time limit from SC (); if Si < Li then Turn off device i; end if end if if Dif ==true then Turn off device i; end if
IPMA Part 3: set deviceOff = false; Ot = read optimum temperature from SC(); Oc = read coolant threshold from SC (); Op = read power supply threshold from SC (); Tc = monitor current vehicle temperature (); Pc = monitor current power supply (); Cc = monitor current vehicle temperature (); set pwrOffList = 0; if Tc > Ot || Pc > Op || Cc > Oc then for each IDSC (i= 1 to n devices) do set Df = get IDSCi fault code (); set Cf = get critical fault code IDSCi from DC (); If Df ==Cf then Turn off device i;

68
UNCLASSIFIED: Dist A. Approved for public release
set deviceOff = true; else set Di = get IDSCi state (); if Di ==IDLE then set St = get device i’s start up time from DC (); set Li = get start up time limit from SC (); if Si < Li then Turn off device i; set deviceOff = true; end if end if end if if deviceOff == true then pwrOffList = pwrOffList +1; end if end for end if return pwrOffList;
IPMA Part 4: if Dwi ==true then set devicesList =get devices for a functionid from FL (); for each device in the devicesList do power on device (); device’s IDSC is activated (); end for end if
6.5 Conclusions
In this chapter, the author discussed the various challenges of using existing standard approaches for CV‘s power management solutions to minimize its device‘s power consumption. In this chapter, the author proposed an Intelligent Power Management Software Architecture (IPMSA) for CVs devices by addressing power consumption aspect of network architecture.
In this thesis, the author proposed a cheaper and a simpler IPMSA for CVs. The IPMSA operation is automatic and its operation IPMSA minimizes the power consumption and provide confidence to use the compact power generation system inside a CV.
The intelligent approaches included the following: 1. Automated vehicle data collection and its processing algorithms using the distributed
SOA software components and a centralized remote controlled PM function. 2. Individual devices detect and notify their idle and the fault states. 3. A vehicle level configuration enables or disables a PM function and prevents the PM
function from powering off the device when it is idle. 4. Minimum cost overhead due to reuse of existing CV software components and its
integration with the new IPMSA components.

69
UNCLASSIFIED: Dist A. Approved for public release
As an additional contribution to this topic, in this thesis, the author will investigate further the growing electric power requirement in CV‘s especially during silent-watch surveillance missions. During silent-watch, the CV is stationary, the soldiers turn off its engines, in-vehicle batteries power the systems, and the soldiers cannot recharge the battery easily. The battery‘s life depends on the power consumption of all the sensors and its network in a CV. Reducing the sensors‘ and its network‘s power consumption, increasing their availability, and prolonging the mission duration are the major challenges of a silent-watch.
In general, to minimize a system's power consumption, vendors use Dynamic Power Management (DPM) [69] concepts. Normally, when building a system, vendors use a power management standard known as Advanced Configuration and Power Interface (ACPI) [70] to implement DPM concepts. ACPI standardizes the mechanisms for transitioning a system between its different power states. The vendors build a system that has multiple power states, in which, each state has an associated power consumption level. Typically, a DPM system has the following power states: working (active), idling (steady), sleeping, and off. The working and the idling states consume more power than the sleeping and the powered off states. Although, ACPI is a standard, it does not dictate any intelligence be built into the power management policies to minimize a system's power consumption. The main idea behind a DPM solution is to use the ACPI standard and transition a system's power state to a lower power state when it is experiencing its lower workload periods. All DPM solutions require techniques to determine a system's optimal lower power state and duration of the period at the lower state based on the system‘s workload conditions. For an optimal DPM solution, we need an accurate workload prediction. Many researchers have proposed methods of predicting future workload conditions of a system using many static, dynamic, off-line, and online techniques. Researchers have approached workload predictions using timeout [71] or predictive techniques [25] using adaptive, heuristic, and stochastic methods [69]. Normally, vendors apply DPM solutions to individual components within a system rather than the whole system.
A CV incorporates many different types of sensors and systems thus it is very difficult for vendors to implement a system specific Power Consumption Minimization (PCM) solution. For example, a Wireless Sensor Network (WSN) specific PCM solution is not suitable for other types of systems. A system specific solution makes it very cumbersome for vendors to achieve a PCM during silent-watch. We require intelligent PCM approaches if it is to implement it globally for all the CV‘s systems. The military requires silent-watch specific PCM solutions.
During silent-watch, all systems experience different workloads. Unlike many existing PCM solutions, instead of focusing on determining the future idle period for a system, it would be beneficial if a system were aware of when the new work request may arrive. This concept helps designers to develop intelligent approaches to transition systems to lower power states until the next work arrival time.
A PCM solution for silent-watch must consider workloads of all systems involved in the required silent-watch task to predict an accurate wakeup time for a given system.
In this thesis, the author propose expert knowledge based silent-watch PCM solution i.e., silent-watch system. The silent-watch system provides intelligent PCM techniques and algorithms. We can minimize silent-watch power consumption collectively for all the sensors and sensor network systems used in that mission.

70
UNCLASSIFIED: Dist A. Approved for public release
CHAPTER 7 MATERIALS AND METHODS
7.1 Materials and Methods In this section, the author describes the materials, methods, and the experimental setup for
conducting, validating, and verifying the results of this thesis‘s proposal.
7.1.1 Source of Materials The author collects the background data for this thesis‘s research by conducting extensive
literature review of published papers in Defense Advanced Research Projects Agency (DARPA), Army Research Laboratories (ARL), Army Research Institute (ARI), IEEE, ACM, and SAE journals. In Chapter 2, the author presents a review of various standard approaches used for in-vehicle network architecture for networking, improving software reliability, and complexity predictions, minimizing power consumption, and designing power management architectures. The author uses this review data to identify the challenges in the current approaches. This data serves as the main material for the research.
7.1.2 Method The author describes the methodology used for executing this thesis proposal in Fig 7.1.1. The
figure explains in various steps how the author conducts and validates this thesis research. The numbers on the figure shows the order of execution. In step 1 through 7, the author collects the materials required for the research and develops intelligent approaches. In Step 8 through 14, the author conducts and validates the research proposal and results.
The author works in a loop in steps 1 through 4a until the document findings are sufficient to conduct research and to propose new approaches. In steps 8 through 14, the author again works in a loop until the proposed intelligent approaches are valid and verified.
In step 10, the author builds the experimental set up shown in Fig.7.1.2, and the simulation models using software packages such as Matlab, Fuzzy Logic ToolBox, Power pack toolbox, and Simulink. In this step, the author also builds analytical models to validate the results theoretically. In step 11, the author conducts experiments, and in step 13 and 14, the author analyzes the results and revises the proposed intelligent approaches.

71
UNCLASSIFIED: Dist A. Approved for public release
Fig.7.1.1 methodology for this thesis research execution
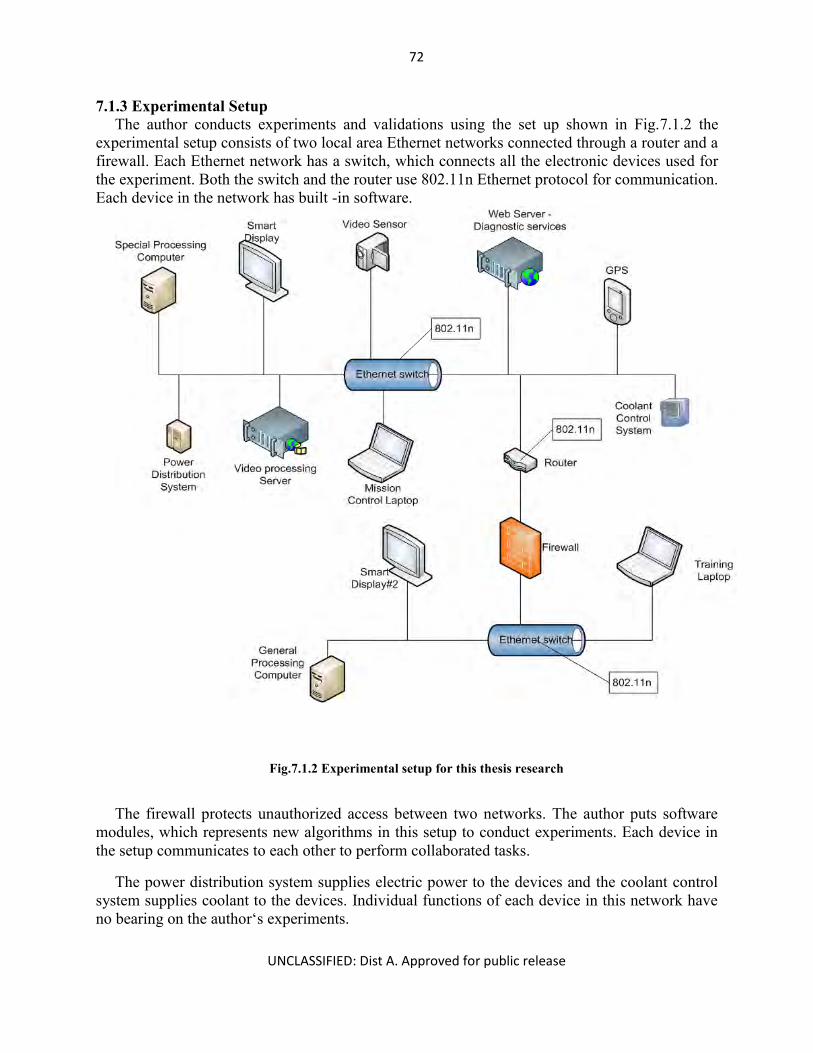
72
UNCLASSIFIED: Dist A. Approved for public release
7.1.3 Experimental Setup The author conducts experiments and validations using the set up shown in Fig.7.1.2 the
experimental setup consists of two local area Ethernet networks connected through a router and a firewall. Each Ethernet network has a switch, which connects all the electronic devices used for the experiment. Both the switch and the router use 802.11n Ethernet protocol for communication. Each device in the network has built -in software.
Fig.7.1.2 Experimental setup for this thesis research
The firewall protects unauthorized access between two networks. The author puts software modules, which represents new algorithms in this setup to conduct experiments. Each device in the setup communicates to each other to perform collaborated tasks.
The power distribution system supplies electric power to the devices and the coolant control system supplies coolant to the devices. Individual functions of each device in this network have no bearing on the author‘s experiments.

73
UNCLASSIFIED: Dist A. Approved for public release
CHAPTER 8 – SUMMARY In this dissertation proposal, the author describes the need for efficient network architecture
for solving any practical problems that use software, electronic devices, and LAN. In Chapter 1, the author explains that the network architecture addresses the problem areas of a LAN‘s interoperability and security, software reliability and complexity, and a device‘s power consumption. The author also describes the need for intelligent approaches in the improvements of network architecture to provide an interoperable LAN with reliable and less complex software systems and to minimize power consumption in electronic devices.
This thesis proposal discusses the need for intelligent approaches for improving in-vehicle network architecture of the Army‘s CVs, especially for improving its silent-watch surveillance missions. During silent-watch, the CV is power constrained. In general, the CV is constrained by size weight, and power (SWaP).
In Chapter 1, the author also discusses the fact a CV is susceptible to enemy attacks during ground combat missions and that it needs to perform efficiently for its soldiers during silent-watch missions using the in-vehicle LAN, software, and electronic devices. The author also makes clear that failed interoperability, unreliable and complex software, and power unavailability hinders soldiers‘ performance and can cause mission failure. The author points out that a CV has many challenges in the area of interoperability and power consumption due to vendor specific devices and the Army‘s ad hoc approach to device integration. Therefore, we require intelligent and efficient approaches and methods to improve a CV‘s in-vehicle network architecture. It is an imperative that a CV be capable of successful ground combat missions such as silent-watch.
In this thesis proposal, the author proposes to improve the CV‘s in-vehicle network architecture by providing intelligent approaches to building an interoperable in-vehicle LAN, based on open architecture and standard specifications, to develop metrics and prediction techniques for software reliability and complexity and to develop algorithms and software architecture for minimizing power consumption of electronic devices inside a CV.
Up to date, the author has performed extensive research and proposed several in-vehicle network architecture improvements. This thesis proposal describes the author‘s current work in multiple chapters and noted future contributions of this thesis in the area of PCM algorithms.
Chapter 2 discusses the review of literature examining various standard approaches used in building in-vehicle networking, improving software reliability, and complexity predictions, minimizing power consumption, and designing power management architectures. This review highlights the challenges in the current approaches used in building various aspects of the network architecture. This enables the author to propose intelligent approaches to handling all the challenges highlighted in Chapter 2. This thesis used the fuzzy logic, SOA, and factor analysis techniques to develop intelligent approaches for improving in-vehicle network architecture of CVs.
Chapter 3 describes the author‘s current work in proposing an intelligent approach to developing open architecture based LAN for a CV using nonproprietary solutions to enable interoperability, security, scalability, and performance benefits. This is very important for the in-vehicle network architecture to make sure that the soldiers can perform their tasks efficiently
74
UNCLASSIFIED: Dist A. Approved for public release
with no impacts to a LAN‘s availability, future device integration, and ability of the device vendors to manufacture products to standard specifications. This proposal facilitates economical solutions for integrating additional capabilities for a CV. This LAN proposes network devices that are well within the SWaP restrictions of a CV. The proposed SOA software modules controlled the data security and distribution between the devices. The proposed LAN supports successful combat missions with high availability and faster data transfer than the LAN built using standard approaches.
Chapter 4 discusses the author‘s current work on an intelligent fuzzy logic based approach for investigating IT architecture documents to formulate software reliability metrics and develop reliability prediction algorithms. It is important to conduct software reliability prediction before developing any software. The author proposes a fuzzy logic algorithm to predict software reliability using the results obtained from the analytical models of data handling, fault handling, configuration, and interoperability. This thesis proposal also presents a simulation model to predict software reliability. The author also explains that the prediction is very important for the in-vehicle network architecture to make sure the soldiers can have reliable software to achieve mission success. By using the proposed prediction techniques, project managers can visually see the reliability gap very early in the software development lifecycle. In Chapter 4, the author demonstrates that the network architecture contributes to reliable software by allowing project managers to predict software reliability throughout the development lifecycle and ensure final good software.
Chapter 5 discusses the author‘s current work in intelligent fuzzy logic and factor analysis based approaches to investigating project management documents for software development to formulate software complexity metrics and then develop complexity prediction algorithms. The standard complex mathematical and statistical approaches for AVS complexity based on one source of software historical data and applying it to another may not work for all software. The Army‘s dynamic requirements change requires the management to understand software complexity prediction using easy to understand non-technical factors. Therefore, intelligent and easy to use approaches are required to predict software complexity using non-technical factors. The author discusses the factor analysis approach to reduce the number of factors harvested from various project management documents, and identifies the non-technical factors as software complexity influencing metrics. The author also discusses the intelligent fuzzy logic algorithm to predicting AVS complexity using the results obtained from the factor analysis approach. It is important to predict software complexity before developing any software. All parties involved in a software development project know the proposed metric elements. The author describes that the prediction is very important for the in-vehicle network architecture to make sure the soldiers can have less complex software to achieve successful mission. By providing the complexity prediction techniques, project managers can visually see the gap very early in the software development lifecycle. The author demonstrates that the network architecture could provide less complex software by allowing project managers to predict software complexity throughout the development lifecycle and ensure final less complex software. This thesis proposal also presents a simulation model to predict software complexity.
Chapter 6 describes the author‘s current work on intelligent SOA based approach for investigating and developing Intelligent Power Management Software Architecture (IPMSA) to reduce a device‘s power consumption. The IPMSA lowers implementation cost, overhead, and

75
UNCLASSIFIED: Dist A. Approved for public release
complexity. The author discusses that a CV‘s power consumption during a combat mission dissipates excessive heat and it creates a challenging operational environment for crew and electronic devices. In this thesis, the author proposes a cheaper and a simpler IPMSA for CVs. The IPMSA operation is automatic and its operation minimizes the power consumption and provides confidence in the use the compact power generation system inside a CV. The author demonstrates that minimizing a device‘s power consumption is very important for the in-vehicle network architecture to make sure the devices utilize in-vehicle power efficiently. This is a necessity to handle the CV‘s power availability constraint during a silent-watch mission.
Chapter 6 also discusses the author‘s proposal for future contributions to the thesis. As an additional contribution to this topic, the author investigates further the growing electric power requirement in a CV‘s devices, especially during silent-watch surveillance missions. The author proposes an intelligent approach and algorithms based on a combination of fuzzy logic and other novel methods for investigating silent-watch operations and developing algorithms to minimize electric power consumption of the CV‘s devices. The author plans to propose an expert knowledge based silent-watch PCM solution. This silent-watch system provides intelligent PCM approaches and algorithms. During silent-watch, all devices experience different workloads. Unlike many existing PCM solutions, the author proposes that instead of focusing on determining the future idle period for a system, it would be beneficial if a system were aware of when a new work request may arrive. This concept helps designers to develop new techniques to transition devices to lower power states until the next work request arrives.
Chapter 7 discusses the materials, methods, and the experimental setup for conducting, validating, and verifying the results of this thesis‘s proposal.
76
UNCLASSIFIED: Dist A. Approved for public release
DISCLAIMER Disclaimer: Reference herein to any specific commercial company, product, process, or
service by trade name, trademark, manufacturer, or otherwise, does not necessarily constitute or imply its endorsement, recommendation, or favoring by the United States Government or the Department of the Army (DoA). The opinions of the authors- expressed herein do not necessarily state or reflect those of the United States Government or the DoA, and shall not be used for advertising or product endorsement purposes.
REFFERENCES [1] G. W. Cook, http://www.inetres.com/gp/military/cv/. 2004. [2] S. Zanardelli, ―Energy Storage Requirements & Challenges for Ground Vehicles,‖ ―US
Army TARDEC, Dec. 2009. [3] D. Ahlvin and P. Haley, ―NATO Reference Mobility Model Edition II, NRMM II User‘s
Guide,‖ Technical Report Number GL-92-19, U.S. Army Waterways Figure 9, CRREL Instrumented Vehicle (CIV) Rolling on Snow (top) and Finite Element Model Experiment Station, Corps of Engineers, Vicksburg, MS, December 1992.
[4] A. Immonen and E. Niemela, "Survey of Reliability and Availability Prediction Methods from the Viewpoint of Software Architecture,‖ Software and Systems Modeling, 2007.
[5] S. Mohanta, G. Vinod, A. K. Gosh, and R. Mall, ―An Approach for Early Prediction of Software Reliability,‖ ACM SIGSOFT Software Eng. Notes, vol 35, num. 6, pages 1-9, 2010.
[6] W.Wang, Y.Wu, and M. Chen, ―An Architecture-based Software Reliability Model,‖ Proceedings of the Pacific Rim International Symposium on Dependable Computing, pages 143–150, 1999.
[7] K. Goseva-Popstojanova, K. S. Trivedi. ―Architecture–Based Approach to Reliability Assessment of software systems,‖ Performance Evaluation 45, pages 179-204, 2001.
[8] S. S. Gokhale and K. S. Trivedi, ―Analytical Models for Architecture-based Software Reliability Prediction: A Unification Framework,‖ IEEE Trans. on Reliability, 55(4), pages 578–590, 2006.
[9] N. Nagappan, Williams, L., Vouk, M.A., "Towards a Metric Suite for Early Software Reliability Assessment," International Symposium on Software Reliability Engineering, FastAbstract, Denver,CO, pages 238-239, 2003.
[10] C. Smidts and D. Sova, ―An Architectural Model for Software Reliability Quantification: Sources of Data,‖ Reliability Engineering & System Safety, 64(2), pages 279–290, 1999.
[11] W. Kong, Y. Shi, and C. S. Smidts, "Early Software Reliability Prediction Using Cause-effect Graphing Analysis," The 53rd Annual Reliability and Maintainability Symposium (RAMS 2007), pages 173 - 178, 2007.
[12] S. Yacoub, B. Cukic, and H. H. Ammar, ―A Scenario-Based Reliability Analysis Approach for Component-Based Software,‖ IEEE Transactions on Reliability, vol 53, num. 4, pages 465-480, 2004.

77
UNCLASSIFIED: Dist A. Approved for public release
[13] Tu Honglei, Sun Wei, Zhang Yanan, ―The Research on Software Metrics and Software Complexity Metrics‖, 2009 International Forum on Computer Science-Technology and Applications.
[14] K. Kearney et al, ―Software Complexity Measurement‖, ACM comm., Vol.29, Nov. 1986.
[15] Department of Defense, ―A Guide for Achieving Reliability, Availability, and Maintainability‖, Dimensions,‖ DoD Guide, http://www.acq.osd.mil/sse/docs/RAM_Guide_080305.pdf. 2005.
[16] T.J. McCabe, ―Complexity Measure‖, IEEE Trans. Soft Eng., vol. SE-2, no. 4, pp. 308-320, Dec. 1976.
[17] Halstead, and H. Maurice, ―Elements of Software Science‖, Elsevier North-Holland, New York, 1977.
[18] Henry and Kafura,‖Software Structure Metrics Based on Information Flow‖, IEEE Trans. Soft Eng., vol. SE-7, no. 5, pp. 510-518, Sep. 1981.
[19] W. Harrison, ‖An Entropy Based Software Complexity Measure‖, IEEE Trans. Soft Eng., vol. SE-18, no. 11, pp. 1025-1029, Nov. 1992.
[20] Jingqiu Shao and Yingxu Wang, ―A New Measure of Software Complexity based on Cognitive Weights‖, Canadian Journal of Electrical and Computer Eng., vol.28, no.2, pp. 1333-1338, Apr. 2003.
[21] Khoshgoftaar and Munson, "Applications of a Relative Complexity Metric for Software Project Management,‖ Journal of Systems Software, vol. 12, no. 3, pp. 283-293, Jul. 1990.
[22] S. Gary, P. Ippolito, G. Gerosa, C.Dietz, J.Eno, and H.Sanchez "PowerPC 603, a Microprocessor for Portable Computers," IEEE Design and Test of Computers, pp. 14-23, 1994.
[23] P. Greenawalt, ―Modeling Power Management for Hard Disks,‖ Proc. Int‘l Workshop Modeling, Analysis, and Simulation for Computer and Telecomm. Systems, pp. 62-65, 1994.
[24] Y.-H. Lu, E.-Y. Chung, L. Benini, and G. De Micheli, ―Quantitative Comparison of Power Management Algorithms,‖ Proc. DATE— Design Automation and Test in Europe Conf. and Exhibition, pp. 20-26, 2000.
[25] M. Srivastava, A. Chandrakasan, and R. Brodersen, ―Predictive System Shutdown and Other Architectural Techniques for Energy Efficient Programmable Computation,‖ IEEE Trans. VLSI Systems, vol. 4, no. 1, pp. 42-55, Mar. 1996.
[26] C.-H. Hwang and A. Wu, ―A Predictive System Shutdown Method for Energy Saving of Event-Driven Computation,‖ Proc. Int‘l Conf. Computer-Aided Design, pp. 28-32, 1997.
[27] T. ˇSimunic´, L. Benini, P. Glynn, and G. De Micheli, ―Event-driven Power Management ,‖ IEEE Trans. Computer-Aided Design of Integrated Circuits and Systems, pp.840-857, Nov. 1999.
[28] E.-Y. Chung, L. Benini, and G. D. Micheli, ―Dynamic Power Management Using Adaptive Learning Tree,‖ Proc. Int‘l Conf. Computer-Aided Design, IEEE CS Press, pp. 274-279, 1999.
[29] E.-Y. Chung, L. Benini, A. Bogliolo, Y.-H. Lu, and G. D. Micheli, "Dynamic Power Management for Nonstationary Service Requests," IEEE Trans. Computers, pp. 1345–1361, November 2002.
[30] L.F. P. Pollo, J. -Porto, ―A Network-oriented Power Management Architecture,‖ Proc. Integrated Network Management 2003 (IFIP/IEEE Eighth International Symposium on ‘03), pp. 693-706, March 2003.
78
UNCLASSIFIED: Dist A. Approved for public release
[31] T. Enokido, A. Aikebaier, and M. Takizawa, "A Model for Reducing Power Consumption in Peer-to-Peer Systems,‖ IEEE Systems Journal, vol.4, no.2. June 2010.
[32] Y. Zhu, and V. C. M. Leung, ―Efficient Power Management for Infrastructure IEEE 802.11 WLANs,‖ IEEE Trans. Wireless Communications, vol. 9, no. 7, pp. 2196–2205, July 2010.
[33] Y. Luo, J. Yu, J. Yang, and L. N. Bhuyan, "Conserving Network Processor Power Consumption By Exploiting Traffic Variability," ACM Transactions on Architecture and Code Optimization, vol. 4, no. 1, Article 4, March 2007.
[34] M. Lee, Y. Uhm, Y. Kim, G. Kim, and S. Park, ―Intelligent Power management device with Middleware based living pattern learning for power reduction,‖ IEEE Trans. Consumer Electronics, vol.55, no.4, pp. 2081-2089, August 2009.
[35] C. Alippi and G. Anastasi, ―An Adaptive Sampling Algorithm for Effective Energy Management in Wireless Sensor Networks with Energy-Hungry Sensors,‖ IEEE Trans. Instrumentation and Measurement, vol.59, no. 2, Feb. 2010.
[36] C. J. Merlin and W. B. Heinzelman, "Duty Cycle Control for Low-Power-Listening MAC Protocols," IEEE Trans Mobile Computing, vol.9, no. 11, Nov. 2010.
[37] C-M. Chao and Y-W Lee, "A Quorum-Based Energy-Saving MAC Protocol Design for Wireless Sensor Networks," IEEE Trans Vehicular Tech. vol. 59, no. 2, Feb 2010.
[38] S. Hong, Y. Won, and D. I. Kim "Significance-Aware Channel Power Allocation for Wireless Multimedia Streaming," IEEE Trans Vehicular Tech., vol 59, no.6, Jul 2010.
[39] E. Hwang, K. J. Kim, J. J. Son, and B. D. Choi, "The Power-Saving Mechanism With Periodic Traffic Indications in the IEEE 802.16e/m", IEEE Trans Vehicular Tech., vol. 59, no. 1, January 2010.‖
[40] Y-H Zhu, and V.C.M. Leung, ―Efficient Power Management for Infrastructure IEEE 802.11 WLANs,‖ IEEE Trans. Wireless Communications. vol. 9, no. 7, pp. 2196–2205, July 2010, doi: 10.1109/TWC.2010.07.081493
[41] D. Wang, , X. Wang, and X. Cai, "Optimal Power Control for Multi-User Relay Networks over Fading Channels", IEEE Trans Wireless Comms., vol. 10, no. 1, Jan. 2011.
[42] M. Lee, Y. Uhm, Y. Kim, G. Kim, and S. Park, ―Intelligent Power management device with Middleware based living pattern learning for power reduction‖, IEEE, August 2009.
[43] "Conserving Network Processor Power Consumption By Exploiting Traffic Variability", Y. Luo, J. Yu, J. Yang, and L. N. Bhuyan, ACM Transactions on Architecture and Code Optimization, Vol. 4, No. 1, Article 4, Publication date: March 2007.
[44] A. Sinha and A. Chandrakasan, ―Dynamic power management in wireless sensor networks,‖ IEEE Des. Test Computer, vol. 18, pp. 62–74, Mar./Apr. 2001, doi: 10.1109/54.914626.
[45] S.P. Bingulac, ―A Power Management Architecture for Sensor Nodes,‖ Pending publication for Proc. WCNC 2007.
[46] J. Han, I. Ha, and K-Roh Park, "Service-oriented power management for an integrated multi-function home server," IEEE Trans. Consumer Electronics, vol. 53, no. 1, pp. 204-208, Feb. 2007, doi: 10.1109/TCE.2007.339526.
[47] L.F. Pollo and J-Porto, ―A Network-oriented Power Management Architecture,‖ Proc. Integrated Network Management 2003 (IFIP/IEEE Eighth International Symposium on ‘03), pp. 693-706, March 2003.
79
UNCLASSIFIED: Dist A. Approved for public release
[48] E. Gelenbe and S. Silvestri, "Reducing power consumption in wired networks,‖
Computer and Information Sciences, 2009. ISCIS 2009. 24th International Symposium on DOI:10.1109/ISCIS.2009.5291829", pp. 292 – 297, September 2009.
[49] T. Enokido, A. Aikebaier, and M. Takizawa, ―A Model for Reducing Power Consumption in Peer-to-Peer Systems", IEEE Systems Journal, vol.4, no.2. June 2010.
[50] R. Bianchini and R. Rajamony, ―Power and energy management for server systems,‖
IEEE Computer, vol. 37, no. 11, pp. 68–74, Nov. 2004. [51] T. Heath, B. Diniz, E. Carrera, W. Meira, and R. Bianchini, ―Energy conservation in
heterogeneous server clusters,‖ in ACM SIGPLAN 2005 Symposium on Principles and Practice of Parallel Programming, 2005.
[52] "Modeling and reducing power consumption in large IT systems ", Singh, N.; Rao, S.; Systems Conference, 2010 4th Annual IEEE DOI: 10.1109/SYSTEMS.2010.5482354 2010 , Page(s): 178 – 183.
[53] P. Luskin and R. Berlin, ―Systems Engineering Methodology for Fuel Efficiency and its Application to the TARDEC Fuel Efficient Demonstrator (FED) program‖, 2010 NDIA ground vehicle Systems Engineering and Technology symposium, August 17 2009.
[54] J. Park, Z.Chen, L.Kiliaris, M. L. Kuang, and M. Abul Masrur, A. M. Phillips, and Y.L. Murphey, "Intelligent Vehicle Power Control Based on Machine Learning of Optimal Control Parameters and Prediction of Road Type and Traffic Congestion", Trans. Vehicular Technology, vol. 58, no. 9, Nov. 2009.
[55] M. Koot, J. T. B. A. Kessels, B. de Jager, W. P. M. H. Heemels, P. P. J. van den Bosch, and M. Steinbuch, "Energy Management Strategies for Vehicular Electric Power Systems," IEEE Trans. Vehicular Technology, vol. 54, no. 3, May 2005.
[56] C. Zhang, A. Vahidi, P. Pisu, X. Li, and K. Tennant, "Role of Terrain Preview in Energy Management of Hybrid Electric Vehicles," IEEE Trans. Vehicular Technology, vol. 59, no. 3, March 2010.
[57] Yi L. Murphey, M. A. Masrur, D. E. Neumann, "Exploring Cognitive Knowledge for Intelligent Vehicle Power Management in Military Mission Scenarios," NDIA ground vehicle Systems Engineering and Technology symposium, August 2009.
[58] A. Soltani and A. Akbar Safavi, ‖A Novel optimal Energy Management Strategy Based on Fuzzy Logic for a Hybrid Electric Vehicle,‖ ICVES 2009.
[59] E. McDonnell and B. Jackman, ―Software-Based Vehicle Dynamic Power Management System,‖ SAE International Technical papers, Apr. 2005.
[60] Q. Gong, Y. Li, and Z. Peng "Trip-Based Optimal Power Management of Plug-in Hybrid Electric Vehicles," IEEE Trans. Vehicular Technology, vol. 57, no. 6, pp. 3393-3401, Nov. 2008, doi: 10.1109/TVT.2008.921622.
[61] Zadeh, L. A., ―Fuzzy Logic = Computing with Words," IEEE Trans. Fuzzy Systems, vol.4, no.2, May 1996.
[62] Zadeh, L.A., ―Is There a Need for Fuzzy Logic‖, Information Sciences, vol.178, pp. 2751-2779, 2008.
[63] Zadeh, L. A., ―Fuzzy Sets,‖ Inform. Contr., vol.8, no.3, pp.338-353, 1965. [64] Mendel, J. M., ―Fuzzy logic systems for engineering: A tutorial," Proc. of the IEEE,
Special Issue on Fuzzy Logic in Engineering Applications, vol.83, no.3, pp.345–377, March 1995.
80
UNCLASSIFIED: Dist A. Approved for public release
[65] D. H. Nam and H. Singh,‖ Pattern Recognition using Multivariate-based Fuzzy Inference Rule Reduction on Neuro Fuzzy‖, Fuzzy Information Processing Society, pp. 573- 578, Jun 2005.
[66] M. Blain, ―Ground Vehicle Power & Mobility (GVPM)‖, TARDEC, April 15 2008, Advanced Planning Briefing for Academia.
[67] ―Report of the Defense Science Board Task Force on DoD Energy Strategy ―More Fight – Less Fuel‖ ―, February 20098, Office of the Under Secretary of Defense For Acquisition, Technology, and Logistics.
[68] S. B.-Curtin,"Power for the Warfighter," DARPA Tech 2005, Microsystems Technology Office, August 2005.
[69] L. Benini, A. Bogliolo, and G. D. Micheli, ―A Survey of De-sign Techniques for System-Level Dynamic Power Management,‖ IEEE Trans. Very Large Scale Integr. (VLSI) Syst., vol. 8, no. 3, pp. 299–316, Jun. 2000, doi: S 1063-8210(00)04347-X.
[70] Intel, Microsoft, and Toshiba, ―Advanced Configuration and Power Interface Specification,‖ http://www.intel.com/ial/ powermgm/specs.html. 1996.
[71] A. R. Karlin, M. S. Manasse, L. A. McGeoch, and S. Owicki, ―Competitive Randomized Algorithms for Non-Uniform Problems,‖ Proc. 1st Annu. ACM-SIAM SODA, pp. 301–309, 1990