integrity: a semi-mechanistic model for stress corrosion cracking … · 2012-11-18 · integrity:...
TRANSCRIPT

A. AECL EACLAECL CANDU EACL CANDU
INTEGRITY: ASemi-Mechanistic Model forStress Corrosion Cracking ofFuel
IAEA Technical CommitteeMeeting on Water Reactor FuelElement Modelling at HighBurnup and its ExperimentalSupport
Windermere, United Kingdom
AECL-1 0792
by M. Tayal*, K. Hallgrimson*,J. MacQuarrie*, R Alavi*, S. Sato*,Y. Kinoshita** and T. Nishimura**
AECL, Mississauga, Ontario, CanadaElectric Power Development Company LimitedToyko, Japan
1994 Sept. 19-23
AECL CANDU2251 Speakman DriveMississauga, OntarioCanada L5K1B2
19-23 Sept, 1994
EACL CANDU2251, rue SpeakmanMississauga (Ontario)Canada L5K 1B2

a
Q Atomic Energy of Canada Limited © tnergie atomique du Canada limitse
94222V450Tayas94an2

AECL EACLAECL CANDU EACL CANDU
INTEGRITY: ASemi-Mechanistic Model forStress Corrosion Cracking ofFuel
IAEA Technical CommitteeMeeting on Water Reactor FuelElement Modelling at HighBurnup and its ExperimentalSupport
Windermere, United Kingdom
AECL-10792
by M. Tayal, K. Hallgrimson,J. MacQuarrie, P. Alavi, S. Sato,Y. Kinoshita and T. Nishimura
Abstract
In this paper we describe the features, validation, and illustrative applications of a semi-mechanistic model.INTEGRITY, which calculates the probability of fuel defects due to stress corrosion cracking. The modelexpresses the defect probability in terms of fundamental parameters such as local stresses, local strains, andfission product concentration. The assessments of defect probability continue to reflect the influences ofconventional parameters like ramped power, power-ramp, burnup and Canlub coating. In addition, theINTEGRITY model provides a mechanism to account for the impacts of additional factors involving detailedfuel design and reactor operation. Some examples of the latter include pellet density, pellet shape and size,sheath diameter and thickness, pellet/sheath clearance, coolant temperature and pressure, etc. The model hasbeen fitted to a database of 554 power-ramp irradiations of CANDU fuel with and without Canlub. For thisdatabase the INTEGRITY model calculates 75 defects versus 75 actual defects. Similarly good agreementswere noted in the different sub-groups of the data involving non-Canlub, thin-Canlub, and thick-Canlub fuel.Moreover, the shapes and the locations of the defect thresholds were consistent with all the above defects aswell as with additional 14 ripple defects that were not in the above database. Two illustrative examplesdemonstrate how the defect thresholds are influenced by changes in the internal design of the fuel elementand by extended burnup.
1993 Sept. 19-23
AECL CANDU2251 Speakman DriveMississauga, OntarioCanada L5K1B2
19-23 Sept. 1993
EACL CANDU2251, rue SpeakmanMississauga (Ontario)Canada L5K 1 B2

A>si AECL EACLAECLCANDU EACLCANDU
INTEGRITY: Modelesemi-mecaniste de lafissuration par corrosion souscontrainte du combustible
Reunion du Comit6 technique de1'AIEA sur la modelisation del'element combustible du reacteurA eau aux fortes combustions et lesexp~iences a 'appui.
Windermere, Royaume-Uni
AECL-1 0792
par M. Tayal, K. Hallgrimson,J. MacQuarrie, P. Alavi, S. Sato,Y. Kinoshita et T. Nishimura
Resume
Le present ouvrage decrit Ics caracteristiques, la validation et les applications typiques d'un modelesemi-mdcaniste appele 4INTEGRITY* qui calcule la probabilite des ruptures de gaine causees par lafissuration par corrosion sous contrainte. Le modele exprime cette probabilite par des parametresfondamentaux, par exemple les contraintes locales, la deformation locale et la concentration de produits defission. Les calculs de probabilite de defaillance (rupture de gaine) tiennent toujours compte des parametresclassiques commes les variations de la puissance par rampes, les rampes de puissance, la combustionmassique et l-cnrobage Canlub. Dc plus, le modelc RNTEGRITY prend en compte dans ses calculs d'autresfacteurs touchant par exemple l'etude detaille du combustible et le fonctionnement du racteur. Parmi cesderniers facteurs, on retrouve la densitd de la pastille, la forme et la taille de la pastille, le diametre etI'epaisseur de la gaine, le jeu entre les pastilles et la gaine, la temperature et la pression du caloporteur, etc.Le modele utilise une base de donnees contenant les donnees de 554 irradiations du combustible CANDUavec et sans enrobage Canlub, dans des conditions de variation continue de la puissance. Utilisant cette basede donndes, le modele a calculd 75 defaillances thdoriques contre 75 defaillances rdelles. Des rsultats toutaussi bons ont dtd obtenus dans les differents sous-groupes de donnees lids a 'absence d'enrobage Canlub, aune mince couche de Canlub et a une epaisse couche de Canlub. Par ailleurs, la forme et 'emplacement desseuils de defaillance etaient exacts pour toutes les ddfaillances susmentionnces ainsi que pour 14 autresdefaillances secondaires qui ne figuraient pas dans la base de donndes. On donne deux exemples pourillustrer comment les modifications apportdes a la structure interne de l'dldment combustible et comment lesfortes combustions influent sur les seuils de defaillance.
1993 Sept. 19-23 Du 19 au 23 sept.
AECL CANDU EACL CANDU2251 Speakman Drive 2251, rue Speakman
21V450 Mississauga, Ontario Mississauga (Ontario)Canada L5K 1B2 Canada L5K 1 B2

TABLE OF CONTENTS
SECTION PAGE
1. INTRODUCTION : ...................................... 1
2. BACKGROUND............................................ 1
3. DATA COLLECTION ....................................... 3
3.1 Out-Reactor Data ........................................ 33.2 In-Reactor Data . ...................................... 3
4. DEFINITIONS OF MECHANISTIC TERMS ........ ............. 5
5. MATHEMATICAL FORMULATIONS ........... ............... 5
6. GOODNESS OF FIT ...................................... 7
7. FEATURES OF THE MODEL .................................. 9
8. ILLUSTRATIVE EXAMPLE #1: PELLET DENSITY ...... ........ 10
9. ILLUSTRATIVE EXAMPLE #2: HIGH BURNUP ...... .......... 10
10. DISCUSSION . ...................................... 10
10.1 Guide the Acceptance/Loading of New Fuel ....................... 1110.2 Aid Fuel Specifications ...................................... 1110.3 Guide Reactor Operation ...................................... 1110.4 Aid Evolution of Fuel Design ................... ............... 11
11. CONCLUSIONS . ...................................... 11
12. ACKNOWLEDGEMENTS .................................... 12
13. LIST OF SYMBOLS ...................................... 12
14. REFERENCES . ...................................... 13
9422 1450
9a7
TABLE OF CONTENTS
SECTION PAGE
List of Figures
Figure 1: Definitions of Terms
Figure 2: Data for Failure Thresholds
Figure 3: Number of Defects - Actual Versus Calculated
Figure 4: Distributions of Defects - Actual Versus Calculated
Figure 5: Defect Probability Versus Damage Index - All Data
Figure 6: Defect Threshold for All Data
Figure 7: Illustrative Examples
I
- 1 -
1. INTRODUCTION
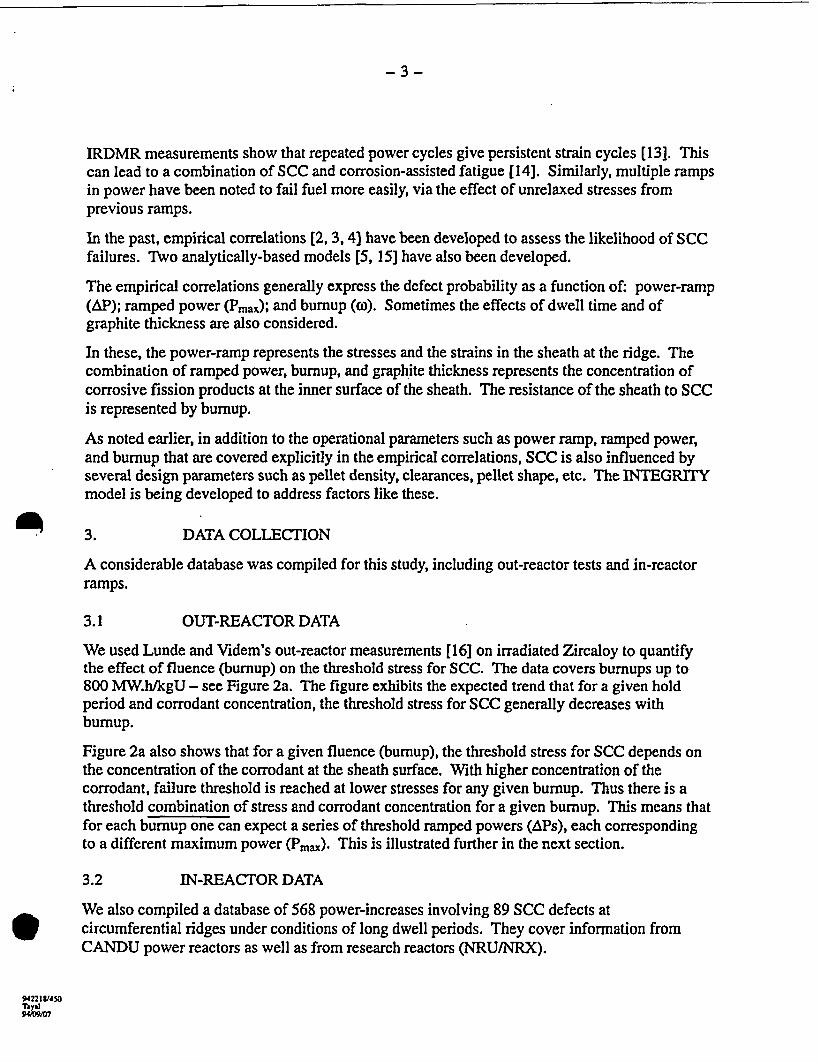
The performance record of CANDU* fuel is excellent, with fuel bundle integrity exceeding99.9% [1]. Most of the defects occurred during identifiable departures from the norm, andhelped improve our understanding of the nature and level of defect probabilities. Previoussurveys of the defects have shown that in these small number of defects, stress corrosioncracking (SCC) is an important mechanism for fuel failures [1].
At present empirical correlations [2, 3, 4] are available to define the limits of powers and ofpower-ramps within which CANDU fuel can be operated without risk of failure from SCC undernormal operating conditions. Their use is generally recommended within the ranges of theirrespective databases. Often fuel engineers also need to assess the impact of operating fuel underconditions beyond the existing database, for example: extended burnups; mixed oxide (MOX)fuel; slightly enriched (SEU) fuel; manufacturing variations/flaws; variations in pellet density;diametral/axial clearances; pellet length and shape; element diameter; etc. These applicationsgenerally fall outside the range of the existing databases of the empirical correlations. To helpassess the likelihood of SCC under such conditions, a semi-mechanistic approach for SCC,called INTEGRITY [5], was developed in 1990.
This paper presents an evolution of the above concept and contains improved equations thatincrease the accuracy of the INTEGRITY model. The improved model - called INTEGRITY-2- has been based on and compared to a database of 554 power-ramp irradiations and 14 rippledefects of CANDU fuel. The results are presented here.
At this time the applicability of INTEGRITY-2 is limited to stress corrosion cracking atcircumferential ridges due to single power-ramps with dwell periods of 2.5 h or longer.
In this paper we first provide some technical background relevant to SCC, followed by adiscussion of the mechanistic equations and their validation. Two illustrative examples showhow the defect thresholds are influenced by changes in the internal deign of the fuel element andby extended burnup.
Figure 1 defines some of the terms used in this paper. The nomenclature is given towards theend.
2. BACKGROUND
SCC of fuel element cladding occurs when the irradiation-embrittled sheath experiences hightensile stresses/strains in the presence of a corrosive internal environment provided by the fissionproducts. It may also be influenced by hydrides, which can provide sites for crack initiation andwhich can also blunt the growth of cracks [6, 7].
* CANDU: CANada Deuterium Uranium
94221 450TAy1194M~7

-2-
The high tensile stresses occur mostly due to pellet expansion because of power-ramps. Theseresult from on-power fuelling and/or from changes in reactor power. Tensile stresses can alsopotentially be caused by excessive pressure of fission gas. Thus SCC assessments are importantbecause collapsible sheaths experience higher stresses/strains, and because the comparativelyhigher operating powers of CANDU fuel lead to higher fission gas release.
About 80-90% of the defects during SCC-excursions so far in commercial CANDU reactorshave occurred at circumferential ridges and were caused by power-ramps. Therefore the focusof this paper is on SCC defects at circumferential ridges caused by power-ramps.
Most of the remaining SCC defects have occurred at the re-entrant corner near the sheath/endcapweld, and were also caused by power-ramps. A few isolated SCC defects have also occurreddue to excessive gas pressures at high burnups. At a later date we expect to expandINTEGR1TY-2 to also cover the latter two subsets of SCC defects.
Both the locations noted above (circumferential ridge, endcap weld) are locations of stress/strainconcentrations.
Many factors contribute to SCC in CANDU fuel. There is convincing evidence 6, 7, 8] that thelikelihood of SCC is influenced by the following factors: the local tensile stresses and strains;the local concentration of corrodants at the crack tip; the duration of tensile stresses/strains; andthe influences of microstructure, of hydrides and of irradiation on the resistance of Zircaloy toSCC. The studies to-date have focused on iodine, on cesium, and on cadmium as the likelycorrodants.
We call these the mechanistic parameters pertinent to SCC. The mechanistic parameters, in turn,are affected by a number of operational and design parameters. For example, the effects oframped power, of power-ramp, of burnup, of dwell time, and of Canlub have been documentedextensively [2, 6, 8].
In addition, in the area of ridge stresses/strains, IRDMR* experiments have demonstrated thatridge strains are increased by higher density of U0 2, by faster ramp-rates, and by increasedburnups [9]. Similarly, Carter has shown that longer pellets also increase the ridge strain[I0]. Astudy of 1988 Pickering defects has suggested [11] that fuel containing long dense pellets ismore susceptible to SCC.
Likewise, in the area of corrosive internal environment, enrichment changes the heat generationrate profile within the fuel element. This changes the pellet temperature and hence the fissiongas release. Previous reviews have suggested that enriched CANDU fuel power-ramped inresearch reactors (NRU/NRX) is more susceptible to SCC than natural-uranium fuel ramped incommercial CANDU reactors [2]. Also, gamma-radiography has demonstrated that some fissionproducts tend to concentrate at the interfaces between neighbouring pellets [121. For example,Lysell and Schrire report that the concentrations of I-131, 1-133, Cs-134, and Cs-137 are a factorof 4 to 14 higher at the pellet interfaces compared to the mid-pellet positions [12]. This meansthat the number of pellets in the stack can also affect the local concentration of corrosives.
* IRDMR: In-Reactor Diameter Measurement Rig
942219450Tayui9VSM7 i
- 3 -
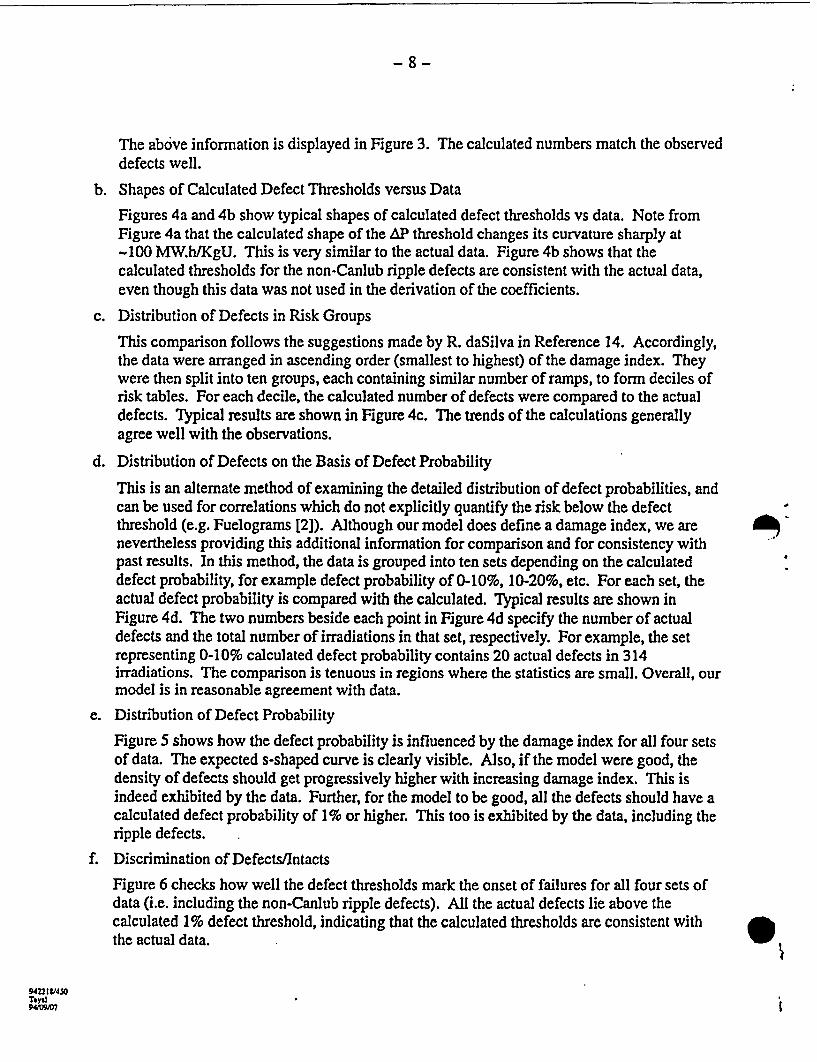
IRDMR measurements show that repeated power cycles give persistent strain cycles [13]. Thiscan lead to a combination of SCC and corrosion-assisted fatigue [14]. Similarly, multiple rampsin power have been noted to fail fuel more easily, via the effect of unrelaxed stresses fromprevious ramps.
In the past, empirical correlations [2, 3, 4] have been developed to assess the likelihood of SCCfailures. Two analytically-based models [5, 15] have also been developed.
The empirical correlations generally express the defect probability as a function of: power-ramp(AP); ramped power (Pmax); and bumup (). Sometimes the effects of dwell time and ofgraphite thickness are also considered.
In these, the power-ramp represents the stresses and the strains in the sheath at the ridge. Thecombination of ramped power, burnup, and graphite thickness represents the concentration ofcorrosive fission products at the inner surface of the sheath. The resistance of the sheath to SCCis represented by burnup.
As noted earlier, in addition to the operational parameters such as power ramp, ramped power,and burnup that are covered explicitly in the empirical correlations, SCC is also influenced byseveral design parameters such as pellet density, clearances, pellet shape, etc. The INTEGRITYmodel is being developed to address factors like these.
3. DATA COLLECTION
A considerable database was compiled for this study, including out-reactor tests and in-reactorramps.
3.1 OUT-REACTOR DATA
We used Lunde and Videm's out-reactor measurements [16] on irradiated Zircaloy to quantifythe effect of fluence (burnup) on the threshold stress for SCC. The data covers burnups up to800 MWh/kgU - see Figure 2a. The figure exhibits the expected trend that for a given holdperiod and corrodant concentration, the threshold stress for SCC generally decreases withbumup.
Figure 2a also shows that for a given fluence (burnup), the threshold stress for SCC depends onthe concentration of the corrodant at the sheath surface. With higher concentration of thecorrodant, failure threshold is reached at lower stresses for any given burnup. Thus there is athreshold combination of stress and corrodant concentration for a given bumup. This means thatfor each burnup one can expect a series of threshold ramped powers (Ps), each correspondingto a different maximum power (Pma). This is illustrated further in the next section.
3.2 IN-REACTOR DATA
We also compiled a database of 568 power-increases involving 89 SCC defects atcircumferential ridges under conditions of long dwell periods. They cover information fromCANDU power reactors as well as from research reactors (NRU/NRX).
94n1/450Tayl94"/M

- 4 -
The data covers the following ranges:
- Ramped powers: 28 to 92 kW/m
- Power ramps: 6 to 60 kW/m
- Burnups: up to 742 MWh/kgU
The above data can be divided into the following four categories:
- Non-Canlub Ramps: 50 defects in 410 ramps;
- Non-Canlub Ripples: 14 defects. No information is readily available for intact fuel in thiscategory;
- Thin-Canlub Ramps: 8 defects in 21 ramps;
- Thick-Canlub Ramps: 17 defects in 123 ramps.
Thus the defect probability can be calculated for the ramp data, providing a total of 75 defects in554 irradiations. The ripple data provides 14 additional irradiations which can help locate defectthresholds but do not quantify defect probabilities.
We checked if the ramp and ripple defects come from the same population. For this purpose, wereviewed the non-Canlub defects that are close to the defect thresholds. The results are shown inFigures 2b to 2d. The ramp and ripple thresholds seem to form separate populations formaximum power as well as for power-increase - see Figures 2b and 2c.
Compared to the ramps, the ripples are generally associated with higher maximum power(Figure 2b) and lower power-ramps (Figure 2c). This can be related to the generally higherinitial powers involved in the ripple data. This is further illustrated in Figure 2d, which showsidealized power histories for typical ramp and ripple defects at -220 MW.hfkgU. It is clear thatthe ripple defects operated at initial powers higher than the maximum power threshold for theramp defects. Thus they had higher amounts of fission products and required comparativelysmall power-ramps for the defects.
This is similar to the effect of iodine noted earlier from the independent data of Lunde andVidem [16] - see Figure 2a - where higher amount of iodine lowered the threshold stress forSCC.
From this we conclude that the thresholds for maximum power and for power-ramp are mutuallydependent on each other.
We note that at this time-the defect data is available in terms of bundle defects for 89 ramps/568irradiations, and in terms of element defects for only 39 ramps/158 irradiations. Ourmechanistic model uses the bundle-defect data so that the model can benefit from the muchlarger database.

- 5 -
4. DEFINITIONS OF MECHANISTIC TERMS
Following Reference 5, we based our mechanistic model on fission product concentration, workdensity, and SCC-resistance. In this section we give their definitions.
The fission product concentration, f, represents the corrodant concentration at the inside surfaceof the sheath at the ridge.
The work density, u, is the area under the stress-strain curve. It is calculated by using thefollowing equation:
U= JloI dcl, +JC22d 22 +JCa 33 dC33 +Ja 13 de13
where the integral is taken over the power-ramp. The symbols "a" and "E" represent the localstresses and strains respectively, and the subscripts 1, 2, 3 represent the radial, circumferential,and axial directions respectively. Thus the work density represents the combined influences ofthe radial, hoop, axial, and shear components of the elastic-plastic stresses and strains. It isequal to the work done, or energy imparted to the sheath by the expanding pellet.
The SCC-resistance measures Zircaloy's inherent resistance to failure via SCC. We define it asthe work density required to fail Zircaloy via SCC at a given burnup and fission productconcentration.
The mathematical details of the model are given in the next section.
5. MATHEMATICAL FORMULATIONS
a. The shape of the curve for SCC-resistance was derived from the out-reactor data of Lundeand Videm [16]. As noted earlier, the above data is valid up to 800 MW.h/kgU. Theequation of this shape is given by:
Us = 2.358 x 10¹² F,0.6056 (1)
where
F = 7.58 x 10l8co (2)
b. Next, we calculated the work densities for the 568 power increases described in the previoussection. This was done by using the ELESTRES code [17] to calculate the incrementalpellet displacements during the ramp, and the FEAST code [18] to calculate the resultingstresses, strains, and work densities at the inner surface of the sheath at the ridge. TheFEAST calculations considered elastic-plastic effects. To account for the effects of localstress/strain concentrations at the circumferential ridge, a graded mesh of about 300axisymmetric finite elements was used [17]. The SHEATH code was used to automate thecalculations. Thus the work density reflects the influences of parameters like the size of thepower-ramp, pellet density, diametral clearance, pellet shape (e.g. length, chamfer size, landwidth, dish depth), coolant pressure, etc., on the stresses and strains in the sheath.
9422181450
7n9

- 6 -
c. The above work density was expressed in non-dimensional form by defining the workdensity ratio (W) as follows:
W = uuS (3)
Thus the work density ratio incorporates the shape of threshold stresses measured by Lundeand Videm.
d. Then we used ELESTRES to calculate the fission gas released to the pellet-sheath gap. Forthis calculation, we used a dwell time of 2.5 h [2] and calculated the average fission gas inthe gap during the above hold after the ramp.
This was converted to fission product factor in the gap as follows - please see thenomenclature given at the end:
VD
g=2 7r rl (n+ 1)
The above equation reflects the experimental evidence on 1-131 noted earlier, in that itallows the corrosive fraction of the fission products to concentrate in narrow rings atinter-pellet interfaces. The fission product factor in the gap, g, is a function of the operatingconditions and fuel design. It covers the combined influences of parameters such as rampedpower, burnup, sheath diameter, number of pellets, pellet density, initial power and coolanttemperature, on the the amount of fission products at the inner surface of the sheath.
e. We next calculated the fission product concentration at the inside surface of the sheath at theridge, f. To do this we subtracted the protection provided by Canlub, c, from the fissionproduct concentration in the gap, g:
f = g-c (5)
In equation (5) the net effect of Canlub is considered equivalent to a net reduction in theamount of fission products that reach the surface of the sheath.
f. The protection provided by Canlub, c, was considered proportional to the mass of Canlub forhigh values of fission product release. At low values of fission product release, theprotection was considered to also depend on the concentration of the fission gas in the gap.Thus, based on a statistical analysis, 'c' was defined as follows:
c = minimum of {g, or [1- exp ((qm))] g, or vm) (6)
Here, "m" is the mass of graphite at the ridge and is calculated from:
m = 2rlt p (7)
Thus thicker Canlub is considered to provide greater protection against SCC. InINTEGRITY the effect of Canlub is treated as a continuous function of graphite thicknessrather than a series of separate curves for no-, thin-, or thick-Canlub.
.i

- 7 -
g. A "Damage Index" d was defined to assess the combined influences of the work density ratioand the fission product concentration as follows:
d= aWxy (8)
This form of the damage index ensures that zero damage is assigned if either the workdensity or the fission product concentration is zero.
h. From this, a defect probability "p" was defined as [3, 4]:
1
1 + exp {-(d - z)) ()
i. The six empirical coefficients, a, q, v, x, y and z, were found by a least-squares regressionanalysis to fit the actual number of defects observed in the previous database. Themethodology outlined by R. daSilva was used [4]. Four of the coefficients, a, x, y, and z,define the influences of work density ratio and of fission product concentration on the defectprobability. For these trends the most reliable statistical guidance is provided by thenon-Canlub ramp data because it is the most numerous. Hence this data was given thehighest weight in determining these four coefficients. The thick-Canlub data was usedmainly to quantify the effect of Canlub, viz. coefficients q and m. The thin-Canlub data wasnot used to obtain the coefficients because it contains only 21 irradiations, hence it wasconsidered too small for statistical purposes. The non-Canlub ripple data was also not usedbecause for that set we do not have data on intact fuel at this time, hence the defectprobabilities cannot be quantified for them. Nevertheless, the final correlation was tested forconsistency against all four sets of data.
In obtaining the least squares fit, we set the defect probability to 1% [2] for the non-Canlubramp defect with the lowest value of the damage parameter.
6. GOODNESS OF FIT
The goodness of fit was checked by six separate methods: a) Number of observed versuscalculated defects; b) Shapes of calculated defect thresholds versus data; c) Distribution ofdefects in risk groups; d) Distribution of defects on the basis of defect probability; e)Distribution of defect probability; and f) Discrimination of defectsfintacts. These are describedin the following paragraphs.
a. Number of Observed versus Calculated Defects
We used the model to calculate the expected number of defects in the 3 sets of data for whichthe defect/intact statistics are available (i.e., excluding non-Canlub ripples). The followingresults were obtained: In the 410 non-Canlub ramps, the model calculated 50 defects vs. theactual number of 50. In the 21 thin-Canlub ramps, the model calculated 8 defects vsersus theactual 8. In the 123 thick-Canlub ramps, the model calculated 17 defects versus the actual17. Thus in all, for the 554 ramps, the model calculated a total of 75 defects which is thesame as the actual number (also 75).
942212450Tays94X9X7
- 8 -
The above information is displayed in Figure 3. The calculated numbers match the observeddefects well.
b. Shapes of Calculated Defect Thresholds versus Data
Figures 4a and 4b show typical shapes of calculated defect thresholds vs data. Note fromFigure 4a that the calculated shape of the AP threshold changes its curvature sharply at-100 MW.h/KgU. This is very similar to the actual data. Figure 4b shows that thecalculated thresholds for the non-Canlub ripple defects are consistent with the actual data,even though this data was not used in the derivation of the coefficients.
c. Distribution of Defects in Risk Groups
This comparison follows the suggestions made by R. daSilva in Reference 14. Accordingly,the data were arranged in ascending order (smallest to highest) of the damage index. Theywere then split into ten groups, each containing similar number of ramps, to form deciles ofrisk tables. For each decile, the calculated number of defects were compared to the actualdefects. Iypical results are shown in Figure 4c. The trends of the calculations generallyagree well with the observations.
d. Distribution of Defects on the Basis of Defect Probability
This is an alternate method of examining the detailed distribution of defect probabilities, andcan be used for correlations which do not explicitly quantify the risk below the defectthreshold (e.g. Fuelograms 12]). Although our model does define a damage index, we arenevertheless providing this additional information for comparison and for consistency withpast results. In this method, the data is grouped into ten sets depending on the calculateddefect probability, for example defect probability of 0-10%, 10-20%, etc. For each set, theactual defect probability is compared with the calculated. Typical results are shown inFigure 4d. The two numbers beside each point in Figure 4d specify the number of actualdefects and the total number of irradiations in that set, respectively. For example, the setrepresenting 0-10% calculated defect probability contains 20 actual defects in 314irradiations. The comparison is tenuous in regions where the statistics are small. Overall, ourmodel is in reasonable agreement with data.
e. Distribution of Defect Probability
Figure 5 shows how the defect probability is influenced by the damage index for all four setsof data. The expected s-shaped curve is clearly visible. Also, if the model were good, thedensity of defects should get progressively higher with increasing damage index. This isindeed exhibited by the data. Further, for the model to be good, all the defects should have acalculated defect probability of 1% or higher. This too is exhibited by the data, including theripple defects.
f. Discrimination of Defects/Intacts
Figure 6 checks how well the defect thresholds mark the onset of failures for all four sets ofdata (i.e. including the non-Canlub ripple defects). All the actual defects lie above thecalculated 1% defect threshold, indicating that the calculated thresholds are consistent withthe actual data.
9
In Figure 6, the non-Canlub ripple defects generally lie at the highest fission productconcentrations. This reflects their comparatively high pre-ramp powers.
Canlub prevents some of the fission gas in the gap from reaching the sheath surface. Thusthe Canlub failures occur for lower values of fission product concentration andcorrespondingly higher values of work density ratio. This effect is more pronounced in thickCanlub fuel, and is also visible in Figure 6.
7. FEATURES OF THE MODEL
* The shape of the defect threshold is based on out-reactor tests which define a basic,continuously-varying material property (SCC threshold). Hence the accuracy of the shape isnot subject to the comparatively larger uncertainty expected in defect thresholds derivedsolely from a limited number of yes/no type of in-reactor defects. Thus the model is usablein the range of the database of the above out-reactor tests.
* Although the shapes of the defect thresholds are derived from out-reactor data, they domatch quite well with the available in-reactor data on 568 power-increases. Also, thecalculated number and distribution of defects agree well with the actual data.
* One set of equations correlates well with four different sets of data, i.e., non-Canlub ramps;non-Canlub ripples; thin-Canlub ramps; and thick-Canlub ramps. This provides confidencethat the pertinent trends are captured well.
* The defect probability curves show continuous variations with operational parameters likeAP and Pmax. Thus some of the unnatural jumps and plateaus exhibited by a previousempirical correlation have been eliminated.
* The principles of statistics are followed rigorously. This has eliminated a weakness of aprevious empirical correlation.
* The model recognizes the interdependence of Pm. and AP in determining the defectthresholds. This makes it consistent with the observed differences in ramp and ripple defectthresholds, as well as with the differences in stress thresholds observed by Lunde and Videmfor different corrodant concentrations.
* The model incorporates the influence of operational parameters such as power-ramps,ramped powers, coolant temperature, and coolant pressure; and of design variables such asCanlub mass, pellet density, clearances and pellet shape, etc.
* The model is considered valid for burnups up to 800 MW.hfkgU infinite dwell times (longerthan 2.5 h); and single ramps in power. The model is limited to estimates of defectprobability due to stress corrosion cracking at circumferential ridges.
The next two sections provide illustrative examples on the use of the INTEGRITY model.
94221V450T&dfseMM
-10-
8. ILLUSTRATIVE EXAMPLE #1: PELLET DENSITY
As an illustrative example, we assessed the influence of pellet density on the defect probabilityof 37-element CANDU fuel. Figure 7a shows the power history considered, consisting of aramp of 35 kW/m to a maximum power of 56 kW/m at 100 MW.hlkgU. Figure 7b shows thecalculated trends of the damage index, and demonstrate the opposing effects of density, pellettemperature and porosity. At low densities, increasing the density decreases pellet temperatureswhich decreases the damage index. At higher densities, the low porosity in high-density fuelcauses higher expansion of the pellet, which increases the damage index. For this power historythe defect probability stays below 1% for pellet densities less than 10.8 g/cc.
9. ILLUSTRATIVE EXAMPLE #2: HIGH BURNUP
As another illustrative example, we assessed the influence of extended bumup - about700 MW.h/kgU - on the integrity of a fuel element of reduced diameter containing slightlyenriched uranium fuel. An optimized pellet shape was considered featuring short pellets, bigchamfers, big land, and reduced density [19]. Figure 7c shows the combinations ofpower-ramps/ramped-powers considered. The ramped powers range from 25 to 56 kW/m, andthe power-ramps from 1 to 40 kW/m. Figure 7d shows the calculated damage index. Again, thecalculated trends look reasonable. The defect probabilities reflect a balance between higherfission gas release due to enrichment, lower volume of fission gas release due to smallerdiameter, tendency for higher concentration of fission products due to reduced diameter, andlower stresses/strains due to the optimized shape and density of the pellet.
10. DISCUSSION
The INTEGRITY model discussed here does not replace the empirical correlations now in use.Rather, it provides a means of extending the range of applicability of the correlations, toconditions that are either not covered by the existing data base or are sparsely represented.
The INTEGRITY model continues to reflect the influences of operational parameters that arecurrently used in existing empirical correlations for defect thresholds/probabilities, viz:power-ramp, ramped power, and burnup. In addition, it provides a vehicle to account for theimpacts of detailed fuel design parameters such as pellet density, pellet shape and size, sheathdiameter and thickness, pellet/sheath clearances, etc. Additional operational parameters can alsobe covered, for example coolant temperature and pressure, etc. As noted earlier, previousexperiments and irradiations have already demonstrated that combinations of the above featurescan have considerable impacts on factors such as stresses, strains, and fission gas releases, andhence on SCC defects.
The examples discussed above demonstrate how INTEGRITY can be applied to obtainfirst-order estimates of defect thresholds and probabilities in situations where sufficientempirical data may not exist to provide reliable guidance. With further evolution, some specificapplications of the preceding concepts could include the following:

-11-
10.1 GUIDE THE ACCEPTANCE/LOADING OF NEW FUEL
Sometimes the as-fabricated fuel contains combinations of tolerances that are not sufficientlycovered by the previous well-characterized database on ramp testing. One example is fuel ofhigh mass, including high U0 2 density and low clearances. Or, the fuel may containmanufacturing flaws whose impact is unknown from previous tests. The approach outlined herecan help provide an interim guidance about the expected performance of such fuel.
10.2 AID FUEL SPECIFICATIONS
The model can be used to define the sensitivity of SCC defects for combinations of fuelfabrication parameters like pellet density, pellet shape, pellet/sheath clearances, etc. This canhelp confirm that the limits in fuel specifications reflect only the safe combinations of above andrelated parameters.
10.3 GUIDE REACTOR OPERATION
Similarly, the approach can help guide reactor operation in new areas of operation, e.g., effectsof power cycles, extended burnups, non-routine startups, non-routine fuelling, etc.
10.4 AID EVOLUTION OF FUEL DESIGN
Some specific fuel evolution activities currently underway include [1]: High Burnup Fuel,Slightly Enriched Uranium Fuel, Fuel for Highly Advanced Core, Low Void Reactivity Bundle,Mixed Oxide (MOX) Fuel, and DUPIC (Direct Use of PWR Fuel in CANDU). Again, theapproach outlined above can be applied in these evolutions.
11. CONCLUSIONS
a. Two independent sets of data suggest that defect thresholds for maximum power (fissionproducts) and for power-ramp (stresses/strains) are mutually dependent on each other.
b. A mechanistic model called INTEGRITY-2 has been developed for assessing SCC at ridges.It accounts for fuel design as well as operational parameters in calculating SCC. Itsapplicability extends to burnups of 800 MW.h/kgU.
c. The model shows excellent fit with defect statistics in 554 ramps. In particular, checksshow:
- 50 calculated defects vs. 50 actual defects in 410 non-Canlub ramps;
- 8 calculated versus 8 actual defects in 21 thin-Canlub ramps; and
- 17 calculated versus 17 actual defects in 123 thick-Canlub ramps.
d. The shapes of the defect threshold curves are consistent with the distributions of the actualdata noted above, and with 14 additional defects involving power ripples in non-Canlub fuel.The calculated distributions of the defects in different risk regions are also consistent withactual data.

-12-
c. The model contains a term for the mass of Canlub, so any thickness of Canlub can beassessed.
f. An illustrative example shows that the pellet density first decreases, then increases, thedefect probability. This is due to the competing influences of pellet temperature and pelletporosity. Another illustrative example suggests that fuel integrity can be enhanced byoptimizing the shape and density of the pellet.
12. ACKNOWLEDGEMENTS
We thank Mr. T. Tanaka (EPDC), J.W. Love (AECL), R. Sejnoha (AECL), I.E. Oldaker (AECL),T. Carter (AECL), M. Floyd (AECL), P. Chan (AECL), W. Richmond (AECL), D.E. Teed(GEC), M. Hoare (Zircatec), and J. Lawless (Univ. of Waterloo), for valuable technicaldiscussions and help during this project. We also thank L. Lunde (Norway), K. Videm (Norway)and Journal of Nuclear Materials for permission to reproduce Figure 2a. Financial support byElectric Power Development Company Limited, Japan, is also gratefully acknowledged.
13. LIST OF SYMBOLS
a empirical coefficient
c empirical coefficient for the effect of Canlub on fission product concentration
d damage index
D density of free gas
f fission product concentration at the sheath inner surface at the ridge (g/mm 2)
F fast neutron fluence (> 1 Mev) (n/cm2)
g fission product factor in the gap (g/mm 2)
I width of the ring over which the fission products concentrate at the circumferential ridge(mm)
m mass of Canlub (jig)
n number of pellets in the fuel element
AP power-ramp (kW/m)
PmX ramped power (kW/m)
p defect probability (fraction)
q empirical coefficient
r inner radius of the sheath (mm)
t thickness of Canlub (m)

-13-
u work density (MPa)
v empirical coefficient
V volume of released fission gas
W work density ratio
x, y, z empirical coefficients
Greek Symbols
£ strain
p density of Canlub
a stress
co burnup (MW.h/kgU)
Subscript
s shape of threshold
14. REFERENCES
1. M. Gacesa, P.G. Boczar, J.H.K. Lau, P.T. Truant, N. Macici, E.G. Young, "Canadian FuelDevelopment Program", Third International Conference on CANDU Fuel, Canadian NuclearSociety, Pembroke, Canada, 1992 October 04-08.
2. W.J. Penn, R.K. Lo, and J.C. Wood, "CANDU Fuel - Power Ramp Performance Criteria",Nuclear Technology, 34 (1977), pp. 249-268.
3. A.J. Hains, R.L. daSilva and P.T. Truant, "Ontario Hydro Fuel Performance Experience andDevelopment Program", International Conference on CANDU Fuel, Canadian NuclearSociety, Chalk River, 1986 October 06-08.
4. R.L. daSilva, "CAFE - A Probabilistic Model for Predicting CANDU Fuel SCC PowerRamp Failures", Third International Conference on CANDU Fuel, Pembroke, CanadianNuclear Society, 1992 October 04-08.
5. M. Tayal, E. Millen, R. Sejnoha, G. Valli, "A Semi-Mechanistic Approach to Calculate theProbability of Fuel Defects", AECL Report AECL-10642, 1992 October.
6. B. Cox, "Pellet Clad Interaction (PCI) Failures of Zirconium Alloy Fuel Cladding - AReview", Journal of Nuclear Materials, 1990 August, Vol. 172, Issue -3, pp. 249-292.
7. B. Cox, "Environmentally Induced Cracking of Zirconium Alloys - A Review", Journal ofNuclear Materials, 1990 January, Vol. 170, Issue -1, p 1-23.
8. B. Cox, J.C. Wood, "Iodine Induced Cracking of Zircaloy Fuel Cladding - A Review",Atomic Energy of Canada Limited, Report AECL-4936, 1974.

-14-
9. P.J. Fehrenbach, P.A. Morel, R.D. Sage, "In-Reactor Measurement of Cladding Strain: FuelDensity and Relocation Effects", Nuclear Technology, Volume 56, 1982, pp. 112-119.
10. T.J. Carter, "Experimental Investigation of Various Pellet Geometries to Reduce Strains inZirconium Alloy Cladding", Nuclear Technology, Volume 45, 1979, pp. 166-176.
11. M.R. Floyd, R.J. Chenier, D.A. Leach, R.R. Elder, "An Overview of the Examination of Fuelas a Follow-up to the 1988 November Overpower Transient in Pickering NGS-A Unit 1",Third International Conference on CANDU Fuel, Canadian Nuclear Society, Pembroke,Canada, 1992 October 04-08.
12. G. Lysell, D. Schrire, "Fission Product Distribution at Different Power Levels", IAEAMeeting on Fuel Performance at High Burnup for Water Reactors, Studsvik, Sweden,1990 June 05-08, IWGFPT/36, pp. 132-139.
13. P.J. Fehrenbach, P.A. Morel, "In-Reactor Measurement of Clad Strain: Effect of PowerHistory", AECL Report AECL-6686, 1980.
14. M. Tayal, A.M. Manzer, R. Sejnoha, Y. Kinoshita, A.J. Hains, "The Integrity of CANDUFuel during Load Following", AECL Report AECL-9797, 1989.
15. M.J.F. Notley, "PRAMP - A Model for Calculating the Probability of Fuel Defects", ThirdInternational Conference on CANDU Fuel, Canadian Nuclear Society, Chalk River, Canada,1992 October 4-8, pp 5-11 to 5-20.
16. L. Lunde, K. Videm, "The Influence of Testing Conditions and Irradiation on the StressCorrosion Cracking Susceptibility of Zircaloy", Journal of Nuclear Materials, 95 (1980),pp. 210-218.
17. M. Tayal, "Modelling CANDU Fuel Under Normal Operating Conditions: ELESTRESCode Description", Atomic Energy of Canada Limited, Report AECL-9331, 1987.
18. M. Tayal, "FEAST: A Two-Dimensional Non-Linear Finite Element Code for CalculatingStresses", Seventh Annual Conference, Canadian Nuclear Society, 1986. Also ReportAECL-8763.
19. M. Tayal, A. Ranger, P.N. Singh, I.J. Hastings, A.J. Hains, Y. Kinoshita, "The Integrity ofCNADU Fuel at Extended Burnups", Canadian Nuclear Society, Second InternationalConference on CANDU Fuel, Pembroke, Canada, 1989 October 1-5, pp 413-428.

RAMPED POWER
crw
pma 1 7ea
Pt'aPOWER hPRAMP
PC
PAE-RAMP POWE R I
+ F ~~2.Sh
SURNUP
(a) POWER HISTORY
Reentrant Corner
SHEATHIENDCAP FOR CLARITY THEJUNCION WAVINESS HAS BEEN
EXAGGERATED
(b) FUEL ELEMENT
Figure 1: Definitions of Terms

70
600
S I-
g 0
envn 300UAOO
en200
10
LJsred.a4td49.h nd
- Sow 4
0 I f ,f . f .... . . ... t -. ,. .. -o ,o20 . 21 2
O 80 10 ~~~~~~~~10FAST NEUITRON DOSE -/cm'
= tow .Odne. SOW b-9h iodivw. 2 -2WO I
(a) Failure stress for SCC In 1-3 h.
(Rapnducod fm Lunde and Videm. 1980)
0 50 100 ISO 20
eNUP Q
(b) Non-canlub defects nearthe maximum power thresholds
250
50 70
60
AS
40
35
f_1AS
0
s-
1'S
c
30
RIPPLE
RAMPr
510 -
0 U .
0 50 100 ISO 20vLRN-W(
(c) Non-canlub defects nearthe power Increase thresholds
250 0 50 100 ISO 203 250
S1JRNIP (0Wt#KOIJ)
(d) Idealized power historiesfor ramps and ripples
Figure 2: Data for Failure Thresholds

80
D Actual 7 74.8
70 -_ Calculated .
N~ote:Non-CANLUB Ripple data
60 - _ excluded due to unavailabilityof intact data.
50 50.0s0
CA
C.0
C30
20 ~~~~~~~~~~~17 17.0
10 8 7.8
0
Non- Thin Thick TotalCANLUB CANLUB CANLUBRamped
Figure 3: Number of Defects - Actual Versus Calculated

60
50
so
E 30
10
2awlU:
0
0 200 400 60w
URNUP (M W
(a) Shape of the calculatednon-canlub ramp defectthreshold vs. data
o 200 4O 6w0 Soo
BURNUP
(b) Shape of the calculatednon-canlub ripple defectthreshold vs. data
100%
so.
-60%C
0C5
V-
=M G
0r0a
1-7
0.8 _
o 0.6
CL
-
-
0.2
0
o 0.420/.
0%6- (4 I in w O o 0
Risk Group
(c) Distribution of defectsIn risk groups
50°.
Calculated Defect Probability
(d) Distribution of defectson the basis of defectprobability
100%
Figure 4: Distributions of Defects - Actual Versus Calculated

1 00%M
90/o
s meale via,
.0s
X Intact
' Defect
:D.
C
80 -
70 -
60
50%/
40% -
30/C _
20% -
10%/o
0%-o
e
.
l:%
XX
: -
W,.
If
_..
#*V7 I I_ _sI I q
--- ---..
5.00.0
I I
10.0 1S.0
Damage Index (d)
20.0 25.0
Figure 5: Defect Probability Versus Damage Index - All Data

0
1.E+3
1.E+2
_ 1.E+1C,.
EE 1.E+o
'E 1E 1.20
c- 1.E1
a0
c 1.E-2C
0UC 1.E-30
3 I.E-40L-
O.
~ .2-0
U-I.E-6
I0
_ - A
_ .
4
4 G
* N*
0,a O ,
.. I X..<
f t
44
4
A A
a
X1 Inlacle
* Non-CANLUB Rpple.
* Non-CANLUB Ramped
A Thtn CANLUB
a ThIck CANLUB
1% Thresholdx x
x x x\tt
1.2.7
i.E-8 I I I I 6.11 _ a I . . . ... I L 111111 X I 1 - )-t11 I- 1 I I I fil I- I I I I II S *-ai a ; . .. .i
1.E.3 1.E-1
Work Density Ratio (W)
1.E+1 1.2.+2 1.E+3
Figure 6: Defect Threshold for All Data

U ,!I
60
50-
40 -
CD30 -0
C
60
L
40+
30+
*
*~~ II
A AAU
A
A
A A* . . A I
10
10*
0 0 50 100 I150 0
Bumup (MW/kgU)
(a) Power Ramp Data(Illustrative Example #1)
2= 400 6 800Bumup (MWhtgU)
(c) Power History forALS CANDU Reactor(Illustrative Example #2)
9.1
xCD
Ci 9E0
C
11 .
1LD5
1D4
lM Ž
.0
CD
0.960
10
XD
0C)0>tMco
9
.
..
10
2
.0
C
C
1
8a92
0.90
7 i . ,
8.9 1 1 1 1 1 1 1 Q8
10.55 1w 10.6 10.7 1a75 10Q 10.85 10.
Pellet Density (gcbTN3)
(b) Effect of Density(Illustrative Example #1)
-_ 0.18000 200 400 600
Bumup (MWingU)
(d) Damage Index andDefect Probability(Illustrative Example 2)
Figure 7: Illustrative Examples