integration of vertical electrical sounding and
TRANSCRIPT

Jordan Journal of Civil Engineering, Volume 4, No. 4, 2010
- 389 -
Integration of Vertical Electrical Sounding and Aeromagnetic Data Using GIS
Techniques to Assess the Potential of Unsaturated Zone and Natural Basalt Caves for Groundwater Artificial Recharge in NE-Jordan
Hani Al-Amoush
Assistance Professor, Institute of Earth and Environmental Sciences, Al-al-Bayt University, Jordan
E-Mail: [email protected].
ABSTRACT
Geophysical data consisting of Aeromagnetic (AM) and Vertical Electrical Sounding (VES) in addition to the extracted lineaments map for the northern part of Azraq basin were used with the aid of ArcGIS tools aiming at investigating the potential of natural basalt caves and unsaturated zone for the purposes of artificial groundwater recharge. The aeromagnetic data were analyzed using advanced processing techniques. The aeromagnetic interpretation was carried out qualitatively and quantitatively and correlated with the distribution and density of lineaments and caves location. The geo-electrical measurements were processed and interpreted to characterize the unsaturated zone in the study area. The surface watershed and watershed-point areas were modeled and were considered within the integrated interpretation. Based on the results of this study, it was concluded that highly fractured regions possessing low aeromagnetic intensity are of high potential for groundwater recharge; therefore, the central western part of the study area is considered of high potential for groundwater recharge. Regarding the natural basaltic caves, it is concluded that the Beer Al-Hamam and Al-Fahda caves are of high potential for groundwater artificial recharge and the possibility of using the other basaltic caves for groundwater artificial recharge and subsurface storages.
KEYWORDS: Aeromagnetic, Artificial recharge, Watershed-point, Vertical Electrical Sounding
(VES).
INTRODUCTION
Jordan faces a situation with very limited water
resources as being among the water-poorest counties in the world on a per capita basis. The available per capita water resources are projected to decline from about 150 m3/year for all uses to only 90 m3/year by the year 2020, putting Jordan in the category of having an absolute water shortage (Salameh, 1996).
The basaltic aquifer which is located north east of Jordan and shared with Syria contributes about 80
MCM/Y of high quality water to Jordan's groundwater budget. The aquifer represents an important resource for the drinking water supply of major cities in the country (as Amman and Zarqa). Intensive water withdrawal from the aquifer is taking place as it is one of the main supply sources for the greater Amman area as well as for various purposes in the southern part of Syria, which is affecting water quantity and quality. Thus, it was concluded that an additional groundwater extraction could worsen the situation (Noble, 1994).
Due to water scarcity, decreasing rainfall amounts, drought conditions and climatic changes with their environmental impacts, intensive efforts and planned Accepted for Publication on 15/10/2010.
© 2010 JUST. All Rights Reserved.

Integration of Vertical Electrical… Hani Al-Amoush
- 390 -
projects at the national level have been done and are planned to overcome this situation, such as the Red-Dead Seas canal project to generate hydropower and to desalinate sea water making use of the topographical difference. Another significant project which includes installing a pipeline to transport water from Disi aquifer basin in south Jordan to Amman is being worked on to make available around 100 MCM/Y for drinking
purposes (MWI, 2008). Harvesting water projects have been implemented in the eastern badia region of Jordan by the Jordan Badia Research and Development (JBRD) programs. Studies on artificial recharge to groundwater have been carried out in a few locations and alluvial aquifers in the Jordan Valley. Among these are Salameh (2001) and Al-Amoush (2006).
Figure 1: Location map of the study area and (DEM)
LOCATION AND GEOLOGY OF THE STUDY AREA
The study area (Fig. 1) is situated in the northern part of the Azraq basin and lies within the coordinates 435472E-521315.9E and 535477N-598086N according to the Jordan Transverse Mercator (JTM). The Azraq basin covers a surface area of about 12800km2,where 6% of the total surface area of Azraq basin lies inside Syrian territories, and about 1% inside Saudi Arabia. The groundwater in the Azraq basin is found in three major aquifers; the top most aquifer is the shallow basaltic aquifer which is combined with the underlying Chalk-Marl formation (B4) and Chalk-Chert formation (B5) of Tertiary age, the middle aquifer is a carbonate aquifer (A7/B2) of Cretaceous (Turonian - Campanian) age and the lower most aquifer is the sandstone aquifer
of Early Cretaceous age (Salameh, 1996). Along the northern part of Azraq basin, a sequence
of Tertiary to Quaternary basaltic lava flows exists that unconformably lies in the sedimentary successions. Flow directions are roughly north to south (Fig. 4), the thickness of basaltic lava varies from 1 km in Syrian territories to 600 m at the Jordanian – Syrian border thinning southward. The southern basalt lava flows interdigitate with sediments of the Azraq formations (Gibss, 1993). The origin of the basaltic - alkali-olivine type lava flows is associated with the tectonic setting of the whole region and may be connected to the existence of a continental intra-plate hot spot plume. Its eruptive site should appear to move southward as the Arabian plate moves northward (Al-Malabeh, 2005).
Legend
Caves Location!( VES Locations
DEM
Elevation (amsl)
High : 1200m Low : 600m
®!(
!(
!(
!(
!(VES5
VES4
VES3
VES2 VES1
AzzamDahdal
Alfhda
Beer Hamam
Abu Alkursi
440000
440000
460000
460000
480000
480000
500000
500000
520000
520000
5400
00
5400
00
5600
00
5600
00
5800
00
5800
00
6000
00
6000
00
Syria
Suadia Arabia
Suadia Arabia
Al Hamad
Azraq Basin
Mujib
Sirhan
Jafer
Yutum
Zarqa Dhulil
Hasa
Sout
hren
Rift
Si d
e
Tabuk
Yarmouk
300 400
200
100
Pala
stin
e
Med
iterr
ania
nAq
aba

Jordan Journal of Civil Engineering, Volume 4, No. 4, 2010
- 391 -
Figure 2: Geological map of the study area and major faults (modified after Al-Tarawneh, 1996)
Several basaltic lava flows have been identified
during the geological field mapping (Bender, 1968; Al-Dmour, 1992). The drilling log of deep penetration reveals at least 14 basaltic lava flows with varying thicknesses in the north of Azraq basin (NRA, open files).
In addition to the predominantly basaltic lava flows, soil, alluvium with wadi sediments, Umm Rijam Carbonates (URC) and Muaqqar Chalk Marl (MCM) formations, volcanoe mountains, mudflat deposits (MF) of recent sediments are exposed at different locations in the study area (Fig. 2).
PROBLEM AND OBJECTIVES OF THE STUDY
Before the 70s of the past century, the Azraq Oasis
occupied a depression in the middle part of the eastern Jordan desert. It had been a unique place for human settlement from the Stone Age until the past century. Several springs feed the Oasis and marshland with pools, supporting varied and unique flora and fauna in
that area. After that period, the country entered a comprehensive socio-economical development program, driven by need and high population growth rate of 3.6% (Salameh, 1996). This required high amounts of water leading to the development of the groundwater of the basalt aquifer of the Azraq basin. High abstraction and over-exploitation through hundreds of water wells led in turn to the overexploitation of the aquifer. Several severe environmental problems arose due to that such as that the oasis and marshland dried out completely, aquatic animal and birdlife depleted, spring discharges ceased and dried and the water table in the aquifer and the well yields dropped down. There are also some indications of salt-freshwater intrusions in the basalt aquifer.
The problem is that the basalt aquifer is overexploited. The estimated safe yield of the basalt aquifer is 24 MCM, and the estimated amount of water extracted from the basin is 55 MCM. The estimated deficit is more than 31 MCM (WAJ, open files). The situation of the groundwater in this aquifer is worsening
Integration of Vertical Electrical… Hani Al-Amoush
- 392 -
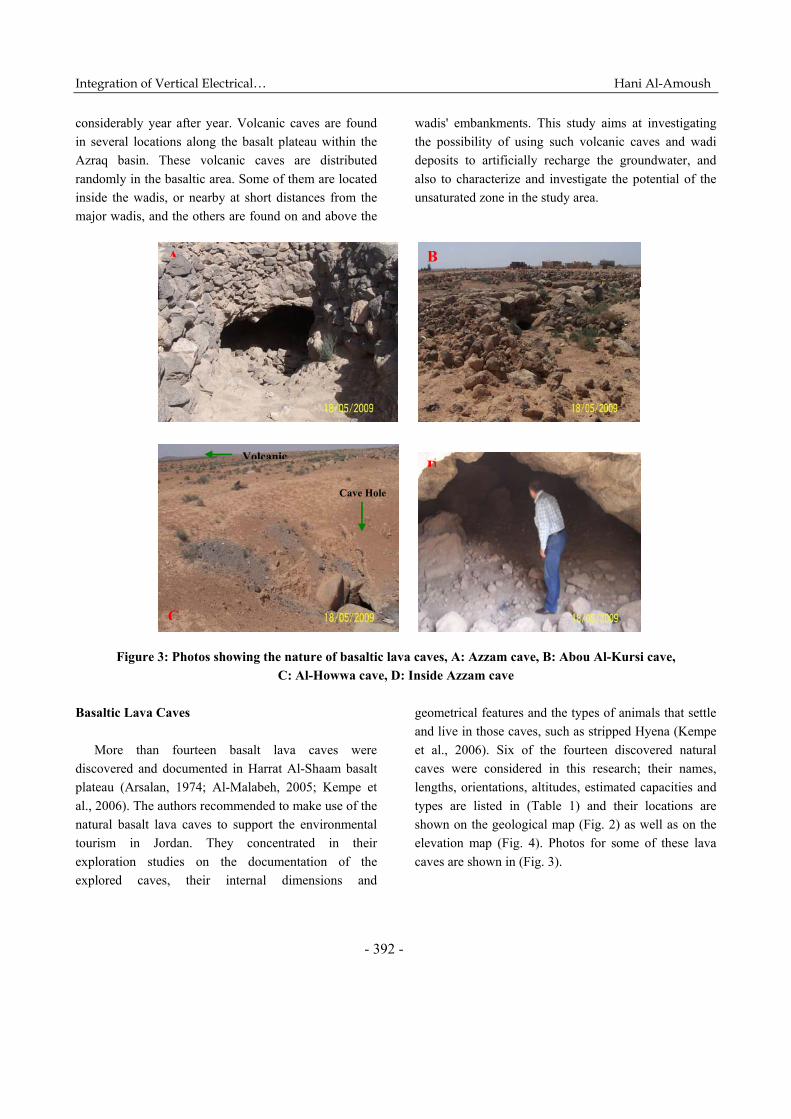
considerably year after year. Volcanic caves are found in several locations along the basalt plateau within the Azraq basin. These volcanic caves are distributed randomly in the basaltic area. Some of them are located inside the wadis, or nearby at short distances from the major wadis, and the others are found on and above the
wadis' embankments. This study aims at investigating the possibility of using such volcanic caves and wadi deposits to artificially recharge the groundwater, and also to characterize and investigate the potential of the unsaturated zone in the study area.
Figure 3: Photos showing the nature of basaltic lava caves, A: Azzam cave, B: Abou Al-Kursi cave, C: Al-Howwa cave, D: Inside Azzam cave
Basaltic Lava Caves
More than fourteen basalt lava caves were
discovered and documented in Harrat Al-Shaam basalt plateau (Arsalan, 1974; Al-Malabeh, 2005; Kempe et al., 2006). The authors recommended to make use of the natural basalt lava caves to support the environmental tourism in Jordan. They concentrated in their exploration studies on the documentation of the explored caves, their internal dimensions and
geometrical features and the types of animals that settle and live in those caves, such as stripped Hyena (Kempe et al., 2006). Six of the fourteen discovered natural caves were considered in this research; their names, lengths, orientations, altitudes, estimated capacities and types are listed in (Table 1) and their locations are shown on the geological map (Fig. 2) as well as on the elevation map (Fig. 4). Photos for some of these lava caves are shown in (Fig. 3).
A
Volcanic
C
B
DCave Hole

Jordan Journal of Civil Engineering, Volume 4, No. 4, 2010
- 393 -
Figure 4: Drainage network system superimposed on the DEM of the study area
Figure 5: Lineaments and fractures on the study area

Integration of Vertical Electrical… Hani Al-Amoush
- 394 -
Figure 6: Catchment areas in the study area and locations of basalt caves
Figure 7: Watershed area for the studied caves

Jordan Journal of Civil Engineering, Volume 4, No. 4, 2010
- 395 -
Figure 8: Location map of vertical electrical sounding points
METHODOLOGY
Data Preparation Using GIS
Digital Elevation Model (DEM) of the study area was generated with the help of ArcGIS9.2 software tools. The elevation data were provided by the Royal Jordanian Geographic Center (RJGC, 2005). The drainage network system was digitized and superimposed on the DEM (Fig. 4) for subsequent analysis. Different thematic maps were digitized and produced such as the geological map of the study area. The lineament and fracture maps were extracted from the Landsat ETM+ imagery using ERDAS imaging software and then georeferenced, digitized and incorporated into the ArcGis9.2 environment as vector maps (Fig. 5). The locations of natural basalt caves and vertical electrical soundings were positioned and located using GPS device and incorporated into the ArcGIS9.2 environment. The catchment area for the whole study area and the watershed for each natural basalt cave were
generated with the aid of ArcHydro.9 tools extension. The aeromagnetic data were gridded, processed and interpolated using the Surfer 8.0 (2002) software and MagPick (2004) software. The resulting total aeromagnetic field contouring map was georeferenced and digitized using ArcGis9.2 for use in subsequent analysis processes.
Topography
As the DEM of the study area shows (Fig. 4), the elevation ranges from around 600masl at the southern, southeastern and southwestern parts of the study area to about 1200masl in the most northern part of the study area. The regional slope is toward the S, SE and SW directions, the slope ranges from (1-10)%. The variations of slope to SE and SW reflect a structural ridge extending from north to south and controlled by the presence of a major fault crossing the study area from NNE to SSW (Fig. 2). The drainage network system (Fig. 4) is significantly related to the topography

Integration of Vertical Electrical… Hani Al-Amoush
- 396 -
and shows a semi-radial drainage pattern. These intensive wadis principally originate in Jabal -Al-Druz (not shown) and from the northern highlands in Syria and Jordan. During and after precipitation events, most
of these wadis are flooded, and large amounts of surface water run off, spread over the desert depressions, and evaporate. Potential evaporation is estimated to be in the range of (2000-2700mm/y) (WAJ, open files).
Figure 10: Multilayer interpretation model of VES1
1
10
100
1000
1 10 100 1000
Electrode Separation (AB/2) (m)
App
aren
t Res
istiv
ity (o
hm.m
)
ves1ves2
ves3
ves4
ves5
Figure 9: Field apparent resistivity curves
Jordan Journal of Civil Engineering, Volume 4, No. 4, 2010
- 397 -
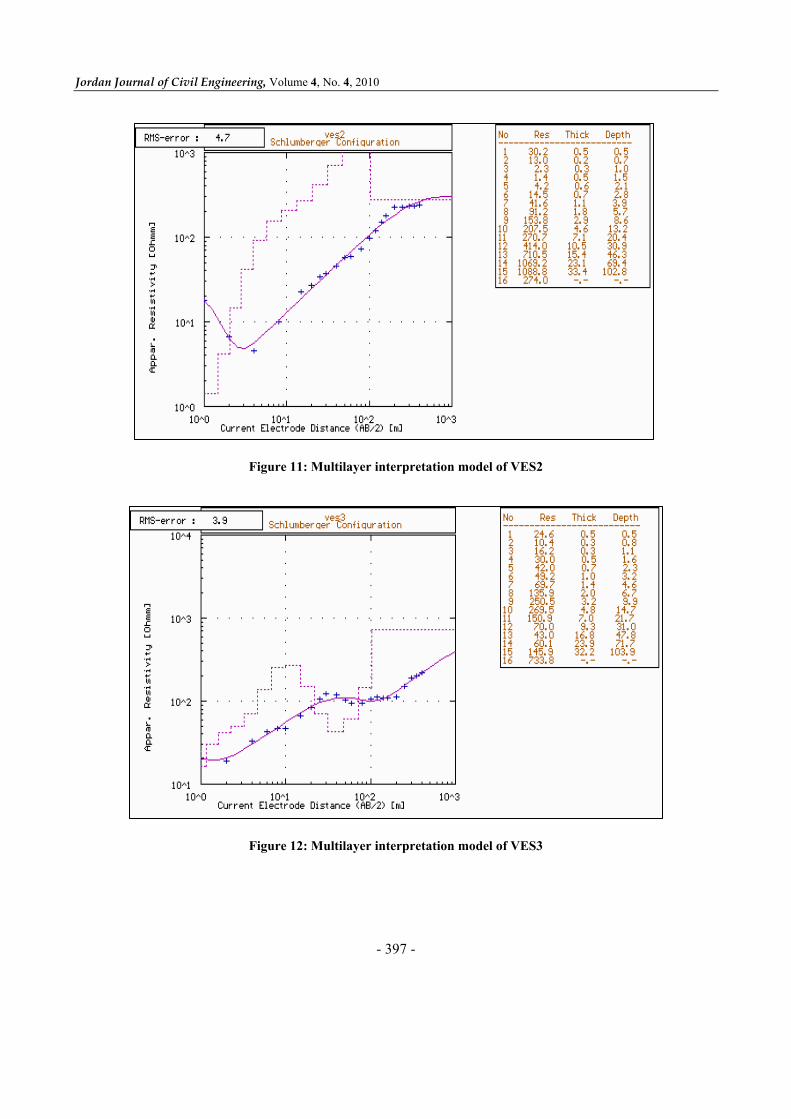
Figure 11: Multilayer interpretation model of VES2
Figure 12: Multilayer interpretation model of VES3

Integration of Vertical Electrical… Hani Al-Amoush
- 398 -
Figure 13: Multilayer interpretation model of VES4
Figure 14: Multilayer interpretation model of VES5
Watershed Modeling
Using the software ArcHydro9 tools, it is possible to delineate the watershed for any desired point in the study area. The watershed-point is applied in this study for the existing basalt lava caves. This program has several applications related to hydrological modeling. However, our task during the application of this
software was constrained to watershed modeling, and different steps have been made to achieve the ultimate aim and a raster analysis was performed to generate data sets on a flow model, flow accumulation, stream definitions, stream segmentations and watershed delineation (ArcHydro tools, 2005). These datasets were then used to generate a vector representation of the
Jordan Journal of Civil Engineering, Volume 4, No. 4, 2010
- 399 -
watershed and drainage lines. ArcHydro9 tools use all these information to develop a geometric network for the study area. The Digital Elevation Model (DEM) is the fundamental input file to make all these necessary steps. Figure (6) shows the watershed model for the whole study area and Figure (7) shows the watershed-point area for the existing basalt lava caves. Table (2) lists the calculated area for each of the specified watershed area.
GEOELECTRICAL STUDY
Five long Vertical Electrical Sounding (VES)
profiles were carried out along the course of major wadis (Fig. 8) aiming at investigating the potential of the unsaturated zone to artificial recharge to groundwater, in terms of the thickness and type of layers. The presence of impediments and clayey horizons within the unsaturated zone may affect the recharge to the groundwater aquifer and characterize the conductive and water bearing zones.
Data Acquisition and Processing
In this survey, an ABEM campus Geopulse Resist-
meter instrument was used for data collection. It is a digital signal enhancement device incorporating a microprocessor that gives the resistance (R) reading in Ω, mΩ or µΩ and is capable of accurate measurements over a wide range of conditions. The data collected were converted into resistivity readings to be modeled in order to provide information about the vertical variations of resistivity of the subsurface materials. Schlumberger configuration with electrode separation (AB) of 800 m was used to collect the field data, since this configuration is the most popular for investigating the variations of resistivity with depth. The field data acquisition was generally carried out by moving two or four of the electrodes used, between each measurement. The apparent resistivity values were found by using the equation:
ρa = 2π R/G (1)
where ρa is the apparent resistivity, R is the resistance as measured in the field (Ohm), G is the geometrical factor which depends on the electrode separation for each measurement point (Telford et al., 1990). The calculated apparent resistivity measurements were plotted against a half of the current electrode spacing (AB/2) on a transparent bi-logarithm scale. Traditional interpretation techniques by curve matching and drawing auxiliary point diagram (Zohdy, 1965; Zohdy et al., 1974; Orenella and Mooney, 1966) were applied on the field data to obtain the results of layering model. In addition to that, an automatic interpretation method using the program ATO developed by Zohdy and Bisdorf (1989) was applied on the field measurements to obtain a multilayer model representing each of the electrical sounding locations. The final results with their root mean square (RMS) errors were presented by RESIST software (Veplen, 1988). Data Interpretation Vertical Electrical Sounding (VES1)
The geo-electrical profile (VES1) is located at 463353E, 563810N (Fig. 8). It extends in the N-S direction. The field apparent resistivity curve in Figure 9 shows a gradual increase in apparent resistivity with increasing the half electrode spacing (AB/2). Basalt lava flows (BF7/BF5) are the main dominant rocks that cover the area and surround the site of the geoelectrical profiles VES1, VES2 and VES4. The interpreted multilayer model of (VES1) (Fig. 10) indicates the presence of a high resistive zone (300-600 ohm.m) with a thickness of larger than 90 m at a depth of 25 m. Therefore, the increase in resistivity with depth could indicate the presence of a thick zone of unsaturated basalt lava layers of (BF7/BF5) and wadi deposits.
Vertical Electrical Sounding (VES2)
The geo-electrical profile VES2 is located at 463353E, 563810N (Fig. 8). The field apparent resistivity curve in Figure (9) shows a conductive shallow layer until the half electrode separation AB/2 = 6 m, after that the curve gradually increases to AB/2 =

Integration of Vertical Electrical… Hani Al-Amoush
- 400 -
400 m with a variable gradient degree. The interpreted multilayer model (Fig. 11) indicates the presence of about 1.5 m of a shallow conductive layer at a depth of 1 m. It is important to say that the geo-electrical surveys were conducted at the beginning of the spring season, so that the weathered soil zone was still retaining some water of infiltrating rainfall along depressions. Therefore, the presence of a shallow conductive zone could be attributed to soil moisture after rainfalls. The
interpreted model (Fig. 11) also indicates the presence of a high resistive layer (>1000 ohm.m) with a thickness of more than 50 m at a depth of 46 m. This layer is presumably interpreted as an unsaturated layer consisting of basalt boulders of (BF7/BF5) and wadi deposits. Beneath this thick resistive layer, the resistivity decreases to reach about 275 ohm.m, indicating the beginning of a saturated layer.
Figure 15: Aeromagnetic intensity field (nT) map Vertical Electrical Sounding (VES3)
The geo-electrical profile (VES3) is located at 464144E, 569254N (Fig. 8). The field resistivity curve of this profile in (Fig. 9) shows an increase in apparent resistivity from the half electrode spacing AB/2= 2 m to the half electrode spacing AB/2= 30 m. After that, the apparent resistivity decreases until AB/2 =60m and then returns back to increase until the end of the profile. The multilayer interpretation of this sounding point (Fig. 12) indicates the presence of repetitive sequences of conductive and resistive zones, since the first 25 meters
were interpreted to be a wet to dry top zone consisting of soil intercalated by basaltic boulders belonging to the BF6/BF5 basalt flows (Fig. 2). A conductive layer with a thickness of 50 m was found at a depth of 25m. Beneath this layer, a high-resistive layer with ρ>730 ohm.m was found.
Vertical Electrical Sounding (VES4)
The geo-electrical profile (VES4) is located at 462920E, 562762N (Fig. 8). The field apparent resistivity curve (Fig. 9) shows the highest obtained
F1

Jordan Journal of Civil Engineering, Volume 4, No. 4, 2010
- 401 -
field apparent resistivity values among all the sounding curves. The interpreted multilayer model (Fig. 13) shows a high thickness (>100 m) of presumably
unsaturated basaltic boulders of BF7/BF5 and wadi sediment layers with resistivity values ranging from 250 to 600 ohm.m.
Figure 16: Aeroagnetic intensity > 44100 nT and lineaments (length>10 km) and their relation with
basalt cave locations
Vertical Electrical Sounding (VES5) The geo-electrical profile (VES5) is located at
465479E, 573067N (Fig. 8). The field apparent resistivity curve (Fig. 9) and the multilayer model interpretation (Fig. 14) resemble a high degree sounding point (VES3) at a high value of AB/2, since they are close to each other and are located in the same geological environment (Fig. 2). The presence of a conductive zone with a thickness of 45-50 m and the presence of a high-resistive layer of ρ > 1500 ohm.m at a depth of > 90 m are the main characteristics of this sounding location.
AEROMAGNETIC STUDY
Data Resources and Methodology The source of aeromagnetic data is the Natural
Resources Authority (NRA) in Jordan. The datasets are part of a countrywide airborne magnetic survey which was carried out in the year 1979/1980 by Geoterrex Limited (Phoenix, 1980). The aeromagnetic data were available in the form of a final datasets corrected for the time-magnetic variations (Hassouneh, 1998). The total aeromagnetic field data were plotted and interpolated using Surfer Version 8.0 (2002). Different filtering techniques were applied on the datasets for enhancement and removal of undesired signals. The total aeromagnetic intensity contour map for the study area was digitized, georeferenced and incorporated into ArcGIS9.2 environment (Fig. 15) aiming at achieving a correlation with different thematic maps to yield a reasonable interpretation relating to any structures important for groundwater movement and recharge. It
Integration of Vertical Electrical… Hani Al-Amoush
- 402 -
was concluded- from the regional study of the aeromagnetic anomalies in and around the region- that the magnetic anomalies are of small structures associated with local magnetic features in continental areas (Rybakov et al., 1997). Rajesh et al. (2002) concluded that basaltic terrains are ideal for magnetic exploration, because basalts generally have high magnetic susceptibility as well as high remanence contrasts, which exist between basalts and other
materials such as soil or sedimentary rocks. In addition to that, faults in basalts generally produce magnetic anomalies because of the offset of the flows as well as the modification of magnetite grains due to frictional heating, grinding and hydrothermal alterations. Groundwater flow through aquifers is frequently influenced by the location of faults, which act as channels for flow.
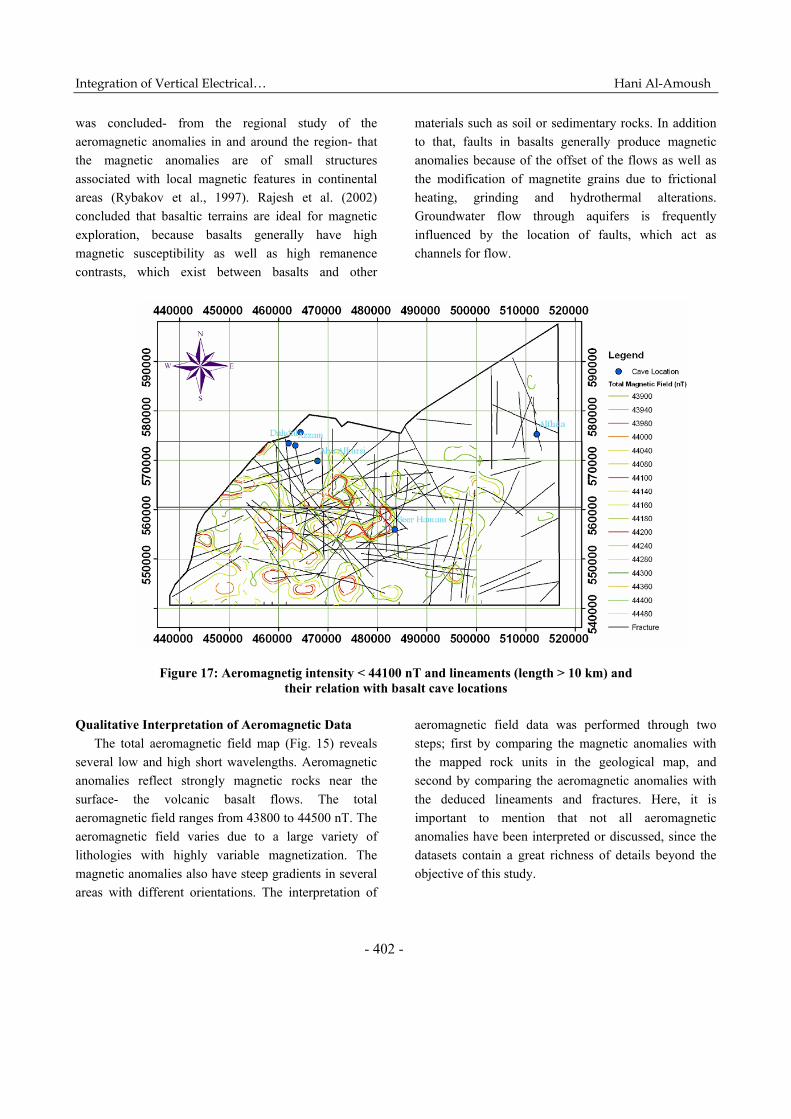
Figure 17: Aeromagnetig intensity < 44100 nT and lineaments (length > 10 km) and
their relation with basalt cave locations Qualitative Interpretation of Aeromagnetic Data
The total aeromagnetic field map (Fig. 15) reveals several low and high short wavelengths. Aeromagnetic anomalies reflect strongly magnetic rocks near the surface- the volcanic basalt flows. The total aeromagnetic field ranges from 43800 to 44500 nT. The aeromagnetic field varies due to a large variety of lithologies with highly variable magnetization. The magnetic anomalies also have steep gradients in several areas with different orientations. The interpretation of
aeromagnetic field data was performed through two steps; first by comparing the magnetic anomalies with the mapped rock units in the geological map, and second by comparing the aeromagnetic anomalies with the deduced lineaments and fractures. Here, it is important to mention that not all aeromagnetic anomalies have been interpreted or discussed, since the datasets contain a great richness of details beyond the objective of this study.

Jordan Journal of Civil Engineering, Volume 4, No. 4, 2010
- 403 -
Figure 18: (R.T.P.) magnetic anomaly with lineaments > 1 km
Figure 19: Regions of high potential of groundwater recharge
Quies Volc.
High Potential for Artificial Recharge Low Magnetic and highly fractured and faulted
Integration of Vertical Electrical… Hani Al-Amoush
- 404 -
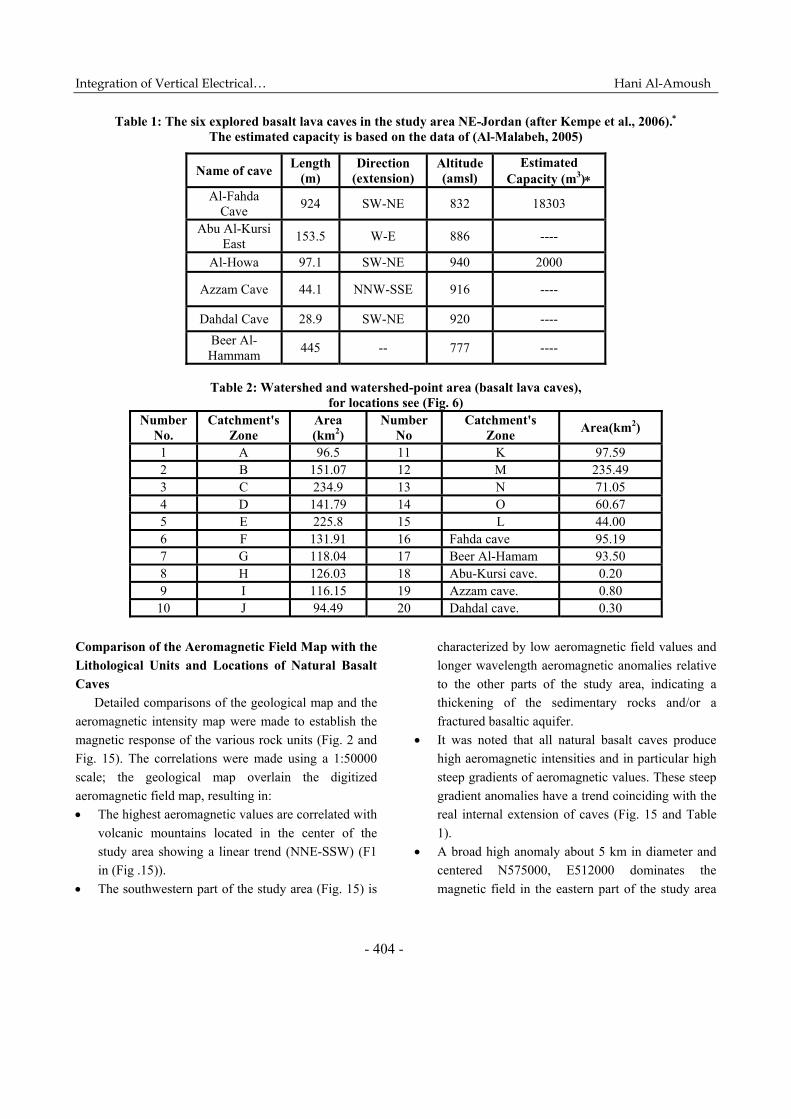
Table 1: The six explored basalt lava caves in the study area NE-Jordan (after Kempe et al., 2006).∗ The estimated capacity is based on the data of (Al-Malabeh, 2005)
Table 2: Watershed and watershed-point area (basalt lava caves), for locations see (Fig. 6)
Number No.
Catchment's Zone
Area (km2)
Number No
Catchment's Zone Area(km2)
1 A 96.5 11 K 97.59 2 B 151.07 12 M 235.49 3 C 234.9 13 N 71.05 4 D 141.79 14 O 60.67 5 E 225.8 15 L 44.00 6 F 131.91 16 Fahda cave 95.19 7 G 118.04 17 Beer Al-Hamam 93.50 8 H 126.03 18 Abu-Kursi cave. 0.20 9 I 116.15 19 Azzam cave. 0.80
10 J 94.49 20 Dahdal cave. 0.30 Comparison of the Aeromagnetic Field Map with the Lithological Units and Locations of Natural Basalt Caves
Detailed comparisons of the geological map and the aeromagnetic intensity map were made to establish the magnetic response of the various rock units (Fig. 2 and Fig. 15). The correlations were made using a 1:50000 scale; the geological map overlain the digitized aeromagnetic field map, resulting in: • The highest aeromagnetic values are correlated with
volcanic mountains located in the center of the study area showing a linear trend (NNE-SSW) (F1 in (Fig .15)).
• The southwestern part of the study area (Fig. 15) is
characterized by low aeromagnetic field values and longer wavelength aeromagnetic anomalies relative to the other parts of the study area, indicating a thickening of the sedimentary rocks and/or a fractured basaltic aquifer.
• It was noted that all natural basalt caves produce high aeromagnetic intensities and in particular high steep gradients of aeromagnetic values. These steep gradient anomalies have a trend coinciding with the real internal extension of caves (Fig. 15 and Table 1).
• A broad high anomaly about 5 km in diameter and centered N575000, E512000 dominates the magnetic field in the eastern part of the study area
Name of cave Length (m)
Direction (extension)
Altitude (amsl)
Estimated Capacity (m3)∗
Al-Fahda Cave 924 SW-NE 832 18303
Abu Al-Kursi East 153.5 W-E 886 ----
Al-Howa 97.1 SW-NE 940 2000
Azzam Cave 44.1 NNW-SSE 916 ----
Dahdal Cave 28.9 SW-NE 920 ---- Beer Al-Hammam 445 -- 777 ----
Jordan Journal of Civil Engineering, Volume 4, No. 4, 2010
- 405 -
and may be attributed to the presence of volcanic rocks or a deep causative magnetic source.
Comparison of the Aeromagnetic Field Map with the Lineaments and Fractures Map
The fracture-trace mapping, satellite lineaments mapping and the map of zones of weathering have a great and significant role in the delineations of potential sites for the recharge of groundwater (Allison, 1998). Detailed comparisons between the deduced lineaments and fractures model map and aeromagnetic intensity map were made to establish the magnetic signature for the various lineaments and fracture trends and densities. The lineaments map (Fig. 5) shows that fractures and lineaments have a high density with variable trends and lengths. The lengths of the mapped lineaments range from a few meters to about 30 km. Simplifying and clarifying the comparison processes between the aeromagnetic intensity map and the lineaments map, ArcGIS9.2 allow through query builder option to perform the correlations and comparisons at any desired aeromagnetic intensity values with any lineament length intervals. Two correlation process cases are presented here; first when the aeromagnetic intensity values are larger than 44100 nT and the length of the lineament more than 10 km (Fig. 16). The second case is when the aeromagnetic intensity values are less than 44100 nT and the length of the lineament more than 10 km (Fig. 17). The following specific information can be concluded through the detailed investigations of Figures 16 and 17. • The higher aeromagnetic intensity values are
concentrated in the northern and northeastern part as well as at the middle part of the study area having a trend in the NE-SW direction (Fig. 16).
• High densities of lineaments and fractures have been identified in the areas having lower aeromagnetic intensities such as the southern - middle western part of the study area (Fig. 17).
• There is almost a good correlation between the aeromagnetic anomalies and the mapped lineaments and fractures.
• The locations of natural basaltic lava caves were highly correlated with the presence of major lineaments (Figures 16 and 17), and with steep gradients of aeromagnetic intensities. In addition, the trend of each lineament around the natural basaltic cave is coincident with the real extension of the natural basalt cave (Table 1 and Figs. 16 and 17).
• It is concluded from the comparison of aeromagnetic intensity and geological maps that the south-western part of the study area is characterized by a thickening of the sedimentary basin or by a deep magnetic source. This conclusion is supported by the presence of high density of long lineaments (>10 km) and fractures. These lineaments are also intensively intersected with variable trends, at a low aeromagnetic field (Fig. 17). These lineament intersections are of great importance in groundwater recharge.
Therefore, this part of the study area was subjected to a more detailed analysis. The total aeromagnetic field data were reduced to the magnetic pole, which is a process effectively subtracting the regional earth's field, leaving only the local and shallow magnetic field strength. In addition, the inclinations were modified as the datasets were measured at poles (Reynolds, 1998). This process has been carried out and presented using the software (Mag-Pick, V2.93b). The reduced to the magnetic pole (R.T.P.) aeromagnetic map with a scale of 1:500000 was georeferenced and incorporated into ArcGIS9.2 and correlated with the lineaments and fractures model map (> 1km, Fig. 18).
In fact, there was no significant difference between the magnetic anomalies deduced from the total aeromagnetic intensity and that resulting from the transformation to the pole aeromagnetic anomaly map. This indicates that the shallow magnetic structures and basalt rocks have a higher effect on the total aeromagnetic intensity. However, the R.T.P. map is characterized by intense magnetic anomalies constituting several high and low peaks. By comparing the two maps; the (lineaments >1 km) map and the

Integration of Vertical Electrical… Hani Al-Amoush
- 406 -
reduced aeromagnetic anomaly (R.T.P.) map (Fig. 18), the following can be concluded: • The areas with low magnetic anomalies
characterized by the presence of high lineament and fracture density with different strike trending.
• The low magnetic zones (Fig. 18) possess the highest density of lineaments, and most of the lineament intersection centers are located within these low magnetic anomaly zones as indicated by the black arrows.
• The presence of basalt lava caves in high magnetic anomaly zones (Fig. 18) is associated with the locations of volcanic mountains; e.g., Quies volcanoes, as previously concluded from the comparison between the aeromagnetic intensity map and the geological map.
• The low magnetic anomalies and high lineament density regions (Fig. 18) could indicate the fractured basaltic groundwater aquifer, or the thickening of the sediments. Consequently, these regions can be considered as favorable sites to recharge the aquifer.
SUMMARY AND CONCLUSIONS
The basalt lava caves in central north Jordan are
found in specific geological configurations associated with the volcanic mountain locations. Therefore, it is expected to locate more undiscovered basaltic lava caves close to and near the volcanic centers. Basalt caves are found to exist near the surface of the earth at shallow depths extending horizontally beneath the ground surface in a tunnel-like shape. The nature of the extension and the existence underground the surface give two main advantages. First, it is easy to locate these underground caves by applying the different geophysical methods, because the existing basaltic caves were found to posses their own signature in the aeromagnetic intensity map as a steep gradient in aeromagnetic intensity values as well as their trends. Second, the natural basaltic caves could be used directly as subsurface storages for run off water. Two of the six
existing basaltic lava caves were found to have a relatively large watershed area. They are Al-Fahada cave with a watershed area of 95km2 and Beer Al-Hamam cave with a watershed area of 93 km2. However, these are watershed-points and not the real watershed that belongs to each cave, because the ArcHydro tools 9 model the watershed for each desired point or the nearest large watershed in case it has no own watershed. Therefore, the watershed point for Al-Fahada cave is located at a distance of 2 km to the north of the cave site, and the watershed-point for Beer-Al-Hamam cave is located at about 1.5 km east of the cave site. The other basalt caves have smaller watersheds (Table 2).
It was noted that each of the existing basaltic caves was associated with the presence of large lineaments (faults) with a length of more than 10 km. In addition, the area is characterized by high density of lineaments. These lineaments and fractures play a major role as conduits in transporting the surface water into the groundwater aquifer.
Regarding the potential of natural basalt caves for artificial groundwater recharge, and based on the following sets of criteria: cave capacity (internal capacity), cave watershed area, locations of the basaltic cave relative to the zones of highly lineament density and lineament intersection sites, it was found that Beer Al-Hamam and Al-Fahada caves have a high potential for groundwater artificial recharge, whereas, the other basalt caves have a moderate potential for groundwater recharge.
Under optimal conditions, water should reach the top of the saturated zone and spread laterally rather than building up a column of water toward the surface, which would greatly reduce recharge (Freez and Cherry, 1979). Rajesh et al. (2002) concluded that the zones subjected to artificial recharge must have a deeper water level condition; otherwise the artificial recharge would lead to water logging. In this study, and based on the resistivity survey results, the unsaturated zone was estimated to be larger than 150 m, which indicates a suitable thickness for any artificial recharge scheme. In

Jordan Journal of Civil Engineering, Volume 4, No. 4, 2010
- 407 -
addition to the unsaturated zone thickness, the existence of fractures and lineaments in the unsaturated zone can exert dominant controls on a flow system, since these features occur in hard rock regions as conduits which act as transporters for the water to the groundwater aquifer. The relatively high values of resistivity and the increase of resistivity with depth (Fig. 9) could indicate the presence of layers of free-clay horizons and impede layers at greater depths within the unsaturated zone, which also gives advantage for groundwater artificial recharge. To summarize, the regions of high fracturing, dense lineaments and lineament intersections in addition to low aeromagnetic intensities are considered regions
of a high potential for artificial groundwater recharge (Fig. 19).
Acknowledgments
The author sincerely acknowledges Prof. Peter Rotschmann and Dr. Eng. Frans Zunic from the Technical University Munich (TUM) for their great valuable suggestions and their warm hospitality during my stay in Munich. Critical and constructive review of the manuscript by Prof. Elias Salameh from the University of Jordan and the reviewers is greatly appreciated. This research was supported by a grant from the German Foundation of Sciences (DFG).
REFERENCES
Al-Amoush, H. 2006. Hydro-geophysical investigations for
the purposes of groundwater artificial recharge in the Jordan valley area. Unpublished PhD Thesis, University of Jordan.
Al-Dmour, T. M. 1992. Interpreting the geology of Azraq, south area of Jordan, using landsat TM data. Geology directorate, NRA, Jordan.
Allison, R. J. 1998. Geology, geomorphology, hydrology, groundwater and physical resources. In: R. Dutton, J. Clarke and A. Battikhi (eds.), Arid Land Resources and their Management, Jordan Desert Margin, Kegan Paul International, London, 332p.
Al-Malabeh, A. 2005. New discoveries supporting eco-tourism in Jordan. In: Abstract Book, 6. Jordan, Proc. 1st Economic Jordanian Forum. Amman.
Al-Tarawneh, K. 1996. The geology of Al-Hamidiyya (Al-Hababiyya) area, Map Sheet No. 3354II, Bulletin 35, Geology Directorate, Geological Mapping Division, Natural Resources Authority, Amman, Jordan.
ArcHydro. 2005. Arc Hydro tools - tutorial, Version 1.1, Final report (Esri), www.esri.com.
Arsalan, F. A. 1974. Geologie und Hydrogeologie der Azraq-Depression (Ost-Jordanien), Unpublished PhD Thesis.
Bender, F. 1968. Geologie von Jordanian, V (7). Gebrüder Bornträger, Berlin, Germany, 230p.
ERDAS .2005. Software imaging and remote sensing image analysis. www.erdas.com.
ESRI-Environmental Systems Research Institute. 2009. ArcView GIS version 9.2. A computer software to visualize, explore, query and analyze data spatially, USA.
Freeze, A. R. and Cherry, A .J. 1979. Groundwater, Prentice-Hall, Englewood Cliffs, NJ, 559p.
Gibbs, B. 1993. Hydrogeology of the Azraq basin north-east Badia, Jordan. Unpublished M.Sc. Thesis. University College, London.
Golden Software. 2002. Surfer 8.0, Surface Mapping Software. www.goldensoftware.com.
Hassouneh, M. 1998. Jordan aeromagnetic map, scale 1:500000, Natural Resources Authority, Jordan.
Kempe, S., Al-Malabeh, A., Frehat, M. and Henschel, H.V. 2006. State of lava cave research in Jordan. - Proc. 12th Intern. Symp. on Vulcanospeleology, Tepo, Mexico, 2-7 July 2006, Mexico.
MagPick. V2.93b. 2008. Software for magnetic map and profile processing. www.geometrics.com.
MWI. 2008. Ministry of Water and Irrigation of Jordan, Open files. www.mwi.gov.jo.
Natural Resources Authority (NRA). 2008. Internal open

Integration of Vertical Electrical… Hani Al-Amoush
- 408 -
files. www.nra.gov.jo. Noble, P. 1994. Quantification of recharge to the Azraq
basin, NE Badia, Jordan. Unpublished M.Sc. Thesis. University College, London.
Orenella, E. and Mooney, H.M. 1966. Master tables and curves for vertical electrical sounding over layered structures. Interciencia, Madrid. 34p.
Phoenix Corporation. 1980. A comprehensive airborne magnetic/radiometric survey of the Hashemite Kingdom of Jordan, Natural Resources Authority, Unpublished report, Jordan.
Rajesh, R., Murty, T.R. and Shankar, H. 2002. Electrical resistivity survey to demarcate potential sites for groundwater and artificial recharging in a part of Precambrian crystalline province of peninsular India. Journal of Applied Hydrology, 15: 39-48.
Reynolds, John M. 1998. An introduction to applied and environmental geophysics, Chichester, England, John Wiely and Sons, Ltd., 796p.
Royal Jordanian Geographic Centre (RJGC). 2005. GIS maps. Found at: http://www.rjgc.gov.jo.
Rybakov, V., Goldschmidt and Rotstein, Y. 1997. Geophysical Research Letter, 24 (1): 33-36.
Salameh, E. 1996. Water Quality Degradation in Jordan, Friedrich Ebert Stiftung, Amman, Jordan.
Salameh, E. 2001. The potential of groundwater artificial recharge in the Jordan Valley area/Jordan. Selected contributions to applied geology in the Jordan rift valley, Freiburger Forschungshefte C494; 63-81, Freiburg.
Telford, W.M., Geldart, L.P. and Sheriff, R.E. 1990. Applied geophysics, 2nd edition, Cambridge University Press, Cambridge, 792p.
Velpen, V. 1988. RESIST. A computer program to process resistivity sounding data on PC compatibles, Computer and Geosciences, 19 (5): 691-703.
WAJ. 2008. Water Authority of Jordan, Internal Open files. www.waj.gov.jo
Zohdy, A. R. 1965. The auxiliary point method of electrical sounding interpretation and its relationship to Dar-Zarrouk parameters, Geophysics, 30: 644-660.
Zohdy, A.R., Eaton, G.P. and Mabey, D.R. 1974. Application of surface geophysics to groundwater investigations, In: U.S.Geol. Surv. Techniques of water resources investigation, Book 2, Chap. D1, 116.
Zohdy, A.R. and Bisdorf, R.J. 1989. Programs for the automatic processing and interpretation of Schlumberger sounding curves in Quick Basic. U.S. Geological Survey, (Open file Report 89-137-2, 64 p).