integration of sustainable development ... - gossart.wp.imt…
TRANSCRIPT

1
INTEGRATION OF SUSTAINABLE DEVELOPMENT INTO SECTORAL
POLICIES (TR 0402.11)
INTERIM REPORT ON SCIENCE AND TECHNOLOGY (S&T) SECTOR
I. Introduction
It can be stated without too much difficulty that sustainable development is doubtless the
most daunting challenge which humanity has ever faced. Many of the international documents
starting from ‘World Commission on Environment and Development Report- Our Common
Future’ (Brundtland Report, 1987) to the Action Plan of the EU have basically shared three
components for the concept of sustainable development: (Valenduc and Vendramin, 1997).
• the question of ecology, natural resources and global changes;
• the question of solidarity and justice, between present and future generations and
between developing and developed countries;
• the question of economic growth and regulation, production and consumption.
Dealing with these issues and achieving success require that the fundamental issues be
addressed immediately at local, regional and global levels. The function of science and
technology cannot be denied at all levels. Suitable technologies and scientific knowledge are
focal for the resolution of the economic, social and environmental problems that cause
existing development paths to be unsustainable. In this context, not only the natural and
engineering sciences but also the social sciences are called for an action. Moreover, an
interdisciplinary approach is inevitable. This requires S&T community to provide an essential
effort to challenge the existing problems. However, this task cannot solely be realized by the
struggle of the S&T community. A strapping collaboration among S&T community, private
and public sector and NGOs is a precondition for success towards sustainable development.
This study will focus on the role of S&T for sustainable development in Turkey and on
the integration of sustainable development principles into S&T policies. It contains, somewhat
overlapping, five phases in which each requires different types of approaches. The first is the
analysis of the current situation in terms of the external environment such as impacts of
demographics and macroeconomic factors and internal environment, for instance the main
problems of the sector, actors in the sector, etc. The second phase is an analysis of sectoral
sustainability focusing on the principles, mechanisms, decision-making processes, and etc. in
the sector. In fact, towards the end of this phase, we will still make an analysis of the current

2
situation. Thus, the approach utilized is the review of the existing evidence. However, last
issues of the second phase (the determination of the targets of the sector, policy options, and
the prospect for the role of the actors) require a change in the methodology in which the views
of the partners of the project should be fully documented. The next phase concerns inter-
sectoral integration. This phase mainly puts forward the relations among the other sectors of
the project. The fourth phase is the evaluation of the policy alternatives while the final one
focuses on sectoral sustainable development indicators.
II. Turkish S&T Sector in Retrospect
The S&T sector in Turkey has experienced a prolonged period of instability,
especially until 2003. The non-existence of sector-specific polices for a long time period is the
basic cause of this instability. Besides others that will be discussed later in this report, the
political and macroeconomic instability are the principal problem areas. The impact of
macroeconomic instability on the sector operates through two channels, namely demand and
supply driven channels or frankly speaking consumption and production of S&T. While
governments were unable to allocate necessary funds to the sector because of structural
problems in the economy, the private sector did not demand too much from the sector because
of the market uncertainties and its associated high costs. One of the main indicators in the
sector, the share of R&D expenditures out of GDP, is far below EU average. The composition
of R&D expenditures is also problematic, in the sense that the share of the private sector is
relatively lower than what it is in the most competitive economies. However, the picture
seems to change radically after 2003. The macroeconomic stability reached after 2003 has
significant reflections on the sector. As we will discuss later, major steps are taken forward to
improve the performance of the sector. It is observed that a relative improvement in the
sectors’ indicators have been realized in the period 2003-2007.
The influence of demographic factors generally runs through human capital. The high
population growth and the rapid urbanization coupled with regional disparities trigger the
difficulties in the educational infrastructure. The unequal opportunities created by this process
in the education system, the low quality of the education, the mismatch between the demand
and supply of labor because of planning inefficiencies, the lack of vocational training,
problems in the higher educational system, to name but a few, generate problem areas for the
sector. In this report, the focus will not be places on the details of demographic and
macroeconomic dynamics but rather on the sector-specific characteristics.

3
II.1 Some Stylized Facts on the Turkish S&T Sector
One of the main performance indicators for S&T sector on a society’s welfare is the
economy’s competitiveness in the world markets. The competitive performance of an
economy, of course, depends on other factors as well yet the above average performance in
the S&T sector is decisive for the success in global markets. One of the widely used indicators
in the literature is Global Competitiveness Index.1 According to the latest Global
Competitiveness Index (GCI, 2006), Turkey ranks 59th. Compared to her rank (71) in the
previous year, she performs quite well in a year. The GCI is composed of nine sub-indices,
namely institutions, infrastructure, macroeconomy, health and primary education, higher
education and training, market efficiency, technological readiness, business sophistication,
and innovation.2
Table 1 shows the comparative performance of Turkey with the recent EU entrants and
candidate countries. For the general index depicted by the first two columns of the Table 1,
the performance of Turkey does not seem to be competitive. She only outperforms performs
Romania and Bulgaria, and even the other candidate country, Croatia, is more competitive
than Turkey. For other sub-indices Turkey performs better in institutions (51), higher
education and training (57), market efficiency (47), business sophistication (39), and
innovation (51) as compared to the general index. However, its rank is considerably low for
the macroeconomy sub-index (111). Moreover, even though not as bad as macroeconomy
sub-index, her rank for the health and primary education sub-index is not promising (78). For
our purposes, the most significant sub-indices are higher education and training, technological
readiness, and innovation. The higher education and training sub-index mainly measures the
quantity and quality of education, as well as the quality of on-the-job-training. The Turkish
score (4.15) is significantly below the average of new entrants (4.84). Furthermore, Turkey
only outperforms Bulgaria. The technological readiness sub-index sketches a more positive
picture for Turkey since her rank in terms of this index is above the general index. Finally, the
innovation sub-index, measuring the capacity of innovation, presents us the best image among
these three sub-indices. For this measure, Turkey outperforms Latvia, Malta, Cyprus,
Romania, and Bulgaria and its score (3.35) is very close to that of China (3.44), Greece
(3.43), Italy (3.50) and Poland (3.47) (GCI, 2006).
1 There are some problems with the reliability of this index in a time-series setting because of the frequent changes in definitions of variables. 2 The detailed technical information on these indices can be seen at the Appendix TableA1.
4
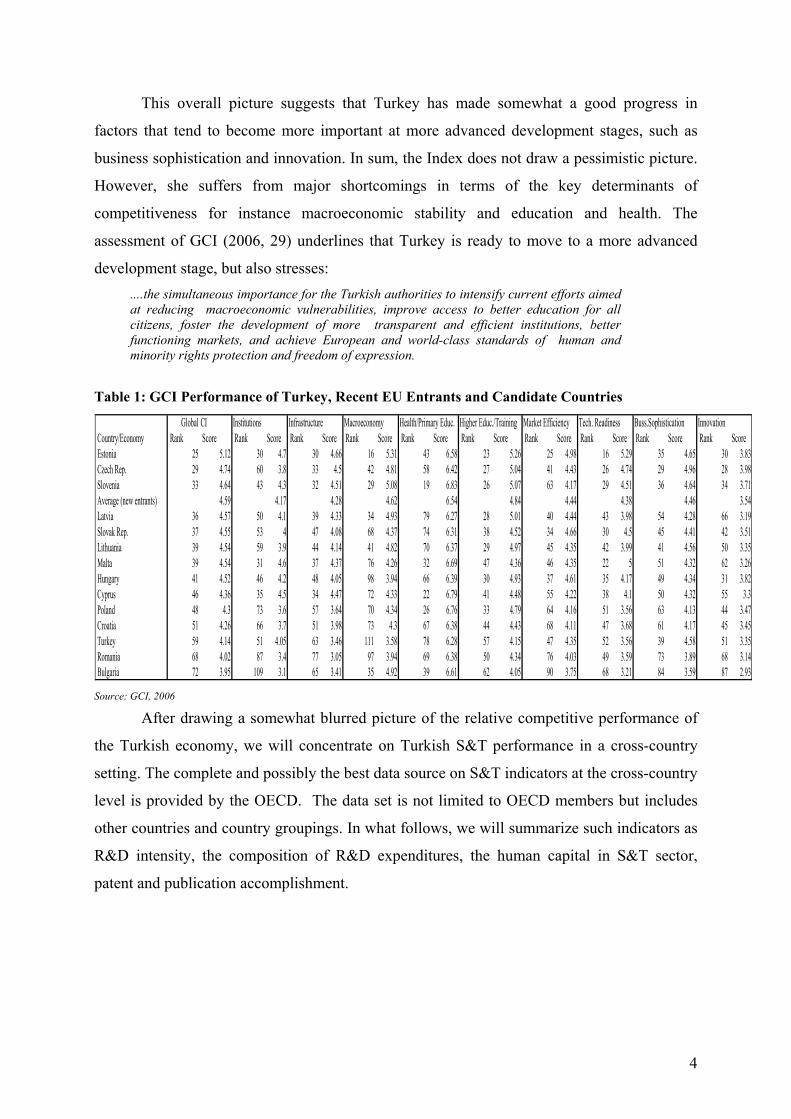
This overall picture suggests that Turkey has made somewhat a good progress in
factors that tend to become more important at more advanced development stages, such as
business sophistication and innovation. In sum, the Index does not draw a pessimistic picture.
However, she suffers from major shortcomings in terms of the key determinants of
competitiveness for instance macroeconomic stability and education and health. The
assessment of GCI (2006, 29) underlines that Turkey is ready to move to a more advanced
development stage, but also stresses: ....the simultaneous importance for the Turkish authorities to intensify current efforts aimed at reducing macroeconomic vulnerabilities, improve access to better education for all citizens, foster the development of more transparent and efficient institutions, better functioning markets, and achieve European and world-class standards of human and minority rights protection and freedom of expression.
Table 1: GCI Performance of Turkey, Recent EU Entrants and Candidate Countries
Global CI Institutions Infrastructure Macroeconomy Health/Primary Educ. Higher Educ./Training Market Efficiency Tech. Readiness Buss.Sophistication Innovation Country/Economy Rank Score Rank Score Rank Score Rank Score Rank Score Rank Score Rank Score Rank Score Rank Score Rank Score Estonia 25 5.12 30 4.7 30 4.66 16 5.31 43 6.58 23 5.26 25 4.98 16 5.29 35 4.65 30 3.83 Czech Rep. 29 4.74 60 3.8 33 4.5 42 4.81 58 6.42 27 5.04 41 4.43 26 4.74 29 4.96 28 3.98 Slovenia 33 4.64 43 4.3 32 4.51 29 5.08 19 6.83 26 5.07 63 4.17 29 4.51 36 4.64 34 3.71 Average (new entrants) 4.59 4.17 4.28 4.62 6.54 4.84 4.44 4.38 4.46 3.54 Latvia 36 4.57 50 4.1 39 4.33 34 4.93 79 6.27 28 5.01 40 4.44 43 3.98 54 4.28 66 3.19 Slovak Rep. 37 4.55 53 4 47 4.08 68 4.37 74 6.31 38 4.52 34 4.66 30 4.5 45 4.41 42 3.51 Lithuania 39 4.54 59 3.9 44 4.14 41 4.82 70 6.37 29 4.97 45 4.35 42 3.99 41 4.56 50 3.35 Malta 39 4.54 31 4.6 37 4.37 76 4.26 32 6.69 47 4.36 46 4.35 22 5 51 4.32 62 3.26 Hungary 41 4.52 46 4.2 48 4.05 98 3.94 66 6.39 30 4.93 37 4.61 35 4.17 49 4.34 31 3.82 Cyprus 46 4.36 35 4.5 34 4.47 72 4.33 22 6.79 41 4.48 55 4.22 38 4.1 50 4.32 55 3.3 Poland 48 4.3 73 3.6 57 3.64 70 4.34 26 6.76 33 4.79 64 4.16 51 3.56 63 4.13 44 3.47 Croatia 51 4.26 66 3.7 51 3.98 73 4.3 67 6.38 44 4.43 68 4.11 47 3.68 61 4.17 45 3.45 Turkey 59 4.14 51 4.05 63 3.46 111 3.58 78 6.28 57 4.15 47 4.35 52 3.56 39 4.58 51 3.35 Romania 68 4.02 87 3.4 77 3.05 97 3.94 69 6.38 50 4.34 76 4.03 49 3.59 73 3.89 68 3.14 Bulgaria 72 3.95 109 3.1 65 3.41 35 4.92 39 6.61 62 4.05 90 3.75 68 3.21 84 3.59 87 2.93 Source: GCI, 2006
After drawing a somewhat blurred picture of the relative competitive performance of
the Turkish economy, we will concentrate on Turkish S&T performance in a cross-country
setting. The complete and possibly the best data source on S&T indicators at the cross-country
level is provided by the OECD. The data set is not limited to OECD members but includes
other countries and country groupings. In what follows, we will summarize such indicators as
R&D intensity, the composition of R&D expenditures, the human capital in S&T sector,
patent and publication accomplishment.

5
Table 2: GERD Intensity in OECD Area and Selected Countries Country 1991 1995 2000 2004 2005 Australia - - 1.51 1.76 1.76b
Austria 1.44 1.54 1.92 2.23 2.47c
Belgium 1.58 1.67 1.97 1.86 1.82 Canada 1.57 1.70 1.92 2.02 1.98 Czech Republic - 0.95 1.21 1.26 1.42 Denmark 1.61 1.82 - 2.50 2.45 Finland 2.00 2.27 3.34 3.45 3.42c
France 2.33 2.29 2.15 2.14 2.13 Germany 2.47 2.19 2.45 2.49 2.46 Greece 0.28 0.38 - 0.48 0.49 Hungary 1.04 0.71 0.78 0.88 0.94 Iceland 1.15 1.53 2.69 - 2.81 Ireland 0.92 1.26 1.13 1.25 1.34c
Italy 1.19 0.97 1.05 1.10 1.1b
Japan 2.96 2.92 3.04 3.17 3.33 Korea 1.84 2.37 2.39 2.85 3.00 Luxembourg - - 1.65 1.66 1.56 Mexico - 0.31 0.37 0.47 0.50 Netherlands 1.96 1.97 1.83 1.78 1.78b
New Zealand 0.97 0.95 - 1.14a 1.14a
Norway 1.63 1.69 - 1.59 1.52 Poland 0.74 0.63 0.64 0.56 0.57 Portugal 0.54 0.54 0.76 0.77 0.80 Slovak Republic 2.10 0.92 0.65 0.51 0.51 Spain 0.82 0.79 0.91 1.06 1.12 Sweden 2.70 3.32 - 3.71 3.89 Switzerland - - 2.57 2.93 2.93b
Turkey 0.53 0.38 0.64 0.67 0.79
United Kingdom 2.07 1.95 1.86 1.73 1.78 United States 2.71 2.51 2.74 2.58 2.61c
Argentina - - 0.44 0.44 0.46 China 0.73 0.57 0.90 1.23 1.34 Israel 2.36 2.62 4.45 4.43 4.57c
Romania 0.79 0.80 0.37 0.39 0.41 Russia 1.43 0.85 1.05 1.16 1.07 Singapore - 1.15 1.88 2.23 2.36 Slovenia - 1.57 1.43 1.45 1.22 South Africa 0.84 - - 0.86 0.86b
Taiwan - 1.72 1.97 2.44 2.52 EU15 1.85 1.76 1.85 1.85 1.86 EU25 - 1.68 1.76 1.75 1.77 OECD 2.19 2.07 2.22 2.21 2.25
a2003 values, b2004 values, c2006 values Source: OECD, Main Science and Technology Indicators, 2007and TÜİK, 2007.

6
Table 2 presents the GERD (Gross Domestic Expenditures on R&D) as a percentage of GDP (
“GERD intensity” ). In March 2000, the European Council agreed on a new strategic and
ambitious goal: making EU "the most competitive and dynamic knowledge-based economy in
the world by 2010", which was later known as the “Lisbon strategy” (EC, 2000). This strategy
was a milestone for EU research and innovation policies, since new policy tools and
institutions were introduced, and new strategies developed for the future of the EU. With the
Lisbon strategy, the EU decided to increase R&D expenditures. During the 2002 Barcelona
meeting of the European Council, it was decided to increase R&D expenditures in member
states to 3 percent of their GDP by 2010 (EC, 2002). This target can be evaluated as too
ambitious and becoming a some sort of fetish for policy-making. In accordance with these
objectives, Turkey has set new targets for GERD intensity. By the end of 2010, the objective
of reaching an R&D intensity of 2 percent has been set, compared to the 2005 value of 0.79
(BYTK, 2004).3
Figure 1: GERD Intensity in Turkey
0.32
0.44 0.450.5
0.64
0.720.67
0.610.67
0.79
0.63
0.49
0.380.36
0.530.49
0
0.1
0.2
0.3
0.4
0.5
0.6
0.7
0.8
0.9
1990 1991 1992 1993 1994 1995 1996 1997 1998 1999 2000 2001 2002 2003 2004 2005
Year
GE
RD
Inte
nsity
(%)
Source: TÜİK, 2007
3 For all Turkish targets on main S&T indicators, see Table A2 at the Appendix.

7
Figure 2: R&D Expenditures in Turkey (2005 Prices)
3835
3190
268523402335
2780
0
500
1000
1500
2000
2500
3000
3500
4000
4500
2000 2001 2002 2003 2004 2005
Year
Mill
ion
YTL
Source: TÜİK, 2007
Table 2, Figure 1 and Figure 2 reveal the following facts:
• Both EU (1.81%) and Turkey (0.79%) are far from reaching predetermined target
levels of GERD intensity. However, the GERD intensity in Turkey exhibits a
significant upward trend after 2002 and reaches a historical peak in 2005. The R&D
expenditures in Turkey increase 38% at real terms in the period 2000-2005. This
situation exhibits a notable success.
• The OECD average is more promising mainly because of high levels of R&D
intensities’ of USA, Japan, Korea, and Switzerland.
• The only EU members having a level above 3% are Finland and Sweden. They rank
second and third in global competitiveness index respectively (GCI, 2006). These two
countries are not the sole examples. For countries with high level of GERD intensity, a
perfect correlation is observed in terms of competitiveness, i.e. Switzerland (1),
Denmark (4), Singapore (5), USA (6), and Japan (7), etc.
• Turkey has reached a level of 0.53% in 1991. Yet the frequent economic and political
crises combined with non-existence of specific polices in the sector cause mild
increases in GERD intensity for the period between 1991-2003, and even absolute
8
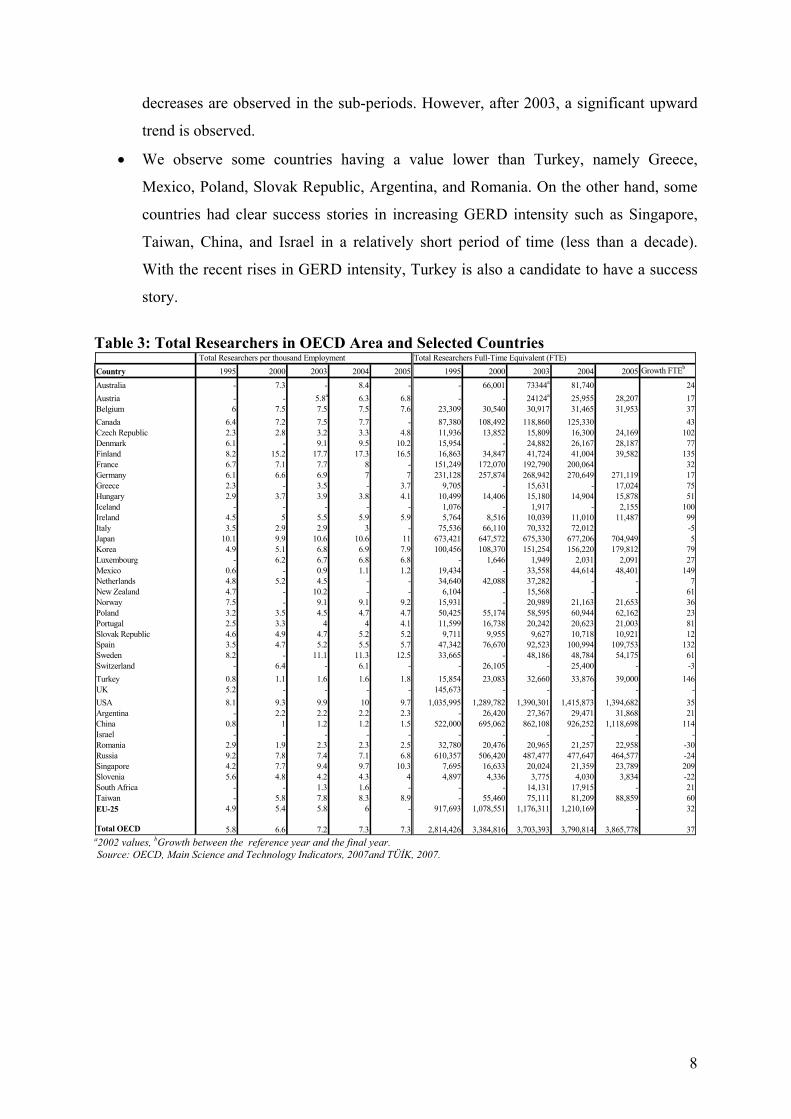
decreases are observed in the sub-periods. However, after 2003, a significant upward
trend is observed.
• We observe some countries having a value lower than Turkey, namely Greece,
Mexico, Poland, Slovak Republic, Argentina, and Romania. On the other hand, some
countries had clear success stories in increasing GERD intensity such as Singapore,
Taiwan, China, and Israel in a relatively short period of time (less than a decade).
With the recent rises in GERD intensity, Turkey is also a candidate to have a success
story.
Table 3: Total Researchers in OECD Area and Selected Countries
Total Researchers per thousand Employment Total Researchers Full-Time Equivalent (FTE)Country 1995 2000 2003 2004 2005 1995 2000 2003 2004 2005 Growth FTEb
Australia - 7.3 - 8.4 - - 66,001 73344a 81,740 24Austria - - 5.8a 6.3 6.8 - - 24124a 25,955 28,207 17Belgium 6 7.5 7.5 7.5 7.6 23,309 30,540 30,917 31,465 31,953 37Canada 6.4 7.2 7.5 7.7 - 87,380 108,492 118,860 125,330 43Czech Republic 2.3 2.8 3.2 3.3 4.8 11,936 13,852 15,809 16,300 24,169 102Denmark 6.1 - 9.1 9.5 10.2 15,954 - 24,882 26,167 28,187 77Finland 8.2 15.2 17.7 17.3 16.5 16,863 34,847 41,724 41,004 39,582 135France 6.7 7.1 7.7 8 - 151,249 172,070 192,790 200,064 32Germany 6.1 6.6 6.9 7 7 231,128 257,874 268,942 270,649 271,119 17Greece 2.3 - 3.5 - 3.7 9,705 - 15,631 - 17,024 75Hungary 2.9 3.7 3.9 3.8 4.1 10,499 14,406 15,180 14,904 15,878 51Iceland - - - - - 1,076 - 1,917 - 2,155 100Ireland 4.5 5 5.5 5.9 5.9 5,764 8,516 10,039 11,010 11,487 99Italy 3.5 2.9 2.9 3 - 75,536 66,110 70,332 72,012 -5Japan 10.1 9.9 10.6 10.6 11 673,421 647,572 675,330 677,206 704,949 5Korea 4.9 5.1 6.8 6.9 7.9 100,456 108,370 151,254 156,220 179,812 79Luxembourg - 6.2 6.7 6.8 6.8 - 1,646 1,949 2,031 2,091 27Mexico 0.6 - 0.9 1.1 1.2 19,434 - 33,558 44,614 48,401 149Netherlands 4.8 5.2 4.5 - - 34,640 42,088 37,282 - - 7New Zealand 4.7 - 10.2 - - 6,104 - 15,568 - - 61Norway 7.5 - 9.1 9.1 9.2 15,931 - 20,989 21,163 21,653 36Poland 3.2 3.5 4.5 4.7 4.7 50,425 55,174 58,595 60,944 62,162 23Portugal 2.5 3.3 4 4 4.1 11,599 16,738 20,242 20,623 21,003 81Slovak Republic 4.6 4.9 4.7 5.2 5.2 9,711 9,955 9,627 10,718 10,921 12Spain 3.5 4.7 5.2 5.5 5.7 47,342 76,670 92,523 100,994 109,753 132Sweden 8.2 - 11.1 11.3 12.5 33,665 - 48,186 48,784 54,175 61Switzerland - 6.4 - 6.1 - - 26,105 - 25,400 - -3Turkey 0.8 1.1 1.6 1.6 1.8 15,854 23,083 32,660 33,876 39,000 146UK 5.2 - - - - 145,673 - - - - -USA 8.1 9.3 9.9 10 9.7 1,035,995 1,289,782 1,390,301 1,415,873 1,394,682 35Argentina - 2.2 2.2 2.2 2.3 - 26,420 27,367 29,471 31,868 21China 0.8 1 1.2 1.2 1.5 522,000 695,062 862,108 926,252 1,118,698 114Israel - - - - - - - - - - -Romania 2.9 1.9 2.3 2.3 2.5 32,780 20,476 20,965 21,257 22,958 -30Russia 9.2 7.8 7.4 7.1 6.8 610,357 506,420 487,477 477,647 464,577 -24Singapore 4.2 7.7 9.4 9.7 10.3 7,695 16,633 20,024 21,359 23,789 209Slovenia 5.6 4.8 4.2 4.3 4 4,897 4,336 3,775 4,030 3,834 -22South Africa - - 1.3 1.6 - - - 14,131 17,915 - 21Taiwan - 5.8 7.8 8.3 8.9 - 55,460 75,111 81,209 88,859 60EU-25 4.9 5.4 5.8 6 - 917,693 1,078,551 1,176,311 1,210,169 - 32
Total OECD 5.8 6.6 7.2 7.3 7.3 2,814,426 3,384,816 3,703,393 3,790,814 3,865,778 37 a2002 values, bGrowth between the reference year and the final year. Source: OECD, Main Science and Technology Indicators, 2007and TÜİK, 2007.

9
Figure 2a: Full-Time Equivalent Human Resources in Turkey
49
24
34
14 15 16 16 17 1822
23 23 2427 28 29
3840
39
33
23232019
11 12 13 14 1416 18 19
0
10
20
30
40
50
60
1990 1991 1992 1993 1994 1995 1996 1997 1998 1999 2000 2001 2002 2003 2004 2005
Year
Num
ber
of P
erso
ns (x
1000
)
FTE R&D Personnel FTE Reasearchers
Source: TÜİK, 2007 Figure 2b: R&D Personnel and Researchers in Turkey
22
11
1618
8 8 89
89 10
11 11 1113 13
14
18 18
15
56 6 6
7 7 8 8 89 10 11
0
5
10
15
20
25
1990 1991 1992 1993 1994 1995 1996 1997 1998 1999 2000 2001 2002 2003 2004 2005
Year
Num
ber o
f Per
sons
Total R&D Personnel per ten thousand EmploymentTotal Researchers per ten thousand Employment
Source: TÜİK, 2007

10
• In sum, as one of the key S&T indicator, the rise in GERD intensity has a positive
contribution in an economy’s overall performance. Turkish government allocated 456
million YTL in 2005 year budget to support R&D activities and to achieve the R&D
intensity target (TÜBİTAK, 2005). This change, of course, has a positive impact on
economic performance. However, its effect on GERD intensity is unclear because
Turkey has also realized an extraordinary economic growth performance. In other
words, the question is whether Turkey has allocated the necessary resources, obtained
from the rise in GDP, to R&D expenditures in order to achieve a significant rise in
GERD intensity. In the context, of the available data until 2005, we have a positive
answer for this question. In the period 2000-2005, the rise in GDP in constant 2005
prices is around 19% while the rise in R&D expenditures is around 38%.
Another important measure for S&T performance is the number of researchers
adjusted by per thousand of employment or by its full-time equivalent (FTE). Again, by
the end of 2010, it was aimed to increase the researcher ratio to 2.3, compared to 1.1 in
2003 (TÜBİTAK, 2004). Table 3, Figures 2a and 2b present these two measures together
with the growth in FTE in the period under investigation.
The picture from Table 3, Figures 2a and 2b suggests that
• The positive correlation between global competitiveness and researchers’ indicators
are observed again.
• Unfortunately, Turkey’s performance in terms of total researchers per thousand
employment by the end of 2005 is not promising. For total researchers per thousand
employment, Turkey (1.80) only outperforms China (1.5), South Africa (1.6), and
Mexico (1.2). However, the growth rate of 20% in the period 2003-2005 demonstrates
a potential for future.
• For total FTE researchers, Turkey has significantly less researchers compared to other
countries having a similar level of development and a comparable population.
However, the growth rate in FTE researchers is promising for the future. Turkish
growth rate of FTE researchers (146%) is both above the average growth rate of FTE
researchers in the EU (32%) and in the OECD (37%). It is the third highest growth
rate in Table 3. This means that Turkey has an opportunity to catch-up with other
countries in terms of this criterion. Moreover, Turkey has almost reached her 2010
target of 40,000 FTE researchers. This fact supports our previous finding that Turkey
has a critical mass of human capital for further development (Erdil, 2001).

11
The question of ‘who is financing the R&D’ is as important as the level of R&D
intensity. For successful R&D-financing and competitive economies, we have witnessed
that GERD is more financed by industry rather than government. Table 4 and Figure 3
exhibit the composition of GERD by source of finance. According to them,
• By 2005, more than 40% of Turkish GERD is financed by industry and half of it by
government. The EU averages are respectively 53.6% and 35% in 2003. The
composition is even more distinctive for OECD (62.1% and 30.2%) in 2004.
Nevertheless, industrial R&D is recovering in the last three years, from 36.2% in 2003
to 43.3% in 2005.
• The comparably lower levels of GERD financed by industry are also attained by some
EU members such as Greece (28.2%), Hungary (39.4%), Poland (33.4%), and
Portugal (31. 7%), meaning that together with Turkey, these countries are not able to
overcome the structural difficulties they face when encouraging industry to finance
R&D activities.
• The last block of Table 4 showing the share of foreigners in financing R&D
expenditures is also worth mentioning. Turkey has a very low figure (0.4%) in terms
of this indicator.
• On the other hand, for other countries we observe two different patterns: developed
countries that traditionally attract higher foreign expenditures on R&D (Austria,
Belgium, Denmark, Netherlands and UK), and countries at lower levels of
development (Greece, Hungary, Russia, Slovenia, and South Africa). Concerning the
foreign financing of R&D, Turkey should reach the levels of this latter group in the
next decade.

12
Figure 3: Percentage of GERD by Source of Finance in Turkey
36.8
44.941.3 43.3
27.4
28.533.8
31.2
33
30.8
41.8
41.8 43.3 42.936.2
37.9
5757
50.648
50.647.7
53.353.7
56.6
62.4
71.4 70.164 65.2
60.4 50.1
5.84.85.26.96.35.24.24.52.66.64.84.92.80.9 1.3 1.8
0
10
20
30
40
50
60
70
80
1990 1991 1992 1993 1994 1995 1996 1997 1998 1999 2000 2001 2002 2003 2004 2005
Year
Rat
io
Industry Government Other National Sources Abroad
Source: TÜİK, 2007

13
Table 4: Percentage of GERD by Source of Finance in OECD Area and Selected Countries Ind ustry (% ) G o vernm en t (% ) O ther N atio na l S o urces (% ) A b ro ad (% )
C o u n try 1 9 9 5 2 0 0 0 2 0 0 3 2 0 0 4 2 0 0 5 1 9 9 5 2 0 0 0 2 0 0 3 2 0 0 4 2 0 0 5 1 9 9 5 2 0 0 0 2 0 0 3 2 0 0 4 2 0 0 5 1 9 9 5 2 0 0 0 2 0 0 3 2 0 0 4 2 0 0 5A ustra lia - 4 6 .3 4 8 .8 b 5 1 .6 - - 4 5 .5 4 2 .4 b 3 9 .8 - - 4 .7 4 .7 b 2 .1 - - 3 .5 4 .1 b 3 .6 -A ustria 4 5 .7 4 1 .8 4 5 .1 4 7 .2 4 5 .5 4 6 .9 3 8 .0 3 4 .4 3 2 .6 3 6 .5 0 .4 0 .3 0 .4 0 .9 0 .4 7 .0 1 9 .9 2 0 .0 1 9 .4 1 7 .6B elg ium 6 7 .1 6 2 .4 6 0 .3 - - 2 3 .1 2 2 .9 2 3 .5 - - 2 .3 2 .4 3 .2 - - 7 .5 1 2 .2 1 2 .9 - -C anad a 4 5 .7 4 4 .9 4 9 .5 4 9 .0 4 7 .9 3 5 .9 2 9 .3 3 2 .1 3 2 .0 3 2 .9 6 .9 8 .4 9 .6 1 0 .0 1 0 .5 1 1 .6 1 7 .5 8 .7 9 .0 8 .7C zech R ep ub lic 6 3 .1 5 1 .2 5 1 .4 5 2 .8 5 4 .1 3 2 .3 4 4 .5 4 1 .8 4 1 .9 4 0 .9 1 .3 1 .1 2 .2 1 .6 1 .1 3 .3 3 .1 4 .6 3 .7 4 .0D enm ark 4 5 .2 6 1 .4 a 5 9 .9 - - 3 9 .6 2 8 .2 a 2 7 .1 - - 4 .2 2 .6 a 2 .7 - - 1 1 .0 7 .8 a 1 0 .3 - -F in land 5 9 .5 7 0 .2 7 0 .0 6 9 .3 6 6 .9 3 5 .1 2 6 .2 2 5 .7 2 6 .3 2 5 .7 1 .0 0 .9 1 .1 1 .2 1 .2 4 .5 2 .7 3 .1 3 .2 6 .3F rance 4 8 .3 5 2 .5 5 0 .8 5 1 .7 - 4 1 .9 3 8 .7 3 9 .0 3 7 .6 - 1 .7 1 .6 1 .8 1 .9 - 8 .0 7 .2 8 .4 8 .8 -G erm any 6 0 .0 6 6 .0 6 6 .3 6 6 .6 - 3 7 .9 3 1 .4 3 1 .2 3 0 .5 - 0 .3 0 .4 0 .3 0 .4 - 1 .8 2 .1 2 .3 2 .5 -G reece 2 5 .5 3 3 .0 a 2 8 .2 - - 5 4 .0 4 6 .6 a 4 6 .4 - - 2 .5 2 .0 a 3 .8 - - 1 8 .0 1 8 .4 a 2 1 .6 - -H ungary 3 8 .4 3 7 .8 3 0 .7 3 7 .1 3 9 .4 5 3 .1 4 9 .5 5 8 .0 5 1 .8 4 9 .4 0 .5 0 .3 0 .4 0 .6 0 .3 4 .8 1 0 .6 1 0 .7 1 0 .4 1 0 .7Ice land 3 4 .6 4 6 .2 a 4 3 .9 - 4 8 .0 5 7 .3 3 4 .0 a 4 0 .1 - 4 0 .5 3 .7 1 .6 a 1 .5 - 0 .3 4 .4 1 8 .3 a 1 4 .5 - 1 1 .2Ire land 6 7 .4 6 5 .8 6 0 .3 5 8 .6 5 7 .3 2 2 .5 2 3 .4 2 9 .8 3 1 .1 3 2 .4 1 .9 1 .9 1 .6 1 .7 1 .7 8 .5 8 .9 8 .3 8 .6 8 .6Ita ly 4 1 .7 - - - - 5 3 .0 - - - - - - - - - 5 .3 - - - -Jap an 6 7 .1 7 2 .4 7 4 .6 7 4 .8 7 6 .1 2 2 .8 1 9 .6 1 8 .0 1 8 .1 1 6 .8 9 .9 7 .6 7 .0 6 .8 6 .8 0 .1 0 .4 0 .3 0 .3 0 .3K o rea 7 6 .3 7 2 .4 7 4 .0 7 5 .0 7 5 .0 1 9 .0 2 3 .9 2 3 .9 2 3 .1 2 3 .0 4 .7 3 .6 1 .7 1 .4 1 .3 0 .0 0 .1 0 .4 0 .5 0 .7L uxem b o urg - 9 0 .7 8 0 .4 - - - 7 .7 1 1 .2 - - - - 0 .2 - - - 1 .6 8 .3 - -M exico 1 7 .6 2 9 .5 3 4 .7 4 4 .0 4 6 .5 6 6 .2 6 3 .0 5 6 .1 4 7 .4 4 5 .3 9 .5 6 .5 8 .4 7 .7 7 .4 6 .7 0 .9 0 .8 0 .8 0 .7N etherland s 4 6 .0 5 1 .4 5 1 .1 - - 4 2 .2 3 4 .2 3 6 .2 - - 2 .6 2 .8 1 .4 - - 9 .3 1 1 .6 1 1 .3 - -N ew Z ea land 3 3 .7 3 7 .8 a 3 8 .5 - - 5 2 .3 4 7 .1 a 4 5 .1 - - 1 0 .1 1 0 .0 a 9 .6 - - 3 .9 6 .7 a 6 .8 - -N o rw ay 4 9 .9 5 1 .6 a 4 9 .2 - 4 6 .4 4 4 .0 3 9 .8 a 4 1 .9 - 4 4 .0 1 .2 1 .4 a 1 .5 - 1 .6 4 .9 7 .1 a 7 .4 - 8 .0P o land 3 6 .0 2 9 .5 3 0 .3 3 0 .5 3 3 .4 6 0 .2 6 6 .5 6 2 .7 6 1 .7 5 7 .7 2 .1 2 .1 2 .4 2 .7 3 .2 1 .7 1 .8 4 .6 5 .2 5 .7P o rtuga l 1 9 .5 2 7 .0 3 1 .7 - - 6 5 .3 6 4 .8 6 0 .1 - - 3 .3 3 .0 3 .2 - - 1 1 .9 5 .2 5 .0 - -S lo vak R ep ub lic 6 0 .4 5 4 .4 4 5 .1 3 8 .3 3 6 .6 3 7 .8 4 2 .6 5 0 .8 5 7 .1 5 7 .0 0 .1 0 .7 0 .7 0 .3 0 .3 1 .6 2 .3 3 .3 4 .3 6 .0S p ain 4 4 .5 4 9 .7 4 8 .4 4 8 .0 - 4 3 .6 3 8 .6 4 0 .1 4 1 .0 - 5 .2 6 .8 5 .8 4 .8 - 6 .7 4 .9 5 .7 6 .2 -S w ed en 6 5 .5 7 1 .5 a 6 5 .0 - - 2 8 .8 2 1 .3 a 2 3 .5 - - 2 .2 3 .8 a 4 .3 - - 3 .4 3 .4 a 7 .3 - -S w itzerland - 6 9 .1 - 6 9 .7 - - 2 3 .2 - 2 2 .7 - - 3 .4 - 2 .3 - - 4 .3 - 5 .2 -T urkey 3 0 .8 4 2 .9 3 6 .2 3 7 .9 4 3 .3 6 2 .4 5 0 .6 5 7 .0 5 7 .0 5 0 .1 4 .8 5 .2 5 .2 4 .8 5 .8 2 .0 1 .2 1 .6 0 .4 0 .8U K 4 8 .2 4 8 .3 4 2 .2 4 4 .1 4 2 .1 3 2 .8 3 0 .2 3 1 .8 3 2 .9 3 2 .8 4 .5 5 .5 5 .8 5 .8 5 .9 1 4 .5 1 6 .0 2 0 .3 1 7 .2 1 9 .2U S A 6 0 .2 6 9 .5 6 4 .3 6 3 .6 6 4 .0 3 5 .4 2 5 .8 3 0 .0 3 0 .8 3 0 .4 4 .4 4 .6 5 .7 5 .6 5 .7 - - - - -A rgentina - 2 3 .3 2 6 .3 3 0 .7 3 1 .0 - 7 0 .7 6 8 .9 6 4 .5 6 5 .3 - 4 .4 3 .5 3 .7 2 .9 - 1 .6 1 .4 1 .1 0 .8C hina - 5 7 .6 6 0 .1 6 5 .7 6 7 .0 - 3 3 .4 2 9 .9 2 6 .6 2 6 .3 - - - - - - 2 .7 1 .9 1 .3 0 .9Israe l 4 7 .7 7 0 .1 6 8 .9 - - 3 5 .9 2 4 .4 2 3 .2 - - 1 2 .0 2 .7 4 .7 - - 4 .4 2 .7 3 .2 - -R o m ania 3 9 .0 4 9 .0 4 5 .4 4 4 .0 3 7 .2 5 7 .4 4 0 .8 4 7 .6 4 9 .0 5 3 .5 0 .5 5 .3 1 .5 1 .5 4 .0 3 .1 4 .9 5 .5 5 .5 5 .3R ussia 3 3 .6 3 2 .9 3 0 .8 3 1 .4 3 0 .0 6 1 .5 5 4 .8 5 9 .6 6 0 .6 6 1 .9 0 .3 0 .4 0 .6 0 .4 0 .5 4 .6 1 2 .0 9 .0 7 .6 7 .6S ingap o re 5 8 .7 5 5 .0 5 1 .6 5 5 .3 5 8 .8 3 2 .5 4 0 .3 4 1 .8 3 7 .9 3 6 .4 4 .8 0 .7 0 .4 1 .0 0 .5 3 .9 4 .0 6 .2 5 .8 4 .4S lo venia 4 5 .9 5 3 .3 5 2 .2 5 8 .5 6 5 .2 4 0 .6 4 0 .0 3 7 .5 3 0 .0 2 7 .2 1 0 .6 0 .4 0 .5 0 .4 0 .7 2 .9 6 .2 9 .9 1 1 .1 6 .8S o uth A frica - 5 5 .8 a 5 4 .8 4 8 .6 - - 3 6 .4 a 3 4 .0 3 5 .6 - - - 0 .3 0 .5 - - 6 .1 a 1 0 .9 1 5 .3 -T aiw an - 6 5 .0 6 3 .3 6 4 .8 6 6 .9 - 3 3 .4 3 5 .2 3 3 .6 3 1 .5 - 1 .6 1 .5 1 .6 1 .5 - 0 .0 0 .0 0 .0 0 .1E U -2 5 5 1 .9 5 5 .5 5 3 .6 5 4 .1 - 3 9 .1 3 4 .5 3 5 .0 - - 1 .8 2 .2 2 .3 - - 6 .9 7 .3 8 .6 - -T o ta l O E C D 5 9 .5 6 4 .4 6 2 .1 6 2 .1 6 2 .5 3 4 .0 2 8 .3 3 0 .1 3 0 .2 - 4 .0 4 .5 4 .8 4 .7 4 .7 - - - - -
a2001 values, b2002 values. Source: OECD, Main Science and Technology Indicators, 2007and TÜİK, 2007.

14
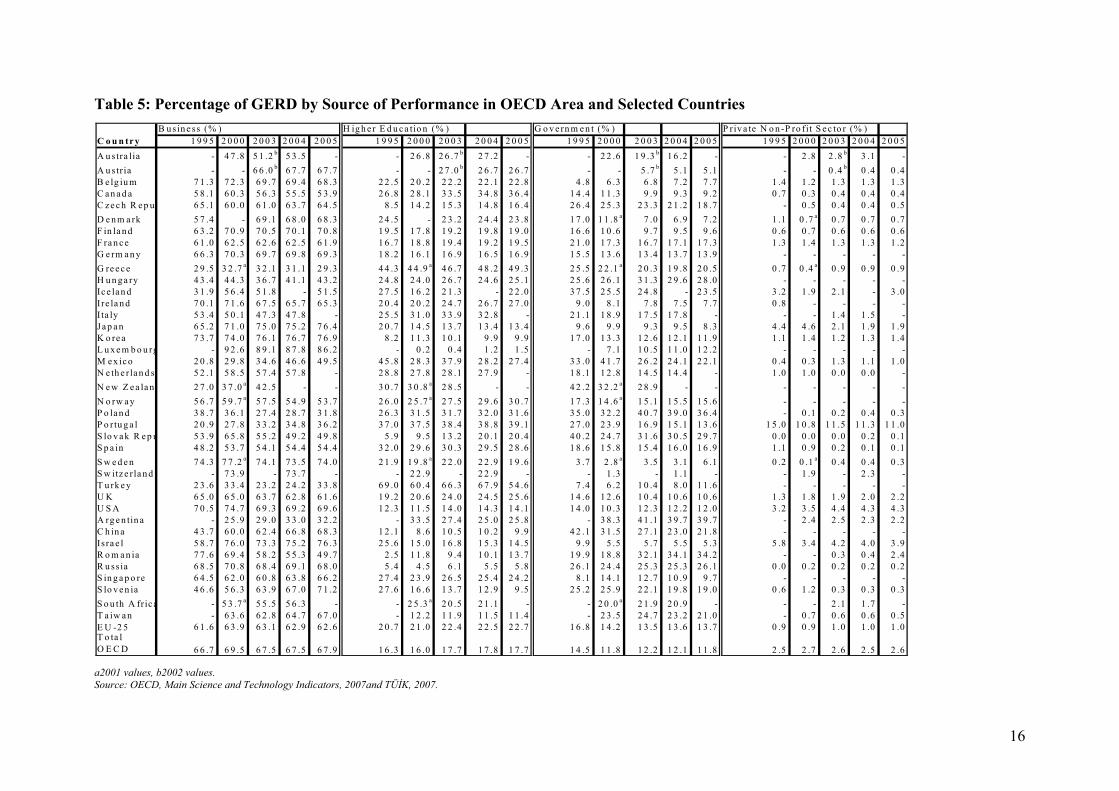
Table 5 and Figures 4a and 4b approach the problem from a different perspective, by
taking the percentage of GERD by source of performance. For champions of competitiveness,
we expect a higher ratio of GERD performed by business. As evidenced from the figures, this
expectation is strongly verified. However, in Turkey the conclusion is radically different.
Turkey has the highest figure (54.6%) in the table in terms of the GERD financed by higher
education. Combined with the difficulties in commercializing basic research, this fact results
in an unintended outcome for Turkey. This calls for urgent measures for Turkey to change the
composition in order to reach higher economic performances. However, we observe
promising developments in the last year. The share of higher education is decreasing while the
share of business is rising. According to Figure 4b, in the period 2000-2005, the rise in
government expenditures is tremendous. Its rate of growth is around 218%. This fact is
explained by a policy shift with rising funds from the government in the last couple of years.
In the same period, the figures for business and higher education are 72% and 54%
respectively.
Figure 4a: Percentage of GERD by Source of Performance in Turkey
24.2
7.4
57.261.1
55.3
67.9
24
21.1
20.8224.722.9 23.6
25.9
32.3
31.6
3833.4 33.7
28.723.2
33.8
11.6
810.4
7
7.4
7.9
9.87
8.2 9.9 8.711.9 10.5
7.3
6.76.2
54.6
66.364.3
58.9
69.31 71
67.8 67.2
66.6 6962.2 60.4
0
10
20
30
40
50
60
70
80
1990 1991 1992 1993 1994 1995 1996 1997 1998 1999 2000 2001 2002 2003 2004 2005
Year
Rat
io
Business Government Higher Education
Source: TÜİK, 2007

15
Figure 4b: GERD by Source of Performance in Turkey (2005 Prices)
1298
2095
443214237
139 140 133
654507546641
756
1364
11181223 1447
1833
0
500
1000
1500
2000
2500
2000 2001 2002 2003 2004 2005
Year
Mill
ion
YTL
Governement Business Higher Education
Source: TÜİK, 2007
16
Table 5: Percentage of GERD by Source of Performance in OECD Area and Selected Countries B u s in e ss (% ) H ig h e r E d u c a tio n (% ) G o v e rn m e n t (% ) P riv a te N o n -P ro fit S e c to r (% )
C o u n tr y 1 9 9 5 2 0 0 0 2 0 0 3 2 0 0 4 2 0 0 5 1 9 9 5 2 0 0 0 2 0 0 3 2 0 0 4 2 0 0 5 1 9 9 5 2 0 0 0 2 0 0 3 2 0 0 4 2 0 0 5 1 9 9 5 2 0 0 0 2 0 0 3 2 0 0 4 2 0 0 5A u stra lia - 4 7 .8 5 1 .2 b 5 3 .5 - - 2 6 .8 2 6 .7 b 2 7 .2 - - 2 2 .6 1 9 .3 b 1 6 .2 - - 2 .8 2 .8 b 3 .1 -A u str ia - - 6 6 .0 b 6 7 .7 6 7 .7 - - 2 7 .0 b 2 6 .7 2 6 .7 - - 5 .7 b 5 .1 5 .1 - - 0 .4 b 0 .4 0 .4B e lg iu m 7 1 .3 7 2 .3 6 9 .7 6 9 .4 6 8 .3 2 2 .5 2 0 .2 2 2 .2 2 2 .1 2 2 .8 4 .8 6 .3 6 .8 7 .2 7 .7 1 .4 1 .2 1 .3 1 .3 1 .3C a n a d a 5 8 .1 6 0 .3 5 6 .3 5 5 .5 5 3 .9 2 6 .8 2 8 .1 3 3 .5 3 4 .8 3 6 .4 1 4 .4 1 1 .3 9 .9 9 .3 9 .2 0 .7 0 .3 0 .4 0 .4 0 .4C z e c h R e p u 6 5 .1 6 0 .0 6 1 .0 6 3 .7 6 4 .5 8 .5 1 4 .2 1 5 .3 1 4 .8 1 6 .4 2 6 .4 2 5 .3 2 3 .3 2 1 .2 1 8 .7 - 0 .5 0 .4 0 .4 0 .5D e n m a rk 5 7 .4 - 6 9 .1 6 8 .0 6 8 .3 2 4 .5 - 2 3 .2 2 4 .4 2 3 .8 1 7 .0 1 1 .8 a 7 .0 6 .9 7 .2 1 .1 0 .7 a 0 .7 0 .7 0 .7F in la n d 6 3 .2 7 0 .9 7 0 .5 7 0 .1 7 0 .8 1 9 .5 1 7 .8 1 9 .2 1 9 .8 1 9 .0 1 6 .6 1 0 .6 9 .7 9 .5 9 .6 0 .6 0 .7 0 .6 0 .6 0 .6F ra n c e 6 1 .0 6 2 .5 6 2 .6 6 2 .5 6 1 .9 1 6 .7 1 8 .8 1 9 .4 1 9 .2 1 9 .5 2 1 .0 1 7 .3 1 6 .7 1 7 .1 1 7 .3 1 .3 1 .4 1 .3 1 .3 1 .2G e rm a n y 6 6 .3 7 0 .3 6 9 .7 6 9 .8 6 9 .3 1 8 .2 1 6 .1 1 6 .9 1 6 .5 1 6 .9 1 5 .5 1 3 .6 1 3 .4 1 3 .7 1 3 .9 - - - - -G re e c e 2 9 .5 3 2 .7 a 3 2 .1 3 1 .1 2 9 .3 4 4 .3 4 4 .9 a 4 6 .7 4 8 .2 4 9 .3 2 5 .5 2 2 .1 a 2 0 .3 1 9 .8 2 0 .5 0 .7 0 .4 a 0 .9 0 .9 0 .9H u n g a ry 4 3 .4 4 4 .3 3 6 .7 4 1 .1 4 3 .2 2 4 .8 2 4 .0 2 6 .7 2 4 .6 2 5 .1 2 5 .6 2 6 .1 3 1 .3 2 9 .6 2 8 .0 - - - - -Ic e la n d 3 1 .9 5 6 .4 5 1 .8 - 5 1 .5 2 7 .5 1 6 .2 2 1 .3 - 2 2 .0 3 7 .5 2 5 .5 2 4 .8 - 2 3 .5 3 .2 1 .9 2 .1 - 3 .0Ire la n d 7 0 .1 7 1 .6 6 7 .5 6 5 .7 6 5 .3 2 0 .4 2 0 .2 2 4 .7 2 6 .7 2 7 .0 9 .0 8 .1 7 .8 7 .5 7 .7 0 .8 - - - -I ta ly 5 3 .4 5 0 .1 4 7 .3 4 7 .8 - 2 5 .5 3 1 .0 3 3 .9 3 2 .8 - 2 1 .1 1 8 .9 1 7 .5 1 7 .8 - - - 1 .4 1 .5 -Ja p a n 6 5 .2 7 1 .0 7 5 .0 7 5 .2 7 6 .4 2 0 .7 1 4 .5 1 3 .7 1 3 .4 1 3 .4 9 .6 9 .9 9 .3 9 .5 8 .3 4 .4 4 .6 2 .1 1 .9 1 .9K o re a 7 3 .7 7 4 .0 7 6 .1 7 6 .7 7 6 .9 8 .2 1 1 .3 1 0 .1 9 .9 9 .9 1 7 .0 1 3 .3 1 2 .6 1 2 .1 1 1 .9 1 .1 1 .4 1 .2 1 .3 1 .4L u x e m b o u rg - 9 2 .6 8 9 .1 8 7 .8 8 6 .2 - 0 .2 0 .4 1 .2 1 .5 - 7 .1 1 0 .5 1 1 .0 1 2 .2 - - - - -M e x ic o 2 0 .8 2 9 .8 3 4 .6 4 6 .6 4 9 .5 4 5 .8 2 8 .3 3 7 .9 2 8 .2 2 7 .4 3 3 .0 4 1 .7 2 6 .2 2 4 .1 2 2 .1 0 .4 0 .3 1 .3 1 .1 1 .0N e th e r la n d s 5 2 .1 5 8 .5 5 7 .4 5 7 .8 - 2 8 .8 2 7 .8 2 8 .1 2 7 .9 - 1 8 .1 1 2 .8 1 4 .5 1 4 .4 - 1 .0 1 .0 0 .0 0 .0 -N e w Z e a la n 2 7 .0 3 7 .0 a 4 2 .5 - - 3 0 .7 3 0 .8 a 2 8 .5 - - 4 2 .2 3 2 .2 a 2 8 .9 - - - - - - -N o rw a y 5 6 .7 5 9 .7 a 5 7 .5 5 4 .9 5 3 .7 2 6 .0 2 5 .7 a 2 7 .5 2 9 .6 3 0 .7 1 7 .3 1 4 .6 a 1 5 .1 1 5 .5 1 5 .6 - - - - -P o la n d 3 8 .7 3 6 .1 2 7 .4 2 8 .7 3 1 .8 2 6 .3 3 1 .5 3 1 .7 3 2 .0 3 1 .6 3 5 .0 3 2 .2 4 0 .7 3 9 .0 3 6 .4 - 0 .1 0 .2 0 .4 0 .3P o rtu g a l 2 0 .9 2 7 .8 3 3 .2 3 4 .8 3 6 .2 3 7 .0 3 7 .5 3 8 .4 3 8 .8 3 9 .1 2 7 .0 2 3 .9 1 6 .9 1 5 .1 1 3 .6 1 5 .0 1 0 .8 1 1 .5 1 1 .3 1 1 .0S lo v a k R e p u 5 3 .9 6 5 .8 5 5 .2 4 9 .2 4 9 .8 5 .9 9 .5 1 3 .2 2 0 .1 2 0 .4 4 0 .2 2 4 .7 3 1 .6 3 0 .5 2 9 .7 0 .0 0 .0 0 .0 0 .2 0 .1S p a in 4 8 .2 5 3 .7 5 4 .1 5 4 .4 5 4 .4 3 2 .0 2 9 .6 3 0 .3 2 9 .5 2 8 .6 1 8 .6 1 5 .8 1 5 .4 1 6 .0 1 6 .9 1 .1 0 .9 0 .2 0 .1 0 .1S w e d e n 7 4 .3 7 7 .2 a 7 4 .1 7 3 .5 7 4 .0 2 1 .9 1 9 .8 a 2 2 .0 2 2 .9 1 9 .6 3 .7 2 .8 a 3 .5 3 .1 6 .1 0 .2 0 .1 a 0 .4 0 .4 0 .3S w itz e r la n d - 7 3 .9 - 7 3 .7 - - 2 2 .9 - 2 2 .9 - - 1 .3 - 1 .1 - - 1 .9 - 2 .3 -T u rk e y 2 3 .6 3 3 .4 2 3 .2 2 4 .2 3 3 .8 6 9 .0 6 0 .4 6 6 .3 6 7 .9 5 4 .6 7 .4 6 .2 1 0 .4 8 .0 1 1 .6 - - - - -U K 6 5 .0 6 5 .0 6 3 .7 6 2 .8 6 1 .6 1 9 .2 2 0 .6 2 4 .0 2 4 .5 2 5 .6 1 4 .6 1 2 .6 1 0 .4 1 0 .6 1 0 .6 1 .3 1 .8 1 .9 2 .0 2 .2U S A 7 0 .5 7 4 .7 6 9 .3 6 9 .2 6 9 .6 1 2 .3 1 1 .5 1 4 .0 1 4 .3 1 4 .1 1 4 .0 1 0 .3 1 2 .3 1 2 .2 1 2 .0 3 .2 3 .5 4 .4 4 .3 4 .3A rg e n tin a - 2 5 .9 2 9 .0 3 3 .0 3 2 .2 - 3 3 .5 2 7 .4 2 5 .0 2 5 .8 - 3 8 .3 4 1 .1 3 9 .7 3 9 .7 - 2 .4 2 .5 2 .3 2 .2C h in a 4 3 .7 6 0 .0 6 2 .4 6 6 .8 6 8 .3 1 2 .1 8 .6 1 0 .5 1 0 .2 9 .9 4 2 .1 3 1 .5 2 7 .1 2 3 .0 2 1 .8 - - - - -Is ra e l 5 8 .7 7 6 .0 7 3 .3 7 5 .2 7 6 .3 2 5 .6 1 5 .0 1 6 .8 1 5 .3 1 4 .5 9 .9 5 .5 5 .7 5 .5 5 .3 5 .8 3 .4 4 .2 4 .0 3 .9R o m a n ia 7 7 .6 6 9 .4 5 8 .2 5 5 .3 4 9 .7 2 .5 1 1 .8 9 .4 1 0 .1 1 3 .7 1 9 .9 1 8 .8 3 2 .1 3 4 .1 3 4 .2 - - 0 .3 0 .4 2 .4R u ss ia 6 8 .5 7 0 .8 6 8 .4 6 9 .1 6 8 .0 5 .4 4 .5 6 .1 5 .5 5 .8 2 6 .1 2 4 .4 2 5 .3 2 5 .3 2 6 .1 0 .0 0 .2 0 .2 0 .2 0 .2S in g a p o re 6 4 .5 6 2 .0 6 0 .8 6 3 .8 6 6 .2 2 7 .4 2 3 .9 2 6 .5 2 5 .4 2 4 .2 8 .1 1 4 .1 1 2 .7 1 0 .9 9 .7 - - - - -S lo v e n ia 4 6 .6 5 6 .3 6 3 .9 6 7 .0 7 1 .2 2 7 .6 1 6 .6 1 3 .7 1 2 .9 9 .5 2 5 .2 2 5 .9 2 2 .1 1 9 .8 1 9 .0 0 .6 1 .2 0 .3 0 .3 0 .3S o u th A fr ic a - 5 3 .7 a 5 5 .5 5 6 .3 - - 2 5 .3 a 2 0 .5 2 1 .1 - - 2 0 .0 a 2 1 .9 2 0 .9 - - - 2 .1 1 .7 -T a iw a n - 6 3 .6 6 2 .8 6 4 .7 6 7 .0 - 1 2 .2 1 1 .9 1 1 .5 1 1 .4 - 2 3 .5 2 4 .7 2 3 .2 2 1 .0 - 0 .7 0 .6 0 .6 0 .5E U -2 5 6 1 .6 6 3 .9 6 3 .1 6 2 .9 6 2 .6 2 0 .7 2 1 .0 2 2 .4 2 2 .5 2 2 .7 1 6 .8 1 4 .2 1 3 .5 1 3 .6 1 3 .7 0 .9 0 .9 1 .0 1 .0 1 .0T o ta l O E C D 6 6 .7 6 9 .5 6 7 .5 6 7 .5 6 7 .9 1 6 .3 1 6 .0 1 7 .7 1 7 .8 1 7 .7 1 4 .5 1 1 .8 1 2 .2 1 2 .1 1 1 .8 2 .5 2 .7 2 .6 2 .5 2 .6
a2001 values, b2002 values. Source: OECD, Main Science and Technology Indicators, 2007and TÜİK, 2007.

17
Table 6: Triadic Patent Families in OECD Area and Selected Countries
Number of Triadic Patent Families
Share of countries in triadic patent families
Country 1997 2000 2003 2004 2005 1997 2000 2003 2004 2005Australia 261 398 409 425 414 0.65 0.84 0.84 0.84 0.81Austria 250 259 281 288 301 0.62 0.55 0.58 0.57 0.59Belgium 411 366 340 358 333 1.02 0.77 0.7 0.71 0.65Canada 556 609 712 766 820 1.38 1.29 1.46 1.52 1.6Czech Republic 11 8 15 15 15 0.03 0.02 0.03 0.03 0.03Denmark 211 238 233 222 220 0.52 0.5 0.48 0.44 0.43Finland 426 358 259 268 264 1.06 0.76 0.53 0.53 0.51France 2112 2277 2407 2440 2463 5.23 4.82 4.93 4.84 4.79Germany 5499 6236 6176 6283 6266 13.63 13.19 12.66 12.47 12.19Greece 10 9 12 10 13 0.02 0.02 0.03 0.02 0.03Hungary 32 34 37 39 37 0.08 0.07 0.07 0.08 0.07Iceland 4 10 7 5 5 0.01 0.02 0.01 0.01 0.01Ireland 36 42 48 51 59 0.09 0.09 0.1 0.1 0.11Italy 712 662 703 706 716 1.76 1.4 1.44 1.4 1.39Japan 10649 14709 14428 15347 15239 26.39 31.11 29.59 30.45 29.66Korea 416 820 2018 2583 3158 1.03 1.73 4.14 5.12 6.14Luxembourg 14 17 22 27 24 0.04 0.04 0.04 0.05 0.05Mexico 13 10 17 17 20 0.03 0.02 0.04 0.03 0.04Netherlands 794 1169 1203 1215 1184 1.97 2.47 2.47 2.41 2.31New Zealand 39 58 73 67 64 0.1 0.12 0.15 0.13 0.13Norway 89 111 102 109 111 0.22 0.23 0.21 0.22 0.22Poland 9 9 10 10 11 0.02 0.02 0.02 0.02 0.02Portugal 6 4 9 7 9 0.02 0.01 0.02 0.01 0.02Slovak Republic 4 2 3 3 3 0.01 0.01 0.01 0.01 0.01Spain 99 150 167 200 201 0.25 0.32 0.34 0.4 0.39Sweden 835 605 596 606 652 2.07 1.28 1.22 1.2 1.27Switzerland 763 796 794 802 801 1.89 1.68 1.63 1.59 1.56Turkey 3 5 12 17 27 0.01 0.01 0.03 0.03 0.05UK 1547 1650 1637 1601 1588 3.83 3.49 3.36 3.18 3.09USA 14544 15664 16037 15916 16368 36.04 33.13 32.88 31.58 31.85Argentina 6 7 8 9 9 .. .. .. .. .. China 40 90 253 312 433 .. .. .. .. .. Israel 278 338 365 360 395 .. .. .. .. .. Romania 2 1 2 0 3 .. .. .. .. .. Russia 53 53 50 50 49 .. .. .. .. .. Singapore 27 54 79 88 95 .. .. .. .. .. Slovenia 5 7 9 11 10 .. .. .. .. .. South Africa 35 36 32 30 33 .. .. .. .. .. Taiwan 52 65 101 114 135 .. .. .. .. .. EU-25 13377 14561 14717 14918 14988 33.15 30.79 30.18 29.6 29.17
Total OECD 40354 47287 48766 50402 51386 100.00 100.00 100.00 100.00 100.00Source: OECD, Main Science and Technology Indicators, 2007

18
Table 6 shows the distribution of triadic patent families (the patents filed at EPO, the
USPTO and the JPO to protect a single invention). Firms seeking to enhance their
competitiveness tend to allocate more resources to the creation and the acquisition of
knowledge and to patent more inventions. As a proxy of innovative activities, not only does
patenting behavior protect intellectual property rights, it also creates an economic value. In
turn, the intensity of patenting activities may act as tool for a country’s competitiveness
through value creation. As evidenced in Table 6, there is a close relation between patenting
activities and competitiveness. Apart from the USA, Japan and Germany where previously
noted patent offices are located, pioneering economies in terms of competitiveness have a
substantial high share in the OECD area even though the relation is not as obvious as in the
previous tables. For instance, Italy has a high share in terms of triadic patent registration yet
its competitiveness rank is 42 since she might be specialized in design registration in few
sectors such as fashion, furniture, and car design. However, this relationship is not so clear,
since the figures for Turkey are low. Although the figures for Turkey is low, we again observe
an increasing trend in the last years, the rate of increase of triadic patents for Turkey is more
than 400% in 2000-2005 period. Another interesting fact is related with the patent
applications. According to the Main Science and Technology Indicators of OECD, Turkey
places as second in terms of the growth rate of patent applications to EPO in the period 2000-
2005 with a growth rate of 360%. Moreover, the national applications to Turkish Patent
Institute have increased around 115% in the 2003-2006 period. The recently established
support for national and international patent applications with the collaboration of Turkish
Patent Institute and TÜBİTAK will accelerate this growth rate.4
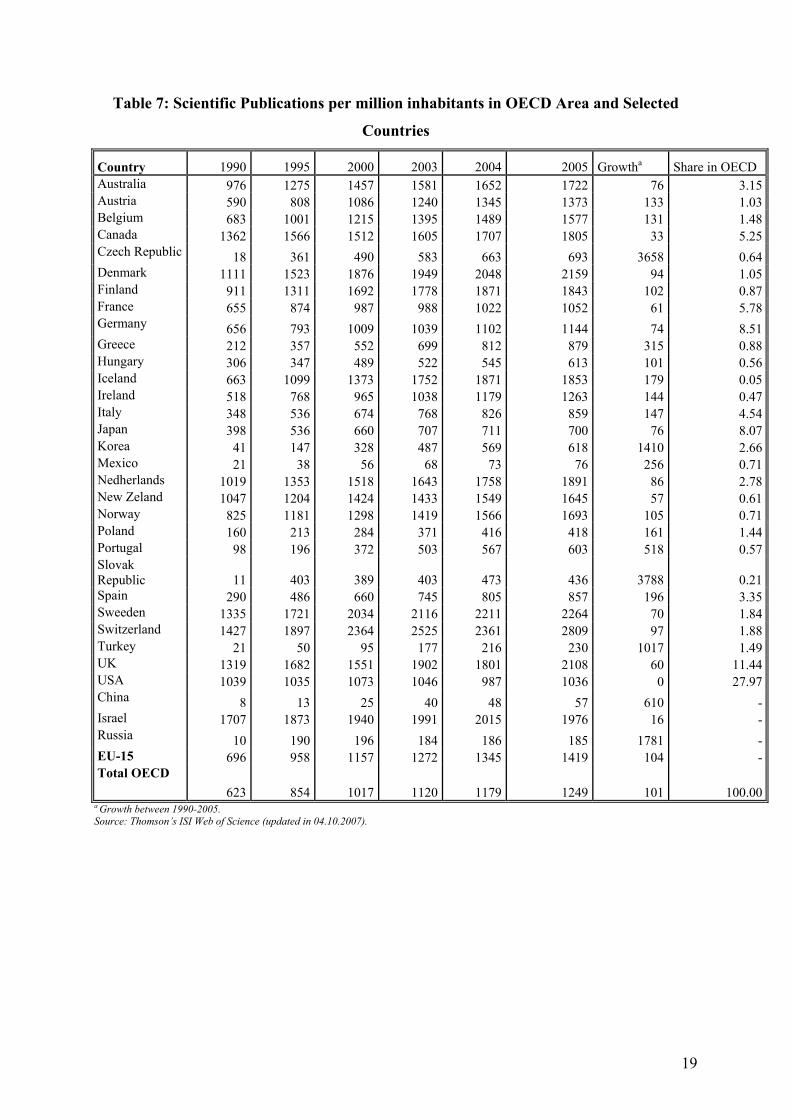
Table 7 and Figure 5 present the distribution of scientific publications per million
inhabitants. This indicator is one of the most promising one for Turkey. Although Turkey’s
share is around 1.5% in the OECD area, its growth rate (1017%) for the period 1990-2005 is
tremendous. Turkey has a chance to reach the EU average by 2023 if those rates of growth
persist. We observe a further rise in 2006 as evident from Figure 5. In the last five year
Turkey with a growth rate of 141% has the highest growth rate in the world. This is really a
significant success story. The promotion criteria in academia and various supports by
TÜBİTAK and universities made possible this success.
4 For detailed information on this support, see http://www.tubitak.gov.tr/home.do?sid=371&pid=364. 145 applications out of 159 are supported by these programmes by 17.07.2007.
19
Table 7: Scientific Publications per million inhabitants in OECD Area and Selected
Countries
Country 1990 1995 2000 2003 2004 2005 Growtha Share in OECD Australia 976 1275 1457 1581 1652 1722 76 3.15Austria 590 808 1086 1240 1345 1373 133 1.03Belgium 683 1001 1215 1395 1489 1577 131 1.48Canada 1362 1566 1512 1605 1707 1805 33 5.25Czech Republic 18 361 490 583 663 693 3658 0.64Denmark 1111 1523 1876 1949 2048 2159 94 1.05Finland 911 1311 1692 1778 1871 1843 102 0.87France 655 874 987 988 1022 1052 61 5.78Germany 656 793 1009 1039 1102 1144 74 8.51Greece 212 357 552 699 812 879 315 0.88Hungary 306 347 489 522 545 613 101 0.56Iceland 663 1099 1373 1752 1871 1853 179 0.05Ireland 518 768 965 1038 1179 1263 144 0.47Italy 348 536 674 768 826 859 147 4.54Japan 398 536 660 707 711 700 76 8.07Korea 41 147 328 487 569 618 1410 2.66Mexico 21 38 56 68 73 76 256 0.71Nedherlands 1019 1353 1518 1643 1758 1891 86 2.78New Zeland 1047 1204 1424 1433 1549 1645 57 0.61Norway 825 1181 1298 1419 1566 1693 105 0.71Poland 160 213 284 371 416 418 161 1.44Portugal 98 196 372 503 567 603 518 0.57Slovak Republic 11 403 389 403 473 436 3788 0.21Spain 290 486 660 745 805 857 196 3.35Sweeden 1335 1721 2034 2116 2211 2264 70 1.84Switzerland 1427 1897 2364 2525 2361 2809 97 1.88Turkey 21 50 95 177 216 230 1017 1.49UK 1319 1682 1551 1902 1801 2108 60 11.44USA 1039 1035 1073 1046 987 1036 0 27.97China 8 13 25 40 48 57 610 -Israel 1707 1873 1940 1991 2015 1976 16 -Russia 10 190 196 184 186 185 1781 -EU-15 696 958 1157 1272 1345 1419 104 -Total OECD
623 854 1017 1120 1179 1249 101 100.00a Growth between 1990-2005. Source: Thomson’s ISI Web of Science (updated in 04.10.2007).

20
Figure 5: Scientific Publications per Million Inhabitants in Turkey
21 24 29 33 3950
6372
8394 95
114
149
177
216230
252
0
50
100
150
200
250
300
1990 1991 1992 1993 1994 1995 1996 1997 1998 1999 2000 2001 2002 2003 2004 2005 2006
Years
Num
ber o
f Sci
entif
ic P
ublic
aito
ns p
er M
illio
n In
habi
tant
s
Source: Thomson’s ISI Web of Science (updated in 24.09.2007).
In sum, the main science and technology indicators show that the performance of
Turkey is far from reaching its development targets until 2003. However, the positive
developments are observed in the last years. This situation is increasing the probability of
catching up more developed economies. The main problem area is not only the level of R&D
expenditures but also its composition. Moreover, Turkey has a relative success in basic
research, but transforming research in to economic value seems to be problematic. This point
is especially important to climb up the ladder of the GCI ranking.
II. 2 A Snapshot on Turkish Science and Technology Policy: Acts and Actors
Turkish science and technology policy has gone through many stages and seen many
actions undertaken during the republican era. We examine below the history of Turkish
science and technology policy divided into five periods, featuring different initiatives and
actors.
1. 1923-1950 Reconstruction under one-party Regime: Under the conditions of extreme
poverty in the post-war period, the first republican government implemented economic
reforms towards a rapid industrialization. The report prepared by the Istanbul Chamber of
21
Commerce and Industry prepared in 1924 can be considered as the first S&T policy document
in this period. This report stated the lack of managers and skilled workers for the development
of the existing manufacturing industry. The main policy tool used during this period is the
transfer of existing technology, mainly from the neighboring countries. Key examples are the
establishment of the cement and sugar industry. The first legislation having somewhat S&T
orientation is the Law of Industrial Incentives (Teşvik-i Sanayi Kanunu) of 1927. In this year,
the total number of industrial establishments was 322, which were employing some 17,000
workers. Approximately 70% of those establishments were engaged in textile and food
manufacturing in which the average staff number was around 30. Unfortunately, the catching
up was very slow for catching up because of the deficiencies in the scientific, economic and
cultural infrastructures. Moreover, it has been argued that the Great Depression has
contributed to this slowdown. The employment of foreign scientists in Turkish universities,
especially the German-Jewish ones, was an important mile stone in 1933 onwards. This
movement positively adds on the development of newly-established universities and the
spillover of scientific thought. The new investments realized in 1930s have been cut with the
impact of the war. Moreover, the introduction of new taxes in this period has impeded capital
accumulation and led to the development of an industry with weak technological capacities.
2. 1950-1960 Multi-Party Regime and Investments on Infrastructure: In this period, the
public investments were directed towards infrastructure, while investment incentives for
technology transfer activities were created for the private sector. The establishment of the
Turkish Industrial Development Bank made foreign credits available to the private sector. The
domestic volume of credits supported with an inflationist monetary policy was increased
through rising private savings, and thus the necessary funds for industrial investments were
risen. In this period, the number of establishments almost doubled. The legislation enacted in
1951 and 1954 aiming to encourage the foreign direct investments acted as leverage for
industrial development. This period witnessed important developments, especially in the
chemical industry.
3. 1960- 1980 Plan Period and Crises:5 This period can be divided into two sub-periods:
from 1960 to 1974 (oil crisis) and from 1974 to 1980 (economic reforms). The strategic
choice of planning shapes the first period that led to the establishment of State Planning
Organization (DPT) in 1961. The aim is twofold, the efficient use of resources and the rapid
development. The import-substitution strategy forms the basic foundation of the economic
5 See Figure A1 at the Appendix, for the timeline of Turkish S&T Policy Making (Akkerman, 2006).

22
policy. In this period, the historical development of Turkish S&T policy can be examined
through the Five Year Development Plans. During the First Five Year Development Plan
period of 1963 – 1967, the most important event was the foundation of The Scientific and
Technological Research Council of Turkey (TÜBİTAK) in 1963. TÜBİTAK was founded
with the aim of carrying out and motivating basic and applied research in exact sciences
(mathematics, natural sciences such as chemistry and physics and applied sciences such as
medicine, architecture and engineering), following technological developments in other
countries and collecting related information, and pursuing the technological developments of
specific products in line with national development (Official Gazette, 1963). During the years
following its foundation, TÜBİTAK undertook various missions itself, such as contributing to
the development of Turkey’s science and technology policies, being the top public R&D
institution, monitoring and evaluating the scientific and technological advance of the country,
as well as supporting and funding both public and private R&D activities. In addition to its
important role in exact sciences, TÜBİTAK enlarged its mission area by funding research in
social sciences and humanities after the establishment of Social Sciences and Humanities
Research Grant Committee in 1999.
The other important event of this period is the Pilot Teams Project of OECD. The Project
was started in 1962 and covered the least developed OECD countries at that time, which were
Turkey, Greece, Spain and Portugal (TÜBA, 2005). The main target was to analyze the level
of scientific and technological research activities and their contribution to sustainable
economic growth in those countries. In addition, requirements and constraints to establish a
national S&T policy in each participating country were questioned in this project. Although
the project was the first attempt to define strategies and framework for a science and
technology policy for Turkey, the results were not transferred into action.
The second period witnessed continuous economic and political crises leading to a
military coup d’etat in 1980. The long-lasting crises have had serious impacts on Turkish
S&T policy. The financial problems experienced during this period have deterred the
allocation of funds for the implementation of the policies. Following the foundation of
TÜBİTAK, there were no significant attempts for a specific S&T policy until the end of
1970s. The first important development towards a “Turkish Science and Technology Policy”
was observed in the Fourth Five Year Development Plan period of 1979 – 1983. The
“Technology Policy” concept was, for the first time in Turkish S&T policy history,
intentionally utilized. It was also underlined that technology policies should be applied in

23
coordination with industrial and investment policies for the target of being a technology-
producing country (DPT, 1978). Moreover, this plan scheduled the preparation of the report
“Turkish Science Policy: 1983 – 2003”, one of the most important step in the history of
Turkish S&T policy.
4. Export-Led Growth and crises again 1983-2000: The report “Turkish Science Policy:
1983 – 2003” pictures out two key paths. The first one is the R&D infrastructure of Turkey.
The second path is identified long-term scientific priority areas of Turkey, namely computer
science, electronic engineering, instrumentation and telecommunication. The relationship
between the two paths is that, profiling and keeping track of the R&D human capital of a
country shapes the national scientific and technological priority areas in the long-run, as well
as mid-term targets. Moreover, defining priority areas informs about the characteristics of
R&D staff. However, the necessary actions foreseen by this document were not implemented.
The Advanced Technologies Implementation Project prepared in 1985 by İstanbul Technical
University upon the request of the government shared the same fate.
The most fruitful result of the “Turkish Science Policy: 1983 – 2003” was the foundation
of BTYK (Supreme Council of Science and Technology). Its 1983 decree law aims to
develop, implement, elaborate, coordinate and direct the scientific and technological R&D
policies of Turkey in accordance with the economic development, social improvement and
national security goals (Official Gazette, 1983). As ruled out by the law, BTYK should
convene twice a year, chaired by the Prime Minister. The members of BTYK are Ministries of
State, National Defense, Finance, Forestry, Agriculture and Rural Affairs, Undustry and
Commerce, Energy and Natural Resources, President of Council of Higher Education,
Undersecretaries of State Planning Organization, Treasury and Foreign Trade, President and a
vice president of TÜBİTAK, Chairman of Turkish Atomic Energy Authority, General
Director of Turkish Radio and Television, Chairman of Union of Chambers and Commodity
Exchanges of Turkey and a member to be appointed by a university to be designated by
Council of Higher Education. However, BTYK carried out its first meeting in 1989, six years
after its foundation, and convened 15 times by March 2007.6 Unfortunately, being a principal
S&T policy-making institution, BTYK has not been functioning effectively until the
beginning of the new millennium. The Fifth Five Year Development Plan of 1985 – 1989
contains a section on “Science – Research – Technology”. For the first time, in this plan R&D
6 For list of all BTYK meetings, see Table A3 in the Appendix.

24
and technological development were stated as the guiding and impulsive forces of economic
change and development (DPT, 1984). Technology transfer and the production of new
technologies according to the priority areas determined in the Turkish Science Policy: 1983 –
2003 document, and the university – industry cooperation were major topics that the plan
focused on. Another important aim in the Fifth Five Year Development Plan was the
preparation of a long-term science and technology plan based on the Turkish Science Policy:
1983 – 2003 document. The plan presumably contains targets for the priority areas,
coordination mechanisms for ongoing R&D activities, and employment of researchers needed
for the specified basic and applied research topics.
The 1990s was a dynamic period for the Turkish S&T policy as far as the legislative and
institutional issues are concerned. The Sixth Five Year Development Plan of the 1990 – 1994
period included significant topics to foster R&D activities and build up a suitable environment
to increase technology production capabilities. In the “Targets” section of the “Science, R&D
and Technology” chapter of the Development Plan document, major science and technology
indicators were mentioned for the first time and precise targets were set for them. For
example; (DPT, 1989)
• Double the number of researchers, where the latest value was 33,000,
• Increase the number of researchers per thousand economically active people,
known as the researcher ratio, to 1.5,
• Reach an R&D intensity of 1 percent.
In addition to the targets set for major science and technology indicators, there were other
significant issues stated for the first time in the Sixth Five Year Development Plan, such as to
support R&D activities in both public and private sector, to encourage university – industry
cooperation, to use technology transfer as the main method of acquiring necessary high
technology to increase the quality of products and global competitiveness of national industry,
and to found a patent organization for protection of intellectual property (DPT, 1989). Sixth
Five Year Development Plan can be seen as an important step forward for Turkish S&T
policy. Nonetheless, the statement noting the activation of BTYK indicated that Turkey’s
highest S&T policy-making institution is malfunctioning. The first significant impact of the
Sixth Five Year Development plan is observed in 1990 with the foundation of Small and
Medium Industry Development Organization (KOSGEB) under the body of the Ministry of
Industry and Trade. The mission of KOSGEB is to inform, support and orient SMEs during

25
their growth (Official Gazette, 1990). History of KOSGEB goes back to 1973 as being a pilot
project in Gaziantep under the name of Small Enterprise Development Center (KÜSGEM).
After reconsidering the role of SMEs in a national economy, KÜSGEM was restructured as an
organization at national level and KOSGEB was founded. Turkish Technology Development
Foundation (TTGV) and TÜBİTAK Industrial R&D Funding Directorate (TİDEB, TEYDEB
after 2005) are also founded as the major R&D funding mechanisms in accordance with the
targets of the plan. TTGV is a non-profit organization founded in 1991 with the funding of the
Undersecretariat of Treasury from the resources of the World Bank in order to support
technology development by Turkish industry, to encourage and fund R&D activities and
innovation. TÜBİTAK-TİDEB – founded in 1995 – organizes and regulates the state support
for R&D activities of the industry, by reimbursing up to 60 percent of R&D expenditures of
companies, regardless of their size. Based on the decree of the Council of the Ministers dated
27.12.1994 and numbered 94/6401, The Undersecretariat of the Prime Ministry for Foreign
Trade started to put a special emphasis on supporting R&D activities during this period
through 2000s. Within this context, SMEs were at the core of the economic development
priorities and R&D supports available to the firms extended to a large extent. Turkish Patent
Institute (TPE) was founded in 1994 to fill the institutional gap for the protection of
intellectual property rights. The final important action foreseen is the preparation of a new
policy document in this plan period. “Turkish Science and Technology Policy: 1993 – 2003”,
which was the revised version of its predecessor covering half of the time interval, included
policy instruments and targets in more detail. Keeping the targets set for science and
technology indicators unchanged, new priority areas for R&D activities were defined. Priority
areas defined in Turkish Science and Technology Policy: 1983 – 2003, which were electronic
engineering, computer science, instrumentation and telecommunication, were combined under
“Information and Communication Technologies (ICT)” title. With the addition of new
research titles, priority areas of Turkey were redefined as ICT, advanced materials,
biotechnology, nuclear technology, and aerospace technology. Apart from defining R&D
priorities; R&D support mechanisms, and university – industry cooperation issues were
discussed in more detail, and the building of new technoparks was stated as a target.
Increasing the number of international scientific publications of Turkey, strengthening
Turkey’s academic and researcher infrastructure by supporting the allocation of scientists
from former Soviet Union States and Eastern European countries in Turkish universities,
updating intellectual property rights legislation, and forming a national science academy
consisting of high-level academics were other topics of the Turkish Science and Technology
26
Policy: 1993 – 2003 policy document. In accordance with the final target, Turkish Academy
of Sciences (TÜBA) is also founded in 1993 to arouse scientific curiosity throughout the
public, to awaken interest in research and to spread scientific thinking. Notwithstanding these
ambitious targets and actions towards institutional infrastructure, the targets of the plan and
the strategies on research priority areas mentioned in the Turkish Science and Technology
Policy: 1993 – 2003 policy document can be implemented. The failure of its implementation
is noted by the Seventh Five Year Development Plan of 1996-2000.
The most important event of the Seventh Five Year Development Plan period of 1996 –
2000 is the launch of “The Project for Impetus in Science and Technology”. Within the scope
of The Impetus in Science and Technology Project, new targets for science and technology
indicators were set and specific fields of investment were proposed. It is targeted to reach an
R&D intensity of 1.5 percent, where researcher ratio target remained 1.5 as it was set in the
Sixth Five Year Development Plan (DPT, 1995).
Several specific fields of investment were envisaged, such as the Construction of the
National Information Infrastructure needed for the 21st Century and the Telematic Services
Network; Process R&D, especially in Flexible Manufacturing and Flexible Automation
Technologies, for innovation in the Turkish Manufacturing Industry; the upgrading of the
existing railway system on the base of High-Speed Train Technologies; Aviation Industry,
and R&D on the base of selected aviation products; R&D in Gene Engineering and
Biotechnology, and project based applications; R&D in Environmentally Sound
Technologies, and in Effective Use of Energy and Environment Friendly - Renewable Energy
Technologies, and nation-wide applications; R&D in Advanced Materials; and related
industries (DPT, 1995). In addition to the targets, and fields of investments, R&D incentives,
university – industry cooperation and the importance of international collaboration are other
hot issues of the plan. Labor force, especially white-collar workers specialized on high
technology areas, was asserted to be the most important capital of the country. It was
suggested that necessary measures should be taken, and that incentives should be provided to
increase the amount and quality of human capital. According to the plan, the contribution of
the private sector to R&D activities should also be increased and supported by public
procurement policies. It was explained in the plan that, the aim of increasing science,
technology and industry skills would be taken into consideration by public procurement
policies. This was encouraging for private sector companies especially for the ones dealing
with ICT. Besides, most public institutions were in need of investments to renovate their ICT
27
infrastructures. Further, issues relating to institutional infrastructure were raised in the
Seventh Five Year Development Plan. One of them was about intellectual property rights.
Others dealt with taking necessary actions for the establishment of a national information
system, of an accreditation mechanism, and of a national institute for standardization and
quality assurance of products / processes, which resulted in foundation of TÜBİTAK –
ULAKBİM in 1998, of the Turkish Accreditation Agency (TÜRKAK) in 1999, and of
TÜBİTAK – National Metrology Institute (UME) in 2001.
Another vital theme of the Seventh Five Year Development Plan was the request to
encourage establishment of venture capital funds. Venture capital funds and business angels
are crucial organizations to meet sustainable development targets. They bear the risk when
government incentives are not enough. Recognizing the importance of venture capital funds,
it was proposed that necessary regulations should be designed, and that policies should be
defined to prepare a suitable environment for such organizations. After the completion of the
legal arrangement about venture capital funds in 1993, Vakıflar Bankası founded in 1996
Vakıf Girişim Venture Capital Investment Co. which is the first national attempt on the
subject. Vakıf Girişim was followed by three noteworthy venture capital funds, İş-Risk, iLab
and Burhan Karaçam Partnership towards the end of 2000.
5. 2000 Onwards, A New Approach and a Challenging way to join the EU: The new
millennium is a turning point with regard to Turkish S&T policy. The first couple of years
witnessed important activities. However, the vicious cycle of the 2001 and 2002 crises may
have significantly impeded the voluntary approach witnessed in the sector. However, in the
post-crisis period, more hopeful and significant improvements were observed in the policy
arena. First of all, the government somewhat takes the political responsibility. More important
than this governmental behavior is the proper functioning of the highest policy-making body
of the sector, namely BTYK. It convenes twice a year after 2004 in accordance with its
legislation. Furthermore, its decisions constantly supported R&D and innovation. The
construction of a national innovation system (NIS) together with the attempts towards
regional innovation systems (RIS) were key developments in its agenda. As stated in the
Eighth Five Year Development Plan (2001 – 2005) “The National Innovation System shall be
completed and efficiently operated with a view to gain a sound scientific base and a certain
innovative potential” and “Legal and institutional arrangements required for the smooth
functioning of the National Innovation System” are major policy concerns (DPT, 2000).

28
Setting up technoparks and technological development zones for the aim of university-
industry collaboration, increasing the support for R&D activities of SMEs, establishing new
technology start-up companies, directing R&D activities to specific areas, and setting new
targets for science and technology indicators were other significant issues in the Eighth Five
Year Development Plan. In the latter, priority areas for R&D activities – “fields of advanced
applications” – to be supported were amended. Advanced material technology and genetic
engineering were added whereas nuclear energy was dropped from the list. Therefore, new
research and development priorities of Turkey were altered in such a way that it includes new
materials, ICT, aerospace and space technologies, mega science and clean energy
technologies, biotechnology and gene engineering, and oceanography and technologies on
utilizing and exploiting sea and underwater riches. The promulgation of “The Law of
Technology Development Zones” in 2001 was a significant step for R&D activities of SMEs
in the context of university–industry collaboration. The law states that technoparks and
technology development zones established by universities and KOSGEB would host
incubators for start-up companies, infrastructure – ready workplaces for SMEs and big
companies, together with tax exemptions and other benefits (Official Gazette, 2001).
The political attempts towards joining the EU also produced vital results for the
Turkish S&T sector. Turkey has shown its intention to be a partner of European Research
Area (ERA). The eight meeting of BTYK clearly exhibits this intent to fully participate in the
6th Framework Program (FP6). The previous partial participation to the ERA through actions
such as EUREKA, COST, etc. evolved into a full participation with the decision of BTYK.
The sixth BTYK meeting ended up with another important decision: the production of the
“National Science and Technology Policies: 2003-2023” strategy document. With the mission
“to build a nation mastering science and technology at the 100th anniversary of Turkish
Republic”, and to raise awareness about the need for a strategy to fulfill long-term
achievements, this document was used as an outline for the “Vision 2023: Science and
Technology Strategies” report, which studies stated up in 2002 (BTYK, 2000 and BTYK,
2002). The major goal of Vision 2023 is to create a welfare society that:
• Dominates in science and technology,
• Is able to use technology and is capable of producing new ones,
• Has the ability to convert technological progress into social and economic benefits.
As evidenced in Figure 5, Vision 2023 Project was decomposed of four sub-projects :7
7 For the organizational Scheme of Vision 2023, see Figure A2 at the Appendix.

29
• Technology Foresight Project
• National Technology Competence Inventory Project
• Researcher Information System Project (ARBİS)
• TUBITAK National Research Infrastructure Information System Project
(TARABİS)
Figure 5: Vision 2023 and its Sub-projects
The technology foresight project comprised the backbone of Vizyon 2023 and was the
first of its kind in Turkey. The primary objective of the Vizyon 2023 project was to
implement a technology foresight exercise and to use its results to design of Turkey’s new
science and technology policy. Process benefits such as ‘large participation’, ‘strategic
thinking’, ‘forward concentration’, ‘coordination’, ‘obtaining social support and consensus’
were also sought and considered particularly useful in gaining support for the later
implementation of the new S&T policy.
Inside the project a SWOT analysis was carried out (see table below). The SWOT
analysis revealed the eminence of human resources issues. Several aspects of the latter were
considered as strengths, weaknesses opportunities and threats. For instance, while the
existence of an open-minded young and dynamic population that can easily adjust to

30
advanced new technologies is seen as strength, high population increase, lack of proper and
sufficient education for this young population constitutes a major weakness. As a
consequence, human resources management appeared as one of the most important strategic
variables for Turkey in acquiring the desired level of competency in science and technology.
Source: TÜBİTAK, 2004b
It is necessary to develop policies that remedy the weaknesses of Turkey’s human
resources and capitalize on the opportunities offered by the young population through proper
education and employment policies. Otherwise, not receiving a proper education and suffering
from unemployment, this population may constitute a major threat.
Another fact that stands out as a result of the SWOT analysis is that public procurement
and defense procurement is a strategic variable that must be considered in S&T policy. Turkey’s
global position obligates heavy defense, aeronautics and space industry investments and the
development of associated products and services with advanced technology content. This
necessity is considered as an opportunity to develop the S&T infrastructure. Furthermore, the
expected spillover of the technologies developed in this area to the private sector is regarded as a
driving force and as an opportunity in itself under the technological opportunities heading. Under
the strengths / science, technology and innovation infrastructure heading, the opportunities of
large scale national projects such as defense procurement programs, national research
Table 8: SWOT Analysis for Turkey in Vision 2023 Project
Strengths Human resources Geographical situation and natural resources The science technology and innovation infrastructure The competitive strength of the industry Weaknesses Human resources Political, administrative and bureaucratic obstacles Weaknesses pertaining to the structure, infrastructure and development of the industry
Lack of coordination and cooperation Cultural factors Opportunities Human resources Opportunities that are created through globalization Technological opportunities Threats Population increase and brain drain Threats that result from globalization Lack of ability to adjust to the rapid development of S&T

31
infrastructure programs and municipality infrastructure programs are listed as a major strength,
while under the weaknesses / political administrative and bureaucratic obstacles heading, it is
stated that the government does not adequately support the science and technology
development efforts with due public procurement policies. Thus, the conclusion is that public
procurement is a very effective way in increasing the S&T competency of the country,
provided that policies are put in place to serve that purpose. This notion is somewhat in
contradiction with the Delphi Survey result, where ‘public procurement’ was the least
preferred policy tool among other suggested policy tools. However, in the Delphi survey,
public procurement was most favored by defence, aeronautics and space, information and
communication and construction and infrastructure sectors, which is comprehensible
considering the larger scale of projects and investment required in these sectors. According to
the SWOT analysis, the inclination of the industry to buy and use systems and technologies from
abroad instead of basing production on in-house or local R&D efforts, leads to a deficiency in
developing new technologies, and is considered as a major weakness of the Turkish industry.
Exceptionally, the automotive and its by-product industries, the household appliances industry
and the consumer electronics and machine manufacturing industries did develop over the past
years a tendency to engage in R&D-based production and in technology development, targeting to
become design and technology development centres on the global scale. This was facilitated by
the developed countries’ practice of shifting production lines for consumer goods to peripheral
economies and by the opportunity to transfer knowledge and technology from global producers
operating in Turkey. Furthermore, the R&D support measures that were undertaken in the recent
past have positively contributed to this development. It is anticipated that new opportunities for
the Turkish industry in global markets will develop, provided that this tendency continues and that
R&D support programs for the private sector are further developed and diversified. Otherwise the
Turkish industry faces the threat to even loose its current competitive advantage acquired in
global markets.
According to the method of the foresight exercise, one of the important task is to
determine strategic technology areas or ‘underpinning technologies’. This task had been
accomplished by the panels but at different levels of detail. The resulting list is a very
extensive one, including 480 different underpinning technologies grouped by the project
office under eight headings referred to as ‘strategic technologies’ listed as 8
• Information and communication technologies
• Biotechnology and gene technology
8 For a full list of strategic technologies, see Table A4 at the Appendix.

32
• Nanotechnology
• Mechatronics (Robotics, MEMS, Sensors, Basic Control Technologies)
• Design technologies (Modelling, Simulation, Design software)
• Technologies related to production processes and systems
• Materials’ Technologies
• Energy and Environment Technologies
In addition to the foresight activity, ARBİS and TARABİS projects aim to estimate the
R&D human capital and capital stock of the country. ARBİS functions to construct an up-to-
date database for the research personnel in universities, for public and private sector
establishments in Turkey, and for Turkish researchers abroad. ARBİS is an important
database to collect information on Turkish Researchers. Moreover, it is one of the first
examples on a global scale. The registrations reach to 35,254 for researchers and 927 for
R&D institutions (updated in 31.10.2007). Similar to ARBİS, TARABİS aims to form a
database for the machine / system / device stock and R&D project accumulation related with
research, experimental development, test / analysis and diagnosis activities.
Unfortunately, Turkey was not able to reach its science and technology targets (R&D
intensity could only reach 0.67 percent and the researcher ratio was only 1.83 by the end of
2004). Besides, Turkey’s problems with catching-up developed countries in technology
production and innovation capabilities persist. In this context, Vision 2023 is a delayed but
crucial attempt in the history of Turkish Science, Technology and Innovation Policies. In
2004, in order to implement Vision 2023, BTYK decided to prepare a mid-term plan, called
“National Science and Technology Policies Implementation Plan 2005-2010 (BTP-UP)”.
Implications of Vision 2023 and of BTP-UP can be seen in BTYK meetings. Firstly, new
targets for the two science and technology indicators were established. By the end of 2010, it
is aimed to raise the researcher ratio to 2.3, and to reach an R&D intensity of 2 percent, while
latest values were respectively 1.36 and 0.67 percent. In 2005, Turkish government allocated
an annual budget of 456 million YTL to support R&D activities and to achieve the R&D
intensity target. Another implication of these two projects is the recognition of new S&T
performance indicators employed by EU member states, Japan and USA to evaluate the
policies in a better and more quantitative way. The first striking feature is that R&D
expenditures were set off to be analyzed in a more detail fashion. Shares of business
enterprises, government, and higher education were also calculated. Another significant point
is the measurement of SME innovation performances. Last but not least, global

33
competitiveness rank of Turkey is monitored with the global competitiveness index, which is
one of the crucial indicators showing the progress in scientific and technological development
and in innovation capabilities of Turkey in a global scale. Using new science and technology
performance indicators implies the recognition of international indicators to measure the
performance of the sector.
The strengths of the Vizyon 2023 technology foresight are:
Strong Link to Policy: The Turkish foresight study, being a project that was decided by the
BTYK, Turkey’s foremost S&T policymaking authority chaired by the prime minister, had a
strong link to policy and enjoyed strong political support. The foresight results and the
strategy developed gained official status by the prompt decisions of the Council. The
implementation is still continuing under the authority of the BTYK.
Holistic Approach: The foresight exercise was designed taking a holistic approach including
vision-building, identification of goals, identification of strategic technologies as well as the
objective of achieving process effects. The appropriateness of the foresight approach naturally
depends on its context. In the Turkish case, a holistic approach was suitable since this was the
first national foresight exercise and it was to serve as a learning process. But it was also
necessary to elaborate on the country’s S&T vision as well as to identify priority technologies
and to develop strategy and policy advice. Previous policies had been developed on the
premises of the examples set by other developed countries. It was therefore significant to
develop a holistic foresight approach, tailored to Turkey’s needs.
Efficient Program Management: Organizing a national foresight study is a grand and
complicated endeavour, involving the coordination of many actors and resources. The task is
even a more challenging one when there is an acknowledged deficiency of coordination, an
unwillingness to cooperate among public bodies and various stakeholders of Turkish science,
technology and innovation system. The project was well executed - all deliverables (panel
meetings, reports, Delphi survey, synthesis, strategy document etc.) were met. During the
execution of the foresight, extensive use was made of the Internet, especially in the conduct of
the Delphi Survey. The documentation of the project is adequate. Nevertheless, as expected in
any such kind of endeavour, critique was raised about the project management. This critique
is documented in the meeting minutes of the joint meeting of the panels held in February
2004. The minutes contain statements in which it is argued that the project management was
not systematic enough, that the project office failed to supply sufficient documentation to the
panels, that the time allocated for the panels work was insufficient, etc. A major flaw of the

34
Vizyon 2023 project is that the other three sub-projects were not completed in time so as to
provide input to the technology foresight project as originally planned. These critiques aside,
the impression one gets is that the technology foresight project was managed efficiently.
Although there are some weaknesses of Vizyon 2023 technology foresight such as
problems in program level prioritization, it is an important step forward for foresight studies
in Turkey. It brings about a necessary know-how for implementation of such projects, for
instance; in the context of the ForSociety ERA-NET project, ERA-Net Multinational Delphi
Survey designed solely by TÜBİTAK are implemented in 15 countries in 2007.
As noted before, National Science and Technology Policies Implementation Plan
2005-2010 (BTP-UP) is an important attempt to implement Visyon 2023. TÜBITAK, in
collaboration with relevant public agencies, academia, private sector and the NGOs developed
a National Science and Technology Strategy spanning the timeframe between 2005-2010. In
formulating the Strategy a participatory process was designed with the participation of all
parties involved in S&T and a jointly agreed vision and mission of the country’s S&T strategy
were adopted. The mission and vision were then approved by the BTYK in September 2004.
In the meetings of September 2004 and March 2005, BTYK adopted strategic goals,
objectives, priorities, general mechanisms and funding policies of the Strategy. Basic
objectives of this strategy are (BTYK, 2004):
• To improve quality of life
• To solve social problems
• To increase competitiveness
• To raise awareness of S&T by the public
Main targets are (BTYK, 2004):
• To increase the demand for RTD
• To enhance the quality and quantity of scientists, professionals and technical
personnel
• To increase the share of RTD expenditures in GDP
Following principles govern the activities within this strategy (BTYK, 2004):
• Strategic approach
• Outcome-orientation

35
• Public-private partnerships
• Effectiveness
• Participation
• Accountability
• Balance between responsibilities and capabilities
• Flexibility
In the meetings of September 2004 and March 2005, BTYK adopted strategic goals,
objectives, priorities, general mechanisms and funding policies of the Strategy. Released after
the March 2005 meeting of BTYK, the plan included seven strategic aims and action areas
(BTYK, 2005a):
• Enhance awareness of science and technology ,
• Educate more scientists and enhancing their capabilities,
• Support outcome-oriented and qualified research,
• Make national science and technology management more effective,
• Strengthen the RTD performance of private sector,
• Improve research environment and infrastructure,
• Enhance national and international linkages.
As the main modality of this strategy, Turkish Research Area (TRA) was defined as an
integrated and coordinated policy entity composing of all private and public entities that either
perform, fund or demand RTD activities as shown by Figure 6.

36
Figure 6: Turkish Research Area (TARAL)
Starting with the eleventh meeting of BTYK, some important decisions are taken.9 In the
eleventh meeting of BTYK, The Foundation of Research Group on Social Sciences and
Humanities in TÜBİTAK (SOBAG) is an important step for Social Sciences in Turkey. This
attempt causes a rise in the number of projects prepared in these areas for TÜBİTAK
supports. The determination of National Science and Technology System Performance
Indicators is another important decision taken in the eleventh meeting. The indicators and
targets are determined in the twelfth meeting of BTYK.
National priority science and technology areas are also determined in accordance with the
findings of Vizyon 2023 in the eleventh meeting of BTYK as:
• Information and communication technologies
• Biotechnology and gene technology
9 For a list of all decsions taken after the tenth meeting of BTYK, see Table A5 in the appendix.
• Principles • Aims • Objectives • National Priorities
•Solve the problems •Increase the quality of life •Increase the level of wealth •Increase the competitiveness
TARAL
Public Agencies
SPO
Private Sector
Universities
NGO

37
• Materials’ Technologies
• Nanotechnology
• Design technologies
• Mechatronics
• Technologies related to production processes and systems
• Energy and Environment Technologies
The acceptance of OECD's Frascati, Oslo ve Canberra Handbooks as reference in R&D
activities in the eleventh meeting ensures the standardization of a database with international
data. As discussed before, the National Science and Technology Implementation Plan 2005-
2010 is a significant ouput of the eleventh meeting of BTYK. National Defence Research
Program and National Space Research Program are the other outcomes of this meeting.
In the last three meetings of BYTK, three important decisions deserve attention among the
others:
• The determination of National Innovation System Performance Indicators: For the
aim of improving the existing statistics and production of incomplete statistics in
international standards that are the basis of strategic decisions for National
Innovation System and international comparisons, Turkish Statistical Institute,
TÜBİTAK and other partners are decided to collaborate.
• The Preperation of National Innovation Strategy and Action Plan: The fourteenth
meeting of BTYK decided the preperation of this plan under the coordination of
TÜBİTAK. In the next meeting, BTYK approved the National Innovation Strategy
(2008-2010). The plan describes six general aims (BTYK, 2007):
1. To encourage entrepreneurship, innovativeness and productivity.
2. The efficient use of science and technology capacity.
3. To support the sustainable, strong and competitive markets in the country.
4. To establish suitable infrastructure and environment.
5. To enhance international cooperation.
6. To improve the governance and harmony of the innovation system.
• International Science, Technology and Innovation Strategy (2007-2010): The
preparation of the plan and its framework are decided in the fourteenth meeting of

38
BTYK. The Strategy document was approved by the fifteenth meeting of BTYK.
The document outlines five general aims (BTYK, 2007).
1. To enhance the existing bilateral and multilateral relations in science,
technology, and innovation (STI), and construct new relations.
2. To support the country’s political, economic, commercial, scientific, social,
cultural, military, strategic, and etc. relations through STI tools.
3. To provide the necessary environment for the partners of Turkish Research
Area (TARAL) for following the STI developments, and increase the
participation, ability and performance of those partners to international STI
activities.
4. To mobilize the expert and researchers mass in abroad in order to increase
the level of STI in Turkey.
5. To support the realization of targets and vision of National Science and
Technology Strategy.
As a new policy tool, National Technology Platforms have been initiated in 2007 in order
to establish a mechanism bringing together a wide range of private and public stakeholders to
play a role in increasing the private R&D investment and involving the private sector in
policy making process. The opening event was held in 11 January 2007, in Istanbul for the
five sectors: automotive, metal, electric-electronic, marine-maritime and textile. These sectors
except marine-maritime, were chosen since they are the leader sectors in Turkey which have
the largest export volume and high skills to create value through collaboration. Marine-
maritime was chosen because of its strategic importance. After the opening event, the
representatives of each sector were gathered in workshops to initiate the establishment of the
platforms. In the workshops the Platform Coordination Boards were elected to be responsible
for the establishment of the platforms and increasing the participation. The establishment and
operational costs of the platforms will be financially subsidized via The Support Program for
the Initiative to Build Scientific and Technological Cooperation Networks and Platforms
(İŞBAP). The initiative was extended to three new sectors with the consultation of BTYK.
Energy and Medicine sectors with high export volumes and Agriculture sector having a
strategic importance were included in the initiative. The opening event for the three sectors
was held in 6 July 07 in Ankara. In the first week of August the workshops for each sector
were organized and the Platform Coordination Boards were established. Technology

39
Platforms are currently preparing the İŞBAP projects to be eligible for the matching fund and
involved with the dissemination activities.
In this context, we can briefly summarize the İŞBAP projects. İŞBAP aims to support the
establishment of collaboration networks and platforms. These networks and platforms are
expected to
• create road maps and develop policies for scientific and technological development
at both national and international levels in the proposed area,
• increase the visibility and collaborations in science and technology at international
arena,
• provide efficient use of incentives by sharing national and international knowledge
accumulation, combine existing opportunities, improve new mechanisms for
sharing, and increase mobility,
• participate in national and international projects, establish and develop physical
infrastructure in Turkey; support and launch educational and training activities
necessary for human capital above the critical mass; provide material actions for
directing accumulated scientific knowledge to technology transfer,
• increase the competitiveness of Turkey through established collaborations.
In a global economy depending on innovation and knowledge, one of the main factors in
order to improve the competitiveness of a country is the sustainable productivity growth.
Furthermore, product differentiation, invention of trademarks, adaptation of high technology
and use of information technologies are among the other factors contributing to the
competitiveness. Within this respect, Turkey has been implementing new strategies to make
her export growth sustainable through diversifying exports on the regional and sectoral basis
and, accordingly, The Undersecretariat for Foreign Trade prepared “The Export Strategic Plan
for 2004-2006” that has delineated a vision for the future and identified long-term solutions to
the structural problems of Turkish exports. The successful implementation of the Strategic
Plan for 2004-2006 led through the preparation of a new road map: “The Export Strategic
Plan for 2007-2009”. The ultimate goal of the New Strategic Plan is “the development of a
competitive structure towards a sustainable export growth.” In order to develop a competitive
structure, emphasis has been given to value-added, technology intensive products that are
supported by R&D. The use of information technologies in the export processes, establishing
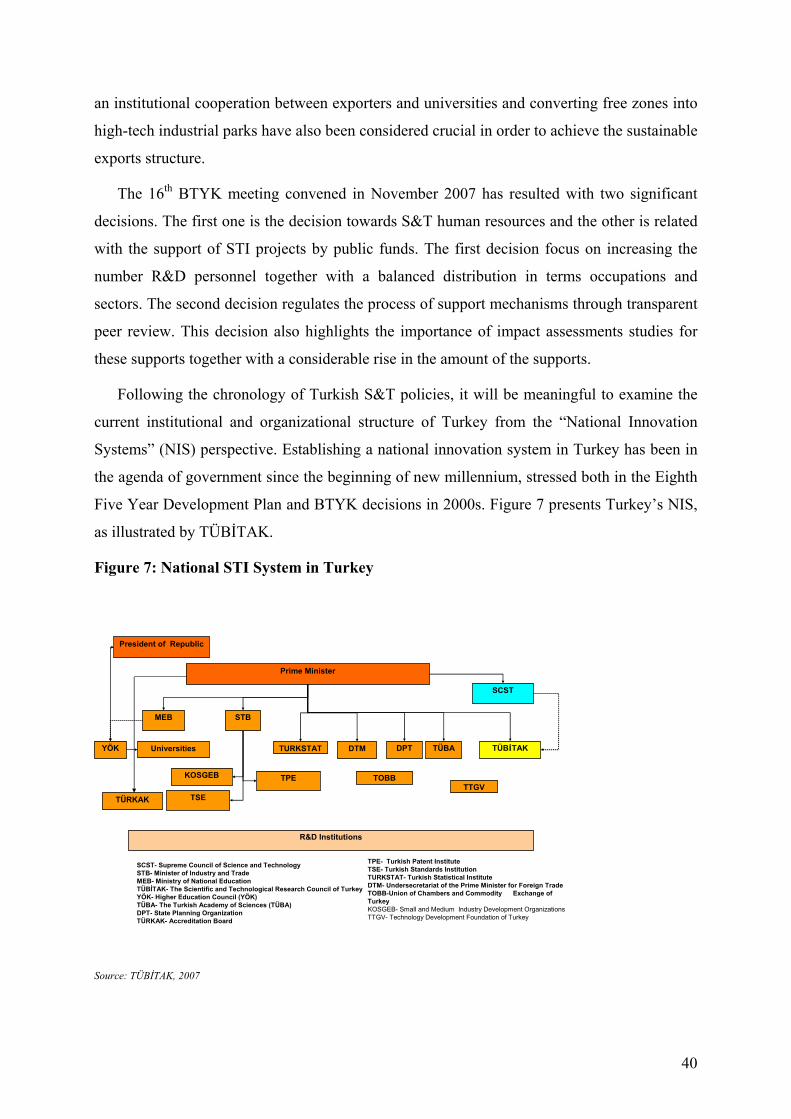
40
an institutional cooperation between exporters and universities and converting free zones into
high-tech industrial parks have also been considered crucial in order to achieve the sustainable
exports structure.
The 16th BTYK meeting convened in November 2007 has resulted with two significant
decisions. The first one is the decision towards S&T human resources and the other is related
with the support of STI projects by public funds. The first decision focus on increasing the
number R&D personnel together with a balanced distribution in terms occupations and
sectors. The second decision regulates the process of support mechanisms through transparent
peer review. This decision also highlights the importance of impact assessments studies for
these supports together with a considerable rise in the amount of the supports.
Following the chronology of Turkish S&T policies, it will be meaningful to examine the
current institutional and organizational structure of Turkey from the “National Innovation
Systems” (NIS) perspective. Establishing a national innovation system in Turkey has been in
the agenda of government since the beginning of new millennium, stressed both in the Eighth
Five Year Development Plan and BTYK decisions in 2000s. Figure 7 presents Turkey’s NIS,
as illustrated by TÜBİTAK.
Figure 7: National STI System in Turkey
President of Republic
Prime Minister
SCST
YÖK TÜBİTAK
STBMEB
Universities DPT TÜBA
TÜRKAK
TPEKOSGEB
TSETTGV
R&D Institutions
DTM
TOBB
TURKSTAT
SCST- Supreme Council of Science and TechnologySTB- Minister of Industry and TradeMEB- Ministry of National EducationTÜBİTAK- The Scientific and Technological Research Council of TurkeyYÖK- Higher Education Council (YÖK)TÜBA- The Turkish Academy of Sciences (TÜBA)DPT- State Planning OrganizationTÜRKAK- Accreditation Board
TPE- Turkish Patent InstituteTSE- Turkish Standards InstitutionTURKSTAT- Turkish Statistical InstituteDTM- Undersecretariat of the Prime Minister for Foreign Trade TOBB-Union of Chambers and Commodity Exchange of TurkeyKOSGEB- Small and Medium Industry Development OrganizationsTTGV- Technology Development Foundation of Turkey
Source: TÜBİTAK, 2007

41
The analysis of the Turkish NIS concludes that it includes nearly all the necessary actors.
Figure 7 shows that BTYK and TÜBİTAK are the main policy-making and coordinating
agents in the system. According to Figure 7, the first significant point in the system is the
complicated and congested structure. The structure may be considered as typical and required
for science, technology and innovation policies, since almost every component of the
government and public institutions are somehow related to the issue. However, this situation
may increase the possibility of harmonization problems among these bodies. The monitoring
and evaluation of R&D activities are performed by one governmental institution, named
TÜBİTAK-TİDEB (later TÜBİTAK-TEYDEB). This is also true for the accreditation
activities held by TÜRKAK. The lack of non-governmental independent evaluation and
accreditation agencies seems to be a problem in front of the adequacy at international level,
especially for the EU.
The financial system seems to function well with numerous types and levels of incentives
as well as direct support for innovating firms by TÜBİTAK-TEYDEB and KOSGEB. The
complementary mechanism of government supports are venture capital funds. However,
Turkey has insufficient number of risk capital establishments, and they supply very limited
capital to start-up companies. The following table displays the risk capital establishments in
Turkey. It shows that risk capital is rather a recent concept in Turkey, even the oldest
establishment, VakıfRisk is around ten years old (Table 9). Moreover, the total number of
projects supported is quite low. The weak structure of risk capital can be considered as one of
the major obstacles for firms to innovate.
Table 9: Risk Capital Establishments in Turkey Date of
Establishment
Number of Projects/Companies in
Portfolio
Vakıf Risk 1996 3
Burhan Karaçam Partnership 2000 -
iLAB 2000 7
İş Risk 2000 6
Turkven 2002 4
KOBİ A.Ş. 2004 1
TTGV Girişim Fund 2004 -
Source: Atmaca, 2006.
Another important institution is knowledge-intensive business services (KIBS). They take
part in the guidance and coordination of institutions and organizations. One thing to say for
KIBS is that Turkey does not have a strong KIBS base. The majority of public institutions and
42
private sector organizations do not utilize KIBS. The number of consultancy firms is far from
meeting the needs of establishments. From the technology consultancy point of view, most of
the so called consultants are representatives or solution development partners of multinational
technology enterprises such as Microsoft, which may keep them from providing optimum
solutions for their clients. Public and private research centres, university-industry cooperation
mechanisms, and private sector companies materialize the operational layer of a national
innovation system. TÜBİTAK is the major public R&D organization of Turkey. TÜBİTAK
manages the largest R&D complex of the country, namely the Marmara Research Center,
which includes a technopark and six research institutes, and six different R&D institutes
working on specific areas. Research institutes within the Marmara Research Center are
Information Technologies Research Institute, Institute of Energy, Chemistry and Environment
Institute, Food Institute, Materials Institute, Earth and Marine Sciences Research Institute.
Other research institutes owned by TÜBİTAK are listed as National Electronics and
Cryptology Research Institute, Defence Industry Research and Development Institute,
Information Technologies and Electronics Research Institute, Basic Science Research
Institute, Genetic Engineering and Biotechnology Research Institute, Cukurova Advanced
Agricultural Research & Development Institute.
In a global context, Technoparks have for a long time been considered as the key
instrument to foster university – industry collaboration and technology spillovers among
firms. Geographical proximity helps to develop complementary skills, to transfer technology,
and to create collaboration opportunities. Universities in Turkey began to establish
technoparks in 1990s, but as evidenced in the above table they have been legally hosting
companies since 2001. By the end of 2001, there were two technoparks in Turkey, METU-
Technopolis and TÜBİTAK-Marmara Technopark. Following the promulgation of “The Law
of Technology Development Zones” in 2001, there has been a sudden increase in the number
of technoparks, and twenty new ones were set up after 2002. However, most of the
technoparks founded after 2003 are still under construction and have not begin to function.

43
Table 10: Technoparks in Turkey
Site Date of Establishment
METU - Technopolis Middle East Technical University / Ankara
2001
Marmara Technopark TÜBİTAK-Marmara Research Center / Gebze
2001
İzmir Technology Development Center İzmir Technology Institute / İzmir
2002
Cyberpark Bilkent University / Ankara 2002
Gebze Organized Industrial Zone Technopark
Sabancı ve Kocaeli Universities / Kocaeli
2002
İTÜ - Arı Technopolis İstanbul Technical University / İstanbul
2003
Hacettepe – Technopolis Hacettepe University / Ankara
2003
YTU – Technopark Yıldız Technical University / İstanbul
2003
Eskişehir Technology Development Zone Anadolu University / Eskişehir
2003
KOU – Technopark Kocaeli University / Kocaeli
2003
Istanbul University Technology Development Zone
İstanbul University / İstanbul
2003
Konya Technopolis Selçuk University / Konya 2003
Antalya Technopolis Akdeniz University / Antalya
2004
Erciyes Technopark Erciyes University / Kayseri
2004
Trabzon Technology Development Zone Karadeniz Technical University / Trabzon
2004
Çukurova Technology Development Zone Çukurova University / Adana
2004
Ata Technopolis Erzurum Atatürk University / Erzurum
2005
Mersin Technology Development Zone Mersin University / Mersin 2005 Göller Bölgesi Technology Development Zone
Süleyman Demirel University / Isparta
2005
Ulutek Technology Development Zone Uludağ University / Bursa 2005 Gaziantep University Technology Development Zone
Gaziantep University / Gaziantep
2006
Ankara University Technology Development Zone
Ankara University / Ankara 2006
Source: Republic of Turkey, Ministry of Industry and Trade, 2006
Next, we will briefly analyze the recent developments for some incentives provided by
TÜBİTAK. TUBİTAK scholarships are important for increasing the number of R&D
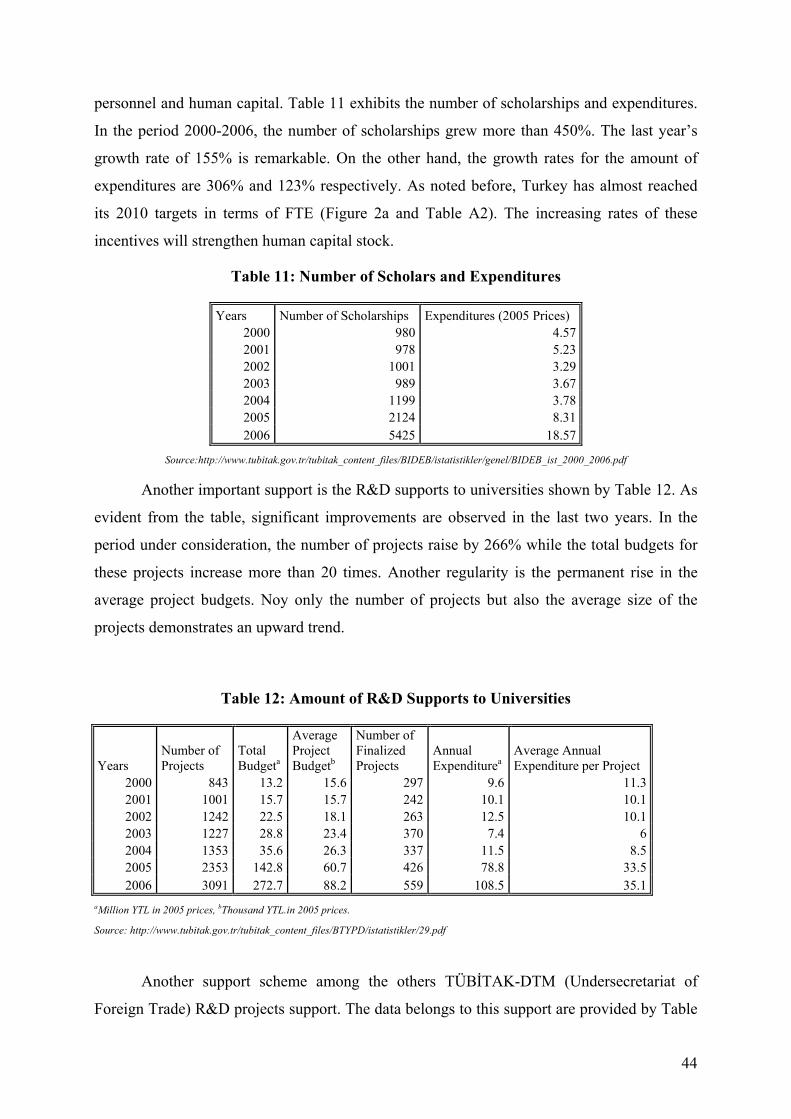
44
personnel and human capital. Table 11 exhibits the number of scholarships and expenditures.
In the period 2000-2006, the number of scholarships grew more than 450%. The last year’s
growth rate of 155% is remarkable. On the other hand, the growth rates for the amount of
expenditures are 306% and 123% respectively. As noted before, Turkey has almost reached
its 2010 targets in terms of FTE (Figure 2a and Table A2). The increasing rates of these
incentives will strengthen human capital stock.
Table 11: Number of Scholars and Expenditures
Years Number of Scholarships Expenditures (2005 Prices) 2000 980 4.57 2001 978 5.23 2002 1001 3.29 2003 989 3.67 2004 1199 3.78 2005 2124 8.31 2006 5425 18.57
Source:http://www.tubitak.gov.tr/tubitak_content_files/BIDEB/istatistikler/genel/BIDEB_ist_2000_2006.pdf
Another important support is the R&D supports to universities shown by Table 12. As
evident from the table, significant improvements are observed in the last two years. In the
period under consideration, the number of projects raise by 266% while the total budgets for
these projects increase more than 20 times. Another regularity is the permanent rise in the
average project budgets. Noy only the number of projects but also the average size of the
projects demonstrates an upward trend.
Table 12: Amount of R&D Supports to Universities
Years Number of Projects
Total Budgeta
Average Project Budgetb
Number of Finalized Projects
Annual Expenditurea
Average Annual Expenditure per Project
2000 843 13.2 15.6 297 9.6 11.3 2001 1001 15.7 15.7 242 10.1 10.1 2002 1242 22.5 18.1 263 12.5 10.1 2003 1227 28.8 23.4 370 7.4 6 2004 1353 35.6 26.3 337 11.5 8.5 2005 2353 142.8 60.7 426 78.8 33.5 2006 3091 272.7 88.2 559 108.5 35.1
aMillion YTL in 2005 prices, bThousand YTL.in 2005 prices.
Source: http://www.tubitak.gov.tr/tubitak_content_files/BTYPD/istatistikler/29.pdf
Another support scheme among the others TÜBİTAK-DTM (Undersecretariat of
Foreign Trade) R&D projects support. The data belongs to this support are provided by Table

45
13. Total amount of the support increases by more than 180% in the last years whereas the
number of projects and numner of firms supported by this program grows approximately
40% and 34% respectively in the same period.
Table 13: TÜBİTAK-DTM Industrial R&D Projects Support
Years Total Supporta Number of Projects Number of Firms 1996 2 274 145 1997 8.4 266 182 1998 10.2 271 173 1999 14.2 251 178 2000 19.7 260 176 2001 29.9 333 233 2002 24.8 374 269 2003 38.2 418 316 2004 45.6 503 360 2005 100 595 434 2006 128.1 711 481
aMillion US$.
Source: http://www.tubitak.gov.tr/tubitak_content_files/BTYPD/istatistikler/19.pdf
By the end of July 2007, the number of projects supported by TÜBİTAK-TEYDEB
industrial R&D projects supoort programme has reached 3,465. In these projects, 1,498
establishments are supported (http://www.tubitak.gov.tr/home.do?sid=488&pid=478). All the
above discussion verifies the positive results of main policy shift in the last three years as
explained previously.
The final point analysis in this section is the summary of EU Framework programmes.
The aim of these programmes is to increase the capacity of scientific research technology
development. The first programme was initiated in 1984. The European Commission provides
funds to R&D projects in terms of thematic priority areas. Turkey participated to 4th and 5th
programmes without paying any contribuyion yet she participated on a project base. Turkish
institutions participated in 56 and 94 projects in these programmes (TÜBİTAK, 2006).
Turkey fully participated to 6th Framework Programme, 2002-2006. TÜBİTAK officially
assigned by the government as the contacy organization for the programme at the beginning
of 2003. For Turkey, the framework programmes can be treated as an opportunity to integrate
Turkish Research Area to European Research Area. The participation to the programme was
realized after first calls made and without making too much groundwork (TÜBİTAK, 2006).
Therefore, as evident from Table 14, the success rate in the early years of the programme is
relatively low. In the second period, a significant rise in success rate is observed, averaging a
rate of success more than 15% as a whole.

46
Table 14: Turkey and 6th Framework Programme
Number of Applications as Consortium Partners from Turkey
Number of Turkish Partners in Funded Projects
Success Rate
December 2002-April 2004 1214 128 10.54 April 2004-December 2006 1768 331 18.72 December 2002-December 2006 2982 459 15.39
Source: http://www.tubitak.gov.tr/tubitak_content_files/BTYPD/istatistikler/39.pdf.
Table 15 makes a performance comparison in the 6th Framework Programme for
selected countries. Considering 6th Framework Programme as the first experience for Turkey,
she is not unsuccessful in terms of FTE researchers’ rate. The success rate (6.97) is not so
below the EU average (8.65), it is even higher than Germany. Unfortunately, applications per
million inhabitants display a weaker performance.
Turkey again fully participates to the 7th Framework Programme covering 2007-2013
period. The performance of Turkey in this programme is expected to go up with the
experiences gained during the 6th Framework Programme.
The following section examines the challenges posed to the aforementioned Turkish S&T
system by the integration of non-economic sustainable development dimensions, especially
the environmental one.
Table 15: Comparison of 6th Framework Performance for Selected Countries
(A) (B) (C)
Country Number of
Applications FTE
Researchers Population (B)/(C) (A)/(B)
Applications to 6th
Framework Programme per Million
Inhabitants EU-25 177,139 2,047,499 459,488,400 0.45 8.65 386Germany 28,898 480,550 82,500,000 0.58 6.01 350Spain 15,692 151,487 43,038,000 0.35 10.36 365Poland 6,612 77,040 38,174,000 0.20 8.58 173Sweden 6,901 72,190 9,011,000 0.80 9.56 766Belgium 6,909 60,047 10,446,000 0.57 11.51 661Finland 4,094 57,196 5,237,000 1.09 7.16 782Turkey 2,020 28,964 71,607,500 0.04 6.97 28Hungary 3,682 23,311 10,006,000 0.23 15.80 368Slovakia 1,560 13,353 5,431,000 0.25 11.68 287
Source: TÜBİTAK, 2006

47
III. S&T and Sustainable Development
The profusion of papers written on the co-optimisation of environmental and economic
objectives10 has paved the way for policy initiatives focusing on what can S&T do for
sustainable development, especially to enhance economic competitiveness.11 For example,
ICS (2002) underlines that scientific measurement and analysis can help identify the social,
economic and environmental dangers associated with global changes in the climate and ozone
layer, contribute to improve carbon sequestration techniques or to forecast anomalous climate
conditions. Social sciences also have a role to play in proposing solutions and in assessing the
feasibility and acceptability of such technological solutions to environmental problems.12 For
example, authors studying sustainable consumption can investigate “eco-labelling” and other
certification programmes, but also question our current modes of consumption:13
These authors can also provided methods to assess the extent to which our actions are
sustainable (impact assessments, multi-criteria mapping, lifecycle analyses). For example, to
facilitate the development of sustainable cities, the S&T community can bring datasets,
visualization tools and scenario development techniques to help catalyze interactions among
researchers and agents of change from different regions.
Figure 8: Consumption and satisfaction
Source: Reproduced from a report in Swedish quoted in Bäckstrand and Ingelstam (2006, 126).
10 For example, about the economic impacts of environmental innovations an the “win-win” debate, see Rennings et al. (2003, 31ff). 11 E.g. see G8 (2003), Clark and Dickson (2003), CEPAL (2003), ICS (2002), Mansell and Wehn (1998). 12 About the ways in which the assumptions, values and visions that drive science can be exposed to public scrutiny, see Willis and Wilsdon (2004). 13 See for example the Journal of Industrial Ecology, 2005, Volume 9, Number 1–2, edited by the Massachusetts Institute of Technology and Yale University, http://mitpress.mit.edu/jie; and Jackson et al. (2006).

48
If many initiatives deal with “S&T for sustainable development”,14 there are less policies
which adopt a preventive approach and aim at integrating sustainable development into
sectoral policies, especially S&T policies. In Turkey, the 9th development plan of the DPT
(2006) includes a set of economic and social axes, but does not incorporate the environmental
dimension, which is tackled by the ISDSP project.15 In the third section of this report, we shall
examine the challenges raised by the integration of the environmental dimension of
sustainable development into S&T policies.
III.1 Issues
In the EU, since the Cardiff European Council in June 1998, member states are invited to
identify indicators for monitoring the integration of environmental issues into non-
environmental policy sectors. These include S&T policies16, and correspond to a preventive
approach to environmental problems, by ensuring that environmental issues are addressed by
each socioeconomic sector before problems occur. The magnitude of this challenge is
underlined by the Finnish Ministry for Foreign Affairs (2004, 20) for the case of on of the
most advanced European countries:17
“The greatest challenges in integrating sustainable development in Finland will be found
from the cross-sectoral, multidimensional policy areas where joint action and common
goals from different administrative branches are required.”
According to CEPAL (2003, 12), the challenge posed to S&T by sustainable development
lies in a growing connectivity and interdependency at many levels (chaotic societal and
ecological events more likely), in changes in our understanding of the world (notably thanks
to scientific discoveries), and in changes in the nature of public and private decision-making
(more participatory).
Rennings et al. (2003) argue that currently this process of integration is seen as a burden
and suggest ways to better incorporate environmental concerns into other policies, such as
14 See for example EU’s Environmental Technology Action Plan (ETAP). 15 Environmental protection appears under the heading “Increasing competitiveness”, together with urban infrastructure. 16 http://www.europarl.europa.eu/summits/car2_en.htm. Based on a Communication from the Commission accessible at http://europa.eu/scadplus/leg/en/lvb/l28075.htm. 17 About the challenges faced by new member states, see the 2004 report of the Czech State Environmental Policy and the National Strategy for Sustainable Development published by http://www.ecn.cz/iep and available at http://www.kraj-lbc.cz/public/orlk/projectdocument_sur_lk_czech_final_for_undp_866acc2c32.rtf.

49
better coordination mechanisms. The authors suggest initiatives that could support the
integration of environmental, science, and innovation policies:
1) Green foresight
2) Identify and disseminate BATs (IPPC)
3) Environmental LCAs
4) Strengthen the demand for green product (more focused IPP)
5) Integrate innovation managers in environmental management systems
6) Innovation alliances
7) R&D programmes for sustainable innovation
8) User experiments and lead markets (so that environmental technologies are well accepted
by consumers which can also contribute to their improvement)
9) Programmes for system innovation
This list provides a basis to think about the issues to tackle when integrating environmental
principles into S&T policies and allows us to identify a set of indicators to monitor this
integration. However, some key sustainable development issues seem to be missing, such as
networking initiatives,18 risk assessment, and participatory decision-making.
The article 2(1) of the 6th EAP underlines that it shall be “based particularly on the
polluter-pays principle, the precautionary principle and preventive action, and the principle of
rectification of pollution at source.”19 In order to put these principles into practice, it is
necessary to assess the risks raised by the activities of the S&T sector. Along the lines of
Ulrich Beck’s “Risk Society” (1992), other social and humanities scientists have contributed
to raise awareness about the fact that as science develops, new types of risks appear, entailing
new responsibilities.20 For example, Ravetz (2004) argues that a ‘mainstream’ science,
increasingly linked to industry, should be distinguished from a ‘post-normal’ science, which
embodies the precautionary principle. Post-normal science depends on public debate and
gives a strong role to the ‘extended peer community’. Such as participatory decision-making
for science is increasingly used in Europe. For example, the 6th EAP stresses that provisions
for public participation in policy-making will be important to the success of the Programme. It
18 As argued in the section 2 of this report, an important problem for Turkey is that science outputs are not often enough transformed into technological opportunities. For this purpose ad hoc institutions linking knowledge producers, users and diffusers (e.g. research institutions, firms, and universities) need to be created and empowered, but they should also integrate environmental issues in their initiatives. 19 About how the precautionary principle should be integrated into EU policies, see …###. 20 See Funtowicz and Ravetz (1992, 1993). The French philosopher Michel Serres (1995) even calls for the signature of a “natural contract” to renew Rousseau’s “social contract”.

50
also praises in candidate countries the cooperation with civil society, environmental NGOs
and business. To do so, it calls for the following measures:
- Ensuring access to information, participation and justice through early ratification of
the Aarhus Convention,21
- Supporting the provision of accessible information to citizens on the state and trends
of the environment in relation to social, economic and health trends,
- General raising of environmental awareness,
- Developing general rules and principles for good environmental governance in
dialogue processes.
For the CEPAL (2003, 23), the participation of all social actors, in addition to S&T
professionals, at the different phases of the scientific and technological research process and
in related decision-making, is crucial for four main reasons:
- Ethical reasons. Sectors affected by S&T decisions have the right to participate in
decisions that have a bearing on their wellbeing.
- Political reasons. It is essential to guarantee society’s control over R&D outputs,
particularly those that have an impact on health and the environment.22
- Pragmatic reasons. In certain cases (e.g. new agricultural technologies, new health
treatments), it can be especially important to encourage the social groups who are the
intended beneficiaries to have a sense of ownership over the scientific and
technological knowledge.
- Epistemological reasons. The complex nature of sustainable development often
makes it necessary to consider the different perceptions and objectives of the social
actors involved.
Now that we know a little more about the issue at stake, let us examine a couple of
existing experiences. Only then will we be able to derive indicators to monitor the integration
of environmental issues into S&T policies.
21 Turkey has not ratified the 1998 Aarhus Convention on Access to Information, Public Participation in Decision-Making and Access to Justice in Environmental Matters. 22 For this reason Article XX of the GATT, kept by the WTO allows barriers to trade to protect health and the environment.

51
III.2 Initiatives
There are many international initiatives about how S&T can contribute to sustainable
development. For example, ISTS’ Initiative on Science and Technology for Sustainability
seeks to enhance the contribution of knowledge to environmentally sustainable human
development around the world.23 Its web-based forum facilitates information exchange and
engagement with the larger community involved with science and technology for
sustainability.24 Its Network for Science and Technology for Sustainability25 helps to build a
virtual community linking disparate scholars, managers, and decision makers, and to promote
the sharing of knowledge, ideas, and goals among a community working on science and
technology for sustainability. In Latin America, the CEPAL (2003) has advised to create a
fund for sustainable development, and to alter the “rules” of funding assignment and national
research competitions so that interdisciplinary or trans-disciplinary projects in the area of
sustainable development can be admitted and adequately classified.
In order to foster cooperation between all the actors that contribute to the production of
new knowledge, such as research institutions, universities and firms, in July 2005 France
created 71 centres of competitiveness.26 For example, LYONBIOPÔLE is specialised in
medical sciences and Aerospace Valley in the aerospace sector. But these centres of
competitiveness traditionally used to foster innovation in non-environmental sectors can also
be used to serve sustainable development purposes, as in the case of the “Ville et mobilité
durables” centre specialised in urban planning and management, in the mobility of persons, in
construction and in energy savings.27 Another example is the centre called “DERBI” focusing
on renewable energies.28
Concerning R&D programmes for sustainable innovation, in the EU, the
Environmental Technology Action Plan (ETAP)29 supports eco-innovations by promoting
research and development, mobilising funds, and helping to drive demand and improving
market conditions. Concerning the BATs (Best Available Techniques), they are one of the
four principles on which is based the major IPPC Directive,30 together with public
participation. For example, permits authorising firms to operate must be based on BATs. The
Commission organises an exchange of information between experts from the EU Member 23 See http://www.ksg.harvard.edu/sustsci/ists/. 24 See http://www.ksg.harvard.edu/sustsci/index.html. 25 See http://sustainabilityscience.org/network.html. 26 See http://www.competitivite.gouv.fr/spip.php?rubrique36=&lang=en. 27 See http://www.pole-vmd.org/. 28 See http://www.pole-derbi.com/. 29 See http://ec.europa.eu/environment/etap. 30 See http://ec.europa.eu/environment/ippc/.

52
States, industry and environmental organisations, which is co-ordinated by the European IPPC
Bureau.31 This results in the adoption and publication by the Commission of the BAT
Reference Documents (BREFs) for specific sectors. The right of the public to participate in
the decision making process, and to be informed of its consequences, is ensured giving public
access to:
- Permit applications in order to give opinions,
- Permits,
- Results of the monitoring of releases,
- The European Pollutant Emission Register (EPER),32 which intends to provide
environmental information on major industrial activities.
In Turkey, the TÜBITAK Marmara Research Center (MAM) carries out research on
environmental technologies such as fuel cells, biotechnologies for pollution remediation, or
nanotechnologies for the recovery of VOCs.
In order to develop environmental technologies capabilities at both firm and government
level, and ensure an easier enforcement of such directives, many new European member states
have created Cleaner Production Centres (CPCs). According to Luken and Navratil (2004:
203):
“CP is a cost-effective approach towards sustainable development. The UNIDO/UNEP
NCPC programme confirms that the CP methodology is an effective tool for identification
and prioritisation of technology changes that yield both environmental and economic
benefits.”
The literature on CPCs suggests that their five main tasks are Information diffusion,
Education & Training, Demonstration projects, Policy advice, and Networking. By
working as an interface between government, industry and other stakeholders, CPCs have
assisted several new member states in the integration of environmental issues into non-
environmental sectors, including the S&T one.33 Kjaerheim (2005) even argues that
“Integrating CP methodology in the foreign aid development programmes of western
countries would most probably increase the effectiveness of these programmes”. Setting up
31 See http://eippcb.jrc.es/. 32 See http://ec.europa.eu/environment/ippc/eper/. A new register will replace this one from 2007 onwards. 33 See Staniskis and Arbaciauskas (2004) for the case of Lithuania.

53
a CPCs in Turkey could contribute to the integration of sustainable development principles
into the S&T sector.
Concerning the use of LCAs (life cycle analyses), in the EU the IPP was developed. All
products cause environmental degradation in some way, whether from their manufacturing,
use or disposal. Integrated Product Policy (IPP) seeks to minimise these by looking at all
phases of a products' life-cycle and taking action where it is most effective.34
About green technology foresight, pioneering countries include the Netherlands and
Denmark, which have used conventional technology and expert-oriented approaches such as
Delphi. Innovative methods have been developed by using problem-oriented and back-casting
approaches as well as societal demand pull/technology push approaches and life cycle
assessment.35 Between 2004 and 2005, the Danish Program for cleaner Products has financed
a green foresight project to identify the future environmental challenges and possible
environmentally related competitive advantages related to the three generic technologies
(nanotechnology, biotechnology, ICT). Its recommendations aim at high quality
environmental governance in the development of these technologies, so that issues of societal
needs and environmental potentials and risks are addressed within planning and management
of research, innovation and technology applications. The recommendations concern
Environmental governance, Guiding research and research policy, Policy support for eco-
innovation, and Regulating application areas. They attribute roles to a broad variety of
stakeholders, like research and innovation institutions, businesses and business organisations,
governmental authorities, and consumer and environmental nongovernmental organisations.
Suggestions from the Danish green foresight exercise include:
- The development of strategies for independent assessment of environmental potentials
and risks in research proposals,
- The launch of a Danish Green Innovation programme focused on key environmental
themes and key product and consumption areas,
- The support for development of eco-innovation-oriented competence in research and
innovation through integration of environmental competence and technology
competence
34 See http://ec.europa.eu/environment/ipp/integratedpp.htm. 35 About the GTF methodology, see Borup (2004).

54
- The integration of environmental aspects in policy support for strategic innovation.
Participatory decision-making in S&T has been recently experienced in several occasions:36
the case of UK GMOs,37 including the 1999 UK National Consensus Conference on
Radioactive Waste Management,38 the Citizens’ Foresight exercise in 2000,39 the Prajateerpu
initiative in India in 2002,40 the UK Citizens’ Jury on Nanotechnology in 2005,41 the Public
Engagement and Science and Technology Policy Options project,42 or the RAINS project.43 A
report by Stirling and Mayer (1999) shows how people with very different perspectives can
participate in a constructive discussion and help design regulatory risk appraisal. Twelve
specialists, including highly placed government advisors, biotechnologists, and
representatives of the food industry and public interest groups, worked with them to create a
‘map’ of the debate surrounding GM crops. This ‘multi-criteria mapping’ technique is based
on an approach well-used in areas like energy and land use planning. Instead of asserting a
single ‘right’ (or ‘wrong’) answer, the new method highlights the uncertainties and the
reasons for disagreement, and draws a map of the assumptions under which different options
look ‘best’. In this transparent process, the participants decide the criteria, score the
performance of the various options, and rate the importance of each criterion. The main
findings of the report include:
- Dissatisfaction with the status quo (all the participants judged conventional intensive
cultivation to be performing poorly),
- The organic option performing relatively well across all perspectives, not only under
environmental criteria (where it performed unequivocally well), but also more broadly,
- Participants largely agreed that a voluntary controls regime for GM crops would
perform worse than other regulatory approaches.
36 About new forms of participatory technology developments, see Schot (2001). 37 For a comparison between the public debates on GMOs conducted in France and Britain, see Lieberman and Taylor (2005). 38 See http://www.ukceed.org/consensus_conference/contents.htm. 39 See http://www.iied.org/docs/pla/pla_fs_6.pdf. 40 See http://www.iied.org/sarl/e_forum/. 41 See http://nanotechweb.org/articles/society/4/5/1/1. 42 The PESTO project has investigated public participation in science and technology processes in several European countries, and how the broader public interest has been taken into account in the decision-making process. See http://cordis.europa.eu/improving/socio-economic/area1.htm and Jamison (2001). 43 According to Cash et al. (2003, 8089), the Regional Air Pollution Information and Simulation model developed by IIASA “facilitated discussion among parties with multiple interests regarding differences in perspective, methodology, preferences, values, and desired outcomes”.

55
The following section proposes a set of indicators to evaluate the progress towards the
integration of environmental issues into S&T policies.
III. 3 Indicators 44
Article 6 of the EU Treaty states that “environmental protection requirements must be
integrated into the definition and implementation of the Community policies and activities, …
in particular with a view to promoting sustainable development”. The article 10(e) of the 6th
European EAP45 states that to follow-up and review of sector integration strategies the
European Environment Agency should provide information on integration indicators. The
following figure suggests a framework for evaluating progress with environmental policy
integration developed by the EEA (2005a, 233). It helps to show how integration can be
promoted and provides a single framework for evaluating progress towards environmental
policy integration in a consistent manner and across very different economic sectors. It can
also be used at all levels of governance, from EU institutions to national, regional and local
governments, and even within large companies. It focuses on six main areas:
1. Political commitment, vision and leadership,
2. Administrative culture and practices,
3. Assessments and information for decision-making,
4. Policy instruments such as market-based instruments that promote internalisation,
5. Monitoring progress towards objectives and targets,
6. Eco-efficiency.
44 At this stage this section does not seek to present a systematic list of indicators for monitoring the extent of the integration of sustainable development into S&T policies, but provides material to do so in a later stage. 45 Decision 1600/2002/EC of the Parliament and of the Council of 22/07/2002 laying down the Sixth Community Environment Action Programme. Published in the OJEC, 10/09/2002. http://ec.europa.eu/environment/newprg/intro.htm.

56
Figure 9: Framework for evaluating integration of environment into sector policies
Source: EEA (2005a, 235).
The following table mention some initiatives taken by member states for environmental
integration. As far as the S&T sector is concerned, only the fact that R&D funding and
environmental technologies are mentioned.

57
Table 12: Progress at EU and Member State level in introducing key instruments
Source: EEA (1999, 401).
Lafferty (2002, 19) argues that mechanisms for achieving the sectoral integration of
environmental policy include:
• An initial mapping and specification of sectoral activity which identifies major
environmental/ecological impacts associated with key actors and processes -including
the governmental unit itself (A report)
• Establishment of a system of dialogue and consultation with designated principle
actors and citizens (A forum)
• Formulation of a sectoral strategy for change, with basic principles, goals, targets and
timetables (A strategy)

58
• Formulation of a sectoral action plan, matching prioritised goals and target-related
policies with designated responsible actors (An action plan)
• Integration of the action plan into the sectoral budget and allocations (A green budget)
• Development of a strategy-based system for monitoring impacts, implementation
processes, and target results, including specified cycles for monitoring reports and
revisions of the sectoral strategy and action plan (A monitoring programme)
OECD (2002) provides a checklist on improving policy coherence and integration for
sustainable development. It contains five imperatives, which offer between four to eleven
questions that can be used as indicators to monitor progress towards effective integration:
1. A common understanding of sustainable development,
2. Clear commitment and leadership,
3. Specific institutional mechanisms to steer integration,
4. Effective stakeholder involvement,
5. Efficient knowledge management.
The OECD (2002) has also developed Sectoral Environmental Indicators (SEIs)
designed to help integrate environmental concerns into sectoral policies. Each set focuses on a
specific sector (transport,46 energy, household consumption, tourism, agriculture). Indicators
are classified following an adjusted PSR model reflecting: sectoral trends of environmental
significance; their interactions with the environment (including positive and negative effects);
and related economic and policy considerations.
The EEA (2005b) also provides a set of criteria to monitoring progress towards
environmental integration. The checklist contains one heading relating to the Context for EPI
(Trends in drivers, pressures, changes in state of the environment, impacts and five EPI
categories for which Cross-sectoral and Sector-specific questions need to be answered:
1. Political commitment and strategic vision
2. Administrative culture and practices
3. Assessments and consultation to underpin policy design and decisions
4. Use of policy instruments to deliver EPI
5. Monitoring and learning from experience
46 For an extensive evaluation of the level of integration of environment and transport policies, see EEA (2002).

59
III. 4 Integration of sustainable development into S&T policies in Turkey
In Turkey, several policy initiatives have recently dealt with sustainable development
issues (Local Agenda 21 in 1997, NEAP in 199847, Turkish national sustainable development
report in 2002). But although some of them mention the need to integrate sustainable
development into sectoral policies (DPT development plans), none of them has dealt with the
issue of integrating sustainable development into S&T policies. This lack of initiatives is
evidenced in the policy area by the chapter 35 of the UNDP report on Turkey for the
Johannesburg submit entitled “Science for sustainable development”, which gave the lowest
grade in terms of the quality of available information.48 This lack of policy initiative could be
due to a weak institutional capacity to take up the challenge of integrating sustainable
development into sectoral policies. However, chaired by the Prime Minister, the highest S&T
policy making body in Turkey introduced in the section 2 of this report (BTYK, Supreme
Council for Science and Technology) could be in charge of such a mission.
With its 6th development plan (1990-1994), the DPT started integrating sustainable
development into its development plan. The 8th plan (2001-2005) insists on the need to
integrate sustainable development into other policies, to adopt a participatory approach, to
assess risks, to develop environmental technologies, and to carry out systematic EIAs
(environmental impact assessments). The tools foreseen to integrate sustainable development
into sectoral policies include reviewing the legislation, enforcing it better, developing
horizontal and vertical coordination mechanism, and use EIAs systematically. In Turkey, the
1993 by-law on EIA (latest revision 16 December 2003, Official Gazette No:25318)49 aims to
meet the requirements of the European EIA Directive 85/337/EEC on the Environmental
Impact Assessment of public and private projects (amended by 97/11/EC and 2003/35/EC).50
The latter distinguishes between two types of projects: Annex I, for which EIA is mandatory,
and Annex II projects, for which competent authorities decide if EIA is needed or not. Both
project can include S&T projects. However, enforcement of the transposed EIA directive is
questionable. According to the 2006 accession progress report, regarding EIA Turkey
continues to exclude trans-boundary consultation requirements. Some activities, such as
mining, are not included and public consultation needs improvement. Turkey has not yet
become a party to the Espoo nor the Aarhus Conventions, and no timetable is available with 47 Turkey has a National Environmental Action Plan (NEAP) for the years 1996-2000. It is a binding document for the public sector and serves as a guidance document for the private sector. In addition, certain sectors such as tourism, industry, energy, transport, and agriculture are working towards integration. 48 See http://europeandcis.undp.org/WaterWiki/images/8/86/TurkeyCP.pdf, p. 71. 49 See http://www.abgs.gov.tr/tarama/screening_files/27/SC27DET_01.04.EIA.pdf. 50 See http://www.abgs.gov.tr/tarama/screening_files/27/SC27EXP_EIA%20and%20SEA.pdf.

60
respect to future membership status of these conventions. The strategic environmental
assessment directive remains to be transposed. Key reasons explaining why such integration
has not taken place include shortcomings related to:
- Technical knowledge and capacity for conducting integrated and multi-sectoral
assessments based on sound information, scenarios, and cost benefit analyses to
support sound decision making,
- Coordination among policy-making authorities,
- Effective collaboration feedback mechanisms between decision makers and those
responsible for implementation at the governmental, social (including private sector
and civil society) and individual levels.
Finally, the government adopted in February 2006 a regulation which introduces
regulatory impact assessments (RIA) into the Turkish legal system. RIAs imply to evaluate
costs and benefits, such as environmental and health ones.51 This suggests that due to the
transposed RIA directive, any new S&T should integrate environmental and health issues.
III. 5 What’s next?
Among the key reasons for integrating sustainable development principles into S&T
policies are the fact that environmental policies can trigger innovations (‘win-win’ policies),
that science can help improve the tools used to reach a sustainable development, and that such
a preventive approach allows to take into account the risks and ethical problems deriving from
S&T activities.52 This section contains several elements to answer how can this integration
happen in Turkey.
Since the early 1990s, many countries have developed committees to address
environmental integration. Germany's committee of state secretaries for sustainable
development is one such example. Other countries, such as Austria and Belgium, have
established inter-ministerial commissions to support the implementation of sustainable
development commitments. A large number of countries now have environment or
sustainable development advisory councils, with councils in Finland, Latvia and Lithuania
also serving inter-ministerial coordination functions (EEA, 2005a). As far as the Turkish S&T
51 See http://ec.europa.eu/enterprise/regulation/better_regulation/impact_assessment/index.htm. 52 For example, the EC launched in July 2007 a consultation on a code of conduct for responsible nanosciences and nanotechnology research. See http://www.euractiv.com/en/science/eu-adopt-nanotech-code-conduct/article-165727.

61
sector is concerned, at policy level, the BTYK could lead the integration of environmental
issues in the Turkish S&T sector. The Vision 23 Foresight exercise presented in Section 2
shows that such a participatory policy-making instrument can be used in Turkey. In fact,
energy and environmental technologies are among the eight strategic technologies selected in
the exercise. Building on the obstacles this exercise had to face, a green foresight could be
carried out in Turkey about a controversial environmental S&T issue such as the use of
GMOs in Turkey or the development of biofuels.53 It would be a good experience of a
participatory S&T exercise integrating environmental concerns, in a country where the policy
style is centralised, conflictual, and bureaucratic, to use the factors conditioning policy styles
provided by Jamison (2001, 14).54 A Cleaner Production Centre could be created, for example
within a university for a start, to diffuse cleaner production practices and techniques across
the S&T sector (firms, government, …). Finally, a more specific recommendation could be
the altering of the rules of selection and assessment of Turkish S&T projects, for example to
incorporate the assessment of risk based on the precautionary principle. Argue Rennings et al.
(2003, 42):
“For policy integration it is further important to consider the precautionary principle. The
question is if this principle, tending to risk averse decisions and pessimistic views about
technology impacts, creates conflicts with the general optimistic and technology-friendly
character of foresight studies. This must not necessarily be the case. The precautionary
principle can be used complementarily to exclude unacceptable solutions.”
53 A report on a European foresight on biofuels can be found at http://www.biomatnet.org/secure/Ec/S2061.htm. 54 About policy styles and environmental integration, see EEA (2005c).

62
IV. Problems, causes, and policy recommendations
In this section, we build on the outcomes of the S&T workshop in order to provide policy
recommendations to improve the integration of sustainable development into the S&T sector.
When necessary, information developed in the previous sections was used to support our
arguments, and needs for further studies were pointed out.
IV. 1 Introduction
In order to analyse the degree of integration of sustainable development dimensions into the
S&T sector, a two days workshop was organized. It brought together representatives from all
the stakeholders of the sector, whose name and institution are stated in Appendix. Selected
participants received the draft of the S&T report, which contained the first three sections of
this report. In the beginning of the first day, they were given presentations to remind them of
the objectives and background of the project, including the aforementioned sections. They
were also explained how the workshop was going to function. The same structure was used in
this sector as in the other ones analysed by the ISDSP project to guide the participants in their
formulation of policy recommendations. The broad areas that structured the discussions
correspond to three different phases of the sector (see table in Appendix): Inputs (financial
and human resources), S&T activities (basic research, …), and Outputs (patents, publications,
…).
The participants were first asked to identify the problems of the sector in terms of its
integration of the three dimensions of SD. During this brainstorming exercise, the participants
were divided into three groups so that each of them could work alternatively on the three
phases. For example, one group would start working on problems related to Inputs, after half
an hour it would work on Outputs, and then on S&T activities. Each group appointed a person
to write on a paperboard the groups’ findings, which allowed the groups to benefit from the
thoughts of the previous one when it started working on another phase. Once all the groups
had worked on the three phases of S&T, the moderator put their written contributions in an
electronic format.
Then, the aggregated contributions of the brainstorming of the three groups was displayed on
a screen, and all the participants, not group wise anymore, were asked to separate the
problems from the causes and to organise them in problem categories (see table in
Appendix). Any participant could give his/her opinion as well as the experts. Decision was
always achieved by consensus, and the few problematic cases were identified as such in the
63
table and bullet points (marked with an asterisk) and discussed separately by the authors of
this report.
Finally, overarching policy targets were proposed for each of the three phases:
• Inputs:
o Ease the access to financial resources o Develop institutional capacities
• S&T activities: o Create inter-institutional coordination structures and strengthen existing ones o Increase competitiveness
• Outputs: o Increase competitiveness o Increase support to basic research
These targets defined by the participants provided the structure of this section IV. For each
policy target, we first present and explain the problems and causes raised during the workshop
by the participants (a).55 Then, we introduce as bullet points the policy recommendations
proposed by the participants during the workshop (b), and after these bullet points we discuss
policy alternatives. When the participants’ suggestions did not reach consensus, the policy
recommendation was marked with an asterisk (*) and discussed separately.
Following the bullet points, we start giving our policy recommendations by addressing the
following points:
- Our opinion about the extent to which the 3 dimensions of sustainable development have been addressed by the participants,
- Our opinion about each policy recommendation formulated by the participants,
- Our opinion about the recommendations for which no consensus could be reached,
- Our additional contributions.
Regarding the institutions suggested for implementing the recommendations, we did not make
any additional comment unless we disagreed.
At this stage, we wish to bring to the fore an interesting aspect of the idiosyncrasy of the
S&T sector. This is also reflected in the literature dealing with S&T and SD, which mostly
focuses on S&T for SD, namely on the positive contributions of the sector to the three
55 Therefore, none of the issues presented in the sections on Problems and causes originate from the authors.

64
dimensions of SD. For example, many studies explore how can new technologies contribute
to reduce environmental and health impacts or poverty. This means that the potential negative
impacts of the sector on SD are left aside, hence the importance of this ISDSP project aiming
to allow such negative impacts to be anticipated. In the group’s discussions, these negative
impacts were largely ignored, and the focus was placed on the integration of economic goals
into the S&T sector. Indeed, most discussions dealt with how to make sure that the sector
contributed to enhance the competitiveness of the Turkish economy.
On this particular aspect the participants came out with very interesting proposals, but we
were concerned that the objectives of the project may not be addressed, since two of the three
dimensions of SD had hardly been discussed at the end of the first day. Therefore, before
starting to formulate the policy recommendations in the second day, a short presentation
(attached in Appendix) was given to highlight this problem and to offer solutions to solve it.
After discussing the issue with the participants, given the time constraints they agreed on
taking into account one additional dimension when formulating their policy recommendations
(the environmental one). This resulted in interesting additions, but although not strong enough
to counterbalance the focus on the economic dimension of SD. We wish to underline that
revealing this logic of the S&T sector is an interesting finding in itself, since it tells a lot about
the dynamics of the sector. It will allow us to formulate a specific policy recommendation
about the need for a robust and long-lasting awareness-raising programme targeting all the
stakeholders of the sector, such as university graduates, R&D managers, or government
officials.56
IV. 2 Inputs
This section deals with the extent to which the inputs necessary to carry out S&T activities
integrate SD dimensions. Workshop participants suggested two main policy overarching
policy targets: Ease the access to financial resources, and develop institutional capacities.
IV. 2.1 Ease the access to financial resources
IV. 2.1.a Problems and causes
The key problem to address here is the insufficiency of financial resources. The main
underlying cause mentioned by the participants is the macroeconomic instability. As argued
56 In several new EU member states, this has taken the form of the creation of an institution acting as a resource centre for the promotion of SD, as in the case of the Lithuanian Cleaner Production Centre. See Journal of Cleaner Production, 2004, Vol. 12, pp. 207-214.
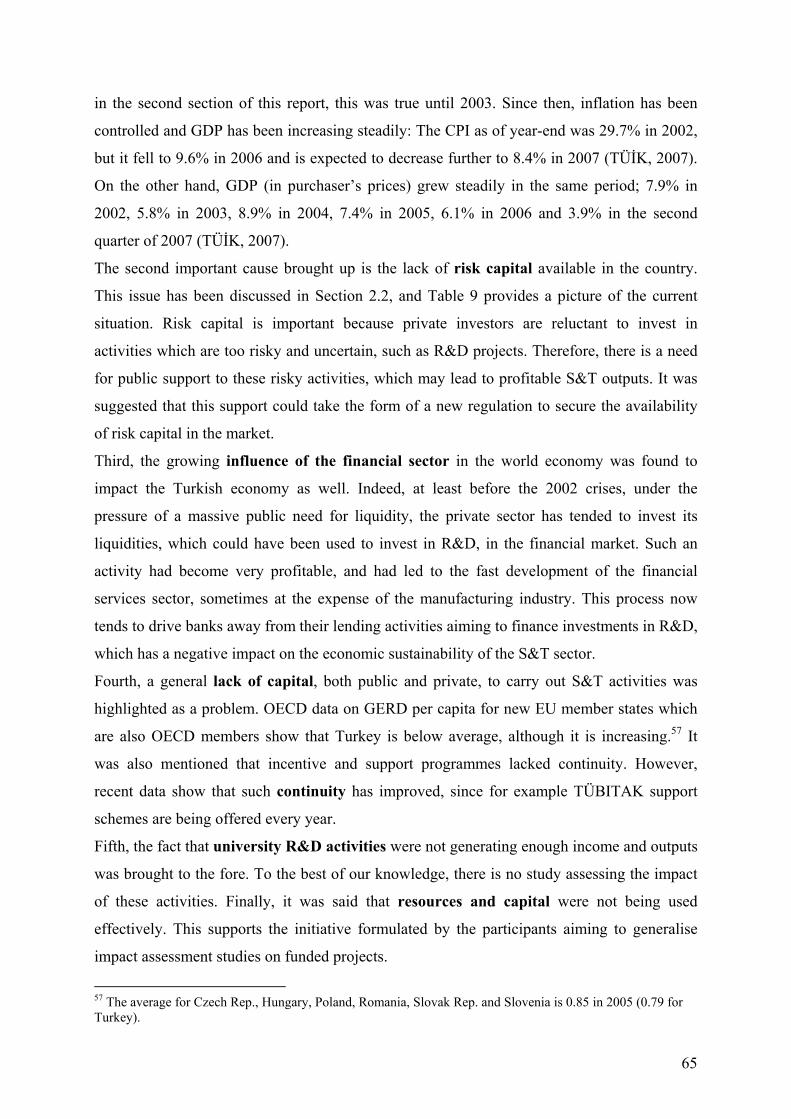
65
in the second section of this report, this was true until 2003. Since then, inflation has been
controlled and GDP has been increasing steadily: The CPI as of year-end was 29.7% in 2002,
but it fell to 9.6% in 2006 and is expected to decrease further to 8.4% in 2007 (TÜİK, 2007).
On the other hand, GDP (in purchaser’s prices) grew steadily in the same period; 7.9% in
2002, 5.8% in 2003, 8.9% in 2004, 7.4% in 2005, 6.1% in 2006 and 3.9% in the second
quarter of 2007 (TÜİK, 2007).
The second important cause brought up is the lack of risk capital available in the country.
This issue has been discussed in Section 2.2, and Table 9 provides a picture of the current
situation. Risk capital is important because private investors are reluctant to invest in
activities which are too risky and uncertain, such as R&D projects. Therefore, there is a need
for public support to these risky activities, which may lead to profitable S&T outputs. It was
suggested that this support could take the form of a new regulation to secure the availability
of risk capital in the market.
Third, the growing influence of the financial sector in the world economy was found to
impact the Turkish economy as well. Indeed, at least before the 2002 crises, under the
pressure of a massive public need for liquidity, the private sector has tended to invest its
liquidities, which could have been used to invest in R&D, in the financial market. Such an
activity had become very profitable, and had led to the fast development of the financial
services sector, sometimes at the expense of the manufacturing industry. This process now
tends to drive banks away from their lending activities aiming to finance investments in R&D,
which has a negative impact on the economic sustainability of the S&T sector.
Fourth, a general lack of capital, both public and private, to carry out S&T activities was
highlighted as a problem. OECD data on GERD per capita for new EU member states which
are also OECD members show that Turkey is below average, although it is increasing.57 It
was also mentioned that incentive and support programmes lacked continuity. However,
recent data show that such continuity has improved, since for example TÜBITAK support
schemes are being offered every year.
Fifth, the fact that university R&D activities were not generating enough income and outputs
was brought to the fore. To the best of our knowledge, there is no study assessing the impact
of these activities. Finally, it was said that resources and capital were not being used
effectively. This supports the initiative formulated by the participants aiming to generalise
impact assessment studies on funded projects.
57 The average for Czech Rep., Hungary, Poland, Romania, Slovak Rep. and Slovenia is 0.85 in 2005 (0.79 for Turkey).

66
IV. 2.1.b Policy recommendations
In order to ease the access to financial resources, the participants offered the following policy
recommendations:
• Make the necessary adjustments and take the necessary precautions to protect the sector from economic instabilities
• Design regulations for risk capital
• Increase the quantity of funds allocated to R&D in the public budget
• Develop funds for university-industry cooperation
• Carry out impact assessments of nationally funded R&D projects
• Create a new unit to implement the coordination of support programmes*
• Monitor the efficient use of the resources transferred to S&T (auditing)*
All these recommendations focus on the economic dimension of SD.
We support all the agreed recommendations, as well as the creation of a new unit to improve
coordination. At the moment, several Turkish institutions offer support programmes
(TUBITAK, SPO, KOSGEB, TTGV, etc.), but no specific unit is assigned to coordinate
them. The creation of such a unit would avoid redundancies in support programmes in a
context of limited funds, as it is done in many European countries. This institution could also
be responsible for auditing how funds are spent, in order to avoid misuse and thus the waste
of public resources.
In this sense, the recommendation to carry out impact assessments of publicly funded
projects is critical. Indeed, by examining whether projects fulfil their objectives and by
analysing their contribution to the sustainable development of Turkey, such assessments
would contribute to the success of future funds. Impact assessments can for example inform
about whether the actual distribution of funds is in conformity with existing strategies. It is
essential that such impact assessments are carried out by an independent institution separate
from the funding institution.58 Finally, the conclusions of these assessments on the results of
funded projects will contribute to the transparency of the use of public funds for S&T
activities.
58 For example, in France the independent funding agency ANR (Agence Nationale de la Recherche, http://www.agence-nationale-recherche.fr) is separated from the independent agency in charge of evaluating French research and academic activities, the AERS (Agence d’Evaluation de la Recherche et de l’Enseignement Superieur, http://www.aeres-evaluation.fr).
67
IV. 2.2 Develop institutional capacities
This section explains the problems and causes related to the policy target seeking to develop
the institutional capacities of the Turkish S&T sector, and offers policy recommendations to
address these problems.
IV.2.2.1 Ineffective implementation of national S&T policies and strategies in providing and using resources
IV.2.2.1.a Problems and causes
The main cause of ineffective implementation seems to be the lack of coordination for
designing policies and strategies. This points to a lack of communication among the actors of
the system (public/public, public/private, private/private), and to the fact that S&T is not a
priority for public and private socioeconomic agents. An important consequence of these
coordination problems is that existing S&T capacities are not being used by the agents who
may need them, since for example private R&D departments are not aware of the research
being carried out in universities. As argued in Section II, this explains why research outputs
are seldom commercialised. This may also reinforce the use of foreign R&D outputs, thereby
increasing the country’s dependency. Another important cause brought forward is that both
public and private R&D infrastructures are not enough developed, except in the case of big
corporations and established academic and research institutions. Finally, there is no system
for avoiding the duplication of research activities carried out by public or private agents. This
reflects the lack of collaboration among these agents, for example within R&D networks.
IV.2.2.1.b Policy recommendations
The participants offered to solve the problems related to the ineffective implementation of
national S&T policies and strategies in providing and using resources specific to the S&T
sector by implementing the following measures:
• Identify the coordination unit and design the necessary legislation
• Secure cooperation and coordination between universities, public agencies and industries by the BTYK on resource utilization
• Define and develop sector-based S&T strategies
• Support the national R&D infrastructure
All these recommendations focus on the economic dimension of SD.

68
We support all the agreed recommendations, especially the creation of a new unit to
coordinate S&T support programmes, discussed in the previous Section IV.2.1.b. The
participants argued that in addition to its policy making responsibilities, the BTYK should
also be involved in securing cooperation and coordination. This proposal identifies the BTYK
as the new coordination unit proposed earlier.
We do not agree with this recommendation, since we think that such a unit should be
independent and that the BTYK should focus on its policy making responsibilities. When
doing so, in accordance with the participatory principles of SD, the BTYK could expand the
range of the stakeholders invited to its bi-annual meetings. For example, involving unions and
NGOs could ensure that the social and environmental dimensions of SD are integrated into
the policies proposed by the BTYK. Finally, in order to secure this integration of the two
neglected dimensions of SD into the Turkish S&T strategy, the invitation to the bi-annual
meetings could become a permanent practice.
In order to integrate the environmental dimension in the policy target aiming to ease the
access to financial resources, a key policy recommendation that we would make is to integrate
into the decision process of funding resources a specific and mandatory criterion about the
need to evaluate the risks that the project may have on health and on nature. The participants
made a policy recommendation about the need to assess the impacts of publicly funded
projects. Once a project is concluded, the institution in charge of such assessments could also
evaluate whether the risks related to health and the environment were properly assessed by the
financed organisation when it applied for the funds. To some extent, carrying out these impact
analyses would allow the sector to take into account the social dimension. For example, if
they evaluate the effects of funded projects on employment, projects’ impact assessments
contribute to shed light on whether the goals of the social dimension have been achieved by
the sector. As explained in the Section V of this report on indicators, then only the solidarity
among nations and across generations as well as social inclusion would remain to address all
the social aspects of sustainable development, as defined in the EU sustainable development
strategy.
IV.2.2.2 Lack of skilled human resources
IV.2.2.2.a Problems and causes
The main problem here is that there is no strategic planning of human resources, both
concerning S&T personnel and vocational human resources. The private sector is suffering

69
from a lack of technicians, who in Turkey are trained by vocational schools. But problems
related to the vocational educational system itself prevent the supply of such technical
personnel. Besides, the system evaluating human resources is not efficient enough. Another
cause mentioned for this problem is the low number of R&D personnel and researchers, and
that the educational system does not provide enough education on R&D-based topics,
especially for researchers who are going to work for the private sector. Finally, brain drain
was said to be very problematic for Turkey.
IV.2.2.2.b Policy recommendations
The participants offered to make up for the lack of skilled human resources in the S&T sector
by implementing the following measures:
• Jointly determine the planning of education and human resources • Develop an action plan and a strategy to reverse brain drain • Enable coordination in relevant areas to provide skilled intermediate staff in the
S&T sector • Define qualitative and quantitative needs of the human resources of the S&T
sector • Organise awareness-raising activities on SD for human resources in the S&T
sector
All these recommendations focus on the economic dimension of SD. Some emphasis was
given to SD in terms of awareness-raising activities.
We support all the agreed recommendations. We strongly underline the need for a human
resources and education planning. Unfortunately, education policy in Turkey is weakly
designed and a lack of demand and supply analysis is a reality in Turkish labor markets.
Active labor market policies seem to be a viable alternative for Turkey.
Active labor market policies can be analyzed under two general headings, namely demand-
side and supply-side policies. In this study, instead of all policies offered in the literature, we
will concentrate on those that may be applicable specifically to the Turkish case. It is possible
to divide demand-side policies into three categories, namely indirect active labor market
policies; subsidies provided to the private sector; and legal arrangements towards regulating
labor demand. The policy tool for the first group comprises job opportunities created by the
public sector. In this context, short-term training of unskilled and semi-skilled long-term
unemployed labor and employment of these in public sector infrastructure investments can be
aimed. Thus, the workers who have relatively less chance to find a job in the private sector are
provided some skills and they may have a higher probability of finding a job even if the

70
employment offered by the public sector is temporary. The second group of demand-side
policy tools includes incentives encouraging employment, tax exemptions toward on-the-job-
training, promoting investments in regions where the unemployment is high and use of local
labor. Finally, in the legal context, the legislation that organizes part-time and flexible work
practices seems to be essential. Moreover, this legislation should also include policy tools
directed towards the regulation of human resources planning both in the private and public
sectors.
The supply-side policies can be divided as policies for improving labor quality and policies
for decreasing labor supply. The policy tools for improving labor quality should target the
adjustment of labor force to the changing labor market conditions through various training
programs. The most significant of these policy tools is the promotion of on-the-job-training.
Neo-liberal policies, started being implemented in the second half of the 1970s, aimed the
working of all markets in conformity with the liberal economy conditions. In this process,
policy tools for the regulation of labour markets were given up, and labor market institutions
became gradually inefficient. In the 1990s, a rapid globalization and international capital
movements demanded new labour skills. However, this structural mismatch induced a process
of steady increase in unemployment. Disorganised trade unions and inefficient legislations
directed firms, the most active agents on labour markets, to adopt on-the-job training
programmes. To the best of our knowledge, a detailed analysis of these programmes for
Turkish labor markets has not been carried out. Therefore, in this framework, the state should
indirectly regulate labour markets by introducing tax exemptions for firms having regular on-
the-job-training programmes, incentives for the training activities of the trade unions, and
programs for public sector employees. The establishment of an administrative structure that
organises vocational training especially at the regional level is necessary. Such an institution
having well-defined responsibilities and sufficient funds should be organised as a result of a
detailed analysis of resources and needs, and could include training on environmental and
health assessments. Moreover, these vocational training opportunities should be accessible to
a large number of people. This institution may also create lifelong learning programmes.59 In
addition to these measures, disadvantaged groups having high probability of being
unemployed should be encouraged to participate in such programs. Such mitigation measures
may have direct impacts on the duration of unemployment. On the other hand, policy tools
aiming to decrease labor supply by the direct intervention of the state may contain measures
59 A participatory strategy to create a European area of lifelong learning can be seen at http://ec.europa.eu/education/policies/lll/life/index_en.html.

71
such as decreasing retirement age60, increasing the duration of compulsory education,
discouraging over time work, and preventing the migration from rural to urban areas through
increased investment in rural areas (such as incentives for organic agriculture, ecotourism,
etc.). However, these policy tools are politically more difficult to implement because of the
possible resistance of some social groups as compared to policy tools aiming to improve
labour quality.
Another issue we would like to raise is that the educational system does not provide enough
education in R&D-based topics, especially for researchers who are going to work for the
private sector. The S&T component can easily be integrated into those policies, together with
an analysis of human resources needs of the S&T sector. In the determination of these
policies, the links between the Ministry of National Education (MEB) and the Higher
Education Institution (YÖK) should be strengthened, together with the participation of NGOs
and unions.
Reversing brain drain is also a significant policy tool in this sense. According to Güngör
(2004), economic instability in Turkey is found to be an important factor contributing to brain
drain, while work experience in Turkey also increases non-return. Higher salaries offered in
the host country, lifestyle preferences, and a more organised and ordered environment
increase the probability of not returning (Güngör, 2004).
In order to better integrate the environmental dimension into the development of Turkish S&T
human resources, the latter should be given training so that they are able to evaluate the
ethical implications of their activities as well as their impacts on society and nature. For
example, firms carrying out research on biometry to improve the techniques used to identify
individuals can have serious implications on people’s private lives. In another area,
researchers experimenting genetically modified organisms (GMOs) should also be obliged to
evaluate the risks of their activities, since non-GMO fields can be contaminated as a result of
their activities.
Risk assessment (RA) is a complex activity that should only be carried out by people who
have been trained for it. Given that RA is not a widespread practice in Turkey, there is a
considerable amount of training to be carried out, especially since many European directives,
which are part of the acquis, demand such an assessment. This is for example the case of the
Regulation (EC) No 1907/2006 of the European Parliament and of the Council of
60 Such measures are offered for German and UK labor markets (Roberts, et al., 2006; Mattil, 2006) and Sweden (Vogel, 2002), Canada, Chile, Czech Republic, Denmark, Germany, Poland and Tunisia (Olsen, et al., 2006).

72
18 December 2006 concerning the Registration, Evaluation, Authorisation and Restriction of
Chemicals (REACH), which contains no less than 849 pages…61 Consequently, we strongly
support the creation of a resource institution that could provide such a training as well as
other kinds of expertise. This organisation could serve all Turkish socioeconomic sectors and
target other sustainable development areas, such as best available technologies and material
flow analyses.
Finally, in the light of the aforementioned lack of R&D education to future researchers, we
would like to add that in order to attract the best students in the S&T sector, the activities of
TUBITAK’s Science in society department should be reinforced.62 Access to best practices in
other countries could be developed by reinforcing the participation of the aforementioned
department to international initiatives.63
IV.2.2.3 Incomplete and insufficient data and inventory
IV.2.2.3.a Problems and causes
The main cause for this problem is the lack of statistical data on technology in Turkey. For
example, the OECD indicator measuring the technology balance of payments is missing. It
was also mentioned that Turkey should improve its Technology inventory database, which
includes both R&D human resources (ARBIS) and R&D infrastructures (TARABIS), and
increase awareness about the existing inventory. Finally, the participants thought that there
was a lack of information on the evolution of markets in order to direct R&D activities.
IV.2.2.3.b Policy recommendations
The participants offered to solve the problems of data incompleteness and insufficiencies with
the following measures:
• Update, activate and widely spread the use of TARABİS (Turkish Research Infrastructure Information System)
• Improve the Administrative Entry System’s capacity and quality so that it can provide inputs to S&T indicators studies
61 See http://eur-lex.europa.eu/LexUriServ/site/en/oj/2006/l_396/l_39620061230en00010849.pdf. 62 See http://www.tubitak.gov.tr/home.do;jsessionid=560FF2E59C4114B4A2B1AD7AE1096959?ot=1&sid=563&pid=547. 63 For example, the initiative « La main à la pâte » was launched in 1996 by the Nobel prize winner Georges Charpak and the French Academy of Sciences. It is an open network using the knowledge of its members to provide free expertise to schools to popularize science, for example by diffusing books, CDs, or toolboxes allowing children to reproduce simple scientific experiments. Many countries have imitated this initiative such as Argentina, Brazil, China, Egypt, Morocco, and Tunisia. See http://www.inrp.fr/lamap/. See also the annual http://www.fetedelascience.fr, through which 5000 projects promoted science in France in 2006.

73
• Identify missing data, indicators, and methodological studies about how to develop regular data collection and to secure the transfer of these data and related indicators into international databases
• Introduce existing data to relevant actors (who collected it and how)
• Develop a system to analyse and monitor risks for SD
• Process, monitor and control the developed database to provide information for the sector (market, R&D priorities, inventory, etc…) *
• Develop a database comprising statistical data on the S&T sector, on existing technology inventory statistics, and on SD indicators in order to support technological activities *
With these policy recommendations aiming to solve data availability problems in Turkey, the
participants have made a remarkable effort to integrate the three dimensions of sustainable
development. We support all recommendations, especially the one for which no consensus
could be reached about the need to develop a database that would include sustainable
development indicators. Although the construction of a national database on ST that integrates
SD dimensions has caused a disagreement between the participants during the workshop, we
think that such a database is a must for integrating sustainable development into the S&T
sector. EUROSTAT provides extensive sustainable development indicators. However, for
almost all of the indicators, Turkish data are missing. The availability of data in international
databases would improve the scores of Turkey in international indices, such as the European
Innovation Scoreboard, and increase the number of studies on the sector that feed the policy
making process. Apart from international data sources, there seems to be a need to build a
national database for researchers and policy makers. This requires a participatory study to
achieve a comprehensive data collection adapted to the S&T sector and to broader societal
needs. Under the supervision of TÜİK, agents of the sector should identify key data for the
sector in the context of SD, in addition to the proposals that will be made in the final section
of this report. Moreover, public awareness on the data collected by TÜBİTAK, especially for
TARABİS, should be increased.
We also strongly support the suggestion to develop a system to analyse and monitor risks.
For a start, this could take the form of a working group involving all stakeholders (TUIK,
MoEF, NGOs, unions …). This group would contribute to build a system able to provide data
on ex ante and ex post assessment of health and environmental assessment of risks. The ex
post risk assessment could be integrated into the work of an institution in charge of assessing
the impacts of research projects, whose creation was suggested in Section IV.2.1.b. Finally,
the chapter 18 on statistics of the European integration screening process will make use of any

74
progress in the direction of building a strong sustainable development statistical dataset in
Turkey, since some work has already started in this direction.64 There are no indicators on
sustainable development integration yet and no plan to do so in the future, neither in the
health and safety heading,65 in the sustainable development heading,66 in the environment
statistics heading,67 nor in the science heading.68 As argued in the Section V of this report on
indicators, both Eurostat and the European Environment Agency have started developing
indicators on sustainable development integration. Collaboration between Turkish institutions
and the latter would benefit to both sides.
Concerning indicators relating to economic goals, according to OECD Main Science and
Technology Indicators (2007-1), the following data do not exist for Turkey:
1. Estimated civil GERD 2. Basic research expenditures 3. Total Government budget appropriations or outlays for R&D (GBAORD) 4. Defense budget R&D as a percentage of GBAORD 5. Civil budget R&D GBAORD 6. Civil GBAORD for economic development programmes 7. Civil GBAORD for health and environment programmes 8. Civil GBAORD for space programmes 9. Non-oriented research programmes 10. Civil GBAORD for general university funds 11. Technology balance of payments: Receipt and Payments
As noted in Section II, OECD Main Science and Technology Indicators are the most widely
used indicators in the sector for cross-country comparisons. Therefore, there is an urgent need
to complete the data available in this database.
IV. 3 S&T activities
This section deals with the extent to which S&T activities integrate SD dimensions.
Workshop participants suggested two main overarching policy targets: Create new inter-
institutional coordination structures and strengthen existing ones, and improve
competitiveness.
64 See http://www.abgs.gov.tr/tarama/screening_files/18/18AT_Annotated.htm. 65 See http://www.abgs.gov.tr/tarama/screening_files/18/SC18DET_12.01_Health%20and%20Safety.pdf. 66 See http://www.abgs.gov.tr/tarama/screening_files/18/SC18DET_12.02_Sustainable%20Development%20Ind.pdf. 67 See http://www.abgs.gov.tr/tarama/screening_files/18/SC18DET_12.05_Environment.pdf. 68 See http://www.abgs.gov.tr/tarama/screening_files/18/SC18DET_13.02_Science.pdf.

75
IV.3.1 Create inter-institutional coordination structures and strengthen existing ones This policy target responds to a problem of ineffective implementation of S&T policies and
strategies identified by the participants.
IV.3.1.a Problems and causes
Four underlying causes were identified to explain this problem. They relate to strategies,
activities, evaluation, and social and environmental.
The main cause behind this problem relates to the lack of complementarity among existing
strategies. For instance, in the Turkish information society strategy, R&D was well enough
integrated. Although Vision 2023 did determine S&T priorities for Turkey, it was felt that
these priorities were still not well identified. Regarding industrial production strategies, they
were found not to be directed towards high-technologies. It was also found that a sectoral
approach was missing when elaborating national S&T strategies, and that the strategy of S&T
stakeholders was too much focused on short-run initiatives.
The second important set of causes is associated with the way S&T activities are evaluated
in the country. There is no evaluation of international and national S&T resources regarding
their contribution to sustainable development. Another cause is the lack of standards about
how to carry out S&T activities, for example in order to assess the risks of these activities on
the environment and on health. The participants also mentioned the difficulties of Turkish
firms in meeting European and other international standards.
Concerning how S&T activities were carried out, the first cause identified behind this
problem is the lack of coordination and cooperation among S&T stakeholders. Second, they
underlined that these actors had difficulties in integrating the three SD dimensions into
their activities. This cause was also brought forward concerning the public procurement law,
which fails to achieve a balance between the three dimensions of SD. Besides, Turkish
technologies are not always designed to meet national needs, for example when they are
imitated or not corresponding to national needs. Participants also argued that there was a
mismatch between the design of policies and their implementation. Finally, they highlighted a
lack of government commitment to integrate SD dimensions into S&T policies.
As regards social causes, public and private decision making processes do not integrate any
social criterion when allocating resources. Concerning environmental causes, S&T activities
do not contribute enough to the sustainable management of natural resources, and
environmental concerns are usually ignored by industrial districts.

76
IV.3.1.b Policy recommendations
The participants responded to the need to improve the implementation of national S&T
strategies and policies by offering the creation of inter-institutional coordination structures
and the strengthening of existing ones. They suggested the following measures:
• Improve the coordination of policies and actions by organisational and legislative means
• Activate and impose BTYK’s decisions in agreement with the national S&T sector and with all its components, by easing necessary cooperation, coordination and partnership
• Articulate S&T activities in natural resource management and environmental management policies with SD principles
• Harmonise public procurement legislation with S&T-SD criteria
• Harmonise government support legislations with S&T-SD criteria
• Integrate SD criteria into annual programmes and development plans
• Determine which criteria should be used to develop technologies and products in conformity with national needs and priorities
• Integrate the SD strategy in public administration reform actions
This is one of the parts of the workshop where emphasis on SD is highly cited. Together with
the economic dimension, the environmental dimension of SD is also highlighted, although the
social dimension is still missing.
We support all the agreed recommendations.
Articulating S&T activities in natural resource management and environmental management
policies with SD principles requires that the institution in charge of coordinating S&T
support programmes takes up this challenge. This reinforces our support to the
recommendation made in Section IV.2.1.b about the need to create a new coordination unit,
although the group did not have time to reach consensus on this proposal. Harmonising
public procurement legislation with S&T-SD criteria would have a tremendous impact on
the sustainability of the sector, since it would require the ex ante integration of a key set of
sustainable development criteria into procurement procedures.
An even more essential recommendation, perhaps the most significant of all the ones
mentioned during the workshop, offers to harmonise government support legislations with
S&T-SD criteria. To ensure its success, this key initiative could be carried out progressively,
starting with a limited set of criteria defined in consultation with all stakeholders. If these
legislation are to meet European standards, the harmonisation process should include

77
mandatory ex ante and ex post ethical, health and environmental risk assessments for all
project applications or actually funded projects. Concerning the integration of SD criteria
into annual programmes and development plans, it would reinforce the work started by
SPO in its 8th development plan (2001-2005). Indeed, the latter mentions the need to integrate
sustainable development into other policies, to adopt a participatory approach, to assess risks,
to develop environmental technologies, and to carry out systematic EIAs (environmental
impact assessments). Finally, the proposal to integrate the SD strategy in public
administration reform actions would ensure that sustainable development conflicts are
anticipated. A set of sustainable development integration indicators could be used to monitor
this integration.
Finally, the public administration reform might solve many problems of coordination and
participatory decision making. As in the case of inputs, coordination also seemed to be a
major problem for S&T activities. Moreover, consensus-building for the implementation
appeared to be another problem area. The solution to this problem might be the extension of
participatory decision making, even including NGOs. Combined with legislative measures, to
develop such an approach can only be realised in the medium run. We believe that this issue
is an integral part of the concerns raised earlier on the issue of public administration reform
during thematic work group meetings at the early stages of the project. However, as we have
partially achieved in this report, drawing a complete map of the relations between existing
actors in the sector is required. This would help figuring out the necessary steps for the sector
during the preparation of the public administration reform. With its 8th development plan,
SPO has identified SD as a policy target and has supported the need to integrate SD into other
policies. Thus, the main question relates to the implementation of this principle in various
public actions, including in public tenders, in government incentives, etc. Nevertheless, there
seems to be a lack of awareness of public agencies about SD. This was even observed during
the workshops, durin which the participants had difficulties in considering all the dimensions
of SD. This might explain the overemphasis on the economic dimension of SD during the
workshop. The solution might be to identify a coordinating and a main policy-making
unit. The paramount candidate for this unit is SPO. The SD unit in SPO may undertake the
necessary actions both to raise awareness and to enrich various public policies with SD
criteria. However, it should be kept in mind that the role of NGOs in SD actions should not be
ignored. This unit may also act as an intermediary institution between public agencies, the
private sector, unions, and NGOs. In conclusion, the steps for public administration reform

78
and a new organisational setup towards SD could cope with the problems related to the
ineffective implementation of ST policies and strategies in the context of SD.
IV.3.2 Increase competitiveness
This policy target responds to the lack of strategic decision making and production processes
of enterprises.
IV.3.2.a Problems and causes
The main problem here concerns the lack of strategic decision making in the private sector
and difficulties in the production processes of enterprises.
The first cause of this problem is the lack of firms’ awareness about the importance of
combining competition with collaboration, for example in the design phase of product
development. Besides, firms are not enough involved in the international production pipeline,
such as joint production projects. Therefore, they do not benefit from the positive externalities
deriving from such interactions. This may relate to another cause mentioned by the
participants, which is the low level of awareness about the importance of S&T for improving
competitiveness.
Second, the group thought that organising production activities in terms of projects, which
requires a lot of team work, was not a widespread practice, although no strong empirical
evidence supports this claim. In addition to this, there is no system engineering vision in most
Turkish firms. The fact that the latter are not open to organisational innovations corroborates
this argument. The weaknesses of the private sector in technology development and
production are associated with a lack of know-how and know-why. They are also related with
problems in managing technology transfers, and with the absence of R&D departments and
corresponding personnel in most firms.
Finally, a last cause relates to total quality management (TQM) and to environmental
management. Too many firms were found to have a low level of awareness about
environment-friendly production. Concerning TQM, we do not agree with the fact that it is an
important source of concern, since the situation has significantly improved in the past few
years.

79
IV.3.2.b Policy recommendations
The participants offered to solve the problems of competitiveness of S&T activities by developing the strategic decision-making and production processes of enterprises. They
suggested the following measures:
• Spread the incubation system to support entrepreneurship in Turkey
• Spread the use of ICTs to improve Decision Support Systems in the initiatives
• Support enterprises/ entrepreneurs on how to use environmental technologies and on how to develop products
• Design and carry out methodological trainings on R&D Management
• Site visits of enterprises *
• Support entrepreneurship activities on know-how, design etc… *
All these recommendations mainly focus on the economic dimension of SD, but we welcome
the suggestion to support enterprises and entrepreneurs on how to use environmental
technologies and on how to develop products. Environmental technologies are an important
tool for implementing sustainable development strategies in European countries, including in
new member states.
We support all the agreed recommendations. Incubator firms exist in some selected zones in
Turkey, yet as participants noted they are not enough in terms of both quality and quantity.
We argue that one of the most important tools in this framework is to support thematic high
technology zones and to integrate incubators to these zones with further incentives. Thus, the
advantages connected to the geographical proximity and theme can be exploited in these
zones. Such entrepreneurial activities should also be supported with the development of risk
capital initiatives discussed previously.
The recommendation on decision support systems is closely related with the lack of human
resources and capital. The decision support systems may ease the organisation of production.
These systems are costly to introduce, especially for SMEs. Therefore, without following the
recommendations made by the participants in the S&T Inputs section, it would not be realistic
to offer such a tool in the short run.
In the early stages of competition, enterprises tend to ignore environmental friendly
technologies because of cost concerns, lack of knowledge about best available technologies or
about or about market opportunities for green products. In order to establish a base for
competition, the use of environmental-friendly technologies may be supported by various
mechanisms such as tax exemptions both for sales and imports for such technologies. The

80
regulating institution, Ministry of Environment and Forestry, may determine such
technologies and targets. However, this support cannot be long-lasting because of limited
public resources. After reaching specific targets, these supports might be gradually removed.
Finally, concerning R&D management training, it is an indispensable element of competition
in global markets. Nonetheless, it is an element of a broadly-defined business strategy.
Turkish firms, especially because of macroeconomic instability in previous periods, were not
able to develop business strategies. Therefore, training on R&D management as proposed in
the workshop needs a broader vision.
The consensus on the site visits was not established during the workshop, not because it is not
important but because of a lack of resources for such visits. Instead of visits, chambers of
commerce and industry may be pushed to organize workshops on ST-SD related areas. This
necessitates permanent efforts that may be carried out by the unit in SPO offered in the
previous section.
We think that design is an important topic for most of the areas of industrial production. Thus,
establishing new centres and strengthening the existing ones is a viable policy tool for
increasing competitiveness.
At the European level, a joint initiative between the European Commission’s Directorate
General (DG) for Research and its DG Environment, the EU Environmental Technologies
Action Plan (ETAP)69 covers a spectrum of actions to promote eco-innovation and the take-
up of environmental technologies or eco-innovations for a sustainable future. It was created
though the following participatory process:
• 2001: Work began on the Plan.
• 2002: Report produced by the European Commission outlining the environmental technologies market, including some of the barriers to their development.
• 2003: Communication deepening the discussions on the content of the Action Plan by setting out a number of measures and questions as a basis for discussions (Stakeholders were invited to respond to this document).
• 2003: Commission sets up four stakeholder groups to look at the potential of environmental technologies for four particular issues. These have produced reports which have provided input for Action.
• 2004: European Commission adopts ETAP in January and European Council in March.
• 2006: European Forum on Eco-Innovation (brings together decision makers and actors from finance, technology development, business, policy development, academia and NGOs to discuss strategic orientations for eco-innovation and
69 See http://ec.europa.eu/environment/etap/index_en.htm.

81
environmental technologies).70 Its recommendations are used by policy makers.
ETAP acts as a catalyst in the European socioeconomic area by diffusing funding
opportunities, policy initiatives,71 as well as technology best practices for various sectors that
most need eco-innovations.72 In the light of the Lisbon strategy seeking to foster growth, jobs
and the environment, its priority actions are to:
• Promote research and development,
• Mobilise funds,
• Help to drive demand and improve market conditions.
Since its inception, ETAP has supported many activities to diffuse eco-innovations. To foster
experience sharing on eco-innovations and on best practices, the Member States were invited
to formalise their national transposition of strategies and action plans towards environmental
technologies. In some countries like Germany, Sweden, Netherlands, Spain, UK, the ministry
of the environment was in charge of this transposition, in others like in France it was the
environment agency. Finally, the EU has created specific research centres to work on eco-
innovation and cleaner production, which are part of the EU Joint Research Centre (JRC).73
Among the JRC’s Institutes working on cleaner production are the Institute for Environment
and Sustainability (IES),74 the Institute for Energy (IE),75 and the Institute for Prospective and
Technological Studies (IPTS).76 The EU also relies on the expertise of member states, which
have their own research resources. In several new member states, expertise on cleaner
production has been fostered by the creation of cleaner production centres.77
70 See http://ec.europa.eu/environment/etap/forum_en.htm. 71 See Showcase of EU and National Activities at http://ec.europa.eu/environment/etap/showcase_en.htm. 72 See http://ec.europa.eu/environment/etap/technologies_en.htm. 73 See http://ec.europa.eu/dgs/jrc/index.cfm. 74 See http://ies.jrc.ec.europa.eu. 75 See http://www.jrc.nl. 76 See http://ipts.jrc.ec.europa.eu. 77 See “A Programmatic Review of UNIDO/UNEP National Cleaner Production Centres”, Journal of Cleaner Production, Vol. 12, Issue 3, April 2004, pp. 195-205 ; and “Institutional Capacity Building for Pollution Prevention Centres in Central and Eastern Europe with Special Reference to Lithuania”, Journal of Cleaner Production, Volume 12, Issue 3, April 2004, pp. 207-214.

82
IV.4 Outputs
This section deals with the extent to which the outputs of S&T activities integrate SD
dimensions. Workshop participants suggested two main policy overarching policy targets:
Improve competitiveness, and increase support to basic research.
IV.4.1 Increase competitiveness
Two main problems justified this policy target. They are problems specific to the S&T sector,
and to problems related to the competitiveness of S&T outputs.
IV.4.1.1 Problems specific to the S&T sector
IV.4.1.1.a Problems and causes
The first cause associated with this problem relates to the way R&D activities are carried
out. The reason why the S&T sector does not integrate enough economic goals in its output
phase is that there is not enough R&D involved in the production activities of Turkish firms.
And when R&D activities are carried out, they are not managed properly and do not make
enough use of EU research programmes. Moreover, their capacity to commercialise R&D
goods and services is limited. The last two causes are related to a third one about the lack of
technology assessment or auditing mentioned earlier, which tends to cause inefficiencies in
the spending of limited R&D funds.
The second cause concerns information and coordination. The participants argued that there
is no mechanism for sharing information about R&D outputs. This was perceived as a cause
of the problem since limited resources are used to produce the same goods. Indeed, Turkish
firms compete against each other all through the product life cycle, whereas they could benefit
from collaborating during the design phase.
Concerning the evaluation of S&T outputs, the main concern of the group was to assess the
impact of supported R&D projects. This is important in the context of limited public funds. In
Turkey, beneficiaries must prove beforehand that they cannot carry out the research without
these funds. The fact that the firm could indeed not have carried out the research without
public funds should also be verified afterwards during the impact assessment procedure,
proposed earlier by the participants. Finally, inefficiencies in accreditation and standardisation
mechanisms were underlined.
Environmental and ethical concerns were also raised by the participants. Concerning the
international energy efficiency classification, there is not enough information available in
Turkey about how to produce energy efficient appliances. Besides, existing environment-

83
friendly goods and services are not well enough publicised and identified by customers.78 A
resulting cause mentioned by the participants is that too few environmental friendly products
and technologies were manufactured in Turkey. Finally, they thought that ethical rules were
not well established within the sector.
IV.4.1.1.b Policy recommendations
The participants offered to solve the problems specific to the S&T sector by improving R&D
processes. They suggested the following measures:
• Examine and support the R&D support system
• Adapt technology transfer offices to the Turkish context and empower them
• Improve the National R&D Information Management Network
• Prepare sector-based strategies in production and consumption chains based on S&T
• Improve the legislations on ethical rules
• Ensure the conformity of R&D products and services with SD criteria
• Educate skilled staff for R&D process management*
When formulating these policy recommendations, the participants have sought to integrate the
three dimensions of sustainable development by bringing in ethical issues and other
sustainable development criteria.
We agree with all recommendations, including with the last one for which no consensus could
be reached. As noted before, the examination of the support system is viable for the continuity
of existing support schemes as well as to create new ones. Technology transfer is a term used
to describe a formal transfer of rights to use and commercialize new discoveries and
innovations resulting from scientific research to another party. The major steps in this process
include the disclosure of innovations, patenting the innovation concurrent with publication of
scientific research, and licensing the rights to innovations to industry for commercial
development. In this sense, technology transfer offices located within universities and
industrial zones are very important. These offices may also be organized on a regional basis.
The preparation of sector-based strategies coincides with the findings of Vision 2023, which
suggested focusing on key sectors to boost Turkish S&T activities and economic growth.
Improving Turkish regulations on ethical rules is an important recommendation for the S&T
78 We think that this may notably be the case with the European energy efficiency labels. See http://ec.europa.eu/energy/demand/legislation/domestic_en.htm.
84
sector, because its activities are prone to raising ethical concerns. In its section III.5, this
report has presented existing international initiatives such as the adoption of a code of conduct
(which would obtain the commitment of private actors), the creation of an independent
advisory council, or the inclusion of an ethical clause in project calls issued by Turkish S&T
funding bodies. For example, the call for Socio-Economic Sciences and the Humanities (FP7-
SSH-2007-1)79 mentions in its Guide for Applicants for Collaborative projects the following
ethical principles:
“Please remember that research activities in FP7 should respect fundamental ethical principles, including those reflected in the Charter of Fundamental Rights of the European Union. These principles include the need to ensure the freedom of research and the need to protect the physical and moral integrity of individuals and the welfare of animals. For this reason, the European Commission carries out an ethical review of proposals when appropriate.”
This would contribute to the last policy recommendation on ensuring the conformity of R&D
products and services with SD criteria. This recommendation aims to respond to a problem
specific to the S&T sector, which is due to the cause highlighted by the participants about the
lack of coherence between existing S&T systems and SD integration strategies (see table in
Appendix). Finally, we wish to highlight the role of participatory processes in formulating
S&T strategies. As an example of how to adopt a participatory approach in the S&T sector,
the Foundation for Citizen Sciences has organised a forum where information on community
based research on new forms of partnerships between research and civil society and on new
modes of innovation can be shared and developed.80
IV.4.1.2 Problems associated with the competitiveness of S&T outputs
IV.4.1.2.a Problems and causes
The first cause undermining the competitiveness of S&T products and services relates to
market access. SMEs cannot access national and international markets, and many are facing
harsh price competition from imitated and unregistered products. Participants stressed that the
level of exports of R&D-intensive products was too low, and that R&D activities were not
long-lasting. This might be related to another cause mentioned by the participants, which is
that producers are not aware of the competitive advantages that can be gained by innovative
79 See http://cordis.europa.eu/fp7/dc/index.cfm?fuseaction=UserSite.CooperationDetailsCallPage&call_id=39. 80 See http://sciencescitoyennes.org/rubrique.php3?id_rubrique=115 (in French).
85
products. Finally, they pointed out the difficulty to commercialise R&D outputs that meet the
goals of the three SD dimensions.
The second cause relates to intellectual property rights (IPR). IPRs are not used efficiently by
firms, mainly because of a lack of information about them. Also, not enough resources are
allocated to promote the use of IPRs and to make sure that they are respected.
IV.4.1.2.b Policy recommendations
The participants offered to solve the problems associated with the competitiveness of S&T
outputs by improving R&D processes. They suggested the following measures:
• Improve the legislation on strengthen the quality and quantity of R&D human resources in the private sector
• Design and organise trainings on intellectual property system, accreditation, standardisation, and disseminate them
• Convert the existing investment agency into an agency dealing with investment and commerce
• Encourage the production and export of high value-added products and technologies
• Improve infrastructures (physical ones) of universities and research centres to meet Turkish specific needs
• Increase the number and the efficiency of technology development zones –TZA (technoparks), and develop thematic TZAs
• Develop Eco-Industrial regions
• Reward the examples of successful integration of SD dimensions into the S&T sector
• Organise a Sustainable Development Week
• Make environmental management systems (EMAS) mandatory in the S&T sector
The policy recommendations made by the participants do not address the social dimension of
sustainable development.
We agree with all the recommendations made by the participants, with a reserve concerning
the last one on mandatory EMAS.
The first two suggest improving the training of human resources. We would like to add that
such training is essential since it allows through continuous education to update the
knowledge of S&T personnel. However, it is important that such training can bring an added
value to the CV of the trainees. Besides, this training should include environmental and social
aspects, such as environmental standards and risk assessments. We suggest reinforcing the

86
Turkish system of life long-learning, which has for example had a great success with
Eskisehir’s Open University. In addition, should be officially acknowledged, so that workers
can valorise the knowledge acquired after their school years. In new EU member states,
Cleaner Production Centres provide environmental training.
Converting the existing investment agency into an agency dealing with investment and
commerce could allow a better distribution of S&T funding and direct it towards market
opportunities. We would like to point out that there is a risk to accumulate responsibilities for
a single agency, since adding tasks to its usual load could lead to neglect its original mission.
However, an agency to promote high-value products could increase the diffusion of S&T
outputs, together with the design of new products in real time adequacy with market needs.
Such information could be provided by the fifth recommendation seeking to improve
infrastructures that would allow S&T actors to meet Turkish needs. As for technoparks,
one should bear in mind that such structures can hardly be created ex nihilo, and that there is a
risk that they end up being empty shells in which firms just go to benefit from financial
advantages without collaborating with each other. Along these lines, it is essential that
existing zones are evaluated, for example by the suggested institution in charge of impact
assessment. Such an assessment should include an environmental assessment of the activities
of the park. If it is done well, it could lead to the emergence of eco-industrial regions, as
suggested by the participants, in which for example waste management is handled
collectively, allowing the wastes of some firms to be used as an input by others.
The offer to reward the successful integration of SD dimensions is a good one, but to do so
a set of relevant indicators needs to be developed. A SD week could contribute to raise
awareness, including in the S&T sector. It is has been carried out successfully in France since
2003, and NGOs have been closely associated to it.81 The organisation of such an event could
also be entrusted to a pool of Turkish NGOs so that they can contribute to the SD of the
sector. This event could also contribute to raise the awareness of S&T firms about corporate
social responsibility and environmental issues, a suggestion which has been made by the
participants during the workshop but that could not be included in the table. The
participation of all stakeholders to the design of S&T policies would contribute to raise
awareness about the problems of the sector in relation to sustainable development. This low
awareness was mentioned as a problem by the participants during the workshop but could not
be included in the table. This participatory process also eases the implementation of the
81 See http://www.semainedudeveloppementdurable.gouv.fr (in French).

87
recommendations by the stakeholders, who will be more efficient and willing to collaborate if
they are knowledgeable about sustainable development integration and if they participated to
the design of the actions they are asked to implement.
Finally, we do not think that making EMAS mandatory is a realistic objective. Rather, there
should be support mechanisms and incentives to foster their adoption by firms, among other
policy tools. In France for example, chambers of commerce are resources centres for firms
willing to adopt EMAS and other measures to improve their environmental performance.
Therefore, TOBB could be involved in promoting the development of EMAS and other
environmental policy tools across Turkish firms. For other types of organisations, a Cleaner
Production Centre could target administrations, academic institutions, municipalities, etc.82 It
could also promote the market visibility of S&T cleaner outputs by promoting the use of
ecolabels.
IV.4.2 Increase support to basic research
IV.4.2.a Problems and causes
The problem that justifies this policy target relates to difficulties experienced by basic
research outputs.
The first underlying cause to this problem is the lack of research infrastructure in
universities and research institutions. Second, it was argued that existing human resources
were not used efficiently and were not enough supported. Third, scientific publications were
thought not to receive enough support, and not to be used enough by industry. Finally, a low
participation of researchers to international research networks was highlighted.
IV.4.2.b Policy recommendations
The participants offered to increase the support to basic research by implementing the
following measures:
• Design and implement an impact assessment system targeting national and institutional programmes
• Improve the legislation responsible for strengthening the quality and quantity of R&D human resources in universities
• Develop cooperation opportunities between existing infrastructures of the Higher Education Sector and infrastructures of international and EU organisations
• Increase university resources to enhance basic scientific research
• Enable coordination for the applicability of basic scientific research 82 About the EMAS, see http://ec.europa.eu/environment/emas/index_en.htm.

88
• Support basic research for sustainable development
Once again the social dimension is missing in the policy recommendations made by the
participants.
We have reservations about the last two suggestions, since sustainable development solutions
demand support from applied research. Indeed, by definition the activities of basic research
are not determined by any societal need, even if its outputs may in time be used by society.
But this cannot be known in advance; otherwise we are then dealing with applied research and
not with basic research.
As argued earlier, impact assessment systems are very important to make sure that S&T
funding does serve the goals of the three dimensions of sustainable development. To do so,
sustainable development integration indicators are a must. The third suggestion is an
important one since it is unfortunate that Turkey does not contribute enough to the European
Research Area83 and to the programmes of S&T international organisations such as the
European Science Foundation,84 especially in the context of limited S&T budgets. Such
initiatives also support basic research. But since the outcomes of the latter are not commanded
by real world needs, government funding is the only durable source of funding for basic
research. We thus strongly support the recommendation made to increase university basic
research in all disciplines.
Conclusion
It has been difficult in a two days workshop to work on the integration of the three dimensions
of sustainable development into S&T activities. We have tried to reach a balance between
these dimensions, but the resulting policy recommendations clearly focus on economic issues.
We have argued that this is an interesting finding in itself, but further efforts should be made
to better integrate the social and environmental dimensions of sustainable development into
the S&T sector. Two problems are associated with this lack of integration. At first there is a
lack of knowledge about the social and environmental dimensions themselves. Therefore,
substantive training programmes should be offered to the actors of the S&T sector. We have
argued that the creation of Cleaner Production Centre could take up this challenge, as it has
been done in several new EU member states. These centres were sometimes publicly funded
or co-funded by industry, sometimes located within universities or technoparks, or
83 See http://ec.europa.eu/research/era/index_en.html. 84 See http://www.esf.org/.

89
subcontracted to private consultancy firms. But whichever the structure and funding
mechanisms, in every country they were adapted to the national context and needs to
maximise the efficiency of the contribution of such a centre to the sustainable development of
the country. Second, although more and more S&T actors are concerned with sustainable
development, they lack data to develop effective strategies, in both the public and private
sector. This is why the last, but not least, section of this report addresses the issue of the
indicators that can be used to evaluate and monitor progress towards the integration of
sustainable development into the S&T sector. The lack of integration of the social and
environmental dimensions of sustainable development into the S&T sector could be made up
by developing indicators allowing to clearly evaluate this shortcoming and to propose ways to
overcome it. Together with other shortcomings in the sector, the most important one seems to
be an organizational problem. The links between existing institutions are loosely defined and
the latter need restructuring. As offered in this report, a restructuring effort would solve most
of the problems in the sector. This reorganisation also includes restructuring of both domestic
and international relations, in such a way that it integrates all the dimensions of sustainable
development.

90
References Akkerman, 2006 Vizyon 2023: Technology Foresight for Turkey, Unpublished M.Sc. Thesis,
Ankara: METU.
Atmaca, S., 2006 Adaptation of Turkish Science and Technology Policy to the European Union Research and Innovation Policies In the Light of Lisbon Strategy of the Union, Unpublished M.Sc. Thesis, Ankara: METU.
Bäckstrand, G., Ingelstam, L., 2006. Enough! Global challenges and responsible lifestyles, in DHF (Ed.), “What Next Volume I, Setting the context”, Development Dialogue 2006: June, no. 47, pp. 97-148. http://www.dhf.uu.se/pdffiler/DD2006_47_what_next_vol_1.pdf.
Borup, M., 2004. Green Technology Foresight as Instrument in Governance for Sustainability, in K. Jacob, M. Binder, A. Wieczorek (Eds.), Governance for Industrial Transformation. Proceedings of the 2003 Berlin Conference on the Human Dimensions of Global Environmental Change, Environmental Policy Research Centre: Berlin. pp. 386-408. http://web.fu-berlin.de/ffu/akumwelt/bc2003/proceedings/386%20-%20408%20borup.pdf.
Brundtland Report, 1987. World Commission on Environment and Development, Our Common Future, Oxford.
BTYK, 2000, Altıncı Bilim ve Teknoloji Yüksek Kurulu Toplantısı.
BTYK, 2001,Yedinci Bilim ve Teknoloji Yüksek Kurulu Toplantısı.
BTYK, 2004, Onuncu Bilim ve Teknoloji Yüksek Kurulu Toplantısı.
BTYK, 2005a, Onbirinci Bilim ve Teknoloji Yüksek Kurulu Toplantısı.
BTYK, 2005b, Onikinci Bilim ve Teknoloji Yüksek Kurulu Toplantısı.
BTYK, 2007, Onbeşinci Bilim ve Teknoloji Yüksek Kurulu Toplantısı.
CEPAL, 2003. Science and Technology for Sustainable Development: A Latin American and Caribbean Perspective. CEPAL seminarios y conferencias, n°25, http://www.eclac.cl/publicaciones/xml/8/12228/lcl1840i.pdf.
Clark, W.C., Dickson, N.M., 2003. Science and Technology for Sustainable Development, Sustainability science: The emerging research program. PNAS 100, 8059-8061, http://www.pnas.org/cgi/content/full/100/14/8059.
DPT, 1978 Dördüncü Beş Yıllık Kalkınma Planı 1979 – 198, Ankara: DPT.
DPT, 1984 Beşinci Beş Yıllık Kalkınma Planı, Ankara: DPT.
DPT, 1989 Altıncı Beş Yıllık Kalkınma Planı 1990 – 1994, Ankara: DPT.
DPT, 1995, Yedinci Beş Yıllık Kalkınma Planı 1996 – 2000, Ankara: DPT.
DPT, 2000 Uzun Vadeli Strateji ve Sekizinci Beş Yıllık Kalkınma Planı 2001 – 2005, Ankara: DPT.
DPT, 2006. Dokuzuncu Beş Yıllık Kalkınma Planı 2007-2013.
EEA (1999). Integration of the economy and the environment, in Environment in the European Union at the turn of the century, State of Environment report No 1/1999, Chapter 4.1, http://reports.eea.europa.eu/92-9157-202-0/en/4.1.pdf.
EEA, 2002. Paving the way for EU enlargement Indicators of transport and environment integration. TERM 2002, Environmental issue report No 32.
EEA, 2005a. The European environment: State and outlook.
91
EEA, 2005b. Environmental policy integration in Europe State of play and an evaluation framework. EEA Technical report No 2/2005.
EEA, 2005c. Environmental policy integration in Europe: Administrative culture and practices. EEA Technical Report No 5/2005.
EC, 2000 Presidency Conclusions, Lisbon European Council, 23 and 24 March 2000, Lisbon: European Council.
EC, 2002 Presidency Conclusions, Barcelona European Council, 15 and 16 March 2002, Barcelona: European Council.
EC, 2003 European Commission, Innovation Policy in Seven Candidate Countries: The Challenges Final Report Volume 2.7 Innovation Policy Profile: Turkey, Brussels: European Commission.
EC, 2005 European Trend Chart on Innovation, Annual Innovation Policy Trends and Appraisal Report Turkey, Brussels: European Commission, 2005.
Erdil, E. 2001 Biltek
Funtowicz, S., Ravetz, J., 1992. Three Types of Risk Assessment and the Emergence of Post-Normal Science, in S. Krimsky and D. Golding (Eds.), Social Theories of Risk, Greenwood Westport CT., pp. 251-273.
Funtowicz, S., Ravetz, J., 1993. Science for the Post–Normal Age. Futures 25, 735-755. G8, 2003. Science and Technology for Sustainable Development - A G8 Action Plan.
GCI, 2006. Global Competitiveness Report, 2006-2007, World Economic Forum, New York: Palgrave MacMillan.
Güngör, N.D., 2004 Brain drain from Turkey: an empirical investigation of the determinants of skilled migration and student non-return, Unpublished Ph.D. Thesis, METU: Ankara.
ICS, 2002. S&T for sustainable development., Consensus report on Mexico conference, http://www.icsu.org/Gestion/img/ICSU_DOC_DOWNLOAD/70_DD_FILE_Vol9.pdf.
ICSU, WFEO, 2002. Science and Technology as a Foundation for Sustainable Development. Report by the Scientific and Technological Community for the Multi-Stakeholder Dialogue Segment of the WSSD PrepCom IV Meeting.
Jackson, T., et al., 2006. I will if you will: Towards sustainable consumption. Sustainable Consumption Roundtable, jointly hosted by the National Consumer Council and the Sustainable Development Commission, UK.
Jamison, A., 2001. Science, technology and the quest for sustainable development. Technology Analysis & Strategic Management 13, 9-22.
Jørgensen, M.S., 2006. Green Technology Foresight about environmentally friendly products and materials - The challenges from nanotechnology, biotechnology and ICT, Danish Environmental Protection Agency, Working Report No. 34, http://ec.europa.eu/information_society/istevent/2006/cf/document.cfm?doc_id=1671.
Kjaerheim, G., 2005. Cleaner production and sustainability. Journal of Cleaner Production 13, 329-339.
Lafferty, W.M., 2002. Adapting Government Practice to the Goals of Sustainable Development. ProSus Working Paper 1/02, Oslo, ProSus, University of Oslo (paper presented to the OECD/PUMA expert seminar on ‘Improving Governance for

92
Sustainable Development’, Paris, 22-3 Nov. 2001). http://www.prosus.uio.no/publikasjoner/Arb_not/2002/1-02.pdf.
Lieberman, S., Taylor, K., 2005. Participatory Decision Making: A comparative analysis of the public debates on GMOs conducted in France and Britain. Mimeo, Mansfield College, Oxford. http://www.inter-disciplinary.net/ptb/ejgc/ejgc4/lieberman%20paper.pdf.
Luken, R.A., Navratil, J., 2004. A programmatic review of UNIDO/UNEP national cleaner production centres. Journal of Cleaner Production 12, 195-205.
Mansell, R., Wehn, U., 1998. Knowledge Societies: Information Technology for Sustainable Development, Oxford University Press, http://www.sussex.ac.uk/spru/1-4-9-1-1-2.html.
Mattil, B., 2006 Pension Systems: Sustainability and Distributional Effects in Germany and United Kingdom, Heidelberg, Physica-Verlag.
Ministry for Foreign Affairs, 2004. Finland's Report on the Millennium Development Goals. http://www.undg.org/archive_docs/5341-Finland_MDG_Report_-_English.pdf
OECD, 2002. Improving Policy Coherence and Integration for Sustainable Development: A Checklist. Policy Brief, October. http://www.oecd.org/dataoecd/61/59/2763163.pdf.
OECD, 2007. Integrating Science & Technology into Development Policies: An International Perspective, http://www.oecd.org/document/5/0,3343,en_2649_34499_38626693_1_1_1_1,00.html.
Official Gazette, 1963, Türkiye Bilimsel ve Teknolojik Araştırma Kurumu Kurulması Hakkında Kanun, Law No. 278, Enacted: 17.07.1963 (Official Gazette No. 11462).
Official Gazette, 1983 Bilim ve Teknoloji Yüksek Kurulu Kurulmasına İlişkin 77 Sayılı Kanun Hükmünde Kararname, Decree No. 77, Enacted: 16.08.1983 (Official Gazette No. 18181).
Official Gazette, 1990 Küçük ve Orta Ölçekli Sanayi Geliştirme ve Destekleme İdaresi Başkanlığı Kurulması Hakkında Kanun, Law No. 3624, Enacted: 12.04.1990 (Official Gazette No. 20498).
Official Gazette, 2001 Teknoloji Geliştirme Bölgeleri Kanunu, Law No. 4691, Enacted: 26.06.2001 (Official Gazette No. 24454.
Olsen P., Jespersen, S.T., Jacobsen R.H., 2006 “The Interplay between Retirement Behavior, the Tax System and Labour Market Policies”, Centre for Economic and Business Research, Copenhagen Business School, Report No. 12.
Ravetz, J., 2004. The post-normal science of precaution. Futures 36, 347-357.
Rennings, K., Kemp, R., Bartolomeo, M., Hemmelskamp, J., Hitchens, D., 2003. Blueprints for an Integration of Science, Technology and Environmental Policy, ZEW, Mannheim. http://www.blueprint-network.net.
Roberts, J., Rice, N., Schellhorn, M., Jones, A., Gambin, L., 2006 “Health, Retirement and Inequality: Can Germany and UK Learn from Each Other?”, Anglo-German Foundation Research Report.
Saritas, O., Taymaz, E., Tumer, T., 2007. Vision 2023: Turkey's National Technology Foresight Program: A Contextualist Analysis and Discussion. Technological Forecasting and Social Change, forthcoming.
Schot, J., 2001. Towards new forms of participatory technology development. Technology Analysis & Strategic Management 13, 39-52.

93
Serres, M., 1995. The Natural Contract. University of Michigan Press, Studies in Literature and Science.
Staniskis, J.K., Arbaciauskas, V., 2004. Institutional capacity building for pollution prevention centres in Central and Eastern Europe with special reference to Lithuania. Journal of Cleaner Production 12, 207-214.
Stirling, A., Mayer, S., 1999. Rethinking Risk: a pilot multi-criteria mapping of a genetically modified crop in agricultural systems in the UK. Report for the UK Roundtable on Genetic Modification, SPRU, University of Sussex. A copy of the report abstract and commentary is available free of charge at http://www.sussex.ac.uk/Units/gec/gecko/r9i-mcm-.pdf.
TÜBA, 2005, Geçmişten Geleceğe Türk Bilim ve Teknoloji Politikaları, Ankara: TÜBA.
TÜBİTAK, 2004a Teknoloji Öngörü Çalışma Sonuçları, Sentez Raporu, 1. Cilt, Süreç ve Metodoloji, Ankara: TÜBİTAK.
TÜBİTAK, 2004b Teknoloji Öngörü Çalışma Sonuçları, Sentez Raporu, 3. Cilt, Türkiye Sentezi, Ankara: TÜBİTAK.
TÜBİTAK, 2006, AB Çerçeve Programları ve Türkiye, Ankara:Türkiye.
TÜBİTAK, 2007, İstatistikler, http://www.tubitak.gov.tr/home.do?ot=1&sid=357.
Valenduc, G. and Vendramin P., 1997. “Science, Technological Innovation, and Sustainable Development”, Proceedings of International Conference on Science for a Sustainable Society, Roskilde, Denmark.
Vogel, J., 2002 “Ageing and Living Conditions of the Elderly: Sweden 1980-1998, Social Indicators Research, 59, 1-34.
Willis, R., Wilsdon, J., 2004. Why public engagement needs to move upstream, DEMOS, http://www.demos.co.uk/publications/paddlingupstream.

94
TableA1: Composition of the Global Competitiveness Index 1st Pillar: Institutions A. Public institutions 1. Property rights 1.01 Property rights 2. Ethics and corruption 1.02 Diversion of publics funds 1.03 Public trust of politicians 3. Undue influence 1.04 Judicial independence 1.05 Favoritism in decisions of government officials 4. Government inefficiency (red tape, bureaucracy and waste) 1.06 Wastefulness of government spending 1.07 Burden of government regulation 5. Security 1.08 Business costs of terrorism 1.09 Reliability of police services 1.10 Business costs of crime and violence 1.11 Organized crime B. Private institutions 1. Corporate ethics 1.12 Ethical behavior of firms 2. Accountability 1.13 Efficacy of corporate boards 1.14 Protection of minority shareholders’ interests 1.15 Strength of auditing and accounting standards 2nd Pillar: Infrastructure 2.01 Overall infrastructure quality 2.02 Railroad infrastructure development 2.03 Quality of port infrastructure 2.04 Quality of air transport infrastructure 2.05 Quality of electricity supply 2.06 Telephone lines (hard data) 3rd Pillar: Macroeconomy 3.01 Government surplus/deficit (hard data) 3.02 National savings rate (hard data) 3.03 Inflation (hard data) 3.04 Interest rate spread (hard data) 3.05 Government debt (hard data) 3.06 Real effective exchange rate (hard data) 4th Pillar: Health and primary education A. Health 4.01 Medium-term business impact of malaria 4.02 Medium-term business impact of tuberculosis 4.03 Medium-term business impact of HIV/AIDS 4.04 Infant mortality (hard data) 4.05 Life expectancy (hard data) 4.06 Tuberculosis prevalence (hard data) 4.07 Malaria prevalence (hard data) 4.08 HIV prevalence (hard data) B. Primary education 4.09 Primary enrolment (hard data) 5th Pillar: Higher education and training A. Quantity of education 5.01 Secondary enrolment ratio (hard data) 5.02 Tertiary enrolment ratio (hard data) B. Quality of education 5.03 Quality of the educational system 5.04 Quality of math and science education 5.05 Quality of management schools C. On-the-job training 5.06 Local availability of specialized research and training services 5.07 Extent of staff training
6th Pillar: Market efficiency A. Good markets: Distortions, competition, and size 1. Distortions 6.01 Agricultural policy costs 6.02 Efficiency of legal framework 6.03 Extent and effect of taxation 6.04 Number of procedures required to start a business 6.05 Time required to start a business 2. Competition 6.06 Intensity of local competition 6.07 Effectiveness of antitrust policy 6.08 Imports (hard data) 6.09 Prevalence of trade barriers 6.10 Foreign ownership restrictions 3. Size 0.00 GDP – exports + imports 6.11 Exports B. Labor markets: Flexibility and efficiency 1. Flexibility 6.12 Hiring and firing practices 6.13 Flexibility of wage determination 6.14 Cooperation in labor-employer relations 2. Efficiency 6.15 Reliance on professional management 6.16 Pay and productivity 6.17 Brain drain 6.18 Private sector employment of women C. Financial markets: Sophistication and openness 6.19 Financial market sophistication 6.20 Ease of access to loans 6.21 Venture capital availability 6.22 Soundness of banks 6.23 Local equity market access 7th Pillar: Technological readiness 7.01 Technological readiness 7.02 Firm-level technology absorption 7.03 Laws relating to ICT 7.04 FDI and technology transfer 7.05 Cellular telephones 7.06 Internet users 7.07 Personal computers 8th Pillar: Business sophistication A. Networks and supporting industries 8.01 Local supplier quantity 8.02 Local supplier quality B. Sophistication of firms’ operations and strategy 8.03 Production process sophistication 8.04 Extent of marketing 8.05 Control of international distribution 8.06 Willingness to delegate authority 8.07 Nature of competitive advantage 8.08 Value-chain presence 9th Pillar: Innovation 9.01 Quality of scientific research institutions 9.02 Company spending on research and development 9.03 University/industry research collaboration 9.04 Government procurement of advanced technology products 9.05 Availability of scientists and engineers 9.06 Utility patents 9.07 Intellectual property protection 9.08 Capacity for innovation
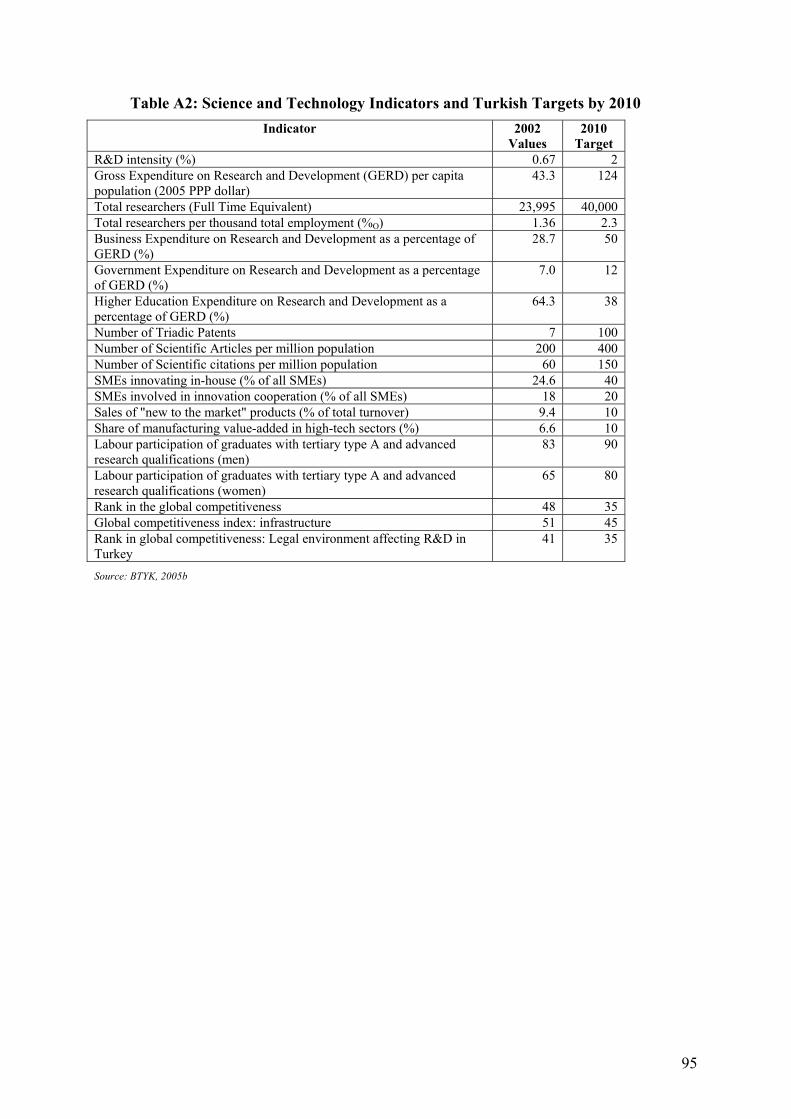
95
Table A2: Science and Technology Indicators and Turkish Targets by 2010 Indicator 2002
Values 2010
Target R&D intensity (%) 0.67 2 Gross Expenditure on Research and Development (GERD) per capita population (2005 PPP dollar)
43.3 124
Total researchers (Full Time Equivalent) 23,995 40,000 Total researchers per thousand total employment (%O) 1.36 2.3 Business Expenditure on Research and Development as a percentage of GERD (%)
28.7 50
Government Expenditure on Research and Development as a percentage of GERD (%)
7.0 12
Higher Education Expenditure on Research and Development as a percentage of GERD (%)
64.3 38
Number of Triadic Patents 7 100 Number of Scientific Articles per million population 200 400 Number of Scientific citations per million population 60 150 SMEs innovating in-house (% of all SMEs) 24.6 40 SMEs involved in innovation cooperation (% of all SMEs) 18 20 Sales of "new to the market" products (% of total turnover) 9.4 10 Share of manufacturing value-added in high-tech sectors (%) 6.6 10 Labour participation of graduates with tertiary type A and advanced research qualifications (men)
83 90
Labour participation of graduates with tertiary type A and advanced research qualifications (women)
65 80
Rank in the global competitiveness 48 35 Global competitiveness index: infrastructure 51 45 Rank in global competitiveness: Legal environment affecting R&D in Turkey
41 35
Source: BTYK, 2005b

96
Table A3: BTYK Meetings Date of Meeting
1 October 9, 1989 2 February 3, 1993 3 August 25, 1997 4 June 2, 1998 5 December 20, 1999 6 December 13, 2000 7 December 24, 2001 8 April 15, 2002 9 February 6, 2003
10 September 8, 2004 11 March 10, 2005 12 September 8, 2005 13 March 8, 2006 14 September 12, 2006 15 March 7, 2007

97
196019611962196319641965196619671968196919701971197219731974197519761977197819791980198119821983198419851986198719881989199019911992199319941995199619971998199920002001200220032004200520062007
Pilo
t Tea
ms
Proj
ect (
OEC
D)
Firs
t Fiv
e Ye
ar D
evel
opm
ent P
lan
♦Est
ablis
hmen
t of S
cien
tific
and
Tec
hnol
ogic
al R
esea
rch
Cou
ncil
- TÜ
BİTA
K♦
Seco
nd F
ive
Year
Dev
elop
men
t Pla
n Th
ird F
ive
Year
Dev
elop
men
t Pla
nFo
urth
Fiv
e Ye
ar D
evel
opm
ent P
lan
♦ Tu
rkis
h Sc
ienc
e Po
licy
1983
-200
3♦
Esta
blis
hmen
t of S
upre
me
Cun
cil o
f Sci
ence
and
Tec
hnol
ogy
(BTY
K)♦
Fist
h Fi
ve Y
ear D
evel
opm
ent P
lan
♦Tur
kish
Adv
ance
d Te
chno
logy
Impe
tus
Proj
ect (
Ista
nbul
Tec
hnic
al U
nive
rsity
)♦
♦BTY
K Fi
rst M
eetin
g♦
Sixt
h Fi
ve Y
ear D
evel
opm
ent P
lan
1st S
cien
ce a
nd T
echn
olog
y As
sem
bly
♦Es
tabl
ishm
ent o
f Tec
hnol
ogy
Dev
elop
men
t Fou
ndat
ion
of T
urke
y - T
TGV
♦♦B
TYK
Seco
nd M
eetin
g♦
Turk
ish
Scie
nce
and
Tecn
olog
y Po
licy:
199
3-20
03
Esta
blis
hmen
t of T
urki
sh A
cade
my
of S
cien
ces
♦Es
tabl
ishm
ent o
f Tur
kish
Pat
ent I
nstit
ute
♦Th
e Pr
ojec
t for
Impe
tus
in S
cien
ce a
nd T
echn
olog
y♦
Seve
nth
Five
Yea
r Dev
elop
men
t Pla
n♦B
TYK
Third
Mee
ting
♦Tu
rkey
's S
cien
ce a
nd T
echn
olog
y Po
licy
♦BTY
K Fo
urth
Mee
ting
♦♦B
TYK
Fifth
Mee
ting
♦♦B
TYK
Sixt
h M
eetin
g♦
Eigt
h Fi
ve Y
ear D
evel
opm
ent P
lan
♦BTY
K Se
vent
h M
eetin
g♦
Enac
tmen
t of T
echn
olog
y D
evel
opm
ent R
egio
ns L
aw
♦♦B
TYK
Eigh
th M
eetin
g♦
♦BTY
K N
inth
Mee
ting
♦♦
Dec
isio
n to
join
the
EU F
ram
ewor
k Pr
ogra
ms
♦♦B
TYK
10th
Mee
ting
♦♦B
TYK
11th
Mee
ting
♦♦B
TYK
12 th
Mee
ting
♦♦B
TYK
13 th
Mee
ting
♦♦B
TYK
14 th
Mee
ting
♦♦B
TYK
15 th
Mee
ting
♦♦B
TYK
16 th
Mee
ting
♦Vİ
ZYO
N 2
023
to 2
023
Nin
th D
evel
opm
ent P
lan
to
201
3
Figu
re A
1: A
Tim
elin
e of
Tur
key'
s S&
T Po
licy-
mak
ing
and
Plan
ning
- M
ajor
Pol
ices
, Pla
ns, E
stab
lishm
ents
And
Mile
ston
es
Mai
n pu
rpos
e w
as to
'est
ablis
h th
e na
tiona
l sys
tem
of i
nnov
atio
n'.a
nd to
fu
rther
the
deve
lopm
ent o
f te
chno
logi
cal c
ompe
tenc
ies
alon
gsid
e sc
ient
ific
com
pete
ncie
s th
at c
an b
e co
nver
ted
to e
cono
mic
and
soc
ial
bene
fit.
Gav
e ris
e to
a n
umbe
r of s
ecto
ral
stud
ies
conc
erne
d w
ith th
e br
aod
spec
trum
of
prio
rity
tech
nolo
gies
in
gene
ric a
reas
suc
h as
info
rmat
ion
tech
nolo
gy, a
dvan
ced
mat
eria
ls,
biot
echn
olog
y, g
ene-
tech
nolo
gy.
Prep
ared
by
DPT
and
TÜ
BİTA
K un
der t
he c
oord
inat
ion
of M
inis
ter
of S
tate
, Nim
et Ö
zdaş
with
the
parti
cipa
tion
of 3
00 s
cien
tists
and
ex
perts
. Tec
hnol
ogy
was
maj
or
mot
ive.
Prio
rity
tech
nolo
y ar
eas
wer
e de
term
ined
.
An im
plem
enta
tion
sche
dule
of T
urki
sh
Scie
nce
and
Tecn
olog
y Po
licy:
199
3-20
03. B
ecam
e pa
rt of
the
Seve
nth
five
year
dev
elop
men
t pla
n.
This
doc
umen
t gav
e th
e fin
al
form
to th
e S&
T po
licie
s af
ter
1993
and
toge
ther
with
the
SCST
's 1
997,
98'
and
99'
de
cisi
ons
form
ed th
e ba
sis
of th
e im
plem
enta
tion
agen
da
ther
efat
er.

98
Figure A2: The Organizational Scheme of Vision 2023
Source: TÜBİTAK, 2004a.

99
Table A4: The Strategic Technologies Information and Communication Technologies Integrated Circuit Design and Production Technologies Image Units (Monitors) Production Technologies Wideband Technologies Image Sensors Production Technologies Biotechnology and Gene Technology High-Scale Platform Technologies Structural and Functional Genome Science Transcriptomics, Proteomics and Metabolomics Recombinant DNA Technologies Cell Treatment and Stem Cell Technologies Drug Scanning and Design Technologies Therapeutic Protein Production and Controlled Release Systems Bioinformatics Nanotechnology Nanophotonics, Nanoelectronics, Nanomagnetism Nanomaterials Nanocharacterization Nanofabrication Quantum Information Processing on Nano Scale Nanobiotechnology Mechatronics Micro / Nano Electromechanical Systems And Sensors Robotics And Automation Technologies Basic Control Technologies and Other Generic Areas Design Technologies Virtual Reality Software and Virtual Prototyping Simulation and Modeling Software Grid Technologies and Parallel and Distributed Computing Software Technologies Related to Production Processes and Systems Flexible and Agile Manufacturing Technologies Rapid Prototyping Technologies Surface, Interface, Thin Film and Vacuum Technologies Metal Shaping Technologies Plastic Parts Manufacturing Technologies Welding Technologies High Speed Machining Technologies Materials’ Technologies Boron Technologies Composite Materials’ Technologies Polymer Technologies Smart Materials’ Technologies Magnetic, Electronic, Optoelectronic Materials Technologies Light and High Strength Materials’ Technologies Energy And Environment Technologies Hydrogen Technologies And Fuel Cells Renewable Energy Technologies Energy Storage Technologies and Power Electronics Nuclear Energy Technologies Environment Sensitive and High Efficiency Fuel and Fuel Combustion Technologies Water Purification Technologies Waste Management Technologies

100
Table A5: Decisions Taken since 10th Meeting of BTYK
BTYK Meeting
No.
Decision No. Decision
2004/1 National Science and Technology Implementation Plan 2005-2010 10 2004/2 Calendar of BTYK Meetings 2005/2010 2005/1 The Foundation of Research Group on Social Sciences and Humanities in TÜBİTAK 2005/2 National Science and Technology Vision 2005/3 National Science and Technology System Performance Indicators 2005/4 National Priority Science and Technology Areas 2005/5 National Public Research Porgramme Preliminary Studies 2005/6 The Policies Implemented for the Utilaization of TÜBİTAK R&D Funds in 2005
2005/7 The Acceptance of OECD's Frascati, Oslo ve Canberra Handbooks as Reference in R&D Activities
2005/8 National Defence Research Program 2005/9 National Space Research Program 2005/10 National Science and Technology Implementation Plan 2005-2010
11
2005/11 Coordination of Earthquake Research 2005/201 The 2010 Targets of National Science and Technology System 2005/202 2006-2008 Public R&D Appropriation 12 2005/203 Participation to the EU Framework Programs 2006/101 National Innovation System Performance Indicators
13 2006/102 The Policies Implemented for the Utilaization of TÜBİTAK R&D Funds in 2006 2006/201 The Preperation of National Innovation Strategy and Action Plan 2006/202 International Strategy on Science, Technology, and Innovation (STI)- (2007-2010) 2006/203 The Appointment of National Contact Institution for the EU Framework Programs
14
2006/204 The Policies Implemented for the Utilization of Public R&D Funds in 2007 2007/101 Global Warming and Climate Change: Measures to be Taken and Studies for Adaptation
15 2007/102 National Nuclear Technology Development Program

101
Table A6: SCIENCE AND TECHNOLOGY TTF WORKSHOP 27-28.11.2007, ANKARA
POLICIES/ MAIN HEADINGS
OVERARCHING POLICY TARGET
CURRENT PROBLEMS (MAIN PROBLEMS) POLITICAL/INSTITUTIONAL/
SOCIAL/ECONOMIC/ENVIRONMENTAL
CAUSES (for the ones marked with an asterisk * , the participants
could not reach consensus)
Dimension of INPUTS
Financial resources (Research funds, the social and environmental criteria included)
Human Resources (number of researchers/trainers, fees, education, included the principles of sustainable development)
Ease the access to financial resources Develop institutional capacities
- Insufficiency of financial resources - Ineffective implementation of national S&T
policies and strategies in providing and using resources
- Inefficient usage of capital (etc. EU funds) - Inefficient usage of the resources - Lack of Capital - Underdeveloped risk capital - Economic instability (effects on R&D) and
non-supportive economic environment - Monetary policy oriented towards the
management of the Economy/Finance sector - Weakness of universities concerning income-
and resource-generating R&D activities - Problems with the continuity of Incentive/
Support programmes - Lack of coordination for designing policies and
strategies for the S&T sector, lack of communication, non-existence of common priorities and criteria among the actors
- S&T is not a priority in institutions, there are no inter-institutional policies/principles
- Inefficient coordination and cooperation between industry-university-government in using of R&D infrastructure.
- Lack of spillover of information/specialization on basic sciences to industry applications (Contributions of universities to industry)
- Dependency from foreign resources in S&T - Lack of R&D infrastructure, underutilization of

102
- Lack of skilled human resources - Incomplete and insufficient data and
inventory
international infrastructures - Redundant technological investments - No common human resources policies - No training for new people on R&D-based
topics (Education System), especially for researchers who are going to work in the private sector
- No human resource planning based on production and on vocational education
- Inefficiency/Lack of human resources, planning, and evaluation system
- Brain Drain - Lack of ”intermediate” staff - Lack of statistical data based on external
dimension of technology (balance of technological payments) – Lack of database which can support technology
- Lack of technology inventory and low awareness about existing inventory
- Lack of market information on R&D activities

103
Dimension of S and T activities
Basic Research Cooperation Participation (the views of stakeholders on research activities)
Risk (pre evaluation of risks objective to human and nature; etc: effect Genetically Modified Organisms (GMO) researches on health and polluting effects of GMO on non GMO fields
Ecological Design (decreasing effects of new products on environment to minimum at design stage)
Create inter-institutional coordination structures and strengthen existing ones
Ineffective implementation of S&T policies and strategies
- Different strategies are not supporting each other, especially the Information Society Strategy (2006-2010) document in which the definition of R&D is not satisfactory
- Lack of coordination and cooperation in S&T activities
- Lack of resource evaluation, orientation and coordination at economic/social / technological dimension at national and International scale
- Lack of identification of R&D priorities at national Dimension
- Lack of leadership in the sector - Non-existence of integrated industry
production policy (advanced technology, final product and production)
- Not enough actors addressing the relation between S&T and SD
- Lack of a sectoral approach by policy makers - Public procurement law and its applications
are not coherent with S&T-SD criteria - Low capacity in developing technologies that
are original and correspond to national needs - Having short-term vision in public and private
sectors - Lack of standards in S&T - Problems related with production processes
and with national/international legislation/accreditation and standards
- No capacity to develop eco-industrial districts - Inability to develop objective criteria for
sharing the resources on fair bases and on social welfare
- Non-existence of a dynamic mechanism to coordinate policies and implementation

104
Increase competitiveness
Lacks of strategic decision making and production processes of enterprises
- Non-existence of enough governmental support for S&T-SD criteria coherent policies
- Not able to integrate S&T and environmental policies in natural resources management
- Lack of Know-How and Know-Why etc. - Lack of experience when developing and
producing technologies - Problems in technology transfer management - Enterprises are not open for organizational
innovations - Non-existence of R&D Departments as a
business culture or lack of personnel in these departments
- Unawareness about the importance and priority of STI (Science, Technology and Innovation)
- Lack of STI culture - Lack of system engineering - Insufficiency of project production culture - Not establishing common targets and lack of
cooperation in organizations (clustering, networking, etc.)
- Lack of environmentally-friendly production structure
- Low awareness about quality and environmental management systems
- Rare participation to international consortia
Dimension of OUTPUTS
Marketing of Research and Development /
Increase competitiveness
Problems specific to the S&T sector
- Lack of intermediate technologies (hence the
need for Technology Assessment) - Insufficiency of ethical rules in R&D
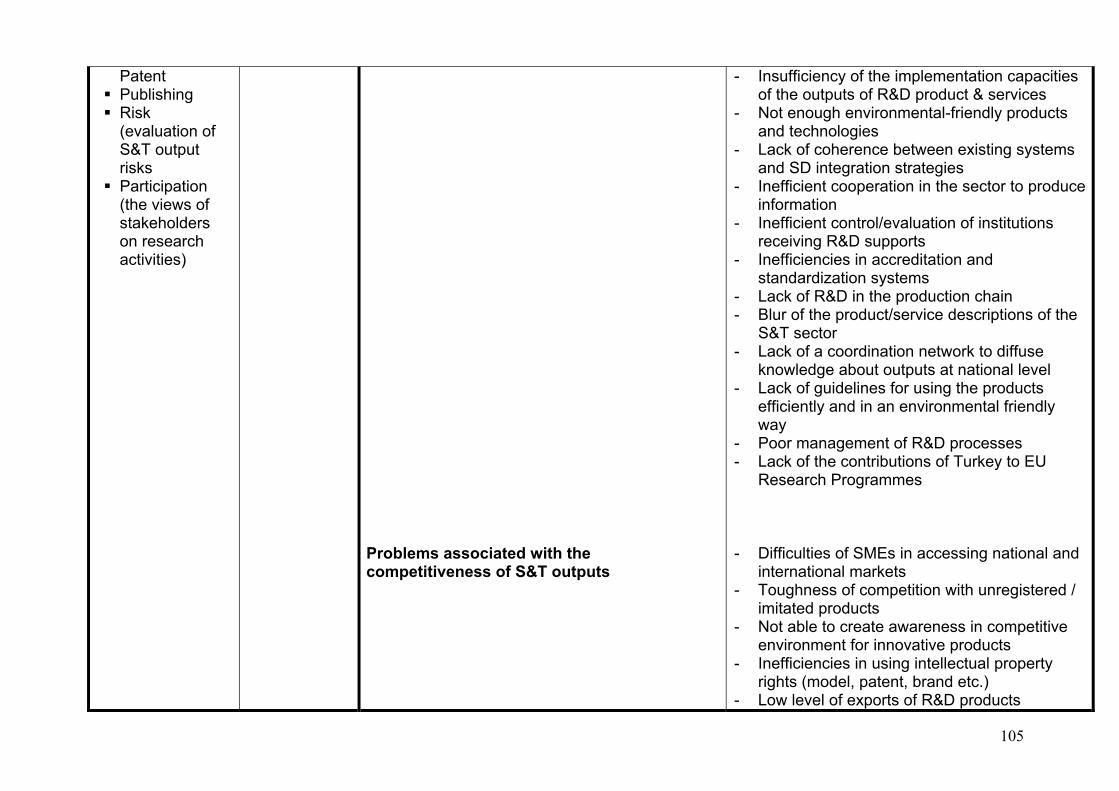
105
Patent Publishing Risk (evaluation of S&T output risks
Participation (the views of stakeholders on research activities)
Problems associated with the competitiveness of S&T outputs
- Insufficiency of the implementation capacities of the outputs of R&D product & services
- Not enough environmental-friendly products and technologies
- Lack of coherence between existing systems and SD integration strategies
- Inefficient cooperation in the sector to produce information
- Inefficient control/evaluation of institutions receiving R&D supports
- Inefficiencies in accreditation and standardization systems
- Lack of R&D in the production chain - Blur of the product/service descriptions of the
S&T sector - Lack of a coordination network to diffuse
knowledge about outputs at national level - Lack of guidelines for using the products
efficiently and in an environmental friendly way
- Poor management of R&D processes - Lack of the contributions of Turkey to EU
Research Programmes - Difficulties of SMEs in accessing national and
international markets - Toughness of competition with unregistered /
imitated products - Not able to create awareness in competitive
environment for innovative products - Inefficiencies in using intellectual property
rights (model, patent, brand etc.) - Low level of exports of R&D products

106
Increase support to basic research
Weak basic research capacity
- Lack of long-lasting R&D programmes - S&T outputs do not take enough into account
market demands - Cartel structure for high technology products * - Difficulties in commercializing R&D products
and services in conformity with SD criteria - Lack of information and resources in the
management of intellectual property rights - Lack of supports for scientific publications - Low level of use of scientific publications - Low participation to international consortia - Not enough research infrastructures in
universities and research institutions - Inefficient use of human resources in basic
research and non-supportive environment for these resources

107
POLICY RECOMMENDATIONS (for the lines or items marked with an asterisk * , the participants could not reach consensus)
POLICIES/ MAIN
HEADINGS
OVERARCHING POLICY TARGET
IDEAL CONDITION POLITICAL/INSTITUTIONAL/
SOCIAL/ECONOMIC/ENVIRONMENTAL THINGS TO DO
WHO? RESPONSIBLE /
SUPPORTER TIME
PERIOD INDICATORS
Increase the quantity of funds allocated to R&D in the public budget
Ministry of Finance
(responsible), BTYK, SPO,
Treasury
Short Term
Design regulations for risk capital
SPK (responsible),
Ministry of Finance,
Treasury, STB, BDDK
Short Term
*
Create a new unit to implement the coordination of support programmes
Prime Ministry (responsible),
Council of Ministers, BTYK
Short Term
Develop funds for university-industry cooperation
TÜBİTAK(s), YÖK, STB,
TOBB, KOSGEB
Short Term
Carry out impact assessments of nationally funded R&D projects
TÜBİTAK, DTM, STB, MEF,
YÖK
Short Term
INPU
TS
Ease the access to financial resources
Create sufficient financial resources
*Monitor the efficient use of the resources transferred to the S&T sector (auditing)
Treasury, Ministry of
Finance, SPO
Short Term

108
Make necessary adjustments and take necessary precautions to protect the sector from economic instabilities
Prime Ministry, Ministry of Finance,
Treasury, SPO
Short Term
Identify the coordination unit and design the necessary legislation
Prime Ministry, Council of Ministers, BTYK
Short Term
Define and develop sector-based S&T strategies
Prime Ministry (circular), SPO
Short Term
Secure cooperation and coordination between universities, public agencies and industries by the BTYK on resource utilization
BTYK (responsible), TÜBİTAK , YÖK, KOSGEB, TOBB and relevant agencies
Short Term
Provide resource for national S&T policies and strategies, and ensure their efficient use
Support the national R&D infrastructure
SPO(responsible), Universities, Ministry of Finance, Treasury, DTM, Private Sector
Short Term
Jointly determine the planning of education and human resources
MEB, YÖK; DPT, Government Personnel Department
Medium Term
Develop institutional capacities
Provide skilled human resources
Develop an action plan and a strategy to reverse brain drain
TÜBİTAK, BTYK, YÖK, TOBB
Short Term

109
Enable the coordination in relevant areas to provide skilled intermediate staff in the S&T sector
YÖK, MEB; STB, TOBB, KOSGEB
Medium Term
Define qualitative and quantitative needs of the human resources of the S&T sector
TÜBİTAK (responsible), BTYK, SPO, YÖK, MEB, Industrial Agencies
Short Term
Organise awareness-raising activities on SD for human resources in the S&T sector
MEB-UNDP coordination, YÖK
Short Term (continuous )
*
Develop a database comprising statistical data on the S&T sector, on existing technology inventory statistics, and on SD indicators in order to support technological activities
Under the responsibility of TÜİK, TÜBİTAK and Treasury, sector representatives and relevant ministries
Short Term
*
Process, monitor and control the developed database to provide information for the sector (market, R&D priorities, inventory, etc…)
TÜBİTAK (responsible) TÜİK, sector representatives and relevant ministries
Short Term
Overcome the insufficiencies in data collection and inventory
*
Update, activate and widely spread the use of TARABİS (Turkish Research Infrastructure Information System)
TÜBİTAK, Research Agencies, TOBB
Medium Term

110
*
Improve the Administrative Entry System’s capacity and quality so that it can provide inputs to S&T indicators studies
SPO, TARAL Actors
Medium Term
*
Identify missing data, indicators, and methodological studies about how to develop regular data collection and to secure the transfer of these data and related indicators into international databases
TÜİK, SPO, TÜBİTAK
Medium Term
*
Introduce existing data to relevant actors (who collected it and how)
TÜİK, SPO, TÜBİTAK
Medium Term
Develop a system to analyse and monitor risks for SD
MEF, SPO(responsible), STB, Ministry of Health, Ministry of Agriculture, TÜİK, MENR, MPWS
Medium Term
S an
d T
Act
iviti
es
Create inter-institutional coordination structures and
Improve the implementation of national S&T strategies and policies
Improve the coordination of policies and actions by organisational and legislative means
BTYK Medium Term

111
Activate and impose BTYK’s decisions in agreement with the national S&T sector and with all its components, by easing necessary cooperation, coordination and partnership
BTYK, TÜBİTAK, relevant ministries
Medium Term
Articulate S&T activities in natural resource management and environmental management policies with SD principles
SPO (responsible) MEF MENR SD Association TÜBİTAK STK
Short Term
Harmonise public procurement legislation with S&T-SD criteria
CFCU SPO TÜBİTAK
Short Term
Harmonise government support legislations with S&T-SD criteria
DTM Treasury TÜBİTAK STB SPO
Short Term
Integrate SD criteria into annual programmes and development plans
SPO(responsible) SD Association TÜBİTAK MENR STB
Short Term
Determine which criteria should be used to develop technologies and products in conformity with national needs and priorities
SPO (responsible) STB Relevant ministries
Short Term

112
Integrate the SD strategy in public administration reform actions
Prime Ministry Administration Development Department
Medium Term
Spread the incubation system to support entrepreneurship in Turkey
STB (responsible) KOSGEB TOBB TÜBİTAK YÖK
Medium Term
Spread the use of ICTs to improve Decision Support Systems in the enterprises
STB DTM TOBB NGO
Medium Term
*
Site visits of enterprises TÜBİTAK STB TOBB SPO Industrial Areas Regional Development Agencies
Short Term
*
Support entrepreneurship activities on know-how, design etc…
STB KOSGEB STK TOBB
Medium Term
Increase competitiveness
Develop the Strategic Decision-Making and Production Processes of Enterprises
Support enterprises/ entrepreneurs on how to use environmental technologies and on how to develop products
Treasury MENR STB
Medium Term

113
Design and carry out methodological trainings on R&D Management
STB SPO MEB YÖK TÜBİTAK
Short Term (continuous)
Adapt technology transfer offices to the Turkish context and empower them
STB, SPO, YÖK, TÜBİTAK, Research agencies
Medium Term
Educated persons-number of firms
Improve the legislations on ethical rules
TÜBİTAK, RK Medium Term
Number of applications made to the offices
Improve the National R&D Information Management Network
TÜBİTAK, YÖK, TOBB, KOSGEB, relevant ministries
Medium Term
Harmonization of legislations
Prepare sector-based strategies in production and consumption chains based on S&T
SPO, TÜBİTAK, STB
Medium Term
*Educate skilled staff for R&D process management
YÖK, R&D Agencies, ST sector components
Long Term
Ensure the conformity of R&D products and services with SD criteria
MENR, STB, SPO, Universities
Short Term
OU
TPU
TS
Increase competitiveness
Improve R&D Processes
Examine and support the R&D support system
STB, SPO, TGB
Short Term

114
Increase the number and the efficiency of technology development zones –TZA (technoparks), develop thematic TZAs
STB, TÜBİTAK, SPO, Treasury, Ministry of Finance
Medium Term
Given aid amount/ number of firms
Improve the legislation on strengthening quality and quantity R&D human resources in the private sector
SPO, YÖK, TÜBİTAK
Short Term
Effect analysis results of the TDAs
Design and organise trainings on intellectual property system, accreditation, standardisation, and disseminate them
STB, TÜRKAK, TPE, DPT, TSE
Short Term
Personnel that has been employed effectively with
Convert the existing investment agency into an agency dealing with investment and commerce
Treasury, DTM, STB, SPO, TOBB, Local Administrations
Short Term
Percentage of the technician and similar personnel
Encourage the production and export of high value-added products and technologies
STB, DTM, TOBB, relevant ministries
Medium Term
Develop Eco-Industrial regions
STB,SPO, MEF, Local Administrations
Medium Term
Reward the examples of successful integration of SD dimensions into the S&T sector
Prime Ministry Short Term
Increase the capacity to compete
Organise a Sustainable Development Week
MEB, STB, YÖK, SPO
Short Term

115
Make environmental management systems mandatory in the S&T sector
MEF, Local Administrations
Medium Term
*
Improve infrastructures (physical ones) of universities and research centres to meet Turkish specific needs
SPO, YÖK Medium Term
*
Improve the legislation responsible for strengthening the quality and quantity of R&D human resources in universities
SPO, YÖK, TÜBİTAK
Medium Term
*
Develop cooperation opportunities between existing infrastructures in Higher Education Sector and infrastructures in international organizations and in the EU
SPO, YÖK Medium Term
*
Design and implement an impact assessment system targeting national and institutional programmes
SPO, TÜBİTAK, STB
Medium Term
*Increase university resources to enhance basic scientific research
Government , Ministry of Finance
Short Term
Increase support to basic research
Increase Basic Research Capacity
Enable coordination for the applicability of basic scientific research
YÖK, TÜBİTAK, BTYK
Long Term

116
Support basic research for sustainable development
YÖK, TÜBİTAK, relevant ministries
Short Term
BTYK: Supreme Council of Science and Technology, SPO: State Planning Organization, SPK: Capital Market Board of Turkey, STB: Ministry of Industry and Trade, BDDK: Banking Regulation and Supervision Agency, TÜBİTAK: Scientific and Technological Research Council of Turkey, YÖK: Higher Education Council, TOBB: The Union of Chambers and Commodity Exchanges of Turkey, KOSGEB: Directorate of SME Development and Support, DTM: Undersecretary of Foreign Trade, MEF: Ministry of Environment and Forestry; MEB: Ministry of National Education, MENR: Ministry of Energy and Natural Resources, MPWS: Ministry of Public Works and Settlement, CFCU: Central Finance and Contracts Unit, RK: Turkish Competition Authority, TPE: Turkish Patent Institute, TSE: Turkish Standards Institute, TGB: Technology development Zones.

117
Table A7: WORKSHOP PARTICIPANTS
No Name Surname Institution POST
1 Muammer Şahin Eti Maden İş.Gn. Müd. Director
2 Cihan Kızıltan TÜBİTAK Coordinator
3 Fulya Tuna ASO Expert
4 Tuğba Öztürk ODTÜ Teknopark Expert
5 Ramazan Çelikkaya TÜİK Director
6 Ayhan Doğan TÜİK Expert
7 M.Recep Usalan DTM Expert
8 Havva Zeytin MAM Expert
9 Ayşen Akın Siemens Director
10 Selvi Ak TÜBİTAK Vice-Expert
11 Işık Özmen TÜBİTAK Expert
12 Çilem Selin Akay TÜBİTAK Researcher
13 Serhat Çakır TÜBİTAK Director
14 Ayşen Erten Eti Maden İş.Gn. Müd. Vice-Director
15 Ömer Öztürk Çevre ve Orman Bakanlığı Vice-Expert
16 Özlem Akbulut Çevre ve Orman Bakanlığı Vice-Expert
17 Necati Önder Oruç Hazine Müst. Expert
18 Hakan Bilir Rekabet Kurumu Expert
19 Murat Bilen Eti Maden İş.Gn. Müd. Engineer
20 Erkan Erdil ODTÜ Associate Prof.
21 Miray Karakuzu TÜBİTAK Vice-Expert

118
22 Yasemin Aslan TÜBİTAK Vice-Expert
23 Burak Codur TÜBİTAK Expert
24 Saadet Deniz Hazine Müst. Director
25 Ayşegül Coşkun San. Ve Tic. Bak. Engineer
26 Yusuf Işık DPT Expert
27 Özgür Keskin KOSGEB Expert
28 A.Ozan Kemaloğlu KOSGEB Vice-Expert
29 Oğuz Tüzün İŞDİM SK Derneği Director
30 Pelin Tekneci DPT Expert
31 Selcan Zeren TÜBİTAK Vice-Expert
32 Ayşegül Günel TÜBİTAK Researcher
33 Tufan Aytaç M.E.B. Expert

119
Integrating SD into S&T
Why?
To anticipate problems
Dr Cedric GOSSART
Integrate what?
The 3 dimensions of SD:
A. Economic
B. Social
C. Environmental
Figure A3: Presentation given on the second day of the workshop to underline the importance to take into account the three dimensions of sustainable development

120
A. Integrating the economicdimension of SD into S&T
• Making sure that the S&T sector
contributes to economic goals(growth GDP, investment, trade,
…)
Yesterday:
We have addressed these goals

121
B. Integrating the socialdimension of SD into S&T
Making sure that the S&T sector
contributes to social goals
Social goals (EU SD strategy)
• Employment• Public health• Social inclusion• Global partnership• Demographic changes

122
Questions• Have we addressed these goals?
• Should we address these social
goals in the Turkish context?
• If yes: which priorities?
C. Integrating the environmentaldimension of SD into S&T
Make sure that the S&T
sector contributes to
environmental goals

123
Environmental goals (Environment 2010)
• Climate change and global warming
• Natural habitat and wildlife
• Health & other environmental impacts
• Natural resources & waste management
Questions• Have we addressed these goals?
• Should we address these goals in
the Turkish context?
• If yes: which priorities?

124
Time constraints today, so: let’s focus on 1 additional dimension
• Yesterday’s session: environmental
technologies mentioned several times
• We could discuss a little bit more the
environmental dimension
How to integrate the environment into a sector? (EEA)

125
Examples of indicators to
evaluate these 5 responses of
the S&T sector to the
challenge of integrating
environmental goals…
1. Political commitment & strategic vision
Is there leadership to integrate
environmental goals into the
S&T sector?

126
Does the mission statement of
the S&T administration reflect
environmental goals?
2. Administrative culture & practices
Does the sector have a process
for ex ante environmental
assessment of its proposed
policies or programmes?
3. Assessment & consultation to underpin policy design & decisions

127
Do financial assistance
programmes of the sector support
environmental objectives?
4. Use of policy instruments to deliver environmental integration
Are there mechanisms for
exchanging good practices about
how to integrate environmental
goals into the S&T sector?
5. Monitoring & learning from experience

128
Response 2 (mission statement):
SPO’s 8th development plan:
Need to integrate SD into other policies,
to assess risks, to develop environmental
technologies, …
Any positive answers for Turkey?
Experience from new European member states: Cleaner Production Centres (CPCs)
1. Diffuse information
2. Education & training
3. Demonstration projects
4. Policy advice
5. Networking

129
They work as an interface between government, industry, & other stakeholders.
References‘‘A programmatic review of UNIDO/UNEP national cleaner production centres’’, Journal of Cleaner Production, Volume 12, Issue 3, April 2004, pp. 195-205.
‘‘Institutional capacity building for pollution prevention centres in Central and Eastern Europe with special reference to Lithuania ’’, Journal of Cleaner Production, Volume 12, Issue 3, April 2004, pp. 207-214.
Cleaner Production Centres