integrated traffic data collection and management plan for
TRANSCRIPT
Prepared by
Prepared for
Integrated Traffic Data Collection and Management Plan for the Shasta County South Central Urban Region (SCUR)
Final Report

Integrated Traffic Data Collectionand
Management Planfor the
Shasta County South Central Urban Region (SCUR)
Final Report
October 3, 2013
Prepared for: Prepared by:
1300 Clay Street, Suite 325Oakland, California 94612
Phone: (510) 625-0712Fax: (916) 608-0885

October 3, 2013 2 | P a g e
EXECUTIVE SUMMARY
To be incorporated as part of final Plan.

October 3, 2013 3 | P a g e
TABLE OF CONTENTS
I. INTRODUCTION ........................................................................................................................................................................... 8
A. Project Background .............................................................................................................................................................. 8
B. Study Area ................................................................................................................................................................................ 8
1. SOUTH CENTRAL URBAN REGION (SCUR) ............................................................................................................ 8
2. GATEWAYS .......................................................................................................................................................................... 8
C. Real-Time Data Collection Background .................................................................................................................... 10
1. AGENCY BENEFITS ........................................................................................................................................................ 10
2. USER BENEFITS ............................................................................................................................................................... 11
D. Stakeholder Needs and Objectives ............................................................................................................................. 11
II. EXISTING CONDITIONS ......................................................................................................................................................... 14
A. Data Collection System .................................................................................................................................................... 14
B. Data Processing .................................................................................................................................................................. 16
C. Data Storage and Reporting .......................................................................................................................................... 17
1. TRANSPORTATION SYSTEM NETWORK .............................................................................................................. 17
2. PeMS .................................................................................................................................................................................. 18
3. CALTRANS WEBSITE ..................................................................................................................................................... 19
III. GAP ANALYSIS..................................................................................................................................................................... 20
IV. SYSTEM EVALUATION AND FEASIBILITY .................................................................................................................. 24
A. Data Collection System .................................................................................................................................................... 24
B. Technology Evaluation ..................................................................................................................................................... 26
1. INDUCTIVE DETECTOR LOOPS ................................................................................................................................ 26
2. RADAR DETECTION ...................................................................................................................................................... 27
3. VIDEO IMAGE DETECTION ........................................................................................................................................ 28
4. AUTOMATIC LICENSE PLATE READERS ................................................................................................................ 29
5. MAGNETOMETERS ....................................................................................................................................................... 30
6. ACOUSTAL DETECTION .............................................................................................................................................. 32
7. BLUETOOTH .................................................................................................................................................................... 33
8. RADIO FREQUENCY IDENTIFICATION (RFID) TAG READERS ....................................................................... 34
9. GPS BASED TRAFFIC DATA ........................................................................................................................................ 34
10. COMMUNICATIONS INFRASTRUCTURE .............................................................................................................. 36

October 3, 2013 4 | P a g e
C. Other Implementation Considerations ...................................................................................................................... 37
1. END USE OF REAL-TIME DATA ................................................................................................................................ 38
2. EXISTING POWER COMMUNICATIONS INFRASTRUCTURE ......................................................................... 38
3. DETECTION LOCATION AND SPACING PER DATA TYPE............................................................................... 41
4. CONSTRUCTION IMPACTS ON TRAFFIC ............................................................................................................. 41
5. LIFECYCLE AND RECURRING COSTS ..................................................................................................................... 41
D. Data Processing .................................................................................................................................................................. 41
E. Data Reporting .................................................................................................................................................................... 43
1. THIRD PARTY CENTRAL SYSTEMS AND DATA AGGREGATORS ................................................................. 44
V. IMPLEMENTATION PLAN ...................................................................................................................................................... 48
A. Alternatives Analysis ......................................................................................................................................................... 48
B. Implementation Plan ........................................................................................................................................................ 49
1. EXISTING CONDITIONS .............................................................................................................................................. 50
2. FUTURE CONDITIONS ................................................................................................................................................. 53
C. Operations and Maintenance Plan .............................................................................................................................. 53
D. Funding .................................................................................................................................................................................. 54
VI. SUMMARY ............................................................................................................................................................................. 57
LIST OF FIGURES
Figure 1: Shasta County SCUR ......................................................................................................................................................... 9Figure 2: Caltrans QuickMap ......................................................................................................................................................... 20Figure 3: Typical Count Station Configuration ....................................................................................................................... 51
LIST OF TABLES
Table 1: Estimate of Probable Operations and Maintenance Costs for Hardwire Power (Per Location) ........ 39Table 2: Estimate of Probable Operations and Maintenance Costs for Solar Power (Per Location) ................ 40Table 3: Estimate of Probable Communication Costs ......................................................................................................... 40Table 4: Gaps and Preferred Alternatives................................................................................................................................. 49Table 5: Summary of Proposed Project Costs ........................................................................................................................ 58

October 3, 2013 5 | P a g e
LIST OF APPENDICES
Appendix A: Existing Count Station LocationsAppendix B: Technology OverviewAppendix C: Alternatives Analysis TableAppendix D: Recommended Projects TableAppendix E: Proposed Projects
LIST OF REFERENCES AND RELATED DOCUMENTS
1. Traffic Monitoring Guide (TMG)2. Update of Guidelines and Operating Procedures for the Traffic Volumes Program – Cambridge
Systematics, September 10, 20083. Highway Performance Monitoring Program (HPMS) Field Manual4. State Procedures for Developing K-factors, D-factors, and Percent Trucks5. Freeway Ramp Metering Implementation, District Directed – Dated April 18, 2008

October 3, 2013 6 | P a g e
GLOSSARY AND ACRONYMSAcronym/Term Definition
AADT Annual Average Daily TrafficALPR Automatic License Plate ReaderATMS Advanced Traffic Management SystemBTS Berkeley Transportation SystemsCCTV Closed Circuit Television
Census Program
A federal traffic data collection program that gathers traffic data for estimatingAADT, AADT by vehicle class, axle loads, and vehicle miles of travel (VMT).Guidelines include the Traffic Monitoring Guide (TMG), Highway PerformanceMonitoring Program (HPMS) Field Manual, and State Procedures forDeveloping K-factors, D-factors, and Percent Trucks.
CFCD Cellular Floating Car DataCHIN Caltrans Highway Information NetworkCLS Classification (Data File Extension)CMS Changeable Message SignCNT Count (Data File Extension)CSV Comma-Separated Value (Data File Extension)CWWP Commercial/Media Wholesale Web PortalETC Electronic Toll CollectionFEPT Front End Protocol TranslatorFHWA Federal Highway AdministrationFMCW Frequency Modulated Continuous WaveGHG Greenhouse GasGIS Geographic Information SystemGPS Global Positioning SystemGPRS General Pocket Radio SystemGUI Graphical User InterfaceHAR Highway Advisory RadioID/DAT Identification/Data (File Extension)Integrated TrafficData CollectionSystem
A data collection system that provides accurate and current traffic data forplanning purposes as well as a means for making Traffic Operations moreefficient
ISDN Integrated Services Digital NetworkITS Intelligent Transportation SystemsLCS Lane Closure SystemMAC Media Access ControlMVDS Microwave Vehicle Detection SystemNon-PermanentCount Station
Census count station where inductive loops have been installed and a Diamondcounter is only deployed during scheduled count period
O&D Origin and DestinationOCR Optical Character Recognition
October 3, 2013 7 | P a g e
GLOSSARY AND ACRONYMSAcronym/Term Definition
PeMSPerformance Measurement System – Online portal for accessing vehicledetection data and conducting analyses.
POTS Plain Old Telephone ServicePermanent CountStation
Census station where inductive loops, controller cabinet, and counter havebeen installed. Station continuously collects traffic data.
Real-time DataCollection
For District 2 and SRTA, real-time data collection refers to providing frequentaccess to traffic data within the SCUR including volume, speed, and O&D atgateways and other key points.
RFID Radio-Frequency IdentificationRITA Research and Innovative Technology AdministrationSCUR South Central Urban RegionSMS Short Messaging ServiceSRTA Shasta Regional Transportation AgencyTMC Traffic Management CenterTMS Traffic Monitoring StationsTSN Transportation System NetworkVCR Type of file format to which traffic data is exported toVIP Video Image ProcessorVMT Vehicle Miles of Travel
ZigBeeA low cost and low power wireless mesh network standard often used ascommunication between a sensor and its control unit.

October 3, 2013 8 | P a g e
I. INTRODUCTION
A. Project Background
Reliable, accurate, and quality traffic data collection is the cornerstone for planning, developing andmanaging an effective transportation system. Caltrans District 2 currently maintains a census program thatcollects vehicle volumes and classification counts per Federal Highway Administration (FHWA) trafficmonitoring data collection guidelines and standards. The current system is limited in its ability to relayand disseminate the data in a timely, efficient, and widely accessible manner that can be useful to theShasta Regional Transportation Agency (SRTA) and partner agencies for planning activities. Withanticipated future growth in the South Central Urban Region (SCUR), the SRTA and Caltrans District 2 (D2)desire to develop a vision for a data collection system that would provide accurate, timely, and reliabledata. This system will be crucial for use in planning, developing, and managing the transportation systemthroughout the County; now and into the future. The purpose of this implementation plan is to detail theexisting data collection system and processes, identify stakeholder needs and goals, present an evaluationof data collection tools and technologies, and identify potential system deployment strategies andapproaches through specific projects.
B. Study Area
1. SOUTHCENTRALURBANREGION(SCUR)
The SCUR is the region surrounding and including the urban centers of Redding, Shasta Lake, andAnderson. It stretches north-south along I-5 from just north of Mountain Gate to the Shasta/TehamaCounty Line. The eastern border is just beyond Palo Cedro, Bella Vista and Jones Valley while the westernborders are just west of Old Shasta and Centerville. The major freeway backbone for the entire region isInterstate 5. California State Routes 44 and 299 are the primary east-west corridors. Figure 1 below showsa map of the SCUR with all three of Shasta County’s urban centers highlighted.
2. GATEWAYS
Shasta County has seventeen points of entry/exit by which vehicles travel to and from the County. For thepurposes of this study and based on discussions with Caltrans and SRTA, the following locations wereidentified as the main urban gateways by which the vast majority of vehicles enter and exit the SCUR. Allgateway references in this document will be in reference to the locations below. The gateways locationsare displayed in Figure 1 below.
Gateway 1: Highway 299 west of French Gulch Road;Gateway 2: Interstate 5 south of Fawndale Road;Gateway 3: Highway 299 east of Dry Creek Road;Gateway 4: Highway 44 east of Deschutes Road; andGateway 5: Interstate 5 north of Bowman Road.

October 3, 2013 9 | P a g e
Figure 1: Shasta County SCUR

October 3, 2013 10 | P a g e
C. Real-Time Data Collection Background
A real-time data collection system provides benefits that can be realized by agencies as well as roadwayusers. For agencies, this can provide a source for more frequent traffic data to provide bettertransportation planning; faster incident detection, response and clearance; the ability to monitor trafficflow on alternate routes; faster analysis and resolution of traffic flow issues; and performance monitoring.For users, this means improved safety, reliable travel time data, and reduced congestion.
Real-time data collection systems can vary in data collection and output capabilities depending onstakeholder data requirements. For purposes of this project and pertinent to District 2 and SRTA, the real-time data collection system is needed to provide frequent access to traffic data within the SCUR including
volume, speed, and origin/destination data at gateways and otherkey points within the SCUR. This would consist of a system that wouldcontinuously collect data and compile it once a quarter or as needed.These counts would primarily be used for planning and trafficmodeling purposes. For purposes of this document, the proposedsystem will be referred to as an Integrated Traffic Data CollectionSystem. An Integrated Traffic Data Collection system is one thatprovides accurate and current traffic data for planning purposes aswell as a means for making traffic operations more efficient.
Below is a discussion of the benefits that an integrated traffic data collection system would provide tostakeholders.
1. AGENCYBENEFITS
Accurate and timely traffic data benefits transportation planners and traffic engineers. Transportationplanners benefit from reliable and current vehicle data to model impacts on the region. Traffic engineerscan utilize lane-by-lane freeway and on-ramp data to pinpoint areas of recurring congestion, collect trafficdata to measure levels-of-service, and measure increasing congestion levels that may warrant rampmetering. Having access to relevant traffic data can also enable engineers and planners to respond to andresolve issues quicker and help them create proactive solutions that address likely traffic issues beforethey happen.
Integrated data collection and distribution coverage across multiple jurisdictions is critical in providingvehicle traffic data that is relevant and useful. While agencies do not need to use the same technologies,having communication protocols for sharing information can be critical to maintaining consistent andreliable information amongst data users. An enhanced data collection and dissemination systemdecreases the amount of time required to process and distribute data, and will provide an ability to shareinformation across multiple communication platforms with several options for automated data collectionand sharing between agencies.
Many of the benefits of enhanced data collection provide indirect benefits that address SRTA’s regionaltransportation goals. The SRTA 2010 Regional Transportation Plan identifies the following expectedbenefits of integrating ITS into the transportation network:
An Integrated Traffic DataCollection System is one thatprovides accurate and currenttraffic data for planningpurposes as well as a meansfor making traffic operationsmore efficient.

October 3, 2013 11 | P a g e
· Improved Safety – Accurate and reliable traveler information will reduce secondary accidents.· Improved Emergency Response – Detect incidents quicker.· Improved Commercial Vehicle Operations – Increased availability of commercial vehicle traffic
data to help identify measures to improve movement of goods throughout the region· Increased Travel Information and Trip Enhancement – An enhanced data collection system will
position the region for future deployment of accurate and reliable traveler information thatdrivers will demand.
· Improved Interagency Communications – Data is easily shared and accessed by multiplepartner agencies.
· Reduced Congestion – Fuel consumption and greenhouse gas emissions are reduced.· Increased Economic Activity – Better mobility through the region will improve economic
activity.
Many of these anticipated benefits will be achieved by providing an enhanced data collection system thatallows for transportation planning professionals to realize these benefits.
2. USERBENEFITS
An expanded data collection system will ultimately provide benefits to users through more-informedtransportation planning. Traffic congestion occurs whenever vehicle demand nears or exceeds thecapacity of a roadway. Traffic congestion is generally characterized by reduced speeds, increased traveltimes, and vehicle-hours of delay. Traffic congestion has economic and environmental impacts, whether inmetropolitan or rural areas. Traffic delays, due to saturated demand or incidents, waste time and fuel,which are quantifiable in both dollars and greenhouse gas emissions.
When transportation planning agencies have better data for modeling, growth strategies are moretangible and pertinent. Users will see relevant expansion in the transportation network and infrastructureas a result of using more current data for development strategies. Purposeful planning will mitigatecongestion, enhance user mobility throughout the region, get people and goods to their destinationsfaster, and allow people to spend more time at their destinations; rather than in traffic.
D. Stakeholder Needs and Objectives
In order to understand and document gaps in the existing data collection system, stakeholder needs andobjectives must be clearly defined. A workshop was conducted with Caltrans District 2 and SRTA staff todiscuss and prioritize overall data collection goals and objectives. While District 2 currently provides a fullysufficient, up-to-date traveler information system by utilizing Closed Circuit Television (CCTV) cameras,Changeable Message Signs (CMS), and Highway Advisory Radio (HAR); the overall goal of stakeholders atthis time is to plan for an accurate, timely, and reliable data collection system that collects, compiles anddistributes vehicle traffic information on the highway system within the urban region of Shasta County.According to stakeholders, there currently is not a need to develop a traveler information system thatprovides congestion levels and travel times/speeds, based on Traffic Monitoring Stations (TMS), althoughthis would be desirable when the region experiences sustained congestion levels. Periodic evaluationsshould be made as the region’s growth and congestion increase to identify when it will be needed.

October 3, 2013 12 | P a g e
The discussion below consists of a summary of the stakeholder needs as determined by stakeholder inputin the workshop. Following each need is a discussion of the desired uses and applications that would beprovided if or when the needs are met. The recommended data applications or processes are categorizedto highlight whether they are applicable to transportation planning or highway operations activities.
TransportationPlanning:
For long-term planning and performance monitoring purposes, a more expansive network of frequentlyupdated vehicle data collection that captures and reports traffic volume data on a regular basis will allowSRTA and Caltrans Planning accurate historical data for project and economic development, regionalconnectivity, traffic impact analyses, traffic demand modeling, and mobility trends. There is also a desireto collect on, off, and through counts at each major interchange along I-5. Additional volume dataincludes vehicle classification counts and vehicle speed data. SRTA and Caltrans Planning would preferthat volume data be continuously collected and available within three to six months of collection. Theenhancement of data availability is a top priority for the various planning groups, and a system where therequired data is collected in conjunction with efficient data processing is an objective that will increase theplanning capabilities of all agencies.
District Directive DP-09 outlines the requirements for planning and implementing a ramp meteringprogram and sets ramp metering implementation levels based on mainline peak vehicle density. Underthis Directive, District 2’s Office of System Planning is tasked with forecasting when ramp meteringimplementation will be required. Although ramp metering throughout the SCUR and District 2 is notwarranted at this time, Caltrans needs to monitor the progress of growth in vehicle density along theregion’s freeways. Ramp metering preparation would be achieved through an expanded data collectionsystem. In line with providing for future ramp metering, a District 2 policy requires that all newinterchanges must be designed to accommodate metering. Currently, one ramp meter was installed inRedding in 2010 at the Dana Drive on-ramp to westbound CA-44, but this ramp meter is inactive becausetraffic volumes and delay to not warrant ramp metering.
HighwayOperations:
Caltrans has identified a future need to collect and display real-time volume data on I-5 and select countgateways when recurring congestion duration increases. At that time, Caltrans would like to increase thevolume data collection frequency and availability in order to monitor – in real-time – traffic conditions toproactively detect incidents and minimize response and lane closure times. An expanded trafficmonitoring system would increase the granularity of vehicle data collected along each corridor. Trafficmonitoring systems used for congestion monitoring utilize TMS that continuously collect on, off, andthrough counts at each major intersection. A central system automatically polls and retrieves the datafrom the TMS. Highway operations could benefit from the ability to monitor volumes on detour and
Need #1: Make volume data more frequently available, at more locations, and at shorter time intervals.

October 3, 2013 13 | P a g e
alternate routes resulting from both recurring and non-recurring congestion and/or construction byhaving up-to-date traffic data on interchanges that can be used for such detours.
Volume data along the freeway mainline and at on-ramps and off-ramps is crucial to operating a rampmetering program. As mentioned in the Transportation Planning discussion above, ramp metering is notcurrently warranted throughout the SCUR and District 2. However, because there is a potential need forramp metering in the future, Caltrans desires an expanded data collection and traffic monitoring systemthat will accommodate a ramp metering program in the future.
TransportationPlanning:
One of the highest priorities for both SRTA and Caltrans’ System Planning is to report interregional,intraregional, and local origin and destination travel patterns. This need is particularly crucial as gatewaysare the most important factor to the planning activities related to the Sustainable Communities andClimate Protection Act of 2008 (Senate Bill 375) and other funding considerations. A system that cancollect and export O&D information would aid in establishing trend lines in goods movement, GHGemissions, and prevailing traffic patterns on an annual, seasonal, and daily basis. O&D monitoring wouldhelp analyze weekday versus weekend traffic trends and can validate regional transportation planningprojections and development. This O&D system would include select County gateways and SCURgateways. Monitoring the county gateways is important in understanding the overall traffic patterns as itrelates to the surrounding counties. The need to monitor SCUR gateways is of high importance forplanning agencies in order to gain a more focused understanding of the urban region’s traffic patterns,since the SCUR is where the heaviest vehicular traffic occurs and where approximately 85% of the region’spopulation lives.
HighwayOperations:
An Origin and Destination system has not been identified as a need by the Highway Operationsstakeholders at this time.
TransportationPlanning:
There is a desire by SRTA for a reporting system that would allow for easy access to data and would beuser friendly. The reporting tool would allow users to readily access current traffic data and makeconclusions on capacity, demands, and problem locations. Evaluation tools are desired in order to allow
Need #2: Implement a tool to provide interregional, intraregional, and local Origin and Destination(O&D) trip information.
Need #3: Create and implement tools to best utilize the existing traffic data collection system.

October 3, 2013 14 | P a g e
planning agencies to identify when roadways will exceed capacity as it relates to both historical and real-time trends. Such tools would help to identify bottleneck locations throughout the region.
Another tool that SRTA has expressed a need for is one that would allow users – whether SRTA staff or thelocal public agencies – to query data for customized transportation-related reports. This data tool wouldmaximize system flexibility and applicability to multiple department/ agency needs and desires. It wouldalso reduce custom requests made to District staff members, standardizing the process for howtransportation planning data is distributed to consultants and the general public.
Lastly, the District has the need to archive and distribute traffic information such as delay, travel time,speed, volume, and congestion levels. This need stems from the desire to quantify the effects of capacityconstraints, recurring and non-recurring congestion, and construction. An archiving and reporting systemis necessary to create a historical database that enables planning agencies to access and define regional-specific and region-wide travel behavior.
HighwayOperations:
A system that monitors real-time delay and congestion levels is desired by the District, but not until somepoint in the future when recurring congestion is more prevalent in the SCUR during longer peak periods.This tool would quantify the effects of capacity constraints and provide users with real-time information tomake informed route decisions when traveling. In the future, the need for a short messaging service (SMS)has been expressed. Once recurring congestion is prevalent, SMS would provide the capability for theTMC or other operational staff to alert emergency responders when necessary; this would minimizeresponse and blockage time and reduce congestion on travel ways.
Because of annual winter weather delays due to the closing of Interstate 5 north of Redding, a key desireby the District is a travel time tool specifically for when inclement weather forces speeds to drop on I-5and/or when weather requires partial closure of the freeway. Such weather-induced incidents are frequentin the Shasta region and can also be caused by summer wildfires. A tool that can alert travelers andprovide predicted delay time would help in allowing them to make informed travel decisions.
II. EXISTING CONDITIONS
A. Data Collection System
Caltrans District 2 collects vehicle census data using in-pavement loop detection, temporary tubecounters, and piezoelectric sensors (data collection technologies are described in Section IV below). Datacollection consists of volume count and vehicle classification (number of axles). There are 660 countstations district-wide; the Caltrans Census Team utilizes about 90 Diamond® counters to collect data fromthese sites.
There are several different types of traffic count data collected by the Census Team. Each type of trafficcount has a specific duration and data submittal frequency. The following list describes the existing countstations that are located within the SCUR:

October 3, 2013 15 | P a g e
· 16 permanent stations for continuous counts, known as trend counts, that remotely collect andtransmit data via dial-up or cellular modem and submitted to Caltrans Headquarters on a monthlybasis;
· 14 quarterly stations (2 of which are permanent), known as control stations, have seven-day countdurations collected four times per year, once every three years;
· 18 profile counts are collected for one week every three years;· 92 ramp counts are collected for two weeks every three years; and· 14 classification stations, used to classify vehicles by number of axles, are completed in a seven
day period on a yearly basis.
Appendix A is a map that shows the locations of these existing count stations.
Caltrans deployed two permanent test sites of Microwave Vehicle Detection System (MVDS) stationsalong I-5 near Knighton Road. These MVDS stations are not currently operational due to integration anddata validation concerns by Caltrans District 2. Caltrans District 2 does not have any Traffic MonitoringStations (TMS) within the SCUR.
All existing census stations are fully operational, with the exception of several stations along I-5 that arecurrently being reinstalled due to construction. When operational issues with a station are identified, stepsare immediately taken to solve the issue.
The majority of the existing permanent stations utilize dial-up modems for communications, thoughseveral utilize cellular modems. District 2 currently utilizes a combination of wireless microwave and dial-up for existing CCTV cameras, and is in the process of enhancing its communication network through theuse of a licensed microwave wireless network. Caltrans has plans to install a fiber optic backbone cablealong Interstate 5; construction is estimated to be completed by 2016.
There are instances where the District receives requests for counts at a specific area in a specific timeframe. These counts, known as Special Count Requests, are done on an as-needed basis and aresubmitted to the party of interest. All count data (except Special Count Requests) is submitted to CaltransHeadquarters as it is collected.
Caltrans District 2’s Census Team employs a mix of standard federal, state, and District specific datacollection procedures and practices. The Census Team works year-round to collect and process trafficdata, and make it available for use by the public and other agencies. As a guideline for Annual AverageDaily Traffic (AADT) volume data collection and reporting, the Census Team has referred to the “Update ofGuidelines and Operating Procedures for the Traffic Volumes Program” report created by CambridgeSystematics. The report details statewide procedures on traffic counting and Transportation SystemNetwork (TSN) data management; however, according to the District 2 Census Coordinator, this reportdoes not serve as a strict manual for the District as they have implemented other District-specificprocedures that have been in effect for many years. The Census Coordinator has created informaldocuments for certain steps of the traffic volumes program, but none of these documents have beenstandardized or compiled into a single, official operating procedures manual. Since there are no officialdocumented procedures for collecting traffic, a separate Policy and Procedure Manual has been developedin conjunction with this Implementation Plan.

October 3, 2013 16 | P a g e
Depending on data collection locations, field visits are required to deploy equipment or download data.For non-permanent count stations, the Census Team travels to the station and deploys a counter thatcollects the traffic data. The counter collects data for one week and is then retrieved by the Census Teamto extract the data and download it using traffic count software. In some cases, such as for quarterly countstations, road tubes are installed instead of permanent counting devices. The Census Team deploys bothtubes and counters for a designated duration before retrieving the equipment and downloading thetraffic data. For permanent stations collecting trend counts, the Census Team has the capability ofcollecting the data in one of two ways: in-field connection or dial-up modem connection. Either methodwill download the data without the need to deploy counters, since counters are permanently installed atthese locations. The former method requires a physical connection to the station’s controller while thelatter can be done through remote connection with the Census office at Caltrans District 2. For ease andconvenience, the Census Team utilizes the remote connection method; however, should a connection beunstable and data is not polled correctly, the team troubleshoots in the field and downloads the countdata through direct connection. Both methods use Diamond’s TT-Link program to communicate with thecount station, retrieve the count data, and convert the data into useable files.
Caltrans District 2 maintains and manages the Loop List database in Microsoft Access which documentsvarious attributes for all census locations within the District, including those within the SCUR studyboundary. The database stores general roadway information including route number, postmile,latitude/longitude, elevation, roadway type, number of lanes, primary direction, and location description.The database also documents count station details, such as site number, leg, station type, detector type,pull box postmile, number of loops, description, other notes, as well as maintenance log, pictures,sketches, land maintenance date, and year of installation.
Though existing census station information had not previously been mapped using ArcGIS, this projecthas created a GIS shapefile for existing District 2 census stations based on the information provided in theLoop List database in Microsoft Access. Mapping of existing census stations was achieved through the useof latitude/longitude coordinates (decimal degree format) in the Loop List Access database and based oninput from District 2's Census Team. The projection isNAD_1983_HARN_StatePlane_California_I_FIPS_0401_Feet. With this shapefile, SRTA and Caltrans will havea mapping tool to continuously build upon the existing data collection infrastructure as it expands overtime. This data is compatible with other county ArcGIS data formats and spatial projects. The GIS spatialdata can replace the previous Microstation census station map.
B. Data Processing
Once the traffic data has been downloaded, data processing begins. The Census Team follows aprecedent of undocumented procedures for processing collected count data in order to meet FederalCensus data requirements. These processes have been refined throughout the years by the current CensusCoordinator to improve data collection efficiency. When data is extracted from the counters, it is in theform of classification and count files (CLS and CNT file extensions). Sensor misses and errors are placed inseparate files. The Census Team primarily uses Diamond’s Trafman, a DOS program, and converts the datafrom Diamond’s native file format by downloading the data from the counters into VCR files(classification) and ID/DAT files (volume). VCR and ID/DAT files are sent to Caltrans Headquarters wherethey are uploaded into the Caltrans TSN. Classification files are sent to headquarters first since these files

October 3, 2013 17 | P a g e
exclude vehicles that could not be classified due to sensor error. Volume files are sent separately andinclude all vehicles regardless of classification and therefore provide a true volume count. Volume figuresfrom these ID/DAT files will update and override volume figures from previously submitted VCR files.Upon receiving these files from the District, Headquarters uploads them into TSN. If an uploading erroroccurs, the Census Team is alerted through email and begins troubleshooting. The combination of bothVCR and ID/DAT files in TSN provides a comprehensive and accurate reporting database.
Typically, vehicle count data is available in TSN within 6 weeks from when the counts are conducted. Asummary of the tasks that must take place over this time period are as follows:
1. Caltrans District 2 staff manually retrieve the data from all non-permanent and permanent countstations;
2. Caltrans District 2 staff manually compiles the data and sends to Caltrans Headquarters; and3. Caltrans Headquarters’ staff posts data to TSN.
Based on conversations with Caltrans District 2 staff, the data collection and processing operates asefficiently as possible given current staffing levels and equipment.
Along with actual count data collection processing described above, District 2 follows a set schedule forfirst and final rounds of AADT submittals, and ramp and truck AADT updates. From October to January,the Census Team quality checks the information that was placed into TSN from the previous fiscal year.Data from Diamond counters are compiled into an Excel spreadsheet using Centurion. Centurion is atraffic management program from Diamond similar to Trafman, but on a Windows platform rather thanDOS. The Census Team compares the spreadsheet data with the TSN data for accuracy. Corrections aremade to the TSN data if necessary. By mid-January, the traffic data is used to create the first draft of theAADT Report due to Caltrans Headquarters. By March, the final report is submitted, where it is passedonto Federal agencies that make them available for public use.
C. Data Storage and Reporting
1. TRANSPORTATIONSYSTEMNETWORK
The Transportation System Network (TSN) is a system that integrates traffic volumes, incidents,performance monitoring, and pavement management into a single application. Historical data is storedand can be queried by users to develop customized reports that are compatible with MS Office programs.Data reports can include daily and hourly summaries as well as volume rankings for any user-defined timeperiod and data collection station within the system.
Caltrans heavily relies on this data for historical analysis and planning purposes, but the data is nottypically available until Headquarters further validates the data and posted it in the TSN database.Typically, the time period between collecting the data from the field to the posting of data on TSN isabout 6 weeks.
SRTA does not currently have access to data posted on TSN. Instead, SRTA must either wait for data to beposted on PeMS, use published AADT reports (which are only posted on a yearly basis), or make special
October 3, 2013 18 | P a g e
requests for data from Caltrans District 2. Due to staffing and other workload constraints, special datarequests strains District 2's already restricted resources.
2. PeMS
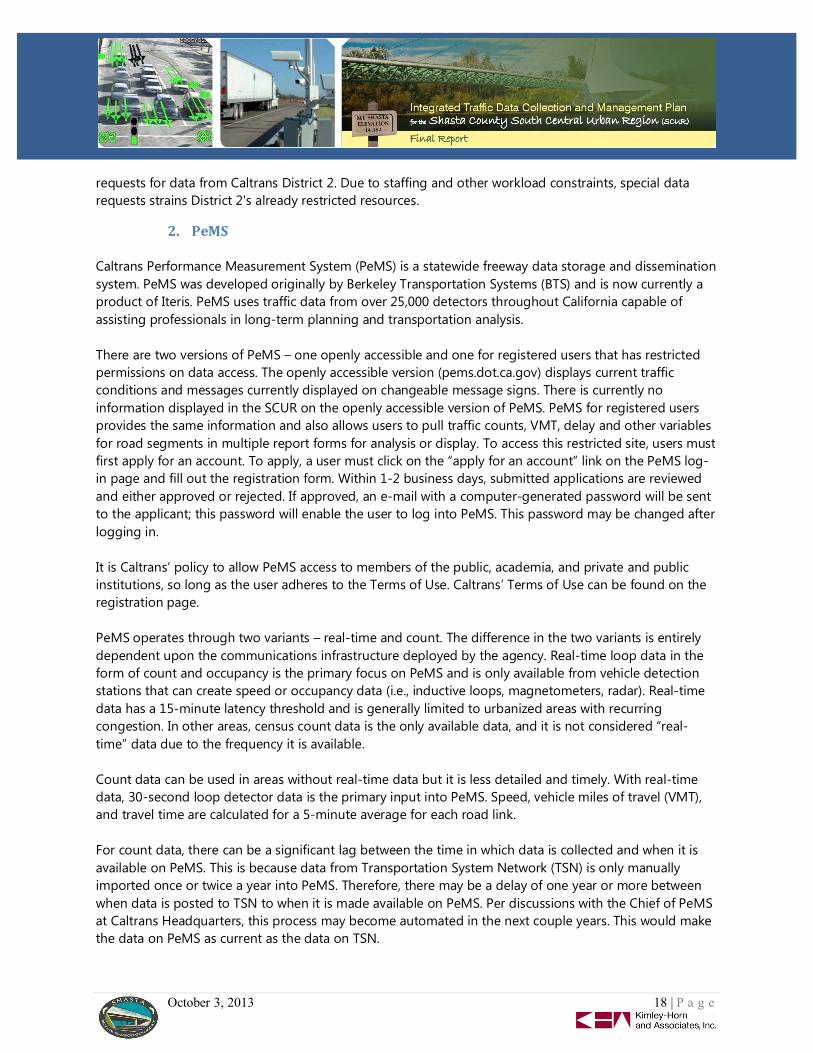
Caltrans Performance Measurement System (PeMS) is a statewide freeway data storage and disseminationsystem. PeMS was developed originally by Berkeley Transportation Systems (BTS) and is now currently aproduct of Iteris. PeMS uses traffic data from over 25,000 detectors throughout California capable ofassisting professionals in long-term planning and transportation analysis.
There are two versions of PeMS – one openly accessible and one for registered users that has restrictedpermissions on data access. The openly accessible version (pems.dot.ca.gov) displays current trafficconditions and messages currently displayed on changeable message signs. There is currently noinformation displayed in the SCUR on the openly accessible version of PeMS. PeMS for registered usersprovides the same information and also allows users to pull traffic counts, VMT, delay and other variablesfor road segments in multiple report forms for analysis or display. To access this restricted site, users mustfirst apply for an account. To apply, a user must click on the “apply for an account” link on the PeMS log-in page and fill out the registration form. Within 1-2 business days, submitted applications are reviewedand either approved or rejected. If approved, an e-mail with a computer-generated password will be sentto the applicant; this password will enable the user to log into PeMS. This password may be changed afterlogging in.
It is Caltrans’ policy to allow PeMS access to members of the public, academia, and private and publicinstitutions, so long as the user adheres to the Terms of Use. Caltrans’ Terms of Use can be found on theregistration page.
PeMS operates through two variants – real-time and count. The difference in the two variants is entirelydependent upon the communications infrastructure deployed by the agency. Real-time loop data in theform of count and occupancy is the primary focus on PeMS and is only available from vehicle detectionstations that can create speed or occupancy data (i.e., inductive loops, magnetometers, radar). Real-timedata has a 15-minute latency threshold and is generally limited to urbanized areas with recurringcongestion. In other areas, census count data is the only available data, and it is not considered “real-time” data due to the frequency it is available.
Count data can be used in areas without real-time data but it is less detailed and timely. With real-timedata, 30-second loop detector data is the primary input into PeMS. Speed, vehicle miles of travel (VMT),and travel time are calculated for a 5-minute average for each road link.
For count data, there can be a significant lag between the time in which data is collected and when it isavailable on PeMS. This is because data from Transportation System Network (TSN) is only manuallyimported once or twice a year into PeMS. Therefore, there may be a delay of one year or more betweenwhen data is posted to TSN to when it is made available on PeMS. Per discussions with the Chief of PeMSat Caltrans Headquarters, this process may become automated in the next couple years. This would makethe data on PeMS as current as the data on TSN.

October 3, 2013 19 | P a g e
Data is shown primarily through a map-based GUI for both users. For professional users, PeMS includes abuilt-in table with graphing tools as well as multiple export options. Users can navigate through PeMS’options to find specific data on field elements that exist on a freeway. Elements such as controllers,stations, detectors, and traffic census stations are listed for each freeway and includes data such as postmile, element ID, type of station (e.g. mainline or on-ramp), and what data the station collects (e.g.volume or classification). By clicking on a specific station ID, users are brought to a summary page wherethey can view station details including the installation date, sensor type, and retrieval method. Largearchived data sets can be downloaded for modeling and statistical analysis. For instance, volume data canbe retrieved and manipulated to report the information through time-space diagrams, time-seriesdiagrams, time-of-day, time-of-week, or hourly counts. Other versions of the data can be exported toshow the data as a plot, a table in a web browser, a text file, a CSV file, or a “flat file” (real-time data only)which contains data that has gone through a data clearinghouse.
Not all field elements in a particular freeway will have all the data that PeMS is capable of providing. Theavailability of detailed data on specific field elements depends on factors that include the elements’health, the frequency that data is polled from the field element, and the frequency that the data isuploaded to PeMS. The accuracy and usefulness of PeMS data is highly dependent on the completenessof data being collected in the field and processed. PeMS has an adaptive g-factor algorithm to provideaccurate speed estimates but does not include other error checking algorithms or error flagging tools.Users require instruction and training to understand how to navigate PeMS and to apply the dataaccessed through PeMS.
3. CALTRANSWEBSITE
The Caltrans District 2 website (dot.ca.gov/dist2/) currently offers several maps with travel information inthe region. Information provided via the District 2 website includes lane closure information, incidents,CMS messages, CCTV camera still shots, and chain control requirements. Data is updated on the websiteapproximately every 5 minutes.
There are also links to the following:· Caltrans Highway Information Network (CHIN) – This interactive map provides a summary of
traffic alerts (e.g., road construction, chain requirements) along each state corridor for the entirelength of the corridor. This information can be a little tedious for a corridor such as I-5 which runsthe entire length of the state. This information cannot be exported separately from the website.
· Traffic Cameras and Road Weather Information – This interactive map provides locations of CCTVcameras and RWIS stations. When clicked, a pop-up window displays a camera image andweather information (where applicable). This information can be exported separately from thewebsite using specific export feeds.
· CMS Messages – An interactive map provides locations of CMS. When clicked, a pop-up windowdisplays current messages displayed on a sign. This information can be exported separately fromthe website using specific export feeds.
October 3, 2013 20 | P a g e
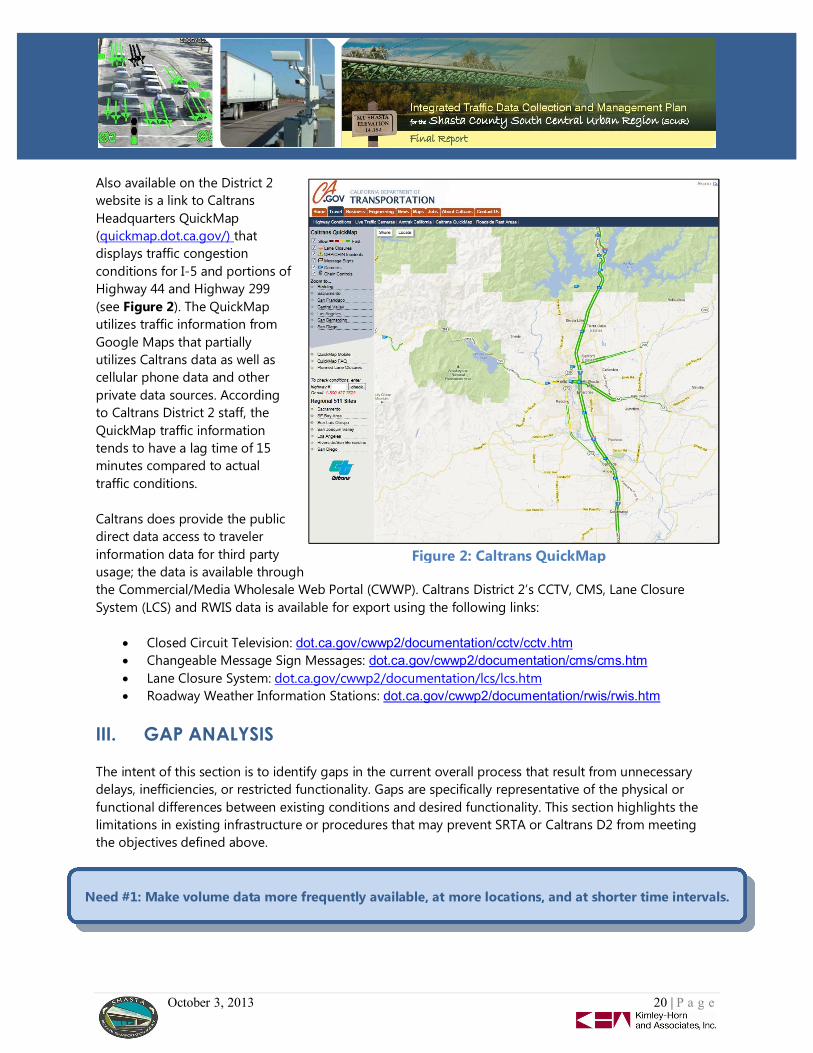
Also available on the District 2website is a link to CaltransHeadquarters QuickMap(quickmap.dot.ca.gov/) thatdisplays traffic congestionconditions for I-5 and portions ofHighway 44 and Highway 299(see Figure 2). The QuickMaputilizes traffic information fromGoogle Maps that partiallyutilizes Caltrans data as well ascellular phone data and otherprivate data sources. Accordingto Caltrans District 2 staff, theQuickMap traffic informationtends to have a lag time of 15minutes compared to actualtraffic conditions.
Caltrans does provide the publicdirect data access to travelerinformation data for third partyusage; the data is available throughthe Commercial/Media Wholesale Web Portal (CWWP). Caltrans District 2’s CCTV, CMS, Lane ClosureSystem (LCS) and RWIS data is available for export using the following links:
· Closed Circuit Television: dot.ca.gov/cwwp2/documentation/cctv/cctv.htm· Changeable Message Sign Messages: dot.ca.gov/cwwp2/documentation/cms/cms.htm· Lane Closure System: dot.ca.gov/cwwp2/documentation/lcs/lcs.htm· Roadway Weather Information Stations: dot.ca.gov/cwwp2/documentation/rwis/rwis.htm
III. GAP ANALYSIS
The intent of this section is to identify gaps in the current overall process that result from unnecessarydelays, inefficiencies, or restricted functionality. Gaps are specifically representative of the physical orfunctional differences between existing conditions and desired functionality. This section highlights thelimitations in existing infrastructure or procedures that may prevent SRTA or Caltrans D2 from meetingthe objectives defined above.
Need #1: Make volume data more frequently available, at more locations, and at shorter time intervals.
Figure 2: Caltrans QuickMap

October 3, 2013 21 | P a g e
Gap #1: Majority of count stations are non-permanent and do not collect continuous counts.
The current census data collection infrastructure is built to meet the requirements of the federallymandated Census Program. Under that program, much of the volume data is only required to be collectedevery three years for a short period of time, but the stakeholders need more recent data (preferably 3-6months old). Currently, there are only two Census staff members responsible for the entire process ofcollecting, processing and reporting census data. The Census Team has developed an efficient process toquicken the various tasks required; however, a large amount of time is still spent manually collecting datafrom every count station. Non-permanent stations require the team to physically set up Diamondcounters to poll data, while downloads from permanent stations can be initiated from the Census office.Though permanent stations don’t require extra time to manually deploy and retrieve counters, the processcan still be optimized by implementing a system where the need to manually poll data by phone isbypassed. The manual data collection nature of non-permanent count stations is preventing the Districtfrom more efficiently collecting volume data. However, the District has been limited in deployingpermanent stations due to the initial costs of permanent stations for the installation of infrastructure andequipment as well as the recurring costs for maintenance, power, and communications.
Given the limited staffing and extensive duties, there is very little room to expand or optimize the existingdata collection process. Any addition of new data collection stations or increasing the frequency of datacollection to meet the stakeholder’s data needs is beyond the current staffing capabilities. Upgradingnon-permanent count stations with permanent counters or controllers will reduce the amount of fieldwork required for the Census Team and help the stakeholders achieve the need for more frequentlyavailable data.
Gap #2: Lack of permanent count stations installed at locations where data is most desired.
The District lacks permanent count stations that can continuously poll data between major interchangesalong I-5, such as between Knighton Road and South Bonnyview Road, Route 44 and Route 299, Route299 and Twin View Boulevard, Oasis Road and Pine Grove Avenue, and Pine Grove Avenue and Route 151.Since the need to regularly capture volume data between interchanges and at ramps is a priority for theDistrict, it is necessary to analyze the current count station locations and fill in gaps where inventory islacking.
Gap #3: Limited communication network to allow for regular polling of data.
The current configuration of the vehicle count infrastructure cannot be utilized for providing continuousdata. There is currently no direct data dissemination to a Traffic Management Center (TMC) or AdvancedTraffic Management System (ATMS). Since data collection is currently done through on-site datadownload, periodic data collection, or dial-up (cellular or telephone) download, the system cannotprovide frequent data without further investment in communications equipment. Dissemination of datawould need to occur through direct network communication – private wireless, direct fiber line, integratedservices digital network (ISDN) telephone or a private cellular network are all options. As part ofupgrading existing non-permanent count stations, these locations should be equipped with acommunication device in order to provide more frequent, continuous data. However, as it is already aconstraint to Caltrans District 2, installation and recurring costs of an expanded communication network
October 3, 2013 22 | P a g e
will remain a key factor in deployment of an expanded data collection system. Communication solutionswill need to be evaluated on a location by location basis to determine which will best serve the needswhile not being cost prohibitive.
Gap #4: There is no equipment to track traffic into, out of, and within the County.
Currently, there are classification stations throughout District 2 that provide some information on vehiclemovement by type of vehicle throughout the County. Unfortunately, this data only consists of volumecounts and does not provide the granularity of origins and destinations. Permanent data collectionstations are not able to collect O&D data nor is there a central data processing system that candisseminate O&D data. Specialized data collection stations with the ability for continuous communicationmust be deployed to provide continuous O&D data needed by SRTA and Caltrans planning groups. Thistype of tool will be essential to SRTA for calibrating and validating their traffic modeling in the future. Thiswill assist SRTA in tracking and showing progress toward meeting passenger vehicle greenhouse gasemissions reduction targets.
Gap #5: There is no central system for reporting traffic data into, out of, and within the County.
Caltrans currently conducts manual data collection of origins and destinations to determine the flow ofvehicles and goods. If origin and destination data is collected by field equipment, a central database andreporting system is needed to archive the data and enable users to generate reports.
Gap #6: There is no Advanced Traffic Management System (ATMS) that can monitor real-timecongestion levels, detect incidents, or convey regional travel time impacts due toinclement weather conditions.
The current system has the ability to display travel information, incident warnings, and other messages onthe District’s existing changeable message sign (CMS) network. CMS are manually activated andcontrolled by the TMC operator as needed. There is currently no ATMS deployed in District 2 that canautomatically compare real-time and historical data to anticipate and alert when congestion or incidentsoccur, though IRIS (Intelligent Roadway Information System), an open-source ATMS is anticipated to bedeployed in District 2. No exact deployment date is scheduled at this time. This is currently a low priorityto stakeholders.
Need #2: Implement a tool to provide interregional, intraregional, and local Origin and Destination(O&D) trip information.
Need #3: Create and implement tools to best utilize the existing traffic data collection system.

October 3, 2013 23 | P a g e
Gap #7: No direct way for outside agencies to query or compile reports until data is posted toPeMS.
PeMS is a powerful tool to gather information; however, data querying is only possible if the data hasalready been posted by the collecting entity. Since Caltrans’ data processing and procedures can take asignificant amount of time to post to PeMS, agencies interested in the data need another source forrequesting data that is more frequent. Caltrans Headquarters has indicated that PeMS does notautomatically pull census information from TSN (although this feature is a currently planned Caltransproject). Instead, the data must be manually transferred and uploaded into PeMS after the data isvalidated in TSN using outdated legacy software. The data is manually downloaded to PeMS only once ortwice a year. This process may add six to twelve months of delay on top of the required time to collectand validate the census data.
The time it takes to process data into PeMS should be decreased, or a program/interface upgrade shouldbe developed for minimal cost to assist in processing the data to streamline and speed up this process.However, as Caltrans Headquarters manages PeMS, improvements to PeMS allowing for better integrationof available count data into PeMS is outside of the control of the individual Caltrans Districts. Improvingaccess to traffic data will require either Caltrans Headquarters to upgrade to PeMS to automaticallydownload data available in TSN and make it faster or for a separate reporting system to be created tocompile and allow for all of Shasta County to access data through a separate portal.

October 3, 2013 24 | P a g e
IV. SYSTEM EVALUATION AND FEASIBILITY
Within the industry, there are many different approaches to collecting, processing, reporting anddisseminating data collected by field equipment. The tools are internal or external systems and vary in thetype of information provided, accessible formats, and granularity. This section presents various tools thatare utilized within the industry.
A. Data Collection System
There are many technologies available for collecting traffic data. The technologies presented in thissection include innovative technologies as well as well-established technologies. Some of the real-timedata collection applications are already utilized within Shasta County; others are emerging in the industry.Each application includes a discussion of the system architecture, data elements collected, validationprocesses, system performance, data analysis, and dissemination methods that should be considered.
Many of the technologies are able to provide several types of vehicle detection data. The following is a listof the various types of detection parameters that are considered in this evaluation:
· Presence – Whether or not an object is present.· Volume – The number of vehicles passing a particular point.· Vehicle Occupancy – The amount of time a vehicle remains in a detection zone.· Speed – The instantaneous speed of a vehicle as it passes a detector.· Classification – The type of vehicle classification (e.g., truck, car, motorcycle). Some technologies
determine the length of a vehicle (radar, video) while others determine the number of axles avehicle has (loops, magnetometers).
· Incident – Identification of an incident based on detected changes in traffic flow.· Origin and Destination – Determination of where a vehicle enters and leaves the roadway
network.
The basis for the cost estimates presented within each vehicle count technology discussion, exceptLicense Plate Readers, assumes construction costs for the installation of a mainline count station in onedirection with two detector loops per lane for three lanes. The License Plate Reader costs account forcovering six lanes of traffic (three in each direction), to capture vehicles into and out of the region at agateway. Estimated operations and maintenance costs per detector location are presented. Costs alsoassume a new controller and cabinet, but the costs do not account for conduits or conductors for powerand communication. The costs also do not include system integration costs or other necessary costs likemetal beam guard rail to protect new device installations. In Section V: Plan Implementation of thisdocument, all project considerations including capital improvement costs, cost of providing power,operations and maintenance, and project development will be presented and considered for potentialprojects.
A table summarizing the technologies below can be found in Appendix B. The table presents the majoritems to consider when choosing a technology that best fits the needs of SRTA and Caltrans. Low,

October 3, 2013 25 | P a g e
moderate, and high values represent the order of magnitude compared to other technologies. Thefollowing bullet points describe the bases accounted for in each category:
· Accuracy - The closeness of measured data to actual values.· Calibration Difficulty – The ease of adjusting the technology so it accurately collects data.· Maintenance Frequency – The frequency of which devices must be cleaned, recalibrated, or
replaced due to general operations wear-and-tear.· Verification Frequency – The frequency at which the data from a technology will have to be
checked and validated to ensure data collected is accurate.· Integration Difficulty – The difficulty to integrate the data collected by the technology into an
existing data collection system. Technologies that have widespread use in industry, like those thatinterface with detector cards, are relatively quick to integrate due to established standards for use.Technologies that are currently deployed by other Caltrans Districts may allow for easierintegration since interface tools could be shared with District 2. Other technologies, like ALPR andBluetooth®, that are new tools for traffic data collection, will require integration of specializedsoftware. This category takes into account the time and effort required to implement, operate,and maintain the technology as well as the data collected.
· Power Supply - Whether the devices require hardwired power or are able to utilize a solar powersystem.
· Estimated Lifespan – The expected useful life of field devices based on similar deployments, aswell as information compiled from the Knowledge Resource Portal provided by the U.S.Department of Transportation Research and Innovative Technology Administration (RITA). RITAcollects and provides project information for ITS deployments throughout the U.S.
· Expected Long-Term Viability – The expectation of the technology’s normal growth anddevelopment capabilities.
· Estimated Yearly Operations & Maintenance Costs – The estimated number of staff hoursrequired each year to provide general maintenance, including any validation tasks to ensurequality data collection.
The majority of the technologies listed below will allow for count data to be seamlessly integrated withthe existing traffic data collection process currently used by Caltrans District 2. The technologies availablefor counting and classifying vehicles have previously been detailed in the, “Update of Guidelines andOperating Procedures for the Traffic Volumes Program” report created by Cambridge Systematics. Thoughthe Guidelines do not specifically enumerate accuracy requirements for traffic monitoring systems, theydo indicate error rates of most (if not all) detection technologies are less than the errors that result fromestimation calculations used in the AADT process. Therefore, the Guidelines do not directly eliminate anyparticular technology from usage. Instead, the Guidelines recommend that any detection technology mustbe evaluated based on the location conditions, since field conditions will change the accuracy of alldevices site to site. Of the technologies below, Bluetooth, RFID tag readers, GPS based traffic data wouldnot be conducive for traffic monitoring count stations because each vehicle that passes may not beequipped with appropriate sensors and thus unable to capture every vehicle for counting.

October 3, 2013 26 | P a g e
B. Technology Evaluation
1. INDUCTIVEDETECTORLOOPS
Inductive detector loops have been the industrystandard technology for detection since the 1960sand consist of a series of coiled loops placed in theroadway’s surface to create an electromagneticfield around the wire. When a metallic object (e.g.,vehicle, bicycle) passes through theelectromagnetic field of the detector loop, adisturbance is caused in the field. The loops areconnected to sensor cards enclosed in a nearbycabinet which are programmed to be triggered at apre-set threshold. Speed is typically calculated byinstalling two (2) loops twenty feet apart, thenmeasuring the time it takes a vehicle to travelbetween the loops. These readings can then be used for presence, passage, lane occupancy, and or speedmeasurements.
Since loop detector use is a very widespread and proven technology, loop detection systems are relativelyeasy to deploy and integrate. There are established standards that provide for quick implementation of aloop detector-based system that will provide highly accurate traffic data. Additionally, compared to someother detection systems, loop detection is not affected by weather and other environmental factors.However, loop detector installation does require saw cutting the roadway pavement surface, resulting inhigher installation and maintenance impacts such as lane closure, traffic control, and decreased pavementlife.
CostsLoop detectors are the most common technology for vehicle detection, but some agencies do not havesufficient staff to maintain reliable loop performance. Construction installation cost of a single freewaydetection station using inductive loops is approximately $35,000 which includes the cost of installing theloops, a controller cabinet, a dial-up modem, and controller equipment. Integration and maintenancecosts per station will not differ from what District 2 pays for their existing census stations. Currently,operations support is estimated to be 20 hours per year per location while maintenance is approximately8 hours a year per location.
FeasibilityInductive detector loops are the best and most conventional option to collect vehicle data. Thetechnology is well-developed and has already been deployed throughout Shasta County and District 2.Existing non-permanent (i.e. counter is only on-site during data collection periods) stations already havein-pavement loops and could be upgraded to permanent stations (i.e. install cabinet and counter in orderto collect data at all times) or Traffic Monitoring Stations (TMS). The use of detector loops can also bepaired with statewide infrastructure since TMS stations with loops are most commonly used. Loopdetectors are highly feasible to deploy.

October 3, 2013 27 | P a g e
This technology addresses the future potential need for a ramp metering system as well. Caltrans’ rampmetering guidelines assume the use of detector loops. These loops can replace the temporary count tubescurrently used to monitor ramp volumes. In coordination with the current ramp volume monitoringsystem, detector loops are a feasible option for ramp metering implementation.
2. RADARDETECTION
Radar detection is a non-intrusive technology that can be deployed for advance detection withoutimpacting the pavement. Radar detection relies on microwave technology to detect, monitor, andmeasure vehicle traffic without installing equipment in the roadway. There are two types of microwaveradars: continuous wave (CW) and frequency modulated continuous wave (FMCW). CW radars use theDoppler Effect to determine occupancy and speed. The radar transmits a continuous, low-energy wavethat is constant in frequency with respect to time. When a vehicle passes through the detection zone andmakes contact with the wave, it causes a shift in the frequency that is relayed back to the radar. This shiftis captured by the radar’s sensors and can be used to determine vehicle occupancy and speed. CW radarsrequire the vehicle to be in motion to be able to detect a change in frequency; therefore, stopped vehiclescannot be detected. FMCW radars emit waves that are constantly changing with respect to time. Thismethod incorporates auxiliary range measuring capabilities and is therefore able to detect motion-lessvehicles.
Though radar detection has mostly been deployed tomonitor traffic at a single point along a roadway,manufacturers are producing radar detection systemsthat are intended to replace traditional inductive loopdetectors. Radar detectors are mounted at fixedpositions and can emit waves from overhead or sidefire. A single unit can provide multi-lane coverage inone direction and has the capability to averagevehicle speeds over several lanes, but is not suitablefor lane-by-lane data. This type of sensor is generallyresistant to inclement weather; however, somemodels do have issues in heavy fog or when installedon steel bridges. Additionally, high truck volumes canreduce the accuracy of the system due to occlusion.This technology performs well for both low and high-volume counts and can be installed without laneclosures or other traffic obstruction.
CostsConstruction costs are estimated to be near $14,000 per station. Operations and maintenance costs wouldbe greater than those estimated for TMS deploying loop technology because of the higher amount ofsupport to verify the accuracy of the data collected. It would be reasonable to assume an additional 12hours total of operations and maintenance support a year per location.

October 3, 2013 28 | P a g e
FeasibilityRadar detection is a feasible option for additional count stations in areas where data is desired and doesnot exist. They can be installed along I-5 at regular intervals and could transmit data to the TMC. This typeof detector could also be used for on and off ramp volumes and replace the need to manually deploytube counters to collect the data. Installation of this technology would not require any traffic-impactingconstruction as no roadway pavement work is needed. An upgrade to the District’s central equipment andsoftware would be necessary to deploy radar. The process of collecting the data and transferring it toPeMS would require a Front End Protocol Translator (FEPT), which the District does not currently have.
Stand-alone radar stations with solar power and cellular communication are a great option for detectionlocations far away from existing power and communication infrastructure. The feasibility of this option,however, would depend on site conditions and whether or not cellular connection is available at a specificlocation.
Since radar detectors are generally weather resistant, inclement winter weather would not affect them.However, since I-5 is a major route for truck movement, high truck volumes could interfere with theaccuracy of detectors due to occlusion. Installation of radar detectors on overhead structures could beconsidered to minimize occlusion. However, overhead installation and maintenance of radar detectorswould require lane closures. District 2 has deployed microwave detectors at two test sites on I-5 that wereinstalled in the center median area to mitigate occlusion impacts, but these are not currently in use norintegrated into the existing system.
Radar detection has limited capabilities to detect classification. Although it is able to detect vehicle lengthand type, which is a form of vehicle classification, it does not automatically detect number of axles andthus does not fit all census statistics requirements.
3. VIDEOIMAGEDETECTION
Using fixed position video camerasmounted above traffic, a Video ImageProcessor (VIP) system analyzes video viaalgorithms to produce traffic data. Easy tomodify and customize, user defined zonesidentify the areas where detection is totake place. A single camera connected to aVIP is capable of providing detection overmultiple lanes, including separatedetection zones in one lane. The VIP iscapable of detecting vehicle presence,occupancy, vehicle speed, classification,bicycles, and traffic incidents. In addition,the video captured by the system can beused for traffic monitoring viewing by
October 3, 2013 29 | P a g e
City/County/Caltrans personnel. Since a VIP system is able to trigger phase selectors in the same manneras detector loops, the data provided by the VIP system should be relatively straightforward to integratewith Caltrans’ existing data collection system.
While video detection systems are capable of providing a large amount of traffic data, there are factorsthat must be considered prior to installation to ensure a reliable system. First, environmental factors likerain, snow, night, shadows and dirt on the camera lens can degrade the performance of the system bydegrading the quality of video captured. Because of the effect of environmental factors on videodetection quality, Caltrans prefers not to deploy video detection at traffic signals. Additionally, if thecamera is not installed in a place that provides optimal viewing of traffic, occlusion will prevent the systemfrom seeing all vehicles passing through the detection zone.
CostsThe cost to install a stand-alone video detection station along a freeway to collect vehicle counts,classification, or speed is on the order of $22,000. Costs could increase significantly if there is a desire todirectly view the video due to the need for a high speed data connection, although future fiber optic cableinstallation along I-5 will help manage these costs. Caltrans currently has a standard workload of 16 hoursper year per CCTV camera for Caltrans operations support and another 16 hours of preventativemaintenance support. Video image detection cameras would require about the same preventativemaintenance support as existing CCTV installations but the operations support would be higher since thesystem would need to be monitored for accuracy.
FeasibilityVideo image detection is an option for filling in gaps where count stations are missing throughout theShasta region. It is an effective non-intrusive technology that has the option to be a stand-alone systemsince it is capable of utilizing solar for power and cellular for communications (however, this option isdependent on good cellular service reception and direct sunlight). Construction of this type of detectorwould not typically require any lane closures.
For the Shasta region, video image detectors may lose reliability due to their susceptibility to weather-related technical problems. Snow and rain during the winter months can hinder the quality and accuracyof the detectors. Also, though they can detect vehicle classification, they cannot automatically detect thetype of classification counts that fit the criteria that census statistics require (i.e., number of axles).
This technology should be considered as an option for traffic monitoring, but could be better suited forsignalized intersections (which is not an objective of the stakeholders) rather than arterial freeways suchas I-5.
4. AUTOMATICLICENSEPLATEREADERS
Automatic License Plate Readers (ALPR) uses Optical Character Recognition (OCR) to identify vehicles bytheir license plates. This type of technology has many applications including traffic data collection, tollcollection, and law enforcement. This technology utilizes cameras that capture images using infrared forbetter clarity and image processing. Algorithms are used to take the captured image, digitize it, recognize

October 3, 2013 30 | P a g e
individual characters and translate them into ASCII characters. These characters can be stored in adatabase module and can be used for various applications.
ALPR cameras capture images in anyenvironmental condition, day or night, and canbe processed using real-time software ortransmitted to a data center. They can captureimages of vehicles with speeds up to 130 MPHwith good accuracy, depending on themanufacturer and device model. For instance,Motorola’s® ALPR provides 130 MPH capturespeed with 90% accuracy. Cameras can beinstalled at fixed positions overhead or side fire,though caution must be taken to ensure properangling of the camera for optimal reading. Thistechnology can offer a non-intrusive, wirelessmethod of traffic data collection, having the potential to measure occupancy, presence, travel time, andspeed depending on the algorithms used. ALPR systems use proprietary software to digitize and translateimages into characters, so integration with PeMS will require substantial effort.
CostsEstimated installation costs for covering both directions of travel (six lanes) in order to capture all traffic inand out at a gateway is approximately $63,000. Installation costs include central software and vendorconstruction support. Additional yearly licensing fees of approximately $2,500 per gateway areanticipated. ALPR operations and maintenance costs would be very similar on a per camera basis as videoimage detection.
FeasibilityALPR is a feasible option for collecting O&D data. Implementation of the infrastructure is non-intrusiveand would cause little traffic impact. Though the technology has the ability to monitor various trafficcharacteristics, it would not be capable of replacing the need for conventional and more commonly usedtechnology such as in-ground loops for accurate speed and occupancy. Furthermore, though ALPR cancapture length-based vehicle classification, they are incapable of detecting number of axles, which is acriterion required for official census statistics.
Inclement weather may degrade the accuracy of the readers, and could potentially require a high amountof maintenance. Implementing an ALPR system is an expensive option due to the need for proprietarysoftware to digitize and translate images into characters. Integration with TSN/PeMS will also requiresubstantial effort. Though this is the case, an ALPR system is still feasible for the gateway locations as it isvery reliable for O&D monitoring and the system can analyze O&D data.
5. MAGNETOMETERS
Magnetometers are devices that have the capability to count both vehicular and bicycle traffic, detectpresence and speed, and in many models, can transmit data wirelessly through wireless radio frequency.
October 3, 2013 31 | P a g e
Magnetometers are small in size compared to traditional loop detectors, some models such as Sensys®3-axis series being just 3x3x2 inches in dimension. Magnetometers can be installed in small saw-cuts orholes in the road surface and can also be installed underneath bridge structures. Magnetometers areinstalled in the same configuration as loop detectors, with one magnetometer per lane for volume countsor two per lane to capture vehicle speeds and volumes.
A magnetometer functions by detecting perturbation (magnetic anomalies) in the Earth’s magnetic field.The device is first calibrated to the local environment and recorded as the base condition. When a vehicledrives over the device, its metal body distorts the Earth’s magnetic field in either the x, y, or z axis as itenters and passes through the magnetometer’s detection zone. As a vehicle enters this zone, the Earth’smagnetic lines compress, converge, and then diverge as the vehicle exits. This perturbation of the Earth’smagnetic field is captured by the magnetometer and recorded. This data is then sent to a main controllerthrough wireless communication. Data collected is essentially the same as collected by loops; therefore,the data can be easily integrated into PeMS.
There are several advantages to magnetometer-based traffic data collection. For many models, installationrequires the drilling of a small hole using a hammer or core drill, with fast-drying epoxy as sealant. Thisquick and simple installation means shorter lane closures and disruption of traffic. Magnetometers alsohave a long battery life, reported to last up to 10 years, and requires only a low amount of communicationbandwidth transmit data back and forth. It is important to note that due to the fact that the technology isstill relatively new, the overall battery life of the devices is still under evaluation.
Disadvantages to the magnetometer include its difficulty in detecting stopped vehicles since the detectorrequires a ferromagnetic object to perturb the Earth’s magnetic field, which is done only when it is movingthrough the detection zone. Some models also have small detection zones and thus require multiple unitsto be installed to be able to capture wide roadways. Communication between the sensor and the controlunit can pose problems at times due to the use of the low power ZigBee standard often used with thistype of technology. Instances of jammed connections are not uncommon, causing data to not be receivedand stored by the central server. Lastly, the batteries in the detectors are considered hazardous materialsand require special removal measures whenever the detectors are replaced at the end of their life.
CostsMagnetometers are in the moderate price range, with installation costs at approximately $21,500 perlocation. Caltrans District 4 is currently deploying magnetometers at select detector stations, sointegration efforts in District 2 may be low if there is an interface already in place that can be utilized. Dueto sensor battery life, the magnetometers may need to be replaced at least every 10 years, and battery lifemay be shorter than that. Based on that alone, maintenance costs for magnetometers are going to behigher than loops since magnetometer life cycles are shorter and will need to be replaced more often.
FeasibilityMagnetometers are an option for the installation of new count stations at desirable locations within theCounty. This technology can replace non-permanent loop locations or any loops that are no longerfunctional. They are easy to install and would require minimal lane closures and disruption of traffic.Because magnetometers are currently used by other Caltrans districts, integration to Caltrans’ currentinfrastructure may not be as intensive. This technology can be installed on mainlines as well as on and off

October 3, 2013 32 | P a g e
ramps for volume monitoring. Furthermore, magnetometers can be paired with a system thatcommunicates directly with the TMC and would require low communication bandwidth to transfer data.
Since magnetometers cannot detect stopped vehicles, they may have trouble detecting vehicle presenceduring inclement weather in winter months. Vehicles stopped along I-5 would not be captured by themagnetometers. Stopped vehicles on ramps may also not be detected; therefore, this technology may notbe feasible for use with a ramp metering system. Magnetometers are also incapable of detecting any formof vehicle classification.
Overall, magnetometers are a good option for the District to consider. Moderately priced and easy toinstall, this technology is comparable to inductive detector loops and can have many applications forShasta County.
6. ACOUSTALDETECTION
Acoustic vehicle detection technology is a passive, fixed-unit detection method for traffic data collection.This technology is able to collect traffic counts, detect presence, speed, and occupancy (but notclassification) using a two-dimensional array of microphones to detect the acoustic energy produced by avehicle’s tires as they drive over pavement. When a vehicle drives through the sensor’s detection zone,sound is picked up by the microphones and triggers a sensor. When the vehicle drives out of thedetection zone, the audible levels drop below a specific threshold and the signal to the sensors areterminated. The sensor only focuses in on the specific detection zone; all other sounds are filtered out andare unaccounted for. Vehicle speed is detected by setting two detection zones and assuming an averagevehicle length.
Acoustic sensors offer advantages that include ease of installation and low power consumption. The lattermakes acoustic technology suitable for solar power operation. Acoustic sensors are non-intrusive and canbe installed in a short amount of time without lane closures. They require low to moderatecommunication bandwidth and can be connected to existing traffic controllers. Because acoustic sensorspick up the sound generated from tires moving on pavement, this type of detection technology does notwork well with slow moving vehicles in heavy traffic. Furthermore, though the sensors are resistant toprecipitation, it has been found that the accuracy is affected if subjected to cold temperatures.
CostsThere are two acoustic sensor models that are currently used: SmartSonic® and SAS-1® sensors. Costsassociated with acoustic technology range from $14,000-$20,000 for the purchase and installation ofsensors, depending on the number of lanes that require detection. One acoustic sensor either mountedroadside or over traffic may provide detection for up to five lanes of traffic in one direction of traffic.Operations and maintenance activities are likely much higher than any other detector technologies due toacoustical detection’s questionable reliability, and higher data verification support.
FeasibilityAcoustical detection is a technology that can address the need to install more permanent count stationsat regular intervals. Paired with communication to a TMC, this technology would be useful and wouldrequire low bandwidth. The downside to this technology is its high maintenance requirements and its

October 3, 2013 33 | P a g e
difficulty in detecting slow moving vehicles. During winter months, when vehicles may be traveling slowlyalong I-5 during inclement weather, the detectors will not be able to capture their presence as thevehicles may not be making enough sound due to their slow travel speeds.
This technology is not extensively used throughout the industry. Reliability is questionable, andintegration with current infrastructure may be difficult.
7. BLUETOOTH
The Bluetooth protocol is a widely used, open standard, wireless (2.4 GHz ISM radio band) technology forexchanging data over short distances but is a new application to the traffic data collection industry. Thetechnology is frequently embedded in mobile telephones, Global Positioning Systems (GPS), computers,and in-vehicle applications such as navigation systems. Each Bluetooth device uses a unique electronicidentifier known as a Media Access Control (MAC) address. Conceptually, as a Bluetooth equipped devicetravels along a roadway, it can be anonymously detected at multiple points where the MAC address, timeof detection, and location are scanned and logged. One application for Bluetooth is to derive actual traveltimes between two points. By determining the difference in detection time of a particular MAC address attwo or more points, the travel time between those points can be derived. Installing a network of Bluetoothdevices could provide the ability to collect origin-destination data for travel demand modeling, real-timetravel time traveler information, and for evaluating system wide performance measures.
The use of Bluetooth MAC addresses for travel time monitoring typically only requires one inconspicuousroadside installation to capture the unique address of Bluetooth devices traveling in all directions of flow,with an approximate detection range of 300 feet. In some cases, Bluetooth has been viewed favorablybecause of its low capital costs and accuracy compared to other travel time detection methods, but it iscritical to have a sufficient sample size for reliable data. Some Bluetooth applications have been known toonly capture 5-7% of traffic, which is not sufficient for a reliable data point. Other applications havereported 15-20% which is a reasonable sample size for travel time and origin-destination calculations.
CostsTypical installations of this technology cost approximately $1,500-$2,000 per location, which includes onlythe equipment and installation costs. A new pole and foundation for mounting the equipment will berequired. Recurring licensing fees and yearly data validation costs will also be required. With theseintegration and implementation costs considered, Bluetooth detection can total up to $8,000 to $10,000per location. Maintenance and operation costs are estimated to be similar to radar detection.
FeasibilityThis technology is a possible option for collecting O&D data. It is capable of providing travel timeinformation and would be cheaper than other non-intrusive options; however, it would not be the mostviable option for Shasta County because the SCUR may not have the vehicle volume to support this typeof data collection method. Moreover, with cellular device manufacturers decreasing the amount of time aphone is left in “discoverable mode”, some Bluetooth detectors will not be able to capture an acceptablesample size.

October 3, 2013 34 | P a g e
Bluetooth technology is constantly being developed to improve detection ranges and reliable coverage.As technology improves in the future, Bluetooth may be a feasible solution for O&D data at gatewaylocations.
8. RADIOFREQUENCYIDENTIFICATION(RFID)TAGREADERS
RFID technology can be used as a wireless and non-intrusive method for traffic data collection. The use ofRFID for traffic data requires two main elements: the transponder and the tag reader. The transpondercontains a RFID chip embedded with an electromagnetic field coil that is used to transfer information tothe tag reader. This system is widely used for commercial vehicle operations and electronic toll collection(ETC) such as FasTrak® in the Bay Area. When a vehicle passes through the detection point, the tag readercommunicates with the transponder inside the vehicle through radio frequency and collects the data (e.g.,vehicle permits, tolls). For traffic data collection, tag readers can be strategically placed throughout acorridor to collect vehicle counts and occupancy. Since each transponder has a unique identification code,vehicle speed can be detected by setting tag readers at certain intervals to capture and encrypt thevehicle’s transponder ID at these check points.
The effectiveness of this method for traffic monitoring relies on vehicles being equipped with thetransponders and a high enough sample size to be representative of all traffic. In some instances, not alltransponders may be read by the tag reader or can be misread. Commercial vehicles often have RFID tags,but truck speed is not a good representation of general traffic flow. Implementation of RFID technologywill require proper placement and field testing of tag readers to ensure optimal communication betweenthe reader and the transponder.
CostsAn estimated cost per toll tag reader location is approximately $13,000-$17,000. Installation costs assumethat readers would be placed on existing overhead sign structures. Operations and maintenance costswould be very similar to radar detection.
FeasibilityRFID tag readers are another option that could collect O&D data. This technology is known to providereliable travel time information between two points, but needs a large sample size to be consideredreliable. In this manner, RFID tag readers cannot successfully capture volume, speed, or occupancy in real-time, as the sample sizes do not reflect traffic conditions as whole. The chance of error is high with thistechnology as the tag readers must read the same transponder at two locations, presenting a highlikelihood of misreading a transponder or not being able to read one at all. It relies on vehicles to beequipped with a transponder, adding another logistical step before data collection can begin. There is nosystem in the Shasta region that utilizes RFID tag readers so vehicular volume may be too small to providean adequate sample size. Additionally, integration and implementation costs would be too high for atechnology that has questionable reliability and performance. In the SCUR, it is unlikely that there is alarge enough sample size for this technology to be a feasible solution.
9. GPSBASEDTRAFFICDATA
There are private companies that collect and offer traffic data for purchase. Companies such as TomTom®utilize their Global Positioning System (GPS) navigation devices to collect data that serves as the

October 3, 2013 35 | P a g e
backbone for real-time and historical traffic services. GPS devices have the capability of storing specificvehicle data such as travel speeds, which roads it has traveled on, and where itexperienced congestion or slowdowns. A user can allow the device to share thisdata and therefore give permission for data to be extracted via GPS connection.This aggregate data is used to create traffic data services that planning agenciesmay find useful.
Companies like TomTom® have built extensive databases through GPS datacollection along with traditional sources such as field surveys and aerial/satelliteimagery. Their methodology enables them to create robust web-basedapplications that offer accurate real-time traffic information, traffic flowprediction, travel time predictions, and speed profiles. Planning agencies can payto use these applications to enhance their own existing data that is madeavailable to the public and/or use the data for purely internal planning purposes.Agencies can use the information to know which areas are prone to congestion, high vehicle speeds, orthe most popular routes being taken by travelers.
The use of private traffic data services can be a good supplement to a planning agency’s existing trafficinformation system. It offers dynamic data that reflects a very large sample pool (for TomTom®, over 3billion people globally) that can be implemented in various ways. Important to note, however, is that forprivacy reasons, information is not given as raw data. Planning agencies must use the private company’sweb-based applications to query the information of interest through search functions, and the data will beoutput accordingly. Since the raw data is not provided to the agencies, direct integration with the existingdata collection system is highly unlikely. This data would need to be obtained from TomTom®.
CostsCosts associated with implementing GPS-based traffic data services are on a case-by-case basis and candiffer vastly. Costs are mainly attributed to system implementation/integration costs and recurring datapurchasing costs. If this data is intended to be utilized for real-time operations then an agency must alsoconsider the costs required to implement the new data source into their existing operational environmentand must understand the limitations of the data that is available. The recurring cost to obtain the data willtypically be paid on a monthly basis and the cost level will vary based upon the quality of the dataprovided and the number of lane miles to be captured.
FeasibilityGPS-based traffic data is an option for collecting O&D and travel time data. It is a viable option forperformance monitoring of other real-time infrastructure since data captured through GPS represents truemovement of a particular vehicle. This vehicle’s data can be compared to travel time predictionsformulated by real-time infrastructure elements. Though GPS data can provide useful information, thetechnology can have reliability and performance issues due to a low sample size of data and access toGPS in mountainous regions. Though this technology does not require any new infrastructure, planningagencies would incur an ongoing fee from a private traffic data service provider that process the data.Raw data is not provided to agencies and can only be used through the private party's software. GPS datais unable to provide vehicle volume data and it is only able to provide average roadway travel speed data.

October 3, 2013 36 | P a g e
Though GPS traffic data is an option for collecting O&D and other data, it is not a feasible option forShasta County at this time due to the limited sample size. Due to the nature of the data source (only fromusers with GPS onboard the vehicle), GPS traffic data is unable to provide volume data. Also, while GPStraffic data is able to provide roadway speed data, the speeds are an average over a segment of roadwayand not on a per vehicle basis.
10. COMMUNICATIONSINFRASTRUCTURE
The current data collection process is tailored to the federal standards and requirements for collectingcensus data. The infrastructure provides the ability, albeit manually, to collect the required data for thefederal program. Since the infrastructure was configured to this purpose, there is very little opportunity toreconfigure field equipment to provide additional functionality without investing in additionalcommunications equipment and other permanent field equipment. There is no opportunity to provideorigin-destination data with the current equipment. With the addition of permanent communicationsequipment there is a significant opportunity to utilize existing infrastructure for enhanced data collectionpurposes.
To support the implementation of new technology that will enhance the District’s data collectionprocessing and procedures, upgrades to the existing communication infrastructure is necessary. Upgradedcommunication lines to bring information from the field to the TMC will enhance the capabilities of theDistrict to make traffic data more readily available. Additionally, improved communication infrastructurewould allow for reduced field collection hours for Census staff that can otherwise be used for data analysisand other transportation management tasks.
A potential optimization for the District’s current system is to provide direct network communication topermanent detection stations. Currently, communicating with permanent detection stations is through amanual dial-up connection. This process could be enhanced by providing a direct network communicationlink to the counters, enabling users to get binned data as it is stored and refresh the binned data at anydesired interval.
With a direct communication link a modem connection is added to a communication network and it is notdropped. Fiber, copper, wireless and certain types of telephone or cellular communications can providethis permanent network connection. A network connection could be established with the countersthrough a terminal server. This terminal server creates a network connection through the counter’s RS232port. This terminal server is a small set-top device that could be placed adjacent to the counter in thecabinet. The Diamond Phoenix counter can be retrofitted with a second high speed serial port to aid inthis type of communication.
Fiber and copper infrastructure are the most reliable mediums for communications networks, but it is alsothe most expensive due to the cost of installing conduit and pull boxes. Construction costs canoccasionally be reduced by including the work as part of other roadway projects if budget is available;however, end equipment would still be required for all field equipment.
Another cost effective way to establish a network connection would be either through a telephone orcellular network. A cellular solution can be more cost effective in comparison to telephone; especially if
October 3, 2013 37 | P a g e
there is limited telephone utility infrastructure nearby. A cellular network can be established as anenterprise solution through any commercial carrier. In Caltrans District 7, a private cellular network fromAT&T is used for some network communications to ITS equipment. Since some of the existing Censusstations in Shasta County already utilize a cellular modem, this might be an attainable next step at thoselocations.
FeasibilityCaltrans District 2 currently utilizes Plain Old Telephone Service (POTS) and cellular modems tocommunicate to existing census stations. POTS is the most cost effective communication method sinceCaltrans only has to pay for actually time used instead being charged a monthly usage fee. Caltrans alsoutilizes a special Calnet II rate which might be a feasible network solution.
Caltrans District 2 is in the process of establishing a licensed microwave wireless network forcommunications to closed circuit television (CCTV) cameras throughout the region. New vehicle detectionstations may be able to utilize this same system if installed close to existing CCTV cameras. To make thisconnection, a direct connection between the detector station and CCTV camera station would need to beinstalled and then integrated into the wireless system equipment at the CCTV camera station.
Lastly, a fiber optic trunk line is currently being installed through the I-5 widening project. This will providea communication backbone for connecting new and existing vehicle detection stations along I-5. Thisfiber optic network is anticipated to be completed within the next two to three years. Fiber or coppercommunications is not feasible along other routes in the network due to the high costs of installingconduit and possible right-of-way acquisition.
A hybrid approach of providing communications to low bandwidth roadside elements (like TMS andpermanent count stations) may be a very cost effective option. Under this scenario, communicationnodes/hubs would be established along the proposed I-5 fiber backbone. The nodes would provide ahigh-speed network connection back to the TMC. CCTV cameras, CMS and other critical elements will bedirectly connected to these ITS Nodes and hence, the fiber infrastructure. The less critical elements (likethe Traffic Monitoring Stations) would be connected to a node by a “linear mesh” wireless networkestablished from TMS to TMS along I-5. Each ITS node would then provide an access point for the wirelesssystem to connect to the fiber infrastructure and then the TMC. Utilizing nodes/hubs and a wirelessnetwork would help minimize costly construction costs required by physical communication infrastructureimprovements.
Caltrans District 2’s current preference for integrating devices into their network is to ensure that all newdevices are compatible with an IP-addressable Field Element Network. All new vehicle detection stationswill be initially deployed using general packet radio systems (GPRS) to establish communications. AsCaltrans expands the fiber backbone and microwave network, the new count stations will be convertedfrom GPRS to the hybrid communication approach described above.
C. Other Implementation Considerations
In addition to technology considerations, there are implementation considerations that need to beevaluated and discussed when deciding on a specific technology. These factors will have at least as much

October 3, 2013 38 | P a g e
impact on the selection of the best technology for the region because there could be significant costimplications that are independent of the technology that could require substantial construction budget ordictate feasible technology.
1. ENDUSEOFREAL-TIMEDATA
While much of the raw data collected by the technologies described in the section above may be useddirectly as-is by SRTA, cities, or Caltrans, the decision on which technology(ies) is most appropriate largelydepends on how the data will be used. Volume, speed, and occupancy can be collected from most of thetechnologies presented here; but, the data may also be further analyzed to provide enhanced benefit totravelers and other public agencies. Many of the technologies are able to provide classificationinformation, but the manner in which the technologies classify may differ. Technologies like radar andvideo can provide vehicle length information for classification use. However, this type of classification isnot applicable for federal census classification that requires classification to be reported by number ofaxles. Volume counts and vehicle speed data may be used in ramp metering applications for developingramp metering rates. Origin-Destination data can be used to determine travel time information that canthen be integrated into traveler information websites like 511.
2. EXISTINGPOWERCOMMUNICATIONSINFRASTRUCTURE
The factor with greatest potential effect on cost is providing power and communication to detectorstations due to the installation of conduits and cabling in areas where there is no infrastructure nearbypower or communication service. Installation costs per 1,000 linear feet of conduit may cost $35,000-$80,000, greatly escalating the overall cost per detector station and making a particular solution costprohibitive.
To mitigate costs of remote detector installations, use of technologies with low power requirements, likethose with a single sensor mounted on a pole on the side of the road (radar, video detection, ALPR,microwave), are able to rely on solar power will be the most cost effective. Additionally, these remotelocations may be able to use general packet radio system (GPRS) wireless modems for communication.These modems utilize wireless phone connections to transmit data back to a central server system. GPRSis widely used by Caltrans throughout the state. However, when choosing locations of isolated detectorstations with solar power and GPRS, the sites must be thoroughly examined to ensure that the locationreceives the adequate sunlight and cellular service to provide power and communication.
Estimated costs for various power and communication alternatives are presented in Tables 1, 2, and 3below.

October 3, 2013 39 | P a g e
Table 1: Estimate of Probable Operations and Maintenance Costs for Hardwire Power (PerLocation)
Element
Installation Costs(Per Location)
Recurring Costs (Per Location)
Conductorsand
Conduit1
ServicePedestal Watts Kwatts
Hoursusedperday
Days/YearTotal
Hours/YearCost/KWH
(cents)
EstimatedAnnual
ElectricityCost
TMS
$16,250 $3,500
1000 1 24 365 8760 $0.16 $1,402PermanentStation
100 0.1 24 365 8760 $0.16 $140
Radar 50 0.05 24 365 8760 $0.16 $70Magnetometer 30 0.03 24 365 8760 $0.16 $42VideoDetection
30 0.03 24 365 8760 $0.16 $42
Acoustic 30 0.03 24 365 8760 $0.16 $42ALPR(Assumes 3camerasystem)
250 0.25 24 365 8760 $0.16 $350
Bluetooth 50 0.05 24 365 8760 $0.16 $701 Assumes 250 feet of conduit between service point and service pedestal.

October 3, 2013 40 | P a g e
Table 2: Estimate of Probable Operations and Maintenance Costs for Solar Power (PerLocation)
ElementInstallation Costs Recurring Costs
Solar Panels andBatteries
Battery Replacement3
(Annualized)
TMS2 Not Feasible
Permanent Station (Assumes 2 batteries) $6,500 $300
Radar (Assumes 1 battery) $4,000 $150Magnetometer (Assumes 1 battery) $4,000 $150Video Detection (Assumes 1 battery) $4,000 $150Acoustic (Assumes 1 battery) $4,000 $150ALPR (Assumes 3 batteries) $6,500 $450
Bluetooth (Assumes 1 battery) $4,000 $1502 Due to high power requirements, solar panels are not an effective option for TMS power.3 Assumes annualized cost of replacing batteries once every three years at a cost of $450 per battery.Expected lifecycle of permanent stations, radar, and magnetometers is 15 years. All other technologies areassumed to have 10 year lifecycles.
Table 3: Estimate of Probable Communication Costs
Sub-Elements Quantity Unit CostTotal Estimated
Installation Costs(Per Location)
Plain Old Telephone Service4
Conduit and Conductors (ft) 250 $50 $12,500Dial-Up Modem 1 $1,000 $1,000
Sub-Total $13,500Microwave Wireless
Antenna 1 $2,500 $2,500Modem 1 $2,000 $2,000
Sub-Total $4,500GPRS5
Modem Assembly (With Antenna) 1 $2,500 $2,500Sub-Total $2,500
4 Assumes $20/month AT&T phone service. Data cost based on input from District 2 Staff5 GPRS will incur a monthly service cost of approximately $50

October 3, 2013 41 | P a g e
3. DETECTIONLOCATIONANDSPACINGPERDATATYPE
The placement and density of the detector stations heavily relies on how the data will be used. For originand destination data, detector stations must be placed at all key entrances and exits of the transportationsystem. Traveler information systems require a large number of sensors to provide detailed and usefulinformation like segment speeds and congestion. To deploy ramp metering along a corridor, detectorstations will need to be placed at all on ramps and off ramps as well as at least one station on themainline freeway between on and off ramps.
4. CONSTRUCTIONIMPACTSONTRAFFIC
The installation of detectors in pavement (e.g., inductive loop detectors or magnetometers) will requirelane closures that will impact traffic. There may be instances where lane closures are not allowed or thecosts outweigh the benefits. Non-intrusive detection will have lower impacts to traffic if they are able tobe placed on the side of the roadway, but could have reduced accuracy due to weather conditions orocclusion. Non-intrusive detection that must be placed overhead would require lane closures.
5. LIFECYCLEANDRECURRINGCOSTS
With agencies being required to maintain existing infrastructure and systems with less and less staff,maintenance and replacement costs are major factors in planning and supporting the deployment ofequipment to ensure system functionality. Ongoing costs, such as power and leased-line communications,will be applicable to the vast majority of technologies. Power costs may not be applicable to stand-alonedetector stations that can utilize solar power; however, those stations will most likely rely upon GPRSwhich will require monthly cellular data plans.
Certain technologies will require regular maintenance to keep the devices at full operational capabilities.Video detection and ALPR cameras require yearly maintenance to clean the lens and to recalibrate theprogrammed detection zones. Inductive loop detectors have often needed to be replaced within 5 yearsdue to roadway degradation, but Caltrans District 2 installs deep loops (2-4” depth) and generally theloops last for the life of the pavement.
All technologies require periodic calibration and verification activities to ensure data accuracy, sometechnologies more than others. This will require Caltrans staff to field verify the validity of the data andadjust the devices/programming to fix any inconsistencies. Particular technologies like loop detectors andmagnetometers have been shown to be very accurate with little or no concern with the legitimacy of thedata. Acoustic detection has been seen to be more prone to data degradation over time requiring yearlycalibration checks. Factors such as weather and occlusion may require more frequent calibration andverification.
D. Data Processing
Once the data is transmitted back to a central system, there are enhancements required in order toprocess and report the data more frequently. For the District’s data processing system, there may be an

October 3, 2013 42 | P a g e
opportunity to improve the procedures to deliver the data to TSN. There is currently no standard timeframe at which data is transferred from TSN to PeMS. This varied time frame affects the efficiency of SRTAand other agencies because of the inconsistency of when data is available for analysis. PeMS is a powerfultool controlled by Headquarters, and an improvement on its existing data processing procedures wouldbe beneficial for District 2, and for all Caltrans districts. If automated updating of census data on PeMSwere to be made available, many of the timeliness concerns of data access from SRTA and Caltransplanning would be satisfied.
Another opportunity for optimizing the existing process is for the Census Team to provide data to SRTA atthe same time as it is sent to be posted on TSN. The census data at this point of the process has beenverified and reviewed by District staff. With some investment, SRTA and the District could also develop aparallel data collection system to process and report data more frequently and in specific formats. In adiscussion with Nick Compin (Caltrans Headquarters Census Program Chief) and Jane Berner (CaltransHeadquarters PeMS Chief) on August 28, 2012, they indicated that there are no Caltrans policies thatprevent individual districts from distributing the data or creating a separate system to process and reportthe data.
To mitigate the issue of a lengthy data processing and reporting time, changes in the PeMS system can bemade to optimize the process. PeMS is currently a robust data reporting tool that can output largeamounts of data in a variety of reporting formats. However, there are currently institutional problems thatare prohibiting data to be posted to PeMS in a time frame that would be most beneficial to the District’splanning and operational agencies. Data is submitted by the District to Headquarters for posting to TSN.The speed of this process and its final posting to TSN has been improved, with the District’s CensusCoordinator stating that it can take as little as just a day now for data to be posted. It is when the data isin TSN that it must wait a varied amount of time to be posted to PeMS. If this time can be shortened to anamount that is documented and made a requirement, the process would be optimized and processingand reporting of data would be improved. As mentioned above, PeMS is a powerful tool for data analysis;however, use of the system does require a certain level of familiarity and training to be able to utilize thesystem in an effective manner. Even if data is available, SRTA does not currently have the necessarytraining to be able to employ PeMS in a manner that maximizes its potential uses to fit their needs.
Enhanced central tools will equip Caltrans and other users with the ability to access data more frequently,proactively monitor traffic conditions, and export data for other uses.
FeasibilityThe most desired option for the District is to optimize the Headquarters review and verification process tominimize the time frame at which data is transferred from TSN to PeMS. Specifically for the District, itwould be helpful for census data to be posted as it is made available in TSN or at least on a monthly basis.PeMS is already a powerful tool for the District and may not need to be complimented or replaced withanother data management system. This option would require no new system upgrades and very littleeffort by District 2. However, this option is fully dependent on Headquarters’ staff to accomplish and thetimeframe and effort for these improvements are outside of the control of Caltrans District 2. Also, ashortened time frame would require an effort by Headquarters to quality check the data in TSN at morefrequent intervals so that the data can be pushed to PeMS faster. Such effort would require the properstaff and the available time for them to complete the task. Whether or not TSN/PeMS data integration is

October 3, 2013 43 | P a g e
improved, training for SRTA staff is required to familiarize them with the PeMS abilities and functions thatmay facilitate their traffic data collection needs.
Per Jane Berner (Caltrans Headquarters PeMS Chief), a project is anticipated for allowing automatictransfer of traffic data from TSN to PeMS; however no implementation schedule has been determined asof this time. If this projected is not anticipated in the near future, SRTA and District 2 should partner tofurther investigate the implementation of new procedures and software to maximize data processingcapabilities and upgrade reporting tools. This would include evaluating a new tool for data processingand dissemination that would provide more timely data transfer to stakeholders external to Caltrans.
There is a number of third-party software that can achieve this, such as IBM’s ITS Traffic ManagementSystem or MS2’s Transportation Data Management System. Additionally, detection vendors, such asWavetronix, offer off-the-shelf software capable of compiling, processing and reporting vehicle countdata. Certain off-the-shelf software are designed to be modular in nature and the vendors report thattheir software has the capability to integrate data outputs from multiple data collection devices (radar,loops, etc.). An off-the-shelf option like this may require less integration effort and costs compared toimplementing a custom system making it a viable option if a secondary data processing system is to beimplemented.
A possible downside of implementing a processing and reporting tool that can make data available tousers without the use of PeMS is the possibility of compromised data integrity. A separate system wouldbypass the full data validation processed used by PeMS prior to making the data available. Decreasingthat time by processing and reporting the data outside of PeMS would make data available much sooner,but data reliability may decrease. Data should either only be made accessible to the new system once ithas been processed by the Caltrans District 2 Census group or be updated/revised in the system asvalidated data is made available. All in all, it is likely more feasible, both in terms of effort and cost, for theDistrict to encourage Caltrans Headquarters to focus on improving the existing PeMS system than toimplement new reporting tools that would accomplish the same goal. A separate quality control processmay be required to verify information input into a secondary processing and reporting tool.
An upgrade to the District’s data archiving system would require a robust data server that could handle alarge amount of storage. If National ITS Architecture standards are followed and data is archived at thefinest granularity, properly sized server infrastructure will be needed. The creation of a tool for dataprocessing and dissemination would need to have a thorough database of detailed historic data. Achallenge with this solution is which operations or planning group would be responsible for the operationand maintenance of the system and database. The development of an agreement would distinguish clearlines of responsibilities and benefits.
E. Data Reporting
New software could be developed and implemented to optimize the data reporting process. A centralsystem can be accessed by multiple entities for data requests to help enhance transportation planningactivities. This program could be used to validate the data, automatically format data for PeMS, orintegrate the data into a non-PeMS portal or system that could store and disseminate the data on a more

October 3, 2013 44 | P a g e
frequent basis so it could be used by District 2 and other agencies. As mentioned above, a software toollike that offered by Wavetronix would have the ability to compile, sort, and distribute data in a userfriendly fashion.
Instead of the expense of a full software program, a variant of this optimization could be the use ofmacro-scripting often used in database programs such as Excel, Access, MySQL, Lotus or Oracle. Utilizingdatabase scripting can provide more customization of records and field information but may be limited tofile sizes smaller than what the District works with. This could be overcome by either reducing thegranularity of data collected or parsing the files into workable segments.
Implementation of useful reporting tools will require a robust archiving system that can process therequired data. A key factor is to implement a system that archives data at the finest granularity to ensurethat it can encompass a wide variety of uses. Archiving systems must be kept up to date with currenttechnology and should be capable of archiving new traffic parameters that may be implemented in thefuture. For instance, the system must be capable of storing information fed by current permanent countstations through manual polling over a modem connection, and be able to quickly adapt and archive datafrom upgraded technology to avoid a gap in historic data availability.
In the future when recurring congestion is present, providing traveler information will help drivers makethe best possible traveling decisions. Development of a real-time traffic and incident monitoring tool canalso provide traffic conditions to TMC operators. Using real-time and historical volume, speed, andoccupancy data, a central system can alert TMC operators or drivers when a certain pre-determinedthreshold is met. This alert system can be integrated into vehicle detection stations to automatically call aflasher or changeable message sign, contact the TMC, or push alert messages to travelers.
1. THIRDPARTYCENTRALSYSTEMSANDDATAAGGREGATORS
Various companies have developed central systems that compile, translate, and aggregate field data.Some companies provide services to develop custom systems tailored to the needs of the clients. Othersystems may have data collection software that is intended to compile data from field devices andcompile the data for reporting. The data collection software is generally compatible with a number ofdifferent detection devices and translates the data into a usable format. Users can then access the dataand make custom data reports to export the data.
There are numerous providers of third-party traffic data. While each company creates traffic data from avariety of sources, differences lay in data fusion techniques. Data fusion is a method of combiningdifferent sources of traffic data with weight to factor in the variables to data quality such as reliability,density, latency, data point frequency, and traffic volume. Each of these solutions is a proprietarymethodology to determine the best quality of data. While some data source details and methodology areavailable, most have not publicly shared this knowledge. Some companies have clearly identifiedthemselves as resellers of data and can be contacted for purchase of selected segments of information.Others maintain proprietary data.

October 3, 2013 45 | P a g e
The following are examples of third party data that is available:
Sigalert.com – A “SigAlert” is a popular term to many living in urbanized areas of California. The term,dating back to a radio operator in the 1950’s, is used by CHP and the media to identify "any unplannedevent that causes the closing of one lane of traffic for 30 minutes or more." These are issued by the CHPand Caltrans who will sometimes use the term to “identify any major traffic incident that will tie up two ormore lanes of a freeway for two or more hours.”
The website features maps illustrating congestion, speeds, and camera icons in some areas of the state.There is no data provided for Shasta County with the exception of some camera images. The data isprovided to Caltrans, but does not support the needs of SRTA.
Sigalert is owned by Clear Channel Communication and will provide free and subscription versions ofSigalert data to website visitors. The traffic data that Clear Channel utilizes is through their brand calledTotal Traffic Network. Total Traffic Network owns their own network of reporters, traffic cameras, aircraft,infrastructure, and other partners to verify and produce traffic information. Clear Channel does sell theirraw traffic data to numerous personal navigation device manufacturers and automakers but have notindicated publicly that they sell directly to government agencies.
Total Traffic Network data is tested for accuracy against a ground-truth testing methodology calledFloating Car Data Quality. In this approach, the ground-truth detection is executed with probe vehicles,utilizing a statistical test to indicate when collected drive data is sufficient for a desired level ofconfidence.
Google – Traffic is a feature added to Google Maps in 2007. This tool is primarily used on computers andsmart phones to view real-time congestion information. Real-time travel time data is also provided whendirections are queried. The congestion map display is the primary user interface, which illustrates green-yellow-red congestion levels. This data is primarily focused on providing information to drivers;professional use of the data is not a major component.
Google’s data primarily comes from Android Google Map subscribers that have agreed to share theirmobile device GPS probe data, known as “crowdsourcing”. Accuracy of crowdsourcing road congestiondata is reliant upon the number of probes in the vicinity and may be limited in accuracy depending on thefrequency and number of data points. Accuracy information is not provided by Google.
Google has not publically indicated that they sell their traffic data, but the data can be integrated intoothers systems for a fee. Google Maps traffic data is a source for travel speed information displayed onCaltrans’ QuickMap, but does not meet the needs of SRTA.
INRIX – INRIX is a private traffic company that specializes in traffic data collection via data probes anddata fusion, real-time information diffusion and traffic data prediction, and is a major provider of trafficand routing data to a variety of third-party users. INRIX focuses on “flow” type maps but also emphasizesrouting, travel time and prediction. Data is derived mostly from probe data which means vehicle speed isthe primary data available. Predictive vehicle data and historical data are also available for transportationplanning and modeling.

October 3, 2013 46 | P a g e
Data is primarily provided to third party automotive manufacturers or navigation system manufacturers,but is also now available through smartphone apps (free subscription) to the public. Corporate or publicsector clients can purchase data for transportation management or planning.
A number of public agencies have utilized INRIX traffic data for tasks ranging from travel timeinformation, roadway performance measures, and congestion monitoring. INRIX customers include orhave included New Hampshire DOT, Massachusetts DOT, Missouri DOT, and Georgia DOT. The SanFrancisco Bay Area’s MTC is in the process of executing an agreement to purchase INRIX data to beintegrated into 511.
In-Vehicle Navigation Systems – In-vehicle navigation systems leverage in-vehicle devices as probes. In-vehicle navigation systems provide dynamic routing and travel time information for subscribers. This datais updated approximately every two minutes.
Like other data fusion traffic providers, these navigation systems have multiple data sources, such ascellular floating car data (CFCD), which is a timing advance measurement to triangulate position. It alsouses GPS based probe vehicle data. Like Clear Channel, this data is typically ground-truth tested foraccuracy.
SpeedInfo – Founded in 2002 in San Jose, SpeedInfo specializes in the deployment of solar-poweredDoppler radar sensors in addition to server software and a dedicated network. SpeedInfo customersinclude mass media organizations that provide traffic information that radio and television networksbroadcast to consumers, traffic aggregation companies, and mobile application developers, such ascontent providers for automotive navigation systems. Only speed data is offered by this source at thistime.
SpeedInfo is currently deployed by various DOTs and MPOs throughout the country. Caltrans, theMetropolitan Transportation Commission in the San Francisco Bay Area, and the North CarolinaDepartment of Transportation utilizes SpeedInfo data for 511 traffic and traveler information. Otheragencies that use SpeedInfo include Washington, D.C. DOT, Ohio DOT, Colorado DOT, and Hawaii DOT.
TrafficCast – TrafficCast provides travel time forecasting and traffic information using traffic flow theoryand probe data technologies, as well as mobile services, digital content and media marketing. TrafficCastclaims to have developed the largest traffic data platform in the industry referencing historical and real-time traffic for over 450,000 miles of roadways in the United States. TrafficCast analyzes real-time datafrom expressways and major arterials as well as information from secondary and tertiary roadways,weather conditions, roadway incidents and events, construction, and historical traffic patterns.
NAVTEQ – NAVTEQ is a global provider of maps, traffic and location data. NAVTEQ digital locationcontent is used in automotive navigation systems, portable and wireless devices, Internet-based mappingapplications, and government and business solutions. NAVTEQ delivers real-time, personalized traffic dataon a map. The data includes traffic flow conditions with speed values, unplanned incidents (accidents andstalled vehicles), and planned incidents (road construction and closures).

October 3, 2013 47 | P a g e
FeasibilityIn their current state, these third party data sources are not viable sources for data collection andreporting in the Shasta County region. This is primarily since most of these services rely on subscribedusers serving as probe points. This may be a limiting factor in Shasta County.
Tools for real-time traffic reporting rely on the infrastructure that can gather the necessary data. For thesetools to be effective, traffic data needs to be collected on a more frequent basis, likely every 30 secondsfrom regularly-spaced detection stations. Once the data is collected, it will need to be placed into adatabase where the system can access and reference the data. This system has the ability to provide traveltimes and real-time congestion information.
Though not needed by the District until a time when recurring congestion is expected, this type of systemcan be implemented to have functions similar to traveler information websites like 511 or Google Maps.These systems utilize real-time data to provide information such as congestion, predicted travel times,and incident alerts. If the District implements a real-time system like these, performance monitoringwould be necessary. The effort of performance monitoring can be high, but it is vital to ensure that thesystem is providing accurate, reliable, and beneficial information. Costs that will incur from animplementation of these tools would be from a combination of both the technology upgrades to gatherthe data as well as the software and system upgrades to support a robust forecasting and monitoringtool.

October 3, 2013 48 | P a g e
V. IMPLEMENTATION PLAN
A. Alternatives Analysis
Through an evaluation of the District’s needs and gaps in ITS infrastructure, alternatives to address eachgap using potential technologies as previously discussed have been provided in the attached AlternativesAnalysis table (Appendix C). Factors that were considered in the determination of alternatives include thefeasibility of each potential technology, priority of each need, influence of existing equipment, and extentof each gap.
For each gap discussed earlier, the Alternatives Analysis table presents a set of alternatives, a priority levelbased on stakeholder input, the elements required for each alternative (i.e., equipment and newinfrastructure), estimated installation costs per location, pros and cons, and what enhancement thealternative provides in terms of data collection procedures. The installation costs for the detectiontechnologies do not include power and communication costs. The costs for alternative power andcommunications included in the alternatives analysis are the same as those presented in tables 1, 2, and 3above.
Using this analysis approach, each potential solution can be evaluated side-by-side to determine thepreferred alternative. The preferred alternative is not solely based on lowest cost, but also considers easeof integration with existing system, functionality, and maturity of technology. The following tablesummarizes the preferred alternative to address each gap.

October 3, 2013 49 | P a g e
Table 4: Gaps and Preferred Alternatives
Gap Preferred Alternative
Lack of permanent count stations Upgrade existing temporary stations to permanentstations
Lack of permanent count stations at desiredlocations
Install permanent loop detector stations at newlocations
Limited communication network Deploy GPRS in the short-term to bring detectorstations online, then covert to an agency ownedwireless network to connect to hubs on a fibercommunication backbone as the infrastructure isinstalled.
Lack of origin-destination data Install Bluetooth demonstration and permanentsystem at County and SCUR gateways
Lack of origin-destination central processingsystem
Integrate commercial off-the-shelf system toexisting Caltrans system
Central system cannot monitor congestion orincidents
Upgrade existing functionality of TSN/PeMSprocess
No access to Caltrans data by external agencies Upgrade PeMS to automatically download censusdata from TSN. If the project for the PeMS upgradeis not anticipated in the near future, install third-party software data processing and reporting tool.
Based on stakeholder’s feedback, the most important stakeholder priorities are to collect data to assistwith the travel demand modeling, and to improve the availability and access of the volume data. Thefollowing describes the approach to developing the projects that will accomplish these goals.
B. Implementation Plan
Based on the table in Appendix C and the methodology described above, individual implementableprojects have been identified to meet the needs of SRTA and Caltrans. The list of projects is presented inAppendix D and is based on identification of strategic corridors and feasible technologies. The projectsfocus on manageable, modular projects that enhance Caltrans’ existing ITS infrastructure whileconsidering the priorities and goals of SRTA and Caltrans. They can be deployed as project funds becomeavailable. Each project includes details of the recommended project with estimated planning level costsfor project development, capital construction, as well as operations and maintenance costs. The estimatedproject costs can vary depending on power and communication, however, for the purposes of thisdocument, the costs presented in the Implementation plan assume hardwire power. The projects alsoassume GPRS/Cellular communications. The discussion below summarizes the categories of the projectsproposed in Appendix D for the data collection system:

October 3, 2013 50 | P a g e
1. EXISTINGCONDITIONS
a. Origin-Destination Stations – The greatest data collection desire for the SRTA andCaltrans D2 planning groups is to provide information to determine the number of inter-,intra-, and thru-regional trips. Origin-Destination detection stations located at the fivemain urban gateways to the SCUR would provide the majority of the trip information intoand out of the region. As described in the introduction, the five gateways are:
Gateway 1: Highway 299 west of French Gulch Road;Gateway 2: Interstate 5 south of Fawndale Road;Gateway 3: Highway 299 east of Dry Creek Road;Gateway 4: Highway 44 east of Deschutes Road; andGateway 5: Interstate 5 north of Bowman Road.
The two technologies most feasible for providing origin-destination information areBluetooth technology and automatic license plate readers. Bluetooth technology is anemerging technology currently being deployed by a number of agencies on a trial basis.Though there are concerns of Bluetooth technology reliability in transportationapplications, it is potentially a very cost effective approach to Origin-Destination tracking.As listed in Appendix D, a pilot test should be conducted along a major corridor(preferably I-5) to measure the reliability and accuracy of Bluetooth technologyspecifically within the region. ALPR technology is a more established and reliable methodof collecting O-D information and has been previously utilized by Caltrans District 2.However, it is considerably more expensive and should be considered if a Bluetoothsolution does not provide acceptable data.
b. Deploy more permanent count stations - Since Shasta County does not presentlyexperience extensive recurring congestion over a long peak duration, there is no need tomaintain an expansive and thorough data collection system that collects and distributesdata for congestion monitoring and incident management. However, SRTA and CaltransPlanning have identified the desire to collect volume data on a continuous basis andmake it available within three to six months. Ideally, volume would be collected at everyinterchange and would capture all vehicles entering and exiting the freeway as well asvolume data on the mainline. Existing permanent count stations currently collect data ona continuous basis; therefore, installing new permanent stations or converting non-permanent count stations to permanent stations would provide the data needed by theplanning groups.
The number of locations for new or upgraded count stations was identified based on ananalysis of existing count station locations and the desired coverage area. All existingstations were considered for upgrades, while new stations are recommended for areaswhere mainline volume between interchanges is currently not captured. There are twotypes of proposed typical count station configurations:

October 3, 2013 51 | P a g e
- New Count Station Configuration: Utilize newly installed mainline loopsconnected to existing on and off-ramp loops, all connected to one controlcabinet.
- Upgraded Count Station Configuration: Utilizes upgraded mainline loopsconnected to existing on and off-ramp loops, all connected to one controlcabinet.
These typical configurations, shown in Figure 3 below, would provide data to calculateand monitor the entering, exiting, and through volume along the mainline.
A large benefit of this implementation approach is there would be very little or nointegration costs since this method matches existing deployments by District 2. SinceCensus staff currently must manually deploy Diamond Counters (and tubes at certainlocations) at all temporary count stations, having permanent count stations atrecommended locations would allow for remote downloading of volume data thereby
Figure 3: Typical Count Station Configuration

October 3, 2013 52 | P a g e
reducing the amount of field work currently required. Through this effort savings, theCensus group would be available to perform other tasks such as TMC support duringadverse weather or additional data analysis.
New and upgraded count stations were divided into project groups based on 2011 AADTvolumes at each of the interchanges. Areas that experience higher volumes were givenpreference in project priority. After taking volumes into consideration, geographiclocations of the count stations were considered so that the locations would be logical andcomplete in terms of corridor management. This would ensure that for the most part,installation of new or upgraded count stations would commence so that only one area ofthe SCUR would be in construction at one time. Installations of new stations andupgrades of existing count stations can also be done as part of other constructionprojects and may provide ITS project cost savings.
Converting the non-permanent count stations to permanent stations will position theregion for a future ramp metering system and a real-time data collection system whenrecurring congestion occurs. Since the installation of the permanent count stations willprovide the necessary infrastructure of controller cabinet, power, communication, andloops, the only modifications required to implement a TMS station would be to replacethe existing Diamond counter with a new 2070 controller and loop detector cards.
Appendix E is a map that shows the locations of the new and upgraded count stations,project group limits and their project numbers. The project numbers correspond directlywith the table in Appendix C which lists the project limits, project elements, and projectcosts.
c. Implement central system for data exchange – The implementation of a data exchangesystem can be separated into three different approaches:
1. In the event that the PeMS system is upgraded by Caltrans Headquarters in thenear future, this will allow for automatic downloading of census information fromTSN as soon as it is posted. PeMS would provide stakeholders with the vehicletraffic volume data access and reporting tool desired. Under this approach, trainingworkshops would be required to help familiarize SRTA and other agencies withPeMS data processing and reporting capabilities.
2. If a project to upgrade PeMS is too far out on the horizon, SRTA and Caltrans canpartner to deploy a commercial off-the-shelf software solution that will simplify theexporting and reporting process. SRTA and Caltrans can obtain the precise dataand format that is most desirable and the system could integrate with existingCaltrans equipment. Depending on the solution selected, it may also be necessaryto install a communications link that enables SRTA to directly access and export thedata.
3. The simplest and potentially least expensive option in terms of deployment wouldbe to implement a central software interface that would be able to export andcompile raw traffic data in excel format. However, this alternative is not desired bySRTA because it would require more staff resources to manually disseminate dataand create reports. This option may be viable in the short-term until one of the two
October 3, 2013 53 | P a g e
data exchange options above is implemented. The disadvantage may be that thedata is not in a format most preferred by SRTA.
2. FUTURECONDITIONS
a. Implement equipment for real-time data collection system – At a point in the future whenrecurring traffic becomes common over a longer duration of the peak period, the Districtmay desire a data collection system capable of providing real-time speed and congestioninformation. If the existing permanent count station infrastructure is expanded asdescribed above, Caltrans will only need to install new controllers and detector cardequipment to convert the count stations to traffic monitoring stations. Since theinfrastructure construction costs of deploying TMS will not be required, the saved fundscan then be applied to developing or integrating a central traffic monitoring system.
C. Operations and Maintenance Plan
Caltrans is currently responsible for operating all data collection equipment within Caltrans right-of-way.This includes loop detectors, MVDS, cabling, communications equipment, field cabinets, and centralstorage and processing equipment. With the deployment of additional equipment, it is likely that Caltranswill continue to operate the new equipment. If additional software is deployed to provide SRTA withcustomized reporting of origin-destination or real-time data, SRTA may share responsibility for operatingand maintaining the software and the communication connection to Caltrans data.
Maintenance activities fall into two categories: preventive and corrective. Preventive maintenance involvesthe periodic calibrating, cleaning, or fine tuning of equipment to prolong the acceptable performance ofthe equipment. Corrective maintenance involves the troubleshooting, repair, or replacement of failedequipment, usually prioritized based on severity of the failure.
Scheduling preventive maintenance measures and timing should be based on manufacturers’recommendations. Using these manufacturer recommendations, Caltrans should develop a maintenancechecklist for maintenance crews to use and develop a schedule for when the periodic check-ups shouldtake place. Depending on whether in-house expertise exists, maintenance may be out-sourced to providefaster and cost-effective response to maintenance needs. Additionally, subject to manufacturers’warranties, device operations may need to be recertified by the manufacturer for proper operation (e.g.,video detection adjustment/calibration). Recertifying the devices usually involves field testing andreconfiguring the devices to ensure proper device operations. Manufacturer recertification should benegotiated at the time of purchase.
To address corrective maintenance, Caltrans must develop contingency plans to address the inevitableunknown device failures. Devices may inadvertently be damaged or may unexpectedly fail due tounforeseen device malfunctions. To address these issues, Caltrans should budget for an inventory of spareequipment for future replacement of failed equipment. It is an industry standard to maintain two to threepercent of the total deployment for adequate spare devices to have on hand for maintenance purposes,plus an open Purchase Order for seven to eight percent (totaling 10 percent total).

October 3, 2013 54 | P a g e
In addition to maintenance activities, there are also replacement costs due to upgrading legacyequipment or end of lifespan that Caltrans should consider. To prepare and anticipate the need toupgrade in the future, Caltrans should plan for replacing existing equipment based on estimated end ofuseful lifespan considerations.
In the event that detection equipment is deployed where Caltrans and SRTA have agreed to shared, therecould be an Operations and Maintenance Memorandum of Understanding executed between Caltransand SRTA, if needed, that captures the responsibilities of each agency, including the following:
· Power and communications costs· Initial capital costs· Equipment replacement/maintenance responsibilities and costs· Privileges for utilizing data· Responsibilities for maintaining useful data· Opportunities and limitations for system expansion· Data sharing opportunities and limitations· Cost sharing
D. Funding
While some of the following funding sources may not be data collection specific, data collection elementscan be incorporated into capital improvement projects falling under these funding source requirements.
· Congestion Mitigation and Air Quality Program (CMAQ) – This program was established bythe 1991 Federal Intermodal Surface Transportation Efficiency Act (ISTEA) and was re-authorizedwith the passage of SAFETEA-LU in 2004. CMAQ funds are directed to transportation projects andprograms that contribute to the attainment or maintenance of National Ambient Air QualityStandards in nonattainment or air quality maintenance areas for ozone, carbon monoxide, orparticulate matter under provisions in the Federal Clean Air Act. Eligible projects are as follows:public transit improvements; high occupancy vehicle (HOV) lanes; Intelligent TransportationInfrastructure (ITI); traffic management and traveler information systems (e.g., electric tollcollection systems); employer-based transportation management plans and incentives; traffic flowimprovement programs (signal coordination); fringe parking facilities serving multiple occupancyvehicles; shared ride services; bicycle and pedestrian facilities; flexible work-hour programs;outreach activities establishing Transportation Management Associations; fare/fee subsidyprograms; engine diesel retrofits; alternative fuel vehicles; vehicle congestion pricing; freightintermodal projects; idle reduction projects; and under certain conditions, PM-10 projects.Routine rehabilitation projects and projects that are capacity increasing or highway expansiontypically are not eligible. Operations projects may be funded for only three years.
Shasta County’s air quality currently meets the Federal Clean Air Act requirements and therefore isnot eligible for these funds at this time. However, if air quality were to degrade enough to makeShasta County available for these funds, vehicle detection projects may possibly qualify under thisprogram.
October 3, 2013 55 | P a g e
· Shasta County Air Quality Management District (SCAQMD) - “Endeavors to manage andenhance the air quality resources of Shasta County through a balanced program of environmentaloversight and protection of public health.” Typical grant recipient projects include replacingoutdated diesel vehicles and equipment and wood stove rebates. While this is not a directfunding source for SRTA at this present time, potential opportunities may be available in thefuture to accomplish greenhouse reduction measures presented in the Shasta Regional ClimateAction Plan.
· Development Impact Fees - Traffic impact mitigation fees assessed to new development in thelocal cities and/or the County could be used to fund a portion of the deployment of newdetection. Per California law, impact fees can only be assessed to a list of projects orimprovements determined to meet nexus requirements from impacts of development. Specificdata collection solutions may not be explicitly called out for in an approved project list, but couldbe part of roadway construction.
· State Funding Opportunities – At the State level, Intelligent Transportation System (ITS) funding(including vehicle detection systems) is provided as part of the statewide transportationprogramming and funding process administered by Caltrans in coordination with theMetropolitan Planning Organizations (MPOs) and the Regional Transportation Planning Agencies(RTPAs).
· State Highway Operation and Protection Plan (SHOPP) – SHOPP is a program that providesfunding for highway and bridge improvement projects related to rehabilitation, operations, andsafety.
· State Transportation Improvement Program (STIP) - The State Transportation ImprovementProgram (STIP) is a multi-year capital improvement program resource management document toassist the State and local entities to plan and implement transportation improvements, and toutilize resources in a cost-effective manner. All STIP projects must be capital projects (includingproject development costs) needed to improve transportation. These projects generally mayinclude, but are not limited to, improving State highways, local roads, public transit (includingbuses), intercity rail, pedestrian and bicycle facilities, grade separations, transportation systemmanagement, transportation demand management, sound walls, intermodal facilities, safety, andenvironmental enhancement and mitigation projects. STIP funding is split 25 percent toInterregional Transportation Improvement Program (ITIP) projects nominated by Caltrans, and 75percent to Regional Transportation Improvement Program (RTIP) projects decided by regionalagencies. Projects are presented as part of a complete ITIP or RTIP to the California TransportationCommission (CTC) for approval and inclusion in the STIP. The CTC, upon review of the ITIP orRTIP, can accept or reject the program in its entirety.
· Caltrans Planning Grant Program - A call for projects was recently issued for 2013/14 for thisprogram offering funding opportunities in Environmental Justice (EJ), Community BasedTransportation Planning (CBTP), Partnership Planning, and Transit Planning. The typical grant for

October 3, 2013 56 | P a g e
each of these categories has a cap of $300,000 ($250,000 for EJ). Future years may offer similaropportunities that could be applicable to some of the County’s trial and/or strategic planningprograms.
· SB 375/AB 32 - SB 375 is California state legislation that requires the development of regionalreduction targets for greenhouse gas emissions in long-range regional planning for land-use,housing, and transportation. The legislation requires SRTA to direct the development of aSustainable Communities Strategy (SCS) for the region. If the state-determined targets cannot beidentified and met through the SCS, an Alternative Planning Strategy (APS) can be developed andemployed in its place. SB 375 aims to reduce Vehicle Miles Traveled (VMT) and encouragelive/work and sustainable development for the future.
California's major initiatives for reducing climate change or greenhouse gas (GHG) emissions areoutlined in Assembly Bill 32 (signed into law 2006), 2005 Executive Order, and a 2004 ARBregulation to reduce passenger car GHG emissions. These efforts aim at reducing GHG emissionsto 1990 levels by 2020 - a reduction of approximately 30 percent, and then an 80 percentreduction below 1990 levels by 2050.
Both pieces of legislation (SB 375 and AB 32) require the adoption of targets and thedevelopment of plans to achieve those targets within the required time frame. They do notprovide for additional funding for such activities, but rather re-direct current funding towardsgreenhouse reducing approaches.
AB 32 may present opportunities for an innovative funding approach taking advantage of carbonemission credits through the use of the cap and trade mechanism for emissions management.This approach would involve a Carbon Study by the County that defines the carbon emissionssavings that are a direct result of the vehicle detection enhancements defined in this document. Ifthese savings can be proven to be sustainable, they can be eligible for verification andcertification by an independent verification organization and traded as carbon offsets. At the timeof this report, two bills, AB 1532 and SB 1572 have been introduced. These bills “would create theGreenhouse Gas Reduction Account within the Air Pollution Control Fund. The bill would requiremonies, as specified, collected pursuant to a market-based compliance mechanism be depositedin this account. The bill also would require those monies, upon appropriation by the Legislature,be used for purposes of carrying out the California Global Warming Solutions Action of 2006.” Inshort, data collection technologies that will help monitor and reduce congestion and emissionshave the potential of receiving funding from this account.

October 3, 2013 57 | P a g e
VI. SUMMARY
The SRTA and Caltrans District 2 have partnered to develop a plan for an integrated traffic data collectionsystem that will collect and distribute timely, reliable, accurate, and quality traffic data. The overall projectgoal is to develop a plan to deploy an enhanced data collection system that provides agencies withcurrent and frequent traffic data for planning, developing and managing an effective transportationsystem. This system will build upon the current data collection infrastructure utilized by Caltrans District 2for their Census program.
Based on several stakeholder workshops, the ultimate recommended system is one that will expand theexisting system through the use of already deployed technology requiring little integration effort and nochanges to existing data collection procedures. The following is a summary of project recommendationsto deploy an Integrated Traffic Data Collection System:
1. Expand the network of permanent detector count stations through the installation of newdetection stations or upgrade of temporary detection stations at every interchange throughoutthe SCUR. At each interchange, the count stations will monitor mainline, on-ramp, and off-ramptraffic providing engineers and planners with volume, speed, and classification data.
2. Provide permanent communications and detection equipment to automatically collect data on amore frequent basis. Currently, data is collected based on a schedule set for Census data. Trafficdata at some locations are only collected once every three years via manual data collectionprocesses. A permanent data collection system will provide current, timely data to better evaluatetraffic trends, develop performance measures, and validate traffic models. An additional benefit ofexpanding the permanent count station network is that over time the additional infrastructure(controller cabinets, conduits, power, communication, etc.) will prepare the region for future trafficcongestion monitoring and ramp metering. When the time comes that Caltrans District 2 andSRTA wish to deploy technology for real-time congestion monitoring, the expensive infrastructurewill be in place and minimal device upgrades will be required. Additionally, this recommendedsystem will provide the District with a single data collection network capable of census datacollection and traffic monitoring.
3. Conduct a Bluetooth Pilot Test to evaluate the performance and data samples for origin-destination data. If results are acceptable, deploy Bluetooth field equipment at Gateway locations.This will enable SRTA to collect and analyze origin-destination data for intra- and inter-regionaltrips.
4. If the Caltrans Headquarters’ project to automate the interface between TSN and PeMS is notscheduled for the near future, SRTA should consider deploying third party software with dataprocessing and reporting capabilities. The tool should be able to seamlessly compile count dataprovided by Caltrans and integrate with various types of detection technologies to allow foradditional future expansion. This will provide the SRTA a simpler and quicker process foraccessing and manipulating traffic count data.

October 3, 2013 58 | P a g e
Table 5 below summarizes the planning level costs associated with the recommended Traffic DataCollection System project that will create a system that fits the data needs of SRTA and Caltrans District 2.
Table 5: Summary of Proposed Project Costs
ProjectInstallation Costs
O&M Costs(Annually)
Gateway Origin-Destination Stations $510,000 $58,000
Detector Project 1 $851,000 $39,000
Detector Project 2 $496,000 $22,000Detector Project 3 $562,000 $25,000
Detector Project 4 $562,000 $25,000Detector Project 5 $284,000 $13,000Detector Project 6 $142,000 $6,000
Detector Project 7 $199,000 $9,000
Total Installation Costs: $3,606,000 -Total Annual O&M Costs: - $197,000
Future ConditionsConvert stations from Detector Project 1 to TMS $79,000 $15,000Convert stations from Detector Project 2 to TMS $46,000 $9,000Convert stations from Detector Project 3 to TMS $53,000 $11,000Convert stations from Detector Project 4 to TMS $53,000 $11,000Convert stations from Detector Project 5 to TMS $26,000 $5,000
Convert stations from Detector Project 6 to TMS $13,000 $9,000
Convert stations from Detector Project 7 to TMS $20,000 $4,000
Total Installation Costs: $290,000 -
Net Increase Annual O&M Costs1: - $64,0001 Net increase in O&M costs reflects the additional costs of Traffic Monitoring Stations due to additional communication and powerrequirements.
SRTA and Caltrans District 2 should pursue multiple funding sources for the deployment of therecommended integrated data collection system. Both Federal and State funding sources should bemonitored and pursued when grant opportunities are released. California’s new Cap & Trade programmay provide an innovative funding source to fund capital projects that meet ITS needs and help reducevehicle emissions. The stakeholders also should evaluate the prospects for including data collectionsystem elements into other capital projects, similar to the inclusion of fiber installation in the I-5expansion project currently taking place.

AppendixAExistingCountStationLocations

October 3, 2013 Appendix A
EXISTING COUNT STATION LOCATIONS

AppendixBDetectorTechnologyEvaluation
Matrix

Volu
me
Spee
d
Occ
upan
cy
Clas
sific
atio
n
Trav
elTi
me
Orig
in-
Dest
inat
ion
Inductive Loop X X X X Excellent YesRoadway Surface (2 loops
per lane)Low Low Low Low Hardwire or Solar 15 to 20 Years Excellent 28 hours
Radar X X X X Very GoodSide Fire - No
Overhead - YesOverhead or Side Fire (1
per cross section)Low to
ModerateModerate Moderate
Low toModerate
Hardwire or Solar 10 to 15 Years Very Good 40 Hours
Video ImageDetection
X X X X GoodSide Fire - No
Overhead - YesOverhead or Side Fire (1
per cross section)Moderate Moderate Moderate
Low toModerate
Hardwire 7 to 10 Years Excellent 48 Hours
License PlateReader
X X Very GoodSide Fire - No
Overhead - YesOverhead or Side Fire (1
per cross section)Low Moderate Moderate
Moderate toHigh
Hardwire or Solar 10 Years Good 48 Hours
Magnetometer X X X Very Good Yes
Sensors in roadway surface(1 per lane); Access Point
and Repeaters polemounted
Moderate Moderate Low Low
Hardwire or Solar forAccess Point; Battery
for Sensors andRepeaters
5-10 Years Very Good 36 hours
Acoustic X X X GoodSide Fire - No
Overhead - YesOverhead or Side Fire (1
per cross section)Moderate High High Moderate Hardwire or Solar 8 Years Fair 50 Hours
Bluetooth X X X X X Good NoSide Fire (1 per cross
section)Low Moderate Moderate
Moderate toHigh
Hardwire or Solar Unknown Fair to Good 40 Hours
Toll Tag (RFID) X X GoodSide Fire - No
Overhead - YesRoadway Surface Moderate Low Moderate
Moderate toHigh
Hardwire or Solar 8 to 10 Years Good 40 Hours
Third-Party GPS-Based Traffic Data
X X X Very Good None None Moderate Moderate Moderate High Not Applicable Unknown Very Good Unknown
Last Updated:
Technology AccuracyLane Closure for
InstallationMounting Configuration
EstimatedAnnual O&M
Staff Hours (perlocation)
MaintenanceFrequency
Power Supply(Hardwire or Solar)
EstimatedLifespan
IntegrationDifficulty
Expected Long-Term Viability
10/3/2013
APPENDIX B - DETECTOR TECHNOLOGY EVALUATION MATRIX
CalibrationDifficulty
VerificationFrequency
Data Collected

AppendixCAlternativesAnalysis

Gap Alternatives PriorityOptional Solutions
Pros ConsElements Required
(per location)Estimated Unit
Costs
Estimated Installation Costs
(per location, excluding power and communications)
Estimated Annual O&M Staff Hours (per
location)
Detector Loops (Assumes loops are already existing)
• Little or no integration costs• Standard technology used state‐wide• Excellent accuracy and long‐term viability• Consistent with current deployment of permanent stations
• Traffic impact during construction• Reinstallation or repair of loops degrades pavement life
• 334 Controller Cabinet/Foundation• Diamond Counter• 250' of Conduit (including DLCs)
$15,000$4,000$16,250 $35,250 28
Radar Detection
• Low integration effort• Very good accuracy and long‐term viability• Can function as a stand‐alone system via wireless connection to TMC• Little to no construction impact
• Moderate to high calibration difficulty• High truck volume can decrease accuracy due to occlusion
• Radar Detector and Controller• Pole/Foundation
$8,000$6,000 $14,000 40
Magnetometer
• Low integration effort• Low communication bandwidth required • Very good accuracy and long‐term viability• Quick installation minimizes traffic impact
• Cannot detect stopped vehicles• Smaller detection zone per unit• Traffic impact during construction• Can experience calibration issues
• 3 Magnetometers and Controller• Access Point• Pole/Foundation
$12,000$3,500$6,000
$21,500 36
Upgrade non‐permanent stations to TMS. MediumDetector Loops
(Assumes loops are already existing)
• Can provide automatic and frequent data collection to a central system with automatic polling every 30 seconds.• Little or no integration costs• Standard technology used state‐wide• Excellent accuracy and long‐term viability
• Needs ATMS or central system to collect and store data• Traffic impact during construction• Reinstallation or repair of loops degrades pavement life
• 334 Controller Cabinet/Foundation• 170/2070 Controller• 3 Detector Cards• 250' of Conduit (including DLCs)
$15,000$4,000$750
$16,250
$36,000 28
Detector Loops• Little or no integration costs• Standard technology used state‐wide• Excellent accuracy and long‐term viability
• Traffic impact during construction• Moderate to high maintenance required
• 6 Detector Loops• 334 Controller Cabinet/Foundation• Diamond Counter• 250' of Conduit (including DLCs)
$3,900$15,000$4,000$16,250
$39,150 28
Radar Detection
• Low integration effort• Very good accuracy and long‐term viability• Can function as a stand‐alone system via wireless connection to TMC
• Moderate to high calibration difficulty• High truck volume can decrease accuracy due to occlusion
• Radar Detector and Controller• Pole/Foundation
$8,000$6,000 $14,000 40
Magnetometer• Low integration effort• Low communication bandwidth required • Very good accuracy and long‐term viability
• Cannot detect stopped vehicles• Smaller detection zones per unit• Traffic impact during construction
• 3 Magnetometers and Controller• Access Point• Pole/Foundation
$12,000$3,500$6,000
$21,500 36
Install new traffic monitoring system (TMS) stations at regular intervals on the mainline between major interchanges and at on and off ramps.
Medium Detector Loops
• Can provide automatic and frequent data collection to a central system with automatic polling every 30 seconds.• Little or no integration costs• Standard technology used state‐wide• Excellent accuracy and long‐term viability
• Needs ATMS or central system to collect and store data• Traffic impact during construction• Reinstallation or repair of loops degrades pavement life
• 6 Detector Loops• 334 Controller Cabinet/Foundation• 170/2070 Controller• 3 Detector Cards• 250' of Conduit (including DLCs)
$3,900$15,000$4,000$750
$16,250
$39,900 28
Wireless to T1• Preferred if cabling/conduit do not exist• Minimal disturbance to traffic or environment during installation
• Must have line of sight• Wireless Connection• Ongoing Monthly Service
$2,000$300/mo
$2,000 +$300/month
‐
ISDN• Minimal disturbance to traffic or environment during installation
• Must have an access point in vicinity of equipment• Requires come conduit installation to demarcation point• Not preferred by Caltrans
• ISDN Modem• Ongoing Monthly Service
$2,000$150/mo
$2,000 +$150/month
‐
Cellular• Minimal disturbance to traffic or environment during installation
• Requires dial‐up process to access data• Limited bandwidth capability
• Telephone or private cellular modem• Ongoing Monthly Service
$2500$50/mo
$2500 + $50/month
‐
Fiber Optic• Robust, reliable communication medium• Higher bandwidth capabilities
• Costly solution if new conduit is required• Agency‐Owned Fiber Optic Cable• Ethernet Switch
$750,000/mile $750,000/mile ‐
Copper Twisted Pair • Robust, reliable communication medium • Costly solution if new conduit is required• Agency‐Owned Copper (Twisted‐Pair) Cable• Modem
$700,000/mile $700,000/mile ‐
APPENDIX C ‐ ALTERNATIVE ANALYSIS
#2: Lack of permanent count stations installed at locations where data is most desired.
#1: Lack of permanent count stations.
High
HighConvert communication lines to wireless network communication.
#3: Limited communication network to allow for regular polling of data.
Convert communication lines to hardwire network communication.
Medium
Upgrade non‐permanent stations to permanent stations.
High
Install new permanent count stations at regular intervals on the mainline between major interchanges and at on and off ramps.

Gap Alternatives PriorityOptional Solutions
Pros ConsElements Required
(per location)Estimated Unit
Costs
Estimated Installation Costs
(per location, excluding power and communications)
Estimated Annual O&M Staff Hours (per
location)
APPENDIX C ‐ ALTERNATIVE ANALYSIS
License Plate Reader• Minimal traffic impact during construction• Can be a stand‐alone system• Minimal traffic impact during installation
• Uses proprietary software to digitize and translate images• Requires effort to integrate with existing process and procedures
• Automatic License Plate Readers (ALPR)• ALPR Software and User License• Pole and Foundation
$50,000$6,600$6,000
$62,600 48
Bluetooth
• Low costs• Very good accuracy• Minimal traffic impact during construction• Can be a stand‐alone system
• High integration effort• Insufficient sample size concerns• Long‐term viability is questionable due to increasing cellular device security restrictions
• Bluetooth Detector and Controller• Pole/Foundation
$2,500$6,000 $8,500 40
License Plate Reader• Minimal traffic impact during construction• Can be a stand‐alone system when paired with wireless communication to TMC.
• Uses proprietary software to digitize and translate images• Requires effort to integrate with existing process and procedures
• Automatic License Plate Readers (ALPR)• ALPR Software and User License• Pole and Foundation
$50,000$6,600$6,000
$62,600 48
Bluetooth• Low costs• Very good accuracy• Minimal traffic impact during construction
• High integration effort• Insufficient sample size concerns• Long‐term viability is questionable due to increasing cellular device security restrictions
• Bluetooth Detector and Controller• Pole/Foundation
$2,500$6,000 $8,500 40
Install separate system at a central facility that communicates solely to O&D count stations.
High ‐
• Will allow the O&D tracking system to operate independently from other data collection system• Potential for more off‐the‐shelf solutions rather than custom development
• Increased costs and effort to implement and maintain a secondary central system
• Central software• Workstation with storage• Modem
‐Varies based on number
of installations Varies based on number
of installations
Integrate detection to a single data collection system High ‐• Entire system for O&D data and real‐time data is integrated into a single system
• Streamlined maintenance and management on a single system
• Modify existing process or modify future system to process O&D and other detection data
‐Varies based on added
features Varies based on added
features
Upgrade existing software functionality to create automated polling of non‐TSN/PeMS files that are separate from the polls for TSN/PeMS.
Low ‐• Maintains a single software system for ease of maintenance
• Increased costs and effort due to required integration of communications and data processing functionality
• Upgrade software functionality• Provide archived storage
‐Varies based on added
features Varies based on added
features
Provide new software used for data processing and real‐time monitoring
Low ‐
• Clean interface with detection locations that provide monitoring capabilities• Potential for proven off‐the‐shelf solutions rather than custom development
• Increased costs and effort to implement and maintain a secondary central system• Effort needed to integrate new software to existing systems
• New software that stores and archives data, processes and compiles reports when prompted through a user‐friendly interface (e.g., Wavetronix DataCollector, IBM ITS Traffic Management System, MS2's Transportation Data Management System)• Workstation with storage
‐ Varies based on software Varies based on software
Speed up the time it takes for data to transfer to PeMS from TSN.
High ‐
• Potential for census data to be available as soon as it is posted to TSN• No customized software would be required to access data.
• SRTA and District 2 have no control over software development schedule.• Would still be dependent on existing census data collection schedule.
• Caltrans Headquarters PeMS department needs to develop software to automatically download census data from TSN.
‐ None None
#5: Lack of O&D central system.
#6: Current central system cannot archive or monitor real‐time congestion levels or incidents.
Install count stations at County gateways. High
Install count stations at SCUR gateways.
#4: Lack of O&D data collection equipment.
High

Gap Alternatives PriorityOptional Solutions
Pros ConsElements Required
(per location)Estimated Unit
Costs
Estimated Installation Costs
(per location, excluding power and communications)
Estimated Annual O&M Staff Hours (per
location)
APPENDIX C ‐ ALTERNATIVE ANALYSIS
‐
• Potential for proven off‐the‐shelf solutions rather than custom development• Little effort needed to program a user‐friendly interface for report querying
• Costs incurred from subscribing to third‐party services• Effort needed to integrate the software.• Data integrity compromised
• New software that stores and archives data, processes and compiles reports when prompted through a user‐friendly interface (e.g., Wavetronix DataCollector, IBM ITS Traffic Management System, MS2's Transportation Data Management System)• Workstation with storage
‐ Varies based on software Varies based on software
‐
• Removes costs incurred through the use of third‐party software• Can be customized to the needs and preferences of the District
• Extensive effort required to create the database • May not be as efficient as software that's already been developed and implemented by others• Data integrity compromised
• Macro‐scripting through database programs such as Excel, Access, MySQL, etc.• Interface that a user can request data and reports from.
‐Varies based on
programming effortsVaries based on
programming efforts
Last Updated: 9/25/2013
#7: No direct way for external agencies to query or compile reports until data is
posted to PeMS.
MediumCreate a database and subsequent tool/application that allows a user to query and/or obtain data, prior to the data being posted to TSN or PeMS

AppendixDRecommendedProjects

CURRENT IMPROVEMENTS
DATA PROCESSING AND REPORTING
Deploy third party data processing andreporting tool
N/A-
- Cost will vary depending on number offield equipment, desired capabilities andfunctionality.
GATEWAYS
Deploy Bluetooth Pilot Test at two GatewaysGateway 2: I-5 South of Fawndale RdGateway 5: I-5 North of Bowman Rd
2 Ö 20,000$ 6,000$
Install O-D Stations at I-5 GatewaysGateway 2: I-5 South of Fawndale RdGateway 5: I-5 North of Bowman Rd
2 Ö 196,000$ 21,000$
Install O-D Stations at CA-299 and CA-44Gateways
Gateway 1: CA 299 West of French Gulch RdGateway 3: CA-299 East of Dry Creek RdGateway 4: CA-44 East of Deschutes Rd
3 Ö 294,000$ 31,000$
Staff Training for License Plate Reader System -$ -$ Combine with Project No. 1
Install central system for ALPR integration.Cost included in Capital Cost of Project No. 1
-$ -$ Combine with Project No. 1
510,000$ 58,000$DETECTOR PROJECT 1
Install new permanent mainline station andnew permanent on and off-ramp station alongI-5
CA-44 to Knighton Road 8 Ö 567,000$ 26,000$
Install new permanent mainline station andnew permanent on and off-ramp station alongCA-44
CA-44/Interstate 5 Interchange 4 Ö 284,000$ 13,000$
851,000$ 39,000$
APPENDIX D - RECOMMENDED PROJECTS
Project DependenciesO&M Cost
(Annual Cost)
PowerSource
Hard
-Wire
Sola
r
Project Location Elements
Perm
anen
tSt
atio
nto
TMS Install Count
Station
Blue
toot
hProject Description
Planning LevelCapital Cost
(includingproject
developmentcosts)AL
PR
Total Gateway Project Costs
Total Project 1 Costs
Dete
ctor
Loop
s
Project Limit
Upg
rade
Non
-Pe
rman
ent
Stat
ion

APPENDIX D - RECOMMENDED PROJECTS
Project DependenciesO&M Cost
(Annual Cost)
PowerSource
Hard
-Wire
Sola
r
Project Location Elements
Perm
anen
tSt
atio
nto
TMS Install Count
Station
Blue
toot
hProject Description
Planning LevelCapital Cost
(includingproject
developmentcosts)AL
PR
Dete
ctor
Loop
s
Project Limit
Upg
rade
Non
-Pe
rman
ent
Stat
ion
DETECTOR PROJECT 2
Install new permanent mainline station andnew permanent on and off-ramp station alongI-5
Ox Yoke Road to Gas Point Road (South Gateway) 7 Ö 496,000$ 22,000$
496,000$ 22,000$DETECTOR PROJECT 3
Install new permanent mainline station andnew permanent on and off-ramp station alongI-5
Oasis Road to CA-299 6 Ö 425,000$ 19,000$
Install new permanent mainline station andnew permanent on and off-ramp station alongCA-299
CA-299/Interstate 5 Interchange 1 Ö 71,000$ 3,000$
Upgrade existing mainline station to apermanent station and install new permanenton and off-ramp station along CA-299
CA-299/Interstate 5 Interchange 1 Ö 66,000$ 3,000$ Assume loops are existing
562,000$ 25,000$DETECTOR PROJECT 4
Install new permanent mainline station andnew permanent on and off-ramp station alongI-5
Fawndale Road (North Gateway) to Pine GroveAvenue
7 Ö 496,000$ 22,000$
Upgrade existing mainline station to apermanent station and install new permanenton and off-ramp station along I-5
Fawndale Road (North Gateway) to Pine GroveAvenue
1 Ö 66,000$ 3,000$ Assume loops are existing
562,000$ 25,000$
Total Project 2 Costs
Total Project 3 Costs
Total Project 4 Costs

APPENDIX D - RECOMMENDED PROJECTS
Project DependenciesO&M Cost
(Annual Cost)
PowerSource
Hard
-Wire
Sola
r
Project Location Elements
Perm
anen
tSt
atio
nto
TMS Install Count
Station
Blue
toot
hProject Description
Planning LevelCapital Cost
(includingproject
developmentcosts)AL
PR
Dete
ctor
Loop
s
Project Limit
Upg
rade
Non
-Pe
rman
ent
Stat
ion
DETECTOR PROJECT 5
Install new permanent mainline station andnew permanent on and off-ramp station alongCA-44
Shasta View Drive to Airport Drive 4 Ö 284,000$ 13,000$
284,000$ 13,000$DETECTOR PROJECT 6
Install new permanent mainline station andnew permanent on and off-ramp station alongCA-299
Churn Creek Road to Old Oregon Trail 2 Ö 142,000$ 6,000$
142,000$ 6,000$DETECTOR PROJECT 7
Upgrade existing profile station to apermanent profile station
CA-299 at Deschutes Road 1 Ö 66,000$ 3,000$ Assume loops are existing
Upgrade existing mainline station to apermanent station and install new permanenton and off-ramp station along CA-44
CA-44 at Deschutes Road 2 Ö 133,000$ 6,000$ Assume loops are existing
199,000$ 9,000$
3,606,000$ 197,000$
Total Project 7 Costs
Total "Current Improvements" Cost1
Total Project 5 Costs
Total Project 6 Costs
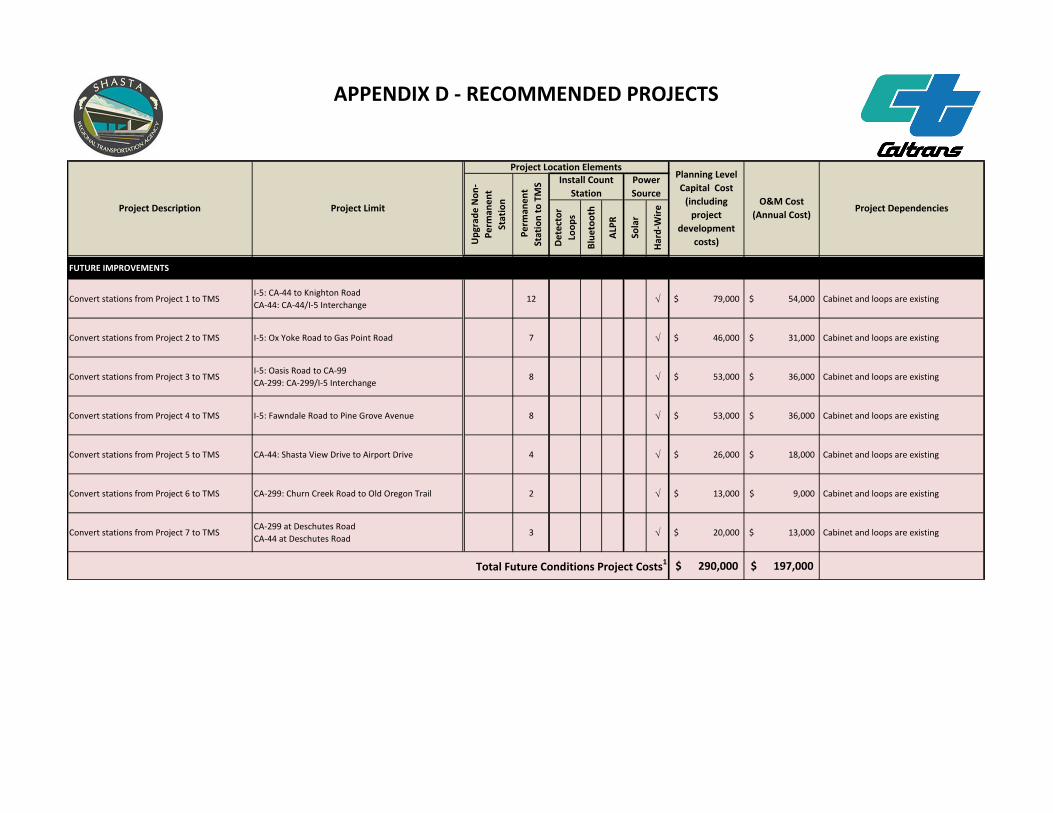
APPENDIX D - RECOMMENDED PROJECTS
Project DependenciesO&M Cost
(Annual Cost)
PowerSource
Hard
-Wire
Sola
r
Project Location Elements
Perm
anen
tSt
atio
nto
TMS Install Count
Station
Blue
toot
hProject Description
Planning LevelCapital Cost
(includingproject
developmentcosts)AL
PR
Dete
ctor
Loop
s
Project Limit
Upg
rade
Non
-Pe
rman
ent
Stat
ion
FUTURE IMPROVEMENTS
Convert stations from Project 1 to TMSI-5: CA-44 to Knighton RoadCA-44: CA-44/I-5 Interchange
12 Ö 79,000$ 54,000$ Cabinet and loops are existing
Convert stations from Project 2 to TMS I-5: Ox Yoke Road to Gas Point Road 7 Ö 46,000$ 31,000$ Cabinet and loops are existing
Convert stations from Project 3 to TMSI-5: Oasis Road to CA-99CA-299: CA-299/I-5 Interchange
8 Ö 53,000$ 36,000$ Cabinet and loops are existing
Convert stations from Project 4 to TMS I-5: Fawndale Road to Pine Grove Avenue 8 Ö 53,000$ 36,000$ Cabinet and loops are existing
Convert stations from Project 5 to TMS CA-44: Shasta View Drive to Airport Drive 4 Ö 26,000$ 18,000$ Cabinet and loops are existing
Convert stations from Project 6 to TMS CA-299: Churn Creek Road to Old Oregon Trail 2 Ö 13,000$ 9,000$ Cabinet and loops are existing
Convert stations from Project 7 to TMSCA-299 at Deschutes RoadCA-44 at Deschutes Road
3 Ö 20,000$ 13,000$ Cabinet and loops are existing
290,000$ 197,000$Total Future Conditions Project Costs1

APPENDIX D - RECOMMENDED PROJECTS
Project DependenciesO&M Cost
(Annual Cost)
PowerSource
Hard
-Wire
Sola
r
Project Location Elements
Perm
anen
tSt
atio
nto
TMS Install Count
Station
Blue
toot
hProject Description
Planning LevelCapital Cost
(includingproject
developmentcosts)AL
PR
Dete
ctor
Loop
s
Project Limit
Upg
rade
Non
-Pe
rman
ent
Stat
ion
COMMUNICATION AND DATA REPORTING ENHANCEMENTS
Convert communication lines to hardwirenetwork communication in the vicinity ofCentral Redding.
Oasis Road to Hartnell Avenue -$ -$ Cost will vary depending on number offield equipment, desired capabilities andfunctionality.
Intitation efforts to reduce data processingtime from TSN to PeMS on an institutionallevel.
Caltrans Headquarters -$ -$ Cost will vary depending on number offield equipment, desired capabilities andfunctionality.
Upgrade existing central softwarefunctionality to separate polling of non-TSN/PeMS files vs. files intended forTSN/PeMS.
Caltrans Headquarters -$ -$ Cost will vary depending on number offield equipment, desired capabilities andfunctionality.
Install and integrate new software for dataprocessing and real-time monitoring.
SRTA Offices -$ -$ Cost will vary depending on number offield equipment, desired capabilities andfunctionality.
Integrate a new tool/application that allowusers to query data prior to the data beingposted to TSN or PeMS.
SRTA Offices -$ -$ Cost will vary depending on number offield equipment, desired capabilities andfunctionality.
Last Updated: 10/3/2013
1 Cost totals do not include costs related to data processing or data reporting tools. Costs for data processing and reporting may be identified in the future.

AppendixEProposedProjectLocations
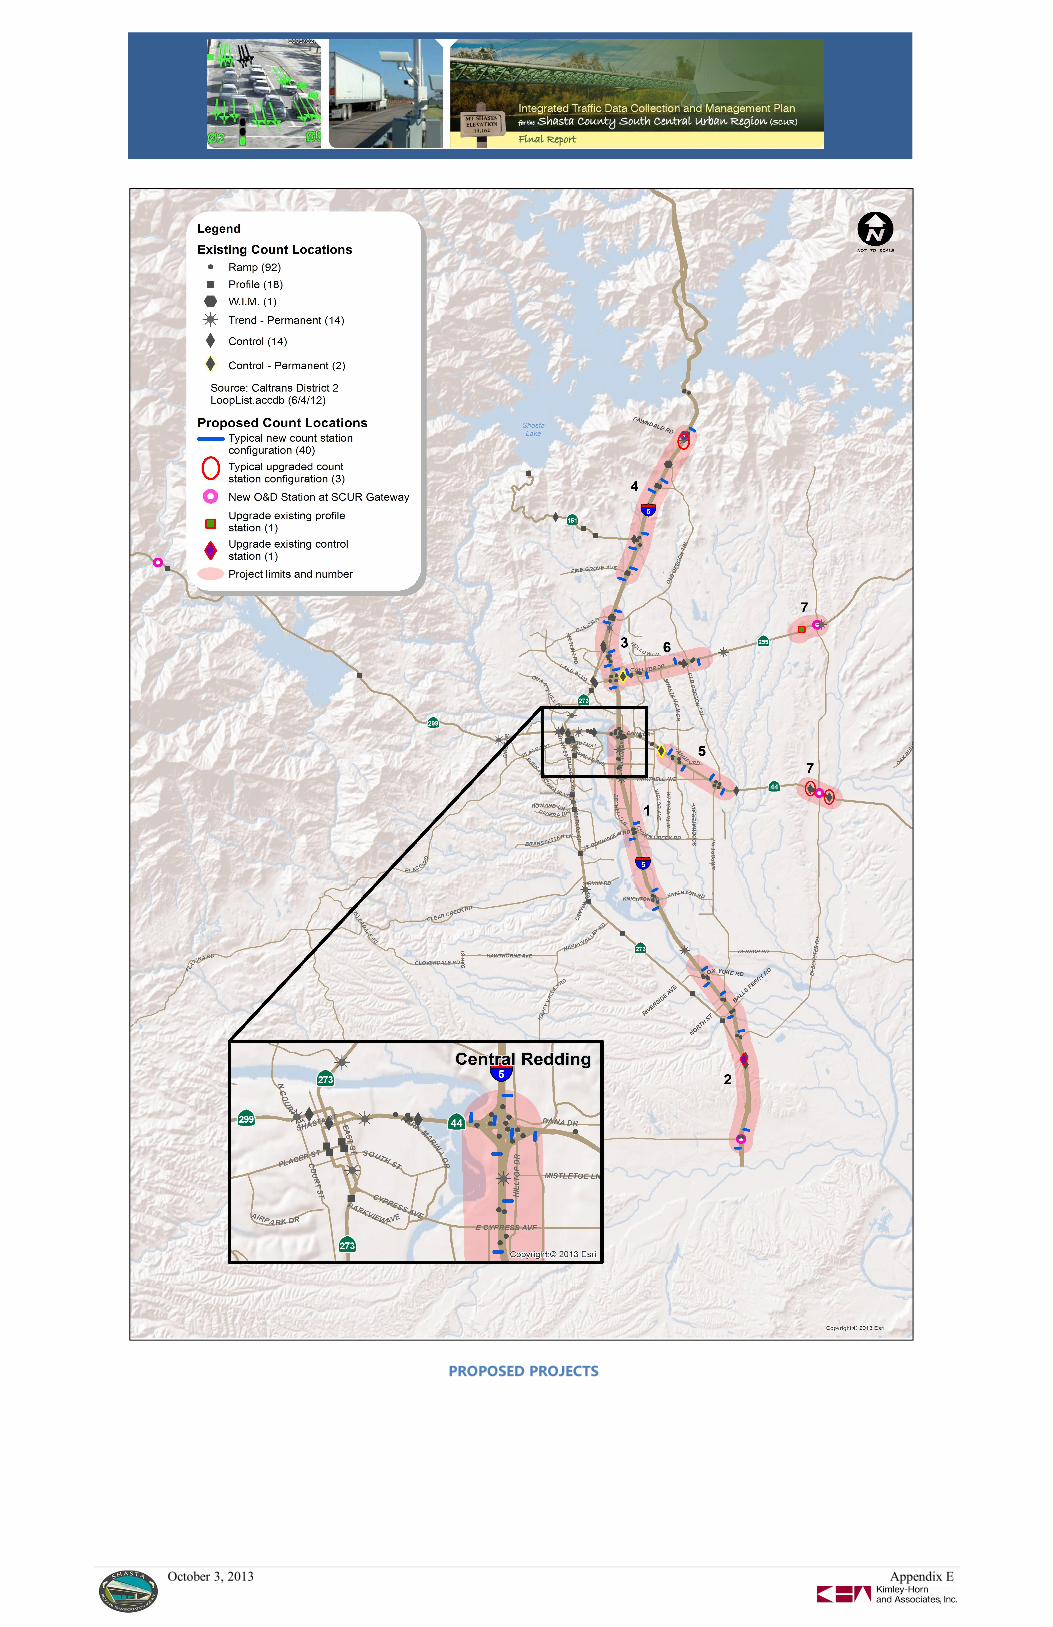
October 3, 2013 Appendix E
PROPOSED PROJECTS

CONTACT
Kimley-Horn and Associates, Inc.1300 Clay StreetSuite 325Oakland, CA 94612-1425
P: 510 625 0712www.kimley-horn.com