integrated top-down and bottom-up model for energy … · aim/end-use (selvakkumaran and ... to...
TRANSCRIPT

Integrated top-down and bottom-up model for energy and CO2
emissions analysis from Thailand’s long-term low carbon energy
efficiency and renewable energy plan
Wongkot Wongsapai
1, 2* Chaichan Ritkrerkkrai
2 J. Pongthanaisawan
3, Suwin Sandu
4
1 Department of Mechanical Engineering, Faculty of Engineering, Chiang Mai University, Thailand
50200; E-Mail: [email protected] 2 Energy Technology for Environment Research Center, Faculty of Engineering, Chiang Mai
University, Thailand 50200, Address; [email protected];
3 National Science Technology and Innovation Policy Office, Thailand
4 University of Technology Sydney, Australia
* Author to whom correspondence should be addressed; E-Mail: [email protected];
Tel.: +6653 944 905 ; Fax: +6653 944 905.
Abstract:
This paper builds the energy demand and supply model from the bottom-up LEAP
software and focus on evaluating and providing insights to the long-term energy and
greenhouse gas impact from the national energy efficiency plan and alternative energy plan
focus from 2015 to 2036 under the 2010 base year. From the results, we found that the
energy demand would increase from 84.77 Mtoe in 2015 to 172.29 Mtoe, or 103.24% in
2036, mainly from the energy efficiency plan by applying the three main programmes with
full successive ratio. The co-benefit result from greenhouse gas emission mitigation would
decrease from 503.34 MtCO2 in 2036,161 and 116 Mt-CO2 from energy efficiency and
alternative energy development plan in 2036, respectively. We also found that this
mitigation also impacts to the decrease of grid emission factor from 506 in the BAU to 339
and 140 kgCO2-eq per MWh due to the higher renewable energy sources and imported
hydro energy. From the LEAP results, the energy oriented input-output model with flexible
production functions have been analyzed for the GDP and sectoral output, employment and
trade balance impact from those integrated plans. We found that compared with the BAU,
the integrated energy plans will have marginally negative impact on employment from
0.5% fewer jobs but higher energy efficiency targets would improve the trade balance as
all non-energy sectors increase their outputs for international markets and also less
dependent on energy imports of the country. Policy recommendations to deploy both
energy plans are also raised.
Keywords: Energy efficiency plan; Renewable energy plan; Energy model; Greenhouse
gas emission
Energy Systems Conference 2016: 21st Century Challenges

1. Introduction
Energy is one major factor input in all goods and services in all economic sectors. After the
industrial revolution in 1700s, world energy consumption have been continuously increased which
results in higher extensively fossil fuels production and the risen of greenhouse gas (GHG) level from
human activities. As one of ongoing developing countries of Asia which planned to increase her gross
domestic products (GDP) from industry and commercial sector from the investment of foreign
countries during the past 30 years, Thailand then experienced one of the region’s highest energy and
greenhouse gas growth rate. At present, as the region’s second largest economy and energy consumer,
Thailand alone contributes 20.82% of ASEAN primary energy consumption in 2011 and around 0.9%
of the world (ERIA, 2014).
There have been several studies in different countries in order to assess the energy and
environmental impacts in various sectors. Sahir and Qureshi (2006) studied the structure of various
energy models and their applications. Kuhi-Thaleldt, et al. (2010), Avami and Farahmanpour (2008)
used LEAP model for analyse the energy and GHG emission in Estonia and Iran energy sector,
respectively while Rahmadi, Aye and Moore (2013) applied the LEAP model for Indonesian biofuel
scenario.
For Thailand, LEAP model is the most preferable and reliable model for Thai researchers,
Wangjiraniran and Eua-arporn (2010) and Wangjiraniran, et al. (2011) studied the outlook and future
scenario of Thai energy and GHG scenario to 2030 while Tanatvanit et al. (2003) focused in the
implications of energy demand management and renewable energy in Thailand. Other models such as
AIM/End-use (Selvakkumaran and Limmeechokchai (2015), Selvakkumaran et al. (2015) and
Selvakkumaran et al. (2014)), MARKAL (Pattanapongchai and Bundit Limmeechokchai (2011)),
GAMS based least cost PGEP model (Promjiraprawat and Limmeechokchai (2012)) and MESSAGE
(Selvakkumaran and Limmeechokchai (2013)) also frequently used for developing long-term energy
and environmental scenario.
Considering the 1990 to 2010 period, we found that the energy consumption in Thailand
continuously increased at an annual average rate of 4.4%. At present, energy consumption is 2.3 times
the amount it was in 1990; the growth rate has been in line with the economic growth rate, of which
the annual average rate is 4.5%. In particular, energy consumption growth rates in the industry and
commercial building sectors are much higher than the GDP growth rate, i.e. 3.0 and 3.7 times
respectively, compared with consumption in 1990 (EPPO, 2011). This means that the energy
efficiency level of the country was far behind the suitable level. Another reason that impact Thailand
to developing the long term plan is the rapidly increase of the world crude oil price since 2004 which
also impacted Thailand, a heavily oil imported country, in many dimensions, e.g. rising in oil import,
dependency, rising of energy import to GDP proportion and oil subsidization.
For long-term sustainable energy planning, Thailand has emphasized secure, adequate energy
supply and sustainable energy use while maximizing self-reliance through the following energy
policies (MoE, 2014);
(a) to promote energy supply security and diversities, emphasizing the use of indigenous energy
resources,

(b) to promote efficient procurement and use of alternative energy sources, and
(c) to emphasize energy management to increase competitiveness of Thailand's production sector
and to enhance stability of energy prices through appropriate monetary, fiscal and managerial
measures.
From the above reasons, Thailand made policy response by developing her first long-term national
energy efficiency development plan (hereafter, EEDP) covering the year 2011 to 2030 and alternative
energy development plan (hereafter, AEDP) covering the year 2012 to 2021.
2. The Energy Efficiency Development Plan
This Energy Efficiency Development Plan (EPPO, 2015) is formulated with a target to reduce
energy intensity by 30% in 2036, compared with that in 2010, or equivalent to reduction of final
energy consumption by 56,142 thousand tons of crude oil equivalent (ktoe) in 2036. From this plan,
the energy intensity, which means the final energy consumption per GDP, would reduce by 30% from
15.28 to 10.7 ktoe per billion Thai Baht in the year 2036, as shown in figure 1.
Figure 1. Thailand’s EEDP Target (EPPO, 2015)
3. The Alternative Energy Development Plan
Thailand energy demand forecasted by Energy Ministry that, an expected demand in 2036 would
be at 131,000 ktoe growing from presently of 75,804 ktoe. The AEDP, as illustrated in figure 2,
determined the renewable energy share increasing from 9,025 ktoe in 2014 to 39,388.67 ktoe in 2036
or 30 percent increase of total energy consumption from renewable for power, heat and biofuels
(DEDE, 2012).
In details, the AEDP plans to deploy 19,684.4 MW installed capacity of power generation, 25,088
ktoe of heat generation and 14 million litres of biodiesel, 11.3 million litres of bioethanol and other
bio-fuel production, all from domestic renewable energy sources.

Figure 2. Thailand’s AEDP Target (DEDE, 2015)
4. About The Model and Scenarios
In this paper, the Long Range Energy Alternatives Planning (LEAP) software was applied to
forecast the energy demand and supply for Thailand. The Business as usual (BAU) was first estimated
based on the data from the GDP, population, past energy and electricity consumption, current energy
situation (year 2012), and energy intensity of the country, then the energy efficiency scenarios, with
successive level, from EEDP have been internalized, as shown in figure 3. Greenhouse gas emission
data also forecasted from the model. All details of the BAU and scenarios are as follows;
Figure 3. Model approach in this study
4.1. Business as usual (BAU)
To develop the BAU of this study, we applied the PDP (2007 version) along with the GDP growth
rate from national data. The average annual growth rate (AAGR) of GDP, calculated from the constant
1988 price, would be 4.39% during 2011-2030 while the AAGR for the population growth in the same
period would be 0.26%.
The demand-side comprises five main sectors, as follows;
Industry sector,
Large commercial building sector,
Household and small building sector,
Solar Wind
3,002 MW6,000 MW
1,200 Ktoe
9,002 MW Power | 1,200 Ktoe Heat
Hydro
Large Hydro2,906.40 MW
Small Hydro376 MW
3,282.40 MW
New-Energy
Geothermal, Used Tire Oil, etc.
10 ktoe
Bio-Fuel
Ethanol Biodiesel Pyrolysis Oil
11.3 ML/Day 14 ML/Day 0.53 ML/Day
Bio-Energy
Biomass BiogasMSW +
Industrial Waste
5,570 MW 600 MW
22,100 ktoe 1,283 ktoe
550 MW
495 ktoe
6,720 MW Power | 23,878 Ktoe Heat
Goal: Target 30% renewables in Total Energy Consumption by 2036
Facilitator: Government
funded RD&D
Facilitator: Private-led investment
Strategy: Alternative Energy Development Plan 2015-2036
Foundation: Commitment to the development of a low-carbon society
CBG
4,800 t/Day
Alt. Fuels*
10 ktoe
* Alternative fuels = Bio-oil, Hydrogen
Energy
Macroeconomic dataset: GDP, POP
Technology data
Energy & Emission data
EEDP
PDP
Na
tio
na
l En
erg
y p
lan
s
With success level
Marginal Abatement Cost (MAC) Data
Energy & GHG Macroeconomic
Model
Data Input Model Process & Analysis Output
BAUScenario
Energyoptions ranking
Mitigation scenarios
• GHG level• Environmental
plan; i.e.NAMAs
• Demand side• Supply side• Reductions
• Base year • GDP Growth
GHG
• Mitigation• Grid emission
factor

Transport sector,
Other sectors (agricultural, construction and mining sector)
However, Thailand final energy demand are from two main sectors; industry and transport with
around 36% share of each sector while industry sector has high proportion at 45%.of electricity
demand of the country.
4.2. Energy Efficiency Scenario
In this EEDP scenario, we prepared the data in each sector as follows;
Industry sector;
Disaggregate into five energy intensive sectors; i.e. cement, food, basic metal, chemical and pulp
and paper industry. Those five sectors had proportion around 84% of total energy consumption in the
year 2009 (DEDE, 2009a)
For energy efficiency improvement estimation, we used the potential energy reduction in each
sector form the difference between Thailand and best practice benchmarking specific energy
consumption (SEC) data from industrialized countries.
The wider gap of SEC between Thai and best practice countries means the higher potential of
energy conservation and efficiency improvement.
Large commercial building sector;
In this sector, the future potential of energy reduction are taken from the difference between the
existing energy consumption in building per area (in the unit of energy consumption per square meter)
and the building energy code (BEC) of Thailand (DEDE, 2009b).
Household and small building sector;
The future potential of energy reduction are taken from the difference between the existing energy
consumption in each main electricity appliances and the high energy performance standard (HEPs) of
Thailand. Here, we focused in lighting, air conditioner, electric water heater for electric energy
potential. For cooking device, we assume the higher efficiency in LPG and charcoal cooking stove.
Transport sector;
For transport sector, the future potential of energy reduction are taken from the difference between
the existing consumption rate and the new fuel economy from Japan standard with 20% energy
efficiency improvement. We also consider the substitute o road transport from conventional fuel to
electricity by using the 70% of new motorcycle sale in 2030 would be electricity motorcycle (IEA,
2009 and Ogden et. Al, 2008, Pongthanaisawan and Sorapipatana, 2012).
4.3. Alternative Energy Scenario
Main For AEDP scenario, we follow the AEDP by disaggregate the renewable energy into three
main tasks; i.e. power, heat and biofuels. The success factor is also considered in this study. The
incremental cost of renewable energy technologies are taken from real domestic datatext paragraph.
5. Results

Even Thailand face slow economic growth in the past ten years, however, continued economic
growth implies growth in energy use. How that energy use and energy efficiency plan would result in
the coming years, we adopted the LEAP (Long-range Alternatives Planning software) model to
forecast Thailand’s future energy consumption by sector, as well as to describe potential future energy
supply arrangements under EEDP and AEDP, respectively.
5.1. The Business as usual (BAU)
From the results, we found that the final energy demand from all sectors in Thailand in the year
2036 would double increase from 71.70 Mtoe in the base year 2010 to 173.14 Mtoe. As presented in
figure 5, the highest proportion would be industry sector at 37%, followed by transport sector at 33%.
Diesel and electricity would have the highest share in final energy demand in 2036 at 27% and 20%,
respectively, as shown in figure 6. Figure 7 compare the final energy demand, by economic sector,
between the year 2010 and 2036.
Considering to the greenhouse gas results, we found that the greenhouse gas from all energy sectors
in Thailand in the year 2036 would be 503 million ton of CO2 equivalent (MtCO2-eq) while it was just
245 MtCO2-eq in the base year 2010.Electricity generation would be the highest proportion with 34%
of total emission in the year 2036. The greenhouse gas emission per capita would also rose in double
from 3.34 to 7.10 tCO2-eq per capita per year, from 2010 to 2036. Figure 8 presents the greenhouse
gas emission from BAU by economics sector.
For the per capita energy consumption and energy intensity from BAU, as presented in figure 9, we
found that the per capita energy consumption would increase from 1,065 to 2,430 ktoe per capita from
2010 and 2036, respectively while the energy intensity would decrease from 15.6 to13.2 ktoe per
billion Baht in the same period.
5.2. The Energy efficiency scenario
The energy saving, from fully success scenario of EEDP, presents in figure 10. From the energy
efficiency results, we found that the final energy demand would decrease from 173.14 Mtoe in BAU to
121.06 Mtoe from all sector energy efficiency scenarios in 2036. The highest share in energy saving
would be industry sector with 48% of total energy saving in 2036.
Figure 5. Final energy demand, BAU, by sector 2005-2036
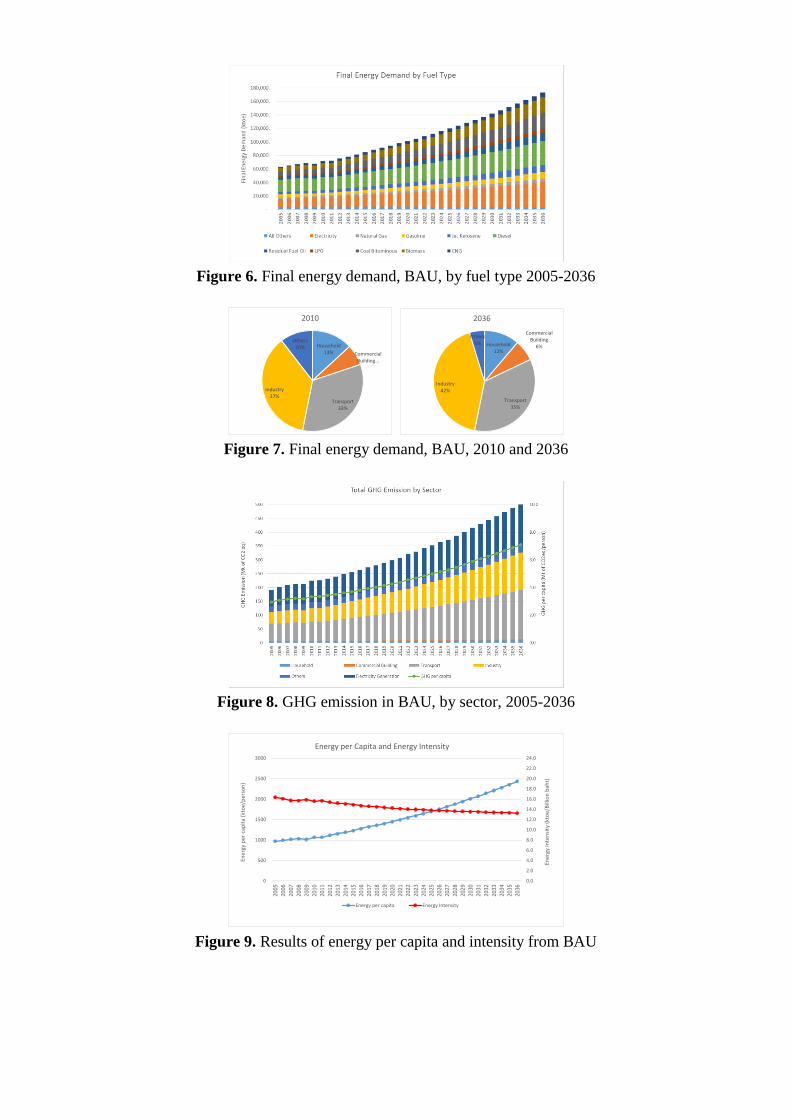
Figure 6. Final energy demand, BAU, by fuel type 2005-2036
Figure 7. Final energy demand, BAU, 2010 and 2036
Figure 8. GHG emission in BAU, by sector, 2005-2036
Figure 9. Results of energy per capita and intensity from BAU
Household13% Commercial
Building…
Transport33%
Industry37%
Others10%
2010
Household12%
Commercial Building
6%
Transport35%
Industry42%
Others5%
2036
0.0
2.0
4.0
6.0
8.0
10.0
12.0
14.0
16.0
18.0
20.0
22.0
24.0
0
500
1000
1500
2000
2500
3000
Ener
gy In
ten
sity
(kt
oe/
Bill
ion
bah
t)
Ener
gy p
er c
apit
a (k
toe/
per
son
)
Energy per Capita and Energy Intensity
Energy per capita Energy Intensity
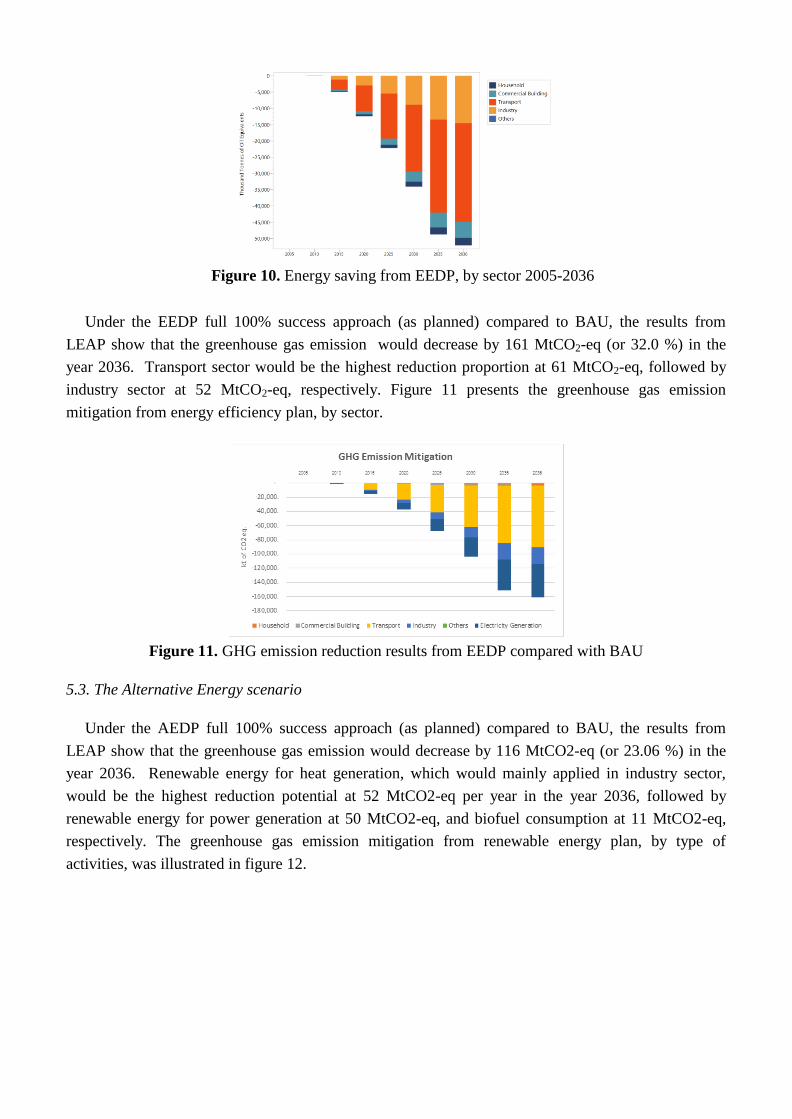
Figure 10. Energy saving from EEDP, by sector 2005-2036
Under the EEDP full 100% success approach (as planned) compared to BAU, the results from
LEAP show that the greenhouse gas emission would decrease by 161 MtCO2-eq (or 32.0 %) in the
year 2036. Transport sector would be the highest reduction proportion at 61 MtCO2-eq, followed by
industry sector at 52 MtCO2-eq, respectively. Figure 11 presents the greenhouse gas emission
mitigation from energy efficiency plan, by sector.
Figure 11. GHG emission reduction results from EEDP compared with BAU
5.3. The Alternative Energy scenario
Under the AEDP full 100% success approach (as planned) compared to BAU, the results from
LEAP show that the greenhouse gas emission would decrease by 116 MtCO2-eq (or 23.06 %) in the
year 2036. Renewable energy for heat generation, which would mainly applied in industry sector,
would be the highest reduction potential at 52 MtCO2-eq per year in the year 2036, followed by
renewable energy for power generation at 50 MtCO2-eq, and biofuel consumption at 11 MtCO2-eq,
respectively. The greenhouse gas emission mitigation from renewable energy plan, by type of
activities, was illustrated in figure 12.

Figure 12. GHG emission reduction results from AEDP compared with BAU
However, due to GHG emission in transport sector are from mobile source, the energy efficiency
policy in this sector would not easy to monitor and verify. Policy maker have to be careful in details on
the policy and should considering both technology improvement along with human behavior.
6. Conclusions
Thailand has experienced rapid growth in oil import and the rising of energy price in the recent
years. Meanwhile, Thai government plan for great efforts to improve energy efficiency and deploy
renewable energy activities, and co-benefit of reduce greenhouse gas emission locally, by introducing
the EEDP and AEDP. This study analyzed the energy demand and the greenhouse gas emission impact
from the energy efficiency scenarios by using the LEAP software. From the results, we found that the
energy demand would increase from 84.77 Mtoe in 2015 to 172.29 Mtoe, or 103.24% in 2036, mainly
from the energy efficiency plan by applying the three main programmes with full successive ratio. The
co-benefit result from greenhouse gas emission mitigation would decrease from 503.34 MtCO2 in
2036,161 and 116 Mt-CO2 from energy efficiency and alternative energy development plan in 2036,
respectively. We also found that this mitigation also impacts to the decrease of grid emission factor
from 506 in the BAU to 339 and 140 kgCO2-eq per MWh due to the higher renewable energy sources
and imported hydro energy.
References
1. Economic Research Institute for ASEAN and East Asia (ERIA), Energy Outlook and Analysis of
Energy Saving Potential in East Asia, ERIA research project report 2013, No.19, Published by
ERIA September 2014.
2. Sahir, Mukhtar H. and Qureshi, Arshad H., Energy modeling applications for analysis of policy
options- an overview. WSEAS Transactions on Systems, Issue 12, Vol 5, December 2006,
pp.2759-2765.
3. Kuhi-Thaleldt, R., Kuhi-Thaleldt, A. and Valtin, J., Estonian electricity production scenarios and
their CO2 and SO2 emissions until 2030. WSEAS Transactions on Power Systems, Issue 1, Vol 5,
January 2010, pp.11-21.
4. Avami, A and Farahmandpour, B, Analysis of environmental emissions and greenhouse gases in
Islamic Republic of Iran. WSEAS Transactions on Environemnt and Development, Issue 4, Vol 4,
April 2008, pp.303-312.
5. Huang, Y., Bor, Y.J. and Peng, C., The long-term forecast of Taiwan’s energy supply and demand:
LEAP model application. Energy Policy, Vol 39, Issue 11, November 2011, pp.6790-6803.
6. Rahmadi, A, Aye, L. and Moore, G. The feasibility and implications for conventional liquid fossil
fuel of the Indonesian biofuel target in 2025. Energy Policy, Vol 61, October 2013, pp 12-21.
7. Tanatvanit, S., Limmeechokchai, B. and Chungpaibulpatana, S.. Sustainable energy development
strategies: implications of energy demand management and renewable energy in
Thailand, Renewable and Sustainable Energy Reviews, Vol. 7, No. 5, October 2003, pp. 367- 395.
8. Wangjiraniran, W. and Eua-arporn, B., The Outlook of Energy-related GHG emission in Thailand,
paper presented at Fostering Economic Growth through Low Carbon Initiatives in Thailand,
Bangkok, Feb 25-26, 2010.
9. Wangjiraniran, W., Vivanpatarakij, S. and Nidhiritdhikrai, R., Impact of Economic Restructuring
on the Energy System in Thailand, Energy Procedia, Vol.9, 2011, pp.25-34.
10. Selvakkumaran, S. and Limmeechokchai, B., Low carbon society scenario analysis of transport
sector of an emerging economy—the AIM/Enduse modelling approach, Energy Policy, Vol. 81,
June 2015, pp. 199-214.
11. Selvakkumaran, S., Limmeechokchai, B., Masui, T., Hanaoka, T. and Matsuoka, Y., A quantitative
analysis of low carbon society (LCS) measures in Thai industrial sector, Renewable and
Sustainable Energy Reviews, Vol. 43 (March 2015), pp. 178-195.
12. Selvakkumaran, S., Limmeechokchai, B., Masui, T., Hanaoka, T. and Matsuoka, Y., Low carbon
society scenario 2050 in Thai industrial sector, Energy Conversion and Management, Vol. 85,
September 2014, pp. 663-674.
13. Pattanapongchai, A. and Limmeechokchai, B. CO2 mitigation model of future power plants with
integrated carbon capture and storage in Thailand. International Journal of Sustainable Energy Vol
30, Supplement 2, 2011, pp.s155-s174.
14. Promjiraprawat, K and Limmeechokchai, B. Assessment of Thailand’s energy policies and
CO2emissions: analyses of energy efficiency measures and renewable power generation, Energies,
Vol. 5, No. 8, August 2012, pp. 3074-3093.
15. Selvakkumaran, S. and Limmeechokchai, B. Energy security and co-benefits of energy efficiency
improvement in three Asian countries, Renewable and Sustainable Energy Reviews, Vol. 20, April
2013, pp. 491-503.
16. MoE, Thailand Energy Strategies 2014-2018, Ministry of Energy, Thailand, 2014, (in Thai)
download from http://www.energy.go.th/th/energy-policy/energy-strategy/
17. EPPO, Energy Efficiency Plan; EEP 2015, Energy Policy and Planning Office, Thailand 2015, (in
Thai) downloaded from http://www.eppo.go.th/encon/EEP2015/Draft-EEP2015.pdf
18. DEDE, Alternative Energy Development Plan: AEDP2015, Department of Alternative Energy
Development and Efficiency, Thailand 2015, (in Thai) downloaded from
http://www.dede.go.th/download/files/AEDP2015_Final_version.pdf
19. DEDE, Energy Balance of Thailand 2014, Department of Alternative Energy Development and
Efficiency, 2014. downloaded from http://www.dede.go.th/
20. DEDE, Thailand Building Energy Code under the Ministerial Regulations A.D.2009, Department
of Alternative Energy Development and Efficiency, 2009b. (in Thai language)
21. IEA, World Energy Outlook, International Energy Agency, OECD/IEA, 2009.
22. Weinert J., Ogden J., Sperling D., Burke A. ,The future of electric two-wheelers and electric
vehicles in China, Energy Policy 66, 2008, pp.4544– 4555.
23. Pongthanaisawan, Jakapong and Sorapipatana, Chumnong, Greenhouse gas emissions from
Thailand’s transport sector: Trends and mitigation options. Applied Energy 2012, pp. 288–298.
24. ONEP, Thailand’s Second National Communication under the United Nations Framework
Convention on Climate Change, Office of Natural Resources and Environmental Policy and
Planning, 2011.downloaded from https://unfccc.int/files/national_reports/non-
annex_i_natcom/submitted_natcom/application/pdf/snc_thailand.pdf