integrated space technologies for natural hazards ... · - presentation of crts - desertification...
TRANSCRIPT

Integrated space technologies for natural hazards monitoring in for natural hazards monitoring in
Morocco
Istanbul, Turkish
15 September, 2010
Noureddine BIJABER
Natural Resources and Environment DepartmentRoyal Centre for Remote Sensing
Rabat, MOROCCO

CONTENTS
- Presentation of CRTS
- Desertification monitoring in Morocco
- Drought monitoring (RS & GIS)- Drought monitoring (RS & GIS)
- Forest fires monitoring

The Royal Center for Remote The Royal Center for Remote Sensing (CRTS)Sensing (CRTS)
Is the national institution responsible for :
- Development of capabilities at the national level
- Coordination and execution of the national program of RS
- Provision of technical advisory services and space information
- provision of training and education opportunities in Space technologies and carrying out reseach actions and programs

Operational applications to support strategic decisions
To support ministerial departments in various fields :
---- Agricultural statistics and production forecastingAgricultural statistics and production forecastingAgricultural statistics and production forecastingAgricultural statistics and production forecasting
---- Water resources managementWater resources managementWater resources managementWater resources management
---- Forest and pastoral resources assessmentForest and pastoral resources assessmentForest and pastoral resources assessmentForest and pastoral resources assessment
---- Urban and land managementUrban and land managementUrban and land managementUrban and land management
---- Space cartography and Space cartography and Space cartography and Space cartography and
geomaticsgeomaticsgeomaticsgeomatics
4
geomaticsgeomaticsgeomaticsgeomatics
---- Environment and hazardsEnvironment and hazardsEnvironment and hazardsEnvironment and hazards
---- Geological applicationsGeological applicationsGeological applicationsGeological applications
---- Oceanography, climate and Oceanography, climate and Oceanography, climate and Oceanography, climate and
marine resourcesmarine resourcesmarine resourcesmarine resources

CONTENTS
- Presentation of CRTS
- Desertification monitoring in Morocco
- Drought monitoring (RS & GIS)- Drought monitoring (RS & GIS)
- Forest fires monitoring

Desertification
in Morocco
Deforestation :31.000 ha/year
Degradation of rangelands: 8 M haDegradation of rangelands: 8 M ha
Overgrazing exceeding23% of the capacity of natural rangelands
Salinity :37.000 haof irrigated areas
Erosion by water :2/3of agricultural areas exposed

Contribution of Remote Sensing and GIS
Satellite data and GIS offer key tools for desertification monitoring at Satellite data and GIS offer key tools for desertification monitoring at
two levels :
- A local monitoring by using high resolution data allowing a specific
management and development of models to extrapolate results to
other sites
- A national monitoring (low resolution data) allowing to reply to national - A national monitoring (low resolution data) allowing to reply to national
plan objectives

Desertification monitoring at two levels
Macro geographic study Meso geographic study
Low resolution data
Macrogeographic indicators
Change maps
High resolution data
Mesogeographic indicators
Change mapsChange maps

NOAA/AVHRR imagery NDVI
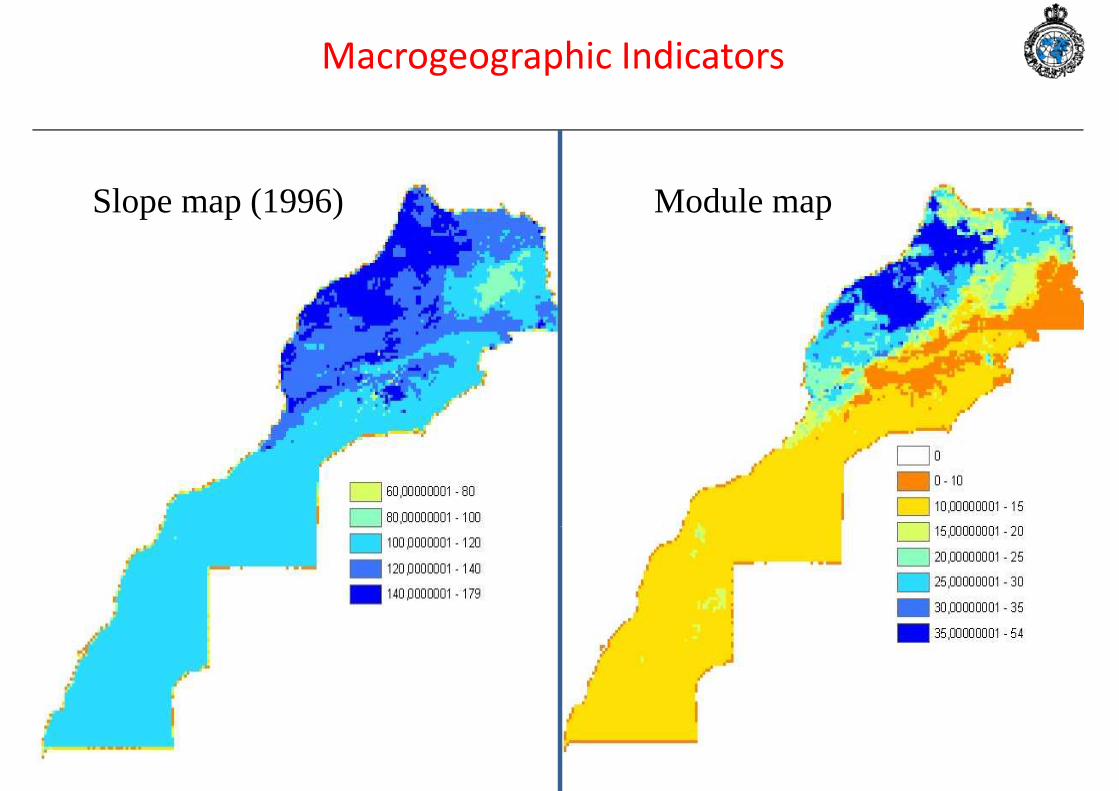
Macrogeographic Indicators
Methodology
AlbedoST
θ
∆Ts
∆NDVI NDVI
Ts
March
July
March July
Since 1996

Slope : Arctangent (θ = ∆Ts/∆NDVI), and Module : (∆Ts & ∆NDVI)
Macrogeographic Indicators
NDVI
V
θ
∆NDVI
March
July
Vector
Land
Cover
Dynamic
22
100
1)T_CNT_CN()NDVI_CNNDVI_CN(Module max_NDVI
smax
smax_Tsmax −+−=
)NDVI_CNNDVI_CN
T_CNT_CNarctan(Pente
maxmax_Ts
max_NDVIs
maxs
−−
×π
= 180
∆ST ST
Ref. : Sobrino & Raissouni (2000 & 2001) on Morocco and on the Mediterranean basin
Le module
Macrogeographic Indicators
Slope map (1996) Module map

1997/1996
Change maps
2000/19962001/19962002/19962002/1996
Classes of land Classes of land use degradation
Stable
Classes of land use recovering

Synthetic map of sensible areas

Macro geographic study Meso geographic study
Desertification monitoring at two levels
Low resolution data
Macrogeographic indicators
Change maps
High resolution data
Mesogeographic indicators
Change maps

Studied zone
Series of satellite images (Landsat-TM, Spot-Series of satellite images (Landsat-TM, Spot-
XS, ASTER, 1986 - 2003)
Other data (field measurements, meteo data,
topographic maps,…)

Land cover Map

Land cover changes detection
1986
2003

Evolution of water areas19862003

Thematic data
Demographic evolution
Years
1996 1997 1998 1999 2000 2001 2002

CONTENTS
- Presentation of CRTS
- Desertification monitoring in Morocco
- Drought monitoring (RS & GIS)- Drought monitoring (RS & GIS)
- Forest fires monitoring

Objective
Elaboration of a drought early warning system based on environmental indicators
calculated from satellite data
Calculate of Indicators and drought early warning,
Methodology / Main steps
� Biophysical parameters extraction from satellite data (NOAA/AVHRR) since1999
� Calculate of drought monitoring indicators from satellite data:� Standardized Vegetation Index (SVI),� Vegetation Condition Index (VCI),� Temperature Condition Index (TCI)� Temperature Condition Index (TCI)� Vegetation Health (VH)
� Calculate of thematic indicators (meteorological, agronomic and forests)
� Bulletin edition

Vegetation Condition Index (results)
VCIOct. 2009
VCINov. 2009
VCIDec. 2009
VCI = (NDVIi – NDVImin) / (NDVImax – NDVImin) * 100Ref. : Felix N. Kogan, 2000
VCIJanv. 2010
VCIFeb. 2010
VCIApr. 2010Janv. 2010 Feb. 2010 Apr. 2010
Between 40 & 60%
Legend
Near to minimal (< 20%)
Between 20 & 40%
Between 60 & 80%
Near to maximal
Clouds (or snow)

TCIOct. 2009
TCINov. 2009
TCIDec. 2009
Temperature Condition Index (results)TCI = (BTmax – BTi) / (Btmax–BTmin) * 100
Ref. : Felix N. Kogan, 2000
TCIJanv. 2010
TCIFeb. 2010
TCIMar. 2010Janv. 2010 Feb. 2010 Mar. 2010
Between 40 & 60%
Legend
Near to minimal (< 20%)
Between 20 & 40%
Between 60 & 80%
Near to maximal
Clouds (or snow)

Indicators (results)
VCI TCI
Legend
Near to minimal (< 20%)
VH < 40% stress(Kogan)
VH = 0,5 VCI + 0,5 TCIDecade3, April 2010
Between 40 & 60%
Between 20 & 40%
Between 60 & 80%
Near to maximal
Clouds (or snow)

SVI
April 2010
Standardized Vegetation Index (results)
April 2010
Decade3
Legend
SVI = (NDVIi – NDVIm) / σσσσ
Ref. : Felix N. Kogan, 2000
Très favorable (0.975 – 1)
LegendTrès défavorable (< 0.025)
Défavorable (0.025 – 0.25)
Normale (0.25 – 0.75)
Favorable (0.75 – 0.975)
Nuages (ou neige)

Integration of thematic dataMaps of meteorological indicator
Standardized Precipitation Index (SPI) “Percent of Normal”
Ref. : DMN Morocco

Map of ploughed fields situation
(December 08) compared to the last ten years mean
Integration of thematic dataMaps of agronomic indicator
Map of cereal seedling situation (wheat and
barley) compared to the last ten years meanto the last ten years mean last ten years mean
Ref. : MADRPM Morocco

Drought warning bulletin
Period : from November to April every year

CONTENTS
- Presentation of CRTS
- Desertification monitoring in Morocco
- Drought monitoring (RS & GIS)- Drought monitoring (RS & GIS)
- Forest fires monitoring

Moroccan forest
9 M ha, 12 % NTDiversity / bioclimat
- Aridity of Moroccan climate
- Degradation >30.000 ha/y
� exploitation� overgrazing
Constraints :
� overgrazing� feeling� forest fires� urbanization� drought� forest health
Forest fires in Morocco
���� > 75% of burned areas is located in the Rif Region (North)
���� July-August : is the risky period
���� > 90% of forest fires are caused by human activities

Remote Sensing to monitor forest fires
���� Forest fires risk mapping at national scale
���� Hot Spot localization
���� Burned areas mapping

Risk index module
ct·bt·a(t)NDVI 2 ++=
NDVI
Vegetation regression index
NDVITS
Vegetation drought index
NDVI estimé
NDVI réel
Temps
LST
nNDVIm += ·T s
LST
NDVI

Forest fires risk : k1*VRI + k2*VDI
Very high risk
High riskModerate risk
Low risk
No risk

Deux feux, de 200 et de 60 ha, survenus le Deux feux, de 200 et de 60 ha, survenus le Deux feux, de 200 et de 60 ha, survenus le Deux feux, de 200 et de 60 ha, survenus le 18/08 18/08 18/08 18/08 dans la dans la dans la dans la zone de Chefchaoun.zone de Chefchaoun.zone de Chefchaoun.zone de Chefchaoun.
Hot Spot
Feu de 1130 ha, survenu dans la zone de Sefrou, le 01/08/2003.

Espèces Area (ha)
Chêne liége 761,404
Chêne Vert 6,624
Feuillés 118,869
Matorral 142,127Matorral 142,127
Reboisements
feuillus 6,999
Reboisements
Résineux 2717,074
Terrains non
Boisés 67,36
Total 3820,457

CONCLUSION
- The presented projects were realized in the objective to develop amethodology to monitor changes in arid ecosystems and productionof documents to help end users.
- Natural hazards (desertification, CC, diseases, ..) are a complexphenomenon (large extend) and result from interaction between
of documents to help end users.
- However,The maps & indicators produced can’t stop natural resourcesdegradation if there is no goodwill to strengthen collaborationbetween institutions at different levels.
phenomenon (large extend) and result from interaction betweenseveral parameters. And it is very difficult to study & monitor thisphenomenon without a global observation of the affected areas.
- Remote sensing and GIS combined to ground data are operational fornatural hazards monitoring at different levels.

Noureddine BIJABER
Natural Resources and Environment DepartmentRoyal Centre for Remote Sensing
Rabat, [email protected]
www.crts.gov.ma