integrated solution for managing liquid loading problem … schlumberger private • to analyse the...
TRANSCRIPT
1
Schlumberger Private
Integrated solution for managing liquid loading problem in gas wells of Burgos fields
Author: Dr Miso Solesa, Jose Luis Martínez, Otoniel Morales Martinez, WCP-ALS, México North, SLB Abstract Schlumberger and PEMEX started the project for integral solution of severe load-up problem in gas wells on Burgos fields by the end of November 2001. It was predicted, by the project, to cover 650 wells in the period of five years, so the expected project deadline would be the end of November 2006 Returning from his round-the world cruise, the Victorian naturalist Charles Darwin was heard to mutter:
“ If Mother Nature can, She will tell a direct lie” The key SLB objective in CISA (Contrato Integrales de Sistema Artificiales) for solving the liquid loading problem in natural gas producing wells was to tell a client (Pemex) the truth, using gathered (measured) data and SLB expertise and knowledge. The considerable efforts were required to define the problem/s in well operations applying the available well problem diagnosis tools, election of the best production methods, design and implementation. Until now more than 470 wells of different production characteristics have been studied and in almost 90% of analyzed wells the new production systems have been applied. The achieved production increase of 95 MMscf/d in the period of 2002-2004 confirm that SLB methodology and solution applied in the project till now can be reliable guarantee for the future activities. 1. Introduction Building the strategy to face the project challenges, we knew that if we could “catch” the symptoms the wells give us, then it would enable the process of diagnosis and problem recognition to be done properly and reliably. We have transformed the limited available data into information that formed a consistent engineering framework for applying the developed methodology of well problem analysis, defining the well performance characteristics, making decision respecting the all constraints of reservoir, well and surface. Knowing that the quality of data has the key role for implementing the integrated solution and the established workflow process, the special attention has been paid to data management (collecting, controlling, analyzing and storing). Addressing the established project objectives, an integrated methodology has been developed to select the most suitable production method/s in a reliable, cost-effective manner. Ambitiously created project defines the strategic aims of mutual activities of which the most important ones are:
• to define the actual status and well performance potential based on the measured values of pressure and temperature in wellbore and the measurements of each separated fluid ( water and condensate);

2
Schlumberger Private
• to analyse the available well data ( technical characteristics, production and workover history);-to select the most suitable production system for solving the liquid loading problem including economic-technical limitations;
• a thorough design and application of selected production system; • a continual daily supervision of well production and the correction of corresponding
parameters depending on actual conditions in the well and on the surface; • development the data base which includes all information of the well history,
measurements of production and pressure, supervision of daily field activities; • an implementation of the well production system in the real time and with the aim to
gather the operational production data and to control well operation • an integration of all relevant data, information, activities and occurrences on static and
dynamic level (real rime production monitoring) all with the aim to optimise well production and to improve the efficiency of the applied production system.
Real time production management (dynamic level), using an easy access to information, is one of the most important issues following the applied project strategy. By using real time data (telemetry) according to knowledge and experience we possess, it is possible to control and manage the well more reliably and accurately avoiding the unwanted production losses and preventing the problems occur again. Having in mind that optimization objective is to maximize production of the wells by minimizing the costs, the telemetry application is balancing the client’s (Pemex) needs, technical and economic limitations. 2.Overview of project organization and processes The project organization has been adjusted in accordance with the foreseen goals so all relevant processes have been covered and the available personnel is used efficiently through the team work. Figure 1 shows the organizational scheme based on identified processes which are necessary for performance of all project predicted activities. As shown on the graphic, there are five crucial steps:
- Preparation of all data (three-phase well production test, pressure and temperature);
- Analysis of characteristic wells, defining problems while in function and suggesting solutions that are to be applied;
- Designing and applying the suggested solutions on the field; - Managing the data, optimising the operation and supervision during the real time; - Administrative support (Financial analysis).
The required flexibility of project management has been achieved thanks to the integration of all processes, stressing that SLB, through their alliances with other companies, has provided those services and equipment which could not be covered by the existing company resources (preparation of chemicals, compressors at the wellhead, additional works on field, flow measurement, underground and surface equipment of the system for well intermittent operation etc.)

3
Schlumberger Private
CISA project
Field survey Well Analysis andDesign Field Operations Optimization Administrative
support
Three phase test
Pressure&Temperaturesurvey
Date BaseInstallations Supervision
Figure 1 – Project process organization
2.1 Field Survey Field surveys include data preparation, which is a minimum of information for analysing, will be performed through the activities of tools on wire and of three-phase production measuring units, as shown on Figure 2.
F ie ld S u rv e y
T h re e p h a s es e p a ra to r te s t
S lic k l in eo p e ra t io n
P ro d u c t io n te s t
F lo w -a f te r f lo wte s t
W e ll c a lib ra t io n
P re s s u re a n dT e m p e ra tu re
s u rv e y
W e ll in te rv e n t io n(T b g p e r fo ra t io n ,
tu b in g s to p . . )
P ro d u c t io n lo g
Figure 2 – Data preparation

4
Schlumberger Private
2.2 Well analysis Using the developed technology (described thoroughly in the next segment) and the available information of well production history and of present well characteristics, based on the performed measurements, a detailed well analysis has been made. This analysis covers the problem diagnosis and suggestions for the application of the most suitable production system. 2.3 Designing and application of the selected production system In the next phase it would be necessary to prepare a detailed design of selected production system installation , including additional data in case a system for periodical operation of well be foreseen with or without chemical preparation (foam stick and liquid foam agent). The additional data, necessary to be applied in order to define, through the design, the initial parameters for system operation, are the following: surface buildup and drawdown pressure on a well at a certain period of time depending on well operation characteristics and field conditions, fluid levels measurements, laboratory analysis of chemicals used to generate the foam in the well, field test data of the foam agents application. Practically, by installing the designed production system the new production phase in the well life has started been , started and through permanent daily supervision they will be monitoring including the modification of some parameters in the cases when it would be required. The organization chart of field activates is shown on Figure 3.
Design, Installation andField Operation
Design Installations Field Operation
Productionsystem for
continuous flow
IntermittentProduction
systemFlow meter Supervison
Surface buildup anddrawdown pressure test,
test with chemicalsPlunger Lift
Motor valve withelectroniccontroler
Foam stickluncher
Coiled tubing Wellheadcompresor
Echometer leveltests
Figure 3- Design, Installations and Field operations

5
Schlumberger Private
2.4 Data management, production optimization and supervision during the real time One of the most important segments in the realization of the project is to build a data base, keep it safe and use these data in all processes. All data that have generated during any previously defined process (high-frequency data like intermittent pressure flow rate data, episodic data as production tests and pressure survey and low-frequency like pressure increment and drawdown, fluid level etc.) are to be stored. All malfunctions and aberrances from the designed production and settled trend could be noted by analyzing the gathered data in the base. This would enable the production optimization process start in time. Real time production monitoring system has been applied at 48 wells, although this completely closes the circle of interacting activities as shown on the Figure 4.
Well Analysis Design and Instllations
Well Optimization
Data collecting
Supervison and Field operations
CISA Data BaseCISA Data BaseTelemtry
Figure 4 – Data base, optimisation, telemetry 3. Well performance and problem diagnosis methodology In tracing the methodology of analyzing the gas wells having liquid loading problem and which wells could most benefit from new production system application it was necessary to develop the modified procedure to evaluate the performance of the wells. Considering that liquid loading problem depend on the pressure and temperature conditions at surface and down hole, as well as the composition of the gas and liquid (condensate) the composite system (NODAL) analysis has selected to define the well model and adjust the actual production data with simulated well behavior. Once the model has been verified it was possibly to perform the sensitivity analysis to evaluate the future wells behavior. In the case that limited data were available to apply the single well system analysis, the multi-criteria ranking model for
6
Schlumberger Private
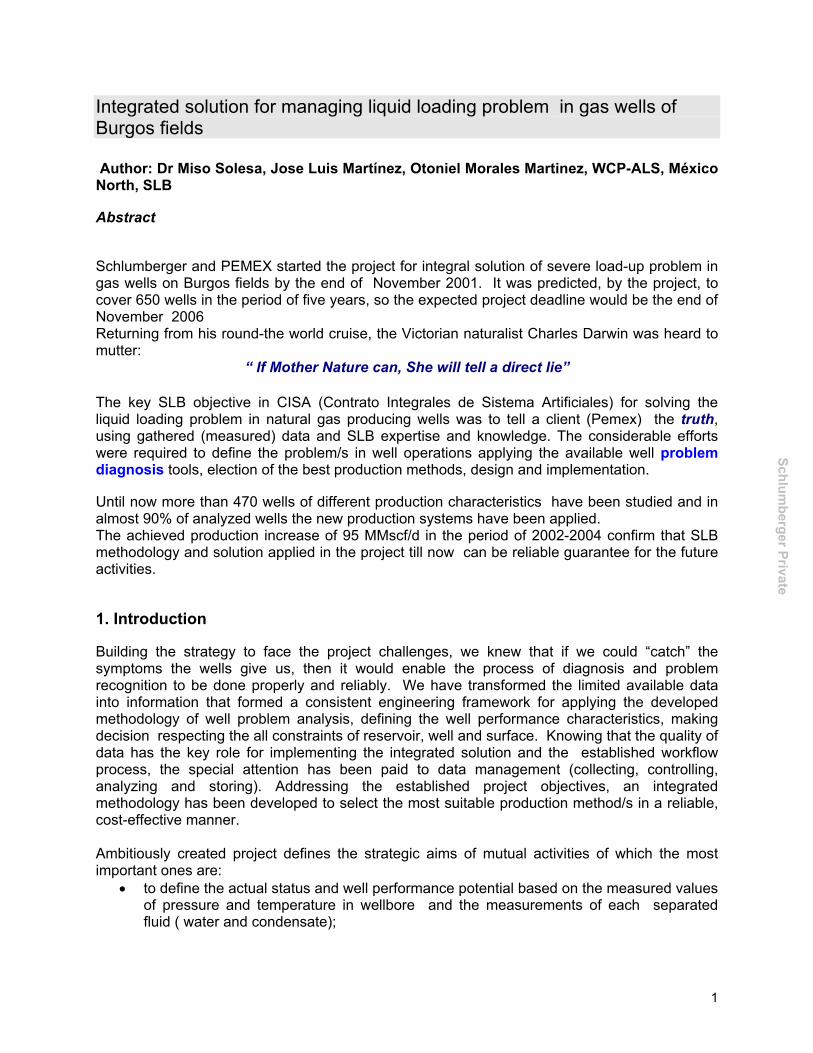
selecting the most adequate production system to solve the liquid loading problem has applied. Using the average multi-criteria ranking approach with specific evaluation of each extracted parameters that the most closest characterize the past and current wells behavior it was possible determine the integrated evaluation factor and to select the production method for solving and/or avoiding the load-up problem in gas wells1. The overview of the well performance and problem diagnosis methodology applied in CISA project is shown on Figure 5.
SymptomsProblem
Diagnosis
Multicriteial
Ranking-AnalysisComposit S
ystem
Analysis
Data Preparation Data Analysis
Solutions
?
Figure 5 – Overview of the well performance and problem diagnosis methodology applied in
CISA project is shown 3.1 Data preparation The first and the most important step in the procedure of well analysis and problem diagnosis was to collect and validate the data and to store them in the developed data base The information available for analysis are:
• Technical well and completion data • Production and pressure history, • Current well production data collected through three-phase measurement, • Field survey data (pressure and temperature at downhole, well calibration, fluid level,
surface buildup and drawdown test , field tests data using foam agents, daily wells supervision, real time –telemetry data )

7
Schlumberger Private
• Gas and condensate composition, • Laboratory analysis of foam agents
The following flow chart (Figure 6) shows the simplified workflow of the preliminary analysis to prepare information for composite system analysis or multi-criteria model.
Type Number ofintervals
Distance Flow type
Well completionsheme
Well productionand pressure
historyCurrent wellproduction Field survey data
Gas and condensatecomposition
Fluid properties
Laboratory analysisof foam agents
Monobore
Conventional
2 7/8"
3 1/2"
No packer
Packer
Sinlglezone
Multiplezone
Distance topacker
Distance betweenintervals
Coiled Tubing2", 13/4" and 11/2" Tubing
AnnulusTubing/Annulus.
Fractured
Short <= 50 m or justabove packer
Medimum 50-200 m
Large > 200 m
Short <= 50 m
Medimum 50-100 m
Large > 100 m
Gas rate
Liquid rate (waterand condensate)
Wellheadpressure
Casing pressure
Line pressure
Choke diameter
Flowing pressure andtemperature
Liquid level (casingand tubing)
Surface buildup anddrawdown test
Test with foam agents
Correction of gascomposition according
to flowing pressure
Pipesim
Foam height andvolume
Foam declining time
Liquid lifting efficiency
Remaning liquidduring gas bubling
Remaning liquid aftergas bubling
Figure 6- Steps in data analysis and preparation 3.2 WELL MODEL BASED ON COMPOSIT SYSTEM ANALISIS AND PRESSURE TEST Prior to making final decisions on changing completion method or working conditions it was required build the well model. By applying system analysis that might be characterized as a deterministic approach accomplished with surface buildup and drawdown tests, it was possible include different parameters and conditions in the well and surface to select the appropriate production systems and predict different sceneries to continue production without liquid loading problem. Also, system analysis has been applied as an efficient diagnostic tool for determining causes, which have brought to gas production decrease and in a certain cases to identify problem type(s). Using the system analysis application we have identified the factors, which had major influence on production decrease, as well as those production system’s components, which had brought to additional flow restrictions. The basic requirement to generate suitable well model is to determine the current inflow performance. In order to accomplish that goal, it is necessary to have quality test data, as well as to select the appropriate IPR model, taking into account reservoir characteristics and the available data quality. After that, it is possible to select the right model for the rest of the

8
Schlumberger Private
production system’s components, in order to make the final prediction of the well’s performance characteristics. In order to optimize the gas well performance having the liquid loading problem , to include each system components and to evaluate the well behavior, it was necessary to make some modifications to build appropriate well performance model. On Figure 8 is shown the workflow chart of the developed well model. After a two-stage matching procedure has been applied , the behavior of the wells using the different parameters (flow tube diameter, choke size, system pressure, flow type etc) have been simulated. By using the composite system analysis for multiphase flow through the wellbore, the well recompletion scenery was being looked for so that the well flowing period could last as long as possible without liquid loading problem. The reservoir pressure is a key parameter for reliable system analysis, but unfortunately, almost in all analyzed cases, it was unknown. The expected static bottomhole pressure can be been estimated using a new developed model if only one test gas rate and bottomhole flowing pressure are known as is shown on Figure 7. Model is based on Mishre-Coudle and Fetkovich inflow performance equations and through the iterative procedure, assuming the static pressure and flow exponent . A probably static pressure is taking as minimum of curve which is a difference of maximum production rates have obtained by Mishre-Coudle (base value) and Fetkovich inflow performance model.

9
Schlumberger Private
Reservoir pressure simulator-One test rate is known
0.0000.2000.400
0.6000.8001.0001.200
1.4001.6001.800
1140 1150 1160 1170 1180 1190 1200 1210 1220 1230 1240 1250
Reservoir pressure
Max
imum
gas
rate
(M
Msc
f)
00.010.02
0.030.040.050.06
0.070.080.09
Qqmax Mishre Qgmax Fetkovich Diff
Figure 7- Static pressure simulator
Limits due to unavailability of properties of opened intervals have increased the risk that recommended production system for future reservoir conditions will not be optimal solution which should enable gas production and well operation without problem of liquid accumulation at the well bottom and in wellbore. The main problem for performing system analysis was to define the wells behavior model with more opened intervals belonging to the reservoir of different and unknown characteristics. The special problem in finding out the “proper” model of current and future well behavior is the distribution and distance of the opened production intervals. It was simulated the well operation assuming that the well will be re-completed with coiled tubing run-in below the uppermost zone and above the lower intervals. The idea was to add gas or from upper zones to maintain the gas velocity (gas rate) through velocity string above the previously determined critical gas rate. With motor valve installed on casing or with closed casing the gas from upper zone(s) is directed to the tubing to increase gas velocity in tubing above critical rate and prevent the occurrence of load-up process. Additional surface buildup tests were used to define the time and pressure when MV has to close and/or open annulus. When the velocity of gas in coiled tubing is close or less to critical velocity and additional gas from annulus is not enough to maintain operation without liquid loading, then the motor valve has used to allow conventional intermittent operation. The number of cycle has been determined using buildup and drawdown on tubing and casing side. I On the basis of numerous analysis results for more than 470 wells applying the software package “PIPESIM” and using composite simulation approach, the following conclusions have been reached:
1. It has been concluded from obtained results that , for more than 50% of analyzed wells, the optimal solution is to install coiled tubing of 2”(50.8 mm) or 1 ¾” ( ) diameter.

10
Schlumberger Private
2. Since it is impossible to define production characteristics for each interval ( there are no necessary data for open intervals), the model of run-in coiled tubing above the deepest open interval with possibility to use the gas from the upper interval/s as additional gas to increase gas velocity, has been chosen in some cases.
3. By simulation of minimal gas velocity rate are defined the limit value for control of gas. 4. Application of coiled tubing in combination with control of gas rate and pressure in
annulus and tubing, results in highly unsteady state flow conditions which can’t be simulated exactly by using the conventional system analysis.
The results of system analysis have been used to also to decide when the application of coiled tubing is not valid (acceptable) solution because the flowing period will be very short and the well will approach the loading conditions very soon. At that cases the reasonable solution is intermittent well operation. Depending on the well conditions, surface pressure test data and field surveys data using different foam agents (sticks and/or liquid) the suitable intermittent system can be selected. Very often we have chosen the combined production system (intermittent operation combined with launching foam sticks) or only intermittent operation using motor valve or plunger lift. In the reservoir with relatively low reservoir pressure where the liquid contain is not high it has been applied the wellhead compressor. That solution has been favored especially in the cases when it was grouped several wells to produce with one compressor unit. Economic analysis have showed that payable gas production rate for the group of the wells should be equal to maximum compressor capacity what is 1.8-2 MMscf. Depending on production rate/well the number of wells in the group can be 2-6. The procedure for adjusting the well model and field surveyed data consists of:
• Data preparation, preprocessing which include the estimation of the most probable value of static bottomhole pressure.
• Strategy building of system analysis, • Matching procedure to select the best correlation using gas composition and flowing
gradient survey. • In order to define well behavior model and to adjust the simulated results with measuring
data (gas rate , bottom-hole and wellhead pressure) it was necessary to apply step by step detailed sensitivity analysis based on selected reservoir, well and surface facilities parameters .
• Adjusting the calculated to the measured data output data with field-test. • If the satisfactory matching of calculated and real data is obtained, then select the next
parameter and make a new sensitivity analysis. • If the well can’t flowing, or expected flowing time is short, then apply intermittent
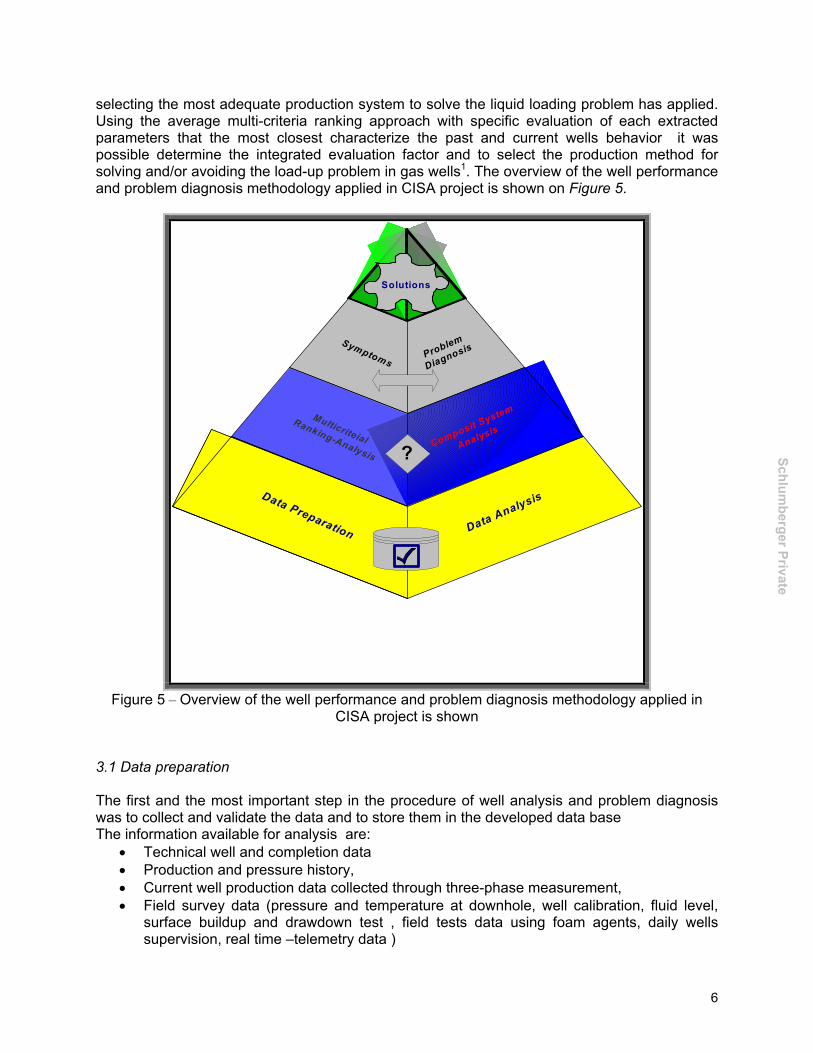
operation mode using surface buildup and drawdown tests. The flow chart of the described procedure is shown on Figure 8. In the case when it was required to simulate the well behavior assuming that liquid liquid foam agent is injecting , the conventional system analysis had to be modified to carry the analysis by Pipesim. The key problem is how to simulate the changes of the flowing gradient if liquid foam agent is injecting continuously through capillary tube at the bottom of the well. The capillary tube allows continuously injecting of foaming agents to lighten the liquid column in the production tubing and below the packer when the conventional completion system with packer is applied.
11
Schlumberger Private
Figure 8– Well performance model for gas wells with liquid loading problem
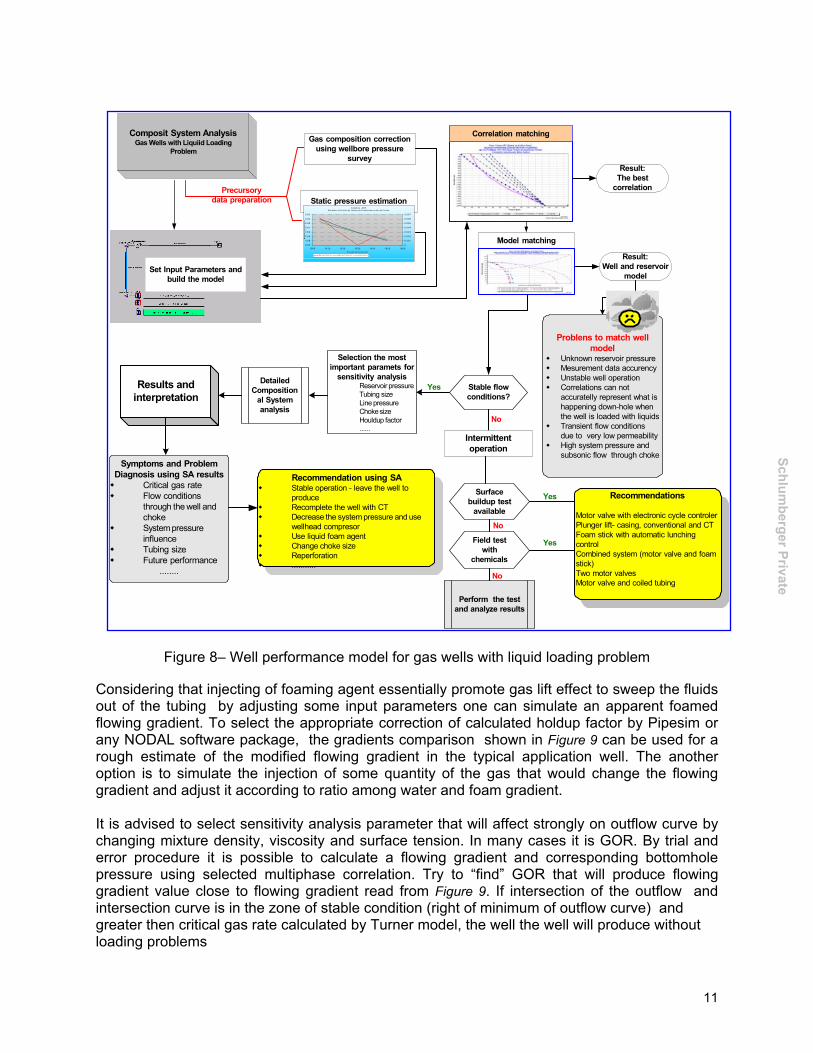
Considering that injecting of foaming agent essentially promote gas lift effect to sweep the fluids out of the tubing by adjusting some input parameters one can simulate an apparent foamed flowing gradient. To select the appropriate correction of calculated holdup factor by Pipesim or any NODAL software package, the gradients comparison shown in Figure 9 can be used for a rough estimate of the modified flowing gradient in the typical application well. The another option is to simulate the injection of some quantity of the gas that would change the flowing gradient and adjust it according to ratio among water and foam gradient. It is advised to select sensitivity analysis parameter that will affect strongly on outflow curve by changing mixture density, viscosity and surface tension. In many cases it is GOR. By trial and error procedure it is possible to calculate a flowing gradient and corresponding bottomhole pressure using selected multiphase correlation. Try to “find” GOR that will produce flowing gradient value close to flowing gradient read from Figure 9. If intersection of the outflow and intersection curve is in the zone of stable condition (right of minimum of outflow curve) and greater then critical gas rate calculated by Turner model, the well the well will produce without loading problems
Composit System AnalysisGas Wells with Liquiid Loading
Problem
Set Input Parameters andbuild the model
Gas composition correctionusing wellbore pressure
survey
Precursorydata preparation Static pressure estimation
C u le b ra - 2 6 2S im ulador d e Pr es ió n de Yacim ie n to -C o noc ie n do u n da t o de Pr ue ba
0 .5 7
0 .5 8
0 .5 9
0 .6 0
0 .6 1
0 .6 2
0 .6 3
0 .6 4
1 00 0 10 1 0 1 0 20 10 3 0 10 4 0 1 0 50 1 06 0P r e s ión d e Ya c im ie n to
Ma
xim
o g
as
to d
e g
0
0 .0 0 1
0 .0 0 2
0 .0 0 3
0 .0 0 4
0 .0 0 5
0 .0 0 6
0 .0 0 7
Qq m a x M is h r e Q g m a x Fe tko vi ch D ife r e n ci a
Correlation matching
Model matching
Stable flowconditions?
No
Yes
Result:The best
correlation
Result:Well and reservoir
model
DetailedComposition
al Systemanalysis
Selection the mostimportant paramets for
sensitivity analysisReservoir pressureTubing sizeLine pressureChoke sizeHouldup factor......
Problens to match wellmodel
Unknown reservoir pressureMesurement data accurencyUnstable well operationCorrelations can notaccuratelly represent what ishappening down-hole whenthe well is loaded with liquidsTransient flow conditionsdue to very low permeabilityHigh system pressure andsubsonic flow through choke
Results andinterpretation
Symptoms and ProblemDiagnosis using SA results
Critical gas rateFlow conditionsthrough the well and chokeSystem pressure influenceTubing sizeFuture performance
........
Recommendation using SAStable operation - leave the well toproduceRecomplete the well with CTDecrease the system pressure and use wellhead compresorUse liquid foam agentChange choke sizeReperforation...........
Intermittentoperation
Surfacebuildup test
available
Field testwith
chemicals
Perform the testand analyze results
Recommendations
Motor valve with electronic cycle controlerPlunger lift- casing, conventional and CTFoam stick with automatic lunchingcontrolCombined system (motor valve and foamstick)Two motor valvesMotor valve and coiled tubing
Yes
Yes
No
No
12
Schlumberger Private
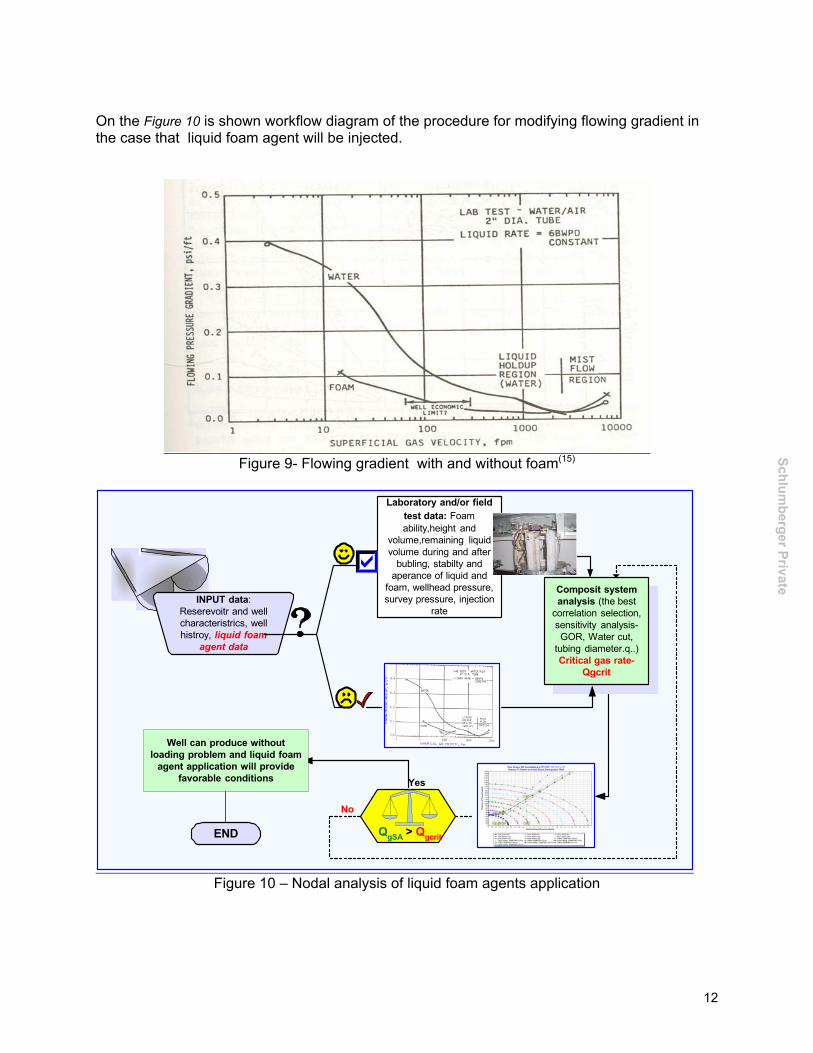
On the Figure 10 is shown workflow diagram of the procedure for modifying flowing gradient in the case that liquid foam agent will be injected.
Figure 9- Flowing gradient with and without foam(15)
INPUT data:Reserevoitr and wellcharacteristrics, wellhistroy, liquid foam
agent data
Laboratory and/or fieldtest data: Foamability,height and
volume,remaining liquidvolume during and after
bubling, stabilty andaperance of liquid and
foam, wellhead pressure,survey pressure, injection
rate
Composit systemanalysis (the best
correlation selection,sensitivity analysis-GOR, Water cut,
tubing diameter.q..)Critical gas rate-
Qgcrit
No
Yes
QgSA > Qgcrit
Well can produce withoutloading problem and liquid foam
agent application will providefavorable conditions
END
Figure 10 – Nodal analysis of liquid foam agents application

13
Schlumberger Private
3.3 Multicriterial model application The specific gas well production characteristics, defined by using available production history data, data of current well performance (production and pressures), data of applied completion systems, were the basis for developing the analytical model (tool) which was used for selecting the most adequate production method of gas wells which operate at severe accumulation of liquid phase in the wellbore (liquid loading process). The phenomena of liquid loading in gas wells, with all relevant parameters that characterize the origin and liquid loading process development (not only in the well bore but also in the reservoir) demanded the main classes of parameters to be separated. Within these general classes (macro level) it was necessary to extract the subclasses of parameters (micro level) with defined importance (evaluation). We solved the problem so that the recommendations are the synthesis of key symptoms, which could be separated from well production life, well problem diagnosis (as a rule it is not the only one), prediction of well behavior, economic evaluation and technical solutions. Detailed studies of the liquid loading problem in gas wells on Burgos basin fields and practical experience have shown the following conclusions:
• Tubing diameter is the most important parameter influencing on appearance and intensity of liquid loading process,
• Well completion type (location of packer regarding the depth of production interval/s) in many cases is the crucial part of liquid loading origin,
• Low reservoir / bottomhole flowing pressure and temperature in the wellbore are factors influencing liquid loading very seriously.
Factors which determine liquid loading and influence the selection of adequate production method are grouped in the following general classes (GFC):
1. Well Completion (WCF)- 2. Well production and pressure history(PHF 3. Well performance class (WPF)- 4. Laboratory tests (LTF) 5. Field tests (FTF) 6. Other problems and tests (OPF) 7. Costs (CEF)
General factor classes (GFC) constitute the model essence and final evaluation of production method application possibility is equal to geometrical average of integrated evaluation factor (IEF) for particular general factor classes. The integrated evaluation factor can be given in the form of the following equation:
nn
iiGFCIEF ∏
=
=1
)( (1)
It is recommended to apply the method which has the highest IEF value. The number of general factor classes is variable so that IEF for each well includes only those parameters for which there is a possibility to be defined. Within each the above mentioned class the particular parameters have been extracted with corresponding evaluations. These evaluations are the results of the following:
• Time of initializing of loading process, • Characteristics of well performance in the previous period, • Knowledge and experience of experts and field personnel,

14
Schlumberger Private
• Natural, technical and economical limitations, • Defined rules depending on applicability of analyzed production methods
It happens very often that, if there is a lack of information about well, it is not possible to define estimation of some factors. In this case the number of multipliers in the equation (2) is being reduced. Generally, the final evaluation for each factor of general classes is:
nn
iik FSclGFC ∏
=
=1
)()( (2)
where: k – stands for general class n – is number of subclasses The number of individual subclasses directly depends on the amount of available data. The influence of the parameters for which there are no data is minimized since their influence has not been taken into account. By using the evaluations of particular methods (foam application, plunger lift, compressor at wellhead, intermittent flow with motor valve, coiled tubing, sucker rod, electrical submersible pump and continuous gas lift) and the importance of particular parameters on micro level, the evaluation matrices have been achieved (shown in Table 2, Example of model application ). Five-level evaluation system (0 to 4) has been used in model development, while the evaluation zero (0) for certain criteria automatically eliminates the possibility of applying some of the methods. It has to be stressed that those evaluation matrices for parameters on micro level are not final and they are changeable depending on whether the obtained results are similar or equal to the expected results. Level of importance of certain parameter alters as a function of final effectiveness of applied method. If, during the application of selected method/s, it is found out that there is a discrepancy and well behavior (production results) is not in accordance with predicted behavior, then the extracted parameters will be reanalyzed, the estimation corrected, and the newly achieved estimation will be used for the next case (well). This conventional process of monitoring the previous solutions, notifications and corrections of errors and changes of evaluation matrices are the fundaments of learning process. It is particularly important that evaluation of certain method arise from description, i.e. from definition of selected factor occurrence. The occurrence definition is characterized by “fuzzy” parameter description. The example of description of particular parameters on micro level for surface pressure test in the case of intermittent lift application (plunger lift or only motor valve) is shown in the Table 1. Table 1- Surface pressure symptoms description

15
Schlumberger Private
Table 2 – Well Culebra –24 Selection of the best production method using multi-criteria model
In case of the well Culebra-24 the liquid loading problem could be solved by using the combined production system (foam stick+ motor valve) in intermittent operating mode According to results of multi-criteria analysis the better option is intermittent operation. The mechanical restriction in the wellbore eliminates the possibility of plunger lift application although all other factors give preferences to application of plunger lift.
16
Schlumberger Private
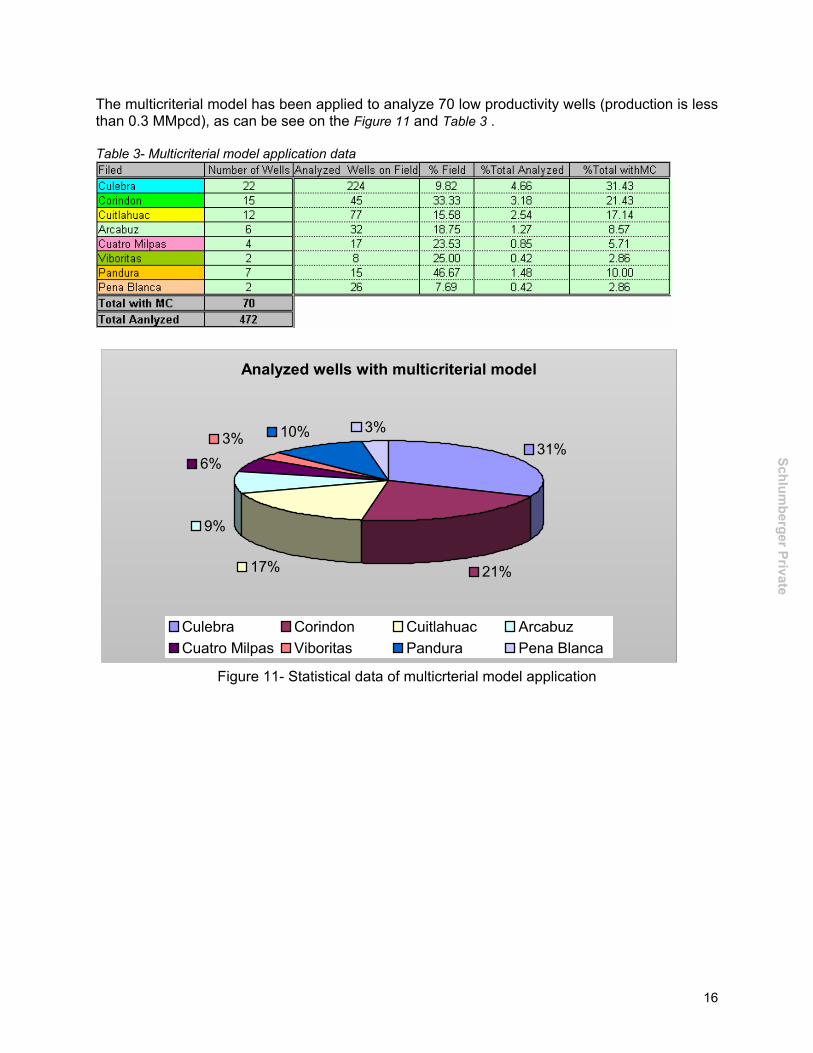
The multicriterial model has been applied to analyze 70 low productivity wells (production is less than 0.3 MMpcd), as can be see on the Figure 11 and Table 3 . Table 3- Multicriterial model application data
Analyzed wells with multicriterial model
31%
21%17%
9%
6%
3% 10% 3%
Culebra Corindon Cuitlahuac ArcabuzCuatro Milpas Viboritas Pandura Pena Blanca
Figure 11- Statistical data of multicrterial model application

17
Schlumberger Private
3.4 Well problem diagnosis and operation proposal When a gas well is producing below its optimal productivity, the source and type of the problem has to identified before any corrective actions are taken. SLB artificial lift engineering group is charged with the responsibility to identify the problem existence in each particular well and to recommend the operation activities to resolve the problem. To know if a well is producing or can be produced at optimal conditions requires the answer for to main questions: (1) is the well producing at its potential, and (2) if it is not producing at expected rate and potential, why not? First of all, to know if a well is producing at its potential requires knowing what its potential is. Potential is not necessarily the amount of production measured on a relatively short-term test with the choke wide open. Potential should be thought of in terms of what the well is capable of producing by imposing the best possible set of conditions on the well. It is a well known fact that data used for analysis of petroleum wells and reservoirs performance (pressure and production data, etc.) are not the data registered in short period of time, but are everyday, weekly or monthly data. When they are registered, the response has to be prompt, because even the smallest delay in reaction inevitably leads to loss of control over the wells performance. The basis of Well Problem Analysis are classified data within a flexible Data Base, which will include the well’s history and real time data. The question is how to organize the data and knowledge (both theoretical and practical), and then to make relations with “already seen”, so that what follows comes with least possible failure. The structure of the procedure we have applied to diagnosis the problem in gas wells in basin Burgos is shown on Figure 12.
List of wells
Well 1Well 2
.
.Well (n-m)
.
.Well(n-1)Well(n)
New well data
Input DataCISA DB
New well
GeneralCompletion
(trajectory, drilling,perforation, fracturing)
Fluid PVTReservoirWorkover historyWell testProduction historyand resultsLaboratory tests ofdifferent chemicalsFiled test(surface buildup anddrawdown test, fluidlevel, chemical foamagent)
Preprocessing
Filtering andsearching DB
List of the wellshaving the similarcharcteristics with
new well
Acquairedexpertise
knowledgeand
experience
List of thesyntoms for
extractedwells
Problemdefinition
for the newwell
Processing
Exstracting,structuring
andorganizingknowledge
Knowledge baseformalization
(rules in the formIf....then
List ofrecommendations
and operationproposal for soving
the problem
Figure 12 – Well problem diagnosis procedure in gas wells with liquid loading problem

18
Schlumberger Private
The relevant expert’s knowledge has been formalized by means classification of the possible problems and by associating the corresponding symptomatology with them. The success of problem diagnosis is related with skill of analyst to connect the extracted symptoms with possible problem, as shown in Table 4. Table 4- The relation between symptoms and well problem
As the most prominent problem in almost all analyzed wells is liquid loading, some special rules have been developed to help the diagnosis process and to generate the problem correlation chart as shown in table 5 for some selected wells. Table 5- Diagnosis problem correlation chart
The meaning of the applied diagnosis coding system in the previous table is:

19
Schlumberger Private
As shown on Figure 12 once the problem identification is accomplished, the best possible course of remedial action should be applied. Depending of what problems were identified in the previous step the recommended operation proposals with corresponding coding system are shown in the following tables. The corresponding recommendations coding system can be seen in table 6. Table 6- Recommendation correlation chart
Recommendation/operation proposal coding system
Considering that each production system, which could be applied to solve the liquid loading problem posses some specific characteristics, we have developed and formalized some specific rules that are applied to select the most suitable production system, as shown in table 7 Table 7 – Example of some rules for production system selection
The production methods applied in project CISA can be classified in two groups. The first one is for continuous flow and the second one is for intermittent operation, as shown on Figure 13.

20
Schlumberger Private
Intermittent lift
Applied production systems
Flowing production
Coiled Tubing 2, 1 3/4” y 1 ½”
Wellhead compressor
Capillary Tube
Coiled tubing with liquid foam injection in casing
Motor valve
Motor valve and foam stick
Foam stick application (mannualy or automatic luncher)
Coiled tubing and motor valve
Coiled tubing and motor valve Installed on casing
Coiled tubing with two motor valves
Plunger lift
Figure 13: Applied production systems to solve liquid loading problem in gas wells The significant improvement has obtained by application of combined production system. The combined production systems have enough flexibility enabling easy modifications of operating parameters and adapting to the changeable dynamic (transient) well conditions. On the figure are shown the applied production systems for continuous and intermittent flow. There are a different options, but the most acceptable solution for continuous flow is coiled tubing application. If the well can’t flow, then combined production systems for intermittent operation (foam sitck and motor valve) are the most frequent applied solution for liquid loading problem. . Using the described methodology different production systems have been applied in more than 400 wells (Table 8). In almost 50% cases the coiled tubing of 2” or 1 ¾” were applied. Table 8- Production system application in CISA project

21
Schlumberger Private
4. Well optimization workflow and real time production application 4.1 Production optimization Optimization of the wells production is continuous (daily) activities, based on day-day analysis consisting of the following steps:
1. Collecting data and monitoring of the wells behavior, 2. Comparison the actual well data with results recorded during production history, and
also with results of the initial analysis. In the case that well is producing according to the previous simulation study, through optimization process will be check is there possibility to improve well operation and/or well production.
3. Production process compromises of dynamic changes through complete production system, starting with reservoir and following with fluid flow through wellbore, and ending with flow through flowlineand surface equipment. Defining the boundary conditions at the bottom and surface, as well as well ability according to actual downhole (reservoir and wellbore) and surface conditions, through new well system analysis will be defined, what is the final objective of the optimization process. The new action plan on the field will be based on optimization results.
Through optimization process it is achieved the full integration of the data, information and events on static and dynamic level with developed data base. Specific behavior of the gas wells in basin Burgos request application of “untypical” optimization process, regarding to method used for solving the loading problem, as can be see on Figure 14. 15.
Figure 14- Workflow of optimization process
Data Information
Events
Reservoir study
(MB, Decline, Simulation)
Stedy state system analysis
Single well modeling
Stedy state/transient network modeling
Historia de producción del poz o: Culebra -552
0.00
0.50
1.00
1.50
2.00
2.50
Dec-00
Jan-01
Feb-01
Mar-01
Apr-01
May-01
Jun-01
Jul-01 Aug-01
Sep-01
Oct-01
Nov-01
Dec-01
Jan-02
Tiempo
Gat
ode
gas
(MM
scf/d
)
0
200
400
600
800
1000
1200
1400
1600
1800
2000
Qg-W1 MMscf-d Qg-W3 B4A MMscf-d Qg-W4 B4A MMscf-d
Gasto de gas total MMscf-d Qg-disp MMscf-d PT-DB psi
PT-Disp psi
Well problemanalysis
Well problemanalysis
Selectionthe best remedial
action
Selectionthe best remedial
action
Operation on field
Operation on field
Real time unsteadystate modelling
Reservoir study
Single well nodal
analysis
Network systemanalysis
Decision
D y n a m I c l e v e l – l o n g t e r m
S t a t I c l e v e l – l o n g t e r m
Data Information
Events
Reservoir study
(MB, Decline, Simulation)
Stedy state system analysis
Single well modeling
Stedy state/transient network modeling
Historia de producción del poz o: Culebra -552
0.00
0.50
1.00
1.50
2.00
2.50
Dec-00
Jan-01
Feb-01
Mar-01
Apr-01
May-01
Jun-01
Jul-01 Aug-01
Sep-01
Oct-01
Nov-01
Dec-01
Jan-02
Tiempo
Gat
ode
gas
(MM
scf/d
)
0
200
400
600
800
1000
1200
1400
1600
1800
2000
Qg-W1 MMscf-d Qg-W3 B4A MMscf-d Qg-W4 B4A MMscf-d
Gasto de gas total MMscf-d Qg-disp MMscf-d PT-DB psi
PT-Disp psi
Well problemanalysis
Well problemanalysis
Selectionthe best remedial
action
Selectionthe best remedial
action
Operation on field
Operation on field
Real time unsteadystate modelling
Reservoir study
Single well nodal
analysis
Network systemanalysis
Economicand risk analysis
Decision
D y n a m I c l e v e l – l o n g t e r m
S t a t I c l e v e l – l o n g t e r m
Real time production control- Telemetry
Data Information
Events
Reservoir study
(MB, Decline, Simulation)
Stedy state system analysis
Single well modeling
Stedy state/transient network modeling
Historia de producción del poz o: Culebra -552
0.00
0.50
1.00
1.50
2.00
2.50
Dec-00
Jan-01
Feb-01
Mar-01
Apr-01
May-01
Jun-01
Jul-01 Aug-01
Sep-01
Oct-01
Nov-01
Dec-01
Jan-02
Tiempo
Gat
ode
gas
(MM
scf/d
)
0
200
400
600
800
1000
1200
1400
1600
1800
2000
Qg-W1 MMscf-d Qg-W3 B4A MMscf-d Qg-W4 B4A MMscf-d
Gasto de gas total MMscf-d Qg-disp MMscf-d PT-DB psi
PT-Disp psi
Well problemanalysis
Well problemanalysis
Selectionthe best remedial
action
Selectionthe best remedial
action
Operation on field
Operation on field
Real time unsteadystate modelling
Reservoir study
Single well nodal
analysis
Network systemanalysis
Decision
D y n a m I c l e v e l – l o n g t e r m
S t a t I c l e v e l – l o n g t e r m
Data Information
Events
Reservoir study
(MB, Decline, Simulation)
Stedy state system analysis
Single well modeling
Stedy state/transient network modeling
Historia de producción del poz o: Culebra -552
0.00
0.50
1.00
1.50
2.00
2.50
Dec-00
Jan-01
Feb-01
Mar-01
Apr-01
May-01
Jun-01
Jul-01 Aug-01
Sep-01
Oct-01
Nov-01
Dec-01
Jan-02
Tiempo
Gat
ode
gas
(MM
scf/d
)
0
200
400
600
800
1000
1200
1400
1600
1800
2000
Qg-W1 MMscf-d Qg-W3 B4A MMscf-d Qg-W4 B4A MMscf-d
Gasto de gas total MMscf-d Qg-disp MMscf-d PT-DB psi
PT-Disp psi
Historia de producción del poz o: Culebra -552
0.00
0.50
1.00
1.50
2.00
2.50
Dec-00
Jan-01
Feb-01
Mar-01
Apr-01
May-01
Jun-01
Jul-01 Aug-01
Sep-01
Oct-01
Nov-01
Dec-01
Jan-02
Tiempo
Gat
ode
gas
(MM
scf/d
)
0
200
400
600
800
1000
1200
1400
1600
1800
2000
Qg-W1 MMscf-d Qg-W3 B4A MMscf-d Qg-W4 B4A MMscf-d
Gasto de gas total MMscf-d Qg-disp MMscf-d PT-DB psi
PT-Disp psi
Well problemanalysis
Well problemanalysis
Selectionthe best remedial
action
Selectionthe best remedial
action
Operation on field
Operation on field
Real time unsteadystate modelling
Reservoir study
Single well nodal
analysis
Network systemanalysis
Economicand risk analysis
Decision
D y n a m I c l e v e l – l o n g t e r m
S t a t I c l e v e l – l o n g t e r m
Real time production control- Telemetry
22
Schlumberger Private
Initial welland network
anlalysis
RecommendationPrograms
Instllation
Check thewells
Compare withPrevious analysis
Operate according to analysis
There is possibilityto improve
New analysis
New operatingprogram
Check the Surface
conditions
OkNo
Ok
No Continue with
productionNo
Yes
Initial welland network
anlalysis
RecommendationPrograms
Instllation
Check thewells
Compare withPrevious analysis
Operate according to analysis
There is possibilityto improve
New analysis
New operatingprogram
Check the Surface
conditions
OkNo
Ok
No Continue with
productionNo
Yes
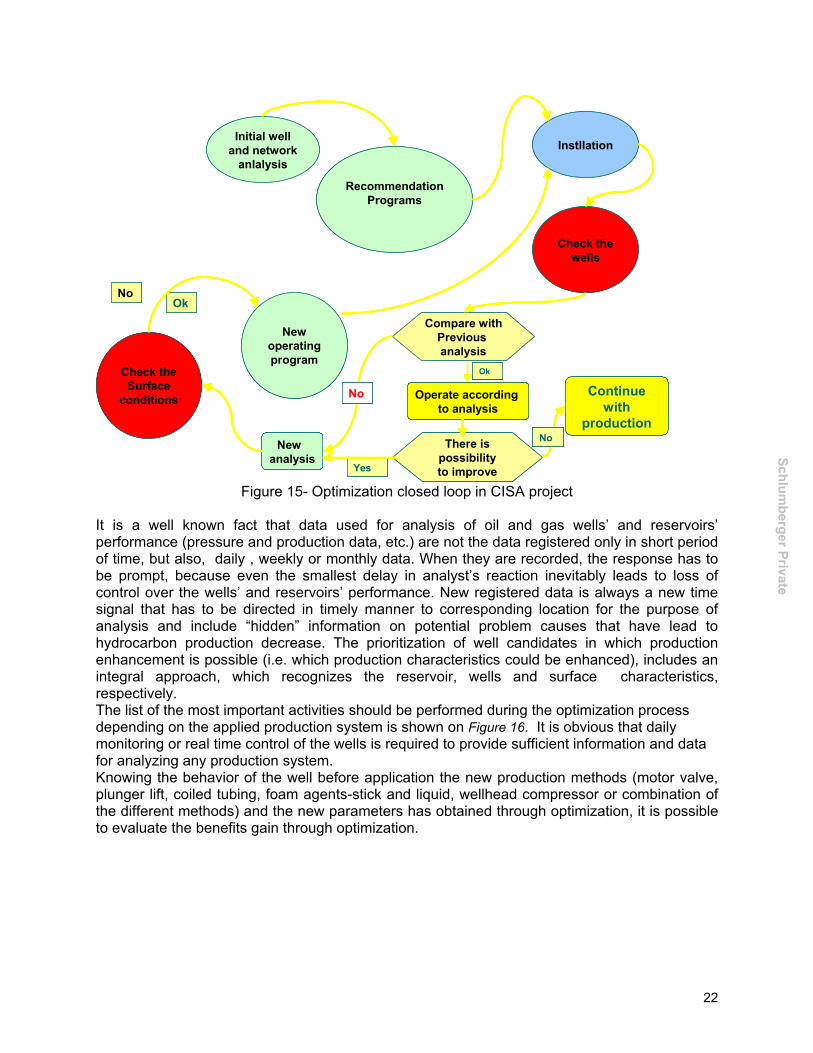
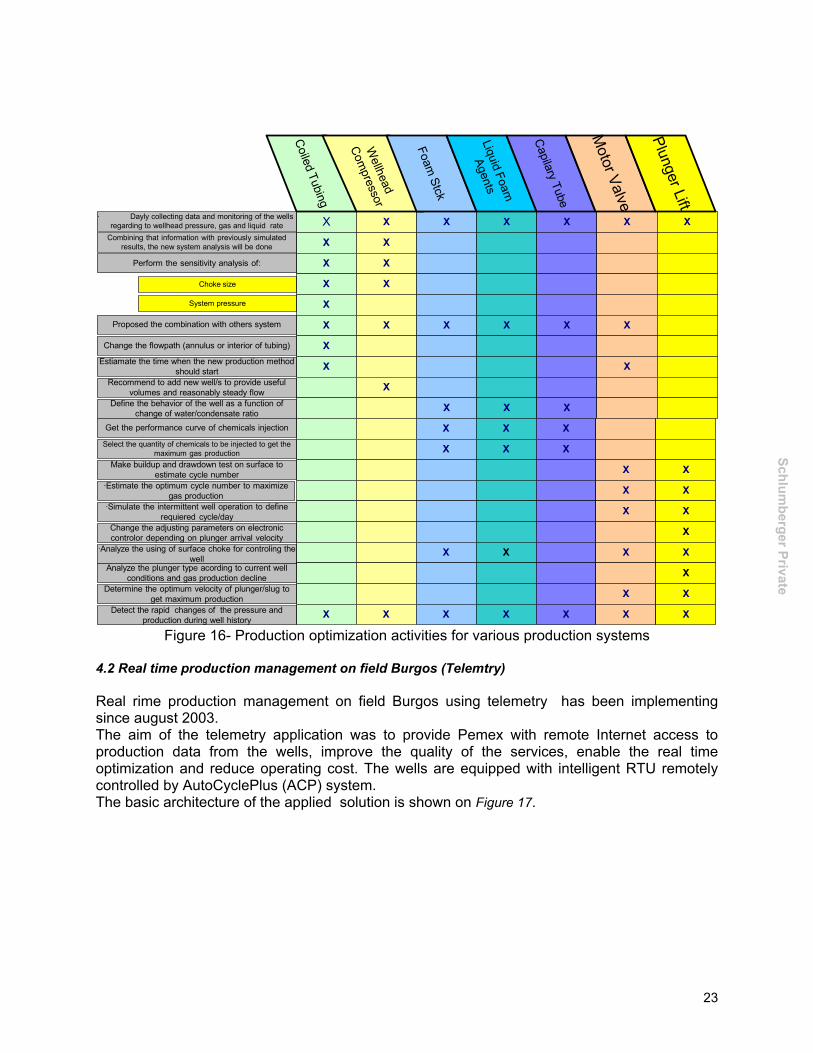
Figure 15- Optimization closed loop in CISA project It is a well known fact that data used for analysis of oil and gas wells’ and reservoirs’ performance (pressure and production data, etc.) are not the data registered only in short period of time, but also, daily , weekly or monthly data. When they are recorded, the response has to be prompt, because even the smallest delay in analyst’s reaction inevitably leads to loss of control over the wells’ and reservoirs’ performance. New registered data is always a new time signal that has to be directed in timely manner to corresponding location for the purpose of analysis and include “hidden” information on potential problem causes that have lead to hydrocarbon production decrease. The prioritization of well candidates in which production enhancement is possible (i.e. which production characteristics could be enhanced), includes an integral approach, which recognizes the reservoir, wells and surface characteristics, respectively. The list of the most important activities should be performed during the optimization process depending on the applied production system is shown on Figure 16. It is obvious that daily monitoring or real time control of the wells is required to provide sufficient information and data for analyzing any production system. Knowing the behavior of the well before application the new production methods (motor valve, plunger lift, coiled tubing, foam agents-stick and liquid, wellhead compressor or combination of the different methods) and the new parameters has obtained through optimization, it is possible to evaluate the benefits gain through optimization.
23
Schlumberger Private
X X X X X X X
X
X
X
X
X
X
X
X
X
X
X X X X X
X
X
X X X
Choke size
Proposed the combination with others system
System pressure
Change the flowpath (annulus or interior of tubing)
Estiamate the time when the new production methodshould start
Coiled Tubing
Wellhead
Compressor
Foam Stck
Liquid Foam
Agents
Capilary Tube
Motor Valve
Plunger Lift
Recommend to add new well/s to provide usefulvolumes and reasonably steady flow
· Dayly collecting data and monitoring of the wellsregarding to wellhead pressure, gas and liquid rate
Combining that information with previously simulatedresults, the new system analysis will be done
Perform the sensitivity analysis of:
Define the behavior of the well as a function ofchange of water/condensate ratio
X X X
X
X X X
X X
X X
X X
X
X X X X
X
X X
X X X X X X
Get the performance curve of chemicals injection
Select the quantity of chemicals to be injected to get themaximum gas production
Make buildup and drawdown test on surface toestimate cycle number
·Estimate the optimum cycle number to maximizegas production
·Simulate the intermittent well operation to definerequiered cycle/day
Change the adjusting parameters on electroniccontrolor depending on plunger arrival velocity
·Analyze the using of surface choke for controling thewell
Analyze the plunger type acording to current wellconditions and gas production decline
Determine the optimum velocity of plunger/slug toget maximum production
Detect the rapid changes of the pressure andproduction during well history
Figure 16- Production optimization activities for various production systems
4.2 Real time production management on field Burgos (Telemtry) Real rime production management on field Burgos using telemetry has been implementing since august 2003. The aim of the telemetry application was to provide Pemex with remote Internet access to production data from the wells, improve the quality of the services, enable the real time optimization and reduce operating cost. The wells are equipped with intelligent RTU remotely controlled by AutoCyclePlus (ACP) system. The basic architecture of the applied solution is shown on Figure 17.

24
Schlumberger Private
Figure 17- CISA Telemetry architecture
The real time data to client (Pemex) are provided through WEB access using WelWatcher system hosted by data Management Center (DMC), which is based on Decision Point portal technology. The data is collected 4 times per day and loaded into DMC (Houston) DB, Using real data in the future will be possible to control, manage and diagnose the problems in well operation according to knowledge and experience of SLB expertise engineers. The real time data always contain some “hidden” information (symptoms) about well problems. By integrating some expert rules valid for specific productions method have applied in project, the system will be able to recommend practical solution for problem solving, according to previous described methodology. Regarding to functionality and values that can get through real time production gas wells with liquid loading problem it is possible extract the four levels shown in Table 9:

25
Schlumberger Private
Table 9..: Functionality and value of real time production
In the previous period the real time production system has been applied on 42 wells and is expected that more 40 wells will be include in telemetry system. With the latest improvement has been realized it can say that second level of functionality has achieved. The new modification will allow the complete control of intermittent operation allowing the direct execution of commands on well site. Using build-in map feature user can visualize the well and depending on its production the corresponding bubble size will be shown (Figure 18)
Figure 18. – Well visualization using map

26
Schlumberger Private
Through map it is possible lunch different reports, like high frequency or daily average, as shown on Figure 19.
Figure 19 – Launch the report using map feature
5. Well management case study In this section is described the application of the developed engineering and optimization methodology for the well Cuitlahuac-958. The well has completed as monobore with tubing 3 ½” and only one interval has been perforated and fractured (3130-3140 m). The well started with production on 23 February of 2001 through the choke 20/64”. Initial production and e tubing wellhead pressure were 10.2 MMscf/d and 5780 psi, respectively. According to the well behaviour during the production, the initial production can be characterize as very high . Very soon the gas production has started to decline (April, 2001). To maintain production on desired level the choke size has been increased to 24/64” and after that production has stabilized in the range of 8.8-10MMscf/d, but the wellhead pressure has continued to decline and reached the 4500 psi. In the following short period of time the gas production increased to 11.5 MMscf/d and tubing wellhead pressure was 4175 psi. After this short-lived increase of gas production, the production of gas has started to decline very rapidly, as well as the tubing pressure. In the following four months the wellhead pressure and gas production has declined to 2200 psi and 6 MMscf/d, respectively. Generally, in the first seven months of production the decline of gas production and wellhead pressure were very rapid. According to threephase measurement performed on 25 September of 2002 the gas production was 1.59 MMscf with wellhead pressure of 1763 psi. The well produced only condensate and average production was 71 bbl/d. As the system pressure was 980 psi, the gas flow through

27
Schlumberger Private
choke was subsonic. The gradient pressure survey indicated high liquid content. The calculated gas critical rate of 2.763 MMscf/d was higher than gas production rate and liquid loading has started. The primary objective of the system analysis was to evaluate a possibilities to produce gas through small tubing diameter installed above perforated interval 3130-3140 m. The model of well and reservoir has been build and it is shown on Figure 20 . The estimated reservoir pressure was 3550 psi and using the known gas composition in the following step the Ansari correlation was selected, as shown on Figure 21.
Figure 20 - Building a system analysis model, which include Reservoir, Tubing, choke and Flow line.
Well CUITLAHUAC-958. Correlations matching
(Reservoir pressure: 1100 psia and Qg= 1.601 MMscfd)
Figure 21 - Correlations matching to reproduce Information measured on Sep, 2002. (Estimated
Reservoir pressure: 3550 psia).

28
Schlumberger Private
Well: CUITLAHUAC-958. Nodal Analysis with Solution at bottom
Sensitivity: Static pressure and Tubing size (Line pressure= 990 psig, Choke size: 14/64”)
Figure 22 – System analysis results (Solution at bottom)
Sensitivity: Static Pressure, Tubing size .(Line Pressure: 990 psig, Choke size: 14/64”) Once the model was verified to reproduce the current behavior, a sensitivity analysis was performed to solve the loading problem. The best option was to run a Velocity String of 2”, which decrease the critical gas rate and extend the natural flow allowing a small increment from the actual gas rate, as can be seen on Figures 23 and 24 . According to the recommendation obtained with engineering analysis, the velocity string was installed on Nov 5, 2002, and it solved the loading problem. After one year, the natural process of declining continued and the loading problem occurred again. As the conditions of flow has changed, it was needed to adjust the model of analysis nodal to the new conditions showed on the next table. Table 10- Three phase measurement data
Date Wellhead, psig
Flow-line, psig
Gas rate, MMscfd
Choke size Water, bpd Condensate, bpd
Notes
Sep 26, 02 1760 990 1.524 14/64" 0 75 Jan 3, 03 1780 1063 1.556 14/64" 0 38 Velocity String 2” Jan 4, 03 1610 1085 1.899 16/64” 0 97.7 Velocity String 2”
Jun 29, 03 1500 1080 0.675 14/64" 3.5 4.8 Velocity String 2”

29
Schlumberger Private
Well CUITLAHUAC-958: Solution at the surfaceMatching the model to new condition with Velocity String. (Choke 16/64” and Line pressure 1080 psig)
Figure 23 – New well model matching ( Solution at surface)
Well CUITLAHUAC-958: Solution at the bottom
Matching the model to new condition with Velocity String. (Choke 16/64” and Line pressure 1080 psig)
Figure 24 – New well model matching ( Solution on bottom)
The next step was to make a sensitivity analysis to solve the loading problem, indicating that is required to reduce the line pressure to 220 psig and increase the choke size at least 18/64”, depending on the performance of the well (Figure 25).

30
Schlumberger Private
W e ll C U IT L A H U A C -9 5 8 : S o lu tio n a t th e b o tto mS e n si tiv i ty : S ta t ic p r e ss u r e a n d C h o k e siz e . (V S 2 ” , l in e p re s su r e 220 p s ig )
Figure 25- Sensitivity analysis (reservoir pressure and choke diameter)
These recommendations were implemented on Nov 03 and the well started to flow with out loading problem as shown on Figure 26. The well increase the gas production for 78.2 %
Figure 26 - The complete production history including the well behavior after optimization
31
Schlumberger Private
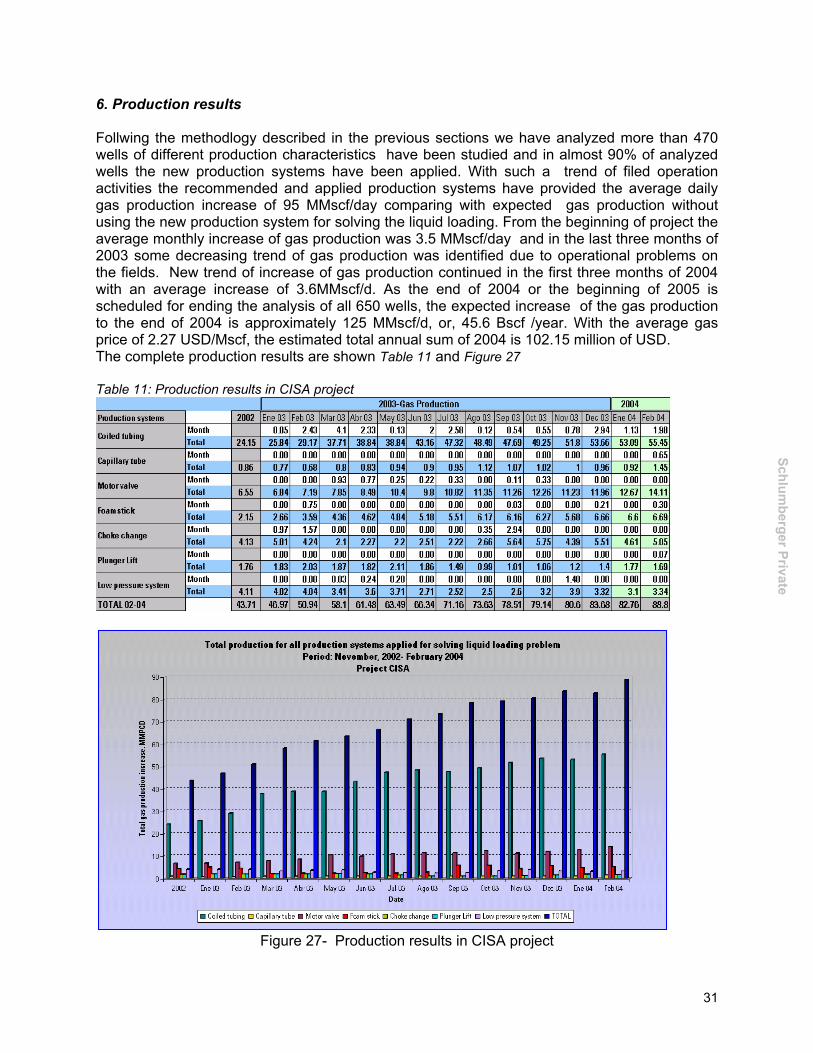
6. Production results Follwing the methodlogy described in the previous sections we have analyzed more than 470 wells of different production characteristics have been studied and in almost 90% of analyzed wells the new production systems have been applied. With such a trend of filed operation activities the recommended and applied production systems have provided the average daily gas production increase of 95 MMscf/day comparing with expected gas production without using the new production system for solving the liquid loading. From the beginning of project the average monthly increase of gas production was 3.5 MMscf/day and in the last three months of 2003 some decreasing trend of gas production was identified due to operational problems on the fields. New trend of increase of gas production continued in the first three months of 2004 with an average increase of 3.6MMscf/d. As the end of 2004 or the beginning of 2005 is scheduled for ending the analysis of all 650 wells, the expected increase of the gas production to the end of 2004 is approximately 125 MMscf/d, or, 45.6 Bscf /year. With the average gas price of 2.27 USD/Mscf, the estimated total annual sum of 2004 is 102.15 million of USD. The complete production results are shown Table 11 and Figure 27 Table 11: Production results in CISA project
Figure 27- Production results in CISA project

32
Schlumberger Private
7. Conclusions CISA project started on November 2001as integral project for optimization of gas wells having liquid loading problem. The project comprises fully integrated processes starting from data preparation and ending with optimization and real time production monitoring (telemetry). During the period of 2.5 years the project has been passing through several stages to get the current organization structure with completely integrated activities and production optimization closed loop. More than 470 wells has been analyzed through detailed engineering analyses using developed methodology of composite system analysis and multicriterial expert model for selecting the most suitable production methods in the case when limited information are available. The recommendations clearly defined in engineering reports have applied on more than 420 wells. The various production methods for continuous and intermittent operation has enough flexibility to include the current and expected conditions. In many cases when it was not possible to solve the problem only by application of single production method, the combined systems (intermittent operation combining mechanical and chemical methods, velocity string with motor valve and foam agents..) has been implemented. By implementing the optimization closed loop we are able to modify the proposed engineering solution and to adjust the new well behavior according to the noted changes in the reservoir ( reservoir pressure decline, change of gas composition, effect of condensate blockage skin factor), wellbore and surface facilities. The lesson learned in the past 2.5 years tell us that application of combined production system are the most efficient way to faced with new liquid loading appearance. The obtained gas production increase of 95 MMscf/d and expected production increase to the end of year in the range of 110-125 MMscf is noticeable proof how integrated production management of the gas wells having loading problem can make project very successfully. Literature: 1.David B. Foo: Production Optimization of Gas Wells by Automated Unloading: Case Histories, SPE 59748 2.Solesa M.: System Analysis of Oil and Gas Production by Flowing Method, Book, Faculty of Mining and Geology, Belgrade, Yugoslavia, 1998, ISBN 86-7352-024-X 3.4.Trascher, T.S: Gas-Well Deliverability Monitoring: Case Histories, SPE, 26181 4.Sweeney, M.J.: An Integrated Approach to Gas Well Deliverability Analysis, Hugoton Field, SPE 27936 5.David B. Foo: Production Optimization of Gas Wells by Automated Unloading: Case Histories, SPE 59748 6.Boswell, J.T.: Controling Liquid Load-up with “Continuous Gas Circulation, SPE 37426 7.Wiliam G. Elmer: Tubing Flowrate Controller: Maximaze Gas Well Production from Start to Finish, SPE 30680 8. Stephenson, G.B at al.: Gas-Well Dewatering: A Coordinated Approach, SPE 58984 9. Hongjie Xiong at al.: Using an Expert System to Diagnose Formation Damage Mechanism and Design Stimulation Treatments for Gas Storage Wells, SPE 72374 10. Shahab Mohagbegh, David Hill: Development of an Intelligent System Approach for Restimulation Candidate, SPE 59767 11. Solesa M at al: Combined production systems for solving and controlling loading problem in gas wells in Basin Burgos, 2003 Gas Well De-Watering Workshop, Denver, Colorada, March 2-4, 2003, Proceeding, 12. Solesa M at al: Multi-criteria model for selecting the best artificial lift systems in gas wells with loading problem on Burgos gas fields, 2003 Gas Well De-Watering Workshop, Denver, Colorada, March 2-4, 2003, Proceeding, 13. Solesa M at al: Application of design and optimization plunger lift model in gas wells with loading problem- case study on field Culebra, 2003 Gas Well De-Watering Workshop, Denver, Colorada, March 2-4, 2003, Proceeding 14. SLB White paper: Reservoir and Production Optimization 15. Lee, J.F. at al: Gas Well Operation with Liquid Production, SPE 11583