integrated solar combined cycle power plants: department
TRANSCRIPT

Integrated Solar Combined Cycle Power Plants:
Paving the Way for Thermal Solar
by
Bandar Jubran Alqahtani
Department of Environment Duke University
Date:_______________________ Approved:
___________________________
Dalia Patiño-Echeverri, Supervisor
___________________________ Naif M. Alabbadi
___________________________
Richard Newell
___________________________ Timothy L. Johnson
Thesis submitted in partial fulfillment of the requirements for the degree of Master of Science in the Department of
Environment in the Graduate School of Duke University
2015

ABSTRACT
Integrated Solar Combined Cycle Power Plants:
Paving the Way for Thermal Solar
by
Bandar Jubran Alqahtani
Department of Environment Duke University
Date:_______________________ Approved:
___________________________
Dalia Patiño-Echeverri, Supervisor
___________________________ Naif M. Alabbadi
___________________________
Richard Newell
___________________________ Timothy L. Johnson
An abstract of a thesis submitted in partial fulfillment of the requirements for the degree
of Master of Science in the Department of Environment in the Graduate School of
Duke University
2015

Copyright by Bandar Jubran Alqahtani
2015

iv
Abstract
Integrated Solar Combined Cycle Power Plants (ISCCs), composed of a
Concentrated Solar Power (CSP) plant and a Natural Gas-fired Combined Cycle (NGCC)
power plant, have been recently introduced in the power generation sector as a
technology with the potential to simultaneously reduce fossil fuel usage and the
integration costs of solar power. This study quantifies the economic benefits of an ISCC
power plant relative to a stand-alone CSP with energy storage, and a NGCC plant. A
combination of tools is used to estimate the levelized cost of electricity (LCOE) and the
cost of carbon abatement (CoA) for CSP, NGCC and ISCC technologies under different
natural gas prices, and at several locations experiencing different ambient temperatures
and solar resources. Results show that an ISCC with up to 10-15% of nameplate capacity
from solar energy can be cost effective as a dispatchable electricity generation resource.
Integrating the CSP into an ISCC reduces the LCOE of solar-generated electricity by 35-
40% relative to a stand-alone CSP plant, and provides the additional benefit of
dispatchability. An ISCC also outperforms a CSP with energy storage in terms of LCOE
and CoA. The current LCOE of an ISCC is lower than that of a stand-alone NGCC when
fuel price reaches 13.5 $/MMBtu, while its CoA is lower at a fuel price of 8.5 $/MMBtu.
Although, under low to moderate natural gas price conditions an NGCC generates
electricity and abates carbon emissions at a lower cost than an ISCC; small changes in

v
the capacity factor of an ISCC relative to the NGCC, or capital cost reductions for the
CSP component have great impact tilting the balance in the ISCC’s favor.

vi
In the name of God, the Compassionate, the Merciful
All praise is for Allah, Lord of the Worlds, Master of the Day of Judgment whom
we do worship, and whose pleasure and aid we seek. Blessings and peace of Allah be
upon his last Prophet and Messenger Mohammed and upon his Family and
Companions.
“Do you not consider how God has created seven heavens in layers,
And made the moon therein a [reflected] light and made the sun a burning lamp?”
The Quran, English interpretation
Chapter 71 (Chapter of Noah), Verse 16-17
.

vii
Contents
Abstract ......................................................................................................................................... iv
List of Figures ............................................................................................................................... ix
Acknowledgements ...................................................................................................................... x
1. Introduction ............................................................................................................................... 1
1.1 Overview ........................................................................................................................... 1
1.2 Literature review .............................................................................................................. 3
1.3 Motivation ......................................................................................................................... 5
1.4 Research Objective ........................................................................................................... 6
2. Methods ...................................................................................................................................... 8
3. Results ....................................................................................................................................... 19
4. Discussion ................................................................................................................................ 39
5. Conclusion ............................................................................................................................... 40
6. Future Work ............................................................................................................................. 42

viii
List of Tables
Table 1: Average values for one typical year hourly solar radiation, and ambient temperature at selected locations.............................................................................................. 15
Table 2. ISCC plant’s technical & economic parameters ....................................................... 16
Table 3. Integrated Solar Combined Cycle Projects ............................................................... 27

ix
List of Figures
Figure 1: Diagram of an ISCC plant. …………………………………………………………..9
Figure 2: Breakdown cost of ISCC LCOE ……………………………………………………14
Figure 3: LCOE for 500 MW NGCC & 550 MW ISCC Plants with respect to NGCC plant at different fuel prices (assumed constant over 25 years), and locations…………………23
Figure 4: CoA for 500 MW NGCC & 550 MW ISCC Plants with respect to NGCC plant at different fuel prices (assumed constant over 25 years), and locations………………….....25
Figure 5: LCOE & abatement cost for 550 MW ISCC Plants with respect to 500 MW NGCC at different fuel prices, with and without ITC and different levels of carbon price ……………………………………………………………………………………………….……26
Figure 6: Break-even NG price at different design solar share in 550 MW ISCC Plant located in Las Vegas……………………………………………………………………………29
Figure 7: LCOE cost for 550 MW ISCC Plants with respect to 500 MW NGCC at different capacity factors of ISCC and NGCC……………………………………………………….…32
Figure 8: CoA for 550 MW ISCC Plants with respect to 500 MW NGCC at different capacity factors of ISCC and NGCC …………………………………………………….……33
Figure 9: LCOE for 500 MW NGCC & 550 MW ISCC Plants with respect to NGCC plant at different fuel prices and locations (assumed CSP capital cost of 3000 $/kW).…………36
Figure 10: CoA for 500 MW NGCC & 550 MW ISCC Plants with respect to NGCC plant at different fuel prices and locations (assumed CSP capital cost of 3000 $/kW).…............36

x
Acknowledgements
I would like to express my sincere gratitude to my thesis advisor, Dr. Dalia
Patiño-Echeverri, for her steadfast encouragement, useful discussions, invaluable
assistance, advice, and comments. Without her tireless and insightful supervision, the
completion of this thesis would not have been possible. Many thanks and appreciations
are due to the members of my thesis committee: Dr. Naif M. Alabbadi, Dr. Richard
Newell and Dr. Timothy L. Johnson for their valuable contributions to this work.
I would like also to express my special thanks to Eng. Ziyad Al-Shiha, the new
CEO of Saudi Electricity Company (SEC), for his kind and great support, when he was
serving as Saudi Aramco Vice President for Power Systems, to award me a scholarship
to attend an advanced degree program at Duke University.
I am forever profoundly indebted to my parents, to whom this work is
dedicated, for their unparalleled love, support and encouragement throughout my
entire life.
I would like to express my profound gratitude to my children, Abdullatif and
Nora, to whom I owe my life, for their unending patience, support, and love.
But most of all my sincere love and deepest appreciation goes to my wife, Mona,
for her unwavering encouragement, understanding and patience during my study.
Last but not least, I want to express my heartfelt gratitude to my brothers and
sisters, Dr. Saeed, Dr. Hussain, Maryam, A’isha, Khalid, Fawzya, Abdullah, Khalil and
Mohammed, for their emotional support and time spent to guide and advise me during
my whole education.
I have thanked just a few of the people who have been instrumental in shaping
my career and academic professional so far, and I ask forgiveness from those who have
been omitted unintentionally.

1
1. Introduction
1.1 Overview
The Integrated Solar Combined Cycle Power Plant (ISCC) has been recently
introduced in the power generation sector as a technology with the potential to help
reduce the costs of solar energy for electricity generation.
An ISCC power plant combines a Concentrated Solar Power (CSP) plant and a
Natural Gas-Fired Combined Cycle (NGCC) power plant. The CSP energy is used to
either produce additional steam that is integrated in the NGCC’s steam turbine to
generate electricity [8], or to heat the compressed air in the gas turbine before entering
the combustion chamber [16].
The concept of the ISCC as a parabolic trough solar plant integrated with modern
combined cycle power plants was initially proposed in the early 1990s by Luz Solar
International, the builders of the SEGS trough plants in California [8].
The first plant materializing this concept was the Archimede Project in Sicily
Italy, which consists of two 380 MWe gas-fired combined cycle power plants and a 5
MWe parabolic trough solar field that uses molten salts as heat transfer fluid (HTF) [1].
As of 2014, there are at least 157MW of thermal solar plants integrated with a natural gas
combined cycle plant, including the 75MW Martin Next Generation Solar Energy Center
in Indiantown Florida, 20MW ISCC Ain Beni Mathar in Morocco, 20MW ISCC Hassi
R'me in Algeria, 20MW ISCC Kuraymat in Egypt and the 17MW ISCC Yazd in Iran. [2-5]

2
ISCC plants effectively help integrating solar power into the grid. The variability
of the solar energy resource and its diurnal nature imply that the CSP is non-
dispatchable unless coupled with an energy storage system [19]. The integration of a
CSP with an NGCC solves this problem while providing reductions of both operating
and capital costs, and the possibility of increased operational flexibility when compared
to a standalone NGCC [7].
The ISCC plant can be configured in two alternative ways so that the steam
generated through solar energy in an ISCC can either be used to reduce the plant fuel
consumption while maintaining the same NGCC plant power output (fuel saver
operation) or to increase the NGCC plant output during solar hours while keeping a
constant fuel input (power boosting operation) [6,7].
The main benefit of the integration of solar-generated steam in the NGCC plant
is increased fuel efficiency (i.e. reduced usage of natural-gas per unit of electricity
generated) and the associated reductions in fuel costs and air emissions from natural gas
combustion such as NOx and CO2. Other reductions in operating costs from an ISCC
relative to stand-alone CSP and NGCC plants come from the reduced thermal
inefficiencies due to the daily start-up and shutdown of the steam turbine at a CSP plant
[9], and from savings in labor costs that result from a shared operation and maintenance
crew for both the CSP & NGCC plants. Capital cost reductions of the ISCC relative to
stand-alone NGCC and CSP plants result from shared usage of the NGCC equipment

3
(e.g. steam turbine, generator, and balance of plant) to convert the solar-generated steam
to power, and from sharing the same land, building, control room, and power
transmission lines.
1.2 Literature review
A number of papers evaluate the technical and economic advantages of the ISCC,
explore different solar thermal technologies, and discuss alternative setups to optimize
performance.
Kelly et al. [9] studied two integrated plant designs using Gate Cycle modeling
software and concluded that annual solar contributions of up to 12 percent in an ISCC
should offer economic advantages over a conventional solar-only parabolic trough
power plant. Also, they found that the most efficient use of solar thermal energy is the
production of high-pressure saturated steam for addition to the heat recovery steam
generator.
Rovira et al. [11] assessed a number of ISCC configurations with solar parabolic
trough collectors and found that the direct steam generation (DGS) configuration is the
best choice for solar energy integration. However, there are a number of challenges
associated with this configuration such as control of solar field during solar radiation
transients, two-phase flow inside the receiver tubes, and temperature gradients in the
receiver tubes [40].

4
Baghernejad et al., [12] and Al-Sulaiman [13] estimated and analyzed the energy
and exergy destruction of an ISCC plant and demonstrated that around 71–73% of the
destroyed exergy (i.e. waste heat) occurs in the solar collectors.
Montes et al., [14] and Nezammahalleh et al., [15] performed an analysis and
techno-economic assessment of an ISCC using Direct Steam Generation (DSG) in
parabolic trough collectors and showed the great influence of solar field size as function
of the power cycle capacity (i.e. the solar multiple) in daily operation, annual
performance, and economy of a DSG parabolic trough plant. Schwarzbözl et al. [16]
introduced and evaluated a system where solar tower plants use pressurized air
receivers to heat the compressed air in a gas turbine. The system achieves an annual
average solar to net electric efficiency of up to 19% which is amongst the highest
conversion efficiencies for solar electric technologies.
Other studies discuss operational issues and present costs and benefits for
operational ISCC plants in Egypt [3], Iran [4] and Algeria [5]. Most past studies conduct
a static analysis of the performance of ISCC plants at a particular time without
evaluating life-time performance to account for the variation of solar energy production
and other factors likely to significantly affect the economics of this technology. A notable
exception is the work of Moore and Apt [44] who simulate one year of hourly operations
of an ISCC located in Phoenix Arizona, receiving prices that vary in the same way the
median of all nodal hourly prices in California ISO. The plant is run to maximize hourly

5
marginal profits so for every hour any of three situations occurs: 1) the plant runs only
with natural gas (i.e. “at base load”); 2) the plant operates as an ISCC with both gas and
whatever solar energy is available (i.e. “with duct firing”); or 3) the plant does not run at
all. A parametric analysis that varies natural gas prices between 2 and 12 $/MMBTU and
adjusts hourly electricity prices to reach annual averages between 35 and 85 ($/MWh),
results in ISCC capacity factors of 3%- 90% and unsubsidized Levelized Cost of
Electricity (LCOE) from the solar portion of the ISCC of 170-3800 ($/MWh).
1.3 Motivation
During the last decade, a number of government/federal polices and incentive
programs such as the solar investment tax credit in the U.S. and feed-in-tariff/premium
payment plans in many European countries, have spurred installations of concentrating
solar power (CSP) plants. Recent studies find that these incentives are effective in
creating several economic opportunities for the large-scale deployment of CSP with
thermal energy storage (TES) as a source of flexible and dispatchable electricity [20, 22,
48].
But despite gained experience, and promising economics, the penetration of CSP
in the power generation sector is lower than expected in the first IEA CSP roadmap
(IEA, 2014) and also in the 2010 Annual Energy Outlook (AEO 2010) by the U.S. Energy
Information Administration (EIA). Several factors may have slowed the penetration of

6
this technology, including long lead times, reduced prices of natural gas, and reduced
installation costs of photovoltaics (PV), which in the US are favored by US federal
incentives [44].
The recent few installations of ISCC technology in four continents highlight its
potential to reduce the capital and variable costs of CSP technologies while effectively
turning it into a dispatchable power plant. Cost reductions and dispatchability could
enable and accelerate substantial deployment of CSP technologies as an alternative to
meet renewables energy targets and obligations set by many countries such as
renewable portfolio standards (RPS) in the U.S. Thus, an examination of the ISCC’s
economic performance relative to standalone CSP and NGCC technologies is of
paramount interest to policy makers and investors.
1.4 Research Objective
The objective of this research is to present an assessment of the economic and
CO2 emissions benefits of an ISCC - configured for power-boosting operation- as a
source of baseload dispatchable electricity, relative to a standalone CSP with energy
storage and NGCC power plants. The Levelized Cost of Electricity (LCOE) and Cost of
CO2 Abatement (CoA) have been estimated for five different U.S. locations to account
for time-varying fluctuations in the solar resource and ambient temperature. Also,
sensitivity analyses of the ISCC’s LCOE and CoA to natural gas prices, solar energy

7
resources, potential power sector related policies, and financing variables have been
performed.
This study shall provide updated costs of electricity from NGCC, CSP and ISCC
plants taking into account the recent development and efficiency improvements in gas
turbines and thermal solar energy collectors. Also, it shall provide not only economic
but also environmental competitiveness of ISCC plant with respect to NGCC and
standalone CSP plants.

8
2. Methods
This study considers the integration of the most efficient NGCC and CSP
technologies available in today’s market, and estimates its LCOE, air-emissions, and
CoA in comparison to those of the standalone technologies by simulating operations
over one typical year in each of five possible U.S. locations. A custom-made
thermodynamic model of an ISCC plant composed of a 500-MW NGCC plant and a 50-
MW solar field is developed to properly represent operations under different
temperature and solar radiation conditions.
The specifications of the NGCC plant are those of the GE FlexEfficiency-60
Combined Cycle power plant, which is GE’s latest innovation in gas turbine technology
[27] while the solar component of the ISCC (i.e. solar field) is assumed to be identical to
that of a CSP with parabolic trough solar collectors.
The CSP-parabolic trough system has a solar thermal collector that is straight in
one dimension and shaped as a parabola in the other two, lined with a polished metal
mirror to focus the incident solar radiation onto a pipe along the focal line of the
collector. The pipe contains a heat-transfer fluid (usually thermal oil) which absorbs the
heat of the concentrated sunlight heating up to a temperature near 400°C. The hot heat-
transfer fluid is then used to heat steam in a standard turbine generator. The major
components of this technology are solar collector assemblies, steam turbine and
auxiliaries, heat exchangers, pumps, water tanks, heat transfer fluid (HTF) system, and
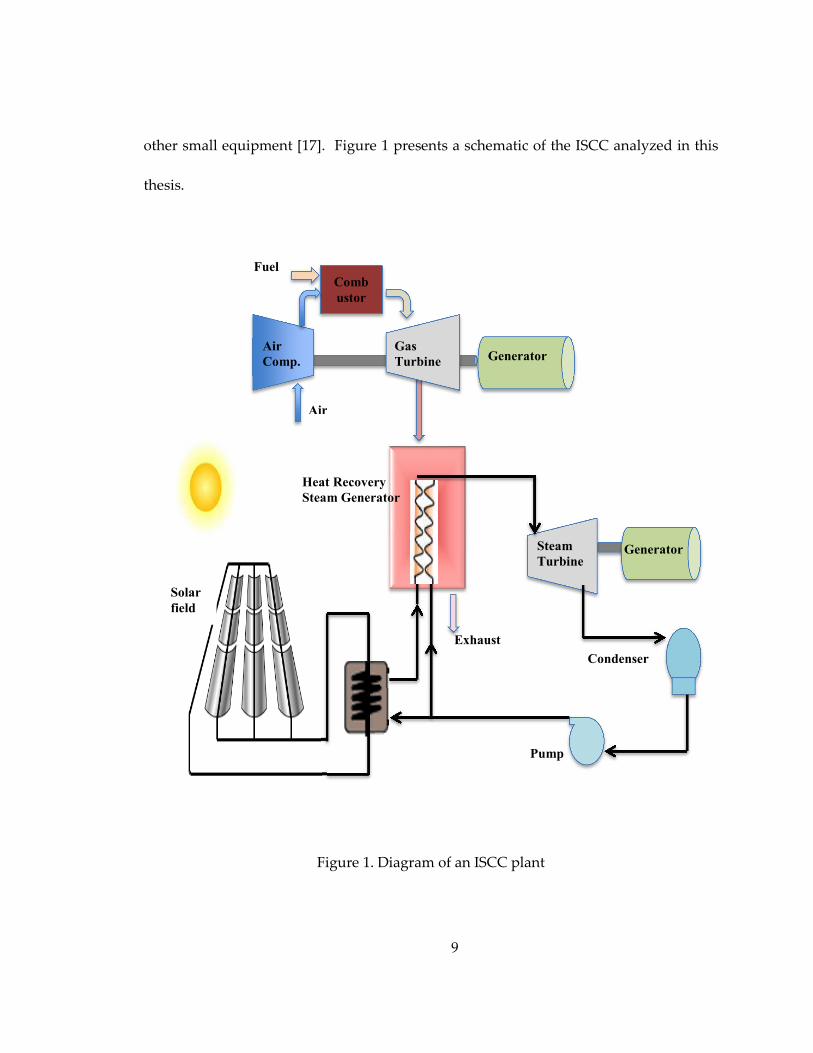
9
other small equipment [17]. Figure 1 presents a schematic of the ISCC analyzed in this
thesis.
Figure 1. Diagram of an ISCC plant
Comb
ustor
Generator Steam
Turbine
Gas
Turbine
Air
Comp. Generator
Air
Fuel
Exhaust
Condenser
Pump
Solar
field
Heat Recovery
Steam Generator
10
Although other CSP technologies such as linear Fresnel lens, and solar tower
could be used as the solar component of the ISCC [10], a parabolic through system is
chosen in this study because it is a technology widely deployed today with an installed
capacity six times larger than other CSP technologies combined [18] and it has an
excellent operating history of more than 30 years [18, 19]. Besides, it offers the most
economical alternative for solar concentrators for large power plant applications [20].
For this study, a CSP is chosen to have similar characteristics to those of the
64MW Nevada Solar One CSP Trough plant in Boulder city, NV [36]. The ratio of CSP to
NGCC installed capacity has been initially chosen to be 10% consistent with previous
studies that suggest this is the share that minimizes the steam turbine efficiency
reduction when solar-generated steam is not available [9, 21]. The results section
presents analysis to find the optimal share of solar field into an ISCC given varying
natural gas prices and solar resources.
2.1 NGCC Assumptions
Consistent with the GE specifications, the NGCC plant is assumed to achieve
61% efficiency at typical condition when loaded at 80% of its nameplate capacity or
more [27], a ramp rate of 50MW/min, a start-up time of less than 30 minutes, and
availability factor of 87%. (see Appendix A for details on the NGCC model)

11
For this analysis the capital cost of a 500MW NGCC is assumed to be 917 k$/MW
of net installed capacity while the fixed O&M cost is estimated to be 13.1-14.91 k$/MW
annually [28,35,46]. According to the AEO 2014 projections, the natural gas price would
rise from $4.52/MMBtu in 2014 to $13.82/MMBtu in 2040 under the reference case, and to
$8.65/MMBtu and $18.6/MMBtu in 2040 under the high and low oil and gas resources
cases respectively (See Appendix A-1.3 for NG price trajectories). Thus, a range of 4-18
$/MMBtu for gas prices is considered in calculating the LCOE and CoA.
2.2 CSP Assumptions
The installation (i.e. capital) costs of a CSP plant without energy storage are
estimated to be between 3000 and 5067 2012$/kWe based on figures from [22, 28, 48, 50].
In this study the capital cost is chosen to be 4000 $/kW which is the actual capital cost of
the recent Genesis Solar Energy Project in Blythe, California [18, 49]. (Refer to Appendix
B for details on the CSP modeling and to section 3.4.5 for a discussion on the uncertainty
surrounding future capital costs). Having excellent solar resources and the optimal solar
field size, the annual CSP plant capacity factor is estimated to be between 25% and 30%
and the CSP plant would generate between 100 and 122 GWh/year [20, 21]. For
standalone CSP analysis, only the location at Las Vegas, NV is considered.

12
2.3 ISCC Assumptions
The ISCC power plant under this study is composed of two gas turbines (each
one has 165 MWe), heat recovery steam generators (HRSGs) that produce steam at high
pressure (2400 PSI), intermediate pressure (360 PSI), and low pressure (80 PSI), a steam
turbine (220 MWe), and a solar field (50 MWe). The inlet and outlet design pressures
and temperatures of the combined cycle equipment as well as other technical and
economic parameters of the ISCC studied are summarized in Table 2.
The solar field is comprised of parallel rows of Solar Collector Assemblies (SCA)
and requires an area of 225 acres in which 74 acres (299,540 m2) are used for the aperture
reflective area (i.e. the area of the collector that reflects sunlight toward the receiver).
SCAs supply thermal energy to produce steam to drive a steam turbine in a Rankine
cycle with solar to thermal efficiency of 60.6%. The concentration factor of solar radiation
on the absorber is about 80%, and the maximum temperature in the absorber is about
400 C. The solar field design-point adopted is based on an assumption of direct solar
irradiance of 900 W/m2 and air temperature of 25 C. The parabolic trough plant is
coupled to the high-pressure level in the HRSGs.
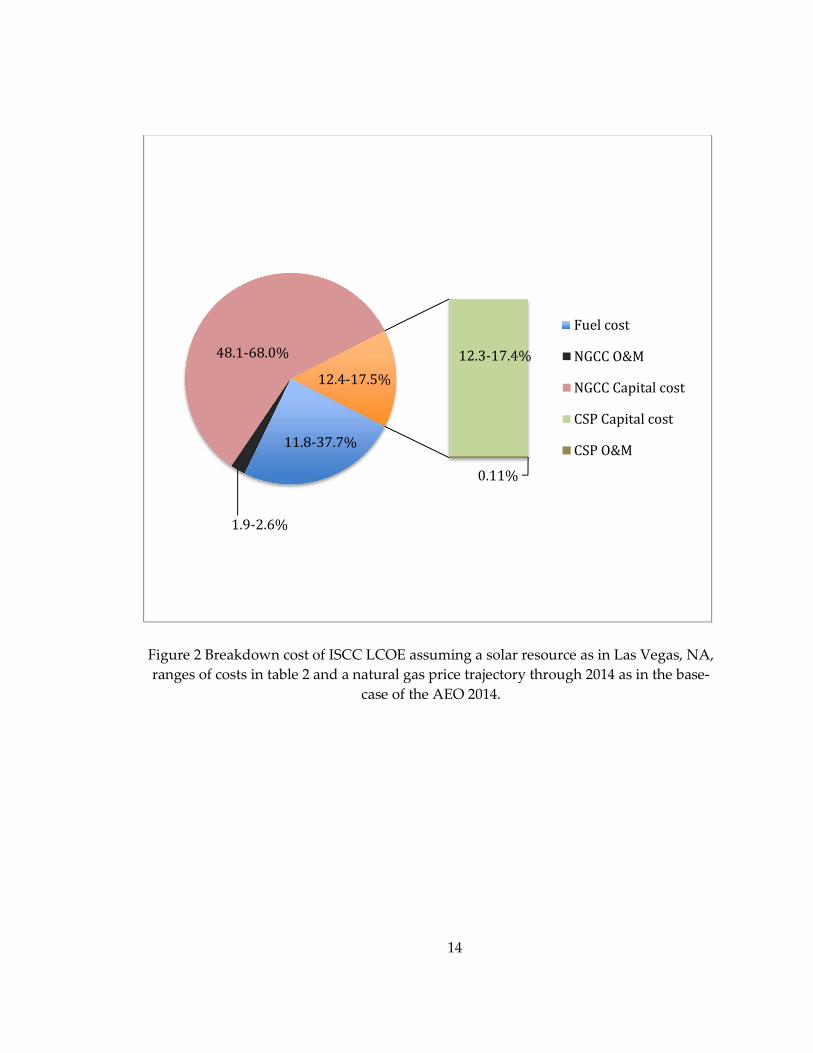
Figure 2 shows the breakdown of LCOE for the specified ISCC plant where as
expected the major cost item is the capital cost of the NGCC plant (48-68%) while the
fuel cost comes next to be about 12-38% (assuming gas prices in the range 4-18
$/MMBtu). The total solar field cost accounts for about 12-18%.

13
2.4 ISCC Simulation Model
The simulation code is developed in MATLAB to determine mass and energy
flow rates of the ISCC system. The plant operations are simulated by applying mass and
energy balances to every component of the combined cycle and the parabolic trough
collector field as explained in Appendices A-1.1 and B-1.1. The code was validated by
comparing the NGCC simulation results with DOE/NETL cost and performance baseline
estimates for NGCC plants [53] and also by comparing the CSP simulation results with
NREL SAM model’s output. The comparison of results is presented in Appendix C.
2.5 DNI and Temperature Data
To properly account for varying solar resources (as measured by the Direct
Normal Irradiance DNI) and temperature conditions likely to affect the performance of
the CSP component, it is assumed that the ISCC plant could be located in one of five
different locations in the U.S.; Barstow, CA; Honolulu, HI; Las Vegas, NV; San Antonio,
TX; and San Diego, CA. Hourly solar radiation data and hourly temperature for a typical
year for these sites has been obtained from the NREL System Advisor Model (SAM)
database [36] which generates a typical year data file based on satellite-derived data
over the period 1998-2005. The annual average solar energy resource (DNI) and
temperatures for each site are summarized in Table 1.
14
Figure 2 Breakdown cost of ISCC LCOE assuming a solar resource as in Las Vegas, NA, ranges of costs in table 2 and a natural gas price trajectory through 2014 as in the base-
case of the AEO 2014.
11.8-37.7%
1.9-2.6%
48.1-68.0% 12.3-17.4%
0.11%
12.4-17.5%
Fuel cost
NGCC O&M
NGCC Capital cost
CSP Capital cost
CSP O&M

15
Table 1: Average values for one typical year hourly solar radiation and ambient temperature at selected locations
Location
Solar Hours per day DNI (kW/m2) Ambient Temp.(C)
Annual
average Range
Standard
deviation
Annual
average Range
Standard
deviation
Annual
average Range
Standard
deviation
Barstow, CA 9.3 0-13 4.0 2981 0-1016 395 20.1 1.2-41.9 9.4
Honolulu, HI 6.7 0-11 3.0 2102 0-965 326 23.7 9.6-26.4 1.3
Las Vegas, CA 8.8 0-13 3.1 2802 0-1004 387 18.9 -0.6-40.4 9.7
San Antonio, TX 5.4 0-11 3.5 1714 0-964 302 20.0 -1.6 – 38 8.1
San Diego, CA 6.7 0-12 3.2 2082 0-951 332 16.8 7.9-31.5 4.0

16
Table 2. ISCC plant’s technical and economic parameters
Parameter Value 32,33 Parameter Value
Overall gross plant capacity (MW)
550 NGCC capital cost (2012$/kW)
876-1050 28,35,46 (917)
Gas turbine capacity (MW)
330 NGCC O&M fixed cost (2012$/kW-yr)
13.1-14.9128,35,46 (14)
HRSG capacity (MW) 220 NGCC O&M variable cost (2012$/MWh)
2-3.6 28,35,46 (3)
Solar field capacity (MW) 50 CSP capital cost (2012$/kW)
3000-506722,28,48-52
(4000) Gas turbine isentropic efficiency (%)
80-90 (90) CSP fixed O&M cost (2012$/kW-yr)
60-67.26 28,47 (65)
Compressor isentropic efficiency (%)
75-90 (87.5) Discount rate (before tax) (%)
7.5
Gas turbine inlet temp (F) 2,350-2,600 (2500)
Insurance rate (%) 0.5
Fuel higher heating value (kJ/kg)
52,288 Plant lifetime (years) 25
Air compressor outlet/inlet pressure ratio
1-25 (18.5) Real bond interest rate (%)
5.83
Steam turbine isentropic efficiency (%)
80-90 (85%) Real preferred stock return (%)
5.34
Steam turbine inlet temp (°F)
500-1100 (1050)
Real common stock return (%)
8.74
Steam turbine inlet pressure (psi)
1850-2500 (2400)
Percent debt (%) 45
Boiler pressure (psi) 2500 Percent equity “preferred stock” (%)
10
Boiler efficiency (%) 80 Percent equity “common stock” (%)
45
Condenser pressure (psi) 0.5-2 (1.5) Federal tax rate (%) 34
Condensate pump efficiency (%)
75-90 (80) State tax rate (%) 4.2
Solar field outlet oil temp. (°F)
735 Property tax rate (%) 2
ISCC capacity factor (%) 87 Inflation (%) 2.5
* Some parameters have a range of operating or estimated values. Values in parentheses are those used in all the base-case simulations

17
2.6 Levelized Cost of Electricity (LCOE) Calculation
LCOE ¢/kWh for all the technologies considered in this study is estimated using
eq. (1):
���� = ��������&������������
����� (1)
where
�������� is the total annualized capital cost ($), obtained by multiplying the
Capital Cost by the Fixed Charge Factor (FCF) which is a levelizing factor that depends
on the expected life time of the investment and a number of financial variables. A Fixed
Charge Factor (FCF) of 0.1128 (excluding any Investment Tax Credits) is assumed which
is the default FCF used in [40]. This assumption is based on economic figures and
equations explained in Appendix A- 1.4.
�&������� is the annual operational & maintenance cost –both fixed and
variable-($)
�������� is the annual fuel expenses ($)
������� is the annual electricity production (MWh)
2.7 Cost of Carbon Abatement (CoA) Calculation
CoA in $/tonne CO2 for a technology k is estimated by using eq. (2):
���� �� �������� �!� �� ��"ℎ!�$�%& ' ( $*+��,
) = .��� /0.��� 1,2(��3 4567768�7 9�:4 ; )0(��3 4567768�7 9�:4 94<)
(2)

18
Where ��� ,=>??>+�? 1�*, / is the rate at which CO2 is emitted by technology k
expressed in tonnes/MWh. The estimates of CoA in this study assume the abatement
technology (e.g. ISCC, CSP or NGCC) is replacing the average U.S. coal-fired power
plant in the U.S. which in years 2007-2010 had an average CO2 emissions rate of 1950-
2210 lb/MWh [38]. The LCOE of this reference technology is assumed to range between
2.5 (for an existing coal-fired power plant with no capital charges) and 5.6 ¢/kWh (for a
coal plant still paying its capital costs) [40]. Although there is much uncertainty about
the emissions of the plants that are or will be shutdown or ramped down during the
operation of an ISCC (i.e. uncertainty about emissions displaced), estimating the CoA
relative to an average coal plant offers useful information particularly for comparison
with other carbon abatement alternatives. Also, please note, that for the purpose of
comparing the ISCC’s CoA relative to other dispatch able technologies such as the
NGCC or CSP+Storage, any choice of reference technology in the CoA estimation yields
identical results.

19
3. Results
This section presents the estimated range of LCOE and CoA for the ISCC and the
stand-alone version of its components. Although the CSP without energy storage is not
a source of dispatchable electricity and hence cannot be compared to the ISCC, we
include its results to appreciate the contributions of an ISCC as a mechanism to integrate
renewable energy.
Given that there is uncertainty on the different factors determining LCOE and
CoA estimates, these figures are reported as ranges. However, for the results illustrated
in the graphs the “base-case” values listed on Table 2 are used.
3.1 Standalone Concentrated Solar Power (CSP)
The levelized cost of electricity (LCOE) of a standalone CSP located in Las Vegas,
Nevada is 20-23 ¢/kWh. If a 50 MW CSP plant displaced the average U.S. coal-fired
power plant in the US it would abate 103,487-117,285 tonnes of CO2 annually and the
abatement of CO2 emissions would come at a cost of 150-215$/CO2 tonne. If instead of
replacing a coal plant the CSP replaced the highly efficient NGCC considered in this
study then it would reduce carbon emissions by only 0.34-0.40 tonne/MWh, which
combined with an assumption of NG prices in the range 6-12 $/MMBTU -which is the
range of the projected average NG prices under all AEO 2014 scenarios over the next 25
years- results in a CO2 abatement cost CoA of 270-480 $/CO2.
20
3.2 Concentrated Solar Power (CSP) With Energy Storage
A CSP plant has a variable energy output and it is not dispatchable unless it is
equipped with a properly sized energy storage system, such as a Molten Salt System
(MSS); a thermal energy storage technology commercially available at unit storage cost
of 80 $/kWht [36]. The costs and performance of a CSP equipped with different sizes of
MSS ranging from 2 to 18 hours located in Las Vegas, NV have been examined using the
SAM model [see Appendix B-1.3]. It is found that in order to have a fully dispatchable
CSP, the solar field should back up 300% of its nameplate capacity which would rise the
LCOE from 20.4 to 24.9 ¢/kWh and the corresponding CO2 abatement costs to 155-235
$/tonne assuming the emissions and LCOE of the average coal-fired power plant.
3.3 Standalone NGCC
The LCOE ranges from 4.8 to 13.8 ¢/kWh when natural gas prices are in the range
4-18 $/MMBtu as depicted in Figure 3. If the NGCC replaces the average U.S. coal-fired
power plant, then the CO2 abatement cost is 40-200 $/tonne.
3.4 Integrated Solar Combined Cycle (ISCC)
3.4.1 NGCC efficiency reductions from partial loading and not solar hours.
An ISCC configured for power boosting operation mode has a steam turbine
capable of handling all the steam generated by the NGCC as well as the steam generated
21
by the solar field when operating at full capacity. Hence the steam turbine will operate
away from its optimal design point during nights or cloudy days when the input stream
from the solar field is diminished or absent. For the ISCC considered in this study, at
non-solar hours, the steam turbine will operate at 77% of its capacity which, according to
the Bartlett equation [29], results in an efficiency reduction of 0.01% (see Appendix A-
1.2). Such reduction is taken into account by the thermodynamic model used to simulate
ISCC performance. For example, for an ISCC in Las Vegas, the total annual electricity
generation –in a “typical year”- is estimated to be 3,858 GWh/yr from which 125 GWh/yr
are generated by the solar field. Thus, the annual solar share of the electricity generated
is about 3.2% and the annual electricity generation reduction in the steam turbine cycle
due to inefficiencies that result from partial loading when the solar field goes off is 48.3
MWh/yr.
3.4.2 Impact of solar resources and ambient temperature on ISCC economics.
Figure 3 depicts the difference in LCOE between the ISCC and NGCC plants at
the selected sites and for different assumptions about natural gas prices. It shows that
sites with higher average DNI result, ceteris-paribus, in lower LCOE. It was found that
at a natural gas price of $6/MMBtu, the LCOE of an ISCC in Barstow, CA -with the
highest annual average DNI of the considered five sites at 2981 kW/m2- is 6.26 ¢/kWh,

22
while the LCOE of an identical plant located in San Antonio, TX -annual average DNI of
1714 kW/m2- is 6.36 ¢/kWh.
The ambient temperature, on the other hand, has significant but conflicting
impact on the ISCC plant. While increasing the ambient temperature reduces the gas
turbine efficiency, it boosts the solar field conversion efficiency. It is found that for the
ISCC of this study the percent reduction on the gas turbine efficiency is lower than the
percent increase in solar conversion efficiency; however, because of the small
contribution of the solar field to the annual electricity generation at the ISCC, in general,
higher average temperatures mean higher LCOEs. This is illustrated by the plants in
Honolulu, HI (6.34 ¢/kWh) and San Diego, CA (6.31 ¢/kWh); two sites that have almost
the same annual average DNI of 2080-2100 kW/m2, but differing average ambient
temperatures of 23.7 C and 16.8 C, respectively.

23
Figure 3. LCOE for 500 MW NGCC & 550 MW ISCC Plants with respect to NGCC plant at different fuel prices (assumed constant over 25 years), and locations.
Indeed while the turbine cycle efficiency operating at Honolulu (23.7 C) is 0.69%
lower than when operating at San Diego (16.8 C) (consistent with results reported by
[24,26]), the electricity generation of the solar field at Honolulu is 1.4% higher. However,
0
2
4
6
8
10
12
14
16
-0.2
-0.15
-0.1
-0.05
0
0.05
0.1
0.15
0.2
0.25
0.3
0.35
3 5 7 9 11 13 15 17 19 21
NG
CC
LC
OE
(C
en
t/k
Wh
)
LC
OE
of
ISC
C w
ith
re
spe
ct t
o N
GC
C (
Ce
nt/
kW
h)
Fuel price ($/MMBTU)
Barstow Honolulu Las Vegas
San Antonio San Diego NGCC

24
because the contribution of the solar field to the annual electricity generation at the ISCC
plant is less than 3%, a 1.4% increase in the electricity from the solar field results on just
a 0.042% increase in total electricity generation.
While comparing LCOE gives information about the economic benefits of an
ISCC under high natural gas prices, it fails to account for the environmental superiority
of the ISCC that results from its lower CO2 –and other- emissions.
Figure 4 shows the CoA of an ISCC in the five considered locations and an
NGCC, relative to the average U.S. coal-fired power plant. The figure shows the natural
gas prices that are required for the ISCC and the NGCC to have identical CoA (i.e. the
breakeven natural gas prices). Interestingly, the breakeven NG prices found for CoA are
much lower than those for LCOE. For example, while $13.5/MMBtu is the breakeven NG
price for LCOE at Barstow, CA and Las Vegas, NV, just $8.5/MMBtu is the breakeven
NG price for CoA at these locations.

25
Figure 4. CoA for 500 MW NGCC & 550 MW ISCC Plants with respect to NGCC plant at different fuel prices (assumed constant over 25 years), and locations.
Another way to compare the ISCC and NGCC fully accounting for their
environmental performance is by assuming a carbon price. Figure 5 depicts the LCOE of
ISCC at Las Vegas, NV, assuming carbon prices of $39 and $53 per tonne representative
0
50
100
150
200
250
-8
-6
-4
-2
0
2
4
6
3 5 7 9 11 13 15 17 19
NG
CC
Ab
ate
me
nt
cost
($
/to
nn
e)
Ab
ate
me
nt
cost
wit
h r
esp
ect
to
NG
CC
($
/to
nn
e)
Fuel price ($/MMBTU)
Barstow Honolulu Las Vegas
San Antonio San Diego NGCC

26
of the Obama’s administration estimate for the social cost of carbon (SCC) in 2015 and
the average SCC over the years of 2015-2040. The figure also shows the effect of the Solar
Investment Tax Credit (ITC) which provides investors with a 30% tax credit for
expenditures associated with installing qualifying renewable energy facilities including
CSP plants installed by the end of 2016, and thus, reduces capital costs by 30%.
Figure 5. LCOE cost for 550 MW ISCC Plants with respect to 500 MW NGCC at different fuel prices, with and without ITC and different levels of carbon price.
-0.25
-0.2
-0.15
-0.1
-0.05
0
0.05
0.1
0.15
0.2
0.25
4 6 8 10 12 14 16 18
LC
OE
wit
h r
esp
ect
to
NG
CC
(C
en
t/k
Wh
)
Fuel price ($/MMBTU)
ISCC ISCC_30% ITCISCC_SCC (39$/ton) ISCC_SCC (53$/ton)

27
3.4.3 Economies of scale and optimal sizing of the ISCC components.
Integrating the solar component of a conventional parabolic trough CSP plant
into an NGCC leads to significant reductions in the capital cost as well as the operating
and maintenance costs due to utilization of common equipment such as steam turbine,
heat sink and balance of plant (BOP) and also due to elimination of thermal
inefficiencies from daily start-up and shut-down of solar steam-turbine. As estimated by
NREL [21] the expected reduction in the capital and O&M costs are about 28% and 67%,
respectively. On the other hand, such integration will slightly reduce the Rankin steam
bottoming cycle efficiency when solar is not available and steam turbine must run at
part load. The steam cycle efficiency reduction can be calculated using Bartlett equation
[29].
Comparing the levelized cost of solar electricity (LCOE-solar) of a 50 MW CSP
integrated into an NGCC (i.e. in an ISCC) with the 50 MW standalone CSP power plant
described in section 2.2 it is found that the LCOE-solar of ISCC is 35-40% less than that
of the standalone CSP. For example, the LCOE-solar of ISCC at Barstow, CA is about
11.3 ¢/kWh while standalone CSP is 19.1 ¢/kWh.
Typically, the CSP share of the ISCC plants installed around the world does not
exceed 15% of the total nameplate capacity as shown in table 3. This is due to tradeoffs
in both capital and operating costs of the ISCC when the solar share is increased.

28
Table 3. Integrated Solar Combined Cycle Projects [2-5]
Plant name Location Net output, MW (fossil fuel/solar)
Solar share Year online
Archimede Italy 130/5 3.7% 2010
Martin Indiantown, FL 1050/75 6.7% 2010
Ain Beni Mathar Morocco 450/20 4.3% 2010
Kuraymat Egypt 120/20 14.3% 2011
Hassi R’Mel Algeria 140/20 12.5% 2011
Yazd Iran 450/17 3.6% 2011
Increasing the design solar share in the ISCC plant reduces the capital costs of
the CSP component due to economies of scale, but increases the capital costs due to the
requirement of a larger steam turbine. Increasing the solar share also affects the fuel
costs. On one hand it reduces the efficiency of the steam turbine cycle when the solar
field goes off (because the steam turbine is sized to operate with all the steam generated
from the solar field and gas turbine cycle, and thus it operates at reduced efficiency
when no steam is provided from solar filed during the night or cloudy weather as
discussed in section 3.4.1 but on the other hand it reduces the overall need for natural
gas. The net impact of these effects depends on natural gas prices, plant capacity factors
and hourly variations in electricity prices. Figure 6 shows the break-even natural gas
price that would make an investor indifferent between an NGCC and an ISCC located in
Las Vegas for different solar shares. From the figure it is clear that the lowest breakeven

29
natural gas price is obtained for a solar share of about 10%. Increasing the solar shared
beyond this point is not economical due to the tradeoffs between the different costs. For
example, increasing the solar field from 2% to 22% reduces the levelized cost of solar
electricity from 12.4 ¢/kWh to 11.4 ¢/kWh; however, the ISCC LCOE (assuming
$6/MMBtu for NG price) rises from about 6.0 ¢/kWh to 6.6 ¢/kWh due to the combined
effect of an increase in the capital costs of a larger steam turbine and an efficiency
reduction in the steam turbine cycle.
Figure 6. Break-even NG price at different design solar share in 550 MW ISCC Plant located in Las Vegas.
10
10.5
11
11.5
12
12.5
13
0 5 10 15 20 25
Bre
ak
ev
en
NG
pri
ce (
$/
MM
BT
U)
Solar Share %

30
3.4.4 Effect of capacity factors in the comparison of LCOE and CoA of different
technologies.
So far, the LCOE estimates presented assume the plants operate at a capacity
factor equal to their availability. This assumption fails to capture the fact that, instead of
operating whenever they are available, these plants may be ramped up and down by an
electricity system operator to balance electrical demand and supply. Made uniformly
across the plants compared, this assumption does not affect their relative profitability,
however, it ignores the fact that differences in marginal costs and operational flexibility
will determine the ultimate dispatch order. This is important, because if for example, the
NGCC were dispatched less than an ISCC, the capacity factor of the NGCC would be
lower and the corresponding LCOE values would change in favor of the ISCC.
In general, because of its zero marginal cost, a CSP with energy storage (ES)
would be dispatched before an NGCC or ISCC, so for the purposes of estimating the
relative LCOE and CoA costs it is safe to assume that the capacity factor of the CSP+ES is
equal to its availability. However, there is not clear indication of the relative dispatch
order between the NGCC and the ISCC. An accurate estimation of the capacity factor of
the NGCC and ISCC in a system requires simulation of balancing authority operations
and/or electricity market outcomes, both tasks beyond the scope of this thesis.
Specifically, the simulation of system operations requires a unit commitment/economic
dispatch model [54] that properly accounts for the need to meet varying electrical load,

31
and for the costs and performance of the power generators when dispatched at different
output levels.
To appreciate the difficulty of correctly inferring the relative capacity factors of
the ISCC and NGCC without a proper modeling framework it is useful to consider that
given that the marginal costs of the NGCC are lower than those of the ISCC at non-solar
hours, and higher during solar hours, one could conclude that in cases of lower electrical
demand, the ISCC should operate during the day and shutdown at night when the
NGCC can operate more efficiently. However this conclusion may be wrong because a
cold start of the ISCC in the morning could offset the gains from reduced natural gas
consumption during the day. In other words, the systems’ costs over the full day period
may be minimized when the ISCC is kept operating at night even if its fuel efficiency is
lower than that of the NGCC, in order to avoid the morning start-up costs and take
advantage of the low marginal costs of the ISCC during the solar hours.
To explore how the LCOE and CoA comparisons would change we consider a
scenario when the ISCC’s capacity factor is 5% and 10% higher than that of an NGCC
plant, and a scenario when it is 5% and 10% lower. We assume that the change in
capacity factor does not affect the plants efficiency but instead changes the proportion of
time the plants are shutdown hence modifying both the plants electrical output and the
associated operating variable costs. The results, as depicted in figures 7 & 8, show that
the change in the capacity factor has a significant impact on the LCOE and CoA. As the

32
capacity factor of ISCC is 10% higher than NGCC one, the CoA and LCOE of the ISCC
are less than those of the NGCC for natural gas prices in the range considered (i.e. 4-
18$/MMBTU). On the contrary, when the ISCC’s annual capacity factor is lower than
that of the NGCC by 10%, the LCOE of the ISCC is higher than the LCOE of the NGCC
for all natural gas prices in the range 4-18 $/MMBTU, while the CoA of the ISCC is only
lower than the CoA of the NGCC for gas prices that exceed 17 $/MMBtu. If the capacity
factor of ISCC is just 5% higher than that of NGCC, the breakeven gas prices for CoA
and LCOE of ISCC are about $5.5/MMBtu and $8/MMBtu, respectively.

33
Figure 7. LCOE cost for 550 MW ISCC Plants with respect to 500 MW NGCC at different capacity factors of ISCC and NGCC. The number after the plant type refers to capacity factor. For example, ISCC87 refers to an
ISCC operated at an 87% capacity factor.
-0.6
-0.4
-0.2
0
0.2
0.4
0.6
3 5 7 9 11 13 15 17 19 21
LC
OE
of
ISC
C w
ith
re
spe
ct t
o N
GC
C (
Ce
nt/
kW
h)
Fuel price ($/MMBTU)
ISCC87-NGCC82 ISCC87-NGCC77 ISCC87-NGCC87
ISCC82-NGCC87 ISCC77-NGCC87

34
Figure 8. CoA for 550 MW ISCC Plants with respect to 500 MW NGCC at different capacity factors of ISCC and NGCC.
3.4.5 Uncertainty on future capital costs of a CSP and its impact on relative LCOE and
CoA estimates.
As stated in section 2.2 estimates of the capital costs of a CSP plant reported in the
literature are between 3000 and 5067 2012$/kWe [22, 28, 48-52]. The IEA [48] estimates
-15
-10
-5
0
5
10
3 5 7 9 11 13 15 17 19 21
Ab
ate
me
nt
cost
wit
h r
esp
ect
to
NG
CC
($
/to
nn
e)
Fuel price ($/MMBTU)
ISCC87-NGCC82 ISCC87-NGCC77 ISCC87-NGCC87
ISCC82-NGCC87 ISCC77-NGCC87

35
the capital cost of a CSP plant in 2014 to be around 4200 $/kW, however, it expects costs
to decrease as CSP deployment progresses and projects costs to be reduced to 3000 $/kW
by 2020.
Similarly, a study published by IRENA (International Renewable Energy Agency) in
2013 claimed that the costs of installed parabolic trough systems ranged from 3400-4600
$/kW for load factors of 20-27% [52]. In that study, IRENA projected a 30-50% reduction
in capital costs by 2020 due to technological learning and economies of scale following
the increasing deployment of CSP power.
This projection of capital cost reductions was also consistent with the ambitions of the
SunShot Initiative, an aggressive R&D plan launched by the U.S. DOE in 2011 [51], to
make large-scale solar energy systems cost competitive (6 cents/kWh or less) without
subsidies by the end of the decade. This would have required a reduction of more than
50% in capital costs, estimated to be about $4,000/kW in early 2012.
However, during the last 4 years, the EIA estimates of capital costs reported in the
Annual Energy Outlook reports (AEO) for a CSP have been significantly revised up and
down. For example, in 2011, the estimated the capital cost of a CSP at 4877 (2012$/kW) a
value 10% lower than the estimate presented in the previous year in the AEO2010.
However, in 2013, the AEO presented a capital cost estimate of 5067 (2012$/kW), a value
4% higher than the estimate from the AEO 2011 but 7% lower than the estimate of the
AEO 2010. The AEO documents do not offer much information on the reasons for

36
estimates revisions, but most likely the changes in cost estimates are driven by the
changes in projections for technology deployment. For example in 2010, the AEO 2010
projected that solar thermal generation capacity would increase from 610 MW in 2010 to
870 MW in 2015. However, the AEO 2011 revised this estimated and projected an
increase of installed capacity from 610 MW in 2010 to 1260 MW in 2015. In addition to
changes in the forecast of deployment, it is also possible that the EIA has had to adjust
its estimates up, due to initial overestimation of the expected cost reductions that would
result from each unit of deployment. [23, 25]
For all the analysis presented so far in this thesis, a capital cost of 4000 $/kW (in 2012
U.S. dollars) has been assumed. This cost reflects the reality of the most recent CSP plant
completed in the country; the Genesis Solar Energy Project [18, 49]. This project,
completed in Blythe, California at a cost of one billion dollars and expected to produce
580,000 MWh/yr from 250 MW parabolic trough CSP plant, can be seen as a typical
project representative of current costs. However, as it has been discussed above there
are reasons to believe that cost may fall down in near future to about 3000 $/kW or less,
and this has the potential to change an assessment of the ISCC economics significantly.
To explore this effect, figures 9 and 10 show how the breakeven NG price changes –from
the LCOE and CoA perspectives- when the capital cost of a CSP are assumed to be on
the low range of the capital cost estimates (i.e. $3000/kWe).

37
Figure 9. LCOE for 500 MW NGCC & 550 MW ISCC Plants with respect to NGCC plant at different fuel prices and locations (assumed CSP capital cost of 3000 $/kW).
Figure 10. CoA for 500 MW NGCC & 550 MW ISCC Plants with respect to NGCC plant at different fuel prices and locations (assumed CSP capital cost of 3000 $/kW).
0
2
4
6
8
10
12
14
16
-0.3
-0.25
-0.2
-0.15
-0.1
-0.05
0
0.05
0.1
0.15
0.2
0.25
3 5 7 9 11 13 15 17 19 21
NG
CC
LC
OE
(C
en
t/k
Wh
)
LC
OE
of
ISC
C w
ith
re
spe
ct t
o N
GC
C (
Ce
nt/
kW
h)
Fuel price ($/MMBTU)
Barstow Honolulu Las Vegas
San Antonio San Diego NGCC
0
50
100
150
200
250
-8
-6
-4
-2
0
2
4
3 5 7 9 11 13 15 17 19
NG
CC
Ab
ate
me
nt
cost
($
/to
nn
e)
Ab
ate
me
nt
cost
wit
h r
esp
ect
to
NG
CC
($
/to
nn
e)
Fuel price ($/MMBTU)
Barstow Honolulu Las Vegas
San Antonio San Diego NGCC

38
At this lower CSP capital cost case, the LCOE of an ISCC located in excellent solar
resources areas such as Barstow, CA and Las Vegas, NV is found to be 6.18 ¢/kWh (at a
natural gas price of $6/MMBtu) compared with 6.26 ¢/kWh in the base case (refer to
section 3.4.2). Accordingly, the breakeven gas prices for CoA and LCOE of ISCC become
about $6.5/MMBtu and $10/MMBtu, respectively. In comparison, the breakeven gas
prices for CoA and LCOE of ISCC in the base case are $8.5/MMBtu and $13.5/MMBtu,
respectively.

39
4. Discussion
At current U.S. NG prices, assuming identical capacity factors, and in the absence
of carbon emission regulations, the ISCC is not cost competitive with an NGCC plant.
Investors considering this technology may be motivated by the need to comply with
Renewable Portfolio Standard (RPS) targets, or by the intention to hedge against the risk
of high natural gas prices in the future. Indeed, as shown in figure 3, the break-even
natural gas price assuming excellent solar resources such as those in Barstow, CA and
Las Vegas,NV varies between 13.5 $/MMBtu and 14 $/MMBtu which are high values,
but not implausible as it can be judged from the prices projected by EIA [28] under the
Low Oil and Gas Resource Scenario.
But even under a low natural gas price scenario, an ISCC could become
economically viable if electric power generators have to pay a price for their carbon
emissions.
If the current scheme of the solar investment tax credit (ITC) [42], which provides
a 30% tax credit for projects that are placed in service prior to January 2017, were
extended, the LCOE of the CSP and ISCC would be reduced by 25-28% and 3-4%,
respectively, which would make the ISCC more economical than an NGCC at fuel price
of 8.5-9.5 $/MMBtu, even in the absence of a carbon price.

40
5. Conclusion
This study provides an economic assessment of an ISCC, a technology that
integrates solar thermal energy into efficient and widely installed natural gas combined
cycle power plants. The benefits from such integration include reduction in the fixed
and variable operations and maintenance costs resulting from CSP and NGCC efficiency
improvements, and elimination of the intermittency characteristic of solar generation.
The analysis shows that the ISCC has favorable levelized electricity costs when
compared with standalone CSP+ES technologies. However, under low and moderate
natural gas prices and in the absence of any carbon prices, capacity factor differences or
subsidies, the NGCC generates electricity at lower costs. Considering a price for carbon
emissions would significantly reduce the gap between ISCC and NGCC LCOEs and
would make the breakeven gas price to be in the range of 10.5-12 $/MMBtu at excellent
solar resources locations. A further reduction in the breakeven gas price - range of 8.5-
9.5 $/MMBtu- would be achieved under the 30% ITC program.
On the other hand, ISCC demonstrates excellent performance in lowering the
CoA relative to CSP and NGCC at natural gas prices of 8.5-9 $/MMBtu under current
capital cost of CSP. Although only a relatively small amount of solar share (3%-15%) can
be economically incorporated in an ISCC, deploying this technology in the several
NGCC plants that may be built in the U.S. to replace coal-fired power plants is an
alternative that should be seriously considered in states with good solar resources.

41
If the CSP capital costs were to go down to $3,000/kW –a plausible event in the
next decade-, then the ISCC plant would be more competitive than an NGCC with gas
prices in the range of 9.5-10.5 $/MMBtu even if there are no subsidies or carbon pricing.
Such break-even gas price could be much lower if CSP achieves higher capital cost
reduction as expected by DOE, IEA and IRENA.

42
6. Future Work
The competitiveness of ISCC with conventional NGCC and other solar energy
options should be assessed taking into account the potential capital cost reduction of a
CSP. The uncertainty surrounding the near- and mid-term capital cost of CSP poses the
need to perform a detailed assessment of potential cost reductions and performance
improvements for each component of a CSP plant such as collectors, heat transfer fluid
system, energy storage and labor cost.
Also, as discussed in section 3.4.4 in this study, the economic performance of the
ISCC is evaluated assuming operations at a constant capacity factor for both an NGCC
and an ISCC. The economic effects of relative capacity factors of the NGCC and the
ISCC are examined under a parametric analysis that assumes there are no efficiency
changes due to operation at different output levels. Future work, should simulate the
performance of the ISCC in the context of system operations properly accounting for the
need to meet varying electrical load, and for the costs and performance of other
conventional and renewable generators.

43
Appendix A: Modeling of NGCC Plant
1.1 NGCC efficiency
Natural Gas Combined Cycle power plants generate electricity with the gas turbine
generator and use the waste heat (hot exhaust gases) to make steam to generate
additional electricity via a steam turbine. NGCC plants are being installed in increasing
numbers across the world in regions where there is access to large quantities of natural
gas. According to the EIA 2013AEO report, the U.S. will add 9.6 GW of NGCC generated
capacity in the next 5 years [28]. Typical Combined cycle block sizes offered by three
major manufacturers (Alstom, General Electric and Siemens) are roughly in the range of
50 MW to 500 MW.
NGCCs can be used for both baseload and peak power generation. The
performance of NGCC power plants is well estimated using the Brayton cycle and
Rankine cycle equations, which as found in most engineering thermodynamics
textbooks [26, 32-33] are:
- The Brayton Cycle
Assuming that compressor efficiency is ηc and turbine efficiency is ηt then the actual
compressor work WC and the actual turbine work WG are given by:
@� = A �(ℎ� − ℎC)/EF (A1)
@G = ( A � + A 2)(ℎI� − ℎJ)/E* (A2)
The actual total output work is

44
@*+* = @G − @� (A3)
where
A � �!K A 2 are mass flow of air and mass of fuel flow, respectively.
ℎC, ℎ�, ℎI� �!K ℎJare enthalpy entering the compressor, enthalpy at the exit of
compressor, entering the gas turbine, and leaving the gas turbine, respectively.
- The Rankine Cycle
The steam generator heat
M? = ℎC? − ℎJ? (A4)
Turbine work
@N = A ?(ℎC? − ℎ�?) (A5)
Pump work
@O = A ?(ℎJ? − ℎI?)/EO (A6)
Overall cycle work
@P+*�� = @G + @N−@� − @O (A7)
Overall cycle efficiency
E = QR8:�
=<A (.ST) (A8)
where ℎC?, ℎ�?, ℎI? �!K ℎJ? are enthalpy of the steam at the turbine inlet, enthalpy at
turbine outlet, the enthalpy at the condenser exit, and the enthalpy at the pump exit,
respectively. A ?, EO and LHV are mass of the steam flow, the pump’s efficiency and the
lower heating value of fuel, respectively.

45
1.2 Effect of NGCC partial load operation on efficiency
The percent reduction in efficiency, as a function of the steam flow ratio, can be
calculated as follows [29]:
%V�KW"�X�! = 0.191 − 0.409^ A A 1,2⁄ ` + 0.218 ^ A A 1,2⁄ `� (A9)
E?,*�1c>�, = (1 − %V�KW"�X�!) d E?,*�1c>�,.1,2 (A10)
where A and A 1,2 are the steam flow rates at the operational and the full load
conditions, respectively.
1.3 Fuel prices scenarios
Figure A1 shows the EIA’s projected gas price till 2040 under three different
scenarios [28].
Figure A1. AEO2014 projection for the natural gas prices till 2040 [28]

46
1.4 Fixed Charge Factor (FCF)
The FCF is used to annualize capital costs over the plant life in order to calculate
the LCOE. FCF depends on the present value of the future yearly carrying charges
which is the sum of the book depreciation, deferred taxes, return on debt, return on
equity, income taxes paid, and the ad valorem tax. It can be expressed in the following
equation [40]:
��� =∑ ��5
3f5gh iT5
j� (A11)
where CCm is year by year carrying charges, PVm is the present value factor of a
future expense in a given year, and An is the annuity factor. The CCm can be calculated
as follows:
��= = kc + �l,= + Vk= + V�= + �O,= + � ��m = 1, 2, … , ! (A12)
where kc is the book depreciation, �l,= is the tax preferences, Vk=is the return
on debt in year m, V�= is the return on equity in year m, �O,= is the taxes paid per year,
a is the ad valorem tax ml,c* and n is the plant life time.
For the ISCC plant, a Fixed Charge Factor (FCF) of 0.1128 (excluding any
Investment Tax Credits) is assumed, which is the default FCF used in [40] and
corresponds to simple real interest rate of 7.5%, Federal tax rate 34%, State tax rate of
4.15%, property tax rate of 2% and a capital lifetime of 25 years.

47
Appendix B: Modeling of CSP Plant
1.1 Description
A simple description of conversion processes occurring in the solar power plant
is given in many thermal solar energy textbooks and publications [1-6, 10, 11, 30, 31].
The incident solar radiation on the collectors’ field propagates along the parabolic
mirror and is converted into absorbed power. The absorbed power is then converted
into useful thermal power and thermal losses. Useful thermal power is expressed as
heating of the thermal fluid. The heat transfer process between the thermal fluid and
water results in high enthalpy water-vapor, converted into mechanical power in the
conversion block (turbo-generators). Mechanical power is then, efficiently converted
into electric power.
The heat received by parabolic trough solar field (i.e. useful thermal power, W)
can be expressed as
Qsolar= mtf ·cp · (To-Ti) (B1)
Where mtf, cp, To and Ti are mass flow rate of thermal fluid (kg/s), specific heat of
thermal fluid (J/kg K), outlet temperature of solar field (K), and inlet temperature of
solar field (K), respectively
The overall efficiency of the solar field is:
E?+��1 = o78�9
pqdjq (B2)

48
where r� �!K s� are direct irradiance normal to the aperture plane (W/m2), and
collector aperture area (m2), respectively.
The total collector area Ac required to generate specific value of electric power
from solar field can be found by the following relation:
sF = i78�9
pq∙uvw (>)∙xy∙x:∙x� (B3)
Where z?+��1 is design power output (MW), i is incident angle, ηc is the collector
efficiency, ηt is turbine cycle efficiency, and ηa is generator efficiency.
Solar to electrical energy efficiency is defined as:
EN0� = Q78�9
o78�9 (B4)
where Wsolar is the net power output of the solar only plant. The derivation of
each parameter is presented in many references [34].
1.2 Capital and O&M Cost Assumptions
The estimated capital cost for 50 MW concentrated solar thermal plant without
storage varies between 3000 and 5000 2012$/kWe based on figures from [22, 28, 48, 50].
In this study the capital cost is chosen to be 4000 $/kW which is the actual capital cost of
the recent Genesis Solar Energy Project in Blythe, California [49].
Based on the experience in SEGS projects, there are recognized economies of
scale which can be determined by the following scaling equation [19]:

49
Cost2 = (C2/C1)0.7 x Cost1 (B3)
where:
Cost1 is the reference cost for a piece of equipment of capacity C1
Cost2 is the predicted cost of the equipment at the desired capacity C2.
The O&M costs are estimated to be 60-67.26 2012$/kW-yr [28, 47]
1.3 Concentrated Solar Power (CSP) with energy storage
The NREL SAM software was used to simulate the performance of the CSP
located at Las Vegas, NV and equipped with different sizes of molten salt energy storage
ranging from 2 to 18 hours. SAM mode is briefly described in Appendix C-1.2.
Figure B1 demonstrate the performance of the CSP systems. For each chosen size
of the energy storage, the solar multiple has been optimized to achieve the lowest LCOE.
Thus, for 2 hours energy storage, it is found that solar multiple of 2.2 is the optimal size
which results in LCOE of 20.4 cent/kWh and about 38% capacity factor while 18 hours
energy storage requires 5.8 solar multiple to achieve the lowest LCOE at 24.9 cent/kWh
and delivers capacity factor of 76%.

50
Figure B1. Annual capacity factor and LCOE as function of solar field and thermal energy storage
1.8 2.2 2.6 3 3.4 3.8 4.2 4.6 5 5.4 5.8
0%
10%
20%
30%
40%
50%
60%
70%
80%
19
20
21
22
23
24
25
0 2 4 6 8 10 12 14 16 18
Solar multiple
An
nu
al
cap
aci
ty f
act
or
LC
OE
(C
en
t/k
Wh
)
Thermal Energy storage (Hours)
LCOE Capacity factor
51
Appendix C: Modeling of ISCC Plant
1.1. ISCC model
Different from other studies that use NREL SAM to simulate the thermal output of the
CSP component of the ISCC, this thesis uses a custom made thermodynamic model
implemented in Matlab to simulate the operations of the NGCC and solar field
simultaneously. The main benefit of combining the NGCC and solar field models into
one thermodynamic model is avoiding overestimating the losses at the solar field.
Using two programs to evaluate the two systems separately and then combining the
results could result in lower solar power generation estimates due to a possible double
counting of the parasitic losses in the CSP portion.
The enthalpy and entropy quantities, temperature, and flow pressure are computed
during the entire cycle of ISCC operations. These calculations are based on
thermodynamic equations presented in A-1.1 and B-1.1. The main input variables for the
combined cycle plant in the model are summarized in table 2 and include the following:
a. Gas turbine and heat recovery steam generator capacities.
b. Gas turbine inlet temp (F)
c. Air compressor outlet/inlet pressure ratio
d. The air compressor inlet temperature
e. The isentropic efficiency of the gas turbine, air compressor, and steam turbine.
f. The heat recovery steam generator (HRSG) exhaust gas temperature

52
g. The pressure and temperature at the steam turbine inlet.
h. The pressure and efficiency of the boiler
i. The condenser pressure.
j. The efficiency of condensate pump
The input variables for the solar field portion of the ISCC plant are exactly
similar to the input variable in the NREL System Advisory Model (SAM) which is
described in the following paragraphs; however, the developed Matlab code is only
designed for parabolic trough concentrating solar power while SAM includes
performance models for various renewable technologies such as photovoltaic systems
(flat-plate and concentrating), parabolic trough concentrating solar power, power tower
concentrating solar power (molten salt and direct steam), linear Fresnel concentrating
solar power, Dish-Stirling concentrating solar power, wind power, geothermal power,
and biomass power.
SAM represents the cost and performance of renewable energy projects using
computer models developed at NREL. SAM includes several libraries of performance
data and coefficients that describe the characteristics of system components such as
photovoltaic modules and inverters, parabolic trough receivers and collectors, wind
turbines, and biopower combustion systems. Also, it can automatically download data
and populate other input variable values such as solar resource data and ambient
weather conditions from online NREL database. For those components, users simply

53
choose an option from a list, and SAM applies values from the library to the input
variables. For the remaining input variables, users either use the default value or change
its value. These main input variables for the CSP-parabolic trough plant are:
- Installation costs including equipment purchases, labor, engineering and other project
costs, land costs, and operation and maintenance costs.
- Collector and receiver type, solar multiple, storage capacity, power block capacity for
parabolic trough systems.
- Analysis period, real discount rate, inflation rate, and tax rates.
- Tax and cash incentive amounts and rates.
SAM displays modeling results in tables and graphs, ranging from the metrics table that
displays levelized cost of energy, first year annual production, and other single-value
metrics, to tables and graphs that show detailed annual cash flows and hourly
performance data. The Matlab code, in the other hand, only displays the major
performance indicators such as LCOEs under different policies, daily, monthly and
annually electricity generations, size of the solar field, annual solar share, and annual
avoided CO2 emissions.
To consider the steam generated by solar field, the annual energy (MWh) from
the solar steam is calculated as follows [45]:
�N+��1 = 2.78 d 100| d ∑ ?+��1,}~|��}�C (ℎ?�,} − ℎI?,}) (C1)

54
Where:
2.78*10-7 : Conversion factor from kJ to MWh
msolar,x : Mass flow of the steam leaving the solar steam generator during hour x (kg)
hsg,x : Average specific enthalpy of the steam leaving the solar steam generator during
hour x (kJ/kg)
h3s,x : Average specific enthalpy of the water at the condenser outlet during hour x
(kJ/kg)
The annual energy (MWh) of the high pressure steam can be determined as follows [45]:
�N+��1 = 2.78 d 100| d ∑ ?,}~|��}�C (ℎC?,} − ℎI?,}) (C2)
Where:
2.78*10-7 : Conversion factor from kJ to MWh
ms,x : Mass flow of the high pressure steam entering the steam turbine during hour x (kg)
hs1,x : Average specific enthalpy of the high pressure steam entering the steam turbine
during hour x (kJ/kg)
hsg,x : Average specific enthalpy of the steam leaving the solar steam generator during
hour x (kJ/kg)
The energy efficiency of ISCC plant is simply a ratio of useful output energy to
input energy. Accordingly, the efficiency of the reference ISCC plant under

55
consideration in this study is calculated as the ratio of the net produced power by the
generators of gas turbine and steam turbine, and the thermal energy supplied by the fuel
and solar field:
EpN�� = QR8:�
=<A (.ST)�o78�9 (C3)
If the thermal energy input by solar field is considered free to the NGCC plant,
M?+��1 term shall be omitted and thus the overall efficiency of the ISCC will be higher
than the efficiency of the standalone NGCC plant.
The fraction of solar energy input to the total energy input of ISCC plant is
defined as:
�� = o78�9
=<A (.ST)�o78�9 (C4)
The code also calculates the simple levelized cost of electricity for NGCC, solar
portion of ISCC, and ISCC technologies. The estimated LCOE is based on equation (1)
and the economic input parameters that are reported in table 2.
1.2. Thermodynamic and economic model validation
The developed thermodynamic model in Matlab has been validated by
comparing its performance results for standalone 565 MW NGCC plant with the
DOE/NETL cost and performance baseline estimates for similar NGCC plant. The
performance of the solar field portion has been benchmarked with the NREL System
56
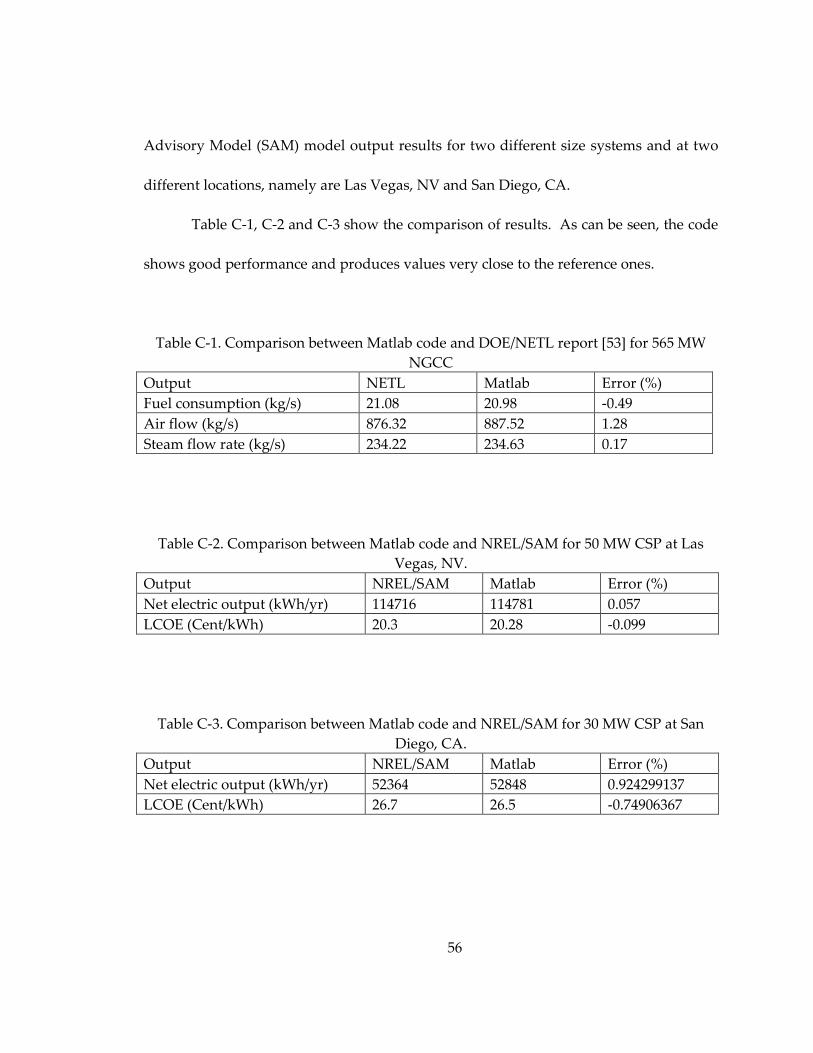
Advisory Model (SAM) model output results for two different size systems and at two
different locations, namely are Las Vegas, NV and San Diego, CA.
Table C-1, C-2 and C-3 show the comparison of results. As can be seen, the code
shows good performance and produces values very close to the reference ones.
Table C-1. Comparison between Matlab code and DOE/NETL report [53] for 565 MW NGCC
Output NETL Matlab Error (%) Fuel consumption (kg/s) 21.08 20.98 -0.49 Air flow (kg/s) 876.32 887.52 1.28 Steam flow rate (kg/s) 234.22 234.63 0.17
Table C-2. Comparison between Matlab code and NREL/SAM for 50 MW CSP at Las Vegas, NV.
Output NREL/SAM Matlab Error (%) Net electric output (kWh/yr) 114716 114781 0.057 LCOE (Cent/kWh) 20.3 20.28 -0.099
Table C-3. Comparison between Matlab code and NREL/SAM for 30 MW CSP at San Diego, CA.
Output NREL/SAM Matlab Error (%) Net electric output (kWh/yr) 52364 52848 0.924299137 LCOE (Cent/kWh) 26.7 26.5 -0.74906367

57
References
[1] Donatini F, Zamparelli C, Maccari A, Vignolini M. High efficiency integration of thermodynamic solar plant with natural gas combined cycle. In: IEEE International conference on clean electrical power, ICCEP ’07 2007. p. 770.
[2] Armistead, T. F., Integrating solar, conventional energy resources, Combined Cycle Journal, Second Quarter 2010.
[3] M.A.H. El-Sayed, Solar supported steam production for power generation in Egypt, Energy Policy 33 (2005).
[4] R. Hosseini, M. Soltani, G. Valizadeh, Technical and economic assessment of the integrated solar combined cycle power plants in Iran, Renew. Energy 30, (2005).
[5] F. Khaldi, Energy and exergy analysis of the first hybrid solar-gas power plant in Algeria, in: Proceedings of ECOS 2012-the 25th International Conference on Efficiency, Cost, Optimization, Simulation and Environmental Impact of Energy Systems, June 26-29, 2012. Perugia, Italy.
[6] Juergen H. Peterseim, Stuart White, Amir Tadros, and Udo Hellwig, Integrated Solar Combined Cycle Plants Using Solar Power Towers To Optimise Plant Performance, SolarPACES 2012 conference, Marrakech, Morocco (2012).
[7] Bohtz, C., Gokarn, S., Conte, E., Integrated Solar Combined Cycles (ISCC) to Meet Renewable Targets and Reduce CO2 Emissions, Power Gen Europe Conference, Austria (2013).
[8] Johansson TB. Renewable energy, sources for fuels and electricity. Washington DC: Island Press; Chapter 5; 1993. p. 234–5.
[9] B. Kelly, U. Herrmann, M.J. Hale, Optimization studies for integrated solar combined cycle systems, in: Proceedings of Solar Forum 2001 Solar Energy: The Power to Choose, April 21e25, 2001. Washington, DC.
[10] D. Ugolini, J. Zachary, J. Park, Options for Hybrid Solar and Conventional Fossil Plants, Bechtel White Paper, Bechtel Technology, December 2009.
[11] A. Rovira, M.J. Montes, F. Varela, M. Gil, Comparison of heat transfer fluid and direct steam generation technologies for integrated solar combined cycles, Appl. Therm. Eng. 52 (2013).

58
[12] A. Baghernejad, M. Yaghoubi, Exergy analysis of an integrated solar combined cycle system, Renew. Energy 35 (2010).
[13] Al-Sulaiman, Fahad A., Exergy analysis of parabolic trough solar collectors integrated with combined steam and organic Rankine cycles, Energy Conversion and Management, Volume 77, Pages 441–449, January 2014.
[14] M.J. Montes, A. Rovira, M. Muñoz, J.M. Martínez-Val, Performance analysis of an Integrated Solar Combined Cycle using Direct Steam Generation in parabolic trough collectors, Appl. Energy 88 (2011).
[15] H. Nezammahalleh, F. Farhadi, M. Tanhaemami, Conceptual design and techno-economic assessment of Integrated Solar Combined Cycle System with DSG technology, Sol. Energy 84 (2010).
[16] P. Schwarzbözl, R. Buck, C. Sugarmen, A. Ring, M.J. Marcos, P. Altwegg, J. Enrile, Solar gas turbine systems: design, cost and perspectives, Sol. Energy 80 (2006).
[17] Bostan, Ion, Resilient energy systems: renewables : wind, solar, hydro, Springer, 1566-0443, v. 19 (2013).
[18] National Renewable Energy Laboratory, Concentrating Solar Power Projects, http://www.nrel.gov/csp/solarpaces/by_project.cfm .
[19] National Renewable Energy Laboratory, Assessment of Parabolic Trough and Power Tower Solar Technology Cost and Performance Forecasts, report prepared by Sargent & Lundy LLC Consulting Group, 2010.
[20] The International Renewable Energy Agency (IRENA), Renewable Energy Technologies: Cost Analysis Series, IRENA Working Group, Volume 1: Power Sector (2012).
[21] Price, H., Keamey, D., Reducing the Cost of Energy from Parabolic Trough Solar Power Plants, International Solar Energy Conference, Hawaii (2003).
[22] Ardani, K. and Margolis, R., 2010 Solar Technologies Market Trends Report, prepared for U.S. Department of Energy (2011).
[23] Energy Information Administration. April 2013. Updated Capital Cost Estimates for Utility Scale Electricity Generating Plants. Washington, DC.

59
[24] F.R.P. Arrieta, E.E.S. Lora, Influence of ambient temperature on combined-cycle power-plant performance, Applied Energy 80 (2005) 261–272.
[25] Energy Information Administration. November 2010. Updated Capital Cost Estimates for Electricity Generation Plants. Washington, DC.
[26] Erdem H.H. and Sevilgen S.H. 2006. Case study: Effect of ambient temperature on the electricity production and fuel consumption of a simple cycle gas turbine in Turkey, Applied Thermal Engineering 26, 320–326.
[27] http://www.ge-energy.com/products_and_services/products/gas_turbines_heavy_duty/flexefficiency_50_combined_cycle_power_plant.jsp. Accessed on December 02, 2014.
[28] Energy Information Administration. 2014. 2014 Annual Energy Outlook report. Washngotn DC.
[29] Bartlett, R.L., 1958. Steam Turbine Performance and Economics. McGraw-Hill, New York, USA, pp. 70–109. LCCCN: 58-8039.
[30] Antonanzas-Torres, F., Sodupe-Ortega, E., Sanz-Garcia, A., Fernandez-Martinez, R., Martinez-de-Pison-Ascacibar, F.J.: Technical feasibility assessment of integrated solar combined cycle power plants in Ciudad Real (Spain) and Las Vegas (USA). In: Proc. 16th International Congress on Project Engineering, Valencia, Spain (2012).
[31] Dersch, J., Geyer, M., Herrmann, U., Jones, S., Kelly, B., Kistner, R., Ortmanns, W., Pitz-Paal, R., & Price, H. (2004). Trough integration into power plants—a study on the performance and economy of integrated solar combined cycle systems. Energy, 29, 947–959.
[32] Boyce, M.P., Handbook for Cogeneration and Combined Cycle Power Plants, 2nd edition, ASME Press, 2010.
[33] Michael J. Moran and Howard N. Shapiro, “Fundamentals of Engineering Thermo-dynamics”, 4th Edition, Toronto, 2000.
[34] J. Duffie and W. Beckman, Solar Engineering of Thermal Processes, John Wiley and Sons, Hoboken, New Jersey, USA, 3rd edition, 2006.
[35] Brattle Group (2014), Exploring Natural Gas and Renewables in ERCOT, Part III, Prepared for The Texas Clean Energy Coalition, Filed May 29, 2014.

60
[36] NREL SAM database, Last Accessed: Nov. 29, 2014, http://maps.nrel.gov/node/10/.
[37] International Energy Agency (IEA), Guidelines for the Economic Analysis of Renewable Energy Technology Applications, IEA, Quebec, 1991.
[38] U.S. Environmental Protection Agency, The Emissions & Generation Resource Integrated Database (eGRID), Last accessed: June 26, 2014, http://www.epa.gov/cleanenergy/energy-resources/egrid/ .
[39] Rainer Tamme, Optimised Industrial Process Heat and Power Generation with Thermal Energy Storage, IEA ECES Annex 19, Final Report, 2010.
[40] Integrated Environmental Control Model (IECM V8.0.2), Carnegie Mellon University,
http://www.iecm-online.com/ Accessed July 21, 2014. This is the public release of this model as of the access date.
[41] Yuanyuan Li, Na Zhang, Ruixian Cai, Low CO2 emission hybrid solar CC power system, The 25th International Conference on Efficiency, Cost, Optimization and Simulation of Energy Conversion Systems and Processes, Volume VIII, June 2012.
[42] Wagner SJ, Rubin ES, Economic implication of thermal energy storage for concentrated solar thermal power, Renewable Energy (2012), http://dx.doi.org/10.1016/j.renene.2012.08.013 .
[43] Sing, D., Croiset, E., Douglas, P. L., Douglas, M. A., Techno-economic study of CO2 Capture from an Existing Coal-Fired Power Plant: MEA Scrubbing vs. O2/CO2 Recycle Combustion, Energy Conversion and Management, 44(19), 3073-3091, 2003.
[44] Jared Moore and Jay Apt, Can Hybrid Solar-Fossil Power Plants Mitigate CO2 at Lower Cost than PV or CSP?, Environ. Sci. Technol. 47, 2487−2493, 2013.
[45] Fichtner Carbon Management GmbH, Methodology for conversion of a Combined Cycle Power Plant to an Integrated Solar Combined Cycle (ISCC), CDM Approved baseline and monitoring methodology AM0100, November 2011.
[46] The Northwest Power and Conservation Council (NPCC), Sixth Northwest Conservation And Electric Power Plan, 2013 revision.
[47] Bruckner, T., H. Chum, A. Jäger-Waldau, Å. Killingtveit, L. Gutiérrez-Negrín, J. Nyboer, W. Musial, A. Verbruggen, R. Wiser, 2011: Annex III: Cost Table. In IPCC Special Report on Renewable Energy Sources and Climate Change Mitigation [O.

61
Edenhofer, R. Pichs-Madruga, Y. Sokona, K. Seyboth, P. Matschoss, S. Kadner, T. Zwickel, P. Eickemeier, G. Hansen, S. Schlömer, C. von Stechow (eds)], Cambridge University Press, Cambridge, United Kingdom and New York, NY, USA.
[48] International Energy Agency (IEA), Technology Roadmap-Solar Thermal Electricity, 2014.
[49] Genesis Solar Energy Project Datasheet. November 2010. http://www.doi.gov/news/pressreleases/upload/Genesis-Fact-Sheet-20101104.pdf. Accessed December 10, 2014.
[50] Brett Prior, Concentrating Solar Power 2011: Technology, Cost and Markets. Greentech Media (GTM). 2011. http://www.gtmresearch.com/report/concentrating-solar-
power-2011-technology costs-and-markets, Accessed December 9 2014.
[51] Department of Energy, SunShot Vision Study, Chapter 5: Concentrating Solar Power: Technologies, Cost, and Performance, February 2012.
[52] EurObserv’ER, Solar Thermal and Concentrated Solar Power Barometer, May 2014.
[53] NETL. Cost and Performance Baseline For Fossil Energy Plants Volume 1: Bituminous Coal And Natural Gas To Electricity. DOE/2010/1397.Revision 2a, September 2013.
[54] E. Ela, M. Milligan, A. Bloom, A. Botterud, A. Townsend, and T. Levin, Evolution of Wholesale Electricity Market Design with Increasing Levels of Renewable Generation, Technical Report NREL/TP-5D00-61765, September 2014.