integrated results presentation for the year ended 31
TRANSCRIPT
Integrated Results Presentation for the year ended 31 March 2012

In support of 2
Disclaimer
This presentation does not constitute or form part of and should not be construed as, an offer to sell, or the solicitation or
invitation of any offer to buy or subscribe for or underwrite or otherwise acquire, securities of Eskom Holdings SOC Limited
(“Eskom”), any holding company or any of its subsidiaries in any jurisdiction or any other person, nor an inducement to enter
into any investment activity. No part of this presentation, nor the fact of its distribution, should form the basis of, or be relied
on in connection with, any contract or commitment or investment decision whatsoever. This presentation does not constitute
a recommendation regarding any securities of Eskom or any other person.
Certain statements in this presentation regarding Eskom‟s business operations may constitute “forward looking statements.”
All statements other than statements of historical fact included in this presentation, including, without limitation, those
regarding the financial position, business strategy, management plans and objectives for future operations of Eskom are
forward looking statements.
Forward-looking statements are not intended to be a guarantee of future results, but instead constitute Eskom‟s current
expectations based on reasonable assumptions. Forecasted financial information is based on certain material assumptions.
These assumptions include, but are not limited to continued normal levels of operating performance and electricity demand in
the Distribution and Transmission divisions and operational performance in the Generation and Primary Energy divisions
consistent with historical levels, and incremental capacity additions through the Group Capital division at investment levels
and rates of return consistent with prior experience, as well as achievements of planned productivity improvements
throughout the business activities.
Actual results could differ materially from those projected in any forward-looking statements due to risks, uncertainties and
other factors. Eskom neither intends to nor assumes any obligation to update or revise any forward-looking statements,
whether as a result of new information, future events or otherwise.
In preparation of this document certain publicly available data was used. While the sources used are generally regarded as
reliable the content has not been verified. Eskom does not accept any responsibility for using any such information.

In support of
Agenda and presenters
Brian Dames Operations
3
Executive summary Brian Dames
Audited financial results Paul O’Flaherty
Construction Paul O’Flaherty
Brian Dames Concluding remarks

In support of
Brian Dames Chief Executive
Executive summary
Remember your power

In support of
• No load shedding since April 2008, despite an extremely tightly balanced energy system
• Safety remains a major concern and continues to be of primary focus
• Three years of good financial performances – financial surpluses will be reinvested in
the business, helping to fund the capital expansion programme and to service debt
• As at 31 March 2012, secured 77.6% of the funding required for the capital expansion
programme
• NERSA approved Eskom‟s revised tariff increase for the final year of MYPD 2,
beginning 1 April 2012, to an average increase of 16% (NERSA had previously
approved an increase of 25.9% for 2012/13)
• R72.1bn spent on Broad-based Black Economic Empowerment
• Improved the efficiency of operations – completed the first phase of the Back2Basics
programme which rolled out a single-instance SAP system on schedule and within
budget
5
Executive summary

In support of
• Significant progress in the capital expansion programme:
– Installed 535MW of additional generation capacity, 631km of high-voltage
transmission lines and 2 525MVA of new transformer capacity during the year to
31 March 2012
– Commissioned three Komati power station units, Grootvlei power station unit 5 and
increased capacity at Camden unit 6 – this leaves only 3 units at Komati to
complete the return to service power stations
– Since the inception of the capital expansion programme installed 5 756MW of
additional generation capacity, 3 899km of high-voltage transmission lines and
20 195MVA of new transformer capacity
– Hydrostatic pressure test for Medupi Unit 6 planned for June 2012
• Total learner complement of 11 953 learners; 5 715 are engineering, technical and
artisan learners, 5 159 are in the youth programme as well as a further 1 079 learners
• In partnership with the Government hosted a highly successful Conference of the
Parties (COP17), which took place in Durban in November and December 2011
6
Executive summary
In support of
1.4%, (1.3%)
6.4%, (6.2%)
14.5%, (14.5%)
4.7%, (4.7%)
5.9%, (5.9%)
26.1%, (26.6%)
41.0%, (40.8%)
Municipalities
Industry
Foreign
Residential
Mining
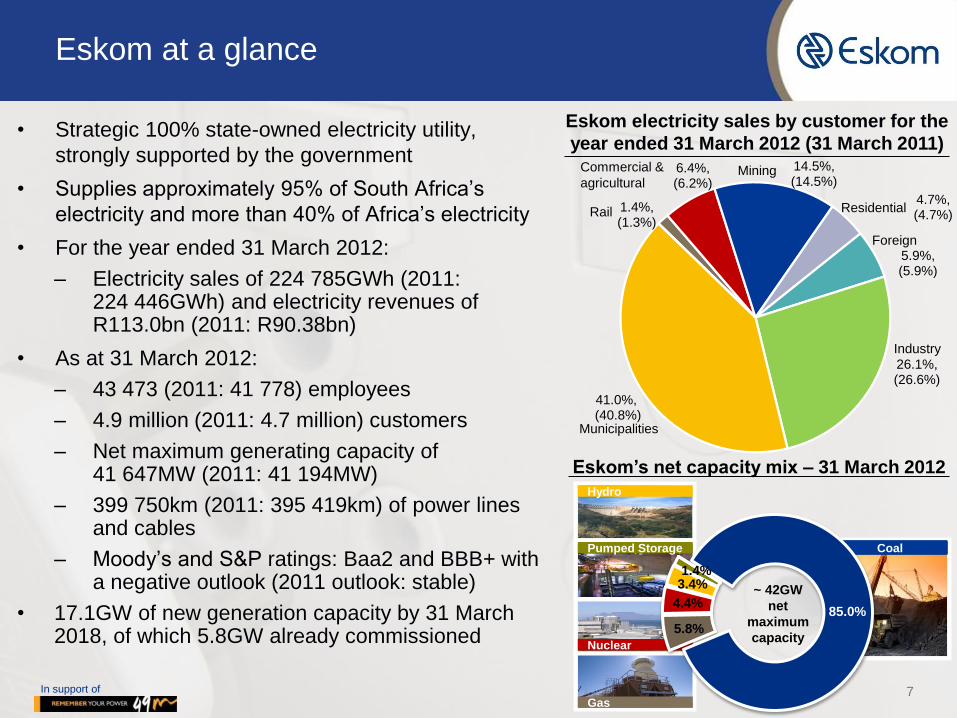
Eskom at a glance
• Strategic 100% state-owned electricity utility,
strongly supported by the government
• Supplies approximately 95% of South Africa‟s
electricity and more than 40% of Africa‟s electricity
• For the year ended 31 March 2012:
– Electricity sales of 224 785GWh (2011: 224 446GWh) and electricity revenues of R113.0bn (2011: R90.38bn)
• As at 31 March 2012:
– 43 473 (2011: 41 778) employees
– 4.9 million (2011: 4.7 million) customers
– Net maximum generating capacity of 41 647MW (2011: 41 194MW)
– 399 750km (2011: 395 419km) of power lines and cables
– Moody‟s and S&P ratings: Baa2 and BBB+ with a negative outlook (2011 outlook: stable)
• 17.1GW of new generation capacity by 31 March 2018, of which 5.8GW already commissioned
Eskom’s net capacity mix – 31 March 2012
Eskom electricity sales by customer for the
year ended 31 March 2012 (31 March 2011)
7
Nuclear
Gas
Coal
Hydro
Pumped Storage
Commercial &
agricultural
Rail
85.0%
5.8%
4.4%
3.4% 1.4%
~ 42GW
net
maximum
capacity

In support of
Eskom‟s strategic pillars support our purpose
8

In support of
• New organisational structure created to support our new strategy and purpose
• New executive management committee established to support the Chief Executive and
ensure that the strategic imperatives are executed
• Line functions to focus on operations and on creating value
• Service functions to safeguard assets, provide expertise on day-to-day standardised
services and leverage synergies in the organisation
• Strategic functions aim to bring about step changes in performance and provide broader
strategic support to the group
Service Functions
9
Corporate structure
Strategic functions
Line functions
Chief executive
Generation Transmission Distribution Customer services
Human Resources
Finance & Group Capital
Technology &
commercial
Enterprise development
Sustainability
Office of the chief executive
Internal Audit

In support of 10
The structure of SA's electricity industry is changing
Change in the industry value chain:
Eskom
Customer
Service
Transmission Generation Primary
energy
sourcing
Distribution
ISMO Independent System
and Market Operator
System
operations
Strategic and service functions
• The ISMO Bill was tabled in
Parliament on 13 May 2011
• A phased approach to be taken
• The System and Market Operator
division was instituted on
1 October 2011
Construction
• Eskom expects to phase in the
subsidiary structure during
2012/13
• It is envisaged that the subsidiary
be transformed into a separate
state owned company

In support of 11
Performance against shareholder compact
Performance
area Company level performance indicator
2011/2012
Target
March
2012
Actual
March
2011
Actual
March
2010
Actual
Ensuring
adequate future
electricity
Generation capacity installed (MW) 385 535 315 452
Transmission lines installed (km) 606 631 443 600
Transmission capacity installed (MVA) 500 2 525 5 940 1 630
Ensuring reliable
electricity supply
Management of the national supply/ demand
constraints
No load
shedding None None None
DSM energy efficiency (GWh) 1 051 1 422 1 339 n/a
Business
sustainability
Internal energy efficiency (annualised GWh) 25.5 45.0 26.2 n/a
Water usage (L/kWh sent out) ≤1.35 1.34 1.35 1.34
Cost of electricity (rand/MWh) 387.0 374.2 296.4 255.1
Debt: equity ≤2.6 1.7 1.7 1.7
Interest cover ≥1.0 3.3 1.4 0.8
Supporting the
developmental
objectives of
South Africa
% local content in new build contracts placed 52.0 77.2 79.7 73.9
Total learners in the system - engineers 1 800 2 273 1 335 955
Total learners in the system - technicians 700 844 692 681
Total learners in the system - artisans 2 350 2 598 2 213 2 144
Pursuing private
sector
participation
Setup a ring-fenced Systems and Market
Operator (SMO) Division within Eskom
Completed
by year
end
Done n/a n/a

In support of
Eskom‟s integrated reporting journey
1994
First
Environmental
Report for
Eskom
2002
First Integrated
Annual Report
(including Financial
and Sustainability
information)
2008
Integrated Annual
Results with first B+
GRI declaration
2011
Integrated Annual Results
with B+ GRI declaration
Benchmarked (2010 annual report) against the
Dow Jones Sustainability Index (DJSI) and the
Johannesburg Stock Exchange (JSE) Socially
Responsible Investment (SRI) index
According to the JSE feedback on the 2010
report, Eskom “achieved a performance level
that not only complies with the minimum
requirements for inclusion in the index, but
which is also very close to the best
performer level in the category for
companies with a high environmental
impact”
2012
Integrated report aligned
with IIRC and IRC of SA
discussion papers
B+ GRI declaration
12

In support of
Supplier
development
& localisation
• Eskom is a major driver of the South African economy – approximately
3% of the country‟s GDP can be attributed to Eskom
• B-BBEE attributable spend amounted to R72.1 billion or 73.2% of
attributable spend for the year (2011: R41.9 billion or 52.3%)
• Job creation – 28 616 (2011: 21 477) individuals working on new build
project sites, since 2005 of which 13 954 are employed from the local
districts
• 77.2% local content in the new build contracts placed for the financial
year
• Since inception of the respective new build projects, the total local
content committed by the Eskom supplier network amounted to R75.2
billion or 62.6% of the total contract values awarded in the new build
projects
• Since the inception of the build programme, 5 915 individuals have
completed their skills development training and 2 342 are currently in
training
Electrification
• A total of 155 213 (2011: 149 914) homes were electrified during the
financial year
• Since inception of the electrification programme in 1991, a total of
4 206 181 (2011: 4 050 968) homes have been electrified
13
Triple bottom line: socio-economic

In support of
Employment
equity
• The Eskom company disability percentage is 2.49% of the total workforce
• Racial equity(1) in senior management is 53.9% and in professionals and
middle management 65.7%
• Gender equity(2) in senior management is 24.3% and in professionals and
middle management 32.4%
Training and
development
• Over 130 000 people employed in the Eskom cloud and over 500 000
people supported by Eskom
• Over 60 000 jobs in non-mining related industries suppliers
• Eskom‟s learner pipeline includes 2 273 engineering, 844 technical, 2 598
artisan and 1 079 other learners
• A further 5 159 learners in the youth programme
• Investment in training for the year was R1.4 billion (2011: R1.0 billion)
Corporate
governance
• Eskom‟s 2011 Integrated Report was awarded 2nd place in the Ernst and
Young, Sustainability Reporting Awards
• Eskom is a member of the International Integrated Report Committee‟s
pilot programme, which continues our drive and commitment of open,
transparent and relevant communication to all our stakeholders
Eskom
Development
Foundation
• Invested R87.9 million in corporate social initiatives during the year which
impacted 256 organisations with some 531 762 project beneficiaries
during the period 14
Triple bottom line: socio-economic
(1) Percentage of black employees
(2) Percentage of female employees

In support of 15
Triple bottom line: safety
Fatalities:
Year to 31 March
2012
Year to 31 March
2011
Year to 31 March
2010
Employees 13 7 (1)
2
Contractors 12 18 15
Employee lost-time incident rate:
Index (target: 0.40) 0.41 0.47 0.54
Causes of fatalities(2):
Electrical Contact
Vehicle Other
Employees and contractors
5 9 11
(1) Amended after issuing the annual report due to a lost time injury reported in January deteriorated to a fatality in July 2011
(2) Covers the period 1 Apr 2011 – 31 Mar 2012
Employee
and
contractor
fatalities
and LTIR
Causes of
fatalities
Action taken:
– Incorporation of safety into performance management system
– Safety training and monitoring for staff
– Launch of Zero harm campaign
– Peer reviews of risk control interventions conducted at selected sites
– Regular work stoppages to discuss and embed safety issues
– Management took robust action on repeat incidents
– Boot camps were held to focus on specific safety issues
Action
taken

In support of
Environmental
performance
Solar panel
installations
Installed solar panels at Kendal and Lethabo power stations to supplement
auxiliary power consumption at these stations – the start of a programme
that will be rolled out across our fleet of coal-fired stations
Management
systems
ISO 14001 certification achieved at 9 coal fired power stations, Koeberg nuclear plant, Peaking Business Unit, Generation Head Office, Medupi, Kusile, Ingula, Power Delivery Projects and Group Capital Head Office The execution of the ISO 9001 implementation plan is underway, with good progress made on certification 16
Triple bottom line: environmental
Atmospheric emissions:
Change Year to
31 March 2012
Year to 31 March
2011
Year to 31 March
2010
Carbon dioxide (CO2) (Mt) 231.9 230.3
224.7
Sulphur dioxide (SO2) (kt) 1 849 1 810 1 856
Nitrogen oxide (NOx) (kt) 977 977 959
Nitrous oxide (N2O) (t) 2 967 2 906 2 825
Relative particulate emissions (kg/MWh sent out)
0.31 0.33 0.39
Specific water consumption (l/kWh sent out)
1.34 1.35 1.34
Number of legal contraventions: 50 63 55

In support of 17
Triple bottom line: financial highlights(1)
Audited year to
31 March 2012
Audited year to
31 March 2011
Audited year to
31 March 2010 Income statement for the period
Revenue (Rm) 114 760 91 447 71 130
Growth in GWh sales (%)(2) 0.2 2.7 1.7
Profit for the period after tax (Rm) 13 248 8 356 3 620
Return on average total assets (%) 3.7 2.9 1.6
Revenue per kWh (cents per kWh)(3) 50.3 40.3 31.9
Operating costs per kWh (cents per kWh)(4) 41.3 32.8 28.2
Capital expenditure (Rbn)(5) 58 815 47 932 43 663
As at end of the period:
Average days coal stock (days) 39 41 37
Gross debt securities issued/borrowings (Rm) 182 567 160 310 105 973
Debt: equity (ratio) 1.6 1.6 1.6
Funding plan well advanced and more than 77% of sources of funds secured Credit ratings remained unchanged but the outlook turned negative
(1) Group numbers unless otherwise specified
(2) Compared to the same period last year
(3) Company numbers and includes environmental levy
(4) Company numbers and includes depreciation and
amortisation costs
(5) Excluding interest capitalised

In support of
Paul O‟Flaherty Finance Director
Audited financial results
Remember, we’re all connected
In support of

In support of 19
Income statement for the year ended 31 March 2012
• 224 785GWh electricity sales
for the year ended 31 March
2012, an increase of 0.2% on
the 224 446GWh reported for
the year ended 31 March 2011
• Group revenue of R114.8 billion
(31 March 2011: R91.4 billion),
an increase of 25.5%
• Effective tax rate of 28.0%
(31 March 2011: 27.9%)
• Net profit increased from R8.4
billion as at 31 March 2011 to
R13.2 billion as at 31 March
2012
Rm
NERSA
target to
31 March
2012(1)
Audited
year to
31 March
2012
Reviewed
half-year
to 30 Sept
2011
Audited
year to
31 March
2011
Audited
year to
31 March
2010(2)
Revenue 116 152 114 760 63 882 91 447 71 130
Other income 2 791 699 395 587 552
Primary energy (47 399) (46 314) (21 858) (35 795) (29 100)
Opex (incl. depreciation
and amortisation) (47 683) (44 762) (21 534) (36 772) (31 719)
Net fair value loss on
financial instruments (815) (2 388) (1 126) (1 816) (4 239)
Operating profit before
embedded derivatives 23 046 21 995 19 759 17 651 6 624
Embedded derivative
gain / (loss) 0 334 263 (1 261) 2 284
Operating profit 23 046 22 329 20 022 16 390 8 908
Net finance costs (5 965) (3 963) (2 106) (4 741) (2 938)
Share of profit of equity -
accounted investees 0 41 16 24 14
Profit before tax 17 081 18 407 17 932 11 673 5 984
Income tax (4 783) (5 156) (5 129) (3 261) (2 080)
Loss from discontinued
operations 0 (3) 7 (56) (284)
Net profit for the period 12 298 13 248 12 810 8 356 3 620
(1) NERSA target for 2012 is at an Eskom company level
(2) Restated

In support of 20
Key performance ratios
Unit
Audited
year to
31 March
2012
Audited
year to
31 March
2011
Audited
year to
31 March
2010
EBITDA Rm 31 130 23 609 14 624
Funds from operations (FFO) Rm 30 483 16 953 2 356
Gross debt/ EBITDA ratio 6.5 7.5 8.4
FFO/ gross debt % 15.2 9.5 1.9
Return on average total assets (1) % 3.7 2.9 1.6
Return on average equity (1) % 13.9 10.7 5.6
Working capital ratio ratio 0.8 0.9 0.9
Revenue per kWh (electricity sales) cents per kWh 50.3 40.3 31.9
Costs per kWh (electricity business) cents per kWh 41.3 32.8 28.2
Bad debt as percentage of revenue % 0.5 0.8 0.8
Average debtor days:
Customer service large power users days 21.8 18.9 18.9
Customer service small power users (2) days 42.9 45.1 40.5
Key industrial and international
customers (3) days 14.4 15.5 15.4
(1) Historic
(2) Excluding Soweto debt
(3) Excluding disputes

In support of
22 487 137 689 112 1 595
(572) (10 519)
(3 437)
(1 414) (3 139)
2011operating
profit beforefinance costs
Tariffincrease
GWh salesvolume growth
Otherrevenues
Otherincome
Net fair valuechanges in
financialinstruments
Embeddedderivatives
Primaryenergy
Manpowercosts
Depreciationand
amortisationexpense (1)
Otheroperatingexpenses
2012operating
profit beforefinance costs
21
Earnings before interest and tax (EBIT)
Rm
22 329
16 390
(1) Includes net impairment losses

In support of
32.1
(13.3)
(6.1) (3.0)
(5.8)
(28.2)
0.7
(2.1)
2.5
40.5
(16.0)
(6.8) (3.5)
(6.5)
(32.8)
0.7
(0.8)
7.6
50.5
(20.6)
(7.9) (4.1)
(8.7)
(41.3)
1.3
(1.0)
9.5
Totalrevenue
(2)
Primaryenergycosts
Employeebenefit
expense
Depreciationand
amortisationexpense
Otheroperatingexpenses
(3)
Totaloperating
costs
Other income Net fair valueloss on financial
instruments,excludingembeddedderivatives
EBIT (beforeembeddedderivatives)
2010 2011 2012
22
EBIT before embedded derivatives
Cents/kWh(1)
(1) Numbers represent the annual Eskom Company results
(2) Total revenue includes non-electricity revenues
(3) Other operating costs include repairs and maintenance costs of 4.0 c/kWh for 2012 (2011: 3.3 c/kWh and 2010: 2.3 c/kWh)

In support of
• Improving profitability mainly as a result
of revenue growth which is primarily
driven by an increase in tariffs
• Revenue growth has been offset by
escalating operating expenditures mainly
due to an increase in primary energy
costs
• Gross finance costs continue to rise as
additional borrowings are raised to
finance the capital expansion programme
• Net surplus of R13.2 billion for the year to
be reinvested in the business
• Eskom has held a moratorium on
dividend payments since 2008 due to its
capital expansion programme
23
Improving profitability
Free funds from operations (FFO) (1)
Net profit (1)
Rm
Rm
2 356
16 953
30 483
Mar-10 Mar-11 Mar-12
3 620
8 356
13 248
Mar-10 Mar-11 Mar-12
(1) For the years ending 31 March 2010, 31 March 2011 and 31 March 2012
In support of
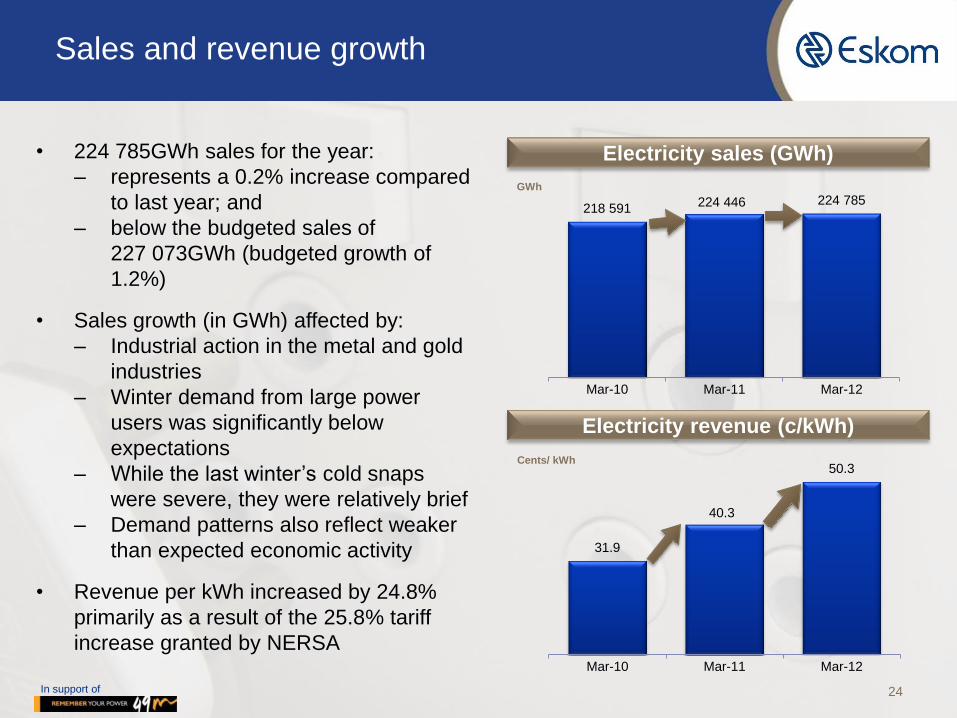
31.9
40.3
50.3
Mar-10 Mar-11 Mar-12
Cents/ kWh
24
Sales and revenue growth
Electricity sales (GWh)
Electricity revenue (c/kWh)
• 224 785GWh sales for the year:
– represents a 0.2% increase compared
to last year; and
– below the budgeted sales of
227 073GWh (budgeted growth of
1.2%)
• Sales growth (in GWh) affected by:
– Industrial action in the metal and gold
industries
– Winter demand from large power
users was significantly below
expectations
– While the last winter‟s cold snaps
were severe, they were relatively brief
– Demand patterns also reflect weaker
than expected economic activity
• Revenue per kWh increased by 24.8%
primarily as a result of the 25.8% tariff
increase granted by NERSA
218 591 224 446 224 785
Mar-10 Mar-11 Mar-12
GWh

In support of
27.5%
31.3%
24.8% 25.8% 25.9%
16.0%
0%
5%
10%
15%
20%
25%
30%
35%
FY 08/09
FY09/10
FY10/11
FY11/12
FY12/13
(Original)
FY12/13
(Revised)
% c
han
ge
in
tari
ff
25
MYPD2 - NERSA approved a lower tariff increase
• NERSA approved Eskom‟s revised tariff
increase for the final year of MYPD 2,
beginning 1 April 2012, to an average
increase of 16% (NERSA had previously
approved an increase of 25.9% for
2012/2013)
• The revised tariff strives to achieve a
balance between the interests of the
South African economy, our customers,
credit providers and shareholder
• Revised tariff based on the acceptance of
key principles:
– Not to compromise Eskom‟s financial
viability
– Continued commitment to migrate to
cost reflective tariffs
– Price path certainty within extended
time frame
MYPD2 average tariff increases

In support of
10 649 12 070
15 209 4.9
5.4
6.8
Mar-10 Mar-11 Mar-12
26
Operating expenses(1)
Primary Energy Costs Employee Benefit Expenses
Rm
Rm Rm
Depreciation & Amortisation Expenses(2)
(1) Cents/KWh figures are calculated based on total electricity sales numbers
(2) Including net impairment loss
(3) Including managerial, technical and other fees, R&D, operating lease expense, auditor‟s remuneration, repairs and maintenance
Other Operating Expenses(3)
Cents/ kWh
Cents/ kWh Cents/ kWh
Cents// kWh Rm
29 100 35 795
46 314 13.3 15.9
20.6
Mar-10 Mar-11 Mar-12
6 376 8 007
9 421
2.9 3.6
4.2
Mar-10 Mar-11 Mar-12
14 694 16 695
20 132
6.7 7.4
9.0
Mar-10 Mar-11 Mar-12

In support of 10 12 14 16 18 20
1.54
0.88
0.87
0.55
Analysis of primary energy costs
Primary Energy Costs (c/kWh) (1)
cents / kWh
• Primary energy costs increased by 29.2%
from 15.9c/kWh (31 March 2011) to
20.6c/kWh for the year to 31 March 2012
33% of the increase
19% of the increase
19% of the increase
12% of the increase
10% of the increase
Cost of coal burnt up
17.7% per ton
Cost of using IPPs up
154% to R3.3bn
Environmental levy
increase of 0.5c/kWh
OCGT(2) costs increased
281% to R1.5bn
DMP(3) & co-generation
costs increased by 923%(4)
Other items in aggregate contributed 7% of the increase
Primary energy costs
as at 31 March 2011:
Primary energy costs as at 31 March 2012: (1) Primary energy costs in c/kWh based on electricity sales
(2) Open cycle gas turbine (OCGT)
(3) Demand market participation (DMP), including power buybacks
(4) Costs increased from R0.2 billion last year to R2.2 billion this year 27
0.49
0.32
20.60
15.95
In support of
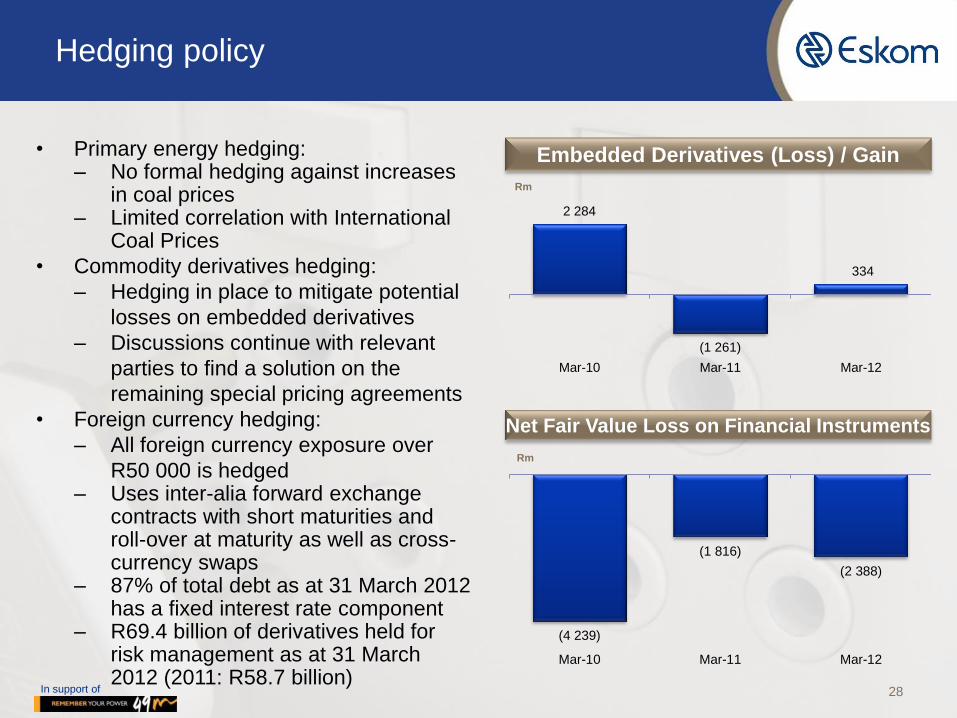
• Primary energy hedging: – No formal hedging against increases
in coal prices – Limited correlation with International
Coal Prices
• Commodity derivatives hedging:
– Hedging in place to mitigate potential
losses on embedded derivatives
– Discussions continue with relevant
parties to find a solution on the
remaining special pricing agreements
• Foreign currency hedging:
– All foreign currency exposure over
R50 000 is hedged – Uses inter-alia forward exchange
contracts with short maturities and roll-over at maturity as well as cross-currency swaps
– 87% of total debt as at 31 March 2012 has a fixed interest rate component
– R69.4 billion of derivatives held for risk management as at 31 March 2012 (2011: R58.7 billion)
28
Hedging policy
2 284
(1 261)
334
Mar-10 Mar-11 Mar-12
Embedded Derivatives (Loss) / Gain
Rm
(4 239)
(1 816)
(2 388)
Mar-10 Mar-11 Mar-12
Rm
Net Fair Value Loss on Financial Instruments

In support of 29
Group audited financial position – growth in property, plant and equipment through debt raised
Equity and Liabilities
Assets Rm
Debt securities and borrowings:
R105 973
Debt securities and borrowings:
R160 310
Debt securities and borrowings:
R182 567
Working Capital: R21 283
Working Capital: R25 427 Working Capital: R33 942
Other liabilities: R48 657
Other liabilities: R55 149
Other liabilities: R62 753
Equity: R70 222
Equity: R87 259
Equity: R103 103
0
50 000
100 000
150 000
200 000
250 000
300 000
350 000
400 000
450 000
March 2010 March 2011 March 2012
Rm
Property, plant and equipment:
R187 905
Property, plant and equipment:
R236 724
Property, plant and equipment:
R290 661
Liquid assets: R19 612
Liquid assets: R49 892
Liquid assets: R40 480
Working capital: R18 938
Working capital: R21 682
Working capital: R25 911
Other assets: R19 680
Other assets: R19 847
Other assets: R25 313
0
50 000
100 000
150 000
200 000
250 000
300 000
350 000
400 000
450 000
March 2010 March 2011 March 2012
Net debt to equity ratio:
1.6
Net debt to equity ratio:
1.6
Net debt to equity ratio:
1.6

In support of 30
Revaluation of assets – proforma if aligned to regulatory asset base
Rm
Historical cost:
For the year to 31 March 2011
After revaluation:
For the year to 31 March 2011
Historical cost:
For the year to 31 March 2012
After revaluation:
For the year to 31 March 2012
Total profit/ (loss) for the year
Historical profit/ (loss) for the period 8 356 8 356 13 248 13 248
Adjustments: Depreciation and amortisation expense - (16 898) - (14 368)
Net impairment loss and other operating expenses - (27) - (250)
Net finance cost - (8 589) - (4 999)
Income tax - 7 144 - 5 493
Adjusted profit after revaluation for the year 8 356 (10 014) 13 248 (876)
Equity (cumulative impact)
Historical closing equity balance - 87 259 - 103 103
Adjustments: Additional comprehensive loss for the year - (35 117) - (49 241)
Revaluation of property, plant and equipment - 332 482 - 277 703
Deferred tax on equity adjustments - (93 095) - (77 757)
Adjusted closing Equity balance 291 529 253 808
Statement of financial position
Property, plant and equipment 236 724 520 432 290 661 499 973
Ratios
Electricity operating costs - cents per kWh (Company) 32.8 40.3 41.3 47.8
Interest cover ratio(Group) 1.5 (0.2) 3.3 0.7
Return on assets % (Group) 2.9% (1.7)% 3.7% (0.1)%
Debt: equity ratio (Group) 1.6 0.5 1.6 0.7

In support of
0.9
1.5
3.3
Mar-10 Mar-11 Mar-12
8.4 7.5
6.5
Mar-10 Mar-11 Mar-12
31
Debt maturity and leverage
Gross Debt/EBITDA ratio Debt & Borrowings Maturity Profile(1)
Interest Cover ratio FFO as a % of Gross Debt
(1) Represents the repayment of nominal capital in the strategic and trading portfolio. Data as at 31 March 2012.
More than 10 years 59.2%
Within 1 year 5.7%
1 year to 10 years 35.2%
1.9
9.5
15.2
Mar-10 Mar-11 Mar-12

In support of 32
Debt maturity profile
Strategic & trading portfolio nominal and interest cashflows as at 31 March 2012
Rbn Rbn
0
50
100
150
200
250
300
0
5
10
15
20
25
30
35
40
45
20
13
20
14
20
15
20
16
20
17
20
18
20
19
20
20
20
21
20
22
20
23
20
24
20
25
20
26
20
27
20
28
20
29
20
30
20
31
20
32
20
33
20
34
20
35
20
36
20
37
20
38
20
39
20
40
20
41
20
42
Total capital Total interest Cumulative nominal capital total
Estimated average net
finance cost per annum
over the next six years:
R23.5 billion
In support of
15 541 12 087
19 450
Mar-10 Mar-11 Mar-12
33
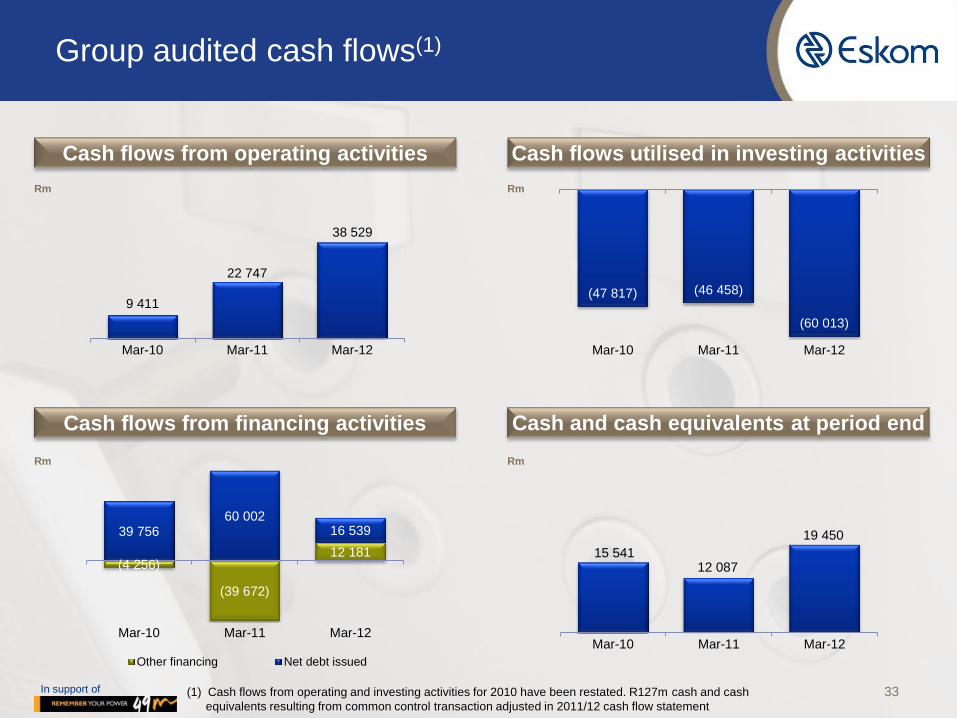
Group audited cash flows(1)
Cash flows from operating activities Cash flows utilised in investing activities
Rm
Rm Rm
Cash flows from financing activities Cash and cash equivalents at period end
Rm
9 411
22 747
38 529
Mar-10 Mar-11 Mar-12
(47 817) (46 458)
(60 013)
Mar-10 Mar-11 Mar-12
(4 256)
(39 672)
12 181
39 756 60 002
16 539
Mar-10 Mar-11 Mar-12
Other financing Net debt issued
(1) Cash flows from operating and investing activities for 2010 have been restated. R127m cash and cash
equivalents resulting from common control transaction adjusted in 2011/12 cash flow statement

In support of
38 529
22 308
17 497
127 19 450
(5 769)
(5 290)
(26) (59 487)
(526)
-
12 087
31 Mar 2011Cash & cashequivalents
Cashgenerated by
operations
Net repaymentof borrowings
Net interestrepayments
Debt Raised Investment insecurities
Otherfinancing
Capexexpenditure
Otherinvesting
Cash & cashequivalents
from commoncontrol
transaction
31 Mar 2012Cash & cashequivalents
34
Summary of audited cash flows
Financing Operations Investing Rm

In support of 35
Funding plan – R300 billion from 1 April 2010 to 2017
Source of funds
Funding
sourced
Rbn
Currently
secured
Rbn
Draw-downs
to date
Rbn
Amount
supported by
Government
Rbn
Bonds 90.0 32.9 32.9 20.4
Commercial paper 70.0 70.0 20.0 0.0
Export Credit Agency backed 32.9 32.9 15.6 0.0
World Bank loan 27.8 27.8 5.6 27.8
AFDB loan 20.9 20.9 5.9 20.9
DBSA loan 15.0 15.0 3.0 0.0
Shareholder loan 20.0 20.0 20.0 20.0
Other sources 23.4 13.2 0.8 4.9
Totals 300.0 232.7 103.8 94.0
Percentages 77.6%(1) 44.6%(2) 40.4%(2)
(1) As a percentage of the R300bn funding sourced
(2) As a percentage of the currently secured total

In support of
Entity Rating Status Moody‟s S&P Fitch
Eskom
Holdings
SOC Ltd
Foreign Currency Baa2 BBB+ -
Local Currency Baa2 BBB+ A
ZAR Long-term - AA AAA
ZAR Short-term - A1 F1+
Outlook Negative (1) Negative (2) Stable/Negative(3)
Stand-Alone Ratings Ba3 B None
RSA Govt.
Foreign Currency A3 BBB+ BBB+
Local Currency A3 A+ A
ZAR Long-term - AAA AAA
ZAR Short-term - A1 F1+
Outlook Negative (1) Negative (2) Negative (3)
36
Credit ratings as at 31 March 2012
(1) During November 2011 Moody‟s lowered its outlook on Eskom‟s and South Africa‟s sovereign credit rating to negative from
stable
(2) During March 2012, S&P lowered its outlook on Eskom‟s and South Africa‟s sovereign credit rating to negative from stable
(3) During January 2012 Fitch lowered its outlook on Eskom‟s local currency rating as well as South Africa‟s sovereign credit
rating to negative from stable. Eskom‟s ZAR long- and short-term rating statuses remained „stable‟

In support of
Construction
Paul O‟Flaherty Finance Director
Switch from traditional light bulbs to CFLs or LEDs

In support of
Note:
* Solar PV Plants at Lethabo (0.575MW) & Kendal (0.620MW) are in operation phase
• ~ 17 082MW of new capacity (5 756MW installed and commissioned)
• ~ 4 700km of required transmission network (3 899.3km installed)
• 20 600MVA planned (20 195MVA installed)
New generation capacity and transmission networks 2005–2018
Commissions of new stations
Un
der
Co
nstr
ucti
on
/
co
mp
lete
In
dev
elo
pm
en
t
• None • Nuclear–site development and front end planning
• Biomass • Primary Energy
projects (Road & Rail)
• Sere (100MW) • Pilot Concentrated Solar
Power (100MW) • Photovoltaic (Own use*)
• Refurbishment and air quality projects
• 60 Grid strengthening projects
• Komati (1 000MW) • Camden (1 520MW) • Grootvlei (1 180MW)
• 3 700MW
• Medupi (4 764MW) • Kusile (4 800MW)
• 9 564MW
• Ankerlig (1 338.3MW) • Gourikwa (746MW) • Ingula (1 332MW) • Solar PV installations
at MWP (0.4MW)
• 3 518MW (1)
• Arnot capacity increase (300MW)
• Matla refurbishment • Kriel refurbishment • Duvha refurbishment
• 300MW
• 765kV projects • Central projects • Northern projects • Cape projects
• ~ 4 700km
Mpumalanga
refurbishment Return-to-service (RTS) Base load Peaking & renewables Transmission
First Unit Last Unit
Medupi
Kusile
Ingula
2013
2014
2014
2017
2014
2018
38 (1) Includes 1.62 MW for Solar PV (MWP, Lethabo & Kendal) Source: Eskom Group Capital Division (Construction Management)
Medupi is the first coal-generating plant in Africa to use supercritical power generation technology

In support of
5 280 1 090 1 000 1 355(1) 1 375 1 630
5 940 2 525
20 195
FY2004/5
FY2005/6
FY2006/7
FY2007/8
FY2008/9
FY2009/10
FY2010/11
FY2011/12
Total
0 290
1 351 1 043
1 769.9 452.5 315
535
5 756.4
659.0 237.0 430.0
480.0 418.3
600.3 443.4
631.3
3 899.3
39
Build progress to date
Km line Transmission
MVAs Substations
MW of capacity Megawatts
To date, a large amount of construction work has been completed, adding
~ 5 756MW of capacity, ~ 3 899km of transmission network and ~ 20 195 of MVAs
(1) MVA – 2007/08 (1 355 MVA) includes Transmission contribution as well as Group Capital (1 295 MVA)

In support of 40
Significant progress in build programme – began in 2005 with completion in 2018
R55.2bn R39.3bn
R11.1bn R23.0bn R16.9bn
R36.0bn R79.2bn
R12.7bn R2.0bn R16.6bn
Medupi Kusile Ingula Return to service Transmission
Completed Remaining
In addition, we plan to spend more than R40 billion over
the next 5 years to strengthen, refurbish and expand
our Distribution network
60.5%
46.5% 91.8%
50.4%
R91.2bn
R23.8bn
R118.5bn
R25.0bn
R33.5bn(1)
% of estimated total cost spent as at 31 March 2012
33.2%
R billion spent and to be spent on the capital expansion
programme (excluding borrowing costs capitalised)
(1) Includes transmission costs for Ingula, Kusile and Medupi
In support of
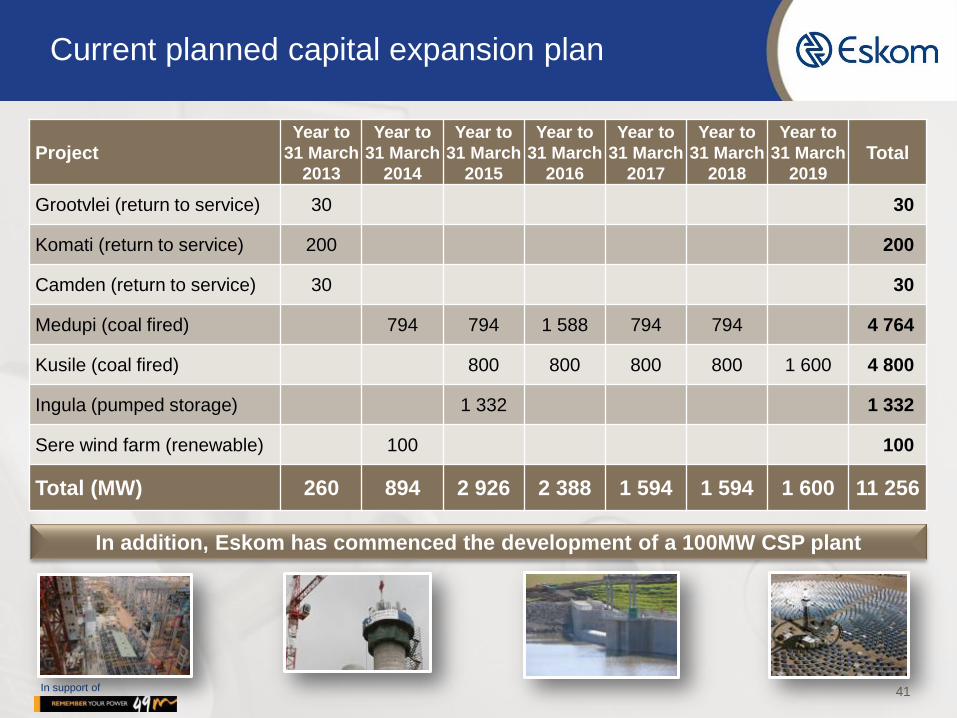
Current planned capital expansion plan
41
Project Year to
31 March
2013
Year to
31 March
2014
Year to
31 March
2015
Year to
31 March
2016
Year to
31 March
2017
Year to
31 March
2018
Year to
31 March
2019
Total
Grootvlei (return to service) 30 30
Komati (return to service) 200 200
Camden (return to service) 30 30
Medupi (coal fired) 794 794 1 588 794 794 4 764
Kusile (coal fired) 800 800 800 800 1 600 4 800
Ingula (pumped storage) 1 332 1 332
Sere wind farm (renewable) 100 100
Total (MW) 260 894 2 926 2 388 1 594 1 594 1 600 11 256
In addition, Eskom has commenced the development of a 100MW CSP plant

In support of
Operations
If you’re not using it, switch it off
Brian Dames Chief Executive
In support of

In support of
Primary Energy – operational performance
43
• Highlights:
– Coal by rail to Majuba and Camden increased by 1.4 million tons to 8.5 million
tons for the year
– Establishment of the rail line and inland coal terminals in Mpumalanga resulted in
greater flexibility
– Conclusion of a memorandum of understanding with a mining coal supplier,
Sekoko Resources (Pty) Ltd in the Waterberg
– Construction of Komati Water Scheme on track for completion at the end of 2012
and the Department of Water Affairs began construction of Mokolo and Crocodile
water augmentation project
– The Primary energy division has achieved ISO 9001 certification as at the end of
March 2012 and are working towards ISO 14001 in the coming financial year

In support of 44
Primary Energy – operational performance
• Challenges:
– Road fatalities involving the public and coal transporters continue despite safety
initiatives
– Maintaining coal stock levels at acceptable levels
– Purchasing more expensive coal due to the poor volume performance of cost-plus
mines(1)
– Achieving contractual performance on all coal supply agreements as coal quality is
poor
– Road construction progress was affected by unreliable bitumen supply and delays in
water-use licences
(1) Cost-plus mines have contractual arrangements through which Eskom pays all capital and operating costs to
mine the coal, plus an annuity return to the mining house

In support of 45
Primary Energy – road to rail migration plan
• The strategy focuses on mode selection and
infrastructure and short term truck reductions
• Since 2009, the implementation of the strategy
has resulted in the following successes:
– An innovative containerised rail solution
has been implemented in Camden
– Tutuka coal terminal will receive its first
coal in July 2012
– Rail deliveries have increased steadily
4.3
5.1
7.1
8.5 8.2
0
1
2
3
4
5
6
7
8
9
Year to31 Mar 2009
Year to31 Mar 2010
Year to31 Mar 2011
Year to31 Mar 2012
Year to31 Mar 2012
Target
Coal road to rail migration (Mt)

In support of
Generation – operational performance
46
• Highlights:
– Coal-related energy losses decreased compared to the previous year
– Received praise from the World Association of Nuclear Operators for Eskom‟s
proactive approach in assessing Koeberg‟s state of readiness in response to the
Fukushima review guidelines
– The number of unplanned unit trips which is an indication of reliability has
improved to 3.19 (2011: 3.62)
– Installed gaseous-emission monitoring systems on one unit of each coal-fired
power station

In support of 47
Generation – operational performance
• Challenges:
– Balancing the conflicting needs of shutting down power plants to perform
maintenance with generating electricity to meet demand
– Unplanned outages on Koeberg unit 2, the long-term shutdown of Duvha unit 4
and unplanned outages at coal-fired power stations severely affected key
performance indicators
– Coal-related energy losses at Matla, Tutuka, Duvha and Arnot power stations
remain a concern and may increase if mines continue to deviate from coal-quality
specifications
– The tight system, poor coal and under-performing plant resulted in a high number
of exemptions against emissions standards

In support of
84.9 85.3 85.2 84.6 82.0
84.1
35
45
55
65
75
85
95
Year to31 Mar2008
Year to31 Mar2009
Year to31 Mar2010
Year to31 Mar2011
Year to31 Mar2012
48
Generation – technical performance
Energy availability factor (EAF(2)) %
Actual Annual target
Slide required with graph and comments on performance
(1) EAF measures plant availability, plus energy losses not under the control of plant management
(2) UCLF measures the lost energy due to unplanned production interruptions resulting from equipment failures and other plant conditions
5.1 4.4
5.1 6.1
8.0
6.5
0
1
2
3
4
5
6
7
8
9
Year to31 Mar2008
Year to31 Mar2009
Year to31 Mar2010
Year to31 Mar2011
Year to31 Mar2012
Unplanned capability loss factor (UCLF(1)) % • EAF performance deteriorated in 2012
compared to the previous year
• The damage to Duvha unit 4 power station,
contributed more than 1% to the UCLF
• Boiler tube failures remain the significant
contributor to total unplanned capacity
losses
• Coal quality improved. It is important to
note though that the effects of the previous
batches of poor quality coal continue to
effect the performance of some of the units
as the damage that was caused will take
some time to fix
• There has been an improvement in the
reliability of Eskom‟s plant fleet although
Koeberg‟s performance was negatively
impacted by a forced outage to repair a
hydrogen leak related to the generator
stator coolant system
In support of
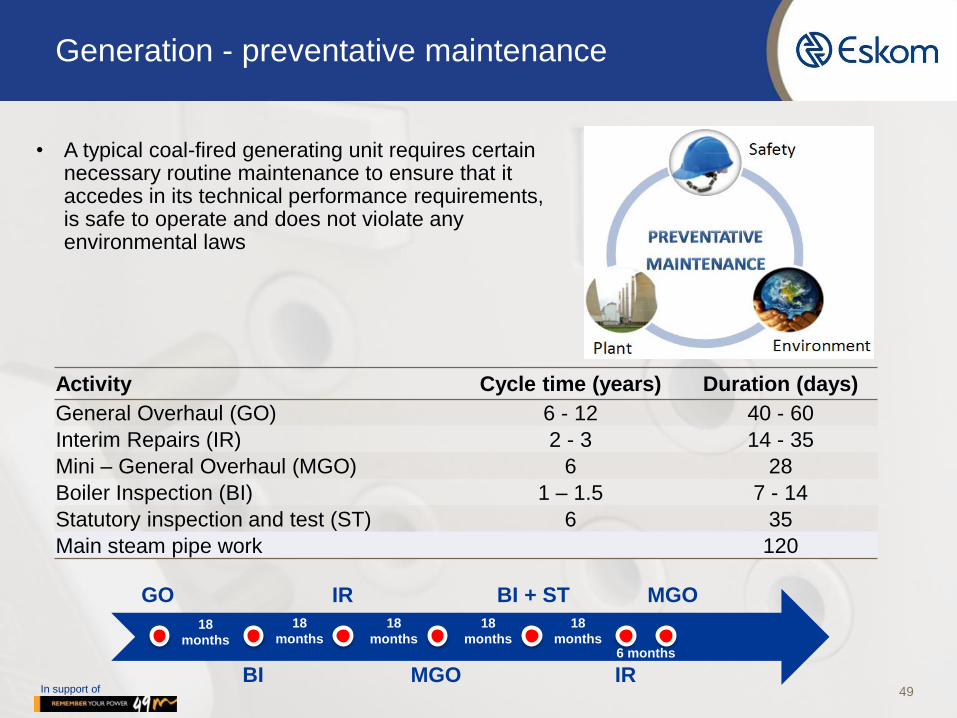
Generation - preventative maintenance
49
Activity Cycle time (years) Duration (days)
General Overhaul (GO) 6 - 12 40 - 60
Interim Repairs (IR) 2 - 3 14 - 35
Mini – General Overhaul (MGO) 6 28
Boiler Inspection (BI) 1 – 1.5 7 - 14
Statutory inspection and test (ST) 6 35
Main steam pipe work 120
GO
BI
IR
MGO
BI + ST
IR
MGO
• A typical coal-fired generating unit requires certain necessary routine maintenance to ensure that it accedes in its technical performance requirements, is safe to operate and does not violate any environmental laws
18
months
18
months 18
months 18
months 18
months 6 months

In support of
Transmission – operational performance
50
• Highlights:
– Substantially improved the availability of transmission assets
– Improved number of line faults per 100km performance
– Only one major incident(1) was recorded, less than the maximum of two as specified
in the key performance indicators
– Identified future trading opportunities in the Southern African region to assist in
alleviating potential shortfalls in the medium-term electricity supply
• Challenges:
– Transmission interruption performance deteriorated during 2011/2012: • The „number of system minutes lost ≤ 1‟ was 4.7 against a target: of ≤ 3.4 • The „number of interruptions‟ recorded was 48 against a target of ≤ 35
– High levels of conductor, equipment and electricity theft are affecting plant
performance and increasing cost
– The number of protected bird mortalities due to collisions with power lines
(1) Major incident: This is an interruption with a severity ≥ 1 system minute

In support of 51
Transmission – technical performance
Number of major incidents
5
3
1 1
2
0
1
2
3
4
5
6
Year to31 Mar2008
Year to31 Mar2009
Year to31 Mar2010
Year to31 Mar2011
Year to31 Mar2012
• Both the number of interruptions and
the system minutes (1) lost ≤ 1
performance deteriorated during the
year
• This was primarily due to risks
associated with the execution of
increased expansion and
refurbishment projects at operational
sites
• One major incident was recorded on
the Transmission network during the
year (target: ≤ 2)
Severity of interruptions (System minutes lost ≤ 1)
3.6
4.2 4.1
2.6
4.7
3.4
0
1
2
3
4
5
Year to31 Mar2008
Year to31 Mar2009
Year to31 Mar2010
Year to31 Mar2011
Year to31 Mar2012
Actual Annual target
(1) System minutes: Is a measure of the severity of interruptions to customers.
One system minute is equivalent to the loss of the entire system for one
minute at annual peak

In support of 52
Independent power producers
Cumulative IPP installed capacity (MW) Target
2012
Actual
2012
Actual
2011
Actual
2010
Medium term power purchase programme 373 373 -
Municipal base load generation 515 515 -
Short term energy purchases 120 - -
Total 1 500 1 008 888 0
IPP power purchased (GWh) n/a 4 107 1 833 0
• Eskom is committed to facilitating the entry of Independent Power Producers (IPPs) and
acknowledges the role that IPPs must play in the South African electricity market
• To date Eskom has contracted 1 008MW of installed capacity from IPPs
• The amount paid for this capacity amounted to R3 250 million in 2011/12 (2010/11:
R1 264 million) at an average cost of 0.77R/kWh
• Eskom has actively supported the Department of Energy in finalising its request for
proposal documents and power purchase agreements for the renewable energy IPP
programme. The request for proposal document calls for 3 725MW of renewable energy
technologies to be in commercial operation between mid-2014 and the end of 2016
– 28 preferred bidders announced for the first submission with a combined 1 416MW
contribution
– 19 preferred bidders announced for the second round of submissions with a
combined 1 275MW contribution

In support of
Distribution – operational performance
53
• Highlights:
– Significant improvement of the system average interruption duration index (SAIDI)
performance and marginal improvement of the system average interruption
frequency index (SAIFI) performance during the year
– Electrification connections during the year were 155 213 versus a target of
125 377
• Challenges:
– Safety performance is a serious concern
especially employee and contractor fatalities
– High levels of theft of equipment and electricity
including illegal connections affects plant
performance and increases costs
– Collisions and electrocutions of birds on
distribution power lines
– Acquisition of land and servitudes for electricity
infrastructure
In support of
55.5
51.5
54.4 52.6
45.8 49.0
35
40
45
50
55
60
Year to31 Mar2008
Year to31 Mar2009
Year to31 Mar2010
Year to31 Mar2011
Year to31 Mar2012
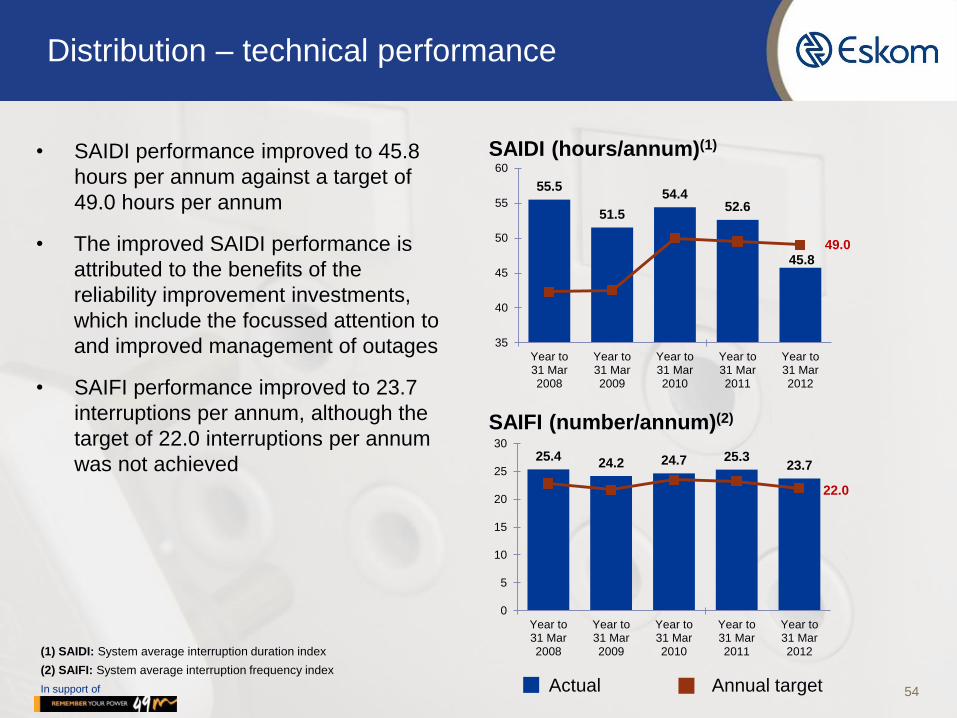
SAIDI (hours/annum)(1) • SAIDI performance improved to 45.8
hours per annum against a target of
49.0 hours per annum
• The improved SAIDI performance is
attributed to the benefits of the
reliability improvement investments,
which include the focussed attention to
and improved management of outages
• SAIFI performance improved to 23.7
interruptions per annum, although the
target of 22.0 interruptions per annum
was not achieved
54
Distribution – technical performance
SAIFI (number/annum)(2)
25.4 24.2 24.7 25.3
23.7
22.0
0
5
10
15
20
25
30
Year to31 Mar2008
Year to31 Mar2009
Year to31 Mar2010
Year to31 Mar2011
Year to31 Mar2012
Actual Annual target
(1) SAIDI: System average interruption duration index
(2) SAIFI: System average interruption frequency index

In support of
Industrial , 21.7%, (22.6%)
Mining , 14.4%, (14.3%)
International , 4.5%, (4.6%)
Residential , 7.7%, (7.7%)
Commercial , 5.5%, (5.3%)
Agricultural , 4.1%, (4.0%)
Traction , 1.7%, (1.5%)
Redistributors
40.4% (40.0%)
Traction, 1.4%, (1.3%)
Commercial & Agricultural, 6.4%, (6.2%)
Mining, 14.5%, (14.5%)
Residential, 4.7%, (4.7%)
Foreign, 5.9%, (5.9%)
Industry, 26.1%, (26.6%)
Redistributors, 41.0%, (40.8%)
• Directly provides electricity to about 45% of all end users in South Africa
• Two main types of customers:
– Redistributors: Mainly municipalities that sell electricity to end customers.
– Direct customers: Industrial, commercial, mining, agricultural and residential consumers
• Eskom top Mining and Industrial customers (previously KSACS) deals with customers using
≥100GWh of energy per year. At 31 March 2012, KSACS had approximately 146 customers
accounting for 34% of total Eskom electricity revenues
• One customer has a supply contract indexed to commodity prices
• A member of Southern African Power Pool (“SAPP”)
55
Customer services
Key figures for the year to 31 March 2012
Sales Split Total: 224 785GWh (224 446GWh)(1)
Gross Electricity Revenue Split Total: R112 999m (R90 375m)(1)
Number of customers Total: 4.9 million (4.7 million)(1)
Residential 97.06%
(97.02%)
Commercial 1.02% (1.05%)
Agricultural 1.73% (1.81%)
Other 0.19% (0.12%)
(1) Numbers in brackets refer to the year to 31 March 2011

In support of
Customer services – operational performance
56
• Highlights:
– Secured a number of electricity buy-back deals amounting to 817MW
– Successfully encouraged customers to reduce electricity load on short notice when
required
– Media advert “Power Alert” continued to drive savings in critical times. During the
year average demand savings of 261MW was attained during “red” periods. The
overall savings of Power Alert translate to 50.6GWh of energy savings
– Accelerated the solar water-heating rebate programme. In the current year 158 175
units were verified
– Rolled out 49M, a marketing campaign aimed at promoting long-term behavioural
change in favour of energy savings
– Introduced alternative incentive programmes for managing demand

In support of
Customer services – operational performance
57
• Challenges:
– Ensuring customers are updated on their
quality of supply as well as planned
outage plans
– High electricity price increases negatively
affect the profitability and financial
sustainability of Eskom‟s customers and
their ability to pay their electricity bills
– Management of Soweto outstanding debt
– Ensuring that tariffs are cost reflective
taking into account size, locality and time
of use by customers as well as addressing
cross subsidisation issues
– Roll-out of the Energy Conservation
Scheme – ensuring that all affected
customers understand the process and
are comfortable with the reference
consumption
82.1
84.7 85.1
84.4
85.6
85.8
80
81
82
83
84
85
86
Year to31 Mar2008
Year to31 Mar2009
Year to31 Mar2010
Year to31 Mar2011
Year to31 Mar2012
Weighted customer service index(1)
(1) Eskom uses a composite index to measure the service delivered to its residential, small and medium customers. The index
combines the results of two external customer service perception surveys and four internal customer service process
measures.
Actual Annual target

In support of
• The accumulated verified demand savings
for the combined financial years 2005 to
2012, is 2 997MW (this is equivalent to
five units worth of output of a typical power
station(1))
• The total evening peak demand savings
achieved of 365MW against a target of
313MW (2011: 354MW)
– The CFL roll-out programme
contributed 215MW to verified savings
• The annualised energy savings for this
financial year are 1 422GWh against the
target of 1 051GWh
• Eskom‟s aim is to improve the energy
efficiency of its facilities (over plants and
buildings) through the undertaking of
energy audits and efficiency programmes
focusing on lighting, heating, ventilation
and air-conditioning (HVAC):
– For the year internal energy demand
savings of 1.4MW and energy savings
of 45GWh were achieved
0
500
1 000
1 500
2 000
2 500
3 000
3 500
2005 2006 2007 2008 2009 2010 2011 2012
Dem
an
d s
avin
gs
(M
W)
Verified MW Eskom Target
1 339 1 422
1 051
0
200
400
600
800
1 000
1 200
1 400
1 600
2011 2012 2012 Target
An
nu
ali
se
d e
ne
rgy s
avin
gs
(G
Wh
)
Integrated Demand Management
Cumulative verified demand savings (MW)
58
Energy Savings (GWh)
(1) A single power station unit contributes about 600MW to national electricity supply

In support of 59
Energy losses and theft
(1) 12 month moving average
(2) Transmission losses are all technical losses
• Energy losses reflect the difference between the quantity of energy sent out from the
power stations and the quantity sold to the various customers at the end of the value
chain
• Eskom loses an estimated R1.2 billion annually due to energy theft and related activities
• High levels of theft of copper and pylon persist, which are affecting plant performance
and increasing costs
• Operation Khanyisa, a public-awareness campaign about legal power usage, is now in
full operation and South Africans have heeded the call to report electricity theft and illegal
electricity sales
Energy losses Target %
2012
Actual %
2012
Actual %
2011
Actual %
2010
Distribution loss ≤6.07 6.32 5.68 5.87
Transmission loss ≤3.40 3.08 3.27 3.27
Total Eskom loss ≤8.75 8.65 8.25 8.45

In support of
Watch out for Power Alert and switch off appliances you don’t need
Brian Dames Chief Executive
Concluding remarks

In support of
Priorities for next year
• Safety
• Keeping the lights on
– Ensuring security of supply in partnership with South Africans
– Ensuring demand side savings by both our customers and our own facilities
• Ensure financial sustainability
– MYPD3 application and country choices
• Deliver on the build programme
– Special focus on the commissioning of the first unit of Medupi
• Improve operations by focusing on the continuation of the:
– Next phase of the implementation of the Back to Basics programme (Processes,
Systems and Tools) and
– Implementation of the Generation (Reducing our unplanned capability load factor
(UCLF) and ensuring the reliability of our power stations), Distribution and Customer
Centricity Excellence Programmes
• South African Energy
– Separate unit formed to investigate regional power opportunities
61

In support of 62
Conclusion
• In 2013 Eskom will be celebrating our 90th anniversary. For nine decades, Eskom has
been adding quality to the lives of South Africans and enabling the country‟s economic
growth
• Eskom‟s progress equates to that of South Africa‟s advancement. In this regard,
Eskom‟s success is crucial
• Embrace energy saving as a national culture, joining the global journey towards a
sustainable future

Thank you Insert image here
Websites and email contacts
Eskom website: www.eskom.co.za
Eskom email: [email protected]
Investor relations: [email protected]
Eskom media desk: [email protected]
Eskom environmental: [email protected]
Eskom annual report: www.eskom.co.za/IR2012/
Eskom Development Foundation: www.eskom.co.za/csi