integrated pest management...
TRANSCRIPT

Integrated Pest Management
Successes
Southern Oregon Research & Extension Center
Interpera
June 15, 2017 — Wenatchee WA

Definition of IPM—
Original definition of Integrated Control:
"Applied pest control which combines and
integrates biological and chemical control.
Chemical control is used as necessary and
in a manner which is least disruptive to
biological control".
(Stern, V. M., R. F. Smith, R. van den Bosch,
and K. S. Hagen. 1959. The integrated control
concept. Hilgardia, 29: 81-101.)
PRIMARY DRIVERS OF IPM ADOPTION
Induced Pests
Pest Resurgence
Resistance
Regulations

Pheromone Mating Disruption
vs. Organophosphate Use
0
1000
2000
3000
4000
5000
91929394959697 98990001020304050607
Ac.
eq
uiv
ale
nts
treate
d w
/ O
Ps
0
500
1000
1500
2000
2500
Ac.
treate
d
w/
CM
MD
OPs CMMD
1991-2007 – Change in the use of OPs and
codling moth mating disruption (CMMD)
CMMD Areawide Project:
1995-1999
Note: data from one of the major pear growers in southern Oregon

Pear psylla levels--2007
0
0.5
1
1.5
2
2.5
3
3.5
4
4.5
5
5/20
/07
6/3/
07
6/17
/07
7/1/
07
7/15
/07
7/29
/07
8/12
/07
pear
psylla a
du
lts p
er
tray
Check
Delegate
Altacor
Assail
Imidan
Guthion
Pear psylla adult levels in beat tray samples
Azinphos methyl
Phosmet

POME FRUIT IPM—RESEARCH & EXTENSION
Pest Development and Phenology Models
Economic Thresholds and Sampling Protocols
Evaluating Control Methods for Target and
Non-target Effects
Resistance Monitoring
Formulating and Testing Alternative Tactics
Implementation on a Commercial Scale

Pear PsyllaLife Stages

Timeline for Cacopsylla pyricola in North America
First identified in Connecticut in 1832
1894 Virginia
1939 Spokane Valley WA
1949 Hood River OR
1950 Rogue Valley OR
1953 Siskiyou & Del Norte CA (backyard trees)
1955 Mendocino CA (commercial orchard)
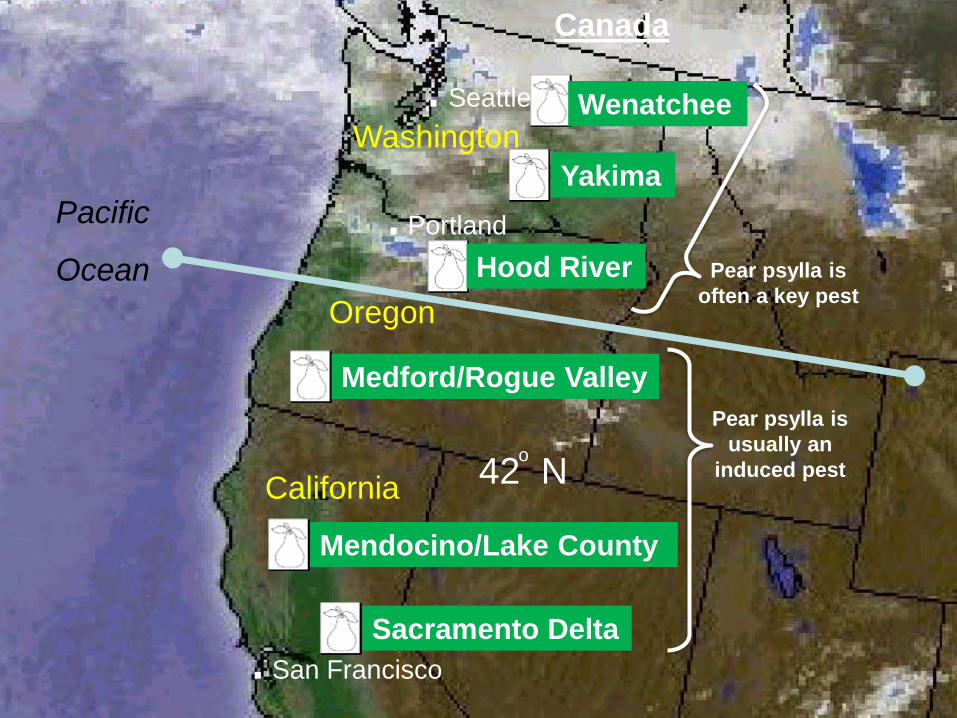
Washington
.Portland
.San Francisco
. Seattle
Pacific
Ocean
Oregon
California42 N
o
Wenatchee
Canada
Yakima
Hood River
Medford/Rogue Valley
Mendocino/Lake County
Sacramento Delta
Pear psylla is
often a key pest
Pear psylla is
usually an
induced pest

INTEGRATING PEAR PSYLLA CONTROL MEASURES
• CULTURAL: TREE VIGOR AND CULTIVAR
• BIOLOGICAL CONTROL
• CHEMICAL CONTROL
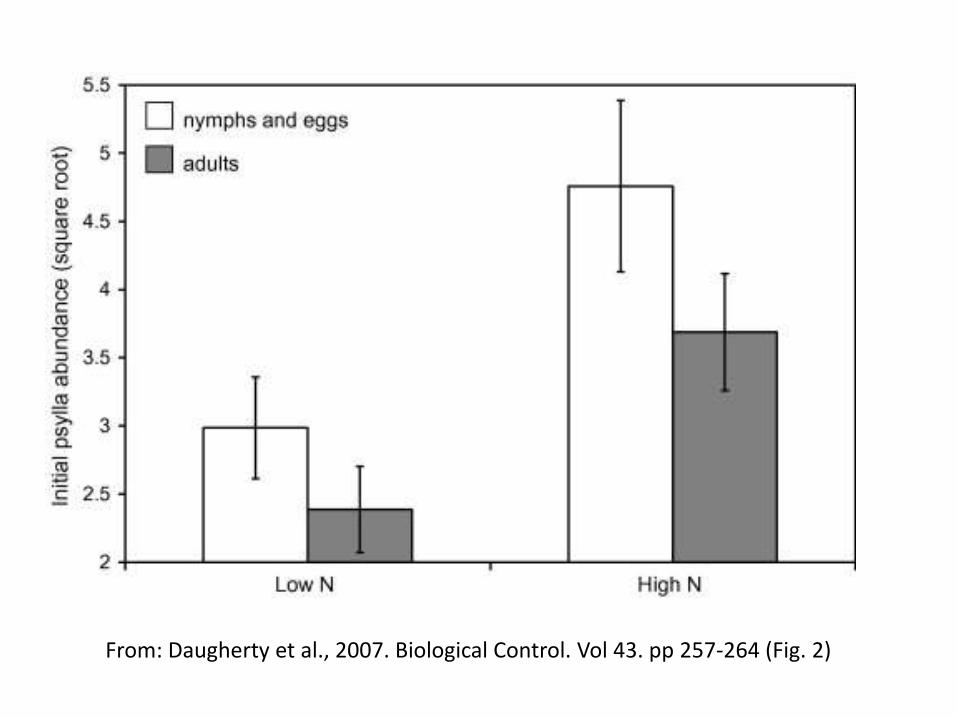
From: Daugherty et al., 2007. Biological Control. Vol 43. pp 257-264 (Fig. 2)

Anjou vs. Bosc:
Effect of Early Season Pear Psylla
Average pear psylla
nymphs per leaf
(4/24 to 6/8)
% injured
fruit
% down-
graded
fruit
% cull
fruit
Anjou 1.1 50 21 6.5
Bosc 1.4 30 3 0.5
From: Westigard et al., 1981. Journal of Economic Entomology. Vol 74. pp 532-534

IPM Orchard Survey—Insects other than Pear Psylla in the Canopy
(number / 50 beat trays)
Early season Mid-season Late season
Pest true bugs
Lygus 0.13 0.70 0.95
Calocoris 0 0.02 0
Stink bugs 0.02 0 0.03
Natural enemies
Deraeocoris brevis 0.35 0.78 0.05
Nabis 0 0.20 0.65
Orius 0.03 0.35 0.24
Soldier beetle 0.10 0 0
Lady beetles 0.30 0.23 0.03
Lacewings 0.37 1.45 0.42
Earwigs 2.10 3.10 0.49
2000

European earwig adults
male ♂
female ♀

Effect of Tanglefoot Exclusion on
European Earwig Population Levels—2002
0.00
0.10
0.20
0.30
0.40
0.50
3-J
un-0
2
10-J
un-0
2
17-J
un-0
2
24-J
un-0
2
1-J
ul-02
8-J
ul-02
15-J
ul-02
22-J
ul-02
29-J
ul-02
5-A
ug-0
2
12-A
ug-0
2
19-A
ug-0
2
# p
er
thre
e t
rays
no tanglefoot
tanglefoot
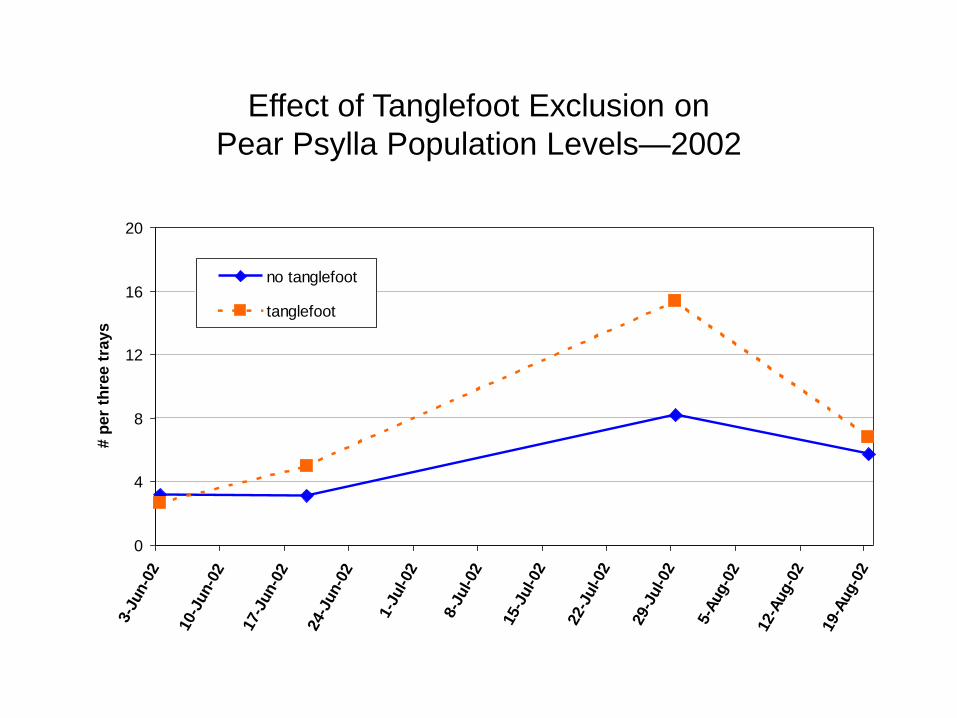
Effect of Tanglefoot Exclusion on
Pear Psylla Population Levels—2002
0
4
8
12
16
20
3-J
un-0
2
10-J
un-0
2
17-J
un-0
2
24-J
un-0
2
1-J
ul-02
8-J
ul-02
15-J
ul-02
22-J
ul-02
29-J
ul-02
5-A
ug-0
2
12-A
ug-0
2
19-A
ug-0
2
# p
er
thre
e t
rays
no tanglefoot
tanglefoot
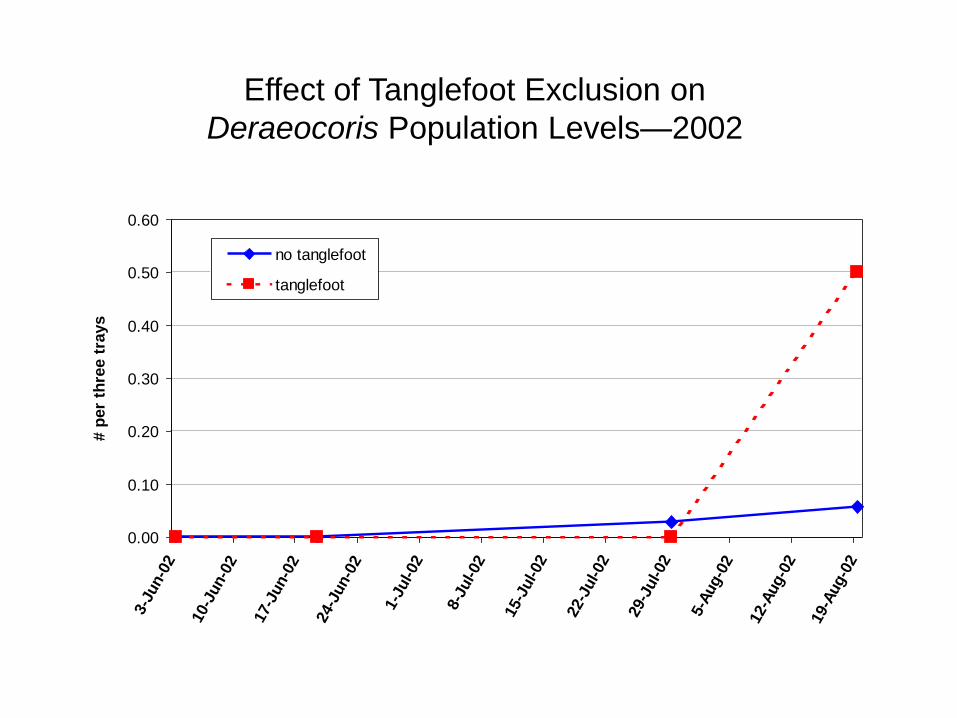
Effect of Tanglefoot Exclusion on
Deraeocoris Population Levels—2002
0.00
0.10
0.20
0.30
0.40
0.50
0.60
3-J
un-0
2
10-J
un-0
2
17-J
un-0
2
24-J
un-0
2
1-J
ul-02
8-J
ul-02
15-J
ul-02
22-J
ul-02
29-J
ul-02
5-A
ug-0
2
12-A
ug-0
2
19-A
ug-0
2
# p
er
thre
e t
rays
no tanglefoot
tanglefoot

Mean per three trays (6/3-8/19)
With Tanglefoot
exclusion (n=14)
No Tanglefoot
exclusion (n=35)
Pear psylla * 7.45 5.04
Earwigs * 0.02 0.34
Deraeocoris * 0.13 0.02
Nabis 0.02 0.01
Orius 0.04 0.01
Trechnites 0.30 0.21
Lacewings 0.09 0.09
Lady beetles 0.02 0.03
Spiders 0.39 0.34
* Indicates a significant difference between the means observed in the two treatments (p<0.05)
Effect of Tanglefoot exclusion on populations
of pear psylla and natural enemies—2002
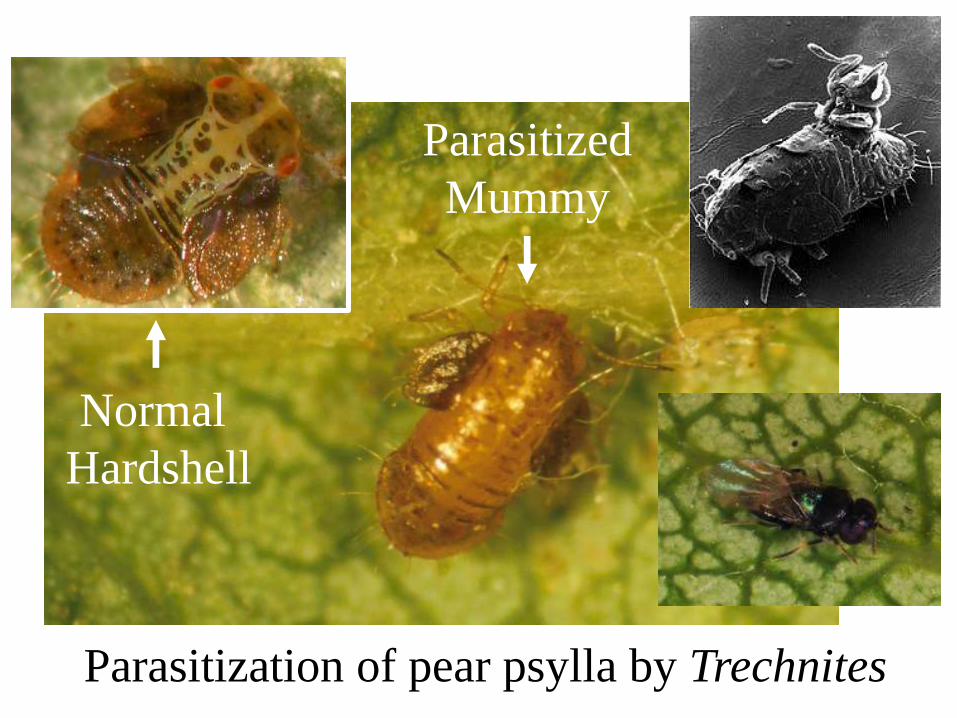
Normal
Hardshell
Parasitized
Mummy
Parasitization of pear psylla by Trechnites
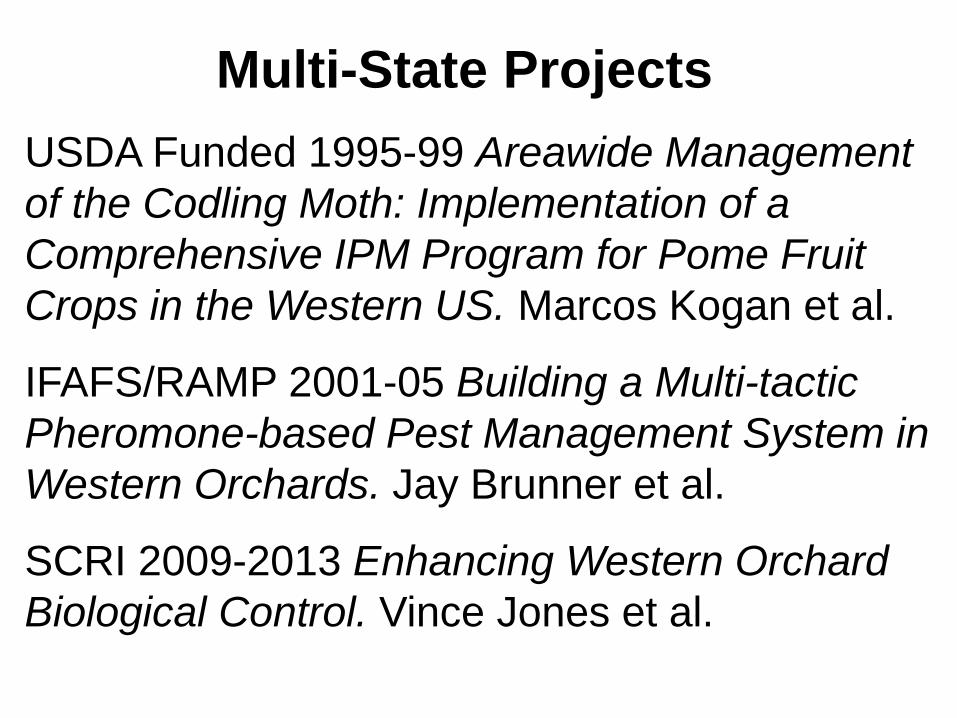
Multi-State Projects
USDA Funded 1995-99 Areawide Management
of the Codling Moth: Implementation of a
Comprehensive IPM Program for Pome Fruit
Crops in the Western US. Marcos Kogan et al.
IFAFS/RAMP 2001-05 Building a Multi-tactic
Pheromone-based Pest Management System in
Western Orchards. Jay Brunner et al.
SCRI 2009-2013 Enhancing Western Orchard
Biological Control. Vince Jones et al.

Multi-State Projects
SCRI 2009-2013 Enhancing Western Orchard
Biological Control. Vince Jones et al.
OPENED - Orchard Pesticide Effects on Natural
Enemies Database
http://enhancedbc.tfrec.wsu.edu/opened/
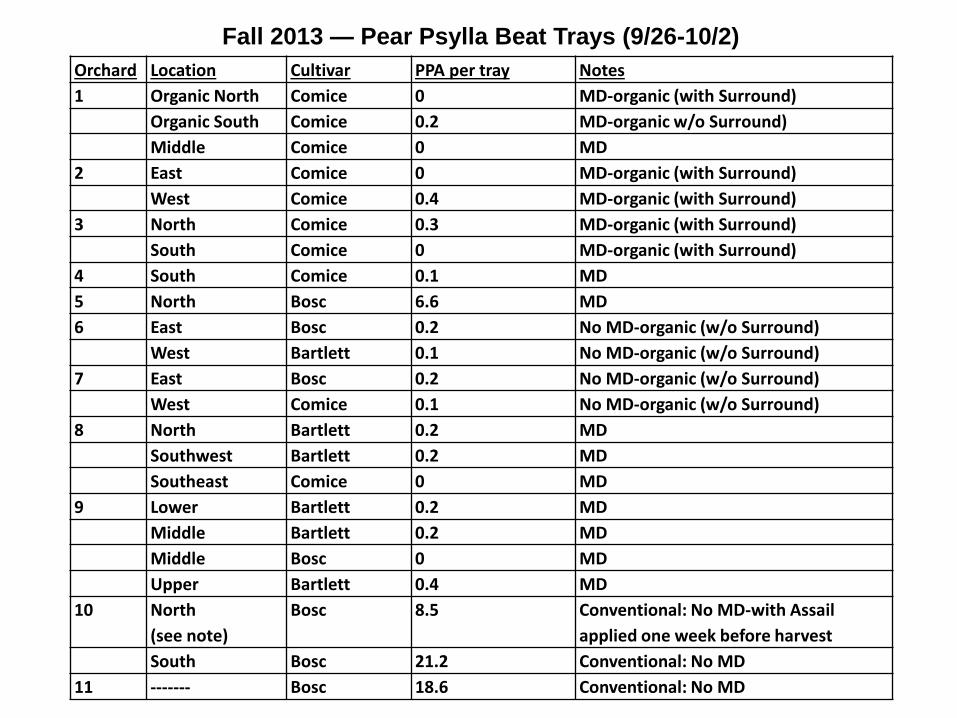
Fall 2013 — Pear Psylla Beat Trays (9/26-10/2)
Orchard Location Cultivar PPA per tray Notes
1 Organic North Comice 0 MD-organic (with Surround)
Organic South Comice 0.2 MD-organic w/o Surround)
Middle Comice 0 MD
2 East Comice 0 MD-organic (with Surround)
West Comice 0.4 MD-organic (with Surround)
3 North Comice 0.3 MD-organic (with Surround)
South Comice 0 MD-organic (with Surround)
4 South Comice 0.1 MD
5 North Bosc 6.6 MD
6 East Bosc 0.2 No MD-organic (w/o Surround)
West Bartlett 0.1 No MD-organic (w/o Surround)
7 East Bosc 0.2 No MD-organic (w/o Surround)
West Comice 0.1 No MD-organic (w/o Surround)
8 North Bartlett 0.2 MD
Southwest Bartlett 0.2 MD
Southeast Comice 0 MD
9 Lower Bartlett 0.2 MD
Middle Bartlett 0.2 MD
Middle Bosc 0 MD
Upper Bartlett 0.4 MD
10 North
(see note)
Bosc 8.5 Conventional: No MD-with Assail
applied one week before harvest
South Bosc 21.2 Conventional: No MD
11 ------- Bosc 18.6 Conventional: No MD
Conventional Mean
= 16.1 PPA/tray
IPM / Organic Mean
= 0.47 PPA/tray
Fall 2013 — Pear Psylla Beat Trays (9/26-10/2)

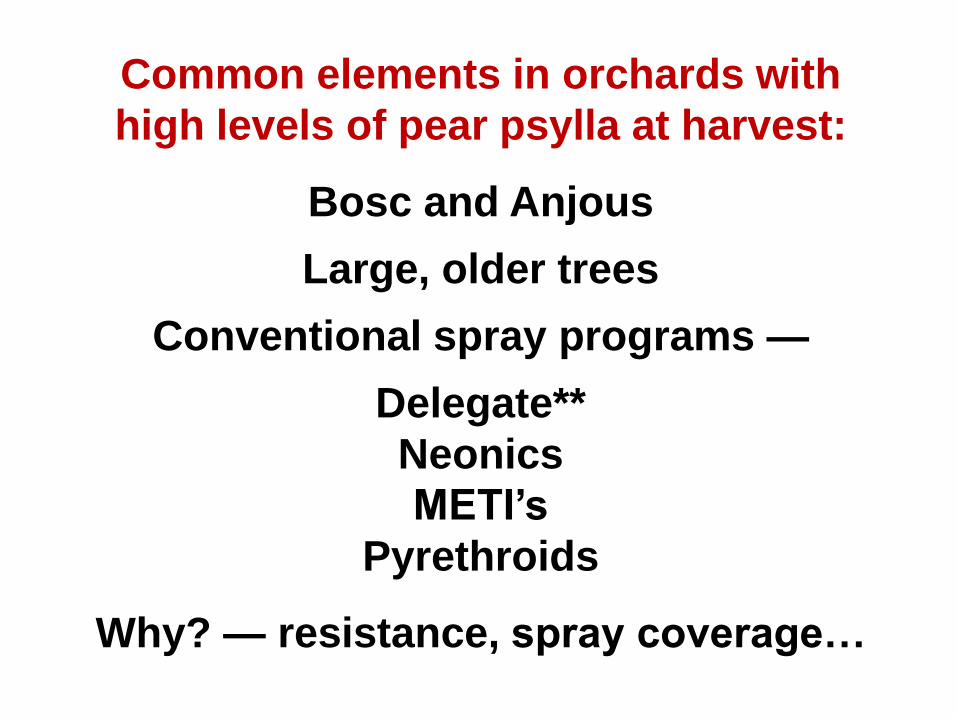
Common elements in orchards with
high levels of pear psylla at harvest:
Bosc and Anjous
Large, older trees
Conventional spray programs —
Delegate**
Neonics
METI’s
Pyrethroids
Common elements in orchards with
high levels of pear psylla at harvest:
Bosc and Anjous
Large, older trees
Conventional spray programs —
Delegate**
Neonics
METI’s
Pyrethroids
Why? — resistance, spray coverage…

2013 Cover Spray ComparisonMaterial and
Rate (form.) per acre
Application dates
Check -----
Spinosyn—
Delegate 6.5 oz 5/11, 6/1, 6/21, 7/13, 8/4
Neonicotinoid—
Assail WP 3.4 oz 5/11, 6/1, 6/21, 7/13, 8/4
Pyrethroid—
Asana 14.5 oz
Warrior 5.12 oz
5/11, 6/1, 6/21
7/13, 8/4

2013 Cover Spray Comparison—
Effect on Codling MothTreatment % Codling Moth Injury
Mid season (7/2) Harvest (8/13)
Check 1.25 a 55.5 a
Delegate 6.5 oz 0 b 0.5 b
Assail WP 3.4 oz 0.25 b 1.0 b
Asana 14.5 oz and
Warrior 5.12 oz0 b 0.5 b

2013 Cover Spray Comparison—
Effect on Pear Rust Mite
Treatment # pear rust mite per leaf (6/10)
Check 20.10 b
Delegate 6.5 oz 58.70 a
Assail WP 3.4 oz 49.90 ab
Asana 14.5 oz 5.80 c

2013 Cover Spray Comparison—
Effect on Twospotted Spider Mite
Treatment # spider mites per shoot leaf (7/23)
Check 0.13 b
Delegate 6.5 oz 0.35 b
Assail WP 3.4 oz 9.33 a
Asana 14.5 oz and
Warrior 5.12 oz1.40 b

2013 Cover Spray Comparison—
Effect on Pear Psylla
Treatment # pear psylla per leaf
6/10 7/23
Check 0.07 b 0.10
Delegate 6.5 oz 0.08 b 0
Assail WP 3.4 oz 0.20 ab 0.05
Asana 14.5 oz and
Warrior 5.12 oz0.42 a 0.03
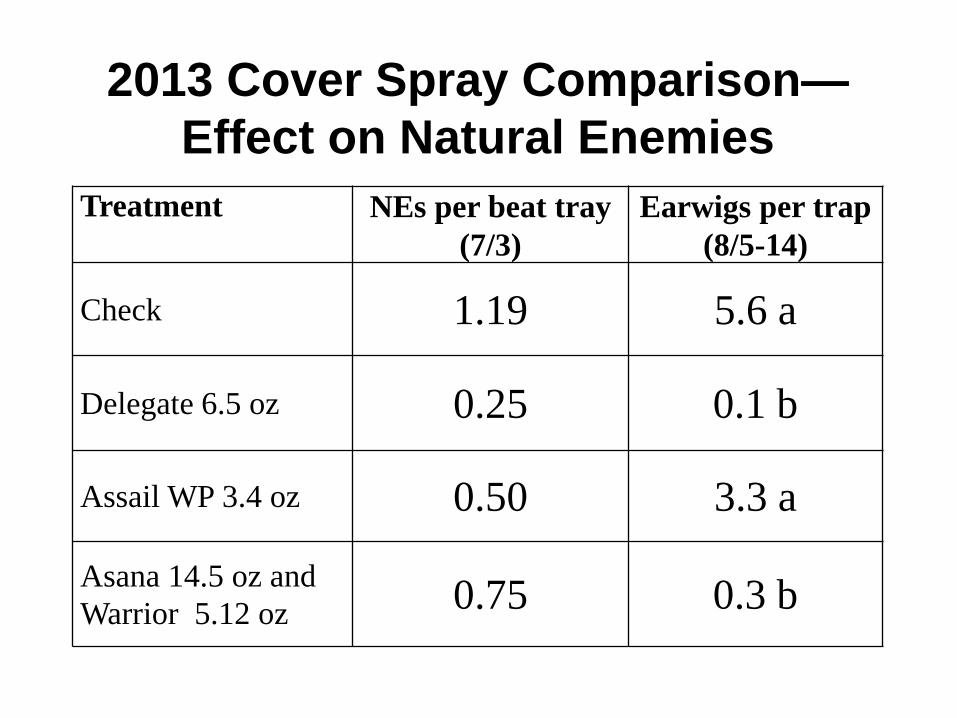
2013 Cover Spray Comparison—
Effect on Natural Enemies
Treatment NEs per beat tray
(7/3)
Earwigs per trap
(8/5-14)
Check 1.19 5.6 a
Delegate 6.5 oz 0.25 0.1 b
Assail WP 3.4 oz 0.50 3.3 a
Asana 14.5 oz and
Warrior 5.12 oz0.75 0.3 b

2016 Pear IPM Orchards – % fruit injury due to insects
Type of injuryOrchard #1
(n=1,000)
Orchard #2
(n=1,200)
Orchard #3
(n=550)
Codling moth 0 0.33 0
Surface feeding 0 1.0 0.18
Green fruitworm 0.1 0 0
True bug 0.8 2.16 0.91
All insect damage 0.9 3.50 1.09

2016 Pear IPM Orchards – % fruit injury due to insects
Type of injuryOrchard #1
(n=1,000)
Orchard #2
(n=1,200)
Orchard #3
(n=550)
Codling moth 0 0.33 0
Surface feeding 0 1.0 0.18
Green fruitworm 0.1 0 0
True bug 0.8 2.16 0.91
All insect damage 0.9 3.50 1.09
BMSB
(brown marmorated stink bug)

Barriers to invasive pests:
Great Wall of China

Barriers to invasive pests:
Hadrian’s Wall
in England

Barriers to invasive pests:
The Wall in Game of Thrones

Barriers to invasive pests:
Rabbit Proof Fence
in Australia

Barriers to invasive pests:
Running Fence in N. California

Barriers to invasive pests:
BMSB Fence in
Wenatchee

QUESTIONS?

I thinkit’s time for
lunch!