integrated coastal monitoring of a gas processing plant using native and caged mussels
TRANSCRIPT
Science of the Total Environment 426 (2012) 375–386
Contents lists available at SciVerse ScienceDirect
Science of the Total Environment
j ourna l homepage: www.e lsev ie r .com/ locate /sc i totenv
Integrated coastal monitoring of a gas processing plant using native andcaged mussels
Steven Brooks a,⁎, Christopher Harman a, Manu Soto b, Ibon Cancio b, Tormod Glette c, Ionan Marigómez b
a Norwegian Institute for Water Research (NIVA), Gaustadalléen 21, NO-0349 Oslo, Norwayb CBET Res Grp, R&D Centre for Experimental Marine Biology and Biotechnology (PIE), Univ Basque Country, Areatza Z/G, Plentzia-Bizkaia, E-48620 Basque Country, Spainc Det Norske Veritas (DNV), Veritasveien 1, 1363 Høvik, Norway
⁎ Corresponding author. Tel.:+4722185100,+4792696E-mail address: [email protected] (S. Brooks).
0048-9697/$ – see front matter © 2012 Elsevier B.V. Alldoi:10.1016/j.scitotenv.2012.03.059
a b s t r a c t
a r t i c l e i n f oArticle history:Received 30 November 2011Received in revised form 15 March 2012Accepted 20 March 2012Available online 18 April 2012
Keywords:BiomarkersProcess waterIntegrated monitoringIntegrative Biological Response indexPassive samplers
The biological effects of a coastal process water (PW) discharge on native and caged mussels (Mytilus edulis)were assessed. Chemical analyses of mussel tissues and semi permeable membrane devices, along with asuite of biomarkers of different levels of biological complexity were measured. These were lysosomalmembrane stability in haemocytes and digestive cells; micronuclei formation in haemocytes; changes in cell-type composition in the digestive gland epithelium; integrity of digestive gland tissue; peroxisomeproliferation; and oxidative stress. Additionally the Integrative Biological Response (IBR/n) index wascalculated. This integrative biomarker approach distinguished mussels, both native and caged, exhibitingdifferent stress conditions not identified from the contaminant exposure. Mussels exhibiting higher stressresponses were found with increased proximity to the PW discharge outlet. However, the biological effectsreported could not be entirely attributed to the PW discharge based on the chemicals measured, but werelikely due to either other chemicals in the discharge that were not measured, the general impact of theprocessing plant and or other activities in the local vicinity.
© 2012 Elsevier B.V. All rights reserved.
1. Introduction
Process water (PW) is a mixture of produced water extracted alongwith natural gas and condensate from geological formations withadditional water and process chemicals. It is a complex mixturecontaining thousands of different compounds mostly including tracemetals, organic acids, phenols, polycyclic aromatic, aliphatic hydrocar-bons (PAH) and residual production and treatment chemicals and theirbreakdown products (Johnsen et al., 2004; Neff, 2002; Roe Utvik, 1999).Due to improved PW treatment systems installed on both offshore andcoastal oil and gas facilities, the concentrations of contaminants in PWreleased into the environment are often small. This is particularly thecase for onshore plants where space limitations for treatment systemsare not a factor, enabling discharge limits to be achieved around 10 foldlower than that for offshore platforms. Once discharged, the PW is thenfurther diluted and dispersed in to the receiving waters, followed byvolatilisation and biodegradation (Flynn et al., 1996). Consequently, themeasurement of these compounds is difficult, often resulting inconcentrations below detection limits. However, biological effectshave frequently been reported following exposure to PW mixtures,with individual chemicals below their detection limits (Brooks et al.,2011b; Harman et al., 2009a, 2009b; Stephens et al., 1996, 2000; Zhao
421 (Mob); fax:+4722185200.
rights reserved.
et al., 2008). In these cases, the toxicity of the mixture and not theindividual compounds was believed to be responsible for the biologicaleffects observed.
The Ormen Lange gas processing plant is situated on the island ofGossa, on the West coast of Norway. The plant processes water, gasand condensate received by pipeline from a gas field approximately120 km offshore in the North Sea. The processing plant contains botha biological treatment system and macro porous polymer extracttechnology, which together can remove up to 99% of the dissolvedand dispersed hydrocarbons (Aker Kværner, 2006). This includesmost aliphatic hydrocarbons, volatiles such as benzene, toluene,ethlbenze and xylenes (BTEX), PAHs and their alkylated homologues,as well as some polar compounds such as alkyl phenols to a lesserextent (Aker Kværner, 2006). Previously, biological effect monitoringof the Ormen Lange PW has confirmed that it is comprised ofextremely low concentrations of a variety of compounds that aredifficult to detect chemically but appear to cause biological effects inexposed mussels (Brooks et al., 2011b).
The main objective of the present study was to evaluate thepotential biological effects of the Ormen Lange PW using native andcaged mussels, Mytilus edulis. The combined use of native and cagedmussels is useful to assess chronic pollution restraining the extent towhich genetic variability and impending adaptive mechanismsagainst chronic environmental insult may affect biological response(Gomiero et al., 2011; Gorbi et al., 2008; Nigro et al., 2006). Inaddition, semi-permeable membrane devices (SPMDs) have also
376 S. Brooks et al. / Science of the Total Environment 426 (2012) 375–386
been used to support the biological effect measurements (Brookset al., 2011b; Huckins et al., 1990, 2006). Using a combination ofmussels and SPMDs is a valuable tool for estimating the fate and impactof chemical contaminants in PW that are discharged to the ocean.
The health status of the mussels was evaluated using an integratedsuite of biomarkers. The selected biomarker measurements can bedirectly related to the amount of environmental stress imposedthrough a variety of factors including organic compounds typicallyfound in produced water. This approach will provide information onthe potential toxicity of the receiving waters within the vicinity of thePW discharge. Due to the complexity of chemicals present in PW,which can induce a wide range of biological effects, the multiplebiomarker approach has been found to be most effective (Brooks etal., 2009; Cajaraville et al., 2000; Garmendia et al., 2011a, 2011b,2011c; Hylland et al., 2008). In the present study, the biomarkersmeasured included: 1) peroxisome proliferation measured aspalmitoyl-CoA oxidase (AOX) activity (Fahimi and Cajaraville,1995); 2) oxidative stress through catalase (CAT) activity measure-ments in the digestive gland (Eertman et al., 1995); 3) micronuclei(MN) formation as a measure of genetic damage (Baršienė andAndreikėnaitė, 2007); 4) the stability of the lysosomal membrane inboth haemocytes (Neutral red retention, NRR; ICES, 2004; Lowe andPipe, 1994) and digestive cells (LMS(d); Marigómez et al., 2005;UNEP/RAMOGE, 1999); 5) changes in the cell composition inthe digestive gland epithelium in terms of volume density ofbasophilic cells (VvBAS; Marigómez et al., 2002; Soto et al., 2002);and 6) integrity of the digestive gland tissue through the connective
Ormen Lange
1
3
2
4
S3S2
Discharge outlet
5
6
100 m
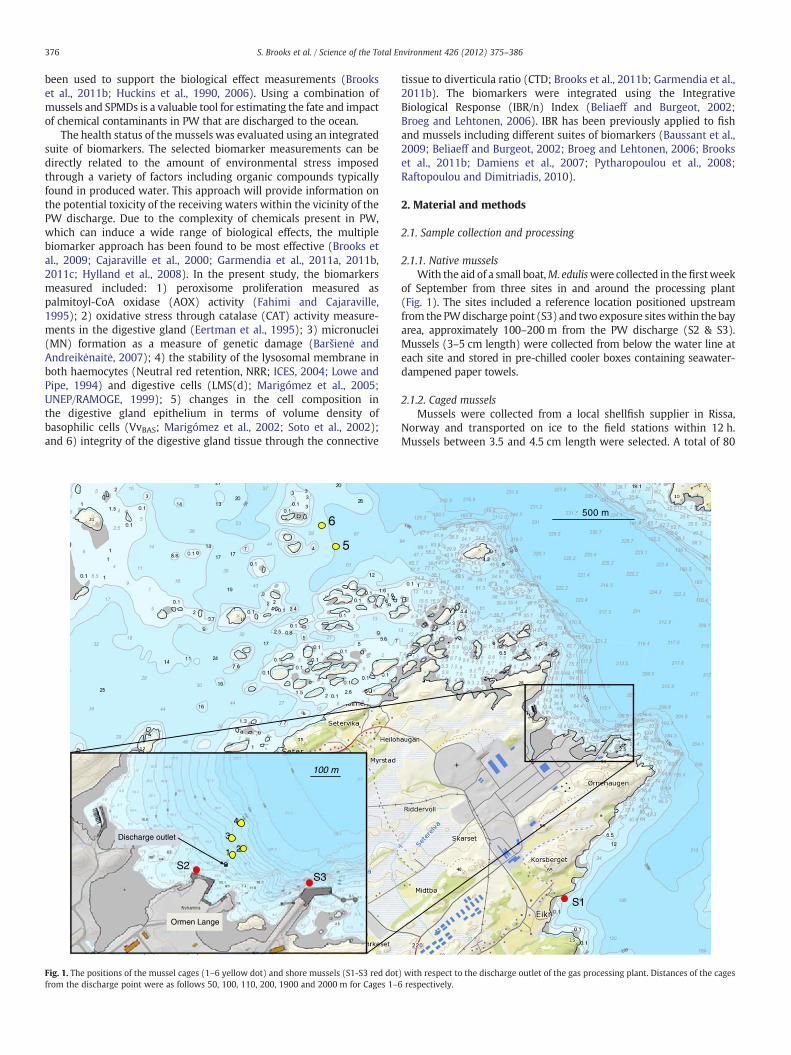
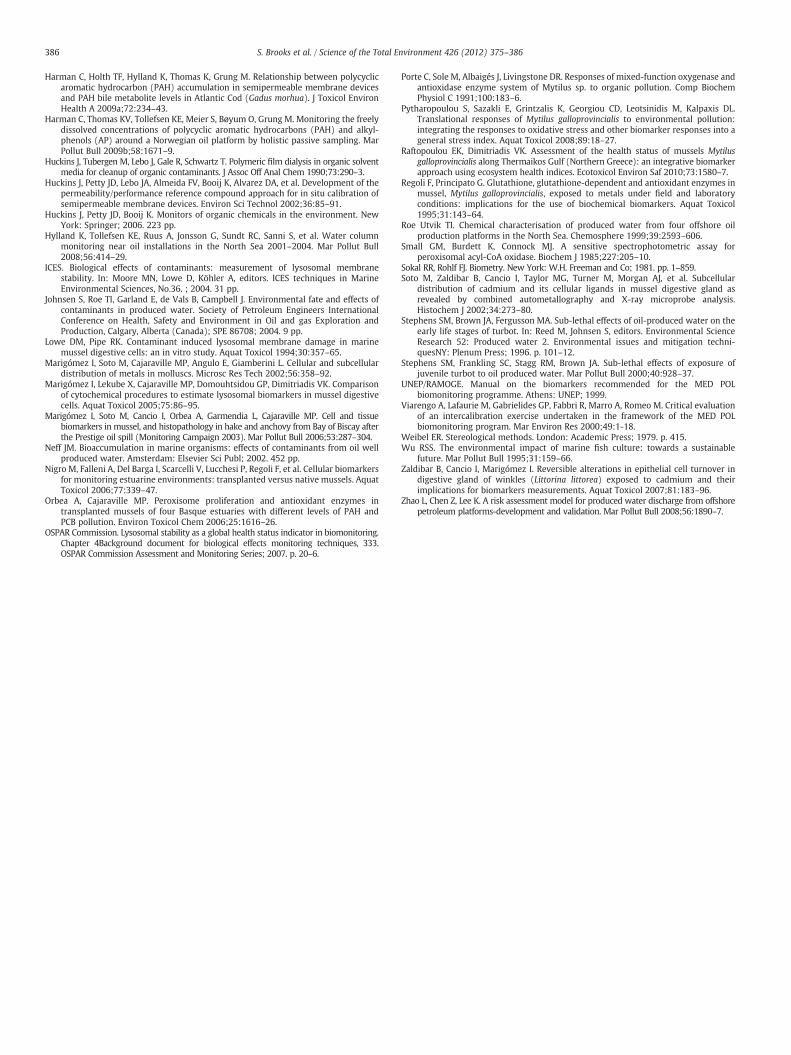
Fig. 1. The positions of the mussel cages (1–6 yellow dot) and shore mussels (S1-S3 red dotfrom the discharge point were as follows 50, 100, 110, 200, 1900 and 2000 m for Cages 1–
tissue to diverticula ratio (CTD; Brooks et al., 2011b; Garmendia et al.,2011b). The biomarkers were integrated using the IntegrativeBiological Response (IBR/n) Index (Beliaeff and Burgeot, 2002;Broeg and Lehtonen, 2006). IBR has been previously applied to fishand mussels including different suites of biomarkers (Baussant et al.,2009; Beliaeff and Burgeot, 2002; Broeg and Lehtonen, 2006; Brookset al., 2011b; Damiens et al., 2007; Pytharopoulou et al., 2008;Raftopoulou and Dimitriadis, 2010).
2. Material and methods
2.1. Sample collection and processing
2.1.1. Native musselsWith the aid of a small boat,M. eduliswere collected in thefirstweek
of September from three sites in and around the processing plant(Fig. 1). The sites included a reference location positioned upstreamfrom the PWdischarge point (S3) and two exposure siteswithin the bayarea, approximately 100–200 m from the PW discharge (S2 & S3).Mussels (3–5 cm length) were collected from below the water line ateach site and stored in pre-chilled cooler boxes containing seawater-dampened paper towels.
2.1.2. Caged musselsMussels were collected from a local shellfish supplier in Rissa,
Norway and transported on ice to the field stations within 12 h.Mussels between 3.5 and 4.5 cm length were selected. A total of 80
S1
500 m
) with respect to the discharge outlet of the gas processing plant. Distances of the cages6 respectively.
377S. Brooks et al. / Science of the Total Environment 426 (2012) 375–386
mussels were placed in elasticated nylon mesh bags. The mesh bagswere divided into 8 compartments holding 10 mussels per compart-ment to ensure that all mussels could attach freely to the nylon meshand were equally exposed to the surrounding waters. The musselswere held at a depth of 25–30 m at all sites. A total of six sites wereused (50 m, two at 100 m, and 200 m away from discharge point aswell as two reference sites, Ref 1 and Ref 2; Fig. 1), and cagesmaintained for 6 weeks before sample collection. SPMDs were woundaround stainless steel deployment spiders and held within a stainlesssteel mesh cage (Environmental Sampling Technologies, Saint Joseph,USA), which was secured to the rope directly below the mussels.Three replicates per cage were used. SPMDs were spiked with amixture of deuterated PAH as performance reference compounds(PRCs) to allow for the determination of sampling rates in situ (Booijet al., 1998; Huckins et al., 2002) and were obtained from ExposMeter(Tavelsjo, Sweden).
2.1.3. Sample processingAllmussels, both native and caged,were taken to thefield laboratory
and processed within 4 h of collection from the shore. Haemolymphsamples were taken from the posterior adductor muscle of individualmussels and assessed for NRR and MN formation. Digestive gland andgonad tissue were removed from individual mussels and preserved byeither snap freezing in liquid nitrogen or submersion in formalin.Digestive gland samples were used to measure lysosomal stability(LMS(d)), enzyme activity (i.e. AOX, CAT) and histological alterations(VvBAS, CTD). In addition, whole soft tissue samples were collected forthe analysis of organic and metal contaminant concentrations.
2.2. Chemical analyses
2.2.1. Pollutant tissue burdens in musselsFor each treatment group, triplicate mussel samples were taken for
analysis of selected metals and PAHs, including alkylated homologues ofnaphthalene, phenanthrene and dibenzothiophene (NPD). Five wholemussels per sample were removed from their shells and placed inpyrolysed (560 °C) glass containers. The mussels were frozen andtransported to NIVA on dry ice. All samples were stored at −20 °C untilanalyses.
Samples were defrosted, homogenised and a sub sample taken ofapproximately 5 g. Internal standards were added before extraction bysaponification. Analytes were then extracted twice with 40 mLcyclohexane and dried over sodium sulphate. The extracts werereduced by a gentle stream of nitrogen and cleaned by gel permeationchromatography (GPC) using the system described previously (Harmanet al., 2008). Analysis proceeded by gas chromatography with massspectrometric detection (GC–MS) with the MS detector operating inselected ionmonitoringmode (SIM). The GCwas equippedwith a 30 mcolumnwith a stationary phase of 5% phenyl polysiloxane (0.25 mm i.d.and 0.25 μm film thickness), and the injector operated in splitlessmode.The initial column temperature was 60 °C, which after 2 minwas raisedstepwise to 310 °C. The carrier gaswas heliumand the column flow ratewas 1.2 mL/min. Quantification of individual components was per-formed by using the internal standard method. The alkylated homo-logues were quantified by baseline integration of the establishedchromatographic pattern and the response factors were assumed equalwithin each group of homologues. Recoveries of PAH frommussel tissueranged between 70 and 120%.
2.2.2. Semipermeable membrane devices (SPMDs)The exterior of the SMPDs was wiped clean before extraction by
dialysis with 2×150 mL hexane (Huckins et al., 1990). Clean up byGPC and analysis for PAHs and NPDs by GC–MS, proceeded asdescribed above for mussel samples. Quantification of individualcomponents was performed by using the relative response of internalstandards. In order to correct for any possible contamination during
study procedures, control or ‘blank’ SPMDs were used. These includedfield controls (FCs) that were exposed to the air during deploymentand retrieval and laboratory controls (LCs) that follow exposure tosolvents, glassware etc. during sample work up. At least one of eachtype of control was used per 10 exposed samplers. Initial (time zero)concentrations of PRCs were also established from LCs. An empiricalmodel, described in detail by Huckins et al. (2006), was used in thecalculation of water concentrations from SPMD accumulations. In thismodel compound specific effects on uptake are adjusted based on thelog Kow of the analyte and site-specific factors arising from differencesin environmental variables are adjusted by using the PRC data. In thisway the uptake for each individual compound at each samplingstation was established, expressed as a sampling rate (L/d). Whereindividual analytes were not detected in SPMDs then the analyticaldetection limit was used in calculations to provide a maximumtheoretical concentration in the water, see Harman et al. (2009b) formore details.
2.3. Biomarkers
2.3.1. Haemolymph analysis
2.3.1.1. Lysosomal membrane stability in haemocytes. The integrity oflysosomal membranes of mussel haemocytes was determined usingthe Neutral Red Retention (NRR) procedure adapted from Lowe andPipe (1994). Approximately 0.1 mL of haemolymph was removedfrom the adductor muscle of the mussel with a syringe containingapproximately 0.1 mL physiological saline. The haemolymph/salinesolution was placed in a microcentrifuge tube, from which a 40 μLsample was removed and pipetted onto the centre of a microscopeslide. The slide was left in a dark humid chamber for 15 min to allowthe cells to adhere to the slide. After this time, the excess liquid wasremoved from the slide and 40 μL of neutral red solution added(Sigma). The neutral red solution was taken up inside the haemocytesand stored within lysosomes. The ability of the lysosomes to retainthe neutral red solution was checked every 15 min by lightmicroscopy (×40). The test was terminated and the time recordedwhen greater than 50% of the haemocytes leaked the neutral red dyeinto the cytosol.
2.3.1.2. Micronuclei formation inmussel haemocytes (MN).Approximate-ly 0.1 mL of haemolymph was removed from the posterior adductormuscle of each mussel with a hypodermic syringe containing 0.1 mLPBS buffer (100 mM PBS, 10 mM EDTA). The haemolymph and PBSbuffer were mixed briefly in the syringe and placed on a microscopeslide. The slide was then placed in a humid chamber for 15 min toenable the haemocytes to adhere to the slides. Excess fluid was drainedand the adhered haemocytes were fixed in 1% glutaraldehyde for5 min. Following fixation, the slides were gently rinsed in PBS bufferand left to air-dry overnight. The dried slides were brought back to thelaboratory for further processing. Slides were stained with 1 μg/mLbisbenzimide 33258 (Hoechst) solution for 5 min, rinsed with distilledwater andmounted in glycerol McIlvaine buffer (1:1). The frequency ofmicronuclei formation was measured on coded slides withoutknowledge of the exposure status of the samples to eliminate bias(Baršienė and Andreikėnaitė, 2007). The frequency of micronuclei inhaemocytes was determined microscopically at 100× objective (finalmagnification ~1000×). A total of 2000 cells (200 cells×10 mussels)were examined for each experimental group ofmussels. Only cells withintact cellular and nuclear membranes were scored.
2.3.2. Enzyme activities in digestive glandFrozen digestive glands were individually homogenised in a
Braun-Potter homogeniser using TVBE buffer (1 mM sodium bicar-bonate, 1 mM EDTA, 0.1% ethanol and 0.01% Triton X-100; pH=7.6).After homogenisation, samples were centrifuged at 500 g for 15 min.
378 S. Brooks et al. / Science of the Total Environment 426 (2012) 375–386
Supernatants were removed and diluted appropriately to perform theenzyme assays. Total protein of all samples was measured using theDC protein assay (BioRad, California) based on the Lowry method andusing a γ-globulin as standard.
2.3.2.1. Catalase (CAT) activity. The activity of the antioxidant enzymecatalase was measured basically as described by Porte et al. (1991) infrozen digestive gland samples (n=10 mussels). CAT activity wasdetermined in 5 pools (2 digestive glands per pool) per experimentalgroup, by measuring the consumption of H2O2 at 240 nm (ext. coeff.40 M−1 cm−1) using H2O2 50 mM as substrate in potassiumphosphate buffer 80 mM (pH=7).
2.3.2.2. Palmitoyl-CoA oxidase (AOX) activity. Peroxisomal palmitoyl-CoA oxidase (AOX) activity was determined spectrophotometrically(λ=502 nm), in the same 5 pools per experimental group as used tomeasure CAT activity, measuring the H2O2 dependent oxidation ofdichlorofluorescein diacetate (Molecular Probes, Eugene, Oregon,USA) catalysed by an exogenous peroxidase, using 30 μM palmitoyl-CoA as substrate, according to Small et al. (1985).
2.3.3. Digestive gland cytochemistryTen serial sections (10 μm thick) of frozen digestive gland (5mussels
per treatment) were cut in a Leica CM 3000 cryotome onto successiveserial slides and stored at−40 °C until processing.
2.3.3.1. Lysosomal membrane stability (LMS(d)). The determination ofLMS was based on the time of acid labilisation treatment required toproduce the maximum staining intensity according to UNEP/RAMOGE (1999), after demonstration of hexosaminidase (Hex)activity in digestive cell lysosomes. Eight serial cryotome sections(10 μm) were subjected to acid labilisation in intervals of 0, 3, 5, 10,15, 20, 30 and 40 min in 0.1 M citrate buffer (pH 4.5 containing 2.5%NaCl) in a shaking water bath at 37 °C, in order to find out the rangeof pre-treatment time needed to completely labilise the lysosomalmembrane. Following this treatment, sections were transferred to thesubstrate incubation medium for the demonstration of Hex activity.The incubation medium consisted of 20 mg naphthol AS-BI-N-acetyl-β-D glucosaminide (Sigma, N 4006) dissolved in 2.5 mL 2-methoxyethanol (Merck, 859), and made up to 50 mL with 0.1 Mcitrate buffer (pH 4.5) containing 2.5% NaCl and 3.5 g low viscositypolypeptide (Sigma, P5115) to act as a section stabiliser. Sectionswere incubated in this medium for 20 min at 37 °C, rinsed in a salinesolution (3.0% NaCl) at 37 °C for 2 min and then transferred to 0.1 Mphosphate buffer (pH 7.4) containing 1 mg/mL diazonium dye FastViolet B salt (Sigma, F1631), at RT for 10 min. Slides were then rapidlyrinsed in running tap water for 5 min, fixed for 10 min in Baker'sformol calcium containing 2.5% NaCl at 4 °C and rinsed in distilledwater. Finally, slides were mounted in Kaiser's glycerine gelatine andsealed with nail varnish. The time of acid labilisation treatmentrequired to produce the maximum staining intensity was assessedunder the light microscope as the maximal accumulation of reactionproduct associated with lysosomes (UNEP/RAMOGE, 1999). Fourdeterminations were made for each animal by dividing each sectionin the acid labilisation sequence into 4 approximately equal segmentsand assessing the labilisation period in each of the corresponding setof segments. The mean value was then derived for each section,corresponding to an individual digestive gland.
2.3.4. Digestive gland histologyHistological sections (7 μm) were cut using a rotary microtome
and stained with haematoxylin-eosin (H/E). Prevalence of parasites,haemocyte infiltration and general condition of the digestiveepithelium, and the interstitial connective tissue were systematicallyrecorded.
2.3.4.1. Epithelial cell-type composition (VvBAS) and tissue integrity indigestive gland (CTD ratio). The volume density of basophilic cells(VvBAS) was quantified by means of stereology as an indication ofwhether changes in cell-type composition occurred or not (Soto et al.,2002). Likewise, the integrity of the digestive gland tissue wassimultaneously determined as the extent of the interstitial connectivetissue relative to the space occupied by digestive diverticula (connec-tive-to-diverticula (CTD) ratio) (Brooks et al., 2011b; Garmendia et al.,2011b). Counts were made in one randomly selected field in onedigestive gland slide per mussel (10 mussels per sample). Slides wereviewed at 40× objective (final magnification ~400×) using a drawingtube attached to a light microscope. A simplified version of the Weibelgraticule multipurpose test system M-168 (Weibel, 1979) was used,and hits on basophilic cells (b), digestive cells (d), diverticular lumens(l) and interstitial connective tissue (c) were recorded. CTD ratio wascalculated as CTD=c/(b+d+l). VvBAS was calculated according to theDelesse's principle (Weibel, 1979), as VvBAS=VBAS/VEP, where VBAS is thevolume of basophilic cells and VEP the volume of digestive glandepithelium.
2.3.5. Integrative Biological Response indexThe Integrative Biological Response (IBR) index was developed by
Beliaeff and Burgeot (2002) in order to integrate biochemical,genotoxicity and histochemical biomarkers. The IBR was modified toIBR/n, which took into account the number of biomarkers (Broeg andLehtonen, 2006). Presently, CAT, MN, LP, CTD and NRR were used tocalculate the IBR/n. The inverse values of LP and NRR were used sincea decrease was reflective of adverse impact. For CAT, previousresearch has identified a reduction in CAT activity in musselsfollowing long term exposure to chronically polluted areas as a resultof adaptation (Regoli and Principato, 1995). Since a similar adaptationwas considered to have occurred in the present study, the inverse ofthe values for CAT were used in the IBR/n calculation. The calculationmethod is based on relative differences between the biomarkers ineach given data set. For a more detailed explanation see Beliaeff andBurgeot (2002) and Broeg and Lehtonen (2006).
2.4. Statistical analysis
Homogeneity of variance was checked using the Levene's test, andwhere necessary, variables were log transformed to obtain homoge-neity. The data were then subjected to analysis of variance (ANOVA)with a Tukey post-hoc test, pb0.05. If homogeneity was not possible aKruskal–Wallis non-parametric test was used to compare means(Sokal and Rohlf, 1981).
3. Results
Low or undetected concentrations of PAHs and metals weremeasured in the whole tissue homogenates of native mussels collectedfrom the three sampling sites (Table 1). However, a small PAH signaturewas found at Site 1 compared to the other two sites, suggestingexposure to low levels of PAHs such as phenanthrene and fluoranthene.Likewise, the tissue concentration of PAHs and metals in cagedmusselswas low or near the detection limits (Table 2). Based on the chemicalanalysis of SPMDs, it was observed that PAH concentrationswere eitherlow or undetected in all the samples (Table 3).
3.1. Native mussels
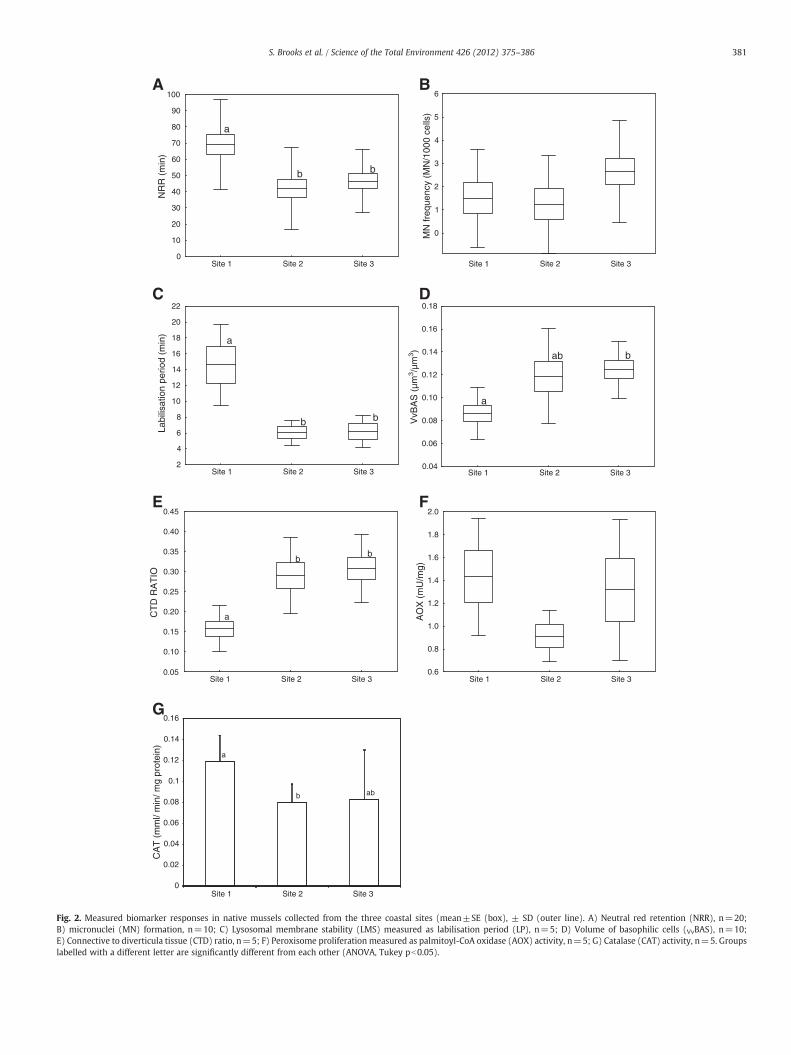
The results of the biomarker analysis performed in native musselsare shown in Fig. 2. Despite an apparent reduction in AOXactivity at Site2 in comparison with Site 1, no significant difference between meanvalues was found (Fig. 2A), which can be attributed to the large intra-variability observed. Elevated levels of CAT activity were measured inmussels from Site 1 compared to that measured in mussels from Site 2

Table 1PAH and metal concentrations in whole mussel homogenates of native shore musselscollected from the three sampling sites. Ten mussels were pooled per sample, datapresented in μg/kg w.w. for PAH and mg/kg w.w for metals (mean±SD, n=3).
Compound Site 1 Site 2 Site 3
Naphthalene b4.5 b4.5 b4.5Acenaphthylene b1.0 b1.0 b1.0Acenaphthene b1.0 b1.0 b1.0Fluorene 1.23±0.25 b1.0 b1.0Phenanthrene 3.67±0.46 1.33±0.21 1.35±0.35Anthracene 1.67±0.23 b1.0 b1.0Fluoranthene 4.37±0.58 1.15±0.21 1.1Pyrene 2.07±0.25 b1.0 b1.0Benzo(a)anthracene b1.0 b1.0 b1.0Chrysene 1.1 b1.0 b1.0Benzo(b)fluoranthene b1.0 b1.0 b1.0Benzo(k)fluoranthene b1.1 b1.0 b1.0Benzo(a)pyrene b1.2 b1.0 b1.0Dibenz(a,h)anthracene b1.3 b1.0 b1.0Benzo(g,h,i)perylene b1.4 b1.0 b1.0Indeno(1,2,3-cd)pyrene b1.5 b1.0 b1.0Sum PAH16 13.3±2.0 2.1±0.87 1.9±1.13Cadmium 0.11±0.02 0.12±0.02 0.14±0.01Copper 0.93±0.07 0.89±0.09 1.09±0.09Mercury 0.009±0.001 0.010±0.001 0.009±0.001Lead 0.057±0.006 0.06 0.06±0.006Zinc 18.1±2.14 14.2±1.16 18.8±1.57Lipid % 1.6±0.17 1.43±0.15 1.6±0.15
Table 2PAH and metal concentrations in whole mussel homogenates of caged mussels positioned foper sample, data presented in μg/kg w.w. for PAH and mg/kg w.w for metals (mean±SD, n
Compound 50 m 100 m 110 m
Naphthalene b0.8 b0.8 b0.8C1-Naphthalenes b2 b2 b2C2-Naphthalenes b2 2.2 2.5±C3-Naphthalenes b2 2.7±0.85 3.2±Phenanthrene 0.81±0.12 0.90±0.02 0.89 ±C1-Phenanthrenes b2 2.5 b2C2-Phenanthrenes 3.0±0.85 3.1±0.53 3.3±C3-Phenanthrenes 3.5 3.63±1.23 3Dibenzothiophene b0.5 b0.5 b0.5C1-Dibenzothiophenes b2 b2 b2C2-Dibenzothiophenes b2 b2 b2C3-Dibenzothiophenes b2 b2 b2Sum NPD b21.17±1.86 b23.63±2.15 b22.3Acenaphthylene b0.5 b0.5 b0.5Acenaphthene b0.5 b0.5 b0.5Fluorene b0.5 b0.5 b0.5Anthracene b0.5 b0.5 b0.5Fluoranthene 0.77±0.2 0.64±0.13 0.78±Pyrene b0.5 b0.5 b0.5Benzo(a)anthracenes b0.5 b0.5 b0.5Chrysene b0.5 b0.5 b0.5Benzo(b)fluoranthene b0.5 b0.5 b0.5Benzo(k)fluoranthene b0.5 b0.5 b0.5Benzo(e)pyrene b0.5 b0.5 b0.5Benzo(a)pyrene b0.5 b0.5 b0.5Perylene 0.65 b0.5 b0.5Indeno(1,2,3-cd)pyrene b0.5 b0.5 b0.5Dibenz(a,h)anthracene b0.5 b0.5 b0.5Benzo(g,h,i)perylene b0.5 b0.5 b0.5Sum PAH b29.57±1.86 b31.77±2.26 b30.5Sum PAH16 b8.68±0.4 b8.84±0.15 b8.72Ag 0.02±0.01 0.011 0.014Al 3.67±1.01 3.77±0.76 3.97±As 2.7±0.16 2.71±0.07 2.91±Cd 0.16±0.02 0.15±0.01 0.15±Cr 0.17±0.06 0.2±0.10 0.13±Cu 1.41±0.11 1.29±0.22 1.42±Fe 11.33±1.15 11.67±1.53 11.67Hg 0.007 0.007 0.007Ni 0.14±0.02 0.14±0.01 0.12±Pb 0.04±0.01 0.04±0.01 0.04Zn 13.27±1.31 13.9±2.84 15.23
379S. Brooks et al. / Science of the Total Environment 426 (2012) 375–386
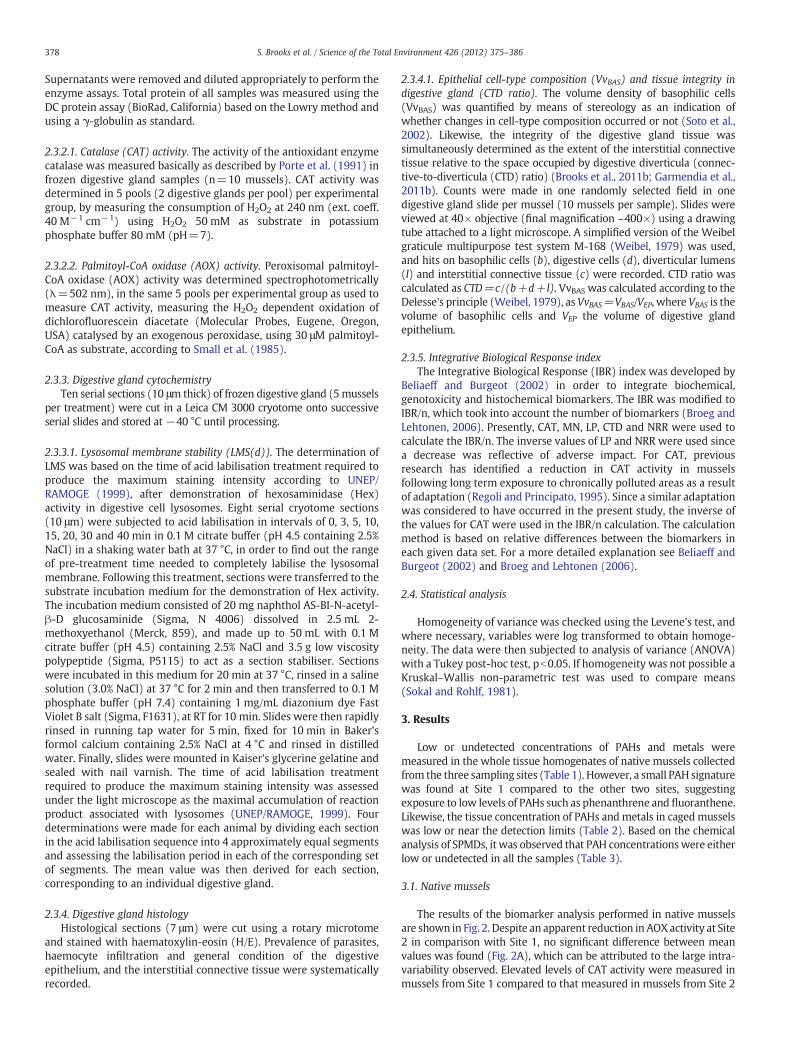
(ANOVA, Tukey, p>0.05). Lower CAT levels were also observed inmussels from Site 3, although due to higher variability no significantdifference to Site 1 was found (Fig. 2B). Although slightly higherincidence of MN was formed in mussels from Site 3 compared to theother two sites, no statistically significant differences were found(Fig. 2C, ANOVA, Tukey, p>0.05). The labilisation period (LP) oflysosomes from the digestive cells was significantly lower in musselsfrom the two exposure sites compared to Site 1 (Fig. 2D, ANOVA, Tukey,p>0.05). VvBAS values recorded in mussels from Site 3 were signifi-cantly higher than those recorded inmussels from Site 1 (Fig. 2E). VvBASvalues in Site 2 were higher but very variable and thus were notsignificantly different from those recorded in Site 1. Significantlyelevated CTD ratio was found in mussels from Sites 2 (0.29±0.095)and 3 (0.31±0.09) compared to the reference Site 1 (0.158±0.058)(ANOVA, Tukey, p>0.05; Fig. 2F). Significantly shorter NRR oflysosomes of haemocytes were observed in mussels collected fromSites 2 and 3 compared to Site 1 (ANOVA, Tukey, pb0.05, Fig. 2G).
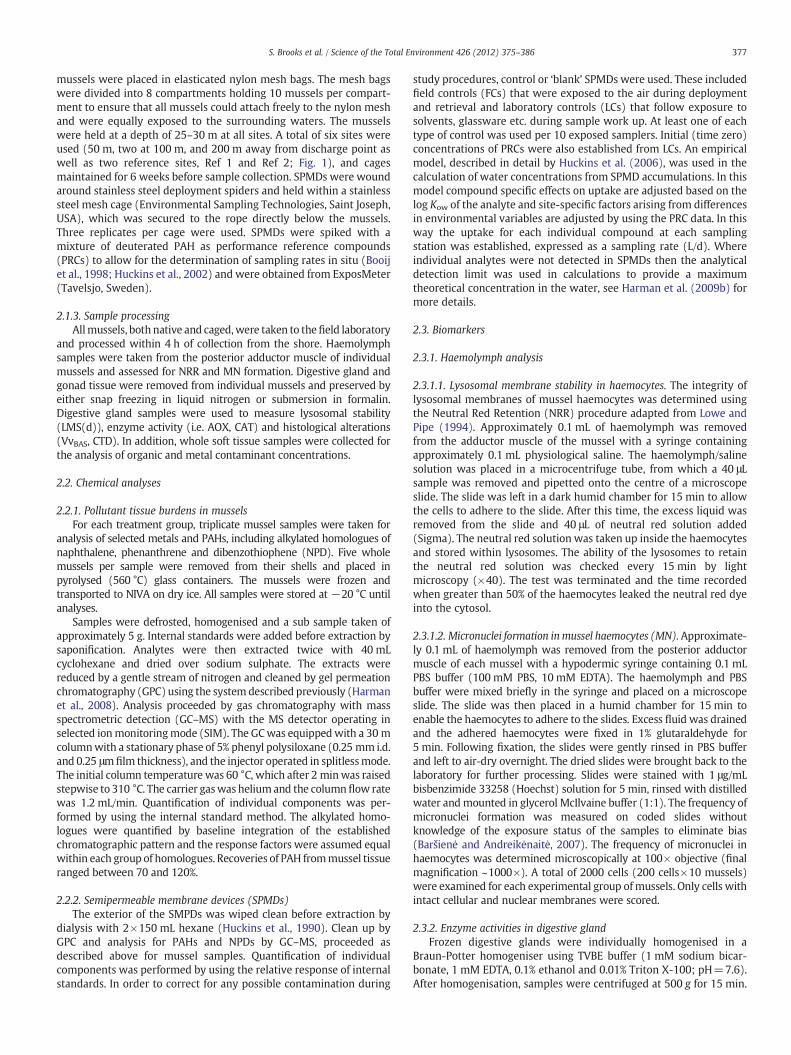
The digestive gland tissue presented a normal histologicalintegrity in the 3 sites with a well organised interstitial connectivetissue, apparently unaltered epithelia in stomach and digestive glandand food material being processed in the mid-gut lumen (Fig. 3A–C).Overall, no significant parasitic infestation or pathological lesionswere found. However, moderate thinning and vacuolisation of thedigestive gland epithelium as well as an apparent reduction in the
r 6 weeks at varying distances from the PW discharge outfall. Ten mussels were pooled=3).
200 m 1900 m (Ref 2) 2000 m (Ref 1)
b0.8 b0.8 b0.8b2 b2 2.6
0.42 b2 2.4 3.05±1.340.57 2.45±0.35 2.93±0.64 3.0±0.950.08 0.84±0.04 0.97±0.11 0.89±0.07
b2 b2 b20.42 3.0±0.36 3.5±0.4 2.9±0.36
b2 3.1 b2b0.5 b0.5 b0.5b2 b2 b2b2 b2 b2b2 3.3 2.1
7±2.31 b21.44±0.73 b23.67±1.59 b23.02±1.31b0.5 b0.5 b0.5b0.5 b0.5 b0.5b0.5 b0.5 b0.5b0.5 b0.5 b0.5
0.15 0.87±0.09 0.96±0.12 0.7±0.03b0.5 b0.5 b0.5b0.5 b0.5 b0.5b0.5 b0.5 b0.5b0.5 0.57 0.5b0.5 b0.5 b0.5b0.5 b0.5 b0.5b0.5 b0.5 b0.5b0.5 b0.5 b0.5b0.5 b0.5 b0.5b0.5 b0.5 b0.5b0.5 b0.5 b0.5
6±2.5 b29.81±0.81 b32.16±1.54 b31.22±1.32±0.37 b9.01±0.12 b9.26±0.21 b8.89±0.04
0.017666667 0.015 0.0113333331.01 3.27±0.12 3.6±0.66 3.13±0.320.09 2.75±0.14 2.91±0.06 2.88±0.080.01 0.14±0.01 0.16±0.01 0.15±0.020.06 0.17±0.06 0.1 0.17±0.060.14 1.26±0.35 1.79±0.41 1.47±0.26±0.58 11.33±0.58 11.0±1.0 11.33±0.58
0.007 0.008 0.0070.02 0.12±0.02 0.12±0.01 0.13±0.02
0.04 0.01 0.04±0.01 0.04±0.01±3.95 13.73±0.85 13.27±0.93 14.4±1.64

Table 3PAH concentrations measured in SPMDs that were placed for 6 weeks in the water column at varying distances from the PW discharge outlet. Data presented as mean±SD, n=3(ng/L), a=high blank values prevent reporting of this compound.
Compound 50 m 100 m 110 m 200 m 1900 m (Ref 2) 2000 m (Ref 1)
Naphthalene a a a a a aAcenaphthylene b0.07 b0.07 b0.07 b0.07 b0.07 b0.07Acenaphthene b0.19 b0.19 b0.19 b0.18 b0.19 b0.18Fluorene 0.26±0.01 0.23±0.06 0.25±0.08 0.12±0.02 0.15 0.12±0.03Dibenzothiophene 0.08 0.07±0.02 0.07±0.02 0.05±0.01 0.06 0.06±0.01Phenanthrene 0.94±0.04 0.89±0.26 0.87±0.25 0.61±0.16 0.82±0.1 0.75±0.11Anthracene b0.03 b0.03 0.04 b0.03 b0.03 b0.03Fluoranthene 0.15±0.01 0.14±0.02 0.14±0.02 0.14±0.01 0.28±0.02 0.25±0.03Pyrene 0.05 0.05 0.053±0.01 0.043±0.01 0.093±0.01 0.08±0.01Benz[a]anthracene b0.02 b0.02 b0.02 b0.02 b0.02 b0.02Chrysene b0.02 b0.02 b0.02 b0.02 0.033±0.01 0.025±0.01Benzo[b.j]fluoranthene b0.02 b0.02 b0.02 b0.02 0.03 0.023±0.01Benzo[k]fluoranthene b0.02 b0.02 b0.02 b0.02 b0.02 b0.02Benzo[e]pyrene b0.02 b0.02 b0.02 b0.02 b0.02 b0.02Benzo[a]pyrene b0.02 b0.02 b0.02 b0.02 b0.02 b0.02Perylene 0.04 0.07 b0.02 b0.02 b0.02 0.04Indeno[1,2,3-cd]pyrene 0.07 b0.02 b0.02 b0.02 0.04 0.03Dibenzo[ac/ah]anthracene 0.03 b0.02 b0.02 b0.02 b0.02 b0.02Benzo[g,h,I]perylene 0.05 b0.02 b0.02 b0.02 0.03 b0.03SUM PAH b2.06±0.08 b1.91±0.36 b1.92±0.43 b1.43±0.22 b1.92±0.16 b1.77±0.22PAH EPA16 b1.93±0.07 b1.78±0.35 b1.81±0.40 b1.35±0.21 b1.82±0.15 b1.67±0.21
380 S. Brooks et al. / Science of the Total Environment 426 (2012) 375–386
size of the digestive alveoli were recorded in all the mussels fromSites 2 and 3 (Fig. 3B and C).
The IBR/n index was calculated from star plots of normalisedbiomarker data from, CAT, MN, LP, CTD and NRR (Fig. 4). The IBR/nwas close to zero at site 1, with only MN showing any response. Formussels at Site 2, CAT, LP, CTD and NRR showed almost equalcontribution to the IBR/n (0.95). The highest IBR/n value wasobtained at site 3 (1.43) with all five biomarkers contributing almostequally.
3.2. Caged mussels
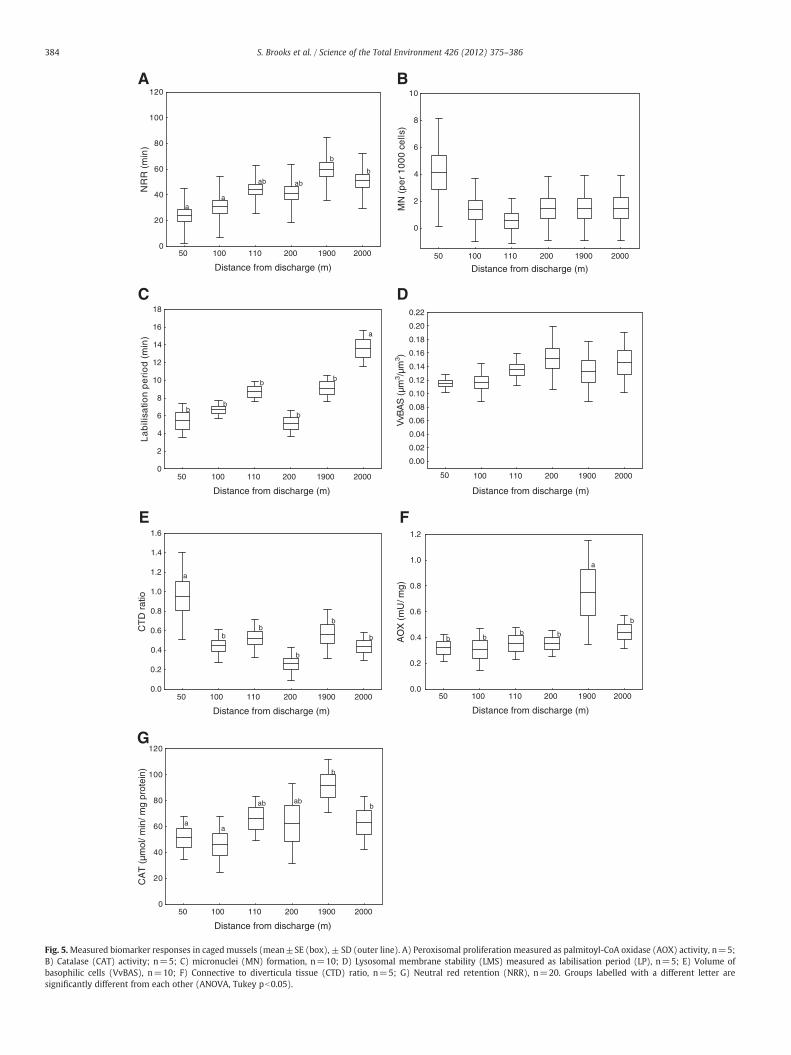
It should be noted that 20% mortality was recorded in the cagedmussels after their 6 weeks exposure. A significant reduction in NRRwas found in mussels caged 50 m and 100 m from the dischargecompared to the reference sites at 1900 m and 2000 m (ANOVA,Tukey pb0.05; Fig. 5A). The frequency of MNwas higher at the closestsite to the PW discharge (50 m), although no significant differencesbetween the groups were found (Fig. 5B). LP values were significantlyhigher in mussels from the station furthest from the discharge(2000 m) compared to all other groups (ANOVA, Tukey pb0.05;Fig. 5C), although significantly lower LP values (b6 min) wererecorded in mussels caged 50 m and 200 m from the discharge.VvBAS values were above 0.10 μm3/μm3 in all caged mussels, with nosignificant difference between the groups (Fig. 5D). Significantdifferences were found in the CTD ratio with a maximum value inmussels caged at 50 m from the PW discharge point and lowest inthose caged at 200 m (ANOVA, Tukey pb0.05; Fig. 5E). AOX activitiesat one of the reference stations, 1900 m from the discharge, weresignificantly higher than all other stations (ANOVA, Tukey pb0.05).The other stations had very low AOX activities (b0.5; Fig. 5F). CATactivity was lowest in mussels 100 m from the discharge outlet,which was significantly lower than CAT activity in mussels 1900 maway (ANOVA, Tukey pb0.05; Fig. 5B).
In general terms, the digestive gland tissue of mussels caged1900 m from discharge and 2000 m from discharge (Fig. 3D and E)exhibited a histological integrity similar to that observed in the nativeshore mussels from Site 1 (Fig. 3A). In contrast, mussels held in cagesat 50 m (Fig. 3F), had alterations in digestive gland tissue thatincluded a certain reduction in the extent of the diverticular mass,disorganisation of the ICT and thinning of the epithelium in the
digestive alveoli beyond that found in native mussels from Sites 2 and3 (Fig. 3B and C).
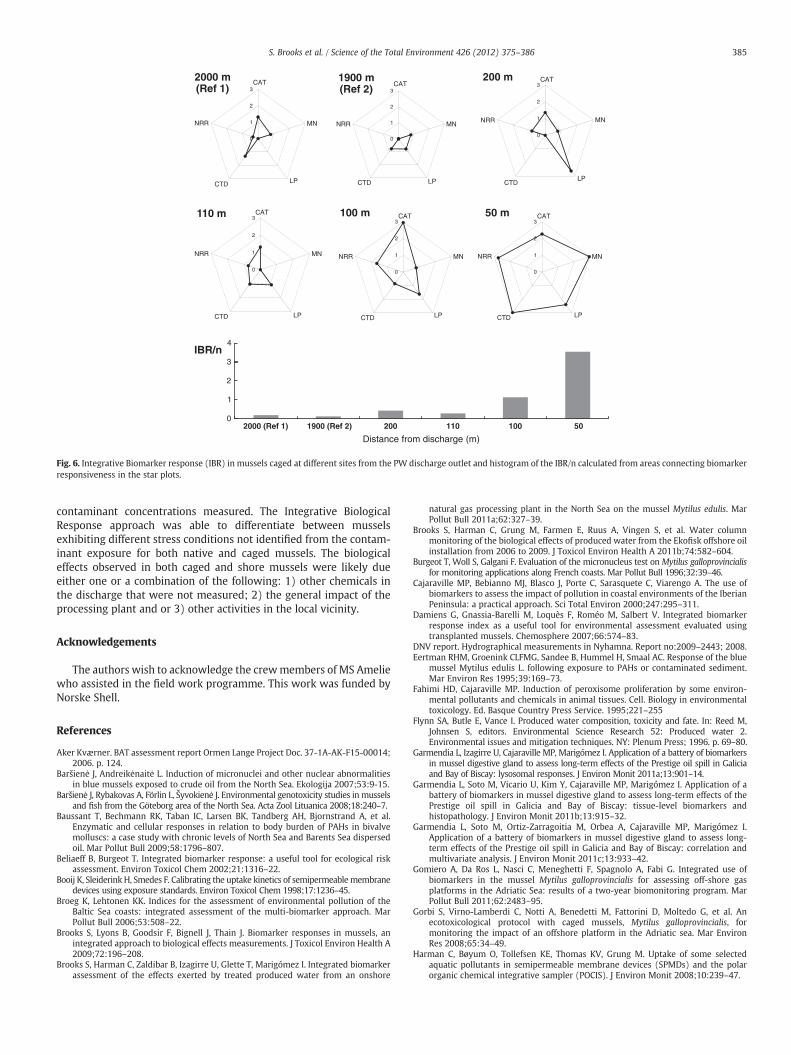
The IBR/n index was calculated from star plots of normalisedbiomarker data from, CAT, MN, LP, CTD and NRR (Fig. 6). The IBR/nwas close to zero at the reference stations increasing with increasedproximity to the discharge outlet. Highest IBR/n of approximately 3.5was found in mussels 50 m from the discharge with almost equalcontributions shown by CAT, MN, LP, CTD and NRR.
4. Discussion
The overall aim of the monitoring study was to determine thebiological effects of the Ormen Lange PW discharge on the localmarine environment using native (long-term response) and caged(short-term response) mussels in combination. Caged mussels havebeen successfully used in exposure studies to offshore PW dischargeswhere they have been shown to bioaccumulate PAH compounds andshow sensitive biological responses, which have led to theircontinued use in the Norwegian offshore water column monitoringprogramme (Hylland et al., 2008; Brooks et al., 2011a). However,despite the clear differences in many of the biological endpointsmeasured, discussed below, the mussel body burden data (PAH,metals) did not show any differences between the sites or betweencages and were either low or undetected in all cases. Due to thetreatment system installed at Ormen Lange (biological treatment andMPPE) the concentration of chemicals released to the environment islow and typical oil related compounds are almost undetected in thereceiving waters using chemical methods (Brooks et al., 2011b). It isalso conceivable that the changes in biological endpoints were notcaused by either elevated concentrations of PAHs or metals, butrather other contaminants that were not measured in this study.Monitoring the environmental effects of a complex mixture at suchlow concentrations in the complexity of the field may not be effectiveusing chemical methods. However, as shown in a previous study(Brooks et al., 2011b) the application of a suite of sensitive andintegrative biomarker endpoints is able to clearly differentiatebetween groups of healthy and stressed mussels.
4.1. Biomarkers in native mussels
The biological effects data have shown clear differences in theoverall health status of the native mussels from the three sites, with
0
1
2
3
4
5
6
MN
freq
uenc
y (M
N/1
000
cells
)
2
4
6
8
10
12
14
16
18
20
22
Labi
lisat
ion
perio
d (m
in)
bb
a
0.04
0.06
0.08
0.10
0.12
0.14
0.16
0.18
VvB
AS
(µm
3 /µm
3 ) bab
a
0.05
0.10
0.15
0.20
0.25
0.30
0.35
0.40
0.45
CT
D R
AT
IO
a
bb
0.6
0.8
1.0
1.2
1.4
1.6
1.8
2.0
AO
X (
mU
/mg)
0
0.02
0.04
0.06
0.08
0.1
0.12
0.14
0.16
CA
T (
mm
l/ m
in/ m
g pr
otei
n)
b ab
a
Site 1 Site 2 Site 3
Site 1 Site 2 Site 3
Site 1 Site 2 Site 3
Site 1 Site 2 Site 3
Site 1 Site 2 Site 3
Site 1 Site 2 Site 3
Site 1 Site 2 Site 3
0
10
20
30
40
50
60
70
80
90
100
NR
R (
min
)
a
bb
A B
C D
E
G
F
Fig. 2. Measured biomarker responses in native mussels collected from the three coastal sites (mean±SE (box), ± SD (outer line). A) Neutral red retention (NRR), n=20;B) micronuclei (MN) formation, n=10; C) Lysosomal membrane stability (LMS) measured as labilisation period (LP), n=5; D) Volume of basophilic cells (VvBAS), n=10;E) Connective to diverticula tissue (CTD) ratio, n=5; F) Peroxisome proliferation measured as palmitoyl-CoA oxidase (AOX) activity, n=5; G) Catalase (CAT) activity, n=5. Groupslabelled with a different letter are significantly different from each other (ANOVA, Tukey pb0.05).
381S. Brooks et al. / Science of the Total Environment 426 (2012) 375–386
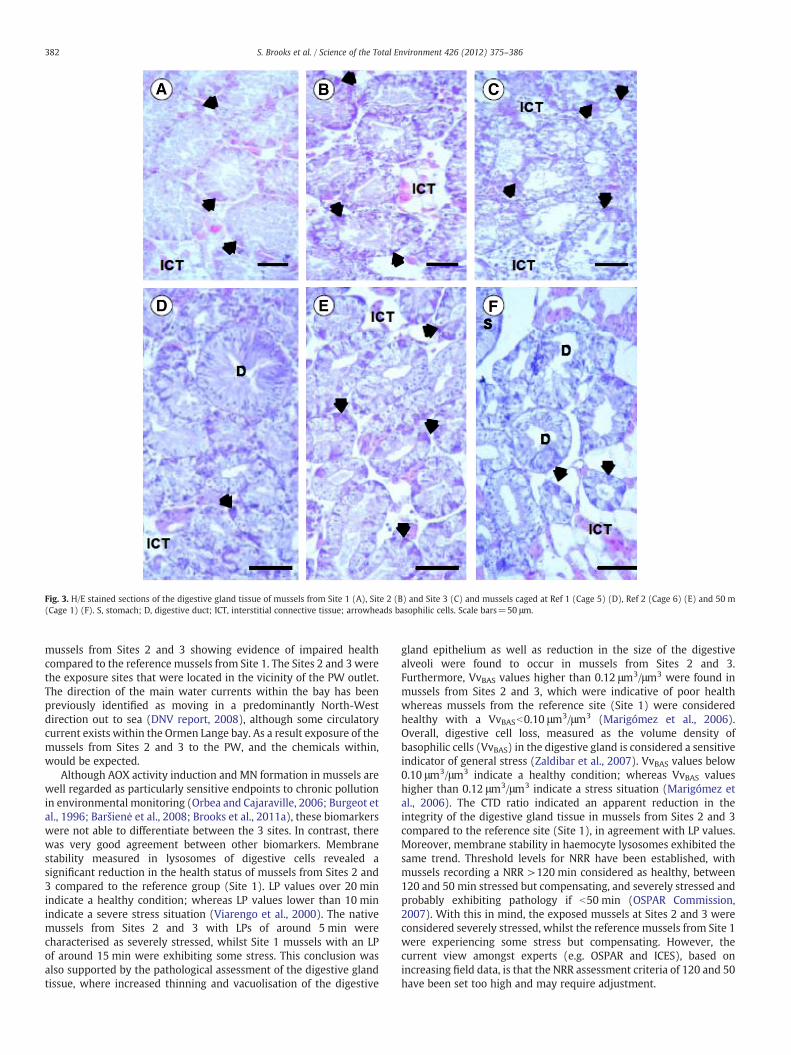
Fig. 3. H/E stained sections of the digestive gland tissue of mussels from Site 1 (A), Site 2 (B) and Site 3 (C) and mussels caged at Ref 1 (Cage 5) (D), Ref 2 (Cage 6) (E) and 50 m(Cage 1) (F). S, stomach; D, digestive duct; ICT, interstitial connective tissue; arrowheads basophilic cells. Scale bars=50 μm.
382 S. Brooks et al. / Science of the Total Environment 426 (2012) 375–386
mussels from Sites 2 and 3 showing evidence of impaired healthcompared to the reference mussels from Site 1. The Sites 2 and 3 werethe exposure sites that were located in the vicinity of the PW outlet.The direction of the main water currents within the bay has beenpreviously identified as moving in a predominantly North-Westdirection out to sea (DNV report, 2008), although some circulatorycurrent exists within the Ormen Lange bay. As a result exposure of themussels from Sites 2 and 3 to the PW, and the chemicals within,would be expected.
Although AOX activity induction and MN formation in mussels arewell regarded as particularly sensitive endpoints to chronic pollutionin environmental monitoring (Orbea and Cajaraville, 2006; Burgeot etal., 1996; Baršienė et al., 2008; Brooks et al., 2011a), these biomarkerswere not able to differentiate between the 3 sites. In contrast, therewas very good agreement between other biomarkers. Membranestability measured in lysosomes of digestive cells revealed asignificant reduction in the health status of mussels from Sites 2 and3 compared to the reference group (Site 1). LP values over 20 minindicate a healthy condition; whereas LP values lower than 10 minindicate a severe stress situation (Viarengo et al., 2000). The nativemussels from Sites 2 and 3 with LPs of around 5 min werecharacterised as severely stressed, whilst Site 1 mussels with an LPof around 15 min were exhibiting some stress. This conclusion wasalso supported by the pathological assessment of the digestive glandtissue, where increased thinning and vacuolisation of the digestive
gland epithelium as well as reduction in the size of the digestivealveoli were found to occur in mussels from Sites 2 and 3.Furthermore, VvBAS values higher than 0.12 μm3/μm3 were found inmussels from Sites 2 and 3, which were indicative of poor healthwhereas mussels from the reference site (Site 1) were consideredhealthy with a VvBASb0.10 μm3/μm3 (Marigómez et al., 2006).Overall, digestive cell loss, measured as the volume density ofbasophilic cells (VvBAS) in the digestive gland is considered a sensitiveindicator of general stress (Zaldibar et al., 2007). VvBAS values below0.10 μm3/μm3 indicate a healthy condition; whereas VvBAS valueshigher than 0.12 μm3/μm3 indicate a stress situation (Marigómez etal., 2006). The CTD ratio indicated an apparent reduction in theintegrity of the digestive gland tissue in mussels from Sites 2 and 3compared to the reference site (Site 1), in agreement with LP values.Moreover, membrane stability in haemocyte lysosomes exhibited thesame trend. Threshold levels for NRR have been established, withmussels recording a NRR >120 min considered as healthy, between120 and 50 min stressed but compensating, and severely stressed andprobably exhibiting pathology if b50 min (OSPAR Commission,2007). With this in mind, the exposed mussels at Sites 2 and 3 wereconsidered severely stressed, whilst the reference mussels from Site 1were experiencing some stress but compensating. However, thecurrent view amongst experts (e.g. OSPAR and ICES), based onincreasing field data, is that the NRR assessment criteria of 120 and 50have been set too high and may require adjustment.

0.0
1.0
2.0
3.0CAT
MN
LPCTD
NRR
Site 1
0.0
1.0
2.0
3.0CAT
MN
LPCTD
NRR
Site 2
0.0
1.0
2.0
3.0CAT
MN
LPCTD
NRR
Site 3
0
0.5
1
1.5
2
1 2 3
IBR/n
Fig. 4. Integrative Biomarker response (IBR) in native mussels collected from the threecoastal sites and histogram of the IBR/n calculated from areas connecting biomarkerresponsiveness in the star plots.
383S. Brooks et al. / Science of the Total Environment 426 (2012) 375–386
Although clear differences in health status were found between thereference mussels and those collected from the two sites within theOrmen Lange bay area, the mussels from the reference site were foundto exhibit a low level stress response, identified from the LMS of bothhaemocytes and digestive cells. Nevertheless, the reference values forLMS in the digestive gland, which was used in this study, wereestablished for M. galloprovincialis from the Bay of Biscay. These varywith season with baseline VvBAS below 0.10 μm3/μm3 in summer butbelow 0.05 in spring and autumn (Marigómez et al., 2006). Thus, itcannot be disregarded that baseline VvBAS values in North SeaM. edulisin late summer–autumn might be lower than 0.10 μm3/μm3 andtherefore also mussels from Site 1 might be subjected to some sourceof environmental stress, although to a much lesser extent than Sites 2and 3. The reason for the possible stress response in the referencemussels is not known, although it may suggest an additional source ofexposure, such as fromanearby river, whichhas not yet been identified,or from other industrial and/or man-made activities. Fish farmingactivity using large cages of salmon and/or trout has been identified inthe rough vicinity of the reference site. Potential impacts of fish farmingpractices on the local environment such as, organic loading, oxygendepletion, copper exposure from fish nets, and anti-parasitic drugs havebeen well documented (Wu, 1995) and may be a potential source ofstressor to the reference mussels. Likewise, it is worth noting that asmall PAH signature was found at Site 1 suggesting exposure to lowlevels of phenanthrene and fluoranthene.
The present biomarker approach, including the calculation of theintegrative IBR/n index, succeeded in distinguishing Site 1 from Site 2and Site 3. In a previous study, IBR/n enabled mussel health status tobe fully assessed after exposure to low concentrations of PW underlaboratory conditions with individual chemicals at very low concen-trations or below their detection limits (Brooks et al., 2011b). Awarethat different biomarker arrangements on the star plots producedifferent IBR/n values (Broeg and Lehtonen, 2006), biomarkers wereorderly represented in the five axes of start plots according to theirbiological complexity level. Star plots revealed details about theprofile of the biological responses at each site, which were verysimilar in Site 2 and Site 3, with the exception of the lack of MN signalin Site 2 that accounts for a slightly lower IBR/n. However, due to theposition of Sites 2 and 3 in relation to the PW outlet, and the lack of
contaminant support data available, it was not possible to entirelyattribute the PW discharge as the source of the effects but rather thegeneral impact of the Ormen Lange processing plant.
4.2. Biomarkers in caged mussels
The biomarker data for the caged mussels showed a goodrelationship between biological response and distance from the PWdischarge outlet, with increasing signs of stress and poor health inmussels closest to the discharge compared to the reference groups(2000 m and 1900 m). However, 20% mortality in all caged musselsindicates that the mussels used were unduly stressed. The source ofthe caged mussels was a local mussel farm. Transplanting thesemussels into their new environment combined with handling andtransport pressures was thought to be the main factor in the higherthan expected mortalities (Nigro et al., 2006; Orbea and Cajaraville,2006; Gorbi et al., 2008). This is also likely to impact on some of thebiomarkers measured including LP, VvBAS, and NRR as describedbelow. LP values below 15 min, as found in both reference groups,suggest a certain degree of environmental stress, although LP waseven lower in mussels closer to the PW discharge. Accordingly, VvBASvalues were always over 0.12 μm3/μm3. As previously mentioned,baseline and critical values need to be properly fixed for North seaM. edulis. In any case, VvBAS seems to be a less sensitive parameter incaged mussels in this study. NRR in all groups, including referencegroups, were below 60 min indicating stress. Although, significantlylower responses were found in the closest two stations (50 and100 m). MN was only elevated in mussels closest to the outlet, whilstat all other groups had MN typical of North Sea backgroundconcentrations (Baršienė et al., 2008).
Overall, differences in the biomarkers were observed amongstmussels caged at different distances from the PW outlet, with highesteffects at 50 m and lowest effects at the reference sites, which wasreflected in the IBR/n health index. Conversely, like in the case ofnative mussels, the concentration of PAHs in water (measuredthrough the use of SPMDs) and PAHs and metals in mussel tissueswere generally below or around detection limits and did not show aclear relationship with the biomarkers or the IBR/n index. The IBR/nindex also provided clear signals of the biological effects of PW atexposure levels in the laboratory in which the concentration ofindividual chemicals in water and mussel tissues was low or belowthe detection limits (Brooks, et al., 2011b). Star plots revealed detailsabout the profile of the biological responses elicited in mussels cagedat different distances from the PW outlet with a clear increase in IBR/nfor mussels at the closest station (50 m) and also at 100 m. IBR/nvalues in mussels at 110 and 200 m from the PW outlet were moresimilar to the mussels from the reference station. The differencebetween mussels at 100 and 110 m may be related to exposure to theplume with the former mussel group more in the path of the plumecompared to the latter. However, the background concentrations ofchemicalsmeasured in themussels and passive sampling devices doesnot provide supporting information for this. Comparison of the IBR/nof shore and cagedmussels shows that the cagedmussels at 50 m fromthe discharge outlet were the most affected with an IBR/n approxi-mately 3 times that of all other mussel groups. The IBR/n for theexposed shore mussels was of similar value to caged mussels held100 m from the discharge.
4.3. Concluding remarks
There was good agreement found between the biological effectmeasurements showing that native shore mussels collected from Site1 were significantly healthier than mussels from Sites 2 and 3.Likewise, mussels caged at longer distances from the PW outlet werehealthier than those caged nearby the discharge outlet. However, norelationship was found between the biological effects and the
50 100 110 200 1900 2000
Distance from discharge (m)
50 100 110 200 1900 2000
Distance from discharge (m)
50 100 110 200 1900 2000
Distance from discharge (m)
50 100 110 200 1900 2000
Distance from discharge (m)
50 100 110 200 1900 2000
Distance from discharge (m)
50 100 110 200 1900 2000
Distance from discharge (m)
50 100 110 200 1900 2000
Distance from discharge (m)
0
20
40
60
80
100
120
NR
R (
min
)
a
b
ababb
a
0
2
4
6
8
10
MN
(p
er
10
00
ce
lls)
0
2
4
6
8
10
12
14
16
18
La
bili
satio
n p
eri
od
(m
in) a
b
b
b
b
b
0.00
0.02
0.04
0.06
0.08
0.10
0.12
0.14
0.16
0.18
0.20
0.22
0.0
0.2
0.4
0.6
0.8
1.0
1.2
1.4
1.6
CT
D r
atio
b bb
b
b
a
0.0
0.2
0.4
0.6
0.8
1.0
1.2
AO
X (
mU
/ mg
)
a
b
b
bbb
0
20
40
60
80
100
120
CA
T (
µmol
/ min
/ mg
prot
ein)
ab
b
b
a
ab
a
VvB
AS
(µm
3 /µm
3 )
A B
C D
E
G
F
Fig. 5.Measured biomarker responses in caged mussels (mean±SE (box), ± SD (outer line). A) Peroxisomal proliferation measured as palmitoyl-CoA oxidase (AOX) activity, n=5;B) Catalase (CAT) activity; n=5; C) micronuclei (MN) formation, n=10; D) Lysosomal membrane stability (LMS) measured as labilisation period (LP), n=5; E) Volume ofbasophilic cells (VvBAS), n=10; F) Connective to diverticula tissue (CTD) ratio, n=5; G) Neutral red retention (NRR), n=20. Groups labelled with a different letter aresignificantly different from each other (ANOVA, Tukey pb0.05).
384 S. Brooks et al. / Science of the Total Environment 426 (2012) 375–386
0
1
2
3
4
2000 (Ref 1) 1900 (Ref 2) 200 110 100 50
IBR/n
Distance from discharge (m)
0
1
2
3CAT
MN
LPCTD
NRR
200 m
0
1
2
3CAT
MN
LPCTD
NRR
100 m
0
1
2
3CAT
MN
LPCTD
NRR
110 m
0
1
2
3CAT
MN
LPCTD
NRR
50 m
0
1
2
3CAT
MN
LPCTD
NRR
2000 m(Ref 1)
0
1
2
3CAT
MN
LPCTD
NRR
1900 m(Ref 2)
Fig. 6. Integrative Biomarker response (IBR) in mussels caged at different sites from the PW discharge outlet and histogram of the IBR/n calculated from areas connecting biomarkerresponsiveness in the star plots.
385S. Brooks et al. / Science of the Total Environment 426 (2012) 375–386
contaminant concentrations measured. The Integrative BiologicalResponse approach was able to differentiate between musselsexhibiting different stress conditions not identified from the contam-inant exposure for both native and caged mussels. The biologicaleffects observed in both caged and shore mussels were likely dueeither one or a combination of the following: 1) other chemicals inthe discharge that were not measured; 2) the general impact of theprocessing plant and or 3) other activities in the local vicinity.
Acknowledgements
The authors wish to acknowledge the crewmembers of MS Ameliewho assisted in the field work programme. This work was funded byNorske Shell.
References
Aker Kværner. BAT assessment report Ormen Lange Project Doc. 37-1A-AK-F15-00014;2006. p. 124.
Baršienė J, Andreikėnaitė L. Induction of micronuclei and other nuclear abnormalitiesin blue mussels exposed to crude oil from the North Sea. Ekologija 2007;53:9-15.
Baršienė J, Rybakovas A, Förlin L, Šyvokienė J. Environmental genotoxicity studies in musselsand fish from the Göteborg area of the North Sea. Acta Zool Lituanica 2008;18:240–7.
Baussant T, Bechmann RK, Taban IC, Larsen BK, Tandberg AH, Bjornstrand A, et al.Enzymatic and cellular responses in relation to body burden of PAHs in bivalvemolluscs: a case study with chronic levels of North Sea and Barents Sea dispersedoil. Mar Pollut Bull 2009;58:1796–807.
Beliaeff B, Burgeot T. Integrated biomarker response: a useful tool for ecological riskassessment. Environ Toxicol Chem 2002;21:1316–22.
Booij K, Sleiderink H, Smedes F. Calibrating the uptake kinetics of semipermeablemembranedevices using exposure standards. Environ Toxicol Chem 1998;17:1236–45.
Broeg K, Lehtonen KK. Indices for the assessment of environmental pollution of theBaltic Sea coasts: integrated assessment of the multi-biomarker approach. MarPollut Bull 2006;53:508–22.
Brooks S, Lyons B, Goodsir F, Bignell J, Thain J. Biomarker responses in mussels, anintegrated approach to biological effects measurements. J Toxicol Environ Health A2009;72:196–208.
Brooks S, Harman C, Zaldibar B, Izagirre U, Glette T, Marigómez I. Integrated biomarkerassessment of the effects exerted by treated produced water from an onshore
natural gas processing plant in the North Sea on the mussel Mytilus edulis. MarPollut Bull 2011a;62:327–39.
Brooks S, Harman C, Grung M, Farmen E, Ruus A, Vingen S, et al. Water columnmonitoring of the biological effects of produced water from the Ekofisk offshore oilinstallation from 2006 to 2009. J Toxicol Environ Health A 2011b;74:582–604.
Burgeot T, Woll S, Galgani F. Evaluation of the micronucleus test on Mytilus galloprovincialisfor monitoring applications along French coasts. Mar Pollut Bull 1996;32:39–46.
Cajaraville MP, Bebianno MJ, Blasco J, Porte C, Sarasquete C, Viarengo A. The use ofbiomarkers to assess the impact of pollution in coastal environments of the IberianPeninsula: a practical approach. Sci Total Environ 2000;247:295–311.
Damiens G, Gnassia-Barelli M, Loquès F, Roméo M, Salbert V. Integrated biomarkerresponse index as a useful tool for environmental assessment evaluated usingtransplanted mussels. Chemosphere 2007;66:574–83.
DNV report. Hydrographical measurements in Nyhamna. Report no:2009–2443; 2008.Eertman RHM, Groenink CLFMG, Sandee B, Hummel H, Smaal AC. Response of the blue
mussel Mytilus edulis L. following exposure to PAHs or contaminated sediment.Mar Environ Res 1995;39:169–73.
Fahimi HD, Cajaraville MP. Induction of peroxisome proliferation by some environ-mental pollutants and chemicals in animal tissues. Cell. Biology in environmentaltoxicology. Ed. Basque Country Press Service. 1995;221–255
Flynn SA, Butle E, Vance I. Produced water composition, toxicity and fate. In: Reed M,Johnsen S, editors. Environmental Science Research 52: Produced water 2.Environmental issues and mitigation techniques. NY: Plenum Press; 1996. p. 69–80.
Garmendia L, Izagirre U, Cajaraville MP, Marigómez I. Application of a battery of biomarkersin mussel digestive gland to assess long-term effects of the Prestige oil spill in Galiciaand Bay of Biscay: lysosomal responses. J Environ Monit 2011a;13:901–14.
Garmendia L, Soto M, Vicario U, Kim Y, Cajaraville MP, Marigómez I. Application of abattery of biomarkers in mussel digestive gland to assess long-term effects of thePrestige oil spill in Galicia and Bay of Biscay: tissue-level biomarkers andhistopathology. J Environ Monit 2011b;13:915–32.
Garmendia L, Soto M, Ortiz-Zarragoitia M, Orbea A, Cajaraville MP, Marigómez I.Application of a battery of biomarkers in mussel digestive gland to assess long-term effects of the Prestige oil spill in Galicia and Bay of Biscay: correlation andmultivariate analysis. J Environ Monit 2011c;13:933–42.
Gomiero A, Da Ros L, Nasci C, Meneghetti F, Spagnolo A, Fabi G. Integrated use ofbiomarkers in the mussel Mytilus galloprovincialis for assessing off-shore gasplatforms in the Adriatic Sea: results of a two-year biomonitoring program. MarPollut Bull 2011;62:2483–95.
Gorbi S, Virno-Lamberdi C, Notti A, Benedetti M, Fattorini D, Moltedo G, et al. Anecotoxicological protocol with caged mussels, Mytilus galloprovincialis, formonitoring the impact of an offshore platform in the Adriatic sea. Mar EnvironRes 2008;65:34–49.
Harman C, Bøyum O, Tollefsen KE, Thomas KV, Grung M. Uptake of some selectedaquatic pollutants in semipermeable membrane devices (SPMDs) and the polarorganic chemical integrative sampler (POCIS). J Environ Monit 2008;10:239–47.
386 S. Brooks et al. / Science of the Total Environment 426 (2012) 375–386
Harman C, Holth TF, Hylland K, Thomas K, Grung M. Relationship between polycyclicaromatic hydrocarbon (PAH) accumulation in semipermeable membrane devicesand PAH bile metabolite levels in Atlantic Cod (Gadus morhua). J Toxicol EnvironHealth A 2009a;72:234–43.
Harman C, Thomas KV, Tollefsen KE, Meier S, Bøyum O, Grung M. Monitoring the freelydissolved concentrations of polycyclic aromatic hydrocarbons (PAH) and alkyl-phenols (AP) around a Norwegian oil platform by holistic passive sampling. MarPollut Bull 2009b;58:1671–9.
Huckins J, Tubergen M, Lebo J, Gale R, Schwartz T. Polymeric film dialysis in organic solventmedia for cleanup of organic contaminants. J Assoc Off Anal Chem 1990;73:290–3.
Huckins J, Petty JD, Lebo JA, Almeida FV, Booij K, Alvarez DA, et al. Development of thepermeability/performance reference compound approach for in situ calibration ofsemipermeable membrane devices. Environ Sci Technol 2002;36:85–91.
Huckins J, Petty JD, Booij K. Monitors of organic chemicals in the environment. NewYork: Springer; 2006. 223 pp.
Hylland K, Tollefsen KE, Ruus A, Jonsson G, Sundt RC, Sanni S, et al. Water columnmonitoring near oil installations in the North Sea 2001–2004. Mar Pollut Bull2008;56:414–29.
ICES. Biological effects of contaminants: measurement of lysosomal membranestability. In: Moore MN, Lowe D, Köhler A, editors. ICES techniques in MarineEnvironmental Sciences, No.36. ; 2004. 31 pp.
Johnsen S, Roe TI, Garland E, de Vals B, Campbell J. Environmental fate and effects ofcontaminants in produced water. Society of Petroleum Engineers InternationalConference on Health, Safety and Environment in Oil and gas Exploration andProduction, Calgary, Alberta (Canada); SPE 86708; 2004. 9 pp.
Lowe DM, Pipe RK. Contaminant induced lysosomal membrane damage in marinemussel digestive cells: an in vitro study. Aquat Toxicol 1994;30:357–65.
Marigómez I, Soto M, Cajaraville MP, Angulo E, Giamberini L. Cellular and subcellulardistribution of metals in molluscs. Microsc Res Tech 2002;56:358–92.
Marigómez I, Lekube X, Cajaraville MP, Domouhtsidou GP, Dimitriadis VK. Comparisonof cytochemical procedures to estimate lysosomal biomarkers in mussel digestivecells. Aquat Toxicol 2005;75:86–95.
Marigómez I, Soto M, Cancio I, Orbea A, Garmendia L, Cajaraville MP. Cell and tissuebiomarkers in mussel, and histopathology in hake and anchovy from Bay of Biscay afterthe Prestige oil spill (Monitoring Campaign 2003). Mar Pollut Bull 2006;53:287–304.
Neff JM. Bioaccumulation in marine organisms: effects of contaminants from oil wellproduced water. Amsterdam: Elsevier Sci Publ; 2002. 452 pp.
Nigro M, Falleni A, Del Barga I, Scarcelli V, Lucchesi P, Regoli F, et al. Cellular biomarkersfor monitoring estuarine environments: transplanted versus native mussels. AquatToxicol 2006;77:339–47.
Orbea A, Cajaraville MP. Peroxisome proliferation and antioxidant enzymes intransplanted mussels of four Basque estuaries with different levels of PAH andPCB pollution. Environ Toxicol Chem 2006;25:1616–26.
OSPAR Commission. Lysosomal stability as a global health status indicator in biomonitoring.Chapter 4Background document for biological effects monitoring techniques, 333.OSPAR Commission Assessment and Monitoring Series; 2007. p. 20–6.
Porte C, Sole M, Albaigés J, Livingstone DR. Responses of mixed-function oxygenase andantioxidase enzyme system of Mytilus sp. to organic pollution. Comp BiochemPhysiol C 1991;100:183–6.
Pytharopoulou S, Sazakli E, Grintzalis K, Georgiou CD, Leotsinidis M, Kalpaxis DL.Translational responses of Mytilus galloprovincialis to environmental pollution:integrating the responses to oxidative stress and other biomarker responses into ageneral stress index. Aquat Toxicol 2008;89:18–27.
Raftopoulou EK, Dimitriadis VK. Assessment of the health status of mussels Mytilusgalloprovincialis along Thermaikos Gulf (Northern Greece): an integrative biomarkerapproach using ecosystem health indices. Ecotoxicol Environ Saf 2010;73:1580–7.
Regoli F, Principato G. Glutathione, glutathione-dependent and antioxidant enzymes inmussel, Mytilus galloprovincialis, exposed to metals under field and laboratoryconditions: implications for the use of biochemical biomarkers. Aquat Toxicol1995;31:143–64.
Roe Utvik TI. Chemical characterisation of produced water from four offshore oilproduction platforms in the North Sea. Chemosphere 1999;39:2593–606.
Small GM, Burdett K, Connock MJ. A sensitive spectrophotometric assay forperoxisomal acyl-CoA oxidase. Biochem J 1985;227:205–10.
Sokal RR, Rohlf FJ. Biometry. New York: W.H. Freeman and Co; 1981. pp. 1–859.Soto M, Zaldibar B, Cancio I, Taylor MG, Turner M, Morgan AJ, et al. Subcellular
distribution of cadmium and its cellular ligands in mussel digestive gland asrevealed by combined autometallography and X-ray microprobe analysis.Histochem J 2002;34:273–80.
Stephens SM, Brown JA, Fergusson MA. Sub-lethal effects of oil-produced water on theearly life stages of turbot. In: Reed M, Johnsen S, editors. Environmental ScienceResearch 52: Produced water 2. Environmental issues and mitigation techni-quesNY: Plenum Press; 1996. p. 101–12.
Stephens SM, Frankling SC, Stagg RM, Brown JA. Sub-lethal effects of exposure ofjuvenile turbot to oil produced water. Mar Pollut Bull 2000;40:928–37.
UNEP/RAMOGE. Manual on the biomarkers recommended for the MED POLbiomonitoring programme. Athens: UNEP; 1999.
Viarengo A, Lafaurie M, Gabrielides GP, Fabbri R, Marro A, Romeo M. Critical evaluationof an intercalibration exercise undertaken in the framework of the MED POLbiomonitoring program. Mar Environ Res 2000;49:1-18.
Weibel ER. Stereological methods. London: Academic Press; 1979. p. 415.Wu RSS. The environmental impact of marine fish culture: towards a sustainable
future. Mar Pollut Bull 1995;31:159–66.Zaldibar B, Cancio I, Marigómez I. Reversible alterations in epithelial cell turnover in
digestive gland of winkles (Littorina littorea) exposed to cadmium and theirimplications for biomarkers measurements. Aquat Toxicol 2007;81:183–96.
Zhao L, Chen Z, Lee K. A risk assessment model for produced water discharge from offshorepetroleum platforms-development and validation. Mar Pollut Bull 2008;56:1890–7.