integrated assessment of black carbon and tropospheric...
TRANSCRIPT

Integrated Assessmentof Black Carbonand Tropospheric OzoneSummary for Decision Makers

A complete elaboration of the topics covered in this summary can be found in the Integrated Assessment of Black Carbon and Tropospheric Ozone report and in the fully referenced underlying research, analyses and reports.
For details of UNEP’s regional and sub-regional areas referred to throughout this document see http://geodata.grid.unep.ch/extras/geosubregions.php.
© Copyright: UNEP and WMO 2011 – Integrated Assessment of Black Carbon and Tropospheric Ozone: Summary for Decision Makers.
Disclaimers
The views expressed in this document are not necessarily those of the agencies cooperating in this project. The designations employed and the presentation do not imply the expression of any opinion whatsoever on the part of UNEP and WMO concerning the legal status of any country, territory or city or its authority, or concerning the delimitation of its frontiers or boundaries.
Mention of a commercial company or product in this document does not imply endorsement by UNEP and WMO. The use of information from this document for publicity or advertising is not permitted. Trademark names and symbols are used in an editorial fashion with no intention on infringement on trademark or copyright laws.
We regret any errors or omissions that may have been unwittingly made.© Maps, photos and illustrations as specified.
Writing team: Coordinators – Drew Shindell (National Aeronautics and Space Administration, Goddard Institute for Space Studies, USA) and Johan C. I. Kuylenstierna (Stockholm Environment Institute, University of York, UK); Writers – Kevin Hicks (Stockholm Environment Institute, University of York, UK), Frank Raes (Joint Research Centre, European Commission, Italy), Veerabhadran Ramanathan (Scripps Institution of Oceanography, USA), Erika Rosenthal (Earth Justice, USA), Sara Terry (US Environmental Protection Agency), Martin Williams (King’s College London, UK).
With inputs from: Markus Amann (International Institute for Applied Systems Analysis, Austria), Susan Anenberg (US Environmental Protection Agency), Volodymyr Demkine (UNEP, Kenya), Lisa Emberson (Stockholm Environment Institute, University of York, UK), David Fowler (The Centre for Ecology and Hydrology, UK), Liisa Jalkanen (WMO, Switzerland), Zbigniew Klimont (International Institute for Applied Systems Analysis, Austria), N. T. Kim Oanh, (Asian Institute of Technology, Thailand), Joel Schwartz (Harvard University, USA), David Streets (Argonne National Laboratory, USA), Rita van Dingenen (Joint Research Centre, European Commission, Italy), Harry Vallack (Stockholm Environment Institute, University of York, UK), Elisabetta Vignati (Joint Research Centre, European Commission, Italy).
With advice from the High-level Consultative Group especially: Ivar Baste (UNEP, Switzerland), Adrián Fernández Bremauntz (National Institute of Ecology, Mexico), Harald Dovland (formerly at the Ministry of Environment, Norway), Dale Evarts (US Environmental Protection Agency), Rob Maas (The National Institute for Public Health and the Environment, Netherlands), Pam Pearson (International Cryosphere Climate Initiative, Sweden/USA), Sophie Punte (Clean Air Initiative for Asian Cities, Philippines), Andreas Schild (International Centre for Integrated Mountain Development, Nepal), Surya Sethi (Former Principal Adviser Energy and Core Climate Negotiator, Government of India), George Varughese (Development Alternatives Group, India), Robert Watson (Department for Environment, Food and Rural Affairs, UK).
Editor: Bart Ullstein (Banson, UK).
Design and layout: Audrey Ringler (UNEP, Kenya).
Printing: UNON/Publishing Services Section/Nairobi, ISO 14001:2004-certified.
Cover photographs: credits
1. Kevin Hicks
3. Veerabhadran Ramanathan4. Christian Lagerek/Shutterstock Images5. John Ogren, NOAA
7. Alba Coral Avitia8. Jerome Whittingham/Shutterstock Images9. Brian Tan/Shutterstock Images
UNEP promotesenvironmentally sound practices
globally and in its own activities. Thispublication is printed on 100% recycled paper
using vegetable based inks and other eco-friendly practices. Our distribution policy aims to
reduce UNEP’s carbon footprint.
1 2
4 5
7 8 9
63

i
Summary for Decision Makers
0U[LNYH[LK�(ZZLZZTLU[VM�)SHJR�*HYIVUHUK�;YVWVZWOLYPJ�6aVUL:\TTHY`�MVY�+LJPZPVU�4HRLYZ

ii
Integrated Assessment of Black Carbon and Tropospheric Ozone
ForewordOne of the key climate change challenges is today to ensure that a sustainable development path will continue to remain available to all nations, including in particular the capability to appropriately meet their expanding food, water and energy requirements, while at the same time limiting inasmuch as possible the carbon dioxide emissions from fossil-fuel burning.
There is growing awareness that a wide range of airborne pollutants not only negatively affect health, agricultural production and key ecosystems like forests and freshwater but also contribute to augment climate change. Many of these substances, ranging from black carbon and methane \W�\ZWXW[XPMZQK�WbWVM�IVL�Æ]WZQVI\ML�OI[M[��IZM�¹[PWZ\�TQ^MLº�QV�\PM�I\UW[XPMZM�QV�KWUXIZQ[WV�with carbon dioxide.
Accordingly, a number of early actions being undertaken under a range of international, regional and national treaties, laws and guidelines, may offer a near-term solution to curb the observed climate trends, and contribute in particular to maintain globally averaged surface temperature rise below 2 degrees Celsius, as well as meet some major international challenges such as the achievement of the UN Millennium Development Goals.
The present report – The Integrated Assessment of Black Carbon and Tropospheric Ozone – ILLZM[[M[�\_W�[]KP�[PWZ\�TQ^ML�KTQUI\M�NWZKMZ[��1\�ZMÆMK\[��QV�XIZ\QK]TIZ��I�V]UJMZ�WN�ÅVLQVO[�WV�\PM�[\I\M�WN�[KQMV\QÅK�SVW_TMLOM�I[�_MTT�I[�XWTQKa�XZWXW[IT[�\W�K]\�MUQ[[QWV[�XZW^QLML�Ja�W^MZ�ÅN\a�authors convened by WMO and UNEP.
While previous assessments focused essentially either on direct effects of these pollutants or the associated climate impacts, rather than on both issues, the present report offers a comprehensive I[[M[[UMV\�WN�\PM�KWTTI\MZIT�JMVMÅ\[�_PQKP�KIV�JM�LMZQ^ML�NZWU�XZIK\QKIT�UMI[]ZM[�\W�ZML]KM�black carbon – a principal soot component – as well as the gases which contribute to the formation of tropospheric ozone, especially methane. In the process, the panel reviewed the best I^IQTIJTM�[KQMV\QÅK�SVW_TMLOM�IVL�Q\�KWVKT]LML�\PI\�I�KT][\MZ�WN�UMI[]ZM[�PIL�\PM�XW\MV\QIT�\W�aQMTL�UIRWZ�JMVMÅ\[�

iii
Summary for Decision Makers
Michel JarraudSecretary-General World Meteorological Organization
)LLQ\QWVITTa��\PM�ZMXWZ\�XZW^QLM[�[WUM�[WJMZQVO�ÅVLQVO[��QV�XIZ\QK]TIZ�\PI\�UQTTQWV[�NITT�QTT�WZ�LQM�prematurely in the developing world from the inhaling of black carbon-polluted air, while mega tonnes of wheat, maize and rice are annually lost to the ozone impacts on crop yields, as well as that black carbon deposits on snow and ice are contributing to the melting of glaciers and ice in the polar regions and over the Himalayas.
On the encouraging side, there is substantial evidence that existing technologies, policies and measures – some of them linked to actions launched to improve energy access, sustainable \ZIV[XWZ\�IVL�PMIT\P�·�KW]TL�QUUMLQI\MTa�JMOQV�\W�XZW^QLM�[QOVQÅKIV\�JMVMÅ\[�QV�\MZU[�WN �human well-being, the climate system and the wider environment, if they were rapidly and widely implemented.
)KKWZLQVOTa��N]TTMZ�QUXTMUMV\I\QWV�WN�\PM�QLMV\QÅML�UMI[]ZM[�Q[�M`XMK\ML�\W�WNNMZ�[]J[\IV\QIT�JMVMÅ\[�\W�\PM�ZMTM^IV\�ZMOQWV[��XIZ\QK]TIZTa�\W�)[QI�_PMZM�[PWZ\�TQ^ML�XWTT]\IV\[�UIa�IT[W�JM�impacting on such regional climate features as the Asian Monsoon.
;KQMV\QÅK�SVW_TMLOM�QV�\PQ[�^Q\IT�ÅMTL�Q[�ZIXQLTa�OZW_QVO�IVL�\PM�XZM[MV\�ZMXWZ\�QVKT]LM[�KTMIZ�ZMKWUUMVLI\QWV[�NWZ�\PM�[MK\WZ[�_PMZM�\PM�IXXZWXZQI\M�XWTQKa�LMKQ[QWV[�KW]TL�[QOVQÅKIV\Ta�contribute to deliver cost-effective opportunities to improve livelihoods and to erect a considerably more sustainable future for humanity.
Achim SteinerUNEP Executive Director Under-Secretary-General of the United Nations

Table of ContentsMain Messages . . . . . . . . . . . . . . . . . . . . . . . . . . . . . . . . . . . . . . . . . . . . . . . . . . . . 1
The challenge . . . . . . . . . . . . . . . . . . . . . . . . . . . . . . . . . . . . . . . . . . . . . . . . . . . . . . . . . . . . 1
Reducing emissions . . . . . . . . . . . . . . . . . . . . . . . . . . . . . . . . . . . . . . . . . . . . . . . . . . . . . . . . 2
� *MVMÅ\[�WN �MUQ[[QWV�ZML]K\QWV[ . . . . . . . . . . . . . . . . . . . . . . . . . . . . . . . . . . . . . . . . . . . . . . . 3
Responses . . . . . . . . . . . . . . . . . . . . . . . . . . . . . . . . . . . . . . . . . . . . . . . . . . . . . . . . . . . . . . . . 3
Introduction . . . . . . . . . . . . . . . . . . . . . . . . . . . . . . . . . . . . . . . . . . . . . . . . . . . . . . 5
Limiting Near-Term Climate Changes and Improving Air Quality . . . . . . . . . . . . 8
Identifying effective response measures . . . . . . . . . . . . . . . . . . . . . . . . . . . . . . . . . . . . . . . . 8
Achieving large emission reductions . . . . . . . . . . . . . . . . . . . . . . . . . . . . . . . . . . . . . . . . . . . 8
Reducing near-term global warming . . . . . . . . . . . . . . . . . . . . . . . . . . . . . . . . . . . . . . . . . . 10
Staying within critical temperature thresholds . . . . . . . . . . . . . . . . . . . . . . . . . . . . . . . . . . 12
� *MVMÅ\[�WN �MIZTa�QUXTMUMV\I\QWV . . . . . . . . . . . . . . . . . . . . . . . . . . . . . . . . . . . . . . . . . . . . . 13
� :MOQWVIT�KTQUI\M�JMVMÅ\[� . . . . . . . . . . . . . . . . . . . . . . . . . . . . . . . . . . . . . . . . . . . . . . . . . . 13
Tropical rainfall patterns and the Asian monsoon . . . . . . . . . . . . . . . . . . . . . . . . . . . . . . . 13
Decreased warming in polar and other glaciated regions . . . . . . . . . . . . . . . . . . . . . . . . . 15
� *MVMÅ\[�WN �\PM�UMI[]ZM[�NWZ�P]UIV�PMIT\P . . . . . . . . . . . . . . . . . . . . . . . . . . . . . . . . . . . . . 16
� *MVMÅ\[�WN �\PM�UMI[]ZM[�NWZ�KZWX�aQMTL[� . . . . . . . . . . . . . . . . . . . . . . . . . . . . . . . . . . . . . . . 16
� :MTI\Q^M�QUXWZ\IVKM�IVL�[KQMV\QÅK�KWVÅLMVKM�QV�\PM�UMI[]ZM[ . . . . . . . . . . . . . . . . . . . . . . 18
Mechanisms for rapid implementation . . . . . . . . . . . . . . . . . . . . . . . . . . . . . . . . . . . . . . . . 19
Potential international regulatory responses . . . . . . . . . . . . . . . . . . . . . . . . . . . . . . . . . . . . 22
� 7XXWZ\]VQ\QM[�NWZ�QV\MZVI\QWVIT�ÅVIVKQVO�IVL�KWWXMZI\QWV . . . . . . . . . . . . . . . . . . . . . . . . 23
Concluding Remarks . . . . . . . . . . . . . . . . . . . . . . . . . . . . . . . . . . . . . . . . . . . . . . 24
Glossary . . . . . . . . . . . . . . . . . . . . . . . . . . . . . . . . . . . . . . . . . . . . . . . . . . . . . . . . 25
Acronyms and Abbreviations . . . . . . . . . . . . . . . . . . . . . . . . . . . . . . . . . . . . . . . . 27
Acknowledgements . . . . . . . . . . . . . . . . . . . . . . . . . . . . . . . . . . . . . . . . . . . . . . . . 28

1
Summary for Decision Makers
Main Messages;KQMV\QÅK�M^QLMVKM�IVL�VM_�IVITa[M[�LMUWV[\ZI\M�\PI\�KWV\ZWT�WN�JTIKS�KIZJWV�XIZ\QKTM[�IVL�\ZWXW[XPMZQK�WbWVM�\PZW]OP�ZIXQL�QUXTMUMV\I\QWV�WN�XZW^MV�MUQ[[QWV�ZML]K\QWV�UMI[]ZM[�_W]TL�PI^M�QUUMLQI\M�IVL�U]T\QXTM�JMVMÅ\[�NWZ�human well-being.
Black carbon exists as particles in the atmosphere and is a major component of soot; it has [QOVQÅKIV\�P]UIV�PMIT\P�IVL�KTQUI\M�QUXIK\[��)\�OZW]VL�TM^MT��WbWVM�Q[�IV�IQZ�XWTT]\IV\�PIZUN]T�to human health and ecosystems, and throughout the troposphere, or lower atmosphere, is also I�[QOVQÅKIV\�OZMMVPW][M�OI[��7bWVM�Q[�VW\�LQZMK\Ta�MUQ\\ML��J]\�Q[�XZWL]KML�NZWU�MUQ[[QWV[�WN�precursors of which methane and carbon monoxide are of particular interest here.
THE CHALLENGE
1. The climate is changing now, warming at the highest rate in polar and high-
altitude regions. Climate change, even in the near term, has the potential to trigger abrupt transitions such as the release of carbon from thawing permafrost and biodiversity TW[[��<PM�_WZTL�PI[�_IZUML�Ja�IJW]\��� â+�NZWU�XZM�QVL][\ZQIT�TM^MT[��I[�ZMXWZ\ML�Ja�\PM�
Traditional brick kilns in South Asia are a major source of black carbon. Improved kiln design in this region is signi!cantly reducing emissions.
Cred
it: K
evin
Hic
ks
2
Integrated Assessment of Black Carbon and Tropospheric Ozone
Intergovernmental Panel on Climate Change (IPCC). The Parties to the United Nations Framework Convention on Climate Change (UNFCCC) have agreed that warming should VW\�M`KMML��â+�IJW^M�XZM�QVL][\ZQIT�TM^MT[�
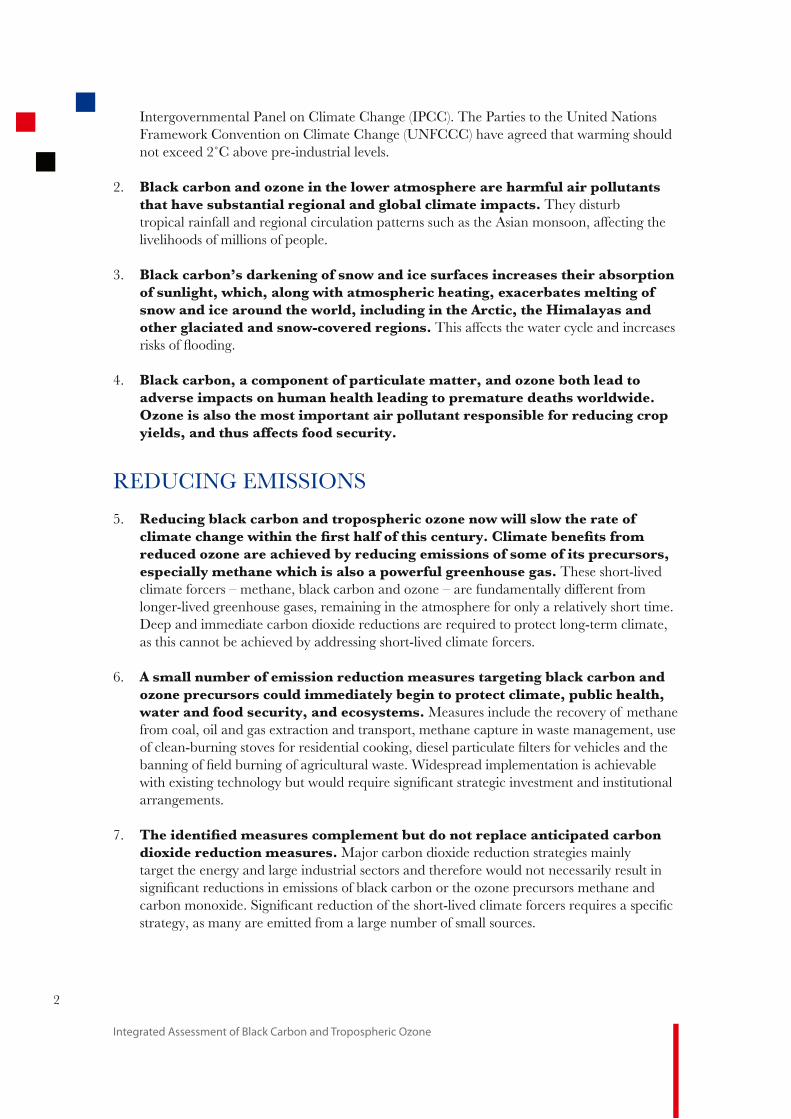
2. *TIKS�KIZJWV�IVL�WbWVM�QV�\PM�TW_MZ�I\UW[XPMZM�IZM�PIZUN]T�IQZ�XWTT]\IV\[�that have substantial regional and global climate impacts. They disturb tropical rainfall and regional circulation patterns such as the Asian monsoon, affecting the livelihoods of millions of people.
3. *TIKS�KIZJWV¼[�LIZSMVQVO�WN�[VW_�IVL�QKM�[]ZNIKM[�QVKZMI[M[�\PMQZ�IJ[WZX\QWV�WN�[]VTQOP\��_PQKP��ITWVO�_Q\P�I\UW[XPMZQK�PMI\QVO��M`IKMZJI\M[�UMT\QVO�WN�snow and ice around the world, including in the Arctic, the Himalayas and
other glaciated and snow-covered regions. This affects the water cycle and increases ZQ[S[�WN�ÆWWLQVO�
4. *TIKS�KIZJWV��I�KWUXWVMV\�WN�XIZ\QK]TI\M�UI\\MZ��IVL�WbWVM�JW\P�TMIL�\W�adverse impacts on human health leading to premature deaths worldwide.
7bWVM�Q[�IT[W�\PM�UW[\�QUXWZ\IV\�IQZ�XWTT]\IV\�ZM[XWV[QJTM�NWZ�ZML]KQVO�KZWX�aQMTL[��IVL�\P][�INNMK\[�NWWL�[MK]ZQ\a�
REDUCING EMISSIONS
5. :ML]KQVO�JTIKS�KIZJWV�IVL�\ZWXW[XPMZQK�WbWVM�VW_�_QTT�[TW_�\PM�ZI\M�WN�KTQUI\M�KPIVOM�_Q\PQV�\PM�ÅZ[\�PITN�WN�\PQ[�KMV\]Za��+TQUI\M�JMVMÅ\[�NZWU�ZML]KML�WbWVM�IZM�IKPQM^ML�Ja�ZML]KQVO�MUQ[[QWV[�WN�[WUM�WN�Q\[�XZMK]Z[WZ[��M[XMKQITTa�UM\PIVM�_PQKP�Q[�IT[W�I�XW_MZN]T�OZMMVPW][M�OI[� These short-lived climate forcers – methane, black carbon and ozone – are fundamentally different from longer-lived greenhouse gases, remaining in the atmosphere for only a relatively short time. Deep and immediate carbon dioxide reductions are required to protect long-term climate, as this cannot be achieved by addressing short-lived climate forcers.
6. )�[UITT�V]UJMZ�WN�MUQ[[QWV�ZML]K\QWV�UMI[]ZM[�\IZOM\QVO�JTIKS�KIZJWV�IVL�ozone precursors could immediately begin to protect climate, public health,
_I\MZ�IVL�NWWL�[MK]ZQ\a��IVL�MKW[a[\MU[� Measures include the recovery of methane from coal, oil and gas extraction and transport, methane capture in waste management, use WN�KTMIV�J]ZVQVO�[\W^M[�NWZ�ZM[QLMV\QIT�KWWSQVO��LQM[MT�XIZ\QK]TI\M�ÅT\MZ[�NWZ�^MPQKTM[�IVL�\PM�JIVVQVO�WN�ÅMTL�J]ZVQVO�WN�IOZQK]T\]ZIT�_I[\M��?QLM[XZMIL�QUXTMUMV\I\QWV�Q[�IKPQM^IJTM�_Q\P�M`Q[\QVO�\MKPVWTWOa�J]\�_W]TL�ZMY]QZM�[QOVQÅKIV\�[\ZI\MOQK�QV^M[\UMV\�IVL�QV[\Q\]\QWVIT�arrangements.
7. <PM�QLMV\QÅML�UMI[]ZM[�KWUXTMUMV\�J]\�LW�VW\�ZMXTIKM�IV\QKQXI\ML�KIZJWV�LQW`QLM�ZML]K\QWV�UMI[]ZM[��Major carbon dioxide reduction strategies mainly target the energy and large industrial sectors and therefore would not necessarily result in [QOVQÅKIV\�ZML]K\QWV[�QV�MUQ[[QWV[�WN�JTIKS�KIZJWV�WZ�\PM�WbWVM�XZMK]Z[WZ[�UM\PIVM�IVL�KIZJWV�UWVW`QLM��;QOVQÅKIV\�ZML]K\QWV�WN�\PM�[PWZ\�TQ^ML�KTQUI\M�NWZKMZ[�ZMY]QZM[�I�[XMKQÅK�strategy, as many are emitted from a large number of small sources.

3
Summary for Decision Makers
BENEFITS OF EMISSION REDUCTIONS
8. .]TT�QUXTMUMV\I\QWV�WN�\PM�QLMV\QÅML�UMI[]ZM[�_W]TL�ZML]KM�N]\]ZM�OTWJIT�_IZUQVO�Ja����â+��_Q\PQV�I�ZIVOM�WN����·���â+��.QO]ZM�����If the measures were to be implemented by 2030, they could halve the potential increase in global temperature projected for 2050 compared to the Assessment’s reference scenario based on current policies and energy and fuel projections. The rate of regional temperature increase would also be reduced.
9. Both near-term and long-term strategies are essential to protect climate.
Reductions in near-term warming can be achieved by control of the short-lived climate forcers whereas carbon dioxide emission reductions, beginning now, are required to limit long-term climate change. Implementing both reduction strategies is needed to improve the chances of keeping the Earth’s global mean temperature increase to within the UNFCCC �â+�\IZOM\�
10.� .]TT�QUXTMUMV\I\QWV�WN�\PM�QLMV\QÅML�UMI[]ZM[�_W]TL�PI^M�[]J[\IV\QIT�JMVMÅ\[�QV�\PM�)ZK\QK��\PM�0QUITIaI[�IVL�W\PMZ�OTIKQI\ML�IVL�[VW_�KW^MZML�regions. This could reduce warming in the Arctic in the next 30 years by about two-thirds compared to the projections of the Assessment’s reference scenario. This substantially LMKZMI[M[�\PM�ZQ[S�WN�KPIVOM[�QV�_MI\PMZ�XI\\MZV[�IVL�IUXTQÅKI\QWV�WN�OTWJIT�_IZUQVO�ZM[]T\QVO�NZWU�KPIVOM[�QV�\PM�)ZK\QK��:MOQWVIT�JMVMÅ\[�WN �\PM�JTIKS�KIZJWV�UMI[]ZM[��[]KP�as their effects on snow- and ice-covered regions or regional rainfall patterns, are largely independent of their impact on global mean warming.
11. .]TT�QUXTMUMV\I\QWV�WN�\PM�QLMV\QÅML�UMI[]ZM[�KW]TL�I^WQL�����UQTTQWV�XZMUI\]ZM�LMI\P[��_Q\PQV�I�ZIVOM�WN����·����UQTTQWV��IVL�\PM�TW[[�WN����UQTTQWV�\WVVM[��_Q\PQV�I�ZIVOM�WN���·����UQTTQWV�\WVVM[����·��XMZ�KMV\��WN�\PM�OTWJIT�XZWL]K\QWV�WN�UIQbM��ZQKM��[WaJMIV�IVL�_PMI\�MIKP�aMIZ��.QO]ZM����The most []J[\IV\QIT�JMVMÅ\[�_QTT�JM�NMT\�QUUMLQI\MTa�QV�WZ�KTW[M�\W�\PM�ZMOQWV[�_PMZM�IK\QWV�Q[�\ISMV�\W�ZML]KM�MUQ[[QWV[��_Q\P�\PM�OZMI\M[\�PMIT\P�IVL�KZWX�JMVMÅ\[�M`XMK\ML�QV�)[QI�
RESPONSES
���� <PM�QLMV\QÅML�UMI[]ZM[�IZM�ITT�K]ZZMV\Ta�QV�][M�QV�LQNNMZMV\�ZMOQWV[�IZW]VL�\PM�_WZTL�\W�achieve a variety of environment and development objectives. Much wider and more
ZIXQL�QUXTMUMV\I\QWV�Q[�ZMY]QZML�\W�IKPQM^M�\PM�N]TT�JMVMÅ\[�QLMV\QÅML�QV�\PQ[�Assessment.
13. )KPQM^QVO�_QLM[XZMIL�QUXTMUMV\I\QWV�WN�\PM�QLMV\QÅML�UMI[]ZM[�_W]TL�JM�UW[\�MNNMK\Q^M�QN �Q\�_MZM�KW]V\Za��IVL�ZMOQWV�[XMKQÅK��IVL�KW]TL�JM�[]XXWZ\ML�Ja�\PM�KWV[QLMZIJTM�M`Q[\QVO�JWLa�WN�SVW_TMLOM�IVL�M`XMZQMVKM��Accounting NWZ�VMIZ�\MZU�KTQUI\M�KW�JMVMÅ\[�KW]TL�TM^MZIOM�ILLQ\QWVIT�IK\QWV�IVL�N]VLQVO�WV�I�_QLMZ�international scale which would facilitate more rapid implementation of the measures. Many measures achieve cost savings over time. However, initial capital investment could be problematic in some countries, necessitating additional support and investment.

4
Integrated Assessment of Black Carbon and Tropospheric Ozone
14. )\�VI\QWVIT�IVL�[]J�VI\QWVIT�[KITM[�UIVa�WN�\PM�QLMV\QÅML�UMI[]ZM[�KW]TL�JM�QUXTMUMV\ML�]VLMZ�M`Q[\QVO�XWTQKQM[�LM[QOVML�\W�ILLZM[[�IQZ�Y]ITQ\a�IVL�development concerns. Improved cooperation within and between regions
would enhance widespread implementation and address transboundary
climate and air quality issues. 1V\MZVI\QWVIT�XWTQKa�IVL�ÅVIVKQVO�QV[\Z]UMV\[�\W�ILLZM[[�\PM�KW�JMVMÅ\[�WN�ZML]KQVO�MUQ[[QWV[�WN�[PWZ\�TQ^ML�KTQUI\M�NWZKMZ[�VMML�development and strengthening. Supporting and extending existing relevant regional arrangements may provide an opportunity for more effective cooperation, implementation and assessment as well as additional monitoring and research.
15. <PM�)[[M[[UMV\�KWVKT]LM[�\PI\�\PMZM�Q[�KWVÅLMVKM�\PI\�QUUMLQI\M�IVL�U]T\QXTM�JMVMÅ\[�_QTT�JM�ZMITQbML�]XWV�QUXTMUMV\I\QWV�WN�\PM�QLMV\QÅML�measures.�<PM�LMOZMM�WN�KWVÅLMVKM�^IZQM[�IKKWZLQVO�\W�XWTT]\IV\��QUXIK\�IVL�ZMOQWV��.WZ�M`IUXTM��\PMZM�Q[�PQOPMZ�KWVÅLMVKM�QV�\PM�MNNMK\�WN�UM\PIVM�UMI[]ZM[�WV�OTWJIT�temperatures than in the effect of black carbon measures, especially where these relate \W�\PM�J]ZVQVO�WN�JQWUI[[��<PMZM�Q[�IT[W�PQOP�KWVÅLMVKM�\PI\�JMVMÅ\[�_QTT�JM�ZMITQbML�NWZ�human health from reducing particles, including black carbon, and to crop yields from ZML]KQVO�\ZWXW[XPMZQK�WbWVM�KWVKMV\ZI\QWV[��/Q^MV�\PM�[KQMV\QÅK�KWUXTM`Q\a�WN�\PM�Q[[]M[��further research is required to optimize near-term strategies in different regions and to M^IT]I\M�\PM�KW[\�JMVMÅ\�ZI\QW�NWZ�QVLQ^QL]IT�UMI[]ZM[��
Figure 1. Global bene!ts from full implementation of the identi!ed measures in 2030 compared to the reference scenario. The climate change bene!t is estimated for a given year (2050) and human health and crop bene!ts are for 2030 and beyond.
0
CH4measures
CH4 + BCmeasures
0.1
0.2
0.3
0.4
0.5
0.6
0.7
Climate change
Global meanavoided
warming in 2050(˚C)
0
CH4measures
CH4 + BCmeasures
1
0.5
1.5
2
2.5
3
3.5
4
4.5
5
Human health
Annually avoidedpremature
deaths(million)
0
CH4measures
CH4 + BCmeasures
25
50
75
100
125
150
Food security
Annually avoidedcrop yield losses
(total maize,rice, soybeanand wheat,
million tonnes)

5
Summary for Decision Makers
Introduction Black carbon (BC, Box 1) and tropospheric ozone (O3, Box 2) are harmful air pollutants that also contribute to climate change. In ZMKMV\�aMIZ[��[KQMV\QÅK�]VLMZ[\IVLQVO�WN�PW_�BC and O3 affect climate and public health PI[�[QOVQÅKIV\Ta�QUXZW^ML��<PQ[�PI[�KI\ITa[ML�a demand for information and action from governments, civil society and other stakeholders. The United Nations (UN) has been requested to urgently provide science-based advice on action to reduce the impacts of these pollutants1.
The United Nations Environment Programme (UNEP), in consultation with partners, initiated an assessment designed to provide an interface between knowledge and action, science IVL�XWTQKa��IVL�\W�XZW^QLM�I�[KQMV\QÅKITTa�credible basis for informed decision-making. The result is a comprehensive analysis of drivers of emissions, trends in concentrations, and impacts on climate, human health and ecosystems of BC, tropospheric O3 and its precursors. BC, tropospheric O3 and methane (CH4) are often referred to as short-lived climate forcers (SLCFs) as they have a short lifetime in the atmosphere (days to about a decade) relative to carbon dioxide (CO2).
The Assessment is an integrated analysis of U]T\QXTM�KW�MUQ\\ML�XWTT]\IV\[�ZMÆMK\QVO�\PM�fact that these pollutants are not emitted in isolation (Boxes 1 and 2). The Assessment determined that under current policies, emissions of BC and O3 precursors are expected globally either to increase or to remain roughly constant unless further mitigation action is taken.
The Integrated Assessment of Black Carbon and
Tropospheric Ozone convened more than 50 authors to assess the state of science and ______________________________________________1 The Anchorage Declaration of 24 April 2009, adopted by the Indigenous People’s Global Summit on Climate Change; the Tromsø Declaration of 29 April
2009, adopted by the Sixth Ministerial Meeting of the Arctic Council and the 8th Session of the Permanent Forum on Indigenous Issues under the United Nations Economic and Social Council (May 2009) called on UNEP to conduct a fast track assessment of short-term drivers of climate change, speci!cally BC, with a view to initiating the negotiation of an international agreement to reduce emissions of BC. A need to take rapid action to address signi!cant climate forcing agents other than CO2, such as BC, was re"ected in the 2009 declaration of the G8 leaders (Responsible Leadership for a Sustainable Future, L’Aquila, Italy, 2009).
existing policy options for addressing these pollutants. The Assessment team examined policy responses and developed an outlook to �����QTT][\ZI\QVO�\PM�JMVMÅ\[�WN�XWTQ\QKIT�LMKQ[QWV[�made today and the risks to climate, human health and crop yields over the next decades if action is delayed. Placing a premium on robust science and analysis, the Assessment was driven by four main policy-relevant questions:
�� ?PQKP�UMI[]ZM[�IZM�TQSMTa�\W�XZW^QLM�[QOVQÅKIV\�KWUJQVML�KTQUI\M�IVL�IQZ�Y]ITQ\a�JMVMÅ\['�
�� 0W_�U]KP�KIV�QUXTMUMV\I\QWV�WN�\PM�QLMV\QÅML�UMI[]ZM[�ZML]KM�\PM�ZI\M�WN�global mean temperature increase by mid-KMV\]Za'�
�� ?PI\�IZM�\PM�U]T\QXTM�KTQUI\M��PMIT\P�IVL�KZWX�aQMTL�JMVMÅ\[�\PI\�_W]TL�JM�IKPQM^ML�Ja�QUXTMUMV\QVO�\PM�UMI[]ZM['�
�� *a�_PI\�UMKPIVQ[U[�KW]TL�\PM�UMI[]ZM[�JM�ZIXQLTa�QUXTMUMV\ML'�
In order to answer these questions, the Assessment team determined that new analyses were needed. The Assessment therefore relies on published literature as much as possible and on new simulations by two independent climate-chemistry-aerosol models: one developed and run by the NASA-Goddard Institute for Space Studies (GISS) and the other developed by the Max Planck Institute in Hamburg, Germany (ECHAM), and run at the Joint Research Centre of the European +WUUQ[[QWV�QV�1[XZI��1\ITa��<PM�[XMKQÅK�measures and emission estimates for use in developing this Assessment were selected using the International Institute for Applied Systems Analysis Greenhouse Gas and Air Pollution Interactions and Synergies (IIASA GAINS) model. For a more detailed description of the modelling see Chapter 1 of the underlying assessment report.
6
Integrated Assessment of Black Carbon and Tropospheric Ozone
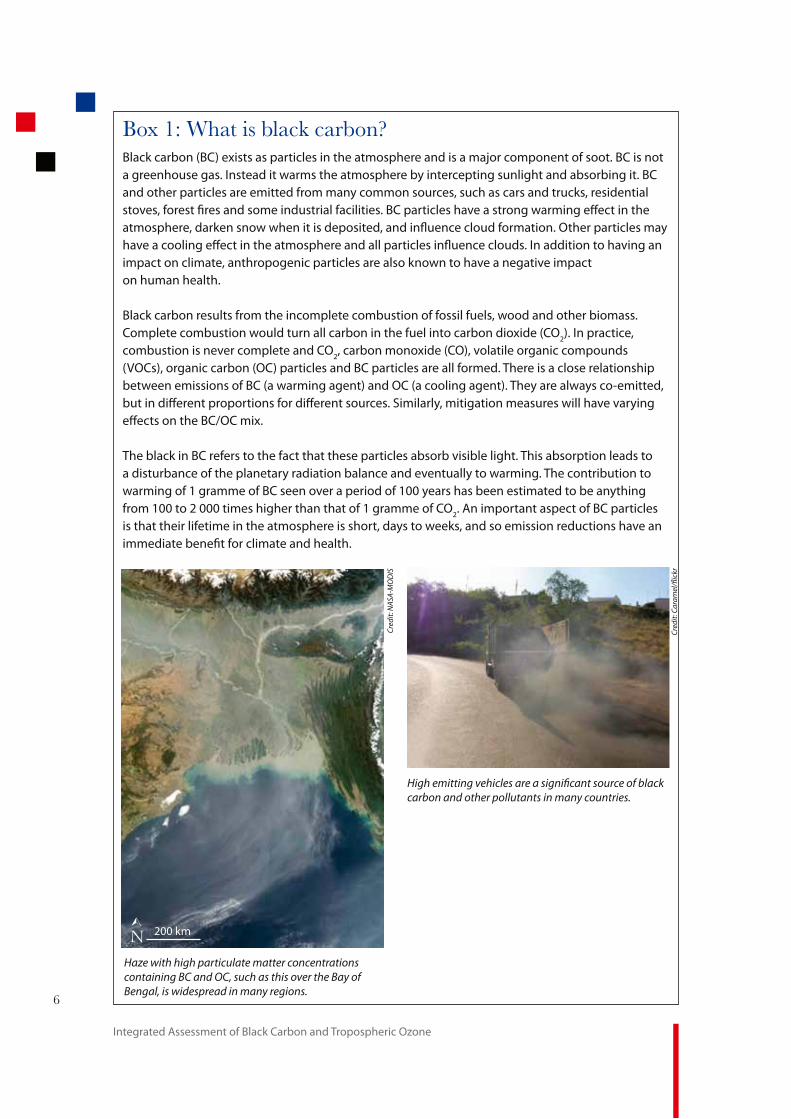
*W`��"�?PI\�Q[�JTIKS�KIZJWV'�Black carbon (BC) exists as particles in the atmosphere and is a major component of soot. BC is not a greenhouse gas. Instead it warms the atmosphere by intercepting sunlight and absorbing it. BC and other particles are emitted from many common sources, such as cars and trucks, residential stoves, forest !res and some industrial facilities. BC particles have a strong warming e#ect in the atmosphere, darken snow when it is deposited, and in"uence cloud formation. Other particles may have a cooling e#ect in the atmosphere and all particles in"uence clouds. In addition to having an impact on climate, anthropogenic particles are also known to have a negative impact on human health.
Black carbon results from the incomplete combustion of fossil fuels, wood and other biomass. Complete combustion would turn all carbon in the fuel into carbon dioxide (CO2). In practice, combustion is never complete and CO2, carbon monoxide (CO), volatile organic compounds (VOCs), organic carbon (OC) particles and BC particles are all formed. There is a close relationship between emissions of BC (a warming agent) and OC (a cooling agent). They are always co-emitted, but in di#erent proportions for di#erent sources. Similarly, mitigation measures will have varying e#ects on the BC/OC mix.
The black in BC refers to the fact that these particles absorb visible light. This absorption leads to a disturbance of the planetary radiation balance and eventually to warming. The contribution to warming of 1 gramme of BC seen over a period of 100 years has been estimated to be anything from 100 to 2 000 times higher than that of 1 gramme of CO2. An important aspect of BC particles is that their lifetime in the atmosphere is short, days to weeks, and so emission reductions have an immediate bene!t for climate and health.
High emitting vehicles are a signi!cant source of black carbon and other pollutants in many countries.
Haze with high particulate matter concentrations containing BC and OC, such as this over the Bay of Bengal, is widespread in many regions.
Cred
it: C
aram
el/"
ickr
Cred
it: N
ASA-
MO
DIS
N 200 km¿

7
Summary for Decision Makers
*W`��"�?PI\�Q[�\ZWXW[XPMZQK�WbWVM'�Ozone (O3) is a reactive gas that exists in two layers of the atmosphere: the stratosphere (the upper layer) and the troposphere (ground level to ~10–15 km). In the stratosphere, O3 is considered to be bene!cial as it protects life on Earth from the sun’s harmful ultraviolet (UV) radiation. In contrast, at ground level, it is an air pollutant harmful to human health and ecosystems, and it is a major component of urban smog. In the troposphere, O3 is also a signi!cant greenhouse gas. The threefold increase of the O3 concentration in the northern hemisphere during the past 100 years has made it the third most important contributor to the human enhancement of the global greenhouse e#ect, after CO2 and CH4.
In the troposphere, O3 is formed by the action of sunlight on O3 precursors that have natural and anthropogenic sources. These precursors are CH4, nitrogen oxides (NOX), VOCs and CO. It is important to understand that reductions in both CH4 and CO emissions have the potential to substantially reduce O3 concentrations and reduce global warming. In contrast, reducing VOCs would clearly be bene!cial but has a small impact on the global scale, while reducing NOX has multiple additional e#ects that result in its net impact on climate being minimal.
Some of the largest emission reductions are obtained using diesel particle !lters on high emitting vehicles. The exhibits above are actual particulate matter (PM) collection samples from an engine testing laboratory (International Council of Clean Transportation (ICCT)).
Retro!tted withDiesel Oxidation Catalyst (DOC)
(Level 1)
Old technlogyLittle black carbon removalLittle ultra!ne PM removal
Does not remove lube oil ash
No retro!t systemUncontrolled Diesel Exhaust
Old technlogyLittle black carbon removalLittle ultra!ne PM removal
Does not remove lube oil ash
Retro!tted withPartial Filter
(Level 2)
Little black carbon removalLittle ultra!ne PM removal
Does not remove lube oil ash
Retro!tted withDiesel Particulate Filter (DPF)
(Level 3)
New TechnologyUsed on all new trucks since 2007
>85% black carbon removal>85% ultra!ne removal
>85% lube oil ash removal
Cred
it: Lu
isa M
olin
a
Cred
it: W
arre
n Gr
etz/
DO
E/NR
EL
Tropospheric ozone is a major constituent of urban smog, left Tokyo, Japan; right Denver, Colorado, USA

8
Integrated Assessment of Black Carbon and Tropospheric Ozone
Limiting Near-Term Climate Changes and Improving Air Quality
emissions of all substances resulting from the N]TT�QUXTMUMV\I\QWV�WN�\PM�QLMV\QÅML�UMI[]ZM[�through the two global composition-climate models GISS and ECHAM (see Chapter 4 of the underlying assessment report). One hundred per cent implementation of the measures globally was used to illustrate the existing potential to reduce climate and air quality impacts, but this does not make any assumptions regarding the feasibility of full implementation everywhere. A discussion of the challenges involved in widespread implementation of the measures follows after \PM�XW\MV\QIT�JMVMÅ\�PI[�JMMV�LMUWV[\ZI\ML��
Achieving large emission
reductions
The packages of policy measures in Table 1 were compared to a reference scenario (Table 2). Figure 2 shows the effect of the packages of policy measures and the reference scenario relative to 2005 emissions.
There is tremendous regional variability in how emissions are projected to change by the year 2030 under the reference scenario. Emissions of CH4 – a major O3 precursor and a potent greenhouse gas – are expected to increase in the future (Figure 2). This increase will occur despite current and planned regulations, in large part due to anticipated economic growth and the increase in fossil fuel production projected to accompany it. In contrast, global emissions of BC and accompanying co-emitted pollutants are expected to remain relatively constant through to 2030. Regionally, reductions in BC emissions are expected due to tighter standards on road transport IVL�UWZM�MNÅKQMV\�KWUJ][\QWV�ZMXTIKQVO�][M�
1LMV\QNaQVO�MNNMK\Q^M�ZM[XWV[M�measures
<PM�)[[M[[UMV\�QLMV\QÅML�\PW[M�UMI[]ZM[�UW[\�TQSMTa�\W�XZW^QLM�KWUJQVML�JMVMÅ\[��taking into account the fact that BC and O3 precursors are co-emitted with different gases and particles, some of which cause warming and some of which, such as organic carbon (OC) and sulphur dioxide (SO2), lead to cooling. The selection criterion was that the measure had to be likely to reduce global climate change and also provide air Y]ITQ\a�JMVMÅ\[��[W�KITTML�_QV�_QV�UMI[]ZM[��<PW[M�UMI[]ZM[�\PI\�XZW^QLML�I�JMVMÅ\�for air quality but increased warming were not included in the selected measures. For example, measures that primarily reduce emissions of SO2 were not included.
<PM�QLMV\QÅML�UMI[]ZM[��<IJTM����_MZM�chosen from a subset of about 2 000 separate measures that can be applied to sources in IIASA’s GAINS model. The selection was JI[ML�WV�\PM�VM\�QVÆ]MVKM�WV�_IZUQVO��estimated using the metric Global Warming Potential (GWP), of all of the gases and particles that are affected by the measure. The selection gives a useful indication of the potential for realizing a win for climate. All emission reduction measures were assumed \W�JMVMÅ\�IQZ�Y]ITQ\a�Ja�ZML]KQVO�XIZ\QK]TI\M�matter and/or O3 concentrations.
<PQ[�[MTMK\QWV�XZWKM[[�QLMV\QÅML�I�ZMTI\Q^MTa�small set of measures which nevertheless provide about 90 per cent of the climate JMVMÅ\�KWUXIZML�\W�\PM�QUXTMUMV\I\QWV�WN�ITT�������UMI[]ZM[�QV�/)16;��<PM�ÅVIT�IVITa[Q[�WN�\PM�JMVMÅ\[�NWZ�\MUXMZI\]ZM��human health and crop yields considered the

9
Summary for Decision Makers
Table 1. Measures that improve climate change mitigation and air quality and have a large
emission reduction potential
Measure1 SectorCH4 measuresExtended pre-mine degasi!cation and recovery and oxidation of CH4 from ventilation air from coal mines
Extraction and transport of fossil fuel
Extended recovery and utilization, rather than venting, of associated gas and improved control of unintended fugitive emissions from the production of oil and natural gasReduced gas leakage from long-distance transmission pipelinesSeparation and treatment of biodegradable municipal waste through recycling, composting and anaerobic digestion as well as land!ll gas collection with combustion/utilization Waste managementUpgrading primary wastewater treatment to secondary/tertiary treatment with gas recovery and over"ow controlControl of CH4 emissions from livestock, mainly through farm-scale anaerobic digestion of manure from cattle and pigs AgricultureIntermittent aeration of continuously "ooded rice paddiesBC measures (a!ecting BC and other co-emitted compounds)Diesel particle !lters as part of a Euro VI package for road and o#-road diesel vehicles TransportElimination of high-emitting vehicles in road and o#-road transport Replacing coal by coal briquettes in cooking and heating stoves
Residential
Pellet stoves and boilers, using fuel made from recycled wood waste or sawdust, to replace current wood-burning technologies in the residential sector in industrialized countriesIntroduction of clean-burning biomass stoves for cooking and heating in developing countries2, 3 Substitution of clean-burning cookstoves using modern fuels for traditional biomass cookstoves in developing countries2, 3 Replacing traditional brick kilns with vertical shaft kilns and Ho#man kilns
IndustryReplacing traditional coke ovens with modern recovery ovens, including the improvement of end-of-pipe abatement measures in developing countriesBan of open !eld burning of agricultural waste2 Agriculture
of biofuels in the residential and commercial sectors, although these are offset to some extent by increased activity and economic growth. The regional BC emission trends, therefore, vary [QOVQÅKIV\Ta��_Q\P�MUQ[[QWV[�M`XMK\ML�\W�LMKZMI[M�in North America and Europe, Latin America and the Caribbean, and in Northeast Asia, ;W]\PMI[\�)[QI�IVL�\PM�8IKQÅK��IVL�\W�QVKZMI[M�QV�Africa and South, West and Central Asia.
The full implementation of the selected UMI[]ZM[�Ja������TMIL[�\W�[QOVQÅKIV\�reductions of SLCF emissions relative to current emissions or to the 2030 emissions in the reference scenario (Figure 2). It also reduces a high proportion of the emissions relative to the maximum reduction from the implementation of all 2 000 or so measures in the GAINS model. The measures designed to
1 There are measures other than those identi!ed in the table that could be implemented. For example, electric cars would have a similar impact to diesel particulate !lters but these have not yet been widely introduced; forest !re controls could also be important but are not included due to the di%culty in establishing the proportion of !res that are anthropogenic.
2 Motivated in part by its e#ect on health and regional climate, including areas of ice and snow.3 For cookstoves, given their importance for BC emissions, two alternative measures are included.

10
Integrated Assessment of Black Carbon and Tropospheric Ozone
reduce BC also have a considerable impact on OC, \W\IT�ÅVM�XIZ\QK]TI\M�UI\\MZ��852.5) and CO emissions, removing more than half the total anthropogenic emissions. The largest BC emission reductions are obtained through measures controlling incomplete combustion WN�JQWUI[[�IVL�LQM[MT�XIZ\QKTM�ÅT\MZ[�I[�XIZ\�WN�a Euro VI package.
The major sources of CO2 are different from those emitting most BC, OC, CH4 and CO. Even in the few cases where there is overlap, []KP�I[�LQM[MT�^MPQKTM[��\PM�XIZ\QKTM�ÅT\MZ[�\PI\�reduce BC, OC and CO have minimal effect on CO2. The measures to reduce CO2 over the next 20 years (Table 2) therefore hardly affect the emissions of BC, OC or CO. The QVÆ]MVKM�WN�\PM�+04 and BC measures is thus the same regardless of whether the CO2 measures are imposed or not.
Reducing near-term global
warming
The Earth is projected to continue the rapid warming of the past several decades and, without additional mitigation efforts, under the reference scenario global mean temperatures are projected to rise about a N]Z\PMZ����â+��_Q\P�I�ZIVOM�WN��� ·���â+��Ja�
the middle of this century, bringing the total warming from pre-industrial levels to about ���â+��.QO]ZM�����<PM�)[[M[[UMV\ shows that the measures targeted to reduce emissions of BC and CH4 could greatly reduce global mean warming rates over the next few decades (Figure 3). Figure 1 shows that over half of the reduced global mean warming is achieved by the CH4 measures and the remainder by BC measures. The greater KWVÅLMVKM�QV�\PM�MNNMK\�WN�+04 measures on _IZUQVO�Q[�ZMÆMK\ML�QV�\PM�VIZZW_MZ�ZIVOM�WN �estimates.
Full implementation of all measures would half the warming during the 2030s relative to the present day compared with taking no action. In contrast, even a fairly aggressive strategy to reduce CO2 emissions under the CO2 measures scenario does little to mitigate warming over the next 20–30 years. In fact, []TXPI\M�XIZ\QKTM[��ZMÆMK\QVO�XIZ\QKTM[�\PI\�offset some of the committed warming for the short time they are in the atmosphere, are derived from SO2 that is co-emitted with CO2 in some of the highest-emitting activities, including coal burning in large-scale combustion such as in power plants. Hence, CO2 measures alone may temporarily enhance near-term warming as sulphates are
Table 2. Policy packages used in the Assessment
Scenario Description1
Reference Based on energy and fuel projections of the International Energy Agency (IEA) World Energy Outlook 2009 and incorporating all presently agreed policies affecting emissions
CH4 measures Reference scenario plus the CH4 measures
BC measures Reference scenario plus the BC measures (the BC measures affect many pollutants, especially BC, OC, and CO)
CH4 + BC measures Reference scenario plus the CH4 and BC measures
CO2 measures Emissions modelled using the assumptions of the IEA World Energy Outlook 2009 450 Scenario2 and the IIASA GAINS database. Includes CO2 measures only. The CO2 measures affect other emissions, especially SO2
3
CO2 + CH4 + BC measures CO2 measures plus CH4 and BC measures
1 In all scenarios, trends in all pollutant emissions are included through 2030, after which only trends in CO2 are included.2 The 450 Scenario is designed to keep total forcing due to long-lived greenhouse gases (including CH4 in this case) at a
level equivalent to 450 ppm CO2 by the end of the century. 3 Emissions of SO2 are reduced by 35–40 per cent by implementing CO2 measures. A further reduction in sulphur emissions
would be bene!cial to health but would increase global warming. This is because sulphate particles cool the Earth by re"ecting sunlight back to space.

11
Summary for Decision Makers
-90 -70-80 -60 -40 -20 20 40-50 -30 -10 100 30 50
ReferenceBC measures
ReferenceBC measures
ReferenceBC measures
ReferenceBC measures
ReferenceCH4 measuresCH4 + BC measures
ReferenceBC measures
ReferenceBC measures
ReferenceBC measures
Change in emissions in 2030 compared to 2005, %
Large-scale combustion Industrial processes
Residential-commercial combustionTransport Fossil fuel extraction and distribution
Waste /land!llAgriculture
CO2
CONO
XSO
2CH
4To
tal P
M 2.5
OC
BC
Figure 2. Percentage change in anthropogenic emissions of the indicated pollutants in 2030 relative to 2005 for the reference, CH4, BC and CH4 + BC measures scenarios. The CH4 measures have minimal e#ect on emissions of anything other than CH4. The identi!ed BC measures reduce a large proportion of total BC, OC and CO emissions. SO2 and CO2 emissions are hardly a#ected by the identi!ed CH4 and BC measures, while NOX and other PM2.5 emissions are a#ected by the BC measures.
reduced (Figure 3; temperatures in the CO2 measures scenario are slightly higher than those in the reference scenario during the period 2020–2040).
The CO2 measures clearly lead to long-term JMVMÅ\[��_Q\P�I�LZIUI\QKITTa�TW_MZ�_IZUQVO�rate in 2070 than under the scenario with only near-term CH4 + BC measures. Owing to the long residence time of CO2 in the I\UW[XPMZM��\PM[M�TWVO�\MZU�JMVMÅ\[�_QTT�only be achieved if CO2 emission reductions are brought in quickly. In essence, the near-term CH4 and BC measures examined in this Assessment are effectively decoupled from
the CO2 measures both in that they target different source sectors and in that their impacts on climate change take place over different timescales.
Near-term warming may occur in sensitive regions and could cause essentially irreversible changes, such as loss of Arctic land-ice, release of CH4 or CO2 from Arctic permafrost and species loss. Indeed, the projected warming in the reference scenario is greater in the Arctic than globally. Reducing the near-term rate of warming hence decreases the risk of QZZM^MZ[QJTM�\ZIV[Q\QWV[�\PI\�KW]TL�QVÆ]MVKM�\PM�global climate system for centuries.

12
Integrated Assessment of Black Carbon and Tropospheric Ozone
Staying within critical
temperature thresholds
Adoption of the near-term emission control measures described in this Assessment, together with measures to reduce CO2 emissions, would greatly improve the chances of keeping Earth’s \MUXMZI\]ZM�QVKZMI[M�\W�TM[[�\PIV��â+�ZMTI\Q^M�to pre-industrial levels (Figure 3). With the CO2 UMI[]ZM[�ITWVM��_IZUQVO�M`KMML[��â+�JMNWZM�2050. Even with both the CO2 measures and CH4 measures envisioned under the same 1-)�����;KMVIZQW��_IZUQVO�M`KMML[��â+�QV�the 2060s (see Chapter 5 of the undelying assessment report). However, the combination of CO2, CH4, and BC measures holds the \MUXMZI\]ZM�QVKZMI[M�JMTW_��â+�]V\QT�IZW]VL�2070. While CO2 emission reductions even larger than those in the CO2 measures scenario would of course mitigate more warming, actual CO2 emissions over the past decade have
consistently exceeded the most pessimistic emission scenarios of the IPCC. Thus, it seems unlikely that reductions more stringent than those in the CO2 measures scenario will take place during the next20 years.
Examining the more stringent UNFCCC ���â+�\PZM[PWTL��\PM�+72 measures scenario exceeds this by 2030, whereas the near-term measures proposed in the Assessment delay that exceedance until after 2040. Again, while substantially deeper early reductions in CO2 emissions than those in the CO2 measures scenario could also delay the crossing of the ���â+�\MUXMZI\]ZM�\PZM[PWTL��[]KP�ZML]K\QWV[�_W]TL�]VLW]J\MLTa�JM�M^MV�UWZM�LQNÅK]T\�\W�achieve. However, adoption of the Assessment’s near-term measures (CH4 + BC) along with the CO2 reductions would provide a substantial chance of keeping the Earth’s temperature QVKZMI[M�JMTW_����â+�NWZ�\PM�VM`\����aMIZ[�
1900 1950 2000 2050
Tem
pera
ture
(˚C)
rela
tive
to 1
890-
1910
CH4 + BC measures
CO2 measures Reference
CO2 + CH4 + BCmeasures
-0.5
0.0
0.5
1.0
1.5
2.0
2.5
3.0
3.5
4.0
Figure 3. Observed deviation of temperature to 2009 and projections under various scenarios. Immediate implementation of the identi!ed BC and CH4 measures, together with measures to reduce CO2 emissions, would greatly improve the chances of keeping Earth’s temperature increase to less than 2˚C relative to pre-industrial levels. The bulk of the bene!ts of CH4 and BC measure are realized by 2040 (dashed line).Explanatory notes: Actual mean temperature observations through 2009, and projected mean temperature under various scenarios thereafter, are shown relative to the 1890–1910 mean temperature. Estimated ranges for 2070 are shown in the bars on the right. A portion of the uncertainty is common to all scenarios, so that overlapping ranges do not mean there is no di#erence, for example, if climate sensitivity is large, it is large regardless of the scenario, so temperatures in all scenarios would be towards the high-end of their ranges.

13
Summary for Decision Makers
*MVMÅ\[�WN�MIZTa�QUXTMUMV\I\QWV
There would clearly be much less warming during 2020–2060 were the measures implemented earlier rather than later (Figure 4). Hence there is a substantial near-term KTQUI\M�JMVMÅ\�QV�IKKMTMZI\QVO�QUXTMUMV\I\QWV�WN�\PM�QLMV\QÅML�UMI[]ZM[�M^MV�QN�[WUM�WN�these might eventually be adopted owing to general air-quality and development concerns. Clearly the earlier implementation _QTT�IT[W�PI^M�[QOVQÅKIV\�ILLQ\QWVIT�P]UIV�PMIT\P�IVL�KZWX�aQMTL�JMVMÅ\[�
)KKMTMZI\ML�ILWX\QWV�WN�\PM�QLMV\QÅML�measures has only a modest effect on long-term climate change in comparison with waiting 20 years, however (Figure 4). This reinforces the conclusion that reducing emissions of O3 precursors and BC can have []J[\IV\QIT�JMVMÅ\[�QV�\PM�VMIZ�\MZU��J]\�that mitigating long-term climate change depends on reducing emissions of long-lived greenhouse gases such as CO2.
:MOQWVIT�KTQUI\M�JMVMÅ\[�
While global mean temperatures provide some indication of climate impacts, temperature changes can vary dramatically from place to place even in response to relatively uniform forcing from long-lived greenhouse gases. Figure 5 shows that warming is projected to increase for all regions with some variation under the reference scenario, while the Assessment’s UMI[]ZM[�XZW^QLM�\PM�JMVMÅ\�WN�ZML]KML�warming in all regions.
Climate change also encompasses more than just temperature changes. Precipitation, melting rates of snow and ice, wind patterns, and clouds are all affected, and these in turn have an impact on human well-being by QVÆ]MVKQVO�NIK\WZ[�[]KP�I[�_I\MZ�I^IQTIJQTQ\a��agriculture and land use.
Both O3 and BC, as well as other particles, KIV�QVÆ]MVKM�UIVa�WN�\PM�XZWKM[[M[�\PI\�TMIL�to the formation of clouds and precipitation. They alter surface temperatures, affecting
evaporation. By absorbing sunlight in the atmosphere, O3 and especially BC can affect cloud formation, rainfall and weather patterns. They can change wind patterns by affecting the regional temperature contrasts that LZQ^M�\PM�_QVL[��QVÆ]MVKQVO�_PMZM�ZIQV�IVL�snow fall. While some aspects of these effects are local, they can also affect temperature, cloudiness, and precipitation far away from the emission sources. The regional changes in all \PM[M�I[XMK\[�WN�KTQUI\M�_QTT�JM�[QOVQÅKIV\��J]\�IZM�K]ZZMV\Ta�VW\�_MTT�Y]IV\QÅML��
<ZWXQKIT�ZIQVNITT�XI\\MZV[�IVL�the Asian monsoon
Several detailed studies of the Asian monsoon suggest that regional forcing by absorbing particles substantially alters precipitation patterns (as explained in the previous section). The fact that both O3 and particle changes are predominantly in the northern hemisphere means that they cause temperature gradients JM\_MMV�\PM�\_W�PMUQ[XPMZM[�\PI\�QVÆ]MVKM�rainfall patterns throughout the tropics. Implementation of the measures analysed in this Assessment would substantially decrease the regional atmospheric heating by particles (Figure 6), and are hence very likely to reduce regional shifts in precipitation. As the reductions of atmospheric forcing are greatest over the Indian sub-continent and other parts of Asia, the emission reductions may have a substantial effect on the Asian monsoon, mitigating disruption of traditional rainfall patterns. However, results from global climate models are not yet robust for the magnitude or timing of monsoon shifts resulting from either greenhouse gas increases or changes in absorbing particles. Nonetheless, results from climate models provide examples of the type of change that might be expected. Shifts in the timing and strength of precipitation KIV�PI^M�[QOVQÅKIV\�QUXIK\[�WV�P]UIV�_MTT�being because of changes in water supply and IOZQK]T\]ZIT�XZWL]K\Q^Q\a��LZW]OP\�IVL�ÆWWLQVO��The results shown in Figure 6 suggest that implementation of the BC measures could also lead to a considerable reduction in the disruption of traditional rainfall patterns in Africa.

14
Integrated Assessment of Black Carbon and Tropospheric Ozone
3.5
4
4.5
3
2.5
2
1.5
1
0.5
0Tem
pera
ture
(˚C)
rela
tive
to 1
890-
1910
Africa
Reference
CH4 + BCmeasures
Northeast Asia,
Southeast Asia and
Paci!c
LatinAmerica
andCaribbean
North America
andEurope
South,West and
Central Asia
Figure 4. Projected global mean temperature changes for the reference scenario and for the CH4 and BC measures scenario with emission reductions starting immediately or delayed by 20 years.
2010 2020 2030 2040
Year
2050 2060 2070
2
3
0
1
ReferenceCH4 + BC measures from 2030–2050CH4 + BC measures from 2010–2030
Tem
pera
ture
(˚C)
rela
tive
to 1
890-
1910
Figure 5. Comparison of regional mean warming over land (˚C) showing the change in 2070 compared with 2005 for the reference scenario (Table 2) and the reference + CH4 + BC measures scenario. The lines on each bar show the range of estimates.

15
Summary for Decision Makers
Decreased warming in polar and
other glaciated regions
Implementation of the measures would substantially slow, but not halt, the current rapid pace of temperature rise and other changes already occurring at the poles and high-altitude glaciated regions, and the reduced warming in these regions would likely be greater than that seen globally. The large JMVMÅ\[�WKK]Z�QV�XIZ\�JMKI][M�\PM�[VW_�QKM�darkening effect of BC is substantially greater \PIV�\PM�KWWTQVO�MNNMK\�WN�ZMÆMK\Q^M�XIZ\QKTM[�co-emitted with BC, leading to greater warming impacts in these areas than in areas without snow and ice cover.
Studies in the Arctic indicate that it is highly sensitive both to local pollutant emissions and those transported from sources close to the Arctic, as well as to the climate impact of pollutants in the mid-latitudes of the northern hemisphere. Much of the need for mitigation measures lies within Europe and North )UMZQKI��<PM�QLMV\QÅML�UMI[]ZM[�KW]TL�ZML]KM�_IZUQVO�QV�\PM�)ZK\QK�Ja�IJW]\����â+��_Q\P�I�ZIVOM�WN����·���â+��QV�������<PQ[�Q[�VMIZTa�\_W�\PQZL[�WN�\PM�M[\QUI\ML����â+��_Q\P�I�ZIVOM�WN����·���â+��_IZUQVO�XZWRMK\ML�
for the Arctic under the reference scenario, and should substantially decrease the risk of global impacts from changes in this sensitive region, such as sea ice loss, which affects global albedo, and permafrost melt. Although VW\�QLMV\QÅML�I[�I�UMI[]ZM�NWZ�][M�QV�\PQ[�)[[M[[UMV\��\PM�KWV\ZWT�WN�JWZMIT�NWZM[\�ÅZM[�may also be important in reducing impacts in the Arctic.
The Antarctic is a far less studied region in terms of SLCF impacts. However, there are studies demonstrating BC deposition even in central portions of the continent, and reductions in O3 and CH4 should slow warming in places like the Antarctic Peninsula, currently the location on the globe showing the most rapid temperature rise of all.
The Himalayas and the Tibetan Plateau are regions where BC is likely to have serious impacts. In the high valleys of the Himalayas, for example, BC levels can be as high as in a mid-sized city. Reducing emissions from local sources and those carried by long-range transport should lower glacial melt in these regions, decreasing the risk of impacts such as catastrophic glacial lake outbursts.
50
0
-50
-20 -10 -4 -3 -2 -1 1
-100 0 100 -100 0 100
50
0
-50
W/m2
GISS ECHAM
Figure 6. Change in atmospheric energy absorption (Watts per square metre, W/m2 as annual mean), an important factor driving tropical rainfall and the monsoons resulting from implementation of BC measures. The changes in absorption of energy by the atmosphere are linked with changes in regional circulation and precipitation patterns, leading to increased precipitation in some regions and decreases in others. BC solar absorption increases the energy input to the atmosphere by as much as 5–15 per cent, with the BC measures removing the bulk of that heating. Results are shown for two independent models to highlight the similarity in the projections of where large regional decreases would occur.

16
Integrated Assessment of Black Carbon and Tropospheric Ozone
*MVMÅ\[�WN�\PM�UMI[]ZM[�NWZ�human health
Fine particulate matter (measured as PM2.5, which includes BC) and ground-level O3 damage human health. PM2.5 causes premature deaths primarily from heart disease and lung cancer, and O3 exposure causes deaths primarily from respiratory QTTVM[[��<PM�PMIT\P�JMVMÅ\�M[\QUI\M[�QV�the Assessment are limited to changes in \PM[M�[XMKQÅK�KI][M[�WN�LMI\P�IVL�QVKT]LM�uncertainty in the estimation methods. However, these pollutants also contribute [QOVQÅKIV\Ta�\W�W\PMZ�PMIT\P�QUXIK\[�including acute and chronic bronchitis and other respiratory illness, non-fatal heart attacks, low birth weight and results in increased emergency room visits and hospital admissions, as well as loss of work and school days.
Under the reference scenario, that is, _Q\PW]\�QUXTMUMV\I\QWV�WN�\PM�QLMV\QÅML�measures, changes in concentrations of PM2.5 and O3 in 2030, relative to 2005, would have substantial effects globally on premature deaths related to air pollution. By region, premature deaths from outdoor pollution are projected to change in line with emissions. The latter are expected to LMKZMI[M�[QOVQÅKIV\Ta�W^MZ�6WZ\P�)UMZQKI�and Europe due to implementation of the existing and expected legislation. Over Africa and Latin America and the Caribbean, the number of premature deaths from these pollutants is expected to show modest changes under the reference scenario (Figure 7). Over Northeast Asia, Southeast )[QI�IVL�8IKQÅK��XZMUI\]ZM�LMI\P[�IZM�projected to decrease substantially due to reductions in PM2.5 in some areas. However, in South, West and Central Asia, premature LMI\P[�IZM�XZWRMK\ML�\W�ZQ[M�[QOVQÅKIV\Ta�L]M�to growth in emissions.
In contrast to the reference scenario, full QUXTMUMV\I\QWV�WN�\PM�UMI[]ZM[�QLMV\QÅML�in the Assessment would substantially improve air quality and reduce premature LMI\P[�OTWJITTa�L]M�\W�[QOVQÅKIV\�ZML]K\QWV[�
in indoor and outdoor air pollution. The reductions in PM2.5 concentrations resulting from the BC measures would, by 2030, avoid an estimated 0.7–4.6 million annual premature deaths due to outdoor air pollution (Figure 1).
:MOQWVITTa��QUXTMUMV\I\QWV�WN�\PM�QLMV\QÅML�measures would lead to greatly improved air quality and fewer premature deaths, especially in Asia (Figure 7). In fact, more \PIV� ��XMZ�KMV\�WN�\PM�PMIT\P�JMVMÅ\[�WN�implementing all measures occur in Asia. <PM�JMVMÅ\[�IZM�TIZOM�MVW]OP�NWZ�ITT�\PM�worsening trends in human health due to outdoor air pollution to be reversed and turned into improvements, relative to 2005. 1V�)NZQKI��\PM�JMVMÅ\�Q[�[]J[\IV\QIT��IT\PW]OP�not as great as in Asia.
*MVMÅ\[�WN�\PM�UMI[]ZM[�NWZ�crop yields
Ozone is toxic to plants. A vast body of literature describes experiments and observations showing the substantial effects of O3 on visible leaf health, growth and productivity for a large number of crops, trees and other plants. Ozone also affects vegetation composition and diversity. Globally, the full implementation of CH4 UMI[]ZM[�ZM[]T\[�QV�[QOVQÅKIV\�ZML]K\QWV[�QV�O3 concentrations leading to avoided yield losses of about 25 million tonnes of four staple crops each year. The implementation of the BC measures would account for about a further 25 million tonnes of avoided yield losses in comparison with the reference [KMVIZQW��.QO]ZM�����<PQ[�Q[�L]M�\W�[QOVQÅKIV\�reductions in emissions of the precursors CO, VOCs and NOX that reduce O3
concentrations.
The regional picture shows considerable differences. Under the reference scenario, O3 concentrations over Northeast, Southeast )[QI�IVL�8IKQÅK�IZM�XZWRMK\ML�\W�QVKZMI[M��resulting in additional crop yield losses (Figure 8). In South, West and Central Asia, both health and agricultural damage are projected to rise (Figures 7 and 8). Damage

17
Summary for Decision Makers
to agriculture is projected to decrease strongly over North America and Europe while changing minimally over Africa and Latin America and the Caribbean. For the whole Asian region maize yields show a decrease of 1–15 per cent, while yields decrease by less than 5 per cent for wheat and rice. These yield losses translate into nearly 40 million tonnes for all crops for the whole Asian region, ZMÆMK\QVO�\PM�[]J[\IV\QIT�K]T\Q^I\ML�IZMI�exposed to elevated O3 concentrations in India – in particular the Indo-Gangetic Plain region. Rice production is also affected, particularly in Asia where elevated O3 concentrations are likely to continue to increase to 2030. Yield loss values for rice are uncertain, however, due to a lack of experimental evidence on concentration-response functions. In contrast, the European and North American regional analyses suggest that all crops will see an improvement in yields under the reference scenario between 2005 and 2030. Even greater improvements would be seen upon implementation of the measures.
<PM�QLMV\QÅML�UMI[]ZM[�TMIL�\W�OZMI\Ta�reduced O3 concentrations, with substantial JMVMÅ\[�\W�KZWX�aQMTL[��M[XMKQITTa�QV�)[QI��.QO]ZM� ���<PM�JMVMÅ\[�WN�\PM�UMI[]ZM[�IZM�
large enough to reverse all the worsening trends seen in agricultural yields and turn them into improvements, relative to 2005, with the exception of crop yields in Northeast IVL�;W]\PMI[\�)[QI�IVL�8IKQÅK��-^MV�QV�\PI\�KI[M��\PM�JMVMÅ\[�WN�N]TT�QUXTMUMV\I\QWV�IZM�quite large, with the measures reducing by 60 per cent the crop losses envisaged in the reference scenario.
It should be stressed that the Assessment’s analyses include only the direct effect of changes in atmospheric composition on health and agriculture through changes in exposure to pollutants. As such, they do not include \PM�JMVMÅ\[�\PI\�I^WQLML�KTQUI\M�KPIVOM�would have on human health and agriculture due to factors such as reduced disruption of precipitation patterns, dimming, and reduced frequency of heat waves. Furthermore, even \PM�LQZMK\�QVÆ]MVKM�WV�aQMTL[�IZM�JI[ML�WV�estimates for only four staple crops, and impacts on leafy crops, productive grasslands and food quality were not included, so that the calculated values are likely to be an underestimate of the total impact. In addition, extrapolation of results from a number of experimental studies to assess O3 impacts on ecosystems strongly suggests that reductions
Figure 7. Comparison of premature mortality (millions of premature deaths annually) by region, showing the change in 2030 in comparison with 2005 for the reference scenario emission trends and the reference plus CH4 + BC measures. The lines on each bar show the range of estimates.
1.5
2
1
0.5
0
-0.5
-1
-1.5
-2
-2.5
-3
Reference
CH4 + BCmeasures
Africa NortheastAsia,
Southeast Asia and
Paci!c
LatinAmerica
andCaribbean
North America
andEurope
South,West and
Central Asia

18
Integrated Assessment of Black Carbon and Tropospheric Ozone
in O3 could lead to substantial increases in the net primary productivity. This could have a substantial impact on carbon sequestration, XZW^QLQVO�ILLQ\QWVIT�KTQUI\M�JMVMÅ\[��
Relative importance and
[KQMV\QÅK�KWVÅLMVKM�QV�\PM�measures
Methane measures have a large impact on global and regional warming, which is achieved by reducing the greenhouse gases CH4 and O3. The climate mitigation impacts of the CH4 measures are also the most certain JMKI][M�\PMZM�Q[�I�PQOP�LMOZMM�WN�KWVÅLMVKM�in the warming effects of this greenhouse gas. The reduced methane and hence O3 KWVKMV\ZI\QWV[�IT[W�TMIL�\W�[QOVQÅKIV\�JMVMÅ\[�for crop yields. <PM�*+�UMI[]ZM[�QLMV\QÅML�PMZM�ZML]KM�concentrations of BC, OC and O3 (largely through reductions in emissions of CO). The warming effect of BC and O3 and the compensating cooling effect of OC, introduces large uncertainty in the net effect of some BC measures on global warming (Figure 1). Uncertainty in the impact of BC measures is also larger than that for CH4 JMKI][M�*+�IVL�7+�KIV�QVÆ]MVKM�KTW]L[�that have multiple effects on climate that are not fully understood. This uncertainly in global impacts is particularly large for the
Figure 8. Comparison of crop yield losses (million tonnes annually of four key crops – wheat, rice, maize and soy combined) by region, showing the change in 2030 compared with 2005 for the reference emission trends and the reference + CH4 + BC measures. The lines on each bar show the range of estimates.
100
50
0
-50
-100
-150Africa
Reference
CH4 + BCmeasures
NortheastAsia,
SoutheastAsia and
Paci!c
LatinAmerica
andCaribbean
NorthAmerica
andEurope
South,West and
Central Asia
The measures identi!ed in the Assessment include replacement of traditional cookstoves, such as that shown here, with clean burning stoves which wouldsubstantially improve air quality and reduce premature deaths due to indoor and outdoor air pollution.
Cred
it: V
eera
bhad
ran
Ram
anat
han

19
Summary for Decision Makers
measures concerning biomass cookstoves and open burning of biomass. Hence with respect to global warming, there is much higher KWVÅLMVKM�NWZ�UMI[]ZM[�\PI\�UQ\QOI\M�LQM[MT�emissions than biomass burning because the proportion of co-emitted cooling OC particles is much lower for diesel.
7V�\PM�W\PMZ�PIVL��\PMZM�Q[�PQOPMZ�KWVÅLMVKM�that BC measures have large impacts on human health through reducing concentrations of inhalable particles, on crop yields through reduced O3, and on climate phenomena such as tropical rainfall, monsoons and snow-ice melt. These regional impacts are largely independent of the measures’ impact on global warming. In fact, regionally, biomass cookstoves and open biomass burning can have much larger effects than fossil fuels. This is because BC directly increases atmospheric heating by absorbing sunlight, which, according to numerous published studies, affects the monsoon and tropical rainfall, and this is largely separate from the effect of co-emitted OC. The same conclusion applies with respect to the impact of BC measures on snow IVL�QKM��*+��JMKI][M�Q\�Q[�LIZS��[QOVQÅKIV\Ta�increases absorption of sunlight by snow and ice when it is deposited on these bright surfaces. OC that is deposited along with BC has very TQ\\TM�MNNMK\�WV�[]VTQOP\�ZMÆMK\ML�Ja�[VW_�IVL�ice since these surfaces are already very white. Hence knowledge of these regional impacts is, in some cases, more robust than the global impacts, and with respect to reducing regional impacts, all of the BC measures are likely to be [QOVQÅKIV\��+WVÅLMVKM�Q[�IT[W�PQOP�\PI\�I�TIZOM�
XZWXWZ\QWV�WN�\PM�PMIT\P�IVL�KZWX�JMVMÅ\[�would be realized in Asia.
5MKPIVQ[U[�NWZ�ZIXQL�implementation
In December 2010 the Parties to the UNFCCC agreed that warming should not M`KMML��â+�IJW^M�XZM�QVL][\ZQIT�TM^MT[�L]ZQVO�this century. This Assessment shows that measures to reduce SLCFs, implemented in combination with CO2 control measures, would increase the chances of staying below \PM��â+�\IZOM\��<PM�UMI[]ZM[�_W]TL�IT[W�slow the rate of near-term temperature rise IVL�IT[W�TMIL�\W�[QOVQÅKIV\�QUXZW^MUMV\[�in health, decreased disruption of regional precipitation patterns and water supply, and in improved food security. The impacts of the measures on temperature change are felt over large geographical areas, while the air quality impacts are more localized near the regions where changes in emissions take place. Therefore, areas that control their emissions will receive the greatest human health and NWWL�[]XXTa�JMVMÅ\[#�ILLQ\QWVITTa�UIVa�WN�\PM�KTQUI\M�JMVMÅ\[�_QTT�JM�NMT\�KTW[M�\W�\PM�ZMOQWV�taking action.
<PM�JMVMÅ\[�_W]TL�JM�ZMITQbML�QV�\PM�VMIZ�term, thereby providing additional incentives \W�W^MZKWUM�ÅVIVKQIT�IVL�QV[\Q\]\QWVIT�hurdles to the adoption of these measures. Countries in all regions have successfully QUXTMUMV\ML�\PM�QLMV\QÅML�UMI[]ZM[�\W�some degree for multiple environment and development objectives. These experiences
Widespread haze over the Himalayas where BC concentrations can be as high as in mid-sized cities.
Reducing emissions should lower glacial melt and decrease the risk of outbursts from glacial lakes.
Cred
it: V
eera
bhad
ran
Ram
anat
han
Cred
it: G
ovin
d Jo
shi

20
Integrated Assessment of Black Carbon and Tropospheric Ozone
provide a considerable body of knowledge and potential models for others that wish to take action.
In most countries, mechanisms are already in place, albeit at different levels of maturity, to address public concern regarding air pollution problems. Mechanisms to tackle anthropogenic greenhouse gases are less well deployed, and systems to maximize \PM�KW�JMVMÅ\[�NZWU�ZML]KQVO�IQZ�XWTT]\QWV�and measures to address climate change are virtually non-existent. Coordination across institutions to address climate, air pollution, energy and development policy is particularly important to enhance achievement of all these goals simultaneously.
Many BC control measures require implementation by multiple actors on diffuse emission sources including diesel vehicles, ÅMTL�J]ZVQVO��KWWS[\W^M[�IVL�ZM[QLMV\QIT�heating. Although air quality and emission standards exist for particulate matter in some regions, they may or may not reduce BC, and implementation remains a challenge. :MTM^IVKM��JMVMÅ\[�IVL�KW[\[�WN�LQNNMZMV\�
Field burning of agricultural waste is a common way to dispose of crop residue in many regions.
To the naked eye, no emissions from an oil storage tank are visible (left), but with the aid of an infrared camera, escaping CH4 is evident (right).
Cred
it: U
S EP
ACr
edit:
Bria
n Ya
p
measures vary from region to region. Many of the measures entail cost savings but require substantial upfront investments. Accounting for air quality, climate and LM^MTWXUMV\�KW�JMVMÅ\[�_QTT�JM�SMa�\W�[KITQVO�up implementation.
Methane is one of the six greenhouse gases governed by the Kyoto Protocol, but there are no explicit targets for it. Many CH4 measures are cost-effective and its recovery is, in many KI[M[��MKWVWUQKITTa�XZWÅ\IJTM��<PMZM�PI^M�been many Clean Development Mechanism (CDM) projects in key CH4 emitting sectors in the past, though few such projects have been launched in recent years because of lack of ÅVIVKQVO��
Case studies from both developed and developing countries (Box 3) show that there are technical solutions available to deliver all of the measures (see Chapter 5 of the underlying report). Given appropriate policy mechanisms the measures can be implemented, but to achieve the JMVMÅ\[�I\�\PM�[KITM�LM[KZQJML�U]KP�_QLMZ�implementation is required.

21
Summary for Decision Makers
Box 3: Case studies of implementation of measures CH4 measuresLand"ll biogas energy Land!ll CH4 emissions contribute 10 per cent of the total greenhouse gas emissions in Mexico. Bioenergia de Nuevo Léon S.A. de C.V. (BENLESA) is using land!ll biogas as fuel. Currently, the plant has an installed capacity of 17 megawatts. Since its opening in September 2003, it has avoided the release of more than 81 000 tonnes of CH4, equivalent to the reduction in emissions of 1.7 million tonnes of CO2, generating 409 megawatt hours of electricity. A partnership between government and a private company turned a liability into an asset by converting land!ll gas (LFG) into electricity to help drive the public transit system by day and light city streets by night. LFG projects can also be found in Armenia, Brazil, China, India, South Africa, and other countries.
Recovery and #aring from oil and natural gas productionOil drilling often brings natural gas, mostly CH4, to the surface along with the oil, which is often vented to the atmosphere to maintain safe pressure in the well. To reduce these emissions, associated gas may be "ared and converted to CO2, or recovered, thus eliminating most of its warming potential and removing its ability to form ozone (O3). In India, Oil India Limited (OIL), a national oil company, is undertaking a project to recover the gas, which is presently "ared, from the Kumchai oil !eld, and send it to a gas processing plant for eventual transport and use in the natural gas grid. Initiatives in Angola, Indonesia and other countries are "aring and recovering associated gas yielding large reductions in CH4 emissions and new sources of fuel for local markets.
Livestock manure management In Brazil, a large CDM project in the state of Mina Gerais seeks to improve waste management systems to reduce the amount of CH4 and other greenhouse gas emissions associated with animal e&uent. The core of the project is to replace open-air lagoons with ambient temperature anaerobic digesters to capture and combust the resulting biogas. Over the course of a 10-year period (2004–2014) the project plans to reduce CH4 and other greenhouse gas emissions by a total of 50 580 tonnes of CO2 equivalent. A CDM project in Hyderabad, India, will use the poultry litter CH4 to generate electricity which will power the plant and supply surplus electricity to the Andhra Pradesh state grid.
Farm scale anaerobic digestion of manure from cattle is one of the key CH4 measures
Cred
it: R
apha
ël V
/"ic
kr

22
Integrated Assessment of Black Carbon and Tropospheric Ozone
Box 3: Case studies of implementation of measures (continued)
BC measuresDiesel particle "ltersIn Santiago, municipal authorities, responding to public concern on air pollution, adopted a new emissions standard for urban buses, requiring installation of diesel particle !lters (DPFs). Currently about one-third of the "eet is equipped with !lters; it is expected that the entire "eet will be retro!tted by 2018. New York City adopted regulations in 2000 and 2003 requiring use of DPFs in city buses and o#-road construction equipment working on city projects. London !tted DPFs to the city’s bus "eet over several years beginning in 2003. Low emission zones in London and other cities create incentives for diesel vehicle owners to retro!t with particle !lters, allowing them to drive within the city limits. Implementation in developing regions will require greater availability of low sulphur diesel, which is an essential prerequisite for using DPFs.
Improved brick kilnsSmall-scale traditional brick kilns are a signi!cant source of air pollution in many developing countries; there are an estimated 20 000 in Mexico alone, emitting large quantities of particulates. An improved kiln design piloted in Ciudad Juárez, near the border with the United States of America, improved e%ciency by 50 per cent and decreased particulate pollution by 80 per cent. In the Bac Ninh province of Viet Nam, a project initiated with the aim of reducing ambient air pollution levels and deposition on surrounding rice !elds piloted the use of a simple limestone scrubbing emissions control device and demonstrated how a combination of regulation, economic tools, monitoring and technology transfer can signi!cantly improve air quality.
A traditional brick kiln (left) and an improved klin design (right) operating in Mexico.
Potential international
regulatory responses
International responses would facilitate rapid and widespread implementation of the measures. Since a large portion of the impacts of SLCFs on climate, health, food security and ecosystems is regional or local in nature, regional approaches incorporating national actions could prove promising for their cost-effective reduction. This approach is still in its very early stage in most regions of the world. For example, the Convention on Long-Range Transboundary Air Pollution
Cred
it: R
ober
t Mar
quez
Cred
it: A
lba
Corra
l Avi
tia
(CLRTAP) recently agreed to address BC in the revision of the Gothenburg Protocol in 2011 and to consider the impacts of CH4 as an O3 precursor in the longer term.
Other regional agreements (Box 4) are fairly new, and predominantly concentrate on [KQMV\QÅK�KWWXMZI\QWV�IVL�KIXIKQ\a�J]QTLQVO��These arrangements might serve as a platform from which to address the emerging challenges related to air pollution from BC and tropospheric O3 and provide potential ^MPQKTM[�NWZ�ÅVIVKM��\MKPVWTWOa�\ZIV[NMZ�IVL�capacity development. Sharing good practices

23
Summary for Decision Makers
on an international scale, as is occurring within the Arctic Council, in a coordinated way could provide a helpful way forward.
This Assessment did not assess the cost-MNNMK\Q^MVM[[�WN�LQNNMZMV\�QLMV\QÅML�UMI[]ZM[�or policy options under different national circumstances. Doing so would help to inform national air quality and climate policy makers, and support implementation on a wider scale. Further study and analyses of the local application of BC and tropospheric O3 reduction technologies, costs and regulatory approaches could contribute to advancing adoption of effective action at multiple levels. This work would be best done based on local knowledge. Likewise further evaluation of the ZMOQWVIT�IVL�OTWJIT�JMVMÅ\[�WN�QUXTMUMV\QVO�[XMKQÅK�UMI[]ZM[�Ja�ZMOQWV�_W]TL�PMTX�\W�better target policy efforts. In support of these efforts, additional modelling and monitoring IVL�UMI[]ZMUMV\�IK\Q^Q\QM[�IZM�VMMLML�\W�ÅTT�remaining knowledge gaps. 7XXWZ\]VQ\QM[�NWZ�QV\MZVI\QWVIT�ÅVIVKQVO�IVL�KWWXMZI\QWV
<PM�TIZOM[\�JMVMÅ\[�_W]TL�JM�LMTQ^MZML�QV�ZMOQWV[�_PMZM�Q\�Q[�]VTQSMTa�\PI\�[QOVQÅKIV\�national funds would be allocated to these issues due to other pressing development VMML[��1V\MZVI\QWVIT�ÅVIVKQVO�IVL�\MKPVWTWOa�support would catalyse and accelerate \PM�ILWX\QWV�WN�\PM�QLMV\QÅML�UMI[]ZM[�I\�sub-national, national and regional levels,
especially in developing countries. Financing _W]TL�JM�UW[\�MNNMK\Q^M�QN�[XMKQÅKITTa�\IZOM\ML�towards pollution abatement actions that UI`QUQbM�IQZ�Y]ITQ\a�IVL�KTQUI\M�JMVMÅ\[��
Funds and activities to address CH4 (such as the Global Methane Initiative; and the Global Methane Fund or Prototype Methane Financing Facility) and cookstoves (the Global Alliance for Clean Cookstoves) exist or are under consideration and may serve as models for other sectors. Expanded action will depend on donor recognition of the opportunity represented by SLCF reductions as a highly effective means to address near-term climate change both globally and especially in sensitive regions of the world.
Black carbon and tropospheric O3 may also be considered as part of other environment, development and energy initiatives such as bilateral assistance, the UN Development Assistance Framework, the World Bank Energy Strategy, the Poverty and Environment Initiative of UNEP and the United Nations Development Programme (UNDP), interagency cooperation initiatives in the UN system such as the Environment Management Group and UN Energy, the UN Foundation, and the consideration by the UN Conference on Sustainable Development (Rio+20) of the institutional framework for sustainable development. These, and others, could take IL^IV\IOM�WN�\PM�WXXWZ\]VQ\QM[�QLMV\QÅML�QV�\PM�Assessment to achieve their objectives.
Box 4: Examples of regional atmospheric pollution agreementsThe Convention on Long-Range Transboundary Air Pollution (CLRTAP) is a mature policy framework covering Europe, Central Asia and North America. Similar regional agreements have emerged in the last decades in other parts of the world. The Malé Declaration on Control and Prevention of Air Pollution and its Likely Transboundary E#ects for South Asia was agreed in 1998 and addresses air quality including tropospheric O3 and particulate matter. The Association of Southeast Asian Nations (ASEAN) Haze Protocol is a legally binding agreement addressing particulate pollution from forest !res in Southeast Asia. In Africa there are a number of framework agreements between countries in southern Africa (Lusaka Agreement), in East Africa (Nairobi Agreement); and West and Central Africa (Abidjan Agreement). In Latin America and the Caribbean a ministerial level intergovernmental network on air pollution has been formed and there is a draft framework agreement and ongoing collaboration on atmospheric issues under UNEP’s leadership.

24
Integrated Assessment of Black Carbon and Tropospheric Ozone
Concluding RemarksThe Assessment establishes the climate co-JMVMÅ\[�WN�IQZ�Y]ITQ\a�UMI[]ZM[�\PI\�ILLZM[[�black carbon and tropospheric ozone and its precursors, especially CH4 and CO. The UMI[]ZM[�QLMV\QÅML�\W�ILLZM[[�\PM[M�[PWZ\�lived climate forcers have been successfully tried around the world and have been [PW_V�\W�LMTQ^MZ�[QOVQÅKIV\�IVL�QUUMLQI\M�LM^MTWXUMV\�IVL�MV^QZWVUMV\IT�JMVMÅ\[�QV�the local areas and regions where they are implemented.
+W[\[�IVL�JMVMÅ\[�WN�\PM�QLMV\QÅML�UMI[]ZM[�IZM�ZMOQWV�[XMKQÅK��IVL�QUXTMUMV\I\QWV�WN\MV�NIKM[�ÅVIVKQIT��ZMO]TI\WZa�IVL�institutional barriers. However, widespread QUXTMUMV\I\QWV�WN�\PM�QLMV\QÅML�UMI[]ZM[�can be effectively leveraged by recognizing that near-term strategies can slow the rate of global and regional warming, improving our chances of keeping global temperature QVKZMI[M�JMTW_�JW]VL[�\PI\�[QOVQÅKIV\Ta�TW_MZ�the probability of major disruptive climate events. Such leverage should spur multilateral initiatives that focus on local priorities and contribute to the global common good.
It is nevertheless stressed that this Assessment does not in any way suggest postponing immediate and aggressive global action on anthropogenic greenhouse gases; in fact it requires such action on CO2. This Assessment concludes that the chance of success with such longer-term measures can be greatly enhanced by simultaneously addressing short-lived climate forcers.
<PM�JMVMÅ\[�QLMV\QÅML�QV�\PQ[�)[[M[[UMV\�KIV�be realised with a concerted effort globally to reduce the concentrations of black carbon and tropospheric ozone. A strategy to achieve this, when developed and implemented, will lead \W�KWV[QLMZIJTM�JMVMÅ\[�NWZ�P]UIV�_MTT�JMQVO�
Aerosol measurement instruments
Cred
it: C
hrist
ian
Lage
rek
Cred
it: Jo
hn O
gren
, NO
AA

25
Summary for Decision Makers
Glossary
Aerosol A collection of airborne solid or liquid particles (excluding pure water), with a typical size between 0.01 and 10 micrometers (µm) and residing in the atmosphere for at least several hours. Aerosols may be of either natu-ral or anthropogenic origin. Aerosols may influence climate in two ways: directly through scattering or absorbing radiation, and indirectly through acting as condensation nuclei for cloud formation or modifying the opti-cal properties and lifetime of clouds.
Biofuels Biofuels are non-fossil fuels. They are energy carriers that store the energy derived from organic materials (biomass), including plant materials and animal waste.
Biomass In the context of energy, the term biomass is often used to refer to organic materials, such as wood and agricultural wastes, which can be burned to produce energy or converted into a gas and used for fuel.
Black carbon Operationally defined aerosol species based on measurement of light absorption and chemical reactivity and/or thermal stability. Black carbon is formed through the incomplete combustion of fossil fuels, biofuel, and biomass, and is emitted in both anthropogenic and naturally occurring soot. It consists of pure carbon in several linked forms. Black carbon warms the Earth by absorbing heat in the atmosphere and by reducing albedo, the ability to reflect sunlight, when deposited on snow and ice.
Carbon sequestration
The uptake and storage of carbon. Trees and plants, for example, absorb carbon dioxide, release the oxygen and store the carbon.
Fugitive emissions
Substances (gas, liquid, solid) that escape to the air from a process or a product without going through a smokestack; for example, emissions of methane escaping from coal, oil, and gas extraction not caught by a cap-ture system.
Global warming potential (GWP)
The global warming potential of a gas or particle refers to an estimate of the total contribution to global warming over a particular time that results from the emission of one unit of that gas or particle relative to one unit of the reference gas, carbon dioxide, which is assigned a value of one.
High-emitting vehicles
Poorly tuned or defective vehicles (including malfunctioning emission control systems), with emissions of air pollutants (including particulate matter) many times greater than the average.
Ho!man kiln Hoffmann kilns are the most common kiln used in production of bricks. A Hoffmann kiln consists of a main fire passage surrounded on each side by several small rooms which contain pallets of bricks. Each room is connect-ed to the next room by a passageway carrying hot gases from the fire. This design makes for a very efficient use of heat and fuel.
Incomplete combustion
A reaction or process which entails only partial burning of a fuel. Combus-tion is almost always incomplete and this may be due to a lack of oxygen or low temperature, preventing the complete chemical reaction.
Oxidation The chemical reaction of a substance with oxygen or a reaction in which the atoms in an element lose electrons and its valence is correspondingly increased.

26
Integrated Assessment of Black Carbon and Tropospheric Ozone
Ozone Ozone, the triatomic form of oxygen (O3), is a gaseous atmospheric constit-uent. In the troposphere, it is created both naturally and by photochemical reactions involving gases resulting from human activities (it is a primary component of photochemical smog). In high concentrations, tropospheric ozone can be harmful to a wide range of living organisms. Tropospheric ozone acts as a greenhouse gas. In the stratosphere, ozone is created by the interaction between solar ultraviolet radiation and molecular oxygen. Stratospheric ozone provides a shield from ultraviolet B (UVB) radiation.
Ozone precursor
Chemical compounds, such as carbon monoxide (CO), methane (CH4), non-methane volatile organic compounds (NMVOC), and nitrogen oxides (NOX), which in the presence of solar radiation react with other chemical compounds to form ozone in the troposphere.
Particulate matter
Very small pieces of solid or liquid matter such as particles of soot, dust, or other aerosols.
Pre-industrial Prior to widespread industrialisation and the resultant changes in the environment. Typically taken as the period before 1750.
Radiation Energy transfer in the form of electromagnetic waves or particles that release energy when absorbed by an object.
Radiative forcing
Radiative forcing is a measure of the change in the energy balance of the Earth-atmosphere system with space. It is defined as the change in the net, downward minus upward, irradiance (expressed in Watts per square metre) at the tropopause due to a change in an external driver of climate change, such as, for example, a change in the concentration of carbon dioxide or the output of the Sun.
Smog Classically a combination of smoke and fog in which products of com-bustion, such as hydrocarbons, particulate matter and oxides of sulphur and nitrogen, occur in concentrations that are harmful to human beings and other organisms. More commonly, it occurs as photochemical smog, produced when sunlight acts on nitrogen oxides and hydrocarbons to produce tropospheric ozone.
Stratosphere Region of the atmosphere between the troposphere and mesosphere, having a lower boundary of approximately 8 km at the poles to 15 km at the equator and an upper boundary of approximately 50 km. Depending upon latitude and season, the temperature in the lower stratosphere can increase, be isothermal, or even decrease with altitude, but the tempera-ture in the upper stratosphere generally increases with height due to absorption of solar radiation by ozone.
Trans- boundary movement
Movement from an area under the national jurisdiction of one State to or through an area under the national jurisdiction of another State or to or through an area not under the national jurisdiction of any State.
Transport (atmospheric)
The movement of chemical species through the atmosphere as a result of large-scale atmospheric motions.
Troposphere The lowest part of the atmosphere from the surface to about 10 km in altitude in mid-latitudes (ranging from 9 km in high latitudes to 16 km in the tropics on average) where clouds and “weather” phenomena occur. In the troposphere temperatures generally decrease with height.

27
Summary for Decision Makers
Acronyms and Abbreviations
ASEAN Association of Southeast Asian NationsBC black carbonBENLESA Latin America Bioenergia de Nuevo Léon S.A. de C.V. CDM Clean Development MechanismCH4 methaneCLRTAP Convention on Long-Range Transboundary Air PollutionCO carbon monoxideCO2 carbon dioxideDPF diesel particle !lterECHAM Climate-chemistry-aerosol model developed by the Max Planck Institute in Ham-
burg, GermanyEuro VI Vehicle emission standard; for diesel vehicles sets emission limits for CO, PM, NOx,
HC+NOx; requires sulphur free (≤10ppm S) fuel; mandatory in Europe for all new cars from 2015
G8 Group of Eight: Canada, France, Germany, Italy, Japan, Russian Federation, United Kingdom, United States
GAINS Greenhouse Gas and Air Pollution Interactions and SynergiesGISS Goddard Institute for Space StudiesGWP global warming potentialHC hydrocarbon; organic compound consisting entirely of hydrogen and carbonIEA International Energy AgencyIIASA International Institute for Applied System AnalysisIPCC Intergovernmental Panel on Climate ChangeLFG land!ll gasNASA National Aeronautics and Space AdministrationNOX nitrogen oxidesO3 ozoneOC organic carbonOIL Oil India LimitedPM particulate matter (PM2.5 has a diameter of 2.5µm or less)ppm parts per millionSLCF short-lived climate forcerSO2 sulphur dioxideUN United NationsUNDP United Nations Development ProgrammeUNEP United Nations Environment ProgrammeUNFCCC United Nations Framework Convention on Climate ChangeUV ultraviolet VOC volatile organic compoundWMO World Meteorological Organization

28
Integrated Assessment of Black Carbon and Tropospheric Ozone
Acknowledgements
The United Nations Environment Programme and World Meteorological Organization would like to thank the Assessment Chair and Vice-Chairs, the members of the High-level Consultative Group, all the lead and contributing authors, reviewers and review editors, and the coordination team for their contribution to the development of this Assessment.
The following individuals have provided input to the Assessment. Authors, reviewers and review editors have contributed to this report in their individual capacity and their organizations are mentioned for identi!cation purposes only.
Chair: Drew Shindell (National Aeronautics and Space Administration Goddard Institute for Space Studies, USA).
Vice-chairs: Veerabhadran Ramanathan (Scripps Institution of Oceanography, USA), Frank Raes, (Joint Research Centre, European Commission, Italy), Luis Cifuentes (The Catholic University of Chile, Chile) and N. T. Kim Oanh (Asian Institute of Technology, Thailand).
High-level Consultative Group: Ivar Baste (UNEP, Switzerland), Harald Dovland (formerly at the Ministry of Environment, Norway), Dale Evarts (US Environmental Protection Agency), Adrián Fernández Bremauntz (National Institute of Ecology, Mexico), Rob Maas (The National Institute for Public Health and the Environment, Netherlands), Pam Pearson (International Cryosphere Climate Initiative, Sweden/USA), Sophie Punte (Clean Air Initiative for Asian Cities, Philippines), Andreas Schild (International Centre for Integrated Mountain Development, Nepal), Surya Sethi (Former Principal Adviser Energy and Core Climate Negotiator, Government of India), George Varughese (Development Alternatives Group, India), Robert Watson (Department for Environment, Food and Rural A#airs, UK).
Scienti"c Coordinator: Johan C. I. Kuylenstierna (Stockholm Environment Institute, University of York, UK).
Coordinating Lead Authors: Frank Raes (Joint Research Centre, European Commission, Italy), David Streets (Argonne National Laboratory, USA), David Fowler (The Centre for Ecology and Hydrology, UK), Lisa Emberson (Stockholm Environment Institute, University of York, UK), Martin Williams (King’s College London, UK).
Lead Authors: Hajime Akimoto (Asia Center for Air Pollution Research, Japan), Markus Amann (International Institute for Applied Systems Analysis, Austria), Susan Anenberg (US Environmental Protection Agency), Paulo Artaxo (University of Sao Paulo, Brazil), Greg Carmichael (University of Iowa, USA), William Collins (UK Meteorological O%ce, UK), Mark Flanner (University of Michigan, USA), Greet Janssens-Maenhout (Joint Research Centre, European Commission, Italy), Kevin Hicks (Stockholm Environment Institute, University of York, UK), Zbigniew Klimont (International Institute for Applied Systems Analysis, Austria), Kaarle Kupiainen (International Institute for Applied Systems Analysis, Austria), Johan C. I. Kuylenstierna (Stockholm Environment Institute, University of York, UK), Nicholas Muller (Middlebury College, USA), Veerabhadran Ramanathan (Scripps Institution of Oceanography, USA), Erika Rosenthal (Earth Justice, USA), Joel Schwartz (Harvard University, USA), Sara Terry (US Environmental Protection Agency), Harry Vallack (Stockholm Environment Institute, University of York, UK), Rita Van Dingenen (Joint Research Centre, European Commission, Italy), Elisabetta Vignati (Joint Research Centre, European Commission, Italy), Chien Wang (Massachusetts Institute of Technology, USA).

29
Summary for Decision Makers
Contributing Authors: Madhoolika Agrawal (Banares Hindu University, India), Kirstin Aunan (Centre for International Climate and Environmental Research, Norway), Gufran Beig (Indian Institute of Tropical Meteorology, India), Luis Cifuentes (The Catholic University of Chile, Chile), Devaraj de Condappa (Stockholm Environment Institute, USA), Greg Faluvegi (National Aeronautics and Space Administration Goddard Institute for Space Studies, USA), Sarath Guttikunda (Urban Emissions, India/Desert Research Institute, USA), Syed Iqbal Hasnain (Calicut University, India), Christopher Heyes (International Institute for Applied Systems Analysis, Austria), Lena Höglund Isaksson (International Institute for Applied Systems Analysis, Austria), Jean-François Lamarque (National Center for Atmospheric Research, USA), Hong Liao (Institute of Atmospheric Physics, Chinese Academy of Sciences, China), Zifeng Lu (Argonne National Laboratory, USA), Vishal Mehta (Stockholm Environment Institute, USA), Lina Mercado (The Centre for Ecology and Hydrology, UK), George Milly (National Aeronautics and Space Administration Goddard Institute for Space Studies, USA), N. T. Kim Oanh (Asian Institute of Technology, Thailand), T. S. Panwar (The Energy and Resources Institute, India), David Purkey (Stockholm Environment Institute, USA), Maheswar Rupakheti (Asian Institute of Technology-UNEP Regional Resource Center for Asia and the Paci!c, Thailand), Michael Schulz (Norwegian Meteorological Institute, Norway), Stephen Sitch (University of Leeds, UK), Michael Walsh (International Council for Clean Transportation, USA), Yuxuan Wang (Tsinghua University, China), Jason West (University of North Carolina, USA), Eric Zusman (Institute for Global Environmental Studies, Japan).
External Reviewers: John Van Aardenne (European Environment Agency, Denmark), John Bachmann (Vision Air Consulting, USA), Angela Bandemehr (US Environmental Protection Agency), Ellen Baum (Clean Air Task Force, USA), Livia Bizikova (International Institute for Sustainable Development, Canada), Elizabeth Bush (Environment Canada), Zoë Chafe (University of California, Berkeley (Energy and Resources Group and School of Public Health), USA), Linda Chappell (US Environmental Protection Agency), Dennis Clare (Institute of Governance and Sustainable Development, USA), Hugh Coe (University of Manchester, UK), Benjamin DeAngelo (US Environmental Protection Agency), Pat Dolwick (US Environmental Protection Agency), Neil Frank (US Environmental Protection Agency), Sandro Fuzzi (Istituto di Scienze dell’Atmosfera e del Clima – CNR, Italy), Nathan Gillett (Environment Canada), Michael Geller (US Environmental Protection Agency), Elisabeth Gilmore (US Environmental Protection Agency), Peringe Grennfelt (Swedish Environmental Research Institute, Sweden), Andrew Grieshop (University of British Columbia, Canada), Paul Gunning (US Environmental Protection Agency), Rakesh Hooda (The Energy and Resources Institute, India), Bryan Hubbell (US Environmental Protection Agency), Mark Jacobson (Stanford University, USA), Yutaka Kondo (University of Tokyo, Japan), David Lavoué (Environment Canada), Richard Leaitch (Environment Canada), Peter Louie (Hong Kong Environmental Protection Department, Government of the Hong Kong Special Administrative Region, China), Gunnar Luderer (Potsdam Institute for Climate Impact Research, Germany), Andy Miller (US Environmental Protection Agency), Ray Minjares (International Council on Clean Transportation, USA), Jacob Moss (US Environmental Protection Agency), Brian Muehling (US Environmental Protection Agency), Venkatesh Rao (US Environmental Protection Agency), Jessica Seddon (Wallach) (US Environmental Protection Agency), Marcus Saro!m (US Environmental Protection Agency), Erika Sasser (US Environmental Protection Agency), Stephen E. Schwartz (Brookhaven National Laboratory, USA), Sangeeta Sharma (Environment Canada), Kirk Smith (University of California, USA), Joseph Somers (US Environmental Protection Agency), Darrell Sonntag (US Environmental Protection Agency), Robert Stone (The Cooperative Institute for Research in Environmental Sciences, National Oceanic and Atmospheric Administration, USA), Jessica Stre"er (Potsdam Institute for Climate Impact Research, Germany).

30
Integrated Assessment of Black Carbon and Tropospheric Ozone
Review Editors: Umesh Kulshrestha (Jawaharlal Nehru University, India), Hiromasa Ueda (Kyoto University, Japan), Piers Forster (University of Leeds, UK), Henning Rodhe (Stockholm University, Sweden), Madhav Karki (International Centre for Integrated Mountain Development, Nepal), Ben Armstrong (London School of Hygiene and Tropical Medicine, UK), Luisa Molina (Massachusetts Institute of Technology and the Molina Center for Energy and the Environment, USA), May Ajero (Clean Air Initiative for Asian Cities, Philippines).
Coordination team: Volodymyr Demkine (UNEP, Kenya), Salif Diop (UNEP, Kenya), Peter Gilruth (UNEP, Kenya), Len Barrie (WMO, Switzerland), Liisa Jalkanen (WMO, Switzerland), Johan C. I. Kuylenstierna (Stockholm Environment Institute, University of York, UK), Kevin Hicks (Stockholm Environment Institute, University of York, UK).
Administrative support: Nyokabi Mwangi (UNEP, Kenya), Chantal Renaudot (WMO, Switzerland), Emma Wright (Stockholm Environment Institute, University of York, UK), Tim Morrissey (Stockholm Environment Institute, University of York, UK).
UNEP and WMO would also like to thank the Department for Environment, Food and Rural A#airs (Defra), UK; Joint Research Centre (JRC)-European Commission, Italy; International Centre for Integrated Mountain Development (ICIMOD), Nepal; and International Institute for Applied Systems Analysis (IIASA), Austria for hosting the Assessment scoping and production meetings and the following individuals from around the world for their valuable comments, provision of data and advice:
Joseph Alcamo (UNEP, Kenya), Sribas Bhattacharya, (Stockholm Environment Institute, Sweden), Banmali Pradhan Bidya (International Centre for Integrated Mountain Development, Nepal), Tami Bond (University of Illinois, USA), David Carslon (International Polar Year/British Antarctic Survey, UK), Bradnee Chambers (UNEP, Kenya), Paolo Cristofanelli (EVK2CNR, Italy), Janusz Cofala (International Institute for Applied Systems Analysis, Austria), Prakash Manandhanr Durga (Department of Hydrology and Meteorology, Nepal), Joan Eamer (formerly at the GRID-Arendal, Norway), David Fahey (National Oceanic and Atmospheric Administration, Earth System Research Laboratory, USA), Sara Feresu (Institute of Environmental Studies, Zimbabwe), Francis X. Johnson, (Stockholm Environment Institute, Sweden), Rijan Bhakta Kayastha (Kathmandu University, Nepal), Terry Keating (US Environmental Protection Agency), Marcel Kok (Netherlands Environmental Assessment Agency, Netherlands), Richard Mills (International Union of Air Pollution Prevention and Environmental Protection Associations, UK and Global Atmospheric Pollution Forum), Lev Neretin, (UNEP, USA), Neeyati Patel (UNEP, Kenya), Kristina Pistone (Scripps Institution of Oceanography, USA), Peter Prokosch (GRID-Arendal, Norway), Mark Radka (UNEP, France), N. H. Ravindranath (Centre for Sustainable Technologies, India), A. R. Ravishankara (National Oceanic and Atmospheric Administration, USA), Lars-Otto Reiersen (Arctic Monitoring and Assessment Programme, Norway), Vladimir Ryabinin (WMO, Switzerland), Wolfgang Schöpp (International Institute for Applied Systems Analysis, Austria), Basanta Shrestha (International Centre for Integrated Mountain Development, Nepal), Ashbindu Singh (UNEP, USA), Clarice Wilson (UNEP, Kenya), Ron Witt (UNEP, Switzerland), Valentin Yemelin (GRID-Arendal, Norway).

About the Assessment:
ozone on human well-being and the climatic system has catalysed a demand for information and action from governments, civil society and other main stakeholders. The United Nations, in consultation with partner expert institutions and stakeholder representatives, organized an integrated assessment of black carbon and tropospheric ozone, and its precursors, to provide decision makers with a comprehensive assessment of the problem and policy options needed to address it.
An assessment team of more than 50 experts was established, supported by the United Nations Environment Programme, World Meteorological Organization and Stockholm Environment Institute. The Assessment was governed by the Chair and
Caribbean and North America regions. A High-level Consultative Group, comprising
international organizations and civil society, provided strategic advice on the assessment process and preparation of the Summary for Decision Makers.
The draft of the underlying Assessment and its Summary for Decision Makers were extensively reviewed and revised based on comments from internal and external review experts. Reputable experts served as review editors to ensure that all
authors. The text of the Summary for Decision Makers was accepted by the Assessment Chair, Vice-Chairs and the High-level Consultative Group members.

ISBN: 978-92-807-3142-2Job. No: DEW/1352/NA
United Nations Environment ProgrammeP.O. Box 30552 - 00100 Nairobi, Kenya
Tel.: +254 20 762 1234Fax: +254 20 762 3927
e-mail: [email protected]
www.unep.org
This document summarizes findings and conclusions of the assessment report: Integrated Assessment of Black Carbon and Tropospheric Ozone. The assessment looks into all aspects of anthropogenic emissions of black carbon and tropospheric ozone precursors, such as methane. It analyses the trends in emissions of these substances and the drivers of these emissions; summarizes the science of atmospheric processes where these substances are involved; discusses related impacts on the climatic system, human health, crops in vulnerable regions and ecosystems; and societal responses to the environmental changes caused by those impacts. The Assessment examines a large number of potential measures to reduce harmful emissions, identifying a small set of specific measures that would likely produce the greatest benefits, and which could be implemented with currently available technology. An outlook up to 2070 is developed illustrating the benefits of those emission mitigation policies and measures for human well-being and climate. The Assessment concludes that rapid mitigation of anthropogenic black carbon and tropospheric ozone precursor emissions would complement carbon dioxide reduction measures and would have immediate benefits for human well-being.
The Summary for Decision Makers was prepared by a writing team with inputs from the members of the High-level Consultative Group and with support from UNEP and WMO. It is intended to serve decision makers at all levels as a guide for assessment, planning and management for the future.