int. j. production economicscollaboration through a comprehensive simulation model ( sari, 2010)....
TRANSCRIPT

A big data approach for logistics trajectory discoveryfrom RFID-enabled production data
Ray Y. Zhong a,b,n, George Q. Huang a, Shulin Lan a, Q.Y. Dai c, Chen Xud, T. Zhang e
a HKU-ZIRI Lab for Physical Internet, Department of Industrial and Manufacturing Systems Engineering, The University of Hong Kong, Hong Kong, Chinab College of Information Engineering, Shenzhen University, Chinac Guangdong Polytechnic Normal University, Guangzhou, Chinad Institute of Intelligent Computing Science, Shenzhen University, Shenzhen, Chinae Huaiji Dengyun Auto-parts (Holding) Co., Ltd., Huaiji, Zhaoqing, Guangdong, China
a r t i c l e i n f o
Article history:Received 18 November 2013Accepted 17 February 2015Available online 23 February 2015
Keywords:RFIDBig dataLogistics controlTrajectory patternShopfloor manufacturing
a b s t r a c t
Radio frequency identification (RFID) has been widely used in supporting the logistics management onmanufacturing shopfloors where production resources attached with RFID facilities are converted into smartmanufacturing objects (SMOs) which are able to sense, interact, and reason to create a ubiquitousenvironment. Within such environment, enormous data could be collected and used for supporting furtherdecision-makings such as logistics planning and scheduling. This paper proposes a holistic Big Data approachto excavate frequent trajectory from massive RFID-enabled shopfloor logistics data with several innovationshighlighted. Firstly, RFID-Cuboids are creatively introduced to establish a data warehouse so that the RFID-enabled logistics data could be highly integrated in terms of tuples, logic, and operations. Secondly, a MapTable is used for linking various cuboids so that information granularity could be enhanced and datasetvolume could be reduced. Thirdly, spatio-temporal sequential logistics trajectory is defined and excavated sothat the logistics operators and machines could be evaluated quantitatively. Finally, key findings from theexperimental results and insights from the observations are summarized as managerial implications, whichare able to guide end-users to carry out associated decisions.
& 2015 Elsevier B.V. All rights reserved.
1. Introduction
Big Data refers to a data set which collects large and complex datathat is hard to process using traditional applications (Jacobs, 2009).With the increasing usage of electronic devices, our daily life is facingBig Data. For instance, taking a flight journey with A380, each enginegenerates 10 TB data every 30 min; more than 12 TB Twitter data arecreated daily and Facebook generates over 25 TB log data every day. Itwas reported that the per-capita capacity to store such data hasapproximately doubled every 40 months since 1980s (Manyika et al.,2011). Manufacturing and service industry largely involve in a range ofhuman activities from high-tech products such as space craft to dailynecessities like toothbrush. Manufacturing is regarded as the “hard”parts of economy using labors, machines, tools, and raw materials toproduce finished goods for different purposes; while service sector isthe “soft” part that includes activities where people supply theirknowledge and time to improve productivity, performance, potential,
and sustainability (Eichengreen and Gupta, 2013; Hill and Hill, 2009;Terziovski, 2010).
This paper is motivated by a real-life automotive part manufacturerwhich has used RFID technology for facilitating its shopfloor manage-ment over 10 years. Logistics within manufacturing sites like ware-house and shopfloors are rationalized by RFID so that materials'movements could be real-time visualized and tracked (Dai et al.,2012). The primary application of RFID for item visibility and trace-ability is rudimentary. First of all, estimation of delivery time onmanufacturing shopfloor is basic for the sales department whengetting a customer order. That helps to ensure the delivery date,which has been estimated from past experiences and time studies.Such estimation is not reasonable and practical given the difference ofindividual operators and seasonal fluctuation (e.g. peak and offseasons). Secondly, RFID-enabled real-time manufacturing, planningand scheduling on shopfloors heavily relie on the arrival of materials,thus, the decisions on logistics trajectory are critical. This companycarries the decision using paper sheets manually which always makethe material delay. That causes many replanning and rescheduling,which greatly affect the production efficiency. Finally, the space on themanufacturing shopfloor is limited. As a result, the logistics trajec-tories of materials should be optimized. Currently, the logistics is not
Contents lists available at ScienceDirect
journal homepage: www.elsevier.com/locate/ijpe
Int. J. Production Economics
http://dx.doi.org/10.1016/j.ijpe.2015.02.0140925-5273/& 2015 Elsevier B.V. All rights reserved.
n Correspondence to: 8-23 Haking Wong Building, Pokfulam Road, Hong Kong,Tel.: þ852 22194298; fax: þ852 28586535.
E-mail address: [email protected] (R.-n. Zhong).
Int. J. Production Economics 165 (2015) 260–272

well-organized, which causes high WIP (Work-In-Progress) inventoryon manufacturing shopfloors.
In order to address the above hurdles, the senior managementmade a decision to explore a solution from making full use of suchRFID-enabled logistics Big Data. Unfortunately, they are facingseveral challenges. Firstly, manufacturing resources equipped withRFID devices are converted into smart manufacturing objects(SMOs) whose movements generate large number of logistics datasince SMOs are able to sense, interact, and reason each other tocarry out logistics logics. The enormous RFID-enabled logisticsdata closely relate to the complex operations on manufacturingshopfloors (Zhong et al., 2013). That leads to a great challenge forfurther analysis and knowledge discovery. Secondly, the RFID-enabled logistics Big Data usually include some “noise” such asincomplete, redundant, and inaccurate records, which couldgreatly affect the quality and reliability of decisions. Therefore,elimination of the redundancy is necessary (Zhong et al., 2013).However, current methods are not suitable for removing the abovenoises due to the high complex and specific characteristics of RFIDBig Data. Finally, mining frequent trajectory knowledge is signifi-cant for determining the logistics plans and layout of distributionfacilities. However, the knowledge hidden in the RFID-enabled BigData is sporadic. That means hundreds of RFID records may createa piece of information which indicates the detailed logic opera-tions. To achieve the creation is very challenging.
This paper proposes a holistic Big Data approach to excavatethe frequent trajectory from massive RFID-enabled manufacturingdata for supporting production logistics decision-makings. Thisapproach comprises several key steps: warehousing for raw RFIDdata, cleansing mechanism for RFID Big Data, mining frequentpatterns, as well as pattern interpretation and visualization.
The rest of this paper is organized as follows. Section 2 brieflyreviews the related work such as RFID in production logistics control,frequent trajectory pattern mining, and Big Data in Manufacturing.Section 3 presents a RFID-enabled logistics control through introducingthe deployment of RFID devices to create a RFID-enabled ubiquitousmanufacturing site and logistics operations within it. Section 4demonstrates the RFID logistics data warehouse and spatio-temporalsequential RFID patterns. Section 5 proposes a Big Data approach interms of framework, key algorithms for discovering trajectory knowl-edge from RFID-enabled manufacturing data, as well as an example tovalidate the proposed approach. Experiments and discussions, includ-ing design of experiments, evaluations, and managerial implicationsare presented in Section 6. Section 7 concludes this paper by giving ourmajor findings and future work.
2. Literature review
This section reviews related research which is categorized intothree dimensions: RFID in production logistics control, frequenttrajectory pattern mining, and Big Data in manufacturing.
2.1. RFID in production logistics control
Due to the bright advantages of RFID technology, it has beenwidely used for production and logistics control in supply chainmanagement (SCM) (Sarac et al., 2010). This section briefly reviewsthis topic from theoretical and practical aspects.
In theoretical perspective, large number of models and frame-works has been proposed. For creating value from RFID-enabled SCM,a contingency model was proposed in logistics and manufacturingenvironments (Wamba and Chatfield, 2009). The model draws on aframework and analyzes five contingency factors which greatlyinfluence value creation. Since RFID could be used for supportingdifferent decision-makings, theoretical models are important. A cost
of ownership (COO) model for RFID logistics system was introducedin order to support the decision-making process in an infrastructureconstruction (Kim and Sohn, 2009). This paper established threescenarios using the RFID system to evaluate the expected profit,helping companies to choose the most beneficial RFID logisticssystem. RFID is supposed to facilitate end-users decision-making inproduction logistics control. To assist the managers' determination ofappropriate operational and environmental conditions under theadoption of RFID, a framework was presented at different levels ofcollaboration through a comprehensive simulation model (Sari,2010). Within the RFID-enabled environment, real-time data couldbe captured and collected. These data can be used for differentpurposes. A model thus for determining the RFID real-time informa-tion sharing and inventory monitoring works on environmental andeconomic benefits was proposed (Nativi and Lee, 2012). This studyimplies that the economic benefits are achieved through carrying outnumerical studies. In practical perspectives, RFID technology hasbeen used for controlling the production and logistics. A warehousemanagement system (WMS) with RFID was designed for monitoringresources and controlling operations (Poon et al., 2009). In thissystem, the data collection and information sharing are facilitatedby RFID. With the information, case-based logistics control isrealized. In order to improve remanufacturing efficiency, RFIDtechnology was used for examining the benefits in practice (Ferreret al., 2011). This paper gives a framework for considering the RFIDadoption in terms of location identification and remanufacturingprocess optimization. Currently, autonomy in production and logis-tics attracts many attentions in practical fields. RFID was investigatedto autonomous cooperating logistics processes to react quickly andflexibly to an increasing dynamic ambience (Windt et al., 2008). Thispaper evaluates the feasibility and practicality by means of anexemplary shopfloor scenario. The fast-moving consumer goods(FMCG) supply chain with RFID was quantitatively assessed withina three-echelon SCM, which contains manufacturers, distributors,and retailers (Bottani and Rizzi, 2008). RFID technology adoptionwith pallet-level tagging, from this research, shows that positiverevenues for all supply chain stakeholders could be achieved; while,a case-level tagging will add costs for manufacturers, resulting innegative economical results.
Cases with RFID application in production and logistics controlfrom practical aspects are also widely studied and reported. EasternLogistics Limited (ELL), a medium-sized 3 PL company used RFIDtechnology in visualizing logistics operations (Chow et al., 2007).This case shows the enhanced performance of its supply chainpartners in reduced inventory level, improved delivery efficiency,and avoidance of out-of-stock. In order to study the factorsinfluencing the use of RFID in China, 574 logistics companies wereanalyzed in terms of technological, organizational, and environ-mental aspects (Lin and Ho, 2009). Most of the cases reveal theadvantages of using RFID for dealing with data capturing in theinitial stage. After the data collection, further applicable dimensionis explored like visibility and traceability. A manufacturing servicesprovider company was introduced for assessing the RFID deploy-ment at one of its production line for tracing components(Chongwatpol and Sharda, 2013). After the RFID deployment, thecycle time, machine utilizations, and penalty costs are significantlyimproved by comparing the RFID-based scheduling and traditionalapproach. For examining the impact of RFID-enabled supply chainon pull-based inventory replenishment, a case study in TFT-LCD(Thin-film-transistor liquid-crystal display) industry was illustrated(Wang et al., 2008). From this case, it is observed that the totalinventory cost could be cut down by 6.19% by using the RFID-enabled pull-based supply chain. More real-life cases using RFID forsupporting real-time production, logistics control and supply chainmanagement could be found from (Dai et al., 2012; Ngai et al., 2008;Sarac et al., 2010; Zhong et al., 2014).
R.Y. Zhong et al. / Int. J. Production Economics 165 (2015) 260–272 261

2.2. Frequent trajectory pattern mining
With the increasing pervasiveness of location-acquisition technol-ogies like GPS, RFID, and Barcode, the collection of large spatio-temporal data gives the chance of mining valuable knowledge aboutmovement behaviors and trajectories of moving objects (Giannottiet al., 2007). Meaningful patterns could be mined under an applicableframework, which plays an important role in trajectory knowledgeexcavation. To this end, a novel framework for semantic trajectoryknowledge discovery was proposed (Alvares et al., 2007). The frame-work integrates samples into the geographic information so thatrelevant applications could be involved. As the wide usage of RFIDtechnology, a framework for mining RF tag arrays was established foractivity monitoring using data mining techniques (Liu et al., 2012).This framework is verified by the empirical study using real RFIDdatasets. Integrating techniques for clustering, pattern mining detec-tion, post-processing and visualization, a framework was introducedto discover and analyze moving flock patterns in large trajectorydatasets (Romero, 2011). The introduced framework is tested underthe comparing with Basic Flock Evaluation (BFE) approach in terms ofefficiency, scalability, and modularity. Currently, spatio-temporal eventdatasets are emerging. A framework for mining sequential patternsfrom these datasets was demonstrated for measuring the patterns(Huang et al., 2008). The proposed framework has been comparedwith STS-Miner and the performance evaluations show that theframework outperforms in terms of processing velocity and efficiency.An entire framework for trajectory clustering, classification, and outlierdetection was introduced by using the transportation data (Han et al.,2010). Additionally, models or algorithms are significant in frequenttrajectory pattern mining. Thus, large numbers of studies have beencarried out. To form a formal statement of efficient representation ofspatio-temporal movements, a new model was presented to discoverpatterns from trajectory data (Kang and Yong, 2010). This model isable to findmeaningful regions and extract frequent patterns based ona prefix-projection approach from the region sequences. Gap betweendatabases and data mining exists when mining frequent trajectorypattern. In order to fill this gap, a novel algorithm is proposed formodeling trajectory patterns during the conceptual design of adatabase (Bogorny et al., 2010). This algorithm is validated with adata mining query language implemented in a system, which allowsend-users to create and query trajectory data and patterns. With thedevelopment of mobile technologies, frequent trajectory patternmining has been widely exposed in our daily use. For finding thelong and sharable patterns in trajectories of moving objects, a databaseprojection-based method was proposed for extracting frequent routes(Gidófalvi and Pedersen, 2009). Graphical-based model is currentlypaid high attention. For example, for mining the frequent trajectorypatterns in a spatial-temporal database, an efficient graph-basedmining (GBM) algorithm was proposed (Lee et al., 2009). From theexperimental results, this algorithm outperforms Apriori-based andPrefixSpan-based methods. Currently, it is very important to predictthe location of a moving object. Thus, a method named WhereNextwas proposed for predicting with a certain level of accuracy the nextlocation (Monreale et al., 2009).
2.3. Big data in manufacturing
Big data, an emerging new term, refers to a collection of datasetswhich is so large and complex that it is difficult to process using on-hand tools or traditional processing applications. Big data is veryclose to our daily life due to the wide usage of mobile phone, Internetaccess, digital cameras, etc (Brown et al., 2011; Syed et al., 2013;Hazen, et al. 2014). Manufacturing carries huge number of data.However, studies and applications of Big Data in manufacturing arestill in primary phase compared with the other fields like finance, IT,and E-commerce (Weng and Weng, 2013).
Before mentioning the big data in manufacturing, data mining hasbeen widely used in the industrial area. A data mining architecturewas introduced in manufacturing company so as to implement in bothindividual and multiply companies (Shahbaz et al., 2012). Thisarchitecture allows the companies to share the mined knowledge.Data mining was also used for assisting decision-makings such asmarketing, manufacturing, planning and scheduling, as well as pro-duct design (Kusiak, 2006; Choudhary et al., 2009; Hanumanthappaand Sarakutty, 2011). In order to pilot and optimize the processes inmanufacturing, a comparison of selectionmethods in PLS (Partial LeastSquares) regression was carried out under large number of variables(Gauchi and Chagnon, 2001). This mining method inclines to addressthe huge volume data influenced on manufacturing processes.
With the increasing data tsunami from manufacturing, Big Datawas wakened. Due to the ability of handling variety of large volume ofdata, Big Data was proposed to address the challenges in industrialautomation domain (Obitko et al., 2013). This paper also gives thenext steps for Big Data adoption in industrial automation andmanufacturing. Big Data used for business process analysis withvisibility on distributed process and performance was demonstrated(Vera-Baquero et al., 2013). For end-users like analysts, they are ableto analyze the business performance in or near real-time fashionwitha distributed environment. Galletti and Papadimitriou (2013) investi-gated how Big Data analytics (BDA) can be perceived and used as adriver for enterprises' competitive advantage. As the development ofcloud computing, cloud manufacturing is shifting based on the fastpromotions (Xu, 2012). Big Data implemented in cloud was intro-duced for developing an easy and highly scalable application fordataflow-based performance analysis (Dai et al., 2011). A comprehen-sive investigation of Big Data challenges for enterprise applicationperformance management was discussed so that the Big Dataapplication in industrial could be promoted based on the lessonslearned from this investigation (Rabl et al., 2012).
From the literature, the above three research dimensions areisolated and several gaps need to be fulfilled so as to carry out thepresent study which integrates them for better production logisticsdecision-makings. Although RFID technology has beenwidely adoptedfor collecting production and logistics data, applications of such dataare elementary. The collected RFID data could be, for example, used tofind out the frequent logistics trajectories on manufacturing shop-floors. However, current frequent trajectory patterns are concentratedon geographical and mobile areas. Due to the high complexity andhuge volume of RFID-enabled manufacturing data, Big Data could be asuitable solution for making full use of the data sets. This paperproposes a Big Data approach to discover useful frequent trajectorypatterns from enormous RFID-enabled manufacturing data for sup-porting logistics decisions so as to fill the research gaps.
3. RFID-enabled logistics control
This research is under a RFID-enabled real-time ubiquitous logis-tics environment in manufacturing sites such as warehouses andshopfloors. This section reports on the RFID-enabled logistics controlin such environment in terms of deployment of RFID devices andtypical logistics operations.
3.1. Deployment of RFID devices
The deployment of RFID devices focuses on two key manufactur-ing sites: warehouse and shopfloors. The purpose is to create a RFID-enabled real-time ubiquitous production environment. To this end, inthe warehouse, a RFID reader is deployed on raw-material loadingarea for binding tags into each batch. Another one is deployed onfinished product receiving area for killing and recycling tags so thatthe binding cost could be reduced.
R.Y. Zhong et al. / Int. J. Production Economics 165 (2015) 260–272262

On manufacturing shopfloors, two types of RFID readers aredeployed. For machines, they are equipped with stationary read-ers. For workers, they are equipped with different devices. Logis-tics operators carry handheld RFID devices due to their frequentmovement within the production environment. Other workers likemachine operators have their RFID staff cards. After the deploy-ment of RFID devices, all the resources are converted into smartmanufacturing objects (SMOs), which are able to sense, act/react,reason, and communicate with each other, therefore, productionand logistics will be carried out by SMOs automatically accordingto the predefined logics.
3.2. Logistics operations within RFID-enabled ubiquitousmanufacturing sites
Within the RFID-enabled real-time ubiquitous manufacturingenvironment, logistics operations are reengineered and rationa-lized by SMOs. The upgraded operations could be briefly demon-strated as follows:
� Raw-materials in this case are packaged with standard of 180pieces for each batch, which is bound with a RFID tag. An externallogistics operator (ELO) uses a stationary reader to fulfill thebinding process. After this process, the RFID-labeled batches aredelivered into the shopfloor buffers, where the enter-in and outmovements could be detected by the RFID devices.
� An internal logistics operator (ILO), on a shopfloor, carries amobile RFID reader to pick up the required materials anddeliver them to a specific machine when he gets a logisticsjob. With the mobile reader, machine operators and ILOs areable to execute the material handover processing.
� After receiving the materials, machine operators can carry onthe processing. Once the job finished, an ELO is informed tomove them to next processing stage using a mobile reader.
� At next processing stage, an ILO utilizes a mobile reader to getthe logistics jobs and moves the materials on the shopfloor. The
machine operators and ILOs execute the material handoverover the mobile reader.
� The above steps are repeated until all the processing stages arefulfilled. The finished products will be delivered to warehouse by anELO, who uses a handheld RFID reader to execute the operations. Inwarehouse, a stationary reader deployed at finished productsreceiving area will be used for killing and recycling the tags.
4. RFID-enabled logistics data
Data from the RFID-enabled logistics control within manufac-turing sites can be seen as a stream of tuples in the form oEPC;Location;Operator; Time;Quantity4 , where EPC (Electronic Pro-duct Code) is the unique identifier of a batch of materials, whichcould be read by an RFID reader. Location is the exact positionwhere the operations or events take place. An event means aneffective RFID detection or an operation on RFID devices. Operatoris the executor of the event. Time marks when the event occurs.Quantity presents the standard amount of materials in a batch.
4.1. RFID logistics data warehouse
RFID logistics data warehouse is used for storing and managingthe tuples according to a time sequence for addressing the complexlogic relationship among enormous tuples since RFID generates largenumber of data at a glance of time on a continuous basis. The RFID-Cuboid is formed by various data records given the logical logisticsoperations. The main differences between the traditional databaseand RFID logistics data warehouse are the presence of data structureof the RFID-Cuboid and a Map Table which links the related recordsfrom various tables in order to preserve the meaningful data (Zhonget al., 2013). A Map Table is designed as a service in the warehouseto build up the RFID-Cuboid according to the predefined logics. Forexample, when receiving an EPC, the Map Table is able to find all therecords in the data warehouse and then initiate a cuboid which is acubic structure according to the logistics operations. After that, the
Stage 1
Machine
Reader
MO
Machine
Reader
MO
.
.
Stage n
Machine
Reader
Machine
Reader
Reader Reader
2 4
ILO: Internal Logistics OperatorELO: External Logistics OperatorMO: Machine Operator
ILOILO
MO
MO
.
.
15
ELO
Buffer Buffer
3
Fig. 1. RFID-enabled real-time logistics environment in manufacturing sites.
R.Y. Zhong et al. / Int. J. Production Economics 165 (2015) 260–272 263
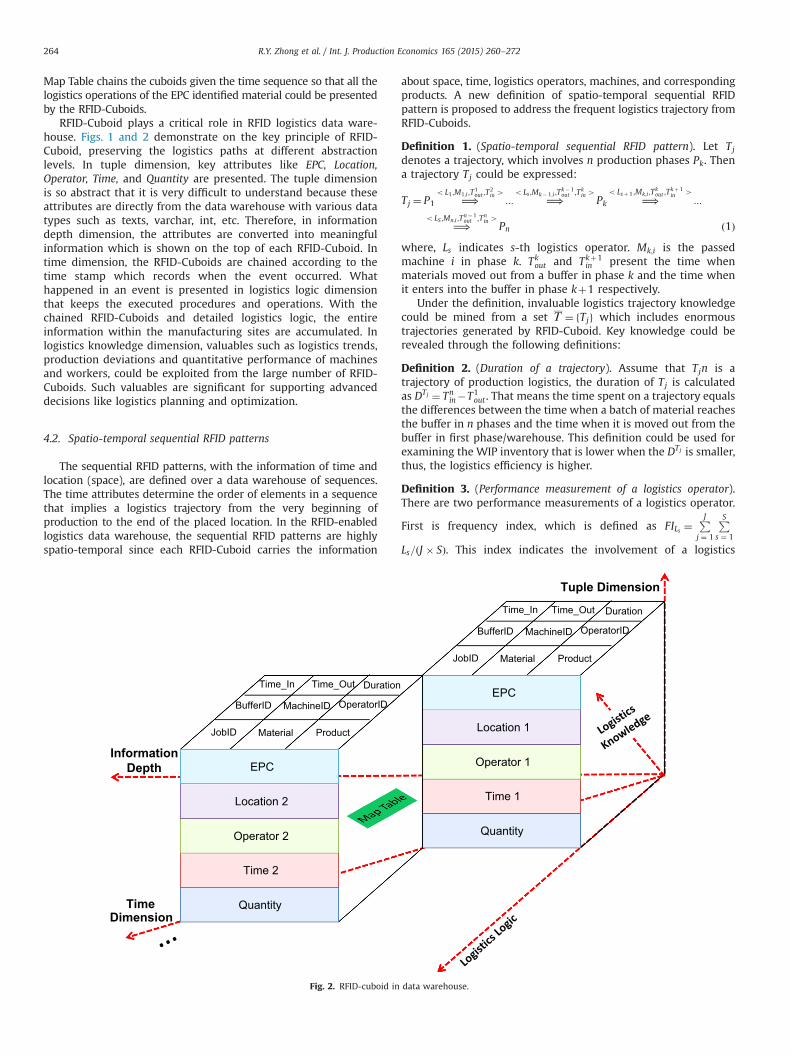
Map Table chains the cuboids given the time sequence so that all thelogistics operations of the EPC identified material could be presentedby the RFID-Cuboids.
RFID-Cuboid plays a critical role in RFID logistics data ware-house. Figs. 1 and 2 demonstrate on the key principle of RFID-Cuboid, preserving the logistics paths at different abstractionlevels. In tuple dimension, key attributes like EPC, Location,Operator, Time, and Quantity are presented. The tuple dimensionis so abstract that it is very difficult to understand because theseattributes are directly from the data warehouse with various datatypes such as texts, varchar, int, etc. Therefore, in informationdepth dimension, the attributes are converted into meaningfulinformation which is shown on the top of each RFID-Cuboid. Intime dimension, the RFID-Cuboids are chained according to thetime stamp which records when the event occurred. Whathappened in an event is presented in logistics logic dimensionthat keeps the executed procedures and operations. With thechained RFID-Cuboids and detailed logistics logic, the entireinformation within the manufacturing sites are accumulated. Inlogistics knowledge dimension, valuables such as logistics trends,production deviations and quantitative performance of machinesand workers, could be exploited from the large number of RFID-Cuboids. Such valuables are significant for supporting advanceddecisions like logistics planning and optimization.
4.2. Spatio-temporal sequential RFID patterns
The sequential RFID patterns, with the information of time andlocation (space), are defined over a data warehouse of sequences.The time attributes determine the order of elements in a sequencethat implies a logistics trajectory from the very beginning ofproduction to the end of the placed location. In the RFID-enabledlogistics data warehouse, the sequential RFID patterns are highlyspatio-temporal since each RFID-Cuboid carries the information
about space, time, logistics operators, machines, and correspondingproducts. A new definition of spatio-temporal sequential RFIDpattern is proposed to address the frequent logistics trajectory fromRFID-Cuboids.
Definition 1. (Spatio-temporal sequential RFID pattern). Let Tj
denotes a trajectory, which involves n production phases Pk. Thena trajectory Tj could be expressed:
Tj ¼ P1 ⟹o L1 ;M1;i ;T
1out ;T
2in 4
::: ⟹o Ls ;Mk� 1;i ;T
k� 1out ;Tk
in 4Pk ⟹
o Lsþ 1 ;Mk;i ;Tkout ;T
kþ 1in 4
:::
⟹oLS ;Mn;i ;T
n� 1out ;Tn
in 4Pn ð1Þ
where, Ls indicates s-th logistics operator. Mk;i is the passedmachine i in phase k. Tk
out and Tkþ1in present the time when
materials moved out from a buffer in phase k and the time whenit enters into the buffer in phase kþ1 respectively.
Under the definition, invaluable logistics trajectory knowledgecould be mined from a set Τ ¼ fTjg which includes enormoustrajectories generated by RFID-Cuboid. Key knowledge could berevealed through the following definitions:
Definition 2. (Duration of a trajectory). Assume that Tjn is atrajectory of production logistics, the duration of Tj is calculatedas DTj ¼ Tn
in�T1out . That means the time spent on a trajectory equals
the differences between the time when a batch of material reachesthe buffer in n phases and the time when it is moved out from thebuffer in first phase/warehouse. This definition could be used forexamining the WIP inventory that is lower when the DTj is smaller,thus, the logistics efficiency is higher.
Definition 3. (Performance measurement of a logistics operator).There are two performance measurements of a logistics operator.
First is frequency index, which is defined as FILs ¼PJ
j ¼ 1
PS
s ¼ 1
Ls=ðJ � SÞ. This index indicates the involvement of a logistics
Quantity
Time 1
Operator 1
Location 1
EPC
OperatorID
JobID Material Product
BufferID MachineID
Time_In Time_Out Duration
Tuple Dimension
Information Depth
Quantity
Time 2
Operator 2
Location 2
EPC
OperatorID
JobID Material Product
BufferID MachineID
Time_In Time_Out Duration
TimeDimension
Fig. 2. RFID-cuboid in data warehouse.
R.Y. Zhong et al. / Int. J. Production Economics 165 (2015) 260–272264

operator in the total delivery tasks. Another is time index, which is
defined as TILo ¼PJ
j ¼ 1
Pn
k ¼ 1ðTkþ1
in �TkoutÞj Ls ¼ Lo . This index reveals the
time contributed from a specific logistics operator (Lo) on totallogistics tasks. J is the total number of logistics trajectories and S isthe total number of logistics operators.
Definition 4. (Utilization of a machine). For a machine i in phase kwithin a time slot ðt1; t2Þ, the machine utilization is defined as
UMk;i¼ PJ
j ¼ 0Tj jMk;i ATj
ðt2 � t1Þ : the total amount of logistics trajectory which
includes machine Mk;i. If more logistics trajectories involved inMk;i, UMk;i
will be bigger.
5. Big Data approach for discovering trajectory knowledge
Based on the definition of spatio-temporal sequential patterns,a framework of the Big Data approach is presented under theabove definitions. The framework is based on the key proceduresfor enormous RFID data processing (Zhong et al., 2013).
5.1. Framework
Since the production data generated by RFID technology is enor-mous as the daily operations carrying on, the framework is designed formeeting the specific characteristics of RFID-Cuboid. It contains severalsteps, each of which is particularly designed for different purposes.
Firstly, a RFID-enabled logistics data warehouse is built uponpicking up several main tables from the production Big Data suchas Task, BatchMain, BatchSub, UserInfo, MachInfo, Technics, etc. Thekey attributes from these tables are selected by the Map Table tocreate a set of RFID-Cuboid which carries invaluable informationabout both logistics behaviors and operational logics.
Secondly, the created RFID-Cuboids have great myriad of redun-dancy, which should be reduced properly, thus, a cleansing operationis performed. The RFID-Cuboid cleansing not only removes theredundant items, but also detects and eliminates the incomplete,inaccurate, and missing cuboids.
Thirdly, the cleansed RFID-Cuboids are usually still enormous. It isessential to carry out the compression operation. RFID-Cuboids com-pression has special features. For example, a holistic trajectory could bedivided into several stages, each of which will be presented by a RFID-Cuboid. These cuboids are highly related to each other because a job istagged with a unique EPC number. Several jobs are consisted of a task.That means the related cuboids have same TaskID. Given the features,the compression of RFID-Cuboid uses key logics to represent such acollective movement through a piece of record no matter how manycuboids could be extracted from the data warehouse.
Fourthly, the compressed RFID-Cuboids must be classified becausedifferent users need specific data sets for decision-makings. Take theevaluation of logistics operator for example, in the collaborativecompany, there are three levels identified by an integer type (0:junior, 1: intermediate, and 2: senior) in the table UserInfo. From theattribute OperatorID in a RFID-Cuboid, cuboids could be categorizedbecause each operatorID uniquely associates with an identified level.Thus, for different levels, key performance indicators (KPIs) such asaverage processing time, learning curves, and major impact factorscould be examined from the categorized RFID-Cuboids. Similarly,materials and machines could be categorized according their types.
Fifthly, the classified cuboids could be used for pattern recogni-tion considering time and space. In time-associated patterns, RFID-Cuboids imply the trends and deviations of various manufacturingobjects like operation efficiency of logistics operators, machineutilization, etc. These patterns are significant for making both long
and short-term logistics decisions. In space-associated patterns,RFID-Cuboids indicate the movements of various materials, keep-ing every location along the logistics trajectory. These patterns areuseful for figuring out the statuses like WIP inventory level as wellas for predicting the workload at different locations.
Finally, the discovered patterns/knowledge must be further inter-preted since different applications may require different presentations.RFID-Cuboids may be (re)structured or reformed at different proce-dures, resulting in different patterns. For example, the discoveredpattern may be a curve which presents the skill improvement from aspecific logistics operator (termed learning curve). The learning curvewill be worked out by machine learning or regression methods andthen interpreted by a mathematic function/model. While, otherdiscovered patterns like values, rules, and conditions could be formedas knowledge granularities through structural insight analysis basedon an associated concept hierarchy from empirical methods or pastsuccessful experiences.
5.2. Key steps with algorithms
The proposed Big Data approach is enabled by some key stepsequipped with suitable algorithms. They are RFID-Cuboid cleans-ing, compression, and classification.
Algorithm 1: RFID-Cuboid cleansing
Input: RFID-enabled Logistics Data Warehouse, Conditionset Conset
Output: RFID-Cuboid set RCubset
Methods:1. RCubset’select records from related tables from
data warehouse2. for each Cuboid in RCubset
3. for each dimension DIi in a Cuboid4. DIi must satisfy a condition Conj
5. DIipConj where ConjAConset
6. if a dimension DIi in RCubkcannot meet thecondition
7. Delete RCubk from RCubset
8. endif9. endfor10. endfor11. return RCubset
� RFID-Cuboid cleansing: The purpose is to detect and removesome noise RFID-Cuboids, which are incomplete, inaccurate,and redundant. The input is a set of raw cuboids from RFID-enabled logistics data warehouse. The output is a sorted set ofcuboids which carry complete and accurate information. Thefollowing algorithm 1 presents the method for cleansing theRFID-Cuboids.
� RFID-Cuboid compression: The purpose is to form an advanceddata structure so that further query, classification, and analysiscould be carried out. The compression approach thus aggre-gates and collapses the records from the cleansed RFID-Cuboids. The output is the compressed RFID-Cuboids. A MapTable is used for organizing the cuboids with high informationdensity. The following algorithm 2 shows the principle ofcompressing the cleansed RFID-Cuboids.
Algorithm 2: RFID-Cuboid compression
Input: RCubset
Output: Compressed RFID-Cuboid set RCubCom
R.Y. Zhong et al. / Int. J. Production Economics 165 (2015) 260–272 265

Methods:1. Batchi¼select batches with same EPC code from
tables in RCubset
2. for each attribute Aj in Batchi
3. Aj¼ select EPC from tables in RCubset
4. if EPC meets the logic in map5. Batchi ¼ oEPC;Operator; Location; Time_in;
Time_out4
6. A order set Orderk’Batchi
7. endif8. endfor9. RCubCom’Order10. return RCubCom
� RFID-Cuboid classification: The purpose of this step is to workout different specific categories which are used for miningspecific information or knowledge. The input is compressedRFID-Cuboid and a category set. The output is classified RFID-Cuboids. Algorithm 3 presents the key manner on classifyingthe Cuboids so that the logistics trajectory knowledge could beobtained from different aspects.
Algorithm 3: RFID-Cuboid classification
Input: RCubCom, Category set CatOutput: Classified RFID-Cuboid set RCubCla
Methods:1. for each category catiACat2. for each Cuboid cuboidj from RCubCom
3. if cuboidjpcati4. set’cuboidj5. else jþþ6. endfor7. RCubClak ’set8. endfor9. RCubCla’RCubClak
10. return RCubCla
5.3. Validity of the proposed framework
Figs. 3 and 4 demonstrate an example on how the proposed BigData framework is able to figure out the useful trajectory knowledgelike learning curves about logistics workers to present its validity.The demonstrative example includes nine major processes:
(1) RFID raw data such as workers, machines, materials, jobs, quality,production operations, and logistics behaviors are collected bySMOs frommanufacturing shopfloors. Over 10 years data are keptin a database with the size of 1.5 T.
(2) A data warehouse is established by picking up RFID data fromvarious tables such as Task, BatchMain, BatchSub, UserInfo,MachInfo, Technics, and Material which are mainly related tologistics.
(3) A Map Table defines the relations among the above tables byconnecting them with a foreign key that migrates to anotherentity based on the logistics logics. Foreign key is a migratorwhich is used to link another entity. For example, tables Batch-Main, BatchSub, and UserInfo are defined as (BatchMainID, QTY,
TimeIn,…), (BatchID, OptID, TimeOut,…), and (UserID, Name, Level,…). Foreign keys are BatchMainID, BatchID, OptID, and UserID.When BatchMainID¼BatchID and OptID¼ UserID, these tablescould be set a relation to connect together.
(4) When receiving the condition parameter (TaskID¼ '82136')which determines what types of RFID-Cuboids should beestablished, the Map Table is able to pick up associated RFIDattributes from data warehouse. Each RFID-Cuboid implies keylogistics information as: 180 is the batch quantity (How manymaterials in a batch?), 2008-04-18 08:43 is the time stamp(When the operations take place?), 008 is the ID of a logisticsoperator (Who carries out the operations?), 20335 (Shopfloor:2, Line: 03, Machine No. 35) is the location (Where theoperations occur?), 3A568847EF is an EPC code presenting abatch (Which material is processed?).
(5) RFID-Cuboids are chained along with the time sequencing.The sequenced RFID-Cuboids are compressed by the proposedalgorithm.
(6) The chained RFID-Cuboids are classified given the logisticsoperator's skill level (0: junior, 1: intermediate, and 2: senior)so as to find the implicit trends at different levels.
(7) The classified RFID-Cuboids are plotted and curve fittingmethods are adopted for mining the trajectory patterns withthe trends of curves.
(8) Trajectory knowledge of the learning curves about junior,intermediate, and senior logistics operators is excavated byregression methods from extracting the fitted curves in a timeinterval (12 months). The knowledge is interpreted as f JðxÞ ¼
RFID-enabled Production Big Data
RFID-enabled Logistics Data Warehouse
RFID-Cuboid Cleansing
RFID-Cuboid Classification
Spatio-temporal Pattern Recognition
Logistics Knowledge Interpretation
Machine Learning/ Regression
Structural Insight Analysis
Predictive ModelsKnowledge Granularity
RFID-Cuboid Compression
Fig. 3. A big data approach for discovering logistics knowledge.
R.Y. Zhong et al. / Int. J. Production Economics 165 (2015) 260–272266

13:41x2�1:59xþ0:18, f IðxÞ ¼ 14:93x2�2:12xþ0:22, and f SðxÞ¼ 10:88x2�0:41xþ0:05.
(9) The discovered learning curves are used for working out moreprecise logistics plans which use the data provided by theinterpreted functions so as to optimize WIP inventory.
6. Experiments and discussions
The purposes of the designed experiments are to evaluate thefeasibility and practicality of the proposed Big Data approach as wellas to discover the frequent logistics trajectory. All experiments areunder an Intel(R) Xeon(R) 2.40 GHz system with 16.0GB of RAM. Theoperation system is Windows 7 Enterprise with 64- bit. Cþþ andMatlab R2009a are used for the evaluation and analysis.
6.1. Experiments Initialization
In the first place, RFID-enabled logistics data is collected from oneof our collaborative companies which has 4 manufacturing shopfloorsequipped with RFID readers, tags, and wireless/wired communication
networks. There are over 400 customer orders in average daily. Ordersare divided into more than 12,000 batches (jobs), each of whichcarries 180 pieces ordinarily. There are about 1000 machines, each ofwhich is equipped with a RFID reader and each batch is identified bya RFID tag. The machines are categorized into 7 phases where theywork in a parallel fashion as shown in Table A1.
Secondly, RFID events are carried out enormously within the manu-facturing environments. A RFID event means an operation or interac-tion of two SMOs. It is estimated that 300 RFID events (e.g. read a tag,input data, etc) take place related to logistics operations in a second.Each event generates a RFID-Cuboid with the size of 101.5 Byte. Thus,2.45 GB RFID datawill be generated per day. If considering other eventsrelated to quality control, machine checking and maintenance, theamount of RFID-Cuboids would reach TeraByte daily.
Thirdly, several tables are picked up for forming the RFID-Cuboids in the logistics data warehouse. UserInfo keeps the data ofworkers such as UserCard (EPC), UserLevel, etc. MachInfo presentsthe machine data like MachID, MachType, TermiAddr (RFID readerdeployed on a machine), and so on. Z_Task stores the productionorders, each of which is regarded as a task. A task is divided into
Min
M
RFID rawdata arecollected from shopfloorandstored in a database.
Data warehouseis established by pickingup associatedRFIDrecords from database.
A Map Tableis used for building up RFID-Cuboids according to logistics logics.
RFID-Cuboids with TaskID=‘82136’ areestablished in data warehouse.
ThechainedRFID-Cuboidsare classifiedbyoperator levelspresentedby 0, 1, and2.
RFID-Cuboids are chained given the timestamp andcompressed to reduce volume.
Learningcurves are used for working outthe logistics optimization.
Patterns of trajectory trends are mined bycurve fitting.
Trajectory knowledge of learning curvesabout three types of worker is generated.
Fig. 4. Demonstration of the validity of the big data framework.
R.Y. Zhong et al. / Int. J. Production Economics 165 (2015) 260–272 267

several batches which are kept in t_BatchSub, which has BatchID(EPC from attached tag), UserID, InTime, TermiAddr, TaskID, etc.Z_Product indicates the material information such as Material-Name, MapNo, etc.
Finally, a Map Table is used for linking related attributes fromvarious tables to build up the RFID-Cuboids which are organized inspatio-temporal sequenced patterns. Several logics are significant.Primary and foreign keys are used for linking separated RFID-Cuboids so that associated trajectory could be cascaded. A primarykey is a unique identifier of a cuboid.
6.2. Evaluations and discussions
Evaluations of the proposed Big Data approach are carried outfrom choosing the key procedures such as cleansing, compression,and classification, which are the key concerns given the character-istics of RFID-enabled manufacturing data. First of all, the RFID-Cuboid cleansing algorithm is examined through comparing withthe statistics analysis worked out by manual operations.
Table 1 shows the evaluation and computational results fromcomparing the proposed cleansing algorithm and statistics analysis.Two groups of cuboids with 1,038,678 and 16,910,473 have beenused for the examination. Four dimensions are examined: duplicated,inaccurate, incomplete, and missing items. Each dimension has threeunits: the first row presents the amount of observed cuboids; thesecond row means the percentage of observed cuboids in totalsample size; the third row is the computational time.
For duplicated items, the algorithm uses key attributes for cleans-ing the cuboids. Thus, it is a bit less accurate than manual statisticsapproach (7.31% vs 8.38%, 7.89% vs 10.32%). However, the proposedalgorithm takes less unit of time than manual operations (36.2 vs 78.6,703.3 vs 3594.3), improving the efficiency by using computer calcula-tion. For inaccurate items, the algorithm performs well since it strictlyconcerns the logistics operation logics in terms of time and spaceperspective. The proposed algorithm has better computational resultsthan manual statistics (23.8 vs 44.5 and 428.4 vs 1980.5). Forincomplete items, since main attributes are preferentially concernedin the algorithm, manual statistics operations scrutinize each attributeso that the performance is better. But the proposed algorithm takesmuch less computational time (10.1 vs 56.4 and 170.8 vs 321.6) whichattributes the high efficiency of removing incomplete cuboids. Formissing items, the algorithm finds out more pieces than manualstatistics because the strong logic about operations, logistics trajectory,material consistency, and time stamp make the outperformance.Additionally, the proposed algorithm has obvious computationaladvantages over manual statistics method (457.8 vs 1658.3 and7782.6 vs 12934.7). It is observed that, the proposed algorithm hassignificant advantages in computational ability. However, missingitems cost the most due to the large volume and high complexrelations of RFID-Cuboids.
Secondly, RFID-Cuboid compression algorithm is examinedthrough comparing with and without the Map Table (map and
no-map). Specifically, for simplicity with generality, three typ-ical cuboids are used for the purpose. The mapped cuboids are1 - t_v_TaskProgrssBatchAll: the progress of the batches; 2 -t_v_Batch: the batch information, and 3 - f_v_Batch: the technicalaspects of batches. The no-map cuboids are generated from fourtables: Z_Task, t_BatchMain, T_TechnicSub, and ProcPower. Fig. 5illustrates the experimental results from comparisons of the mapand no-map cuboids in terms of bulkiness and amount whichindicate the volume and quantity of the cuboids in a data ware-house respectively. Horizontal axis represents the above threetypical cuboids in Fig. 5.
Fig. 5 (a) presents the experiment results about bulkiness of theRFID-cuboids. No-map approach uses a query processing to extractcorresponding attributes to form the cuboids. The most significantreduction is the batches' progresses with 88.21% saving of thestorage because the Map Table highly links the records associatedwith progresses so that some calculations could be carried outwithin each RFID-Cuboid. However, querying processing with no-map picks the attributes out from large quantity of records andthen carries out the calculations. The technical aspects of batchesonly get 43.28% compression because the technical pictures aredifficult to compress. Fig. 5 (b) presents the quantity of RFID-Cuboids from both methods. It is observed that the reduction inthe first cuboid is tremendous which is 66.25%. The rest of twocases are 22.49% and 18.61% respectively. The large differences areattributed to the large involvements and high granularity of linkedcuboids. It is found that with the increasing of involved cuboids,the more compression proportion could be achieved. However,this only works on text-based cuboids.
Thirdly, RFID-Cuboid classification algorithm is assessed. Theassessment is carried out through comparing the proposed algo-rithm with Automated Neural Network (ANN) classification (Para-meters are shown in Appendix Table A2) in the perspective ofelapsed time and error ratio at three levels of input samples. Thesample sizes are 100; 26,349; and 1,126,597. The comparisonresults are presented in Table 2.
From Table 2, the proposed algorithm significantly outperformsin elapsed time which are 0.04 vs 0.77, 1.53 vs 10.05, and 20.77 vs46.30. However, the ANN classification has better performance onerror ratio. The reason is that the approach is capable of learningthe patterns via machine training. However, the learning processeshave to spend much more time. The proposed algorithm usesstatic set rules for clustering the cuboids, thus, it has relativelyhigh error ratio (8.08% vs 7.8%, 18.69% vs 8.28%, and 26.20% vs12.12%). With the increasing of data sample, it is observed that theproposed algorithm has an advantage of time cost, however, theerror ratio decreases sharply.
Finally, frequent spatio-temporal trajectory is mined. Fig. 6demonstrates the experimental simulations from a set of RFID-Cuboids. In this simulation, total N¼ 40 batches of materials aretaken into account for simplicity without loss of generality and eachbatch contains 180 pieces. A batch is regarded as a job that is going
Table 1Evaluation results.
Items Duplicated Inaccurate Incomplete MissingCuboids size
1,038,678 75,892 87,019 46,463 48,792 23,779 38,004 35,899 34,878(7.31%) (8.38%) (4.47%) (4.70%) (2.29%) (3.66%) (3.46%) (3.36%)36.2 78.6 23.8 44.5 10.1 56.4 457.8 1658.3
16,910,473 1,334,236 1,745,160 744,060 804,938 510,696 713,621 654,435 576,647(7.89%) (10.32%) (4.40%) (4.76%) (3.02%) (4.22%) (3.87%) (3.41)703.3 3594.3 428.4 1980.5 170.8 321.6 7782.6 12,934.7
* Left column with gray shading is from the proposed approach.
R.Y. Zhong et al. / Int. J. Production Economics 165 (2015) 260–272268

to pass 7 processing phases. Thus, there are 40 jobs and 8 logisticsoperators are responsible for moving the materials among theabove phases. The maximum machine utilization at each phaseMaxfUMk;i
jk¼ 1;2; :::7g ¼ ð0:1;0:25;0:125;0:675;0:4;0:35;0:2Þ.From the MaxUMk;i
, a frequent logistics trajectory could be observed:
TFre ¼ P1 ⟹o L3 ;M10;1 ;T
1out ;T
2in 4
P2 ⟹o L5 ;M2;2 ;T
2out ;T
3in 4
P3 ⟹o L1 ;M5;3 ;T
3out ;T
4in 4
P4 ⟹o L2 ;M2;4 ;T
4out ;T
5in 4
P5 ⟹o L8 ;M4;5 ;T
5out ;T
6in 4
P6 ⟹o L7 ;M2;6 ;T
6out ;T
7in 4
P7 ⟹o L4 ;M1;7 ;T
7out ;T
8in 4
End
The average duration of logistics trajectory meanðDT Þ is 24.25 min,which implies it takes around 25min for moving a batch of materialfrom phase 1 to phase 7 without considering the machine processingtime. Additionally, the frequency index of each logistics operator couldbe calculated as fFILs j s¼ 1;2:::8g ¼ ð0:14;0:15;0:26; 0:11;0:16;0:04;0:14Þ, which indicates that No.3 logistics operator is the best perfor-mer since he/she involves in the most delivery paths. While, operator6 has the lowest score which is 0.04 which indicates the worstperformance. The mined knowledge in logistics trajectory could beused for making advanced decisions like MRP (Material RequirementPlanning), APS (Advanced Planning and Scheduling), etc. As a result,management in the ubiquitous manufacturing environment could bemore precise, efficient, and effective.
6.3. Managerial implications
Key findings and experimental observations could be generatedinto managerial implications, which are useful when various usersmaking logistics decisions.
Firstly, the RFID-Cuboids could be extended and used for the otherRFID applications like retailer and distribution center so that databasesor data warehouse for storing the sensed data could be optimized interms of effectiveness and efficiency. The usage of Map Table is able toimprove the bulkiness of the data warehouse from the experiments,especially for the text-based records. Thus, this approach could beimplemented in logistics and supply chain management (LSCM) field,which is using RFID for facilitating the operations.
Secondly, the proposed definitions could be used for examining themain manufacturing objects like workers and machines quantitatively.The examination could be carried out through horizontal and verticaldimensions. In horizontal dimension, a worker or a machine could beevaluated at different time horizon by comparing the indexes andutilization. As a result, the deviations can be observed and associatedstrategies could be worked out for balancing workload. In verticalaspects, workers' performance could be analyzed so that some criticaldecisions like promotion strategy could be carried out reasonably. Forexample, the best performer – logistics operator No. 3 could beawarded for a promotion due to his highest score.
Finally, from the mined frequent logistics trajectory, the mostefficient machines are oM10;1;M2;2;M5;3;M2;4;M4;5;M2;6;M1;74whose jobs could be assigned preferentially. The average duration oflogistics trajectory (meanðDT Þ ¼ 24:25 ) could be used for predictingthe delivery date. Additionally, the worst performer is logisticsoperator No.6 with the score 0.04, which implies a bottleneck in hisworking stage whose WIP inventory is the highest. Therefore, morelogistics operators are needed in that stage.
7. Conclusion
This paper introduces a Big Data approach for mining the invaluabletrajectory knowledge from enormous RFID-enabled logistics data. Largenumber of missing, incomplete, inaccurate, and duplicated recordsexists in such data, though they carry rich information that could beused for further and advanced decision-makings. To suit the specialcharacteristics of such data, the proposed approach innovativelyintroduces the RFID-Cuboids for representing the logistics informationso that the trajectory knowledge could be excavated. Specifically,several key procedures are proposed: a RFID-Cuboid cleansing algo-rithm is presented for detecting and removing the noise data from thelogistics dataset, a RFID-Cuboid compression algorithm is demon-strated for reducing the storage space and enhancing informationgranularity, and a RFID-Cuboid classification algorithm is reported forclustering the cuboids according to the practical applications/consid-erations. The feasibility and practicality of the proposed approach arequantitatively examined from various experiments. The experimentalresults reveal rich knowledge for further advanced decision-makingslike MRP and APS. Additionally, key findings and observations areconverted into managerial implications, by which users are able tomake precise and efficient decisions under different situations.
Several contributions are significant. Firstly, a Big Data methodologyin terms of framework and key steps for specifically handling RFID-enabled logistics data is worked out. The methodology contains severalsteps to suit the RFID characteristics so that practical-oriented applica-tions could be achieved. Secondly, RFID-Cuboids are innovativelyproposed for establishing the data warehouse so that the logistics datacould be highly integrated in terms of tuples, logic chain, and
Fig. 5. Compression results.
Table 2Comparison results of ANN and proposed algorithm.
Sample size Algorithms Elapsed time (min.) Error ratio (%)
100 ANN 0.77 7.80Proposed algorithm 0.04 8.08
26,349 ANN 10.05 8.28Proposed algorithm 1.53 18.69
1,126,597 ANN 46.30 12.12Proposed algorithm 20.77 26.20
R.Y. Zhong et al. / Int. J. Production Economics 165 (2015) 260–272 269

operational activities. After the establishment, a Map Table is used forlinking different cuboids so that the abstract data could be convertedinto meaningful information which could be further turned andinterpreted into logistics knowledge. Thirdly, spatio-temporal sequentiallogistics trajectory is defined under the establishment of RFID-Cuboidsdata warehouse. Based on the definition, mined knowledge andassociated indexes areworked out for evaluating various manufacturingobjects like workers and machines. Such knowledge could be used forsupporting difference decision-makings such as logistics planning,production planning and scheduling, as well as enterprise-orientedstrategies. Finally, the proposed Big Data approach is quantitativelyevaluated by a set of experiments. Key findings and observations areobtained and summarized into managerial implications which could beused for guiding end-users in real-life applications.
Future research will be carried out as follows. Firstly, themined invaluable knowledge will be used for supporting APS. Amathematical model integrating production planning & schedul-ing and material delivery strategy will be worked out. Secondly,the evaluations of this Big Data approach could be extendedsince this paper only considers limited examinations. In thefuture, this approach could be evaluated from an entire compu-tational aspect. For non-text-based cuboid compression, theimage compression methods such as area image compressionand adaptive dictionary algorithms could be integrated to thecuboid compression model considering the index of a color inthe color palette. Finally, the interpretation of mined knowledgewill be studied given different applications. To this end, anentropy-based method will be investigated so that the minedknowledge from the RFID Big Data will be measured before real-life applications.
Acknowledgment
This work is supported by National Natural Science Foundation ofChina (Grant no. 51405307), HKU small project funding (201309176013), and Guangdong High Education Institution project (2013CXZDC008). Zhejiang Provincial, Hangzhou Municipal and Lin'an Citygovernments are acknowledged for partial financial supports.
Appendix
Detailed quantitative analysis between the proposed cleansingalgorithm and statistics results is examined from Fig. A1. From theresults of missing Cuboids, it is presented by certain percentage(3.46% vs 3.36%) and (3.87% vs 3.41%) respectively with thedifferences of þ0.1% and þ0.46%. That reveals the outperformanceof the proposed algorithm over the manual statistics operationsbecause the algorithm strictly follows the logics of time andoperation chain within the manufacturing sites. From figuringout inaccurate cuboids, the percentages are 4.47% vs 4.70% and4.40% vs 4.76% at two evaluations. The differences are �0.22% and-0.36%. That indicates the weakness of the proposed algorithm dueto its limited consideration of attributes in RFID-Cuboids. If moreattributes are taken into account, higher precision will beachieved. In the aspect of picking out duplicated cuboids, theresults increase a little bit like 7.31% vs 8.38% and 7.89% vs 10.32%with the differences of �1.07% and �2.43% respectively. From theresults, it is observed that the major noises in RFID-enabledlogistics data come from redundant records. Thus, it is importantto detect and remove the redundancy when processing the
Fig. 6. Frequent spatio-temporal trajectory mined from RFID-cuboids.
R.Y. Zhong et al. / Int. J. Production Economics 165 (2015) 260–272270

RFID-Cuboids. In the aspect of finding incomplete Cuboids, theresults are 2.29% vs 3.66 and 3.02% vs 4.22% with the differences of�1.37% and �1.2%. It implies the algorithm is not as good as thestatistics method because the proposed approach only focuses onkey dimensions. Summarily, from the quantitative analysis, theproposed algorithm has a suitable ability to perform the datacleansing in terms of picking out missing and inaccurate cuboids.The effectiveness of figuring out duplicated and incompletecuboids are relatively weak according to the higher differencescomparing with the previous two aspects. However, the computa-tional advantages of the proposed algorithm can significantlyimprove the efficiency and processing velocity when facing largenumber of RFID-Cuboids.
See the appendix Tables A1 and A2 and Fig. A1
References
Alvares, L.O., Bogorny, V., Kuijpers, B., de Macelo, J., Moelans, B., Palma, A.T., 2007.Towards semantic trajectory knowledge discovery. Data Min. Knowl. Discov.,1–12.
Bogorny, V., Heuser, C.A., Alvares, L.O., 2010. A conceptual data model for trajectorydata mining, Geographic Information Science Vol. 6292. Springer, pp. 1–15.
Bottani, E., Rizzi, A., 2008. Economical assessment of the impact of RFID technologyand EPC system on the fast-moving consumer goods supply chain. Int. J. Prod.Econ. 112 (2), 548–569.
Brown, B., Chui, M., Manyika, J., 2011. Are you ready for the era of ‘big data’?McKinsey Q. 4, 24–35.
Chongwatpol, J., Sharda, R., 2013. RFID-enabled track and traceability in job-shopscheduling environment. Eur. J. Oper. Res. 227 (3), 453–463.
Choudhary, A., Harding, J., Tiwari, M., 2009. Data mining in manufacturing: areview based on the kind of knowledge. J. Intell. Manuf. 20 (5), 501–521.
Chow, H.K.H., Choy, K.L., Lee, W.B., Chan, F.T.S., 2007. Integration of web-based andRFID technology in visualizing logistics operations—a case study. Supply ChainManag.: An Int. J. 12 (3), 221–234.
Dai, J.Q., Huang, J., Huang, S.S., Huang, B., & Liu, Y. (2011). Hitune: dataflow-basedperformance analysis for big data cloud. In: Proceeding of the 2011 USENIXAnnual Technical Conference, 87–100.
Dai, Q.Y., Zhong, R.Y., Huang, G.Q., Qu, T., Zhang, T., Luo, T.Y., 2012. Radio frequencyidentification-enabled real-time manufacturing execution system: a case studyin an automotive part manufacturer. Int. J. Comput. Integr. Manuf. 25 (1),51–65.
Eichengreen, B., Gupta, P., 2013. The two waves of service-sector growth. Oxf. Econ.Pap. 65 (1), 96–123.
Ferrer, G., Heath, S.K., Dew, N., 2011. An RFID application in large job shopremanufacturing operations. Int. J. Prod. Econ. 133 (2), 612–621.
Galletti, A., & Papadimitriou, D.C. (2013). How big data analytics are perceived as adriver for competitive advantage: a qualitative study on food retailers. Masterthesis, 1–58.
Gauchi, J.-P., Chagnon, P., 2001. Comparison of selection methods of explanatoryvariables in PLS regression with application to manufacturing process data.Chemom. Intell. Lab. Syst. 58 (2), 171–193.
Giannotti, F., Nanni, M., Pinelli, F., & Pedreschi, D. (2007). Trajectory pattern mining.In: Proceedings of the 13th ACM SIGKDD International Conference on Knowl-edge Discovery and Data Mining, 330–339.
Gidófalvi, G., Pedersen, T.B., 2009. Mining long, sharable patterns in trajectories ofmoving objects. GeoInformatica 13 (1), 27–55.
Table A1Machines in each phase.
Phase 1 2 3 4 5 6 7Machine amount 18 15 10 2 4 5 10
Table A2Parameters/options of ANN classification.
Network architecture AutomaticCost functions Cross entropyHidden layer sigmoid StandardOutput layer sigmoid StandardEpochs 30Step size for gradient descent 0.1Weight change momentum 0.6Error tolerance 0.01Weight decay 0
Fig. A1. Quantitative analysis of proposed cleansing algorithm and manual statistics analysis.
R.Y. Zhong et al. / Int. J. Production Economics 165 (2015) 260–272 271

Han, J.W., Li, Z.H., & Tang, L.A. (2010). Mining moving object, trajectory and trafficdata. Database Systems for Advanced Applications, Lecture Notes in ComputerScience. 5982 (2010), 485–486.
Hanumanthappa, M., Sarakutty, T., 2011. Predicting the future of car manufacturingindustry using data mining techniques. ACEEE Int. J. Inf. Technol. 1 (1), 27–29.
Hazen, B.T., Boone, C.A., Ezell, J.D., Jones-Farmer, L.A., 2014. Data quality for datascience, predictive analytics, and big data in supply chain management: anintroduction to the problem and suggestions for research and applications. Int.J. Prod. Econ. 154, 72–80.
Hill, T., Hill, A., 2009. Manufacturing Strategy: Text and Cases. Palgrave Macmillan.Huang, Y., Zhang, L., Zhang, P., 2008. A framework for mining sequential patterns
from spatio-temporal event data sets. IEEE Trans. Knowl. Data Eng. 20 (4),433–448.
Jacobs, A., 2009. The pathologies of big data. Commun. ACM 52 (8), 36–44.Kang, J., Yong, H.-S., 2010. Mining spatio-temporal patterns in trajectory data. J. Inf.
Process. Syst. 6 (4), 521–536.Kim, H.S., Sohn, S.Y., 2009. Cost of ownership model for the RFID logistics system
applicable to u-city. Eur. J. Oper. Res. 194 (2), 406–417.Kusiak, A., 2006. Data mining: manufacturing and service applications. Int. J. Prod.
Res. 44 (18–19), 4175–4191.Lee, A.J.T., Chen, Y.A., Ip, W.C., 2009. Mining frequent trajectory patterns in spatial–
temporal databases. Inf. Sci. 179 (13), 2218–2231.Lin, C.Y., Ho, Y.H., 2009. RFID technology adoption and supply chain performance:
an empirical study in China's logistics industry. Supply Chain Manag.: An Int. J.14 (5), 369–378.
Liu, Y.H., Zhao, Y.Y., Chen, L., Pei, J., Han, J.S., 2012. Mining frequent trajectorypatterns for activity monitoring using radio frequency tag arrays. IEEE Trans.Parallel Distrib. Syst. 23 (11), 2138–2149.
Manyika, J., Chui, M., Brown, B., Bughin, J., Dobbs, R., Roxburgh, C., Byers, A.H., 2011.Big data: the next frontier for innovation, competition, and productivity.McKinsey Glob. Inst., 1–137.
Monreale, A., Pinelli, F., Trasarti, R., & Giannotti, F. (2009). WhereNext: a locationpredictor on trajectory pattern mining. In: Proceedings of the 15th ACMSIGKDD International Conference on Knowledge Discovery and Data Mining,637–646.
Nativi, J.J., Lee, S., 2012. Impact of RFID information-sharing strategies on adecentralized supply chain with reverse logistics operations. Int. J. Prod. Econ.136 (2), 366–377.
Ngai, E., Moon, K.K., Riggins, F.J., Yi, C.Y., 2008. RFID research: an academic literaturereview (1995–2005) and future research directions. Int. J. Prod. Econ. 112 (2),510–520.
Obitko, M., Jirkovský, V., Bezdíček, J., 2013. Big data challenges in industrialautomation, Industrial Applications of Holonic and Multi-Agent Systems.Springer, pp. 305–316.
Poon, T.C., Choy, K.L., Chow, H.K.H., Lau, H.C.W., Chan, F.T.S., Ho, K.C., 2009. A RFIDcase-based logistics resource management system for managing order-pickingoperations in warehouses. Expert. Syst. Appl. 36 (4), 8277–8301.
Rabl, T., Gómez-Villamor, S., Sadoghi, M., Muntés-Mulero, V., Jacobsen, H.-A.,Mankovskii, S., 2012. Solving big data challenges for enterprise applicationperformance management. Proc. VLDB Endow. 5 (12), 1724–1735.
Romero, A.O.C., 2011. Mining moving flock patterns in large spatio-temporaldatasets using a frequent pattern mining approach Master thesis. Universityof Twente, pp. 1–79, March 2011.
Sarac, A., Absi, N., Dauzère-Pérès, S., 2010. A literature review on the impact of RFIDtechnologies on supply chain management. Int. J. Prod. Econ. 128 (1), 77–95.
Sari, K., 2010. Exploring the impacts of radio frequency identification (RFID)technology on supply chain performance. Eur. J. Oper. Res. 207 (1), 174–183.
Shahbaz, M., Shaheen, M., Aslam, M., Ahsan, S., Farooq, A., Arshad, J., Masood, S.A.,2012. Data mining methodology in perspective of manufacturing databases.Life Sci. J. 9 (3), 13–22.
Syed, A.R., Gillela, K., Venugopal, C., 2013. The future revolution on big data. Int. J.Adv. Res. Comput. Commun. Eng. 2 (6), 2446–2451.
Terziovski, M., 2010. Innovation practice and its performance implications in smalland medium enterprises (SMEs) in the manufacturing sector: a resource‐basedview. Strateg. Manag. J. 31 (8), 892–902.
Vera-Baquero, A., Colomo-Palacios, R., Molloy, O., 2013. Business process analyticsusing a big data approach. IT Prof., 1–9.
Wamba, S.F., Chatfield, A.T., 2009. A contingency model for creating value from RFIDsupply chain network projects in logistics and manufacturing environments.Eur. J. Inf. Syst. 18 (6), 615–636.
Wang, S.J., Liu, S.F., Wang, W.L., 2008. The simulated impact of RFID-enabled supplychain on pull-based inventory replenishment in TFT-LCD industry. Int. J. Prod.Econ. 112 (2), 570–586.
Weng, W.H., & Weng, W.T. (2013). Forecast of development trends in big dataindustry. In: Proceedings of the Institute of Industrial Engineers Asian Con-ference 2013, 1487–1494.
Windt, K., Böse, F., Philipp, T., 2008. Autonomy in production logistics: identifica-tion, characterisation and application. Robot. Comput. Manuf. 24 (4), 572–578.
Xu, X., 2012. From cloud computing to cloud manufacturing. Robot. Comput. Manuf.28 (1), 75–86.
Zhong, R.Y., Dai, Q.Y., Qu, T., Hu, G.J., Huang, G.Q., 2013. RFID-enabled real-timemanufacturing execution system for mass-customization production. Robot.Comput. Manuf. 29 (2), 283–292.
Zhong, R.Y., Huang, G.Q., Dai, Q.Y., Zhang, T., 2014. Mining SOTs and dispatchingrules from rfid-enabled real-time shopfloor production data. J. Intell. Manuf. 25(4), 825–843.
Zhong, R.Y., Huang, G.Q., Dai, Q.Y., & Zhang, T. (2013). Mining logistics trajectoryknowledge from rfid-enabled production big data. In: Proceeding of the 43rdInternational Conference on Computers and Industrial Engineering (CIE43),[34]-31-[34]-12.
R.Y. Zhong et al. / Int. J. Production Economics 165 (2015) 260–272272