int. j. engg. res. & sci. & tech. 2014 r s deepak, 2014int. j. engg. res. & sci. &...
TRANSCRIPT

This article can be downloaded from http://www.ijerst.com/currentissue.php
233
Int. J. Engg. Res. & Sci. & Tech. 2014 R S Deepak, 2014
ISSN 2319-5991 www.ijerst.com
Vol. 3, No. 2, May, 2014
© 2014 IJERST. All Rights Reserved
Research Paper
SOLAR ENERGY BASED EFFECTIVE POWERDISSEMINATION EXECUTIVE SYSTEM
R S Deepak1*
*Corresponding Author: R S Deepak, � [email protected]
A huge crisis, we face today is mounting power expenditure and that is the reason why renewablepower source has been focused in the recent days.The expectation for a “solar uprising” hasbeen on the edge around for decades. The proposal that one day will use free electricity fromthe sun. This is a seductive promise, because on a bright sunny day, the sun’s rays gives offapproximately 1,000 watts of energy per square meter of our Earth’s surface. If we could collectall that energy, we can easily power our homes and offices for free of cost. And now is the timeto focus on executive management systems to manipulate the technologies to highly mount thepower efficiency. In this paper, we have proposed the system of Smart Power DisseminationExecution (SPDE) to monitor environmental variables which vary in a rapid manner and executesolar power in a flexible manner. The SPDE improves the energy efficiency up to 5.6 percentthan normal utility interactive systems.
Keywords: Power Efficiency, Photovoltaic System, Renewable Energy, ZigBee
INTRODUCTION
Nowadays, Information Technology sectors areincreased in large numbers to provide a range offacilities and facility value and the crisis is theyrequire greater level of power. Even thoughatmosphere-friendly technologies are used, agood rate of efficiency is not achieved yet.
Electric cars are now produced by somecompanies which led to atmosphere- friendly. Theanswer is unhappily “NO” for the question “Doesrecently manufactured Electric cars are efficientenough to make a significant change?”. Due tothese technical issues, renewable energy ishighlighted for the past decade. So now is the
1 Department of ECE, BharathUniversity, Chennai, Tamil Nadu.
right time to make renewable energy as sustain-able renewable energy. This can be achieved byusing Smart Grid and MPPT (Maximum PowerPoint Tracking). But still, stability and highefficiency can’t be achieved due to some issuessuch as:
i) Passive property of the current systems
ii) Generation status depending on weatherconditions
iii) Current Battery Status.
To obtain a higher efficiency of renewableenergy a Smart Power Dissemination Executionsystem has been designed to observe the
This article can be downloaded from http://www.ijerst.com/currentissue.php
234
Int. J. Engg. Res. & Sci. & Tech. 2014 R S Deepak, 2014
parameters and provide a smart executionservices.
In this paper, a Smart Power DisseminationExecution system is proposed with thephotovoltaic system. That is, according to eachenvironment, it observes various variables, andperforms optimal power management tomaximize efficiency. We have designed a SmartPower Dissemination Execution (SPDE)middleware, implemented it in a test bed, andverified its performance on how efficiently itmanages energy.
RELATED WORKS
Globally, a huge attention is received forrenewable energy systems such as photovoltaicpower and wind power generation.
Even though, most power can be producedby thermal power generation and nuclear powergeneration plants, thermal power plants emit thecarbon dioxide into the atmosphere and nuclearpower plants have potential danger and dischargenuclear wastes. And so it is better to go withrenewable sources to make an eco-friendlyenvironment.
Renewable energy power generation unit costis more expensive than fossil fuel generation, butstill this type of generation will replace the existingpower plants because it is an inexhaustibleresource. Hence, it is considered as the vitalsolution to solve various powercrisis.
Renewable energy such as photovoltaic andwind power systems cannot always maintainsteady power but thermal plants and nuclearplants can provide steady output power. Thepower generation dependsupon the time of yeari.e. season, hourly difference and weathercircumstances. Generally, a photovoltaic powersystem generates maximum power at noon.Conferring to time variation, the efficiency ofrenewable energy makes a huge difference.
Moreover, it is difficult to expect steady generationoutput due to insolation and wind velocity factors,which are changing every hour and so therenewable energy is required to store unsteadygenerated energy in energy storage systems.However, a renewable energy system is neededto improve energy efficiency through efficientexecution considering charging periods andintervals for use, due to the limitations of storagecapacity. Apower conditioning unit with invertersystemis also required to use stored or generatedenergy with the existing electrical grid.
At the outset, the features of unsteady outputpower in the renewable power generationsystems cause some complications with outputvoltage and frequency control. Such complicationis the most noteworthy problem to solve toconnect renewable energy systems to theexisting power grid. A high-efficiency inverter anda high-capacity energy storage system maintainthe output voltage and frequency stably on equalterms with the power grid network. Hence, high-efficiency inverters and the high-capacity energystorage systems are necessary to connect to thepower grid. Through the below mentionedreference papers, various types of inverters havebeen developed and examined to minimizeenergy loss in the power transformation process.A MPPT or Maximum Power Point Tracker is usedin our system to convert DC (higher voltage) toDC (lower voltage) that optimizes the matchbetween the PV panels and the battery bank orutility grid. Though, as defined above, there aremany variables to be considered to providesteady power generation production. Asconcerned with photovoltaic power systems,weather and season have a critical effect on theamount of generation. Furthermore, mostrenewable energy systems require storagesystems. On the other hand, the storage systemshave their own limits, and are not easy to installona large-scale from the view of return of

This article can be downloaded from http://www.ijerst.com/currentissue.php
235
Int. J. Engg. Res. & Sci. & Tech. 2014 R S Deepak, 2014
investment. In this paper, we have proposed aexecution system to make the most of theefficiency of a photovoltaic power system inapplication’s part.
The combination of component technologiesof renewable energy with commercial electricityresults in high efficiency and positively. Eventhough research on the element technologieshave been examined well, studies on energymanagement with renewable energy are notcomparatively developed. In case of on-gridphotovoltaic systems connected to commercialelectricity grids directly through inverters as inFigure 1, power intake can be decreased in officeblock or home environment, but still there couldalso be energy loss when power consumption isvery low or electricity price are cheap, and viceversa. A smart execution system is needed notonly to monitor the whole system but also toperform optimal management according to ever-changing conditions such as season, weatherand power intake.
SYSTEM ARCHITECTURE
The most significant purpose of the SPDE is todetermine how efficiently produced power fromsolar panels can be used. For such purpose,SPDE checks the status of a solar batteriescharge and deduces future power consumptionby using specific methods to use solar power.SPDE chooses the time to use stored energy ina battery by using power information, the left overamount of stored energy, and web data. Forinstance, SPDE Figure out weather, which affects
the efficiency of photovoltaic panels and powerconsumption, which is varying every hour, anddecides the finest time to use the stored energy.The structure of the SPDE consists of three mainparts: Power Execution System (PES), whichmanages each nodule and performs total powerexecution in the upper cover; Light Weight PowerExecution System (LWPES) and Repeater, whichmanage each nodule and deal with tasks in thePES for disseminated processing; and theFlexible Power Monitoring Device (FPMD) andPower Monitoring Device (PMD), which play therole of sensor nodes to collect powerconsumption information.
As defined above, the PES collects data fromthe LWPES, manages the whole system, andprovides the collected data to users. The LWPEShas a structure of light weight middleware suitablefor smaller spaces and excepts the Rule- basedEngine and Knowledge Repository which areincluded in the PES. Depending on the structureor size of the places in which SPDE is applied,LWPES can collect the data of the PMD andFPMD directly, but it is also possible to collect itthrough Repeater.
Figure 1: Structure of General Photovoltaic System
Figure 2: Middleware Architecture andSystem Structure of the SPDE

This article can be downloaded from http://www.ijerst.com/currentissue.php
236
Int. J. Engg. Res. & Sci. & Tech. 2014 R S Deepak, 2014
The Power Monitoring Device (PMD) has threepower sockets to measure power consumptionof devices, and a ZigBee network module. Bymeans of these, it can transmit the powerconsumption info or receive a control signal tocontrol the power of devices through ZigBee. TheSPDE collects power consumption data from thePMD and FPMD. The entire system design is asfollows.
The purple colored area in Figure 2 is the areaconsist of multiple PMDs and the FPMD. Eachnode sends power determining data to anappointed Router or LWPMS through the ZigBeelink. Just in case of a specific area which iscovered by one FPMD and multiple PMDsaccording to the number of devices, each nodeis categorized by Node ID and Group ID. Thegather round power consumption data aretransmitted to the LWPMS, analyzed, and usedto perform power execution.
Classification FPMD and PMD
Communication Interface ZigBee
Graded Current 5, 20, 50, 100A (PMS: 20A only)
Number of Measurable Items 7
RF output 1mW(30m), 10mW(50m)
Table 1: Hardware Requirement of FPMD and PMD
Figure 3 illustrates the hardware structure ofthe PMD and FPMD. The Microcontroller Unitislocated in the mid and the ZigBee communication,relay control, power sensing, power supply anduser interface be existent in the PMD. The PMDoffers the ability to sense power consumption,turn devices on or off, and transmit data throughZigBee network. On the other hand, FPMD doesnot include the relay control part and userinterface portion. Clamp-type CT sensors areused to allow for easy setting up in a distributionpanel without replacement of modules. In general,it is difficult to set up a power metering device in
a distribution panel because of its structuralcomplexity. To overcome such inconvenience, theFPMD utilizes the clamp type CT sensors tomeasure power consumption with no trouble.Initially, an analog value collected by the CTsensors is converted to a current value that canbe handled in the MCU by the power measuringIC and the voltage is varied.
As a result, the FPMD and PMD can determinehow much power consumption is used from thecurrent and voltage. And this power consumptionvalue is stored in the internal memory of theMicrocontroller Unit and the stored data aretransmitted every so often to the Repeater or theLight Weight PES. A simple architecture isdesigned for the FPMD as it only collects, storesand transfers data. These tasks can also beperformed by PMD, but additionally shuts offpower in electrical sockets if a monitoring valueexceeds the default value or the value is changedby users. That is to say, the total permissible valueconsists of (1):
PmaxPsocket1_maxPsocket2 _ maxPsocket3_ max...(1)
and this value cannot be changed. But still, thepower shutting-off value is able to be changedso that the power shutting-off value of each powersocket or all sockets can be set to be applied invarious environments. If a consumer wants tosave power consumption, he can vary the valueto be applied in his own environment based onthe consumer’s needs. By using the PMD andFPMD, all used power in a specific space can beexamined.
In addition, the PES also collects the currentbattery status and generated power in a solarpanel by using the FPMD. The PES collects themeasured power data from the photovoltaicsystem module, FPMD & PMD and organizesthese data with interval of time. As per middlewaremodules in the PMS, the types of data are below:

This article can be downloaded from http://www.ijerst.com/currentissue.php
237
Int. J. Engg. Res. & Sci. & Tech. 2014 R S Deepak, 2014
Figure 3: (A) Power Monitoring DeviceHardware Construction (B) Flexible PowerMonitoring Device Hardware Construction
(C) Hardware Architecture of FPMD and PES
Figure 4: Rule Engine of the WebInformation Management
� Web data Management: OutdoorTemperature, Humidity, Weather and Seasoninfo and electric charge through web-crawling.
� Renewable Power Execution: Generatedpower and battery charging condition in thesolar power generator.
� Agent Execution: Power Consumption in thePMD and FPMD.
The collected info is analyzed in the Smart PowerExecution part in the PES. In this paper, we haveproposed two power management methods,efficiency-focused and user-focused methods.
A. Efficiency- focused Method
The vital use of the efficiency-focusedmethod ishow efficiently the PES uses the solar power. Thetwo important power factors are: i) current powerconsumption in this system ii)generated andcharging solar power. The efficiency-focusedmethod concentrates on the usage of the solarpower.
As termed above, the PES collects the out-of-doors temperature, humidity, and atmosphereconditions by the Web DataExecution so that itcan infer. In Figure 4, the Web Data Analyzer takedelivery of the web crawling data and comparesit with previous data stored in the KnowledgeRepository in the PES. The result is comparedwith the previous data, so that the WebInformation Analyzer can predict whether powerconsumption increases or decreases based onthe rule-based engine. For instance, say if thecurrent temperature increases during summer.And once the temperature rises, the WebInformation Analyzer will choose the yellow‘summer’ box first as in Figure 4, and then theresult would be ‘Highly Increase’ or 'SlightlyIncrease'. The purpose why it regulates this actionis that if the temperature goes up in the daytime,can infer that users would need to adjust optimaltemperature and use air conditioning devices.During nighttime, users would also use airconditioning devices, where the powerconsumption would also be less than the daytime.

This article can be downloaded from http://www.ijerst.com/currentissue.php
238
Int. J. Engg. Res. & Sci. & Tech. 2014 R S Deepak, 2014
Power Management chooses to use the chargingbattery.
� Power Factor C > Default Value: use thecharging battery
� Power Factor C Default Value (margin oferror of 3%):
Using the chargeable battery with partialdevice controls
� Power Factor C < Default Value :do not usethe charging battery.
The rule ismade simpler and composed asdescribed above. The default value can be variedby the user or other experimental results so thatthe proposed system can be applied in varioussurroundings. If the Power Factor C is higher orthe same as the Default Value, the PES decideon to use the battery. In the next second case,the PES finds the PMDs, which are less graduallyused and turns off the power to make the defaultvalue less than the Power Factor.
As defined above, according to the efficiencyof the batteries and time the default value can bevaried. The motive why the default value is ableto change is that charging a battery does not showlinear characteristics and the solar power buildingblock can be extremely influenced. we havedetermined in this paper, a specific value whichshows the most efficiency in a simulation as theDefault Value, but then it should be studied more.
B. User-focused Method
The efficiency-focused method only focuses onfinding the optimal time to use the chargingbattery for falling power consumption and electriccharges. On the other hand, even though theservice quality of power execution rises, there isanother difficulty users have. For instance, thinkthrough a device which is always turned on suchas a computer and if this device is turned off bythe power control of the PES, users would feel
Even though this inference of the Web DataExecution cannot always be accurate, this endresult is used with other measured power data tomake more accurate power estimates.
As concerned with Renewable PowerExecution, the generated power and batterycharging conditions are transferred to the SmartPower Management. Initially, the current batterystate is compared with the current powerconsumption in the Smart Power execution forbetter understanding how much it can be utilizedand the electric charges according to seasonalchange. The gathered information from the PMD,FPMD and photovoltaic system unit areconverted into specific factors according to thepredefined table in the Rule-based EngineManagement, and these factors end result in thefollowing three equations.
Web _ Info Weather Season Time ...(2)
PF _ A {(Web _ Info Generation ) Battery}...(3)
PF _ B Consumption (1 Web _ Info) ...(4)
PF _C ( PF _ A PF _ B) ...(5)
Consumption
The Smart PowerExecution determineswhether it uses the battery through the threePower Factors: i.e.) season, weather and time.Equation (3) refers to the available battery powerby using Web Info in equation (2), byusingseason, weather and current time asvariables. The variable ‘Battery’ is the wattageconverted from the current battery condition.Each variable (season, weather and time)contains a specific value from 0 to 1, and thoseare varied according to season, weather andhourly variation. Equation (4) is the estimatedpower demand which is added to current powerconsumption and the concluded power consum-ption from the Web Information. Depending onthe Power Factor C in equation (5), the differencebetween the Power Factors A and B, the Smart
This article can be downloaded from http://www.ijerst.com/currentissue.php
239
Int. J. Engg. Res. & Sci. & Tech. 2014 R S Deepak, 2014
inconvenient and which means the servicequality decreases.
A user-focused method is suggested toresolve this problem. The PMD has four switchesand one of the switches can give a priority amongthe three power sockets. In addition, the PESdeduces which PMD or device plugged into apower socket is used frequently based on datalogs in the Knowledge Repository. By means ofthese two ideas, the PES can control the powerexcept for devices which have priority or are usedoften. That is to say, the PES in the user-focusedmethod bring about the entire system for theuser’s convenience, individually of the efficiency.
The user-focused method has a much simpleralgorithm than the efficiency-focused method.Initially, the PES organizes the powerconsumption according to the time slot in thetabletop. It chooses the specific time slot whichhas high power consumption to use thechargeable battery. And in case of the user-focused method, the PES prevents decreases ofthe service quality of the user's conveniencebecause of shutting off standby power carelessly.It maintains power to the distinct devices, anduses the solar power to reduce cost burden ofthe user.
IMPLEMENTATION
The previous chapter describes the middlewarearchitecture of the SPDE. Based on thismiddleware, the PES manages each PMD &FPMD and gathers power data from both the twodevices and photovoltaic system through theZigBee network. These data are transferred tothe Light Weight PES and it examines these dataand sends it to the PES. The PMS will be able tohandle many more nodes with the help of thedistributed structure. Furthermore, if the numberof nodes are small, the Light Weight PES isdesigned in such a manner to perform most
functions of the PES so that it can be applied inaverage homes with the one Light Weight PES,not the PES and multiple LWPES.
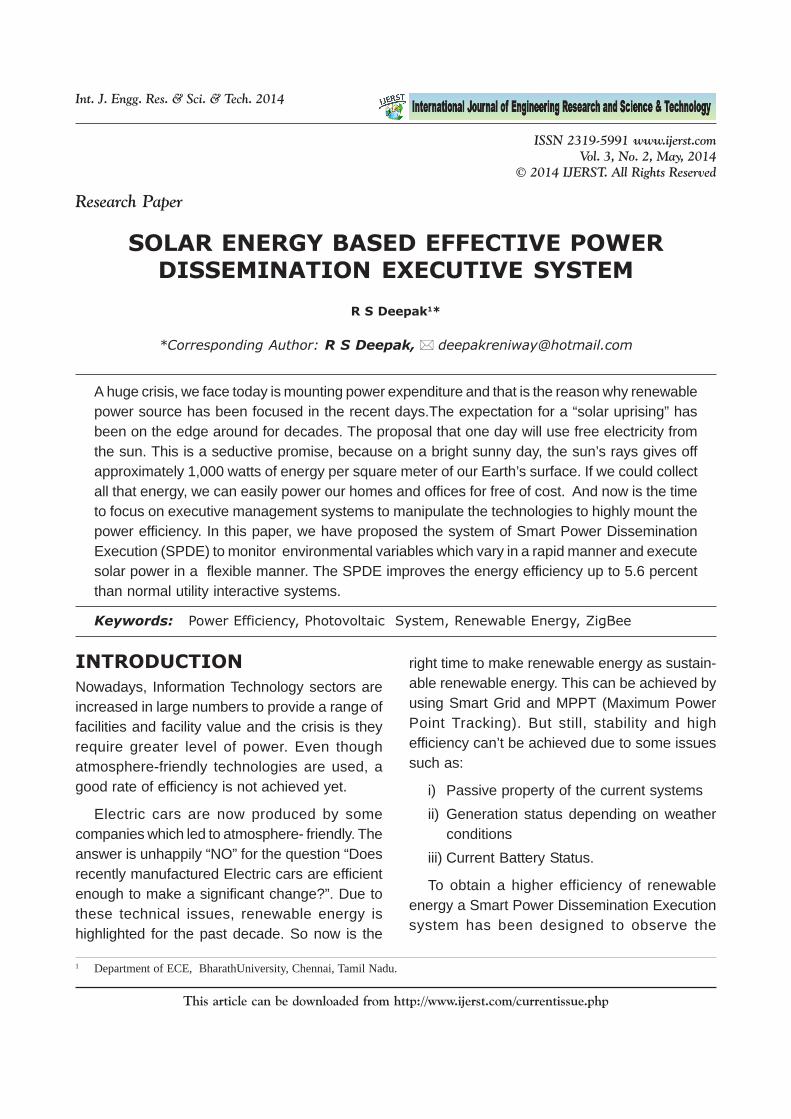
Figure 5: Photovoltaic Generation System(A) 4 solar panels (B) Inverter
(C) Battery (D) PV Charge Controller
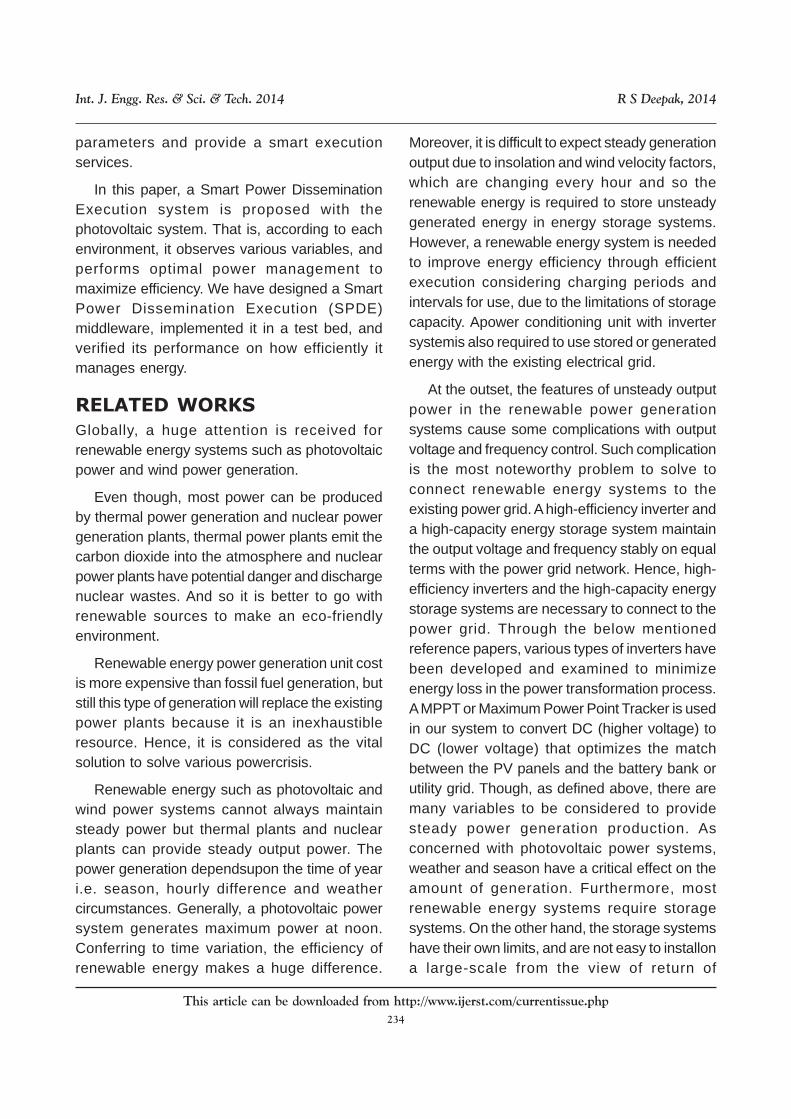
Figure 6: System Structure of PhotovoltaicGeneration System with the SPDE
Classification Value
Maximum Power of Solar Panel (4) 100 W (Total 400W)
Maximum Output Power of 600W
Inverter
Battery Capacity (10) 120 Ah (360 Ah)
Battery Output Voltage 12V
Battery Power 14400 Wh
Table 2: Hardware Specification ofPhotovoltaic Generation System
This article can be downloaded from http://www.ijerst.com/currentissue.php
240
Int. J. Engg. Res. & Sci. & Tech. 2014 R S Deepak, 2014
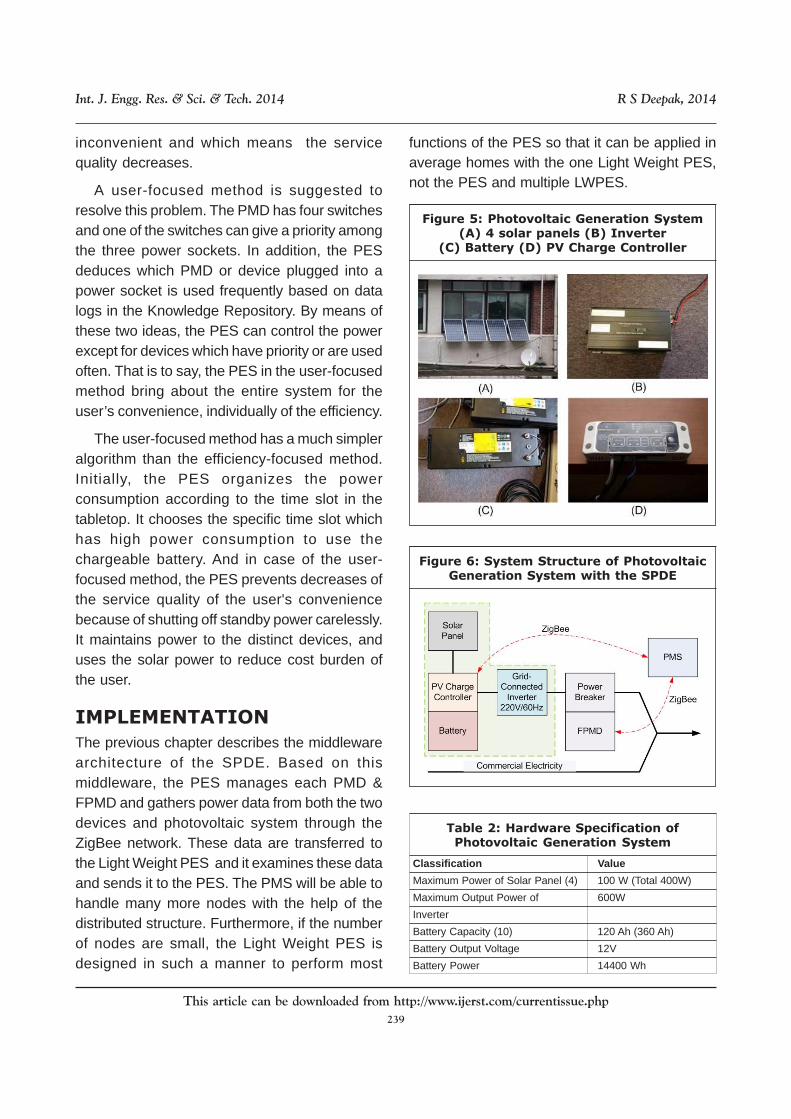
Figure 7: Experimental Results According toPower Execution Methods; Power
Consumption According to time; Bold LineMeans the Time When the Battery is Used
Figure 5 & 6 showsthe generation of thephotovoltaic system used in this paper. We haveinstalled a solar panel system on the side of awindow, and it consists of a battery, an inverterand Photo-voltaic charge controller that managesthe battery charge capably. At that point, thisgeneration system is connected to a powerbreaker in the PES to be linked to the commercialelectricity grid. The FPMD with the power breakerand battery measuring device in the solar panelcontroller transfers power data to the PESregularly through the ZigBee network.
To test the efficiency of the SPDE includingthe PES, PMD, FPMD, and photovoltaic system,we have implemented it in the test bed. The testbed is utilized as a research space with TVs,audio devices, and a washing machine, whichare all generally used in a home.
EXPERIMENTAL RESULTS
We have implemented a proposed system in thetest bed similar to a home space, and tested thetwo energy management methods. The ten PMDsand one FPMD were installed, and the PES waslocated in the center of the test bed to minimizewireless network problems. Furthermore, we alsoconsidered the variation of types of devices toprovide a general experimental environment, andadjusted the number of devices because it isdifficult to handle power consumption in the testbed by a limited capacity of batteries.
We tested three different methods: the generalutility interactive system method, the efficiency-oriented method,and the user- oriented method.To decrease external variables according to
Classification Value
Size 96
The number of used devices 30
Monitoring time 6:00 ~ 23:00
Table 3: Experimental Environment of Test Bed weather condition, the battery is charged up toeighty percent in each experiment. In the user-oriented method, five computers are given priority,and the PES chooses between two PMDs to notturn off power based on the previous power data.Over three days, each experiment was performedin a sunny day to provide battery charge.
Figures 7 and 8 show the result of this experi-ment among the three different environments. InFigure 7, decreased power consumption from12:00 to 15:00 appears in the efficiency -orientedand user -oriented methods. However, there is adifference between the two methods, becausethe efficiency-oriented method shows evenlydeclined power consumption, but power consum-ption of the user-oriented method is concentratedfrom 12:00 to 13:00. As explained, both methodsconsider current battery status having limitedcapacity so that the PMS manages the battery inspecific times.
In total power consumption, the efficiencymethod and user method show 5.64 percent and4.79 percent respective improvement comparedwith the normal operation. Moreover, it higherenergy efficiency is expected with more batterycapacity and solar panels.

This article can be downloaded from http://www.ijerst.com/currentissue.php
241
Int. J. Engg. Res. & Sci. & Tech. 2014 R S Deepak, 2014
CONCLUSION
In this paper, the proposed system givesenhanced power efficiency when compared witha normal utility interactive system. Improvementin storage capacity and the number of solarpanels, makes the SPDE perform better. Inaddition, more atmosphere factors are notincluded in this paper for the verification process.We have studied each factor that can influencethis system and found other variables to improvepower productivity.
REFERENCES
1. A O Converse (2012), “Seasonal EnergyStorage in a Renewable Energy System,”Proceedings of the IEEE, Vol. 100, pp. 401-409.
2. H C Chiang, T T Ma, Y H Cheng, J M Changand W N Chang (2010), “Design and Imple-mentation of a Hybrid Regenerative PowerSystem Combining Grid-tie and Uninterrup-tible Power Supply Functions,” Renewa blePower Generation, IET, Vol. 4, pp. 85-99.
3. J Lee, B Han and K Choi (2011), “High-Efficiency Grid-tied Power ConditioningSystem for Fuel Vell Power Generation,” inPower Electronics and ECCE Asia (ICPE &
ECCE), 2011 IEEE 8th InternationalConference on, pp. 1492-1497.
4. K Touafek, M Haddadi and A Malek (2011),“Modeling and Experimental Validation of aNew Hybrid Photovoltaic Thermal Collector,”Energy Conversion, IEEE Transactions on,Vol. 26, pp. 176-183.
5. L Zhigang, G. Rong, L Jun and A Q Huang(2011), “A High-Efficiency PV Module-Integrated DC/DC Converter for PV EnergyHarvest in FREEDM Systems”, PowerElectronics, IEEE Transactions on, Vol. 26,pp. 897-909.
6. M B Nissen (2009), “High PerformanceDevelopment as Distributed Generation”,Potentials, IEEE, Vol. 28, pp. 25-31.
7. M M Amin and O A Mohammed (2011),“Development of High-Performance Grid-Connected Wind Energy Conversion Systemfor Optimum Utilization of Variable SpeedWind Turbines”, SustainableEnergy, IEEETransactions on, Vol. 2, pp. 235-245.
8. P Sung-Yeul, L Jih-Sheng and L Woo-Cheol(2010), “An Easy, Simple, and FlexibleControl Scheme for a Three-phase Grid-tieInverter System”, in Energy ConversionCongress and Exposition (ECCE), IEEE, pp.599-603.
9. S Teleke, M E Baran, S Bhattacharya and AQ Huang (2010), “Optimal Control of BatteryEnergy Storage for Wind Farm Dispatching”,Energy Conversion, IEEE Transactions on,Vol. 25, pp. 787-794.
10. X Q Guo and W Y Wu (2010), “ImprovedCurrent Regulation of Three-phase Grid-Connected Voltage-source Inverters forDistributed Generation Systems”, RenewablePower Generation, IET, Vol. 4, pp. 101-115.
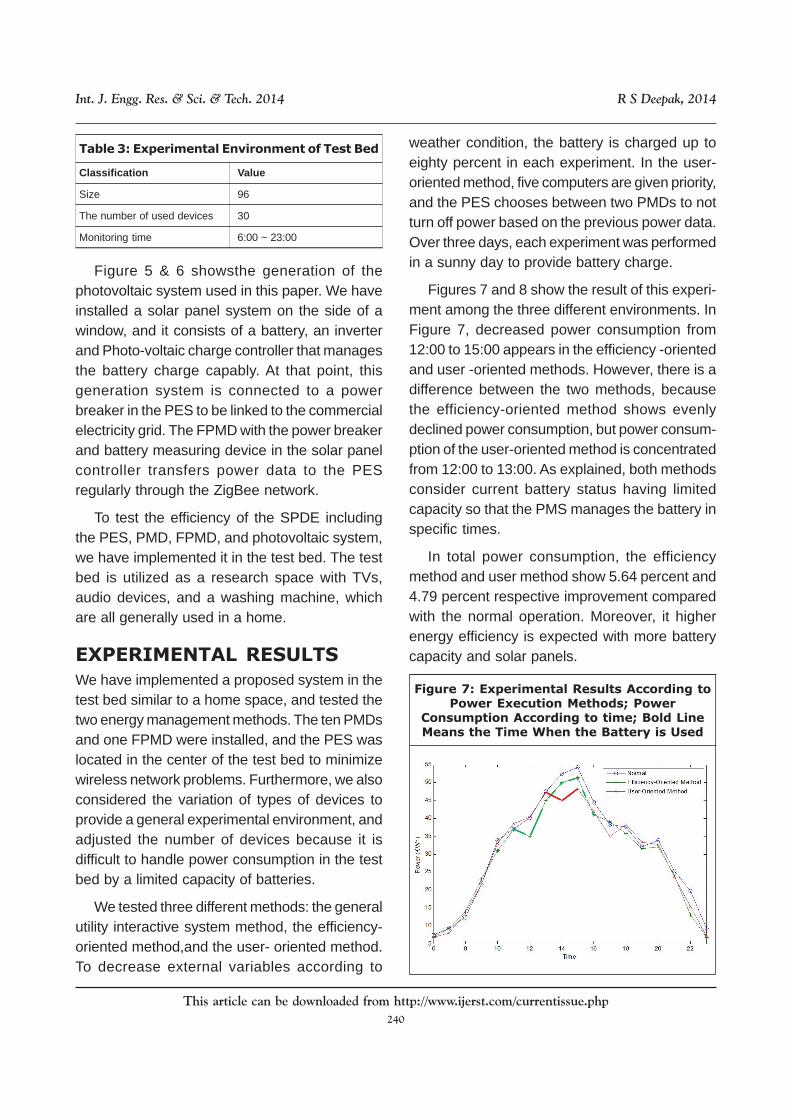
Figure 8: Experimental Results According to PowerExecution Methods; Total Power Consumption