int. j. electrochem. sci., (2021)
TRANSCRIPT
Int. J. Electrochem. Sci., 16 (2021) Article Number: 211131, doi: 10.20964/2021.11.46
International Journal of
ELECTROCHEMICAL SCIENCE
www.electrochemsci.org
Preparation of a Au SERS substrate and its application in the
in-situ Raman spectroelectrochemistry study of Li2CO3-K2CO3
molten salt
Jiangyu Yu1, Chengyuan Liu1, Xianwei Hu1,*, Tian Yuan1, Yifan Zhang1, Zhaowen Wang1, Wuren Ji2,*
1 School of Metallurgy, Northeastern University, Shenyang 110819, China 2 Northwest Research Institute of Mining and Metallurgy, Baiyin 730900, China *E-mail: [email protected], [email protected]
Received: 30 July 2021 / Accepted: 8 September 2021 / Published: 10 October 2021
Molten carbonate is often used as a medium for the decomposition of carbon dioxide to produce
carbon and oxygen. In-situ Raman spectroelectrochemistry is an effective means to study species
changes and the electrochemical reaction mechanism at the electrode-electrolyte interface. In this paper,
a Au surface-enhanced Raman spectroscopy (SERS) substrate was prepared by an electrochemical
oxidation-reduction cycle (ORC) process, and the reaction mechanism and intermediate species on this
kind of Au SERS electrode in a Li2CO3-K2CO3 molten salt were studied. The prepared Au SERS
substrate has a SERS factor of 1.37×10⁴, and it presents excellent uniformity and long-term stability.
Although the SERS effect of the Au substrate gradually weakens as the temperature increases, it
maintains an acceptable SERS factor of 8.76×10² after a high-temperature treatment at 873 K. The
cyclic voltammogram result shows that carbon reduction preferentially occurs on an Au electrode
during the cathodic electrochemical process in Li2CO3-K2CO3 molten salt. In-situ Raman spectroscopy
confirms the existence of the intermediate peroxide ion (O22-) during the electrochemical reduction
process.
Keywords: In-situ Raman spectroscopy; SERS; Carbonate molten salt; Peroxide ion
1. INTRODUCTION
Molten carbonate salts have received extensive attention because of their applications in high-
temperature catalysis, fuel cells, thermal energy storage and carbon dioxide recovery [1-5]. The
preparation of carbon and oxygen by the electrolysis of CO2 in molten carbonate salts is an effective
process to realize the rational utilization of CO2. Alkali metal carbonate is considered an ideal medium

Int. J. Electrochem. Sci., 16 (2021) Article Number: 211131
2
in this process [6-10]. Thus, knowledge of the electrochemical behavior and internal structure of
carbonate molten salts is very important.
Appleby et al. studied the electrochemical reaction of oxygen and carbonate ions in molten
carbonate in an atmosphere of oxygen and carbon dioxide by steady-state and cyclic voltammetric
electrochemical technologies [11-13]. They proposed three possible reaction pathways containing
active peroxide ion (O22-), superoxide ion (O2-), and peroxycarbonate ion (CO4
2-) intermediates. In
addition, the neutralization of the O2- ion by CO2 was considered as the rate controlling step of the
entire porous electrode reaction in alkali carbonate melts. Vogel et al. studied the solubility of oxygen
in Li2CO3-K2CO3 (molar ratio of 62:38) molten salt using a rotating electrode, and found that the main
oxygen-containing species in the molten salt is superoxide ions [14]. Cassir et al. studied the
electrochemical processes and thermodynamics of oxygen reduction in alkali metal carbonate systems
at different temperatures through cyclic voltammetry and rotating potential scanning techniques [15-
16]. The results showed that peroxide ions can only exist stably in basic systems, and superoxide ions
cannot exist in Li-containing carbonates but can stably exist in Na-K carbonates. In addition, CO2
participated in the rate-determining reduction of superoxide and peroxide ions. Van et al. measured the
cyclic voltammetry curves recorded on a carbon electrode in molten Li-Na-K carbonates at the eutectic
composition (43.5:31.5:25 in molar percentage) [17]. Peroxide ions adsorbed on the electrode during
carbon electrodeposition, and could only stably exist on the carbon deposit. They also found that the
concentration of peroxide ions on the electrode surface increased as the potential became more
negative, resulting in a decrease in the electrode effective area. A similar result was also reported by
Borucka [18].
In-situ Raman spectroelectrochemistry can provide changes in complex species on/near the
electrode surface, which contributes to deeply studying the electrochemical reaction mechanism on the
electrode [19-23]. Raman spectroscopy shows unique advantages in the research on melt structures and
high-temperature chemical reactions [24-27]. Itoh et al. studied the cyclic voltammetry behavior of
molten Li2CO3-K2CO3 and Li2CO3 systems on a gold electrode, and thought that peroxide ions (O22-)
and superoxide ions (O2-) were generated during the electrochemical reduction of oxygen, while
peroxide ions could only exist in the Li2CO3 system [28-29].
Conventional Raman spectroscopy technology is limited in its application in high-temperature
molten salts because the Raman scattering signal was too weak to detect the required surface or
interface. Surface-enhanced Raman scattering (SERS) technology is usually used to increase the
Raman scattering signal, which can significantly enhance the Raman scattering signal of species
adsorbed on certain metal surfaces by several orders of magnitude [30-31]. SERS has been widely
used for the in-situ study of various solid-liquid, solid-gas, and solid-solid interface systems at the
molecular level to characterize the structure and process of surfaces (interfaces), especially identifying
the weak Raman signal of intermediate species in electrochemical reactions [32-33]. To achieve an in-
depth understanding of the electrochemical mechanism of carbonate molten salt and expand the
application of SERS technology in high-temperature molten salts, a Au SERS substrate was prepared
by an electrochemical oxidation-reduction cycle (ORC) process [34] in this paper, and the
electrochemical reaction mechanism and intermediate species on the polished and Au SERS electrodes
were studied in Li2CO3-K2CO3 molten salt by in-situ Raman spectroelectrochemistry.

Int. J. Electrochem. Sci., 16 (2021) Article Number: 211131
3
2. EXPERIMENTAL
The Au SERS substrate was prepared by the ORC process in 0.1 mol·L-1 KCl aqueous solution.
A polished Au sheet and a platinum sheet were used as the working and counter electrodes respectively,
and the reference electrode was a saturated calomel electrode. The electrochemical treatment process
of the polished Au substrate is shown in Figure 1.
Figure 1. The diagram of the ORC process for Au SERS substrate preparation
Rhodamine 6G (R6G) was used as the probe molecule to test the SERS effect of the Au SERS
substrate. The substrate was immersed in a 10-4 mol·L-1 aqueous solution of R6G for more than 2 hours
and then rinsed with deionized water to remove the adsorbed chemical. The Raman spectra were
recorded via a Raman spectrometer (Horiba Jobin Yvon LabRAM HR 800).
Cyclic voltammogram measurements were carried out in the Li2CO3-K2CO3 molten salt (68:32
in molar percentage) to study the reaction mechanism on the electrode surface during the cathodic
electrochemical process. All experiments were processed with a three-electrode assembly. An Au wire
was used as an inert working electrode, and the active electrode surface area was calculated by the
immersion depth of the electrode in the molten salt. A platinum wire and graphite rod were used as the
quasi-reference electrode and counter electrode, respectively. All electrodes were polished thoroughly
with emery paper and then cleaned with ethanol before use. For the in-situ Raman
spectroelectrochemistry study, the prepared Au SERS substrate was used as the working electrode. The
excitation light of an Ar+ laser with a wavelength of 488.2 nm was focused on the interface between
the electrolyte and electrode through a 50×0.50 objective (Olympus). The power of the laser beam was
controlled at approximately 17 mW. The spectrum acquisition time was set as 15 s with 2
accumulations.
3. RESULTS AND DISCUSSION
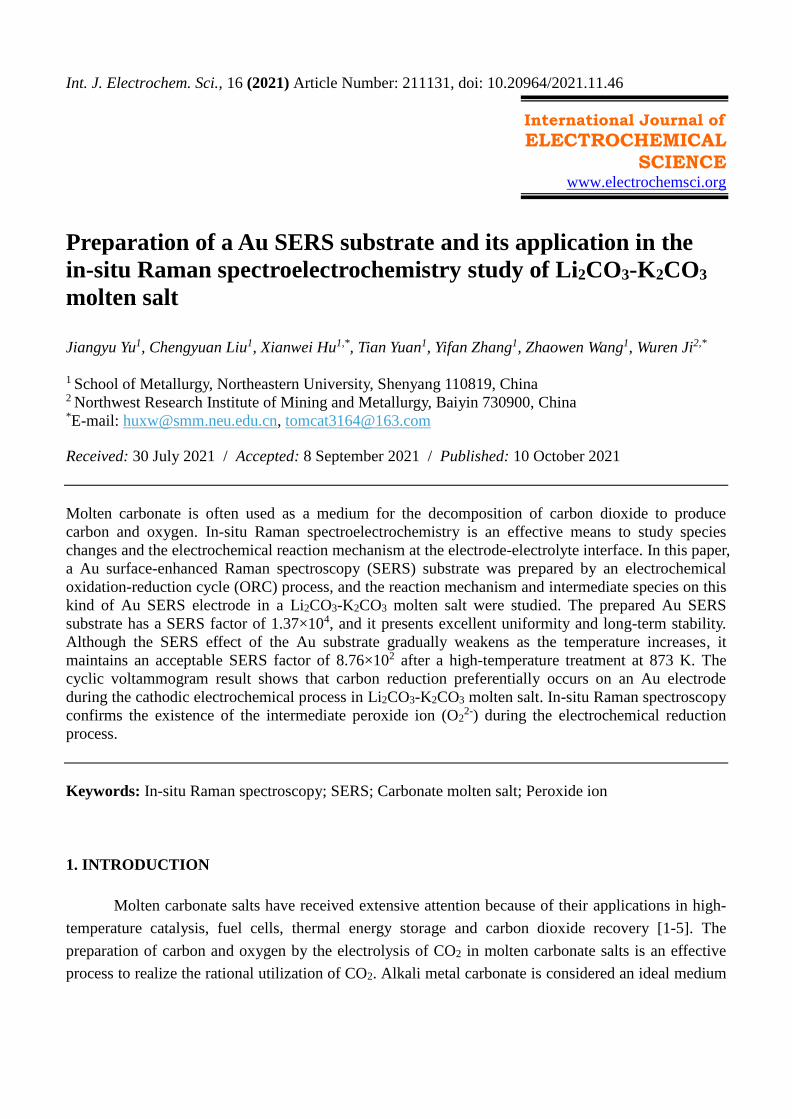
The morphologies of the prepared Au SERS substrate are shown in Figure 2. A large number of
hill-like and ravine-like structures exist on the Au SERS substrate. These rough and uneven surfaces
contribute to the SERS enhancement effect.
Int. J. Electrochem. Sci., 16 (2021) Article Number: 211131
4
Figure 2. Morphologies of the prepared SERS Au substrate: (a) scale bar: 10 μm; (b) scale bar: 2 μm
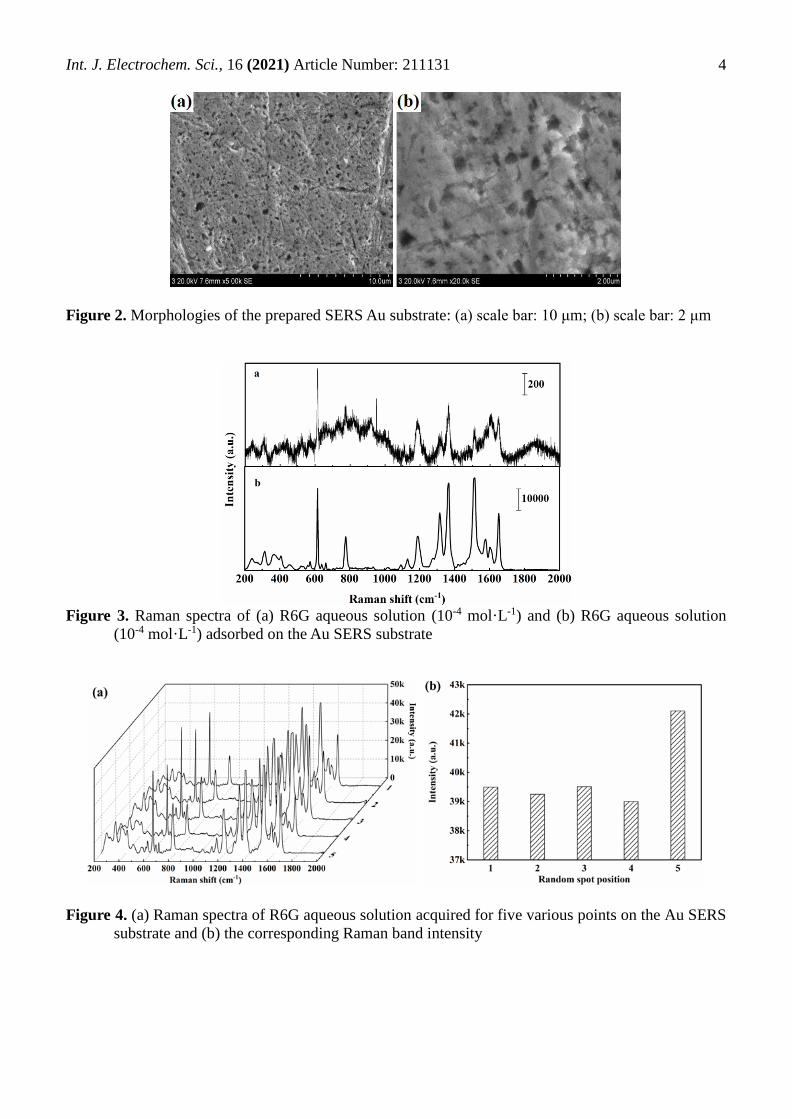
Figure 3. Raman spectra of (a) R6G aqueous solution (10-4 mol·L-1) and (b) R6G aqueous solution
(10-4 mol·L-1) adsorbed on the Au SERS substrate
Figure 4. (a) Raman spectra of R6G aqueous solution acquired for five various points on the Au SERS
substrate and (b) the corresponding Raman band intensity

Int. J. Electrochem. Sci., 16 (2021) Article Number: 211131
5
Figure 3 shows the Raman spectra of R6G on the Au substrate. It is clearly observed that the
prepared Au substrate exhibits an excellent SERS effect. The measured SERS intensities were
compared with the intensity of normal Raman scattering to estimate the magnitude of the enhancement
factor (EF) using Equations (1)-(3) [35]:
surf bulk
bulk surf
I NEF
I N (
1)
bulk bulk AN Ahc N (
2)
surf
surf 2
Ac νN AN
πr
(
3)
where Isurf is the measured SERS intensity for R6G molecules absorbed on the SERS substrate,
cps; Ibulk is the measured intensity of normal Raman scattering from R6G bulk solution, cps; Nbulk and
Nsurf are the numbers of R6G molecules in the bulk solution effectively illuminated by the laser beam
and absorbed on the SERS substrate, respectively; A is the laser focal area, cm2; cbulk is the
concentration of R6G bulk solution, 10-4 mol·L-1; NA is the Avogadro constant, 6.02×10⁻²³ mol-1; h is
the confocal depth, 1.3×10⁻⁵ cm; csurf and v are the concentration (10-4 mol·L-1) and volume (10-5 L) of
R6G solution used for SERS detection; and r is the radius of 10-5 L R6G solution formed on the SERS
substrate, 0.35 cm. Among them, ISERS and Inorm were measured at 1366 cm-1. The values of Ibulk and
Ibulk were measured to be 510 and 6.98×10⁵ cps, respectively. The value of the enhancement factor
calculated for the prepared Au SERS substrate is 1.37×10⁴.
The uniformity of the Au SERS substrate was further investigated by measuring the Raman
enhancement effect of five various points on the Au SERS substrate. The center of the substrate and
four right angles were used as the detection points, and the distances from the selected points at the
four right angles to the center were equal. All the Raman spectra are shown in Figure 4(a). The
intensities of the band at 616.92 cm-1 of the five Raman spectra are in the range of 39000 and 42000
(Figure 4(b)), which shows good reproducibility. The relative standard deviation (RSD) was used to
evaluate the uniformity of the Au SERS substrate. The value of RSD is calculated to be 3.2% by
Equation (4), indicating good uniformity.
2
1
1×100%
n
ii(I I )
nRSD
I
(
4)
where Ii (i =1, 2, 3, 4, 5) andI are the intensity and the average of the five Raman spectra for
the band at 616.92 cm-1, respectively; n is the number of collected spectra, n = 5.
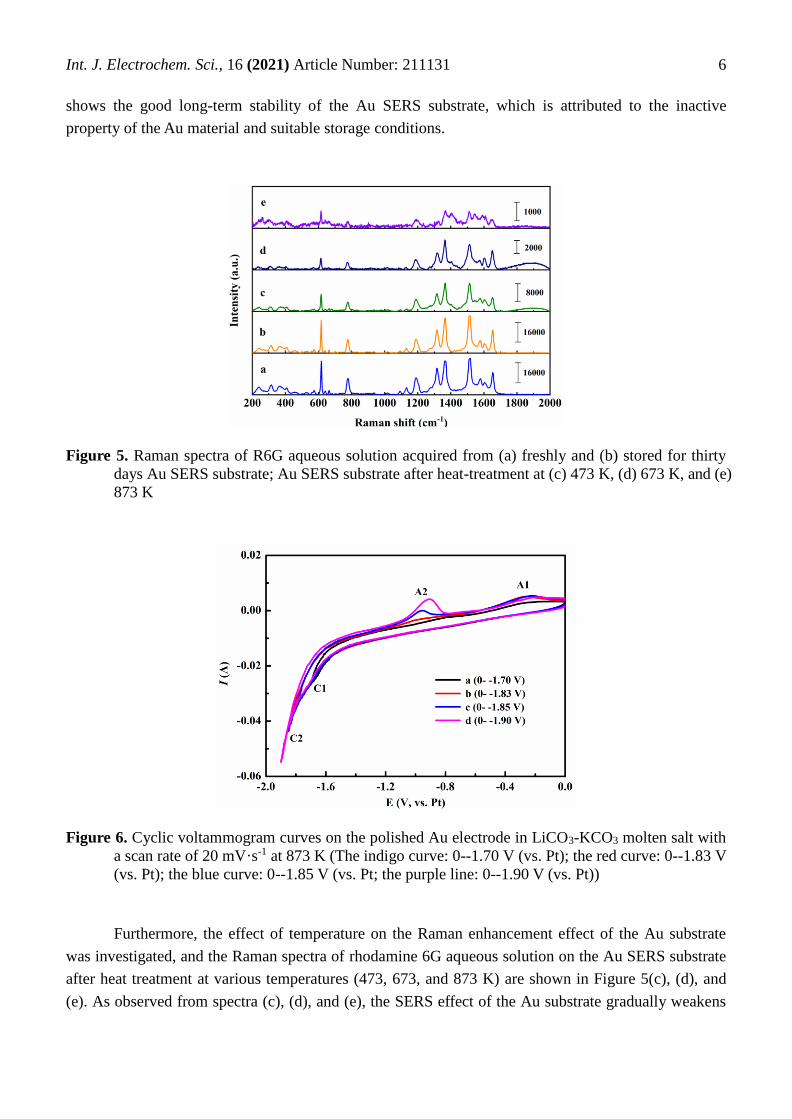
A new Au SERS substrate was prepared to determine the stability of the SERS effect. The
Raman spectrum of rhodamine 6G aqueous solution on the freshly prepared Au SERS substrate was
first measured (spectrum (a) in Figure 5). Then the Raman spectrum of rhodamine 6G aqueous solution
on the substrate stored in a dark and dry container for 30 days was obtained (spectrum (b) in Figure 5).
The enhancement factors of the above Au SERS substrates with two various states were calculated
based on the intensity of the band at 618.04 cm-1. The enhancement factor of the Au SERS substrate
stored for 30 days is only reduced by 18.2% compared with that of the fresh Au SERS substrate. It
Int. J. Electrochem. Sci., 16 (2021) Article Number: 211131
6
shows the good long-term stability of the Au SERS substrate, which is attributed to the inactive
property of the Au material and suitable storage conditions.
Figure 5. Raman spectra of R6G aqueous solution acquired from (a) freshly and (b) stored for thirty
days Au SERS substrate; Au SERS substrate after heat-treatment at (c) 473 K, (d) 673 K, and (e)
873 K
Figure 6. Cyclic voltammogram curves on the polished Au electrode in LiCO3-KCO3 molten salt with
a scan rate of 20 mV·s-1 at 873 K (The indigo curve: 0--1.70 V (vs. Pt); the red curve: 0--1.83 V
(vs. Pt); the blue curve: 0--1.85 V (vs. Pt; the purple line: 0--1.90 V (vs. Pt))
Furthermore, the effect of temperature on the Raman enhancement effect of the Au substrate
was investigated, and the Raman spectra of rhodamine 6G aqueous solution on the Au SERS substrate
after heat treatment at various temperatures (473, 673, and 873 K) are shown in Figure 5(c), (d), and
(e). As observed from spectra (c), (d), and (e), the SERS effect of the Au substrate gradually weakens

Int. J. Electrochem. Sci., 16 (2021) Article Number: 211131
7
as the heating temperature increases. After high-temperature treatment at 873 K, the enhancement
factor of the Au SERS substrate maintained at 8.76×10², indicating that the Au substrate after heat
treatment still presents an acceptable SERS effect. It is thus thought that the Au SERS substrate
prepared by the ORC process has potential applications in research on in situ Raman spectroscopy in
high-temperature molten salts.
Figure 7. Raman spectrum of the deposit obtained from Li2CO3-K2CO3 melt at -1.8 V (vs. Pt) and 873
K
Figure 6 presents the cyclic voltammogram curves obtained on a polished Au electrode in
Li2CO3-K2CO3 molten salt at 873 K with a scan rate of 20 mV·s-1. Curve a shows only one reduction
wave C1 and a small oxidation peak A1, and the peak current increases as the cathodic reversing
potential moves to a negative value of -1.83 V (curve b). A new reduction wave C2 and corresponding
oxidation peak A2 occurred in the cyclic voltammogram curves (c and d) when the reversing potential
was set as more negative values of -1.85 V and -1.90 V. Waves C1 and C2 are attributed to the
reduction of carbon and lithium metal, respectively, and were also observed in previous reports of
alkali metal carbonate [36]. The reduction process can be described as follows:
2 2
3CO 4e C+3O (
5)
Li e Li (
6)
To further confirm the reduction reaction in wave C1, electrodeposition on a Au substrate was
carried out in Li2CO3-K2CO3 molten salt at -1.80 V for 15 min. The Raman spectrum of the deposit is
shown in Figure 7. Two typical bands appearing at 1397 and 1584 cm-1 were assigned to the D-band
and G-band of carbon, respectively. Therefore, it can be inferred that cathodic wave C1 is ascribed to
the bulk electrodeposition of carbon, while the anodic peak A1 is attributed to the oxidation of carbon.
Some researchers considered that the electrochemical reaction of carbonate ions involves an
intermediate peroxide ion (O22-) [20-21]. Therefore, reaction (5) can be further expressed as follows:

Int. J. Electrochem. Sci., 16 (2021) Article Number: 211131
8
2 2
3 22CO 2e 2C+3O (
7)
2 2
2O 2e O (
8)
However, there was no obvious signal for peroxide ions during the electrochemical test (Figure
6), which is thought to be due to the instability of peroxide ions on the electrode surface. Peroxide ions
can combine with carbon to form C-O22- and stably exist on the surface of carbon deposited on the
electrode [17-18].
Figure 8. In-situ Raman spectra recorded on various electrodes in Li2CO3-K2CO3 molten salt during
constant potential electrolysis process at 873 K
To explore the presence of peroxide ions (O22-) in the reduction process of carbonate ions
(CO32-), in-situ Raman spectroelectrochemistry experiments were performed on a gold electrode in
Li2CO3-K2CO3 molten salt. The Raman spectrum recorded on a polished Au electrode during constant
potential electrolysis in Li2CO3-K2CO3 molten salt at -1.8 V (vs. Pt) is shown in Figure 8. For
comparison, the Raman spectrum of the molten salt is also measured. The Raman band appearing at
1064 cm-1 is assigned to the vibration of carbonate. Note that a very weak band is observed at 802 cm-1
in the spectrum of the molten salt, which is attributed to the vibration of peroxide ions (O22-) [28-29].
Furthermore, the prepared Au SERS substrate is used as the working electrode to improve the Raman
signal in constant potential electrolysis in Li2CO3-K2CO3 molten salt. As shown in Fig. 8, an obvious
Raman band located at 802 cm-1 is observed when the electrolysis potential is -1.7 V, and the band
intensity increases as the potential moves to a more negative value of -1.8 V. This represents an
increase in the concentration of peroxide ions in the form of C-O22- because more carbon is deposited
on the Au SERS electrode. The enhanced band is convincing evidence confirming the existence of the
intermediate peroxide ions (O22-) in the electrochemical reaction of carbonate ion in the form of
reactions (7) and (8). This result indicates that the Au SERS substrate prepared by the ORC process
can be used to study Raman spectra in high-temperature molten salts.

Int. J. Electrochem. Sci., 16 (2021) Article Number: 211131
9
4. CONCLUSIONS
In this paper, a Au SERS substrate was prepared by a simple oxidation-reduction method and
applied to in-situ Raman spectroelectrochemistry to explore the electrochemical reduction reaction
mechanism of Li2CO3-K2CO3 carbonate molten salt. The main conclusions are as follows:
(1) The Au SERS substrate prepared by the ORC process has a SERS factor of 1.37×10⁴, and it
presents excellent uniformity and long-term stability.
(2) The Au SERS substrate can withstand attack at high temperatures. After high-temperature
treatment at 873 K, it maintains an acceptable SERS factor of 8.76×10².
(3) The prepared Au SERS substrate has a certain enhancement effect on the Raman scattering
of the complexes in Li2CO3-K2CO3 molten salt and the intermediate species in the electrochemical
reaction. The existence of the intermediate peroxide ions (O22-) during the electrochemical reduction
process of carbonate is confirmed.
ACKNOWLEDGMENTS
This work was financially supported by the National Natural Science Foundation of China (Grant No.
51974081), and the Natural Science Foundation of Liaoning Province, China (2019-MS-129).
References
1. X. Q. Ao, H. Wang and Y. G. Wei, Chem. Ind. Eng. Pro., 26 (2007) 1384.
2. H. J. Wang, S. S. Xu, J. Cheng, R. Y. Zhang, P. J. Wang and Y. Q. Ren, Ther. Power Genera., 46
(2017) 8.
3. W. Weng, L. Tang, and W. Xiao. J. Energy Chem., 28 (2019) 128.
4. Y. Grosu, A. Anagnostopoulos, B. Balakin, J. Krupanek, M. E. Navarro, L.Gonzalez-Fernandez, Y.
Ding, and A. Faik. Sol. Energ. Mat. Sol. C., 220 (2021) 110838.
5. B. H. Wang, M. H. Hong, H. J. Wu, M. J. Luo, D. D. Yuan and W. Dong, Chem. Ind. Eng. Pro., 32
(2013) 2120.
6. J. M. Young, A. Mondal, T. A. Barckholtz, G. Kiss, L. Koziol, and A. Z. Panagiotopoulos. Aiche J.,
67 (2021) e16988.
7. H. Kawamura and Y. Ito, J. Appl. Electrochem., 30 (2000) 571.
8. Q. S. Song and Q. Xu, J. Alloy. Compd., 647 (2015) 245.
9. M. A. Hughes, R. D. Bennett, J. A. Allen, and S. W. Donne. RSC Adv., 9 (2019) 36771.
10. X. Wang, X. Liu, G. Licht, B. Wang, and S. Licht. J. CO2 Util., 34 (2019) 303.
11. A. J. Appleby and S. B. Nicholson, J. Electroanal. Chem. Inter. Electrochem., 83 (1977) 309.
12. A. J. Appleby and S. B. Nicholson, J. Electrochem. Soc., 127 (1980) 759.
13. A. J. Appleby and S. B. Nicholson, J. Electroanal. Chem. Inter. Electrochem., 112 (1980) 71.
14. W. M. Vogel and S. W. Smith, J. Electrochem. Soc., 129 (1982) 1668.
15. M. Cassir, G. Moutiers and J. Devynck, J. Electrochem. Soc., 140, (1993) 3114.
16. M. Cassir, B. Malinowska and W. Peelen, J. Electroanal. Chem., 43(1997) 195.
17. K. L. Van and H. Groult, Electrochim. Acta, 21 (2009) 4566.
18. A. Borucka, J. Electrochem. Soc., 124 (1977) 972.
19. B. Ren, X. Q. Li, Y. Xie, W. Y. Hu and Z. Q. Tian, Spectrosc. Spect. Anal., 20 (2000) 648.
20. B. Ren and Z. Q. Tian, Petrochem. Tech., 31 (2002) 488.
21. B. Ren and Z. Q. Tian, Petrochem. Tech., 31 (2002) 580.
Int. J. Electrochem. Sci., 16 (2021) Article Number: 211131
10
22. R. M. Katona, R. G. Kelly, C. R. Bryan, R. F. Schaller, and A. W. Knight. Electrochem. Commun.,
118 (2020) 106768.
23. A. A. Nekrasov, O. D. Iakobson, and O. L. Gribkova. Electrochim. Acta, 290 (2021) 138869.
24. H. Chen, G. C. Jiang, J. L. You and Y. Q. Wu, Spectrosc. Spect. Anal., 27 (2007) 2464.
25. J. Wang, J. L. You, Y. Y. Wang, G. C. Zhang, S. M. Wan, P. Z. Fu, S. T. Yin, Q. Liu, C. Y. Wang
and X. W. Liu, J. Syn. Cry., 42 (2013) 397.
26. X. Hu, W. Deng, Z. Shi, Z. Wang, B. Gao, and Z. Wang. J. Chem. Eng. Data, 64 (2019) 202.
27. M. Lin, X. Hu, Z. Shi, B. Gao, J. Yu, and Z. Wang. J. Energy Chem., 44 (2020) 19.
28. T. Itoh, K. Abe, K. Dokko, M. Mohamedi, I. Uchida and A. Kasuya, J. Electrochem. Soc., 151
(2004) A2042.
29. T. Itoh, T. Maeda and A. Kasuya, J. Roy. Soc. Chem., 132 (2006) 95.
30. Z. Q. Tian, B. Ren and Z. Q. Wang, J. Light Scat., 10 (1998) 186.
31. B. Ren, J. F. Li, Y. F. Huang, Z. C. Zeng and Z. Q. Tian, Electrochem., 16 (2010) 305.
32. D. Y. Wu, J. F. Li, B. Ren and Z. Q. Tian, Chem. Soc. Rev., 37 (2008) 1025.
33. Z. Q. Tian, B. Ren, J. F. Li and L. Y. Zhi, Chem. Commun., 34 (2007) 3514
34. Z. Q. Tian, B. Ren, and D. Y. Wu. J. Phys. Chem. B, 106 (2002) 9463.
35. H. Z. Yu, J. Zhang, H. L. Zhang and Z. F. Liu, Langmuir, 15 (1999) 16.
36. L. X. Li, Z. N. Shi, B. L. Gao, J. L. Xu, X. W. Hu and Z. W. Wang, J. Electrochem. Soc., 163
(2016) E1.
© 2021 The Authors. Published by ESG (www.electrochemsci.org). This article is an open access
article distributed under the terms and conditions of the Creative Commons Attribution license
(http://creativecommons.org/licenses/by/4.0/).