insulin resistance and metabolic syndrome in normal-weight individuals
TRANSCRIPT

ORIGINAL ARTICLE
Insulin resistance and metabolic syndrome in normal-weightindividuals
Shanying Chen • Youming Chen • Xinyu Liu •
Mi Li • Bide Wu • Yongqiang Li • Yan Liang •
Xiaofei Shao • Harry Holthofer • Hequn Zou
Received: 31 July 2013 / Accepted: 4 October 2013
� Springer Science+Business Media New York 2013
Abstract We performed this study to investigate the
prevalences of insulin resistance and metabolic syndrome
(MetS) in a Chinese population with normal weight. We
also examined whether fat mass is associated with insulin
resistance and MetS in normal-weight individuals. Data
were drawn from a cross-sectional study in China. Subjects
with diabetes were excluded. The prevalences of insulin
resistance and MetS were calculated. Multivariate logistic
regression analysis was performed repeated separately for
body mass index (BMI) and waist circumference (WC) in
both men and women. We also used the combination of
BMI and WC to predict insulin resistance and MetS.
8.55 % of normal-weight men and 12.62 % of normal-
weight women had insulin resistance. 7.41 % of normal-
weight men and 10.24 % of normal-weight women had
MetS. WC was associated with incident insulin resistance
and MetS independent of BMI in both men and women.
BMI was independently associated with incident MetS in
women. Normal-weight individuals with insulin resistance
and/or MetS are not rare in the Chinese population. Fat
mass is associated with insulin resistance and MetS in
normal-weight subjects. The current findings support using
both BMI and WC in clinical practice.
Keywords Insulin resistance �Metabolic syndrome �Normal weight
Abbreviations
MetS Metabolic syndrome
BMI Body mass index
WC Waist circumference
ATP III Third Report of the National Cholesterol
Education Program’s Adult Treatment Panel
CI Confidence interval
HDL-C High-density lipoprotein-cholesterol
HOMA Homeostasis model assessment
OR Odds ratio
CRP C-reactive protein
eGFR Estimated glomerular filtration rate
Scr Serum creatinine
Introduction
Insulin resistance is a hallmark of metabolic syndrome
(MetS) and largely initiated by obesity [1]. The existence
of a subgroup of individuals with normal weight but with
Shanying Chen and Youming Chen have contributed equally to this
study.
S. Chen � X. Liu � Y. Li � Y. Liang � X. Shao � H. Zou (&)
Department of Nephrology, The Third Affiliated Hospital of
Southern Medical University, 183# Zhongshan Dadao, Tianhe
District, Guangzhou 510000, People’s Republic of China
e-mail: [email protected]
S. Chen � B. Wu
Department of Nephrology, Zhangzhou Affiliated Hospital of
Fujian Medical University, Zhangzhou, People’s Republic of
China
Y. Chen
Clinical Laboratory, The Third Affiliated Hospital of Southern
Medical University, Guangzhou, People’s Republic of China
M. Li
Blood Purification Center, The Fifth Affiliated Hospital of Sun
Yat-sen University, Zhuhai, People’s Republic of China
H. Holthofer
National Centre for Sensor Research/BioAnalytical Sciences,
Dublin City University, Dublin, Ireland
123
Endocrine
DOI 10.1007/s12020-013-0079-8

metabolic disturbances usually associated with obesity was
first suggested in 1981 by Ruderman et al. [2, 3]. Despite
having normal body mass index (BMI), these individuals
presented with insulin resistance and/or hyperinsulinemia.
They also had hypertriglyceridemia, hypertension, and
were at high risk for cardiovascular disease and type two
diabetes [2–8]. There exists only scarce data on insulin
resistance in normal-weight individuals. However, indi-
viduals with normal weight and metabolic syndrome
(MetS) or insulin resistance are not uncommon [3, 4, 7]. To
our knowledge, there are no data on the prevalence of
insulin resistance or MetS in Chinese subjects with normal
weight.
There is limited evidence that higher fat mass is asso-
ciated with insulin resistance in normal-weight individuals
[3–8]. However, most previous studies were conducted on
small sizes [3, 5, 6, 8]. Large cohort studies were limited to
the United State population [3, 7, 9].
We performed this study to investigate the prevalences
of insulin resistance and MetS in a Chinese population with
normal weight. We also examined whether fat mass is
associated with insulin resistance and MetS in normal-
weight individuals. Both BMI and waist circumference
(WC) were used as anthropometric indexes of fat mass.
Methods
Subjects
We used the data from a population-based, cross-sectional
survey conducted in Wanzhai Town, Zhuhai City. Zhuhai
is located on the southern coastline of China. There are six
communities in Wanzhai Town and three of them were
randomly selected for this survey. All adult residents
(18 years or older) living in the three communities were
invited to participate in this survey. Participants were
recruited by mail and home visit. 2,142 residents volun-
tarily participated in this survey. This study was approved
by the ethics committee of the Third Affiliated Hospital of
Southern Medical University. All subjects gave their
informed consent. We excluded subjects with diabetes. We
described the cross-sectional study in our previous paper
[10].
Data collection
All doctors, medical students, and nurses participating in
this study had received intensive training. Data were col-
lected in local community clinic, health stations, or during
home interview. Data on age, sex, education, current or
past cigarette smoking, alcohol use, physical activity, die-
tary habits, and personal history and family history were
obtained using questionnaires. Blood pressure was deter-
mined with the calibrated mercury sphygmomanometer in
a sitting position after at least 5 min rest. Blood pressure
was determined three times and an average of the three
reading was calculated [10].
Anthropometric measurements
Anthropometric indexes were collected in the community
clinics and measured according to the recommendation by
the World Health Organization. WC was measured at the
level of midway between the lower rib margin and the iliac
crest in the midaxillary line, with the participants standing
with light garments and breathing out gently. Hip cir-
cumference was measured at the widest point around the
buttocks [11]. BMI was calculated as weight (in kg) divi-
ded by the square of the height (in m).
Laboratory variables
All blood specimens were collected after an overnight fast
of at least 10 h in local community clinic. First morning
urine samples were collected. Women who were actively
menstruating were excluded from the urine test. All spec-
imens from collection sites were transported to the central
laboratory in the Third Affiliated Hospital of Southern
Medical University in 3 h and stored at 2–8 �C until
analysis.
Serum creatinine, fasting glucose, serum total cholesterol,
serum triglyceride, and serum high-density lipoprotein-cho-
lesterol (HDL-C) were measured by the colorimetric method.
High sensitivity C-reactive protein (CRP) was measured using
enzymatic immunoassay turbidimetric method. Serum insulin
was measured by electrochemiluminescence immunoassay.
Homeostatic model assessment of insulin resistance (HOMA-
IR) was calculated as fasting plasma glucose (mmol/l) 9
fasting insulin (mU/l)/22.5 [12]. Estimated glomerular filtra-
tion rate (eGFR) was calculated as 186 9 (Scr)-1.154 9
(Age)-0.203 9 (if female, 90.742) [13]. Urinary albumin-to-
creatinine ratio (mg/g) was calculated as the ratio of urinary
albumin to urinary creatinine.
Definitions
Normal weight was defined as BMI \ 24 kg/m2 [14].
Insulin resistance was defined as exceeding the 75 % per-
centile of HOMA-IR in normal glucose tolerance subjects.
According to an epidemiological survey in China, the cut-
off point is 2.69 [15]. Abdominal obesity was defined as a
waist circumference C85 cm in men or C80 cm in women
[14]. Diabetes mellitus was defined as a fasting serum
Endocrine
123
glucose C7.0 mmol/l and/or self-reported diagnosis of
diabetes. A family history of diabetes or hypertension was
defined as at least one diabetic parent or hypertensive
parent. MetS was defined as having at least three of the
following five criteria: abdominal obesity, elevated tri-
glyceride levels (C150 mg/dl), low HDL-C levels
(\40 mg/dl in men, or \50 mg/dl in women), an elevated
blood pressure (C130/85 mmHg), and an elevated fasting
glucose level (C110 mg/dl or 6.1 mmol/l) [16].
Data analyses
Data were analyzed using Stata (version 11). Continuous
variables were shown as mean ± SD if they had normal
distribution. Median and interquartile range were used to
show skewed distributed continuous variables. The cate-
gorical variables were presented as absolute and relative
(%) values. A two-tailed p value \ 0.05 was considered
significant.
Baseline characteristics of men and women were
examined using Student’s t test or Wilcoxon rank-sum test
for continuous variables and the Chi squared test or Fish-
er’s exact test for categorical variables. The prevalences of
insulin resistance, MetS, and abdominal obesity were cal-
culated for men and women separately.
Then based on WC, both men and women were divided
into normal WC and larger WC subgroups (defined as a
WC C 85 cm in men or C80 cm in women). Baseline
characteristics of two subgroups were examined in both
men and women. The prevalences of insulin resistance and
MetS were also calculated. Differences in the prevalences
of metabolic disturbances between the normal WC and the
larger WC subgroups were tested using Chi squared test or
Fisher’s exact test tests as appropriate, and the analyses
were repeated separately for men and women.
Use of body mass index and waist circumference,
respectively, to predict insulin resistance and metabolic
syndrome
In order to examine whether fat mass is associated insulin
resistance and MetS in normal-weight individuals, the
associations of anthropometric indexes with insulin resis-
tance and MetS were examined using logistic regression in
men and women separately. Both BMI and waist circum-
ference (WC) were used as anthropometric indexes of fat
mass.
The first model was unadjusted. Next this model was
adjusted for variables that are likely potential confounders
and unlikely to be in the causal pathway between fat mass
and insulin resistance/MetS. These variables included age,
family history of hypertension, family history of diabetes,
physical inactivity, smoking, alcohol use, education
attainment, and dietary habits.
In sensitivity analysis, CRP was added to the above
model. CRP is potentially in the causal pathway between
fat mass and insulin resistance. Because the distribution of
CRP was highly skewed, the natural logarithm of CRP was
used for analyses.
The above analyses were repeated separately for BMI
and WC in men and women.
Prediction of insulin resistance and MetS
by the combination of BMI and WC
Although BMI and WC were correlated, the colinearity
diagnostics indicated that BMI and WC could be used in
the same regression model. To determine whether BMI and
WC independently contribute to the prediction of insulin
resistance and MetS in normal-weight subjects, both BMI
and WC were included in the adjusted models.
The logistic regression models were adjusted for age, family
history of hypertension, family history of diabetes, physical
inactivity, smoking, alcohol use, education attainment, and
dietary habits. Finally, CRP was added to the models.
The above analyses were repeated separately for men
and women in the entire cohort.
Results
There were 2,142 study subjects (the mean age was
49.55 ± 13.44 years and 796 were men) and 308 subjects
were excluded because of missing data for serum insulin,
serum fasting glucose, serum creatinine, CRP, urinary albu-
min, urinary creatinine, BMI, or waist circumference. We also
excluded 151 subjects with diabetes. We excluded 619 obesity
subjects (BMI C 24 kg/m2). Among 1,064 normal-weight
subjects, the mean age was 50.82 ± 15.56 years and 32.99 %
(351) were men. The employment rate was higher in men and
employers offered free physical examinations. It led to a lower
participation rate for men [10].
Baseline characteristics of male and female subjects
(Table 1)
Male subjects were older and had higher WC. Of the
lifestyle factors, men had a higher percentage of smoking
and alcohol use, and a lower percentage of physical inac-
tivity (p \ 0.001). Men had higher blood pressure, higher
serum creatinine, higher serum uric acid, and higher serum
triglyceride. Women had a higher prevalence of insulin
resistance (p \ 0.001). Women also had higher preva-
lences of abdominal obesity and MetS, but the differences
were not significant.
Endocrine
123

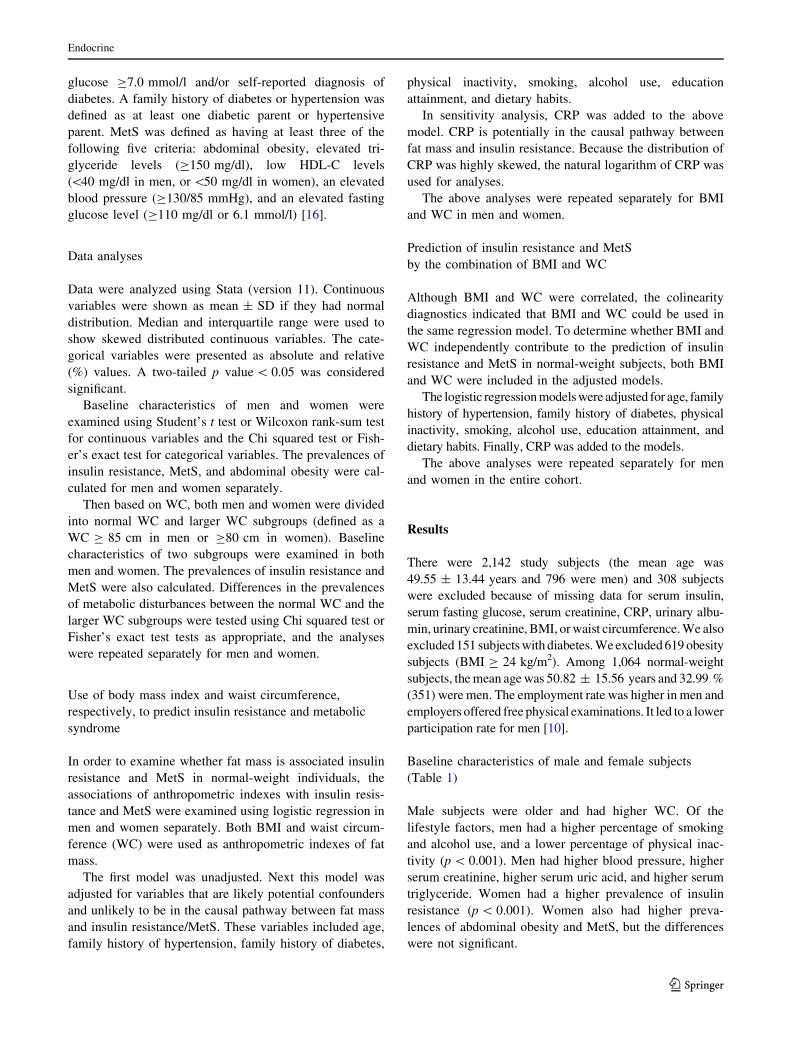
The prevalences of abdominal obesity, insulin resistance
and MetS were 32.82, 12.62, and 10.24 % in women with
normal weight, respectively. In men with normal weight,
the respective prevalences of abdominal obesity, insulin
resistance and MetS were 31.34, 8.55, and 7.41 %. Prev-
alence of metabolic disturbances was shown in Fig. 1. Of
other components of MetS, men had higher prevalences of
elevated blood pressure and elevated triglyceride levels
(p \ 0.01). And women had a higher prevalence of low
HDL-C levels (p \ 0.001).
Baseline characteristics of male and female subjects
according to waist circumference (Table 2)
Based on WC, both men and women were divided into
normal WC and larger WC subgroups. In general, in both
men and women, subjects with larger WC had higher BMI,
higher systolic and diastolic blood pressure, higher serum
Table 1 Baseline characteristics of male and female subjects
Men (n = 351) Women
(n = 713)
p value
Demographics
Age (years) 52.83 ± 16.29 49.82 ± 15.10 0.046
Clinical characteristics
Body mass index
(kg/m2)
21.39 ± 1.96 20.92 ± 21.98 \0.001
Waist circumference
(cm)
80.26 ± 7.36 76.09 ± 7.47 \0.001
History of
hypertension (%)
70 (19.94) 58 (8.13) 0.003
History of coronary
heart disease (%)
5 (1.42) 12 (1.68) 0.75
History of stroke (%) 0 2 (0.28) 1.00
Family history of
diabetes (%)
15 (4.27) 51 (7.15) 0.07
Family history of
hypertension (%)
69 (19.66) 180 (25.25) 0.045
Family history of
coronary heart
disease (%)
12 (3.42) 25 (3.50) 0.75
Family history of
stroke (%)
9 (2.56) 11 (1.54) 0.25
Current smoker (%) 115 (32.76) 9 (1.26) \0.001
Current alcohol
use (%)
46 (13.96) 7 (0.98) \0.001
Education
attainment high
school or above (%)
175 (49.86) 269 (37.73) \0.001
Physical inactivity
(%)
180 (51.85) 420 (58.91) 0.02
Dietary habit
preferring a
vegetarian diet (%)
36 (10.26) 92 (12.90) 0.21
Systolic blood
pressure (mmHg)
127.07 ± 19.86 122.33 ± 19.17 \0.001
Diastolic blood
pressure (mmHg)
77.37 ± 10.85 74.48 ± 10.55 \0.001
Laboratory
Serum creatinine
(lmol/l)
86.84 ± 15.128 63.93 ± 10.02 \0.001
Serum uric acid
(lmol/l)
391.35 ± 85.59 301.61 ± 73.79 \0.001
Estimated
glomerular
filtration rate
(ml/min/1.73 m2)
89.81 ± 18.65 94.21 ± 18.88 \0.001
Urinary albumin-to-
creatinine ratio
(mg/g)
6.10
(4.51–9.81)
8.75
(6.28–13.35)
\0.001
Fasting glucose
(mmo/l)
4.71 ± 0.52 4.66 ± 0.45 0.12
Serum C-reactive
protein
0.69
(0.33–1.70)
0.65
(0.33–1.49)
0.20
Table 1 continued
Men (n = 351) Women
(n = 713)
p value
Serum triglyceride
(mmol/l)
1.14
(0.83–1.64)
1.02
(0.75–1.41)
\0.001
Serum low density
lipoprotein (mmol/l)
3.12 ± 0.92 3.07 ± 0.86 0.37
Serum high-density
lipoprotein (mmol/l)
1.51 ± 0.33 1.64 ± 0.33 \0.001
HOMA-IR
(lU/ml 9
mmol/ml)
1.34
(0.91–1.87)
1.47
(1.08–2.15)
0.001
Metabolic disturbances
Abdominal obesity
(%)
110 (31.34) 234 (32.82) 0.63
Elevated blood
pressure (%)
178 (50.71) 299 (41.94) 0.007
Elevated fasting
glucose level (%)
6 (1.71) 8 (1.12) 0.41
Low high-density
lipoprotein-
cholesterol (%)
5 (1.42) 93 (13.43) \0.001
Elevated triglyceride
level (%)
83 (23.65) 105 (14.73) \0.001
Insulin resistance
(%)
30 (8.55) 90 (12.76) 0.04
Metabolic syndrome
(%)
26 (7.41) 73 (10.24) 0.14
Mean ± SD or median (25th to 75th percentiles) for continuous
variables and absolute and relative (%) values for category variables
are presented. Elevated blood pressure, elevated fasting glucose level,
low high-density lipoprotein-cholesterol, elevated triglyceride level,
and metabolic syndrome diagnostic criteria were defined according to
ATP III
HOMA-IR homeostatic model assessment of insulin resistance
Endocrine
123

uric acid, higher serum fasting glucose, higher serum CRP
and higher serum triglyceride. Subjects with larger WC had
higher prevalences of insulin resistance and MetS in both
men and women. Prevalence of insulin resistance and MetS
in both the normal WC and larger WC subgroups by gender
was shown in Table 2. No differences in a family history of
hypertension and diabetes were observed between the
normal WC and larger WC subgroups in men and women.
In men, subjects with normal WC had a higher proportion
of preferring a vegetarian diet.
Fourteen (5.81 %) male subjects with normal WC and
35 (7.31 %) female subjects with normal WC had insulin
resistance. Eight (1.67 %) female subjects with normal WC
met the metabolic syndrome diagnostic criteria according
to ATP III [15]. No male subject with normal WC had
MetS.
Use of body mass index and waist circumference,
respectively, to predict insulin resistance and metabolic
syndrome (Table 3)
In the unadjusted analyses, both BMI and WC were asso-
ciated with incident insulin resistance in women and men.
After adjusting for age, family history of hypertension,
family history of diabetes, smoking status, alcohol use,
physical inactivity, education attainment, and dietary hab-
its, both BMI and WC were associated with an increased
risk for insulin resistance (Table 3). The odd ratios for BMI
(every 1-kg/m2) were 1.27 (95 % CI 1.00–1.60, p = 0.049)
and 1.36 (95 % CI 1.18–1.55, p \ 0.001) in men and
women, respectively. The respective odd ratios for WC
(every 1-cm increment) in men and women were 1.11
(95 % CI 1.04–1.18, p = 0.001) and 1.10 (95 % CI
1.06–1.14, p \ 0.001). After adjustment for CRP, the
association of BMI and insulin resistance was borderly
significant in men (OR 1.24, 95 % CI 0.98–1.57, p = 0.07)
and still statistically significant in women (OR 1.29, 95 %
CI 1.12–1.49, p \ 0.001). WC was still significantly
associated with insulin resistance in both men and women.
After adjusting for potential confounders and CRP, both
BMI and WC were associated with an increased risk for
MetS. There was a 33 % increased risk of MetS for every
1-kg/m2 increase in BMI (95 % CI 1.01–1.75, p = 0.045)
in men and a 63 % increased risk of MetS (95 % CI
1.36–1.96, p \ 0.001) in women. There was a 28 %
increased risk of MetS for every 1-cm increase in WC
(95 % CI 1.16–1.41, p \ 0.001) in men and 16 %
increased risk of MetS (95 % CI 1.11–1.22, p \ 0.001) in
women.
Prediction of insulin resistance and MetS
by the combination of BMI and WC (Table 4)
Pearson correlation coefficient between BMI and WC were
0.64 in both men and women. When BMI and WC were
included in the logistic regression models, WC was inde-
pendently associated with an increased risk for insulin
resistance in both men and women (OR 1.10, 95 % CI
1.02–1.19, p = 0.009; OR 1.06, 95 % CI 1.02–1.11,
p = 0.005, respectively). The association of WC and
insulin resistance was independent of CRP. However, in
similar models, the associations of BMI and insulin resis-
tance were borderly significant in women and not signifi-
cant in men. When CRP was added to the models, BMI was
p = 0.63
P =0.43
P =0.007
P <0.001
P <0.001
P =0.04
P =0.14
0 .1 .2 .3 .4 .5
Met
aboli
c syn
drom
e
Insu
lin re
sista
nce
A low H
DL lev
el
An ele
vate
d tri
glyce
ride
level
An ele
vate
d blo
od p
ress
ure
level
An ele
vate
d fa
sting
gluc
ose
level
Abdom
inal o
besit
y
women men
Fig. 1 Prevalence of metabolic
disturbances in men and women
Endocrine
123

Table 2 Baseline characteristics of male and female subjects according to waist circumference
Men p value Women p value
WC \ 85 cm
(n = 241)
WC C 85 cm
(n = 110)
WC \ 80 cm
(n = 479)
WC C 80 cm
(n = 234)
Demographics
Age (years) 51.56 ± 16.70 55.59 ± 15.07 0.03 46.49 ± 14.66 56.68 ± 13.62 \0.001
Clinical characteristics
Body mass index (kg/m2) 20.85 ± 2.02 22.57 ± 1.15 \0.001 20.25 ± 1.89 22.29 ± 1.34 \0.001
Waist circumference (cm) 76.65 ± 5.67 88.19 ± 3.32 \0.001 72.04 ± 5.01 84.37 ± 4.10 \0.001
History of hypertension (%) 37 (15.35) 21 (19.09) 0.40 33 (6.89) 37 (15.81) \0.001
History of coronary heart disease (%) 3 (1.24) 2 (18.18) 0.62 10 (2.09) 2 (0.85) 0.35
History of stroke (%) 0 0 – 1 (0.21) 1 (0.43) 0.55
Family history of diabetes (%) 11 (4.56) 4 (3.64) 0.78 38 (7.93) 13 (5.56) 0.28
Family history of hypertension (%) 44 (18.26) 25 (22.73) 0.33 130 (27.14) 50 (21.37) 0.10
Family history of coronary heart disease (%) 7 (2.90) 5 (4.55) 0.53 18 (3.76) 7 (2.99) 0.67
Family history of stroke (%) 8 (3.31) 1 (0.91) 0.28 7 (1.46) 4 (1.71) 0.76
Current smoker (%) 82 (34.02) 33 (30.00) 0.46 5 (1.04) 4 (1.71) 0.49
Current alcohol use (%) 31 (12.86) 15 (13.64) 0.87 2 (0.42) 5 (2.14) 0.04
Education attainment high school or above (%) 117 (48.55) 58 (52.73) 0.49 211 (44.26) 58 (24.79) \0.001
Physical inactivity (%) 129 (53.53) 51 (46.36) 0.21 298 (62.21) 122 (52.14) 0.01
Dietary habit preferring a vegetarian diet (%) 31 (12.86) 5 (4.55) 0.02 57 (11.90) 35 (14.96) 0.25
Systolic blood pressure (mmHg) 125.44 ± 20.038 130.57 ± 18.32 0.03 118.26 ± 17.47 130.27 ± 19.88 \0.001
Diastolic blood pressure (mmHg) 76.35 ± 10.90 79.58 ± 10.46 0.01 73.82 ± 10.75 77.75 ± 10 \0.001
Laboratory
Serum creatinine (lmol/l) 85.95 ± 13.47 86.81 ± 18.69 0.64 63.36 ± 9.86 65.10 ± 10.26 0.03
Serum uric acid (lmol/l) 384.87 ± 86.66 405.54 ± 8.81 0.04 291.91 ± 67.34 321.46 ± 82.14 \0.001
Estimated glomerular filtration rate (ml/min/
1.73 m2)
90.27 ± 18.66 88.81 ± 18.67 0.450 97.10 ± 18.68 90.17 ± 18.48 \0.001
Urinary albumin-to-creatinine ratio (mg/g) 6.01 (4.24–9.72) 6.36
(4.95–10.78)
0.15 8.22
(6.01–12.46)
9.86
(6.98–15.20)
\0.001
Fasting glucose (mmo/l) 4.66 ± 0.51 4.80 ± 0.52 0.02 4.61 ± 0.42 4.75 ± 0.49 \0.001
Serum C-reactive protein (mg/l) 0.60 (0. 29–1.27) 0.96
(0.54–1.78)
\0.001 0.50
(0.28–1.16)
1.102
(0.58–2.05)
\0.001
Serum triglyceride (mmol/l) 1.05
(0.80–1.638)
1.34
(1.03–2.16)
\0.001 0.93
(0.71–1.219)
1.31
(0.94–1.90)
\0.001
Serum low density lipoprotein (mmol/l) 3.06 ± 0.88 3.325 ± 1.00 0.07 2.97 ± 0.84 3.26 ± 0.87 \0.001
Serum high-density lipoprotein (mmol/l) 1.54 ± 0.34 1.44 ± 0.30 0.01 1.67 ± 0.32 1.58 ± 0.33 \0.001
HOMA-IR (lU/ml 9 mmol/ml) 1.21 (0.84–1.68) 1.96
(1.23–2.39)
\0.001 1.34
(0.97–1.79)
1.85
(1.26–2.65)
\0.001
Metabolic disturbances
Elevated blood pressure (%) 110 (45.64) 68 (61.18) 0.005 136 (28.39) 163 (69.66) \0.001
Elevated fasting glucose level (%) 5 (2.07) 1 (0.91) 0.67 4 (0.84) 4 (1.71) 0.45
Low high-density lipoprotein-cholesterol (%) 3 (1.24) 2 (1.82) 0.65 48 (10.02) 45 (19.23) 0.001
Elevated triglyceride level (%) 41 (17.01) 42 (38.18) \0.001 38 (7.93) 67 (28.63) \0.001
Insulin resistance (%) 14 (5.81) 16 (14.55) 0.007 35 (7.31) 56 (23.93) \0.001
Metabolic syndrome (%) 0 26 (23.64) \0.001 8 (1.67) 65 (27.78) \0.001
Mean ± SD or median (25th to 75th percentiles) for continuous variables and absolute and relative (%) values for category variables are
presented. Elevated blood pressure, elevated fasting glucose level, low high-density lipoprotein-cholesterol, elevated triglyceride level and
metabolic syndrome diagnostic criteria were defined according to ATP III
HOMA-IR homeostatic model assessment of insulin resistance
Endocrine
123
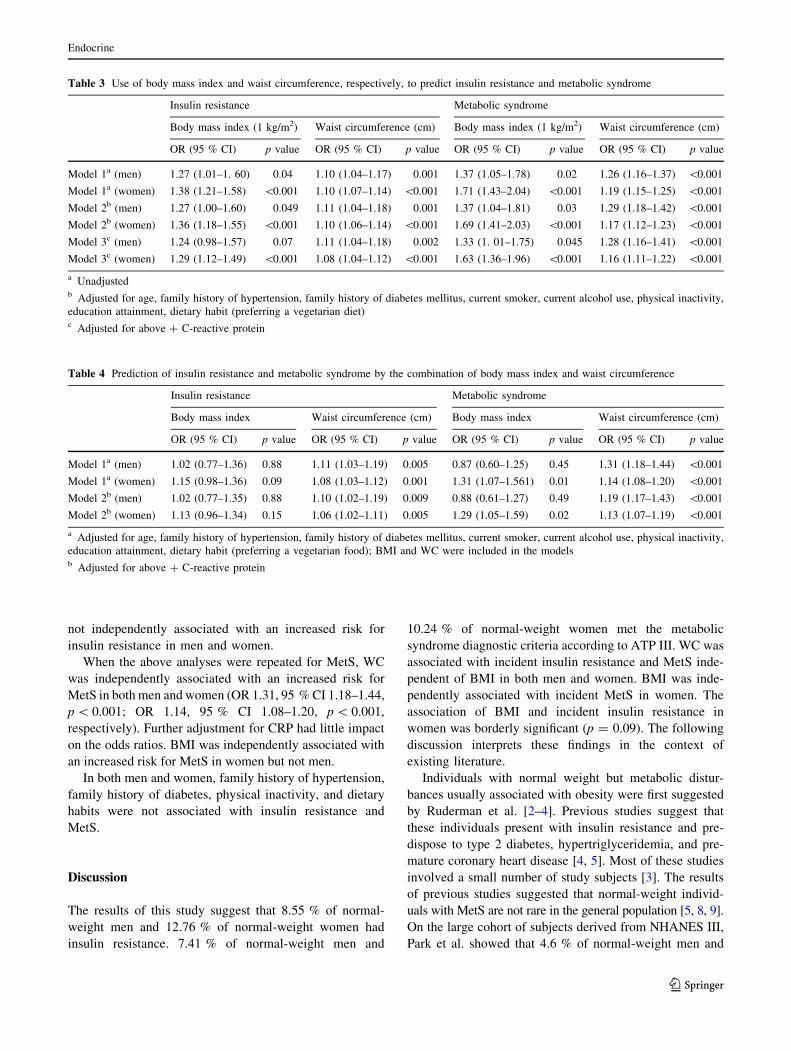
not independently associated with an increased risk for
insulin resistance in men and women.
When the above analyses were repeated for MetS, WC
was independently associated with an increased risk for
MetS in both men and women (OR 1.31, 95 % CI 1.18–1.44,
p \ 0.001; OR 1.14, 95 % CI 1.08–1.20, p \ 0.001,
respectively). Further adjustment for CRP had little impact
on the odds ratios. BMI was independently associated with
an increased risk for MetS in women but not men.
In both men and women, family history of hypertension,
family history of diabetes, physical inactivity, and dietary
habits were not associated with insulin resistance and
MetS.
Discussion
The results of this study suggest that 8.55 % of normal-
weight men and 12.76 % of normal-weight women had
insulin resistance. 7.41 % of normal-weight men and
10.24 % of normal-weight women met the metabolic
syndrome diagnostic criteria according to ATP III. WC was
associated with incident insulin resistance and MetS inde-
pendent of BMI in both men and women. BMI was inde-
pendently associated with incident MetS in women. The
association of BMI and incident insulin resistance in
women was borderly significant (p = 0.09). The following
discussion interprets these findings in the context of
existing literature.
Individuals with normal weight but metabolic distur-
bances usually associated with obesity were first suggested
by Ruderman et al. [2–4]. Previous studies suggest that
these individuals present with insulin resistance and pre-
dispose to type 2 diabetes, hypertriglyceridemia, and pre-
mature coronary heart disease [4, 5]. Most of these studies
involved a small number of study subjects [3]. The results
of previous studies suggested that normal-weight individ-
uals with MetS are not rare in the general population [5, 8, 9].
On the large cohort of subjects derived from NHANES III,
Park et al. showed that 4.6 % of normal-weight men and
Table 3 Use of body mass index and waist circumference, respectively, to predict insulin resistance and metabolic syndrome
Insulin resistance Metabolic syndrome
Body mass index (1 kg/m2) Waist circumference (cm) Body mass index (1 kg/m2) Waist circumference (cm)
OR (95 % CI) p value OR (95 % CI) p value OR (95 % CI) p value OR (95 % CI) p value
Model 1a (men) 1.27 (1.01–1. 60) 0.04 1.10 (1.04–1.17) 0.001 1.37 (1.05–1.78) 0.02 1.26 (1.16–1.37) \0.001
Model 1a (women) 1.38 (1.21–1.58) \0.001 1.10 (1.07–1.14) \0.001 1.71 (1.43–2.04) \0.001 1.19 (1.15–1.25) \0.001
Model 2b (men) 1.27 (1.00–1.60) 0.049 1.11 (1.04–1.18) 0.001 1.37 (1.04–1.81) 0.03 1.29 (1.18–1.42) \0.001
Model 2b (women) 1.36 (1.18–1.55) \0.001 1.10 (1.06–1.14) \0.001 1.69 (1.41–2.03) \0.001 1.17 (1.12–1.23) \0.001
Model 3c (men) 1.24 (0.98–1.57) 0.07 1.11 (1.04–1.18) 0.002 1.33 (1. 01–1.75) 0.045 1.28 (1.16–1.41) \0.001
Model 3c (women) 1.29 (1.12–1.49) \0.001 1.08 (1.04–1.12) \0.001 1.63 (1.36–1.96) \0.001 1.16 (1.11–1.22) \0.001
a Unadjustedb Adjusted for age, family history of hypertension, family history of diabetes mellitus, current smoker, current alcohol use, physical inactivity,
education attainment, dietary habit (preferring a vegetarian diet)c Adjusted for above ? C-reactive protein
Table 4 Prediction of insulin resistance and metabolic syndrome by the combination of body mass index and waist circumference
Insulin resistance Metabolic syndrome
Body mass index Waist circumference (cm) Body mass index Waist circumference (cm)
OR (95 % CI) p value OR (95 % CI) p value OR (95 % CI) p value OR (95 % CI) p value
Model 1a (men) 1.02 (0.77–1.36) 0.88 1.11 (1.03–1.19) 0.005 0.87 (0.60–1.25) 0.45 1.31 (1.18–1.44) \0.001
Model 1a (women) 1.15 (0.98–1.36) 0.09 1.08 (1.03–1.12) 0.001 1.31 (1.07–1.561) 0.01 1.14 (1.08–1.20) \0.001
Model 2b (men) 1.02 (0.77–1.35) 0.88 1.10 (1.02–1.19) 0.009 0.88 (0.61–1.27) 0.49 1.19 (1.17–1.43) \0.001
Model 2b (women) 1.13 (0.96–1.34) 0.15 1.06 (1.02–1.11) 0.005 1.29 (1.05–1.59) 0.02 1.13 (1.07–1.19) \0.001
a Adjusted for age, family history of hypertension, family history of diabetes mellitus, current smoker, current alcohol use, physical inactivity,
education attainment, dietary habit (preferring a vegetarian food); BMI and WC were included in the modelsb Adjusted for above ? C-reactive protein
Endocrine
123
6.2 % of normal-weight women met the MetS diagnostic
criteria according to ATP III [3]. Results from a commu-
nity-based, longitudinal study of 2,902 people showed that
7 % normal-weight subjects had MetS [8]. The results of
the current study suggest the prevalences of insulin resis-
tance in normal-weight men and women were 8.55 and
12.62 %, respectively. To our knowledge, this is the first
study based on the large cohort of Asian subjects.
Over the past 20 years, it has become apparent that a
number of interrelated factors are often associated with and
may contribute to the pathogenesis of insulin resistance in
both normal-weight and obese individuals. They include
central obesity, low birth weight, inactivity, and family
history [5].
In a previous study, even there were no differences in
birth weight and BMI between insulin resistance and
insulin sensitive subgroups, insulin resistance subgroup
had higher fat mass measured by dual energy X-ray
absorptiometry [7].Based on one study in non-obese,
normoglycemic subjects, although both insulin resistance
and insulin sensitive subgroups had normal BMI and there
was no difference of BMI between two subgroups, body
adipose stores were significantly increased in insulin
resistance subgroup. Higher total body, abdominal adipose
stores and increased intramyocellular lipids are related to
activation of the intramyocellular lipids pathway which is
associated with insulin resistance. Association of elevated
intramyocellular lipids with decreased insulin action was
observed in non-obese subjects [1, 17]. In the current
study, normal-weight subjects with larger WC had a
significant higher prevalence of insulin resistance and
MetS in both men and women. The results suggest that
relatively higher fat mass might be plausible explanation
for insulin resistance and metabolic disturbances in nor-
mal-weight subjects.
BMI assesses entire body mass without differentiating
different components of subcutaneous and visceral fat,
muscle, and bone [18]. WC is strongly correlated with
abdominal and thought to represent fat stored in visceral
depots [19, 20]. The results of this study suggest that WC
independently contributes to the prediction of insulin
resistance and MetS in normal-weight men and women.
The results suggest that abdominal fat is associated with
insulin resistance in normal-weight subjects and the adi-
posity exists in subjects with normal-weight.
However, the results of this study also suggest that BMI
independently contributes to the prediction of MetS in
normal-weight women. One previous study suggests that
BMI and WC independently contribute to the prediction of
nonabdominal, abdominal subcutaneous, and visceral fat.
Excess nonabdominal, abdominal subcutaneous, or visceral
fat predict the relative risk of disease, however, WC is not a
clinically significant predictor of abdominal subcutaneous
fat [21]. The findings of the current study support the
combined use of BMI and WC to predict in MetS in nor-
mal-weight women. The fact that BMI is associated with
MetS in normal-weight women independent of WC sug-
gests that not only visceral fat but also nonabdominal and
abdominal subcutaneous contribute to the prediction of
MetS.
Some factors other than fat mass, such as physical
inactivity, low birth weight, and family history may con-
tribute to the pathogenesis of insulin resistance. But in the
current study, none of family history of hypertension and
diabetes, dietary habits, and physical inactivity was asso-
ciated with insulin resistance and MetS.
Strengths of this study include the use of a relatively
large population to conduct the analyses and the combined
use of BMI and WC to predict insulin resistance and MetS.
The first limitation of our study is a cross-sectional study
which limits causal inference. Second, homeostatic model
assessment of insulin is a reliable indicator of insulin
resistance, but not the gold standard [12]. HOMA index is
not suitable for all persons [15]. The magnitude of the
correlation coefficients of HOMA index with insulin
resistance determined by euglycemic clamp test is smaller
in the subjects with a lower body mass index, a lower
HOMA-beta cell function and higher fasting glucose levels
[22]. Third, some potential confounders were not included
in our analyses. Birth weight and detailed diet diary were
not included in this study. But one previous study failed to
find the association of birth weight with insulin resistance
in normal-weight subjects [6]. And the results from another
previous study showed that no difference in diary was
found between metabolically obese subjects with normal
weight and control subjects [3]. Finally, only 32.99 % of
the participants were men. The sample is biased, but the
data analyses were repeated separately for men and
women.
Conclusion
In conclusion, this study suggests that normal-weight
individuals with insulin resistance and/or MetS are not rare
in the Chinese population. WC is significantly associated
with insulin resistance and MetS independent of BMI. BMI
is independently associated with incident MetS in women.
The current findings support using both BMI and WC in
clinical practice.
Acknowledgments This study was supported by the following
science foundation: 1. EU FP7 Program, UroSense, 2011; 2. ISN
Research Committee Grant, 2007; 3. ISN Research Committee Grant,
2004; 4. Guangdong Provincial Science and Technique Program (No.
2011B031800386), 2011.
Endocrine
123
Disclosure None.
Conflict of interest None.
References
1. S.P. Bagby, Obesity-initiated metabolic syndrome and the kid-
ney: a recipe for chronic kidney disease? J. Am. Soc. Nephrol.
15(11), 2775–2791 (2004)
2. N.B. Ruderman, S.H. Schneider, P. Berchtold, The ‘‘metaboli-
cally-obese,’’ normal-weight individual. Am. J. Clin. Nutr. 34(8),
1617–1621 (1981)
3. F. Conus, R. Rabasa-Lhoret, F. Peronnet, Characteristics of
metabolically obese normal-weight (MONW) subjects. Appl.
Physiol. Nutr. Metab. 32(1), 4–12 (2007)
4. N.B. Ruderman, P. Berchtold, S. Schneider, Obesity-associated
disorders in normal-weight individuals: some speculations. Int.
J. Obes. 6(Suppl 1), 151–157 (1982)
5. N. Ruderman, D. Chisholm, X. Pi-Sunyer, S. Schneider, The
metabolically obese, normal-weight individual revisited. Diabetes
47(5), 699–713 (1998)
6. R.V. Dvorak, W.F. DeNino, P.A. Ades, E.T. Poehlman, Pheno-
typic characteristics associated with insulin resistance in meta-
bolically obese but normal-weight young women. Diabetes
48(11), 2210–2214 (1999)
7. F. Conus, D.B. Allison, R. Rabasa-Lhoret, M. St-Onge, D.H. St-
Pierre, A. Tremblay-Lebeau, E.T. Poehlman, Metabolic and
behavioral characteristics of metabolically obese but normal-
weight women. J. Clin. Endocrinol. Metab. 89(10), 5013–5020
(2004)
8. J.B. Meigs, P.W. Wilson, C.S. Fox, R.S. Vasan, D.M. Nathan,
L.M. Sullivan, R.B. D’Agostino, Body mass index, metabolic
syndrome, and risk of type 2 diabetes or cardiovascular disease.
J. Clin. Endocrinol. Metab. 91(8), 2906–2912 (2006)
9. M.-P. St-Onge, I. Janssen, S.B. Heymsfield, Metabolic syndrome
in normal-weight Americans. New definition of the metabolically
obese, normal-weight individual. Diabetes Care 27, 2222–2228
(2004)
10. S.Y. Chen, Y.M. Chen, X.Y. Liu et al., Association of insulin
resistance with chronic kidney disease in non-diabetic subjects
with normal weight. PLoS ONE 8(9), e74058 (2013)
11. A. Molarius, J.C. Seidell, S. Sans, J. Tuomilehto, K. Kuulasmaa,
Waist and hip circumferences, and waist-hip ratio in 19 popula-
tions of the WHO MONICA Project. Int. J. Obes. Relat. Metab.
Disord. 23(2), 116–125 (1999)
12. A.J. Hanley, K. Williams, C. Gonzalez, R.B. D’Agostino Jr, L.E.
Wagenknecht, M.P. Stern, S.M. Haffner, San Antonio Heart
Study, Mexico City Diabetes Study, Insulin Resistance Athero-
sclerosis Study, Prediction of type 2 diabetes using simple
measures of insulin resistance: combined results from the San
Antonio Heart Study, the Mexico City Diabetes Study, and the
Insulin Resistance Atherosclerosis Study. Diabetes 52(2),
463–469 (2003)
13. A.S. Levey, J.P. Bosch, J.B. Lewis, T. Greene, N. Rogers, D.
Roth, A more accurate method to estimate glomerular filtration
rate from serum creatinine: a new prediction equation. Modifi-
cation of Diet in Renal Disease Study Group. Ann. Intern. Med.
130(6), 461–470 (1999)
14. Z. Bei-Fan, Cooperative Meta-Analysis Group of Working Group
on Obesity in China, Predictive values of body mass index and
waist circumference for risk factors of certain related diseases in
Chinese adults: study on optimal cut-off points of body mass
index and waist circumference in Chinese adults. Asia Pac.
J. Clin. Nutr. 11(Suppl 8), S685–S693 (2002)
15. X.Y. Xing, W.Y. Yang, Z.J. Yang, The diagnostic significance of
homeostasis model assessment of insulin resistance in Metabolic
Syndrome among subjects with different glucose tolerance
(Chinese). Chin J Diabetes 12(3), 182–186 (2004)
16. National Cholesterol Education Program (NCEP) Expert Panel on
Detection Ea, and Treatment of High Blood Cholesterol in Adults
(Adult Treatment Panel III), Third report of the National Cho-
lesterol Education Program (NCEP) Expert Panel on detection,
evaluation, and treatment of high blood cholesterol in adults
(adult treatment panel III) final report. Circulation 106(25),
3143–3421 (2002)
17. U.B. Masharani, B.A. Maddux, X. Li, G.K. Sakkas, K. Mulligan,
M. Schambelan, I.D. Goldfine, J.F. Youngren, Insulin resistance
in non-obese subjects is associated with activation of the JNK
pathway and impaired insulin signaling in skeletal muscle. PLoS
ONE 6(5), e19878 (2011)
18. J.O. Burton, L.J. Gray, Webb, M.J. Davies, K. Khunti, W. Crasto,
S.J. Carr, N.J. Brunskill, Association of anthropometric obesity
measures with chronic kidney disease risk in a non-diabetic
patient population. Nephrol. Dial. Transpl. 27(5), 1860–1866
(2012)
19. L.M. Browning, S.D. Hsieh, M. Ashwell, A systematic review of
waist-to-height ratio as a screening tool for the prediction of
cardiovascular disease and diabetes: 0.5 could be a suitable global
boundary value. Nutr. Res. Rev. 23(2), 247–269 (2010)
20. L.M. Browning, O. Mugridge, A.K. Dixon, S.W. Aitken, A.M.
Prentice, S.A. Jebb, Measuring abdominal adipose tissue: com-
parison of simpler methods with MRI. Obes. Facts 4(1), 9–15
(2011)
21. I. Janssen, S.B. Heymsfield, D.B. Allison, D.P. Kotler, R. Ross,
Body mass index and waist circumference independently con-
tribute to the prediction of nonabdominal, abdominal subcuta-
neous, and visceral fat. Am. J. Clin. Nutr. 75(4), 683–688 (2002)
22. E.S. Kang, Y.S. Yun, S.W. Park et al., Limitation of the validity
of the homeostasis model assessment as an index of insulin
resistance in Korea. Metabolism 54(2), 206–211 (2005)
Endocrine
123