instrumented monitoring with traditional public health evaluation
TRANSCRIPT

INSTRUMENTED MONITORING WITH TRADITIONAL PUBLIC HEALTH EVALUATION METHODS: An application to a Water, Sanitation and Hygiene Program in Jakarta, Indonesia
Evan A. Thomas, PhD, PEPortland State University
Kay Mattson, MSW, MPHMercy Corps
Indo
nesi
a —
Fitr
ia R
inaw
ati/
Mer
cy C
orps
0
61
3

Instrumented Public Health Monitoring | MERCY CORPS 1
This paper presents the findings from two complementary approaches to field evaluation of a water, sanitation and hygiene program conducted by Mercy Corps in Indonesia. The program under study installed hand washing stations and latrines at a number of sites across greater Jakarta, and conducted extensive behavior change programs to encourage use of the latrines and hand washing after utilization of latrines. A public health evaluation was conducted at the end of the program, and found a high degree of self-reported compliance with the desired behaviors. A year later (and after the program’s end), instruments were installed that directly monitored hand washing water taps and latrine use, and correlated sanitation facility use against water use at hand washing taps. These results suggest a significantly lower behavior change than earlier estimated in the studied communities. This insight allowed further review of the survey results, and incorporation of the combined data sets into thoughtful review of behavior change efforts. This paper illustrates that instrumented monitoring systems can provide organizations with a data collection method that can greatly enhance their capacity to measure behavior change in global health programs. Mercy Corps, like other development organizations, invests significant resources in water and sanitation infrastructure and behavior change programs, as well as in monitoring and evaluation staff time. Mercy Corps is also aware of the limitations of self-reported survey data, which can be biased, as beneficiaries may have a tendency to report desired results rather than actual practices. Using instrumentation with remote data access may have the potential to enhance data collection and complement survey and observation methods as well as monitor specific program components over longer periods of time than surveys allow, at a lower per-sample cost, while more directly and objectively measuring behavior and reducing self-reporting bias. Instrumentation, with its own limitations including difficulty in discriminating details of behavior, as well as cellular data costs and non-trivial data analysis methods, is not a replacement for survey tools. Rather, it may supplement traditional evaluation methods. Combining remote sensing evaluation tools with traditional evaluation methods may enable programs to have both objective quantifiable data, along with qualitative data from beneficiaries about their knowledge and practices associated with the desired behaviors that could serve to better inform and improve overall program outcomes.
Abstract
Indonesia — Shirine Bakhat-Pont/Mercy Corps; Fitria Rinawati/Mercy Corps

Instrumented Public Health Monitoring | MERCY CORPS 2
Introduction
Background This paper presents the findings from two complementary approaches to field evaluations of a water and sanitation program, RW Siaga Plus+, conducted by Mercy Corps in Indonesia. The first is the traditional evaluation approach conducted by an external evaluator using both program provided monitoring and evaluation data combined with qualitative information to answer identified evaluation questions. The second approach is remote instrument monitoring of selected facilities installed by the program to assess usage and utilization patterns. The RW Siaga Plus+ Program under evaluation for this paper was designed to work toward one of Mercy Corps Indonesia’s key Urban Poverty Reduction Strategy objectives: creating healthy physical environments in urban poor settlements by increasing access to clean water supplies and improved sanitation. The program aimed to reduce the incidence of malnutrition of poor urban community members, particularly children under the age of five, by reducing the risk of infectious disease, primarily diarrhea, through improved water and sanitation conditions and changes in hygiene and nutrition behaviors among the targeted populations. The program was formed around an existing Ministry of Health program - RW Siaga, a comprehensive community-based health program focused on developing the capacity of communities to prevent and respond to health problems, disasters and emergencies. RW Siaga Plus+ was designed to integrate access to water and sanitation infrastructure into this foundational program and strengthen the program’s behavior change capacity related to reducing malnutrition among children under age five. The program was implemented between September 2009 and September 2011 in 16 poor urban neighborhoods (RWs) in three kelurahan (sub-districts) in West Jakarta (Duri Utara, Duri Kosamb and Bekasi) and one kelurahan in Bekasi (Margahayu).
At the end of the program, an external evaluation was conducted using public health evaluation best practices (by co-author Mattson) to evaluate the program’s effectiveness toward achieving the behavior change and overall program targets. A year later, a separate evaluation was conducted using instrumented monitoring (by co-author Thomas) to directly monitor use of hand washing stations and latrines in four RTs (sub-neighborhoods) among the targeted 16 RWs. The evaluations were conducted independently, thereby allowing separate determinations of behavior change specific to hand washing and latrine use. This paper presents a side-by-side analysis, highlighting insights gained through the integration of instrumentation into public health evaluations.
The public health evaluation used both qualitative and quantitative methods to assess the impact of program interventions. Household surveys are the most common method for evaluating specific point-of-use technology usage by beneficiaries in development programs and were conducted by program staff as part of their program monitoring and evaluation process. Additional qualitative methods and further analysis comparing quantitative baseline and endline data was conducted. Both data sets were incorporated into the final evaluation report.
One challenge with this traditional evaluation approach is that surveys have been found to often overestimate adoption rates due to self-report and/or recall bias of survey respondents. This phenomenon has been demonstrated in a number of applications, including determinations of poor correlation between observations and self-reported recall of water storage, hand washing and defecation practices (Stanton, 1987), (Manun’Ebo, 1997).

Instrumented Public Health Monitoring | MERCY CORPS 3
Independently, Portland State University approached Mercy Corps to pilot a concept for remotely reporting instrumented monitoring of water and sanitation technologies in some of Mercy Corps programs and together they determined that the recently completed RWSiaga+ Program would serve as an appropriate pilot program. Portland State University, working with Stevens Water Monitoring Inc., of Portland, Oregon, then developed low-power, low-cost hardware instruments with cellular network based internet reporting to measure the performance and use of various development projects and relay this data directly to the internet for international dissemination. Mercy Corps has been an early partner in the piloting the use of this technology in both Indonesia, for this project, and on a cookstove program in Haiti.
Several other recent applications of instrumentation in global development programs are relevant, including work conducted at the University of California at Berkeley and the associated Berkeley Air Monitoring Group on indoor air pollution instrumentation including a particle monitor (Chowdhury, et al., 2007), a stove temperature sensor (Mercado, 2012), a hand-pump motion monitor with remote reporting developed at the University of Oxford (Thomson, Hope, & Foster, 2012), and a passive latrine use monitor for sanitation studies developed by the University of California at Berkeley and the London School of Hygiene and Tropical Medicine (Clasen, et al., 2012).
This paper explores the use of both traditional survey intensive evaluation methods and remote instrumentation to evaluate the outcomes of an urban water, sanitation and hygiene program. The objective of this paper is to compare and contrast the findings from the two methods in an effort to highlight the complementary nature of instrumentation to provide important program feedback that is not normally available with survey tools and in turn enhance the value and specificity of observational and survey methods.
RW Siaga Plus+ Program Description The overall aim of the RW Siaga Plus+ Program was the improved health and nutrition of residents in poor urban neighborhoods in Jakarta and Bekasi through increased household access to clean water supplies and improved sanitation. Access to water supply and sanitation services is crucial to preventing disease, namely diarrhea, which is a major cause of child mortality and malnutrition in Jakarta (Oyofo, et al., 2002).
To engage and sensitize the community to the need for hygiene behavior change and increased water and sanitation infrastructure, the program employed modified PHAST (Participatory Hygiene and Sanitation Transformation planning process) (WHO, 1998) participatory needs assessment (PNA) (WSP, no date) and Positive Deviance Inquiry (PDI) processes (Marsh, et. al. 2004). These sessions were reduced somewhat to encourage full government and community participation, as well as to increase the likelihood that the methods would be replicated by the community. PHAST was utilized to engage communities in both problem identification and generation of solutions related to water, sanitation infrastructure and hygiene behaviors. PDI was utilized to identify positive behaviors among healthy community members. Children under the age of five were a focus, particularly where the child was assessed to be well-nourished and have low, or no incidence of diarrhea. Positive behaviors identified among these households were then promoted within the communities as behaviors likely to contribute to reduced malnutrition. The resulting behavior change promotion strategies and related trainings were

Instrumented Public Health Monitoring | MERCY CORPS 4
targeted to kaders (community health volunteers) who in turn were responsible for conducting the activities among the targeted communities’ beneficiaries. The activities were designed to change behaviors and stimulate demand for sanitation infrastructure and water treatment and storage projects among community members.
RW Siaga Plus+ Program Targets
By the end of the 24 month project, Mercy Corps expected that:
1. 1,400 households (approximately 7,000 individuals) have access to and utilize improved sanitation facilities.
2. 30,000 households within target area have access to safe water.
3. 30,000 caregivers of children under five practice appropriate hygiene and nutrition behaviors.
4. All target communities take responsibility for at least one component of the integrated RW Siaga+ program in the second year of intervention, in preparation for replicating the full model after program end.
RW Siaga Plus+ Behavior Change StrategyFormative research methods described above were utilized to identify problems, solutions and key factors that contributed to children under the age of five health weight. Among the key factors identified by Mercy Corps were general hygiene and hand washing practices specific to caregivers and children under the age of five before eating and after using the latrine. The identified factors were then used to formulate key messages that would resonate with the community and incorporated into the program’s behavior change promotion strategies. To address and improve the targeted behaviors multiple methods were deployed by the program, including large scale campaigns. The campaigns focused on three key areas – open defecation free communities, healthy menu creation and hand washing with soap. The program also developed a wide range of materials including posters, t-shirts, leaflets, puzzles, stickers, calendars, cloth bags and umbrellas which contained the programs key messages. The latter two were created for Pokja and kaders to serve as tools for socializing the community about the RW Siaga Plus+ program. Stickers were used to identify homes that were determined by the local Pokja to have achieved program objectives. Kaders conducted outreach to caregivers of children under five to promote the targeted desired behaviors using the materials created for the program.
Indonesia — Fitria Rinawati/Mercy Corps

Instrumented Public Health Monitoring | MERCY CORPS 5
In addition to the behavior change communication strategies the program implemented new infrastructure in the targeted communities that would provide the enabling environment to support the practice of desired behaviors. Infrastructure components included: 1) the construction of community latrines (MKK); 2) child-friendly latrines; 3) communal septic tanks; 4) Kedotengs (septic tank sludge removal carts) and Temporary Sludge Storage (TSS) facilities; 5) hand washing stations; 6) rehabilitation of community clean water sources; and 7) promotion of point-of-use water treatment methods.
Comparative Analysis of Evaluation MethodsIn order to assess the impact of the program on changing behaviors specific to latrine use and hand washing after latrine use this paper looks at the results of the final public health evaluation, and results of installed sensors to quantify and compare behaviors related to these two targets. The public health evaluation encompassed an evaluation of the entire program, including latrine use and hand washing behaviors, in all 16 of the targeted neighborhoods (RWs), whereas the sensors look at data from latrines and hand washing stations among four sub-neighborhoods (RTs) among the overall 16 RWs targeted by the program. These four RTs were selected by Mercy Corps as representative of the overall neighborhoods targeted by the program. We report below the summary of the two methods’ findings related to latrine use and hand washing, as well as a comparison of these two methods.
Public Health Evaluation Methods The program conducted a baseline household survey in January/February 2010, a mid-term evaluation in January 2011, and an endline household survey primarily between May and September 2011.
The final evaluation was conducted in Jakarta and Bekasi during September 6-16, 2011 with data collected from all four kelurahan where the program was implemented. The purpose of the final evaluation was to expand on the quantitative findings of the endline survey and monitoring data by provide a qualitative review of the overall RW Siaga Plus+ program’s results and impacts on the community, and to document the lessons learned from program interventions. This evaluation focused on three main areas:
I. Review of the Participatory Needs Assessment (PNA) and behavior change methods employed by the program to assess the level of community engagement in, as well the program’s overall impact on, changing and sustaining targeted behaviors.
II. Performance towards the completion of water and sanitation infrastructure project targets to determine sustainability of completed projects and potential for replication by the community.
III. Review of how well the program increased the capacity of the targeted community’s ability to replicate the program following its completion.
Instrumented Public Health Monitoring | MERCY CORPS 6
The final evaluation included the use of the following methods:
• BriefingbyRWSiagaPlus+programmanagerand lead program officers
• DiscussionswithMercyCorpsmanagementandadvisory staff
• DiscussionwithMercyCorpsRWSiagaPlus+Capacity Building and Infrastructure staff
• Desktopreviewofallprogramandbackgrounddocuments/reports and RW Siaga Plus+ indicator data
• Reviewofprogrammaterials
• ReviewofrelevantMercyCorpsdocuments
• Reviewofbaseline/endlinesummarydataandcomparative analysis between the two data sets
• FieldvisitstothefourKelurahanprojecttargetareas to conduct
- Focus group discussions with Pokja Kelurahan and beneficiaries
- Interviews with key stakeholders - Observation of implemented
infrastructure projects
The results of the evaluation combining quantitative and qualitative findings were presented in a final narrative report to Mercy Corps. To prepare for the comparison of methods described in this paper, additional analysis of the data was done at the RW level to enable more direct comparison of the data from the instrumented latrines and associated hand washing taps with program endline monitoring data. This data is presented along with final evaluation findings in the results section.
Instrumentation Description and MethodsRemotely reporting instrumentation may help address objectivity weaknesses in evaluations through interventions instrumented with sensor based monitors, which can provide remotely reporting data. Data from remote monitoring can offer insight in the short to medium terms by providing a real time report of use that the larger international development community can review and apply to their programs as well as an automatic report to funders. In the long term, social, economic and environmental components of a program can be integrated into implementation strategies (Thomas, Zumr, Barstow, & Linden, 2011).
The Sustainable Water, Energy and Environmental Technologies Laboratory, the SWEETLab, at Portland State University is working with partners to demonstrate this concept across several applications and countries. The SWEETSense technology can provide objective, quantitative and continuous operational data on the usage and performance of programs across a range of sectors and communities. The data is then relayed over cellular networks or Wi-Fi into SWEETData, an internet database presenting summary statistics on performance and usage of the monitored technologies to front-end users.
Indonesia — Kay Mattson/Mercy Corps.
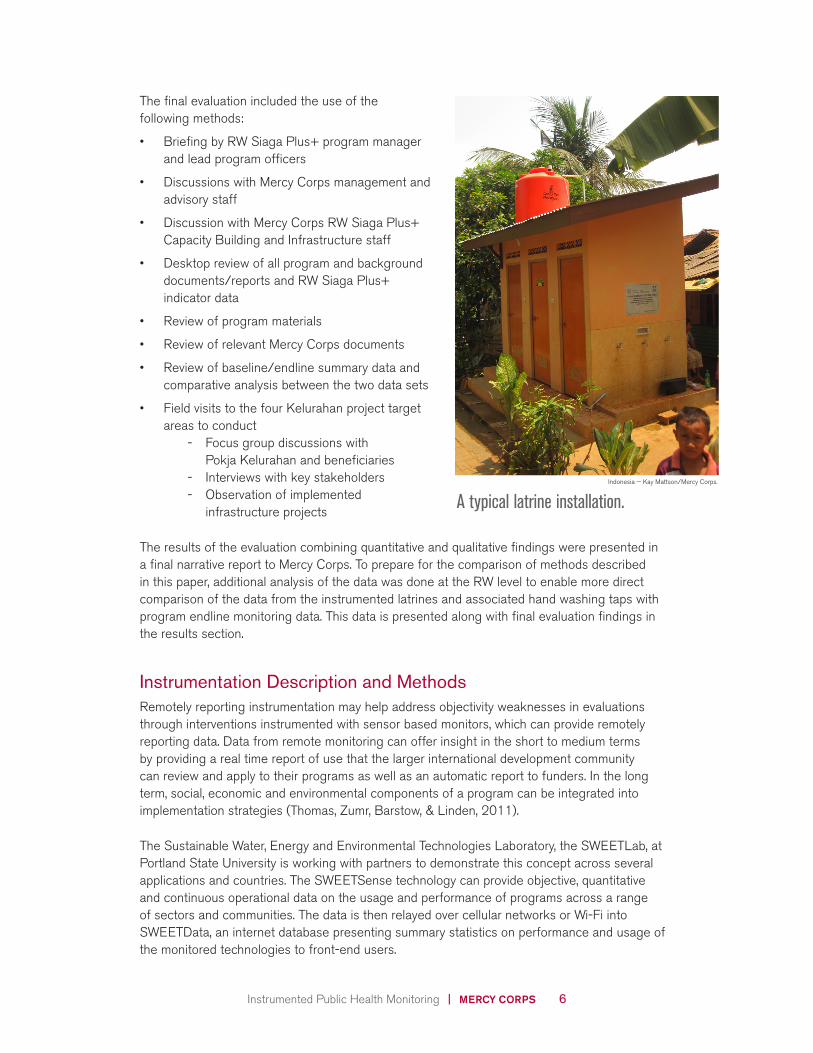
A typical latrine installation.

Instrumented Public Health Monitoring | MERCY CORPS 7
The Portland State University flowmeters were installed on pipelines providing water from elevated tanks to hand washing stations and in-latrine bucket filling taps. The flowmeter did not distinguish between water use associated with handwashing versus bucket filling or other uses. In some cases buckets may have been filled and then used over several latrine flushing and handwashing events, which was not detected in the analysis. These limitations may have biased the analysis both in favor and against showing handwashing compliance. Further studies may examine these limitations. Instruments measuring hand washing station water use and latrine use were installed in four RTs among the targeted 16 neighborhoods (RWs) after the end of the program implementation in September 2012.
Instrumented monitoring can provide insights to many of the issues around sustainability of water, energy and infrastructure interventions. Near real-time data can be inexpensively logged and analyzed to optimize the performance of the particular intervention. Data from sensors can be used in conjunction with other data sources to understand programmatic, social, economic, and seasonal changes that may influence the quality of the system. Additionally, behavioral patterns such as how and when a system is being used can be analyzed to help develop a sustainable system by integrating the user’s behaviors into the design and modification of the system.
This platform combines commercially available front-end sensors, selected for specific applications including water treatment, cookstove, sanitation, infrastructure or other applications, with a comparator circuit board that samples these sensors at a reasonably high rate. The comparator boards monitor the sensors for trigger threshold events that start and end periodic local data logging. The comparators sample the sensors frequently, and the output is fed into a low power microcomputer chip where the relative time that the parameter change occurs is logged. Logging continues until the parameter returns to a predetermined baseline. The stored events are coded to reduce the amount of data, and thereby the amount of energy required for transmission. An on-board SD card allows for local backup logging, as well as logging when cell phone towers are disabled or out of range.
For example, when applied to water flow measurements, as in this study, a transducer comparator examines the reported water pressure data and waits for a change indicating, perhaps, that a tap has been opened. When the sudden drop in water pressure is observed, the system starts logging the actual pressure readings until the user closes the tap. Closing the tap will cause a ‘water hammer’ effect, resulting in spiking pressure readings. These spikes are used to indicate when pressure data logging is discontinued, allowing the unit to return to low power sampling without logging. Two pressure transducers, or a single differential pressure transducer, across an orifice or pipe diameter difference allows correlation of differential pressure readings to volumetric flowrate.

Instrumented Public Health Monitoring | MERCY CORPS 8
One or more times per day, the comparator board relays logged data events either to another parent board or directly to the internet via cellular networks or Wi-Fi. Data processing is enabled on an internet based software program, where the primary algorithms are stored. The internet based program also contains manually and automatically updated calibration files that are periodically and automatically relayed back to the local sensor boards. The innovations include the processes used to enable long duration operation with high resolution data logging while operating on simple, small batteries; the use of customized and remotely updatable threshold trigger events; and the distributed data processing load between the local sensors and the internet.
Through the internet cloud (hosted on Amazon EC2), the data is then integrated with www.sweetdata.org, an internet database. First, the sensor boards deliver data on a reconfigurable period over HTTP. The internet based protocols then process the raw data into summary statistics, and aggregate these results with the database to present to the front-end user summary data on frequency of use and performance of each sensor and the technology it is monitoring. Permissions settings allow project partners to review data prior to public release, without allowing modification or deletion of data.
Each sensor design, i.e. the flowmeter and latrine monitor embodiments discussed here, is separately validated in laboratory and field testing, and the resultant signal processing algorithm applied across all deployments of the same sensor type.
The flowmeter was validated through trials conducted in Portland, Oregon on a low water pressure test bed with an automated water tap opening and closing control system. Water flow detected by the sensor was compared against the automated intervals. Likewise, water use in the installation location was verified during installation as being accurately detected by the sensors.
The latrine monitor was validated through utilization of the same algorithm developed in (Clasen, 2012). The latrine monitor uses the same motion detector as described in this paper, and timestamps the data collected in a nearly identical method.
FIGURE 1: SWEETSense hardware
platform applied to differential pressure flowmeter
Evan Thomas/Portland State University
Instrumented Public Health Monitoring | MERCY CORPS 9
In the four RTs, a motion detector latrine monitor is installed on one of four available stalls, and a flowmeter is installed on the hand washing station water supply. Each sensor is independent – all data analysis on a per site basis is conducted through the online environment exclusively. Each sensor’s reported data is independently analyzed using a validated analysis algorithm. The flowmeters are scaled according to site specific estimates of maximum pressure head. Otherwise, all sensors of the same type are analyzed identically. These algorithms generate date and time stamped event tables.
All eight of the sensors (2 per site at 4 sites) were installed in September 2012, one year after the completion of the program, and continuously operated for at least four months. However, the sensor batteries are consumed at varying rates and other factors, such as humidity or cellular network connectivity, contribute to varying number of data days reported. These variations are compensated for during the analysis by considering average use calculations only during the period of time data is reported. Therefore, while one sensor may have reported 100 days of data, and another 150 days, each sensor is averaged for its own reporting period, yielding results that can directly compared.
The site-specific flowmeter and latrine sensor data are then analyzed. In order to attempt a comparison to the public health monitoring and evaluation survey data collected, the analysis considered the target household beneficiary population in each of the four regions, divided by the number of sites, then multiplied by 4, the average household size in Jakarta (BPS, 2010) to get an average target population at each site. For the latrine monitor, this was further reduced by ¼ to account for the sensor monitoring one of four stalls. The first stall accessed through the entry to the latrine building was instrumented, suggesting that this would be the most highly trafficked. The analysis then assumes that each use represents a unique individual in the target population. This thereby yields an optimistic estimate of the percentage of the target population utilizing the latrine and water services, and allows a direct comparison against survey collected data.

Instrumented Public Health Monitoring | MERCY CORPS 10
TABLE 1:Key Selected Indicator Comparison of Baseline to Endline
INDICATOR Baseline Target Endline Change
% of caregivers who report washing hands with soap before eating, before preparing food, before feeding the child and after defecation.
0.3% 10% 19.4% 6367%
% of caregivers who report washing children’s hands before they eat and after defecation.
3.9% 10% 25.6% 556%
% of caregivers who report using clean water.
98.6% 99% 99.7% 0. 1%
% caregivers who report that they and their children use improved sanitation facility.
19.4% 25% 22.8% 18%
Results
Public Health Evaluation When comparing baseline (460 households surveyed) to endline data (500 households surveyed) the program appeared to have had a significant impact on changing behaviors in the 16 communities in key targeted indicators, particularly with respect to hand washing at critical times in adults (6367%) and among children (556%) (see Table 1). Other findings showed that reported open defecation among children decreased from baseline to endline by 37 percent and that the incidence of reported diarrhea in children aged 0-5 also reportedly dropped by 35 percent from baseline to endline. It’s important to note that all of these are self-reported behaviors of survey respondents on behalf of themselves or their children. All behavior related questions were asked as open ended questions, with some questions allowing for multiple responses, e.g. hand washing times.

Instrumented Public Health Monitoring | MERCY CORPS 11
Additional analysis of the available endline data was done for purposes of comparing evaluation methods for this paper and to examine results in neighborhoods where the sensors were installed to measure and compare latrine usage and hand washing practices between the endline and sensor data. While endline data is available down to the RT level; the sample size among the targeted RTs where the sensors were installed is not large enough to conduct a comparative analysis as only 12 households among the targeted RTs were surveyed at endline. Additionally, given the small number of households among those surveyed in the targeted RTs the authors wanted to ensure that anonymity was maintained for those households that had completed surveys. To enable comparison between the two data sets, analysis was conducted at the RW level, which included the RTs where the targeted sensors were installed. Endline data was collected using a 95% confidence interval of the targeted communities. Of the targeted RWs 78 households were surveyed, representing 15.6% (500) of all endline surveys completed. The following provides a summary of this analysis.
0%
10%
20%
30%
40%
50%
60%
70%
80%
Private Latrine Public Latrine MC Public Latrine Non Latrine
Adult Female/Male
Children Under 5
FIGURE 2:
Place of Defecation Adults and Children (Targeted RWs) (N=78)

Instrumented Public Health Monitoring | MERCY CORPS 12
Of the RWs surveyed no Mercy Corps (MC) public latrines were reported to be used by respondents in Bekasi or Utara, with only a total of five households reporting use of MC public latrines at the point of the endline survey in Kosimbi and Pekojan. At the time of the final endline survey, a significant number of latrines were still being implemented by the program, particularly in the communities of Bekasi and Kosimbi which likely accounts for low reported MC public latrine usage in those communities. The majority of adults in households (71%) reported use of private latrines. There were no differences in these communities among male and female type of latrine use among surveyed households, so adult responses are aggregated. A significant percentage of children under age five (42%) were not using any latrine. Ninety-two percent of the latrines’ waste was reported to go into a septic tank (improved1), with 2.6 percent reported to go into a ditch, and 5.2 percent unknown. One survey had missing data for this question.
1 Further data was gathered on septic tanks regarding their age, frequency of waste removal, what is done with waste removed, etc. This data was not analyzed for this report. Use of a septic tank is determined to be “improved” sanitation for this report.
0
20%
40%
60%
80%
100%
Private LatrinePublic Latrine MC Public Latrine
Duri Kosimbi
Bekasi
Duri Utara
Pekojan
FIGURE 3: Adult Latrine Use by Latrine Type by (Targeted) RW (N= 78)

Instrumented Public Health Monitoring | MERCY CORPS 13
The endline survey included a question related to when caregivers (usually female head of household/mother) washed their hands with soap, and when children washed their hands with soap. The questions were open ended, enabling respondents to provide multiple responses, with positive responses captured for adults for hand washing ‘after cleaning a child who had defecated’, ‘after defecation’, ‘before feeding the children’, ‘before preparing food’ and ‘before eating’ and non-positive responses for ‘other’ and ‘don’t remember’. Similarly, for children, the captured categories were ‘after defecation’, ‘before meal/eating’, ‘other’ and ‘don’t remember’. Child hand washing practice was captured as one response for all children under age five in the household regardless of the number of children under five and/or potential variance in practices among children. For the RWs surveyed, 60.3 percent of caregivers indicated that they washed their hands after defecation with 44.6 percent reporting that their children washed their hands after defecation. However, there was significant variability among the four areas as shown in the figure below. Interestingly there appears to be an inverse relationship between reported adult hand washing behaviors and reported child hand washing behaviors.
FIGURE 4: Caregiver and Child Hand Washing After Latrine Use (Adult N= 78, Child N=74)
0%
20%
40%
60%
80%
100%
Child washes hands after defecationAdults wash hands after defecation
Duri Kosimbi
Bekasi
Duri Utara
Pekojan

Instrumented Public Health Monitoring | MERCY CORPS 14
Instrumentation Analysis Analysis of instrument data to assess latrine and water usage in the four sub-neighborhoods (RTs) was conducted in March, 2013. Data was collected for between approximately 120 and 170 days per sensor device. The following charts show the event data aggregated on an hourly and daily interval, averaged across the reporting interval per sensor. The two charts below illustrate the comparative use of sanitation and water services over each day of the week. While little variation is shown between days, there is significant agreement throughout the week within each site, and a high degree of variation between sites. Additionally, there is a clear differentiation between use of service types between sites. For example, latrine use in Pekojan is significantly higher than the other sites, while the water use in Bekasi is significantly higher than others. An important note is that the Bekasi site was an earlier Mercy Corps pilot initiative, installed a year or more before the later sites, and is located in a less densely populated area of greater Jakarta.
0%
5%
10%
15%
20%
25%
Mon Tues Wed Thur Fri Sat Sun
Duri KosimbiBekasi Duri Utara Pekojan
FIGURE 5: Percentage Target Population Latrine Use Per Day

Instrumented Public Health Monitoring | MERCY CORPS 15
0%
3%
6%
9%
12%
15%
Mon Tues Wed Thur Fri Sat Sun
Duri KosimbiBekasi Duri Utara Pekojan
FIGURE 6: Percentage Target Population Water Use Per Day

Instrumented Public Health Monitoring | MERCY CORPS 16
1 2 3 4 5 6 7 8 9 10 11 12 13 14 15 16 17 18 19 2423222120
Duri KosimbiBekasi Duri Utara Pekojan
0.0
0.5
1.0
1.5
2.0
FIGURE 7: Average Latrine Usage Events Per Hour
The next set of charts further disaggregate the data on an hourly basis, again showing average use during the sensor-specific reporting period and in terms of an estimated fraction of the target population utilizing the water and sanitation services. This data again shows differential use between sites, and also serves as a cross-correlation of the sensors and analysis between sites in terms of the shape of the usage – at all sites the usage generally peaks for both the water and sanitation services at mid-day, and then again in the late evening. While the amount of use is significantly different between sites and between services, the shape of the use is consistent across sites and services, providing confidence in the hardware and software.

Instrumented Public Health Monitoring | MERCY CORPS 17
1 2 3 4 5 6 7 8 9 10 11 12 13 14 15 16 17 18 19 2423222120
Duri KosimbiBekasi Duri Utara Pekojan
0
2
4
6
8
10
FIGURE 8: Average Water Usage Events Per Hour

Instrumented Public Health Monitoring | MERCY CORPS 18
Finally, the latrine sensor data is analyzed on a site-specific basis against the flowmeter detected events. The algorithm takes each detected latrine use and determines if there is a flowmeter detected use at the same site that occurs within 10 minutes after the latrine use. The result is shown in the following chart in terms of percentage of the detected latrine uses that occur in isolation of a water use, and the percentage that correspond to a water use. As shown, there is generally low use of water services (representative of hand-washing) after latrine services (less than 10%) with the exception of Bekasi which has approximately 40% of latrine events corresponding to water use.
FIGURE 9: Use of Water Services after Latrine Use Events
0%
20%
40%
60%
80%
100%
Bekasi Kosimbi Utara Pekojan
Latrine Use Only Water Use after Latrine Use

Instrumented Public Health Monitoring | MERCY CORPS 19
Comparison of Data Analysis between Methods This paper compares self-reported use of ‘improved latrines’ and hand washing after latrine use as reported in endline survey to recorded actual latrine and water usage following latrine use from data obtained from sensor monitoring at selected sites. While a precise comparison is not possible with the data available, the assumptions made allow for a rough approximation. The table below shows the comparison between the sensor-recorded data and the self-reported behavior. In general, the sensor analysis shows significantly less utilization of water for hand washing after latrine use and use of latrine facilities within the target population than was reported by participants in the end of program survey.
2 Improved latrines include latrines where waste is appropriately captured, e.g. in a functioning/well maintained septic tank as opposed to a latrine where the waste goes directly into a river. In Jakarta many households have a latrine, but a large percentage of household waste goes directly into a river or elsewhere.
TABLE 2:Indicative Comparison Between Endline Survey and Sensor Reported Service Adoption
Targeted Behavior Change
Indicator Survey Reported
Sensor Method Sensor Reported
Variance
% of target population utilizing sanitation services.
% adults who report that they use improved sanitation facility.
100% Average daily latrine use detected over approximate target population assuming minimum one use per person per day.
~2-25% 4x or greater
% of children < age five reported to use improved sanitation facility.
58%
% of latrine use followed by handwashing.
% of caregivers who report washing hands after defecation.
60.3% Detected latrine use followed by detected water use.
~0-40% Up to 25x
% of children < age five reported to wash hands after defecation.
44.6%

Instrumented Public Health Monitoring | MERCY CORPS 20
Discussion and LimitationsThe Mercy Corps water and sanitation program recognized that the self-reported data collected in the surveys was probably biased. For example, the majority of adults at baseline reported not practicing open defecation, but reported in final evaluation focus groups that they had stopped the practice of open defecation because of having access to latrines constructed by RW Siaga Plus+. Thus the practice of open defecation among adults was probably higher than reported as indicated by the presence of ‘helicopter’ latrines (makeshift latrines constructed over river ways, canals and dug pits) in the community during the assessment process. To add another dimension to Mercy Corps program evaluation methods they enlisted Portland State University to pilot the use of instrumentation monitoring.
These two evaluation methods were conducted asynchronously – the public health evaluation in September 2011 (with endline data collected up to four months earlier) and the instrumentation one year later (and a year after the program ended). This latency clearly could contribute to the apparent reduction in desired behavior when looking at hand washing practices following latrine use at the monitored latrines. Also, it is not known whether behavior at these latrines is representative of general behavior in these communities. Assuming that 29% of the community populations use the public latrines (based on self-reports), the sensor data indicates that approximately 2-25 percent of the targeted population are using the latrines, and of those 0 to 40% appear to be washing their hands after latrine use at the four respective facilities as indicated by hand washing tap usage, significantly less than was reported at endline. This information by itself is valuable in program evaluation as the long term effectiveness of water and sanitation programming and associated behavior change messaging interventions is often unknown. The question remaining - is the behavior at these latrines an indicator of overall practices or something different? This is not something a sensor alone can answer. However an effective behavior change program would hope to see behaviors consistently adopted, regardless of type/location of latrine use.
Mercy Corps also recognized at the end of the program that sustaining the behavior change long term was uncertain. The methods employed are effective for raising awareness of desired behaviors, and for bringing about immediate changes in behavior. However, research has shown that reinforcement of positive behaviors is critical if change is to be sustained over the long term, particularly for handwashing behaviors where the goal is to prevent incidence of diarrhea (Ejemot, RI et. al, 2008). Still,the program’s emphasis on infrastructure to support positive behaviors (e.g. handwashing stations and increased availability of community latrines) increases the likelihood of sustainability, particularly for reducing open defecation and use of improved latrines, and especially in communities where no other options are available.
Data from sensors can potentially have multiple applications. The data can be analyzed and compared to secondary data sources such as social surveys, finances, commodity prices, rainfall, school and health care facility attendance, or work schedules to better understand user behavior. Additional comparisons can be made between implementation strategies such as particular educational materials or the use of community health workers to disseminate the technology. Results can also be monitored with more frequency than traditional survey methods, allowing for more adjustment of program interventions. With this data, systems and implementation strategies can be designed more effectively to accommodate the user’s needs and wants.

Instrumented Public Health Monitoring | MERCY CORPS 21
ConclusionsInstrumented monitoring systems may be an effective method to improve data collection and thereby program quality and impact within global health programs. Mercy Corps, like other development organizations, invests significant resources in water and sanitation infrastructure and behavior change programs, as well as in monitoring and evaluation staff time, while being aware that survey data can be biased towards showing success and most often relies on self-reported data. By incorporating instrumentation with remote data access, Mercy Corps is able to monitor programs over time, rather than relying solely on isolated survey responses, and more directly measure some behaviors and reduce self-reporting bias. And this can now be done at a significantly lower per-sample cost given the availability of sensor technology. A downside of remote monitoring is that while it can capture usage it doesn’t enable the capturing of other more nuanced data such as other latrines used by the community and why people are not using hand washing stations after using the latrine, information that would be informative to behavior change programming interventions. Use of remote monitoring programs coupled with traditional monitoring and evaluation methods may work to improve overall programming in the long run. Combining both methods throughout the intervention period and beyond the end of the program could potentially contribute to greater understanding of the effectiveness of programs, and changes overtime and needed modifications to ensure that targeted program indicators are met.
Instrumented Public Health Monitoring | MERCY CORPS 22
ACKNOWLEDGEMENTS
The authors recognize the significant collaborations in this on-going program, including students and staff at Portland State University and Stevens Water and Mercy Corps staff in Portland and Jakarta.
DEFINITIONS
Kaders Community Health Volunteers
Kedotengs Septic tank sludge removal carts
Kelurahan Sub-district
MKK Community latrines
PDI Positive Deviance Inquiry
PHAST Participatory Hygiene and Sanitation Transformation
PNA Participatory Needs Assessment
RW Rukun Warga/Neighborhood
RW Siaga Plus + Integrated water, sanitation,
hygiene improvement to decrease under five malnutrition
RT Rukun Tetangga/ Sub-neighborhood
TSS Temporary Sludge Storage

Instrumented Public Health Monitoring | MERCY CORPS 23
REFERENCES
Breslin, E. (2010). Rethinking hydro-philanthropy: smart money for transformative impact. From http://aquadoc.typepad.com/files/breslin-rethinking-hydrophilanthropy-012910-web.pdf.
Gibson, C., Andersson, K., Ostrom, E., Shivakumar, S. (2005). The Samaritan’s Dilemma: The Political Economy of Development. Oxford: Oxford University Press.
Chowdhury, Z., Edwards, R., Johnson, M., Shields, K., Allen, T., Canuz, E., Smith, K. (2007). An inexpensive light-scattering particle monitor: field validation. Journal of Environmental Monitoring, 9, 1099-1106.
Clasen, T., Fabini, D., Boisson, S., Tanjea, J., Song, J., Aichinger, E., Bui, A., Dadashi, S., Schmidt, WP., Burt, Z., Nelson, K. (2012). Making Sanitation Count: Developing and Testing a Device for Assessing Latrine Use in Low-Income Settings. Environmental Science and Technology, 46 (6), 3295-3303.
Curtis, V., Kanki, B., Cousens, S., Diallo, I., Mertens, T. (1997). Dirt and diarrhea: formative research in hygiene promotion programmes. Health Policy and Planning, 12 (2), 122-131.
Curtis, V., Cairncross, S. and R. Yonli (2000). Domestic hygiene and diarrhea – pinpointing the problem. Tropical Medicine and International Health, 5(1), 22-32.
EHP/USAID. (2009). Joint Publication 8. The Hygiene Improvement Framework-A Comprehensive Approach for Preventing Childhood Diarrhea. Prepared under EHP Project 26568/CESH.HI.ADVOCACY.Y3
FAO. (2011). Integrated food-energy systems: generating climate-smart energy for food security. Retrieved 2011 from http://www.fao.org/bioenergy/67564/en.
GACC. (2011). Global alliance for clean cookstoves quick facts. From http://cleancookstoves.org/wpcontent/uploads/2011/05/Cookstoves-One-Pager-05.09.11.pdf.
Jaggi, N., Kar, K. (2011). Multi-sensor activation for temporally correlated event monitoring with renewable energy sources. International Journal of Sensor Networks, 10 (1/2), 42-58.
Kafetzoglou, S., Papabsddiliou, S. (2011). Energy-efficient framework for data gathering in wireless sensor networks via the combination of sleeping MAC and data aggregation strategies. International Journal of Sensor Networks, 10 (1/2), 3-13.
Kapur, D., Kumar, P. (2012). Formative Research on Sanitation and Hygiene Behaviors Current Status, Knowledge, Attitudes, Barriers and Enablers: Primary Research Findings, Paper prepared for the Asia Regional Sanitation and Hygiene Practitioners Work Shop, Dhaka, Bangladesh, 31 January – 2 February 2012, IRC WASH Library from http://www.irc.nl/page/68626.
Olembo, L., Kaona, F., Tuba, M., Burnham, G. (2004). Safe water systems: an evaluation of the Zambia CLORIN program. From http://www.ehproject.org/PDF/Others/Zambia%20Report%20Format.pdf.
Manun’Ebo, M., Cousens, S., Haggerty, P., Kalengaie, M., Ashworth, A., Kirkwood, B. (1997). Measuring hygiene practices: a comparison of questionnaires with direct observations in rural Zaire. Journal of Tropical Medicine and International Health 2: 1015 – 1021.

Instrumented Public Health Monitoring | MERCY CORPS 24
Marsh, D., Schroeder, D., Dearden, K., Sternin, J., Sternin, M. (2004) The power of positive deviance. BMJ, 329; 11.
Morreale, P., Qi, F., Croft, P. (2011). A green wireless sensor network for environmental monitoring and risk identification. International Journal of Sensor Networks, 10 (1/2), 73-82.
Hunter, P., Zmirou-Navier, D., Hartemann, P. (2009). Estimating the impact on health of poor reliability of drinking water interventions in developing countries. Science of Total Environment, 207, 2621-2624.
Properzi, F. (2010). Rapid assessment of drinking water quality (RADWQ). UNICEF/WHO.
Bailis, R., Berrueta, V., Chengappa, C., Dutta, K., Edwards, R., Masera, O., Still, D., Smith, K. (2007). Testing for monitoring improved biomass stove interventions: experiences of the household energy and health project. Energy for Sustainable Development, 11(2), 57-70.
Stanton, B., Clemens, J. (1987). An education intervention for altering water-sanitation behavior to reduce childhood diarrhea in urban Bangladesh II. A randomised trial to assess the impact of intervention on hygienic behaviors and rates of diarrhea. American Journal of Epidemiology 125(2): 292-301.
Thomson, P. H. (2012). GSM-enabled remote monitoring of rural handpumps: a proof of concept study. Journal of Hydroinformatics (In press).
United Nations. (2005). World Population. UN Department of Economic and Social Affairs, Population Division, United Nations.
Berrueta, V., Edwards, R., Masera, O. (2008). Energy performance of wood-burning cookstoves in Michoacan, Mexico. Renewable Energy, 33(5), 859-870.
WHO. (1998) PHAST step-by-step guide: A participatory approach for the control of diarrhoeal diseases http://www.who.int/water_sanitation_health/hygiene/envsan/phastep/en/.
WHO. (2004). Sanitation and hygiene links to health; facts and figures. WHO.
WHO/UNICEF. (2010). Progress on drinking water and sanitation. Geneva: WHO and UNICEF Joint Monitoring Program on Water Supply and Sanitation.
WSP (No date). Methodology for Participatory Assessments, World Bank Water Sanitation Program (WSP) and IRC International Water and Sanitation Centre.

ABOUT MERCY CORPSMercy Corps helps people turn the crises they confront into the opportunities they deserve. Driven by local needs, our programs provide communities in the world’s toughest places with the tools and support they need to transform their own lives. Our worldwide team in 42 countries is improving the lives of 19 million people. For more information, see mercycorps.org.
45 SW Ankeny StreetPortland, Oregon 97204
888.842.0842mercycorps.org
CONTACT
EVAN THOMASAssistant Professor, Portland State [email protected] 503.725.2898
KAY MATTSONIndependent International Public Health/WASH [email protected] 503.522.3525