‘instrumental reading for those that want an energy … · the renewable energy landscape the...
TRANSCRIPT

The Renewable Energy Landscape
Preserving scenic values in our sustainable future
Dean Apostol, James Palmer, Martin Pasqualetti, Richard Smardon and Robert Sullivan
‘Long overdue, this guide on how to place renewable energy in the landscape to maximize public acceptance is critical to the energy transition that is so desperately needed.’Paul Gipe, early advocate of aesthetic design for wind and solar power plants, author of Wind Energy for the Rest of Us: A Comprehensive Guide to Wind Power and How to Use It.
‘Instrumental reading for those that want an energy future that is not only sustainable and affordable, but inclusive and just. If we are to achieve public support for a sustainable energy future, we must minimize natural public resistance to change. This book shows how to do it.’Benjamin K. Sovacool, Professor of Energy Policy, University of Sussex, UK
The Renewable Energy Landscape is a definitive guide to understanding, assessing, avoiding, and minimizing scenic impacts as we transition to a more renewable energy future. It focuses attention, for the first time, on the unique challenges solar, wind, and geothermal energy will create for landscape protection, planning, design, and management.
Topics addressed include: • Policies aimed at managing scenic impacts from renewable energy development and their social acceptance within the USA, Canada, Europe and Australia • Visual characteristics of energy facilities, including the design and planning techniques for avoiding or mitigating impacts and improving visual fit • Methods for assessing visual impacts of energy projects and the best practices for creating and using visual simulations • Policy recommendations for political and regulatory bodies.
A comprehensive and practical book, The Renewable Energy Landscape is an essential resource for those engaged in planning, designing, or regulating the impacts of these new, critical energy sources, as well as a resource for communities that may be facing the prospect of development in their local landscape.
Dean Apostol is Senior Landscape Architect and Restoration Ecologist for MIG Inc, a consulting firm with offices in California, Oregon and Colorado, USA.
James Palmer has had a distinguished professional career in landscape architecture spanning thirty-five years, focusing on the assessment of landscape character and aesthetic quality.
Martin Pasqualetti is Professor in the School of Geographical Sciences and Urban Planning at Arizona State University, USA, and a Senior Sustainability Scientist in the Julie Ann Wrigley Global Institute of Sustainability, USA.
Richard Smardon is a SUNY Distinguished Service Professor Emeritus at the SUNY College of Environmental Science and Forestry in Syracuse, New York, USA.
Robert Sullivan is an environmental scientist in Argonne National Laboratory’s Environmental Science Division, USA.
LANDSCAPE / IMPACT ASSESSMENT
Cover image: Photo by Martin Pasqualetti. Palm Springs, California.
The Renewable Energy Landscape
Dean A
postol, James Palm
er, Martin Pasqualetti,
Richard Sm
ardon and Robert Sullivan
www.routledge.com
Routledge titles are available as eBook editions in a range of digital formats 9 781138 808980
ISBN 978-1-138-80898-0

THE RENEWABLE ENERGY LANDSCAPE
The Renewable Energy Landscape is a defi nitive guide to understanding, assessing, avoiding, and minimiz-ing scenic impacts as we transition to a more renewable energy future. It focuses attention, for the fi rst time, on the unique challenges solar, wind, and geothermal energy will create for landscape protection, planning, design, and management.
Topics addressed include:
• Policies aimed at managing scenic impacts from renewable energy development and their social acceptance within North America, Europe and Australia
• Visual characteristics of energy facilities, including the design and planning techniques for avoiding or mitigating impacts and improving visual fi t
• Methods for assessing visual impacts of energy projects and the best practices for creating and using visual simulations
• Policy recommendations for political and regulatory bodies.
A comprehensive and practical book, The Renewable Energy Landscape is an essential resource for those engaged in planning, designing, or regulating the impacts of these new, critical energy sources, as well as a resource for communities who may be facing the prospect of development in their local landscape.
Dean Apostol is Senior Landscape Architect and Restoration Ecologist for MIG Inc, a consulting fi rm with offi ces in California, Oregon and Colorado, USA. He researches, consults, and does environ-mental analysis on energy projects and aesthetic impacts.
James Palmer has had a distinguished professional career in landscape architecture spanning thirty-fi ve years, focusing on the assessment of landscape character and aesthetic quality. Through publica-tions, peer reviews, court expert testimony, and teaching, he has raised the standards in the fi eld. He frequently consults on wind energy aesthetic impacts in the Northeast.
Martin Pasqualetti is Professor in the School of Geographical Sciences and Urban Planning at Arizona State University, USA, and a Senior Sustainability Scientist in the Julie Ann Wrigley Global Institute

of Sustainability, USA. For over forty years, he has been examining the relationships between energy and environment, especially the formation and mitigation of renewable energy landscapes.
Richard Smardon is a SUNY Distinguished Service Professor Emeritus at the SUNY College of Environmental Science and Forestry in Syracuse, New York, USA, and has over thirty-fi ve years of experience with visual impact assessment methodology development, twenty years of project manage-ment, and has testifi ed in over fi fteen cases with visual impact assessment issues.
Robert Sullivan is an environmental scientist in Argonne National Laboratory’s Environmental Sci-ence Division, USA. He conducts research on the visual impacts of fossil fuel and renewable energy systems, and develops guidance documents for federal agencies on visual resource inventory, manage-ment, and protection.

THE RENEWABLE ENERGY LANDSCAPE
Preserving scenic values in our sustainable future
Edited by Dean Apostol, James Palmer, Martin Pasqualetti, Richard Smardon and Robert Sullivan

First published 2017 by Routledge 2 Park Square, Milton Park, Abingdon, Oxon OX14 4RN
and by Routledge 711 Third Avenue, New York, NY 10017
Routledge is an imprint of the Taylor & Francis Group, an informa business
© 2017 Dean Apostol, James Palmer, Martin Pasqualetti, Richard Smardon and Robert Sullivan
The right of Dean Apostol, James Palmer, Martin Pasqualetti, Richard Smardon and Robert Sullivan to be identifi ed as the author of the editorial material, and of the authors for their individual chapters, has been asserted in accordance with sections 77 and 78 of the Copyright, Designs and Patents Act 1988.
All rights reserved. No part of this book may be reprinted or reproduced or utilised in any form or by any electronic, mechanical, or other means, now known or hereafter invented, including photocopying and recording, or in any information storage or retrieval system, without permission in writing from the publishers.
Trademark notice : Product or corporate names may be trademarks or registered trademarks, and are used only for identifi cation and explanation without intent to infringe.
British Library Cataloguing in Publication Data A catalogue record for this book is available from the British Library
Library of Congress Cataloging-in-Publication Data Names: Apostal, Dean, editor.Title: The renewable energy landscape : preserving scenic values in our sustainable future / edited by
Dean Apostal, James Palmer, Martin Pasqualetti, Richard Smardon and Robert Sullivan.Description: Abingdon, Oxon ; New York, NY : Routledge is an imprint of the Taylor & Francis
Group, an informa business, [2016] | Includes bibliographical references and index.Identifi ers: LCCN 2016007800 | ISBN 9781138808980 (hardback : alk. paper) |
ISBN 9781315618463 (ebook)Subjects: LCSH: Renewable energy sources.Classifi cation: LCC TJ808 .R4135 2016 | DDC 333.7/16—dc23LC record available at http://lccn.loc.gov/2016007800
ISBN: 978-1-138-80898-0 (hbk) ISBN: 978-1-315-61846-3 (ebk)
Typeset in Bembo by Apex CoVantage, LLC
CONTENTS
List of Illustrations ix Plates ix Figures xi Tables xvi Foreword xviii Preface xx Acknowledgements xxii
1 Introduction to the changing landscapes of renewable energy 1 1.1 Driving across America in the year 2030 2 1.2 The challenge 8
PART I 2 Conserving scenery during an energy transition 17
2.1 Introduction 17 2.2 Visual elements of renewable energy landscapes 18 2.3 The early years 23 Case study 2.1: The San Gorgonio California Wind Study 27 2.4 Evolving visual impact assessment methods 30 2.5 Visibility assessment techniques 32 Case study 2.2: Cape Wind, Massachusetts 32 2.6 Visual impact thresholds 33 2.7 Summary 36
3 Managing new energy landscapes in the USA, Canada, and Australia 41 3.1 Introduction 41

vi Contents
3.2 US federal and state support for renewable energy 42 3.3 State and local review of renewable energy projects – the crazy quilt 49 3.4 What about utility-scale solar development in North America? 56 3.5 US legal issues with State and local renewable energy siting 57 3.6 Canadian laws, ordinances, regulations, and standards 58 3.7 Renewable energy guidance for Australia 61 3.8 Summary and conclusions 67
4 Adjusting to renewable energy in a crowded Europe 78 4.1 Introduction 78 4.2 Policy context 80 4.3 The European landscape 83 4.4 Overview of methods and approaches to considering
landscape in windfarm development 87 4.5 Strategic planning: locational aspects and landscape capacity 88 4.6 Site level planning and design 90 4.7 Landscape and visual impact assessment 93 4.8 Assessment methodology 94 4.9 Taking account of public perceptions and opinions 105 4.10 Conclusions 106
5 Social acceptance of renewable energy landscapes 108 5.1 Introduction 108 5.2 General public reactions to renewable energy 109 5.3 National public response to renewable energy 113 5.4 Offshore wind energy development social factors 124 5.5 Commercial solar energy and social acceptability factors 127 5.6 Social receptivity and geothermal energy development 129 5.7 Summary of acceptability by renewable energy type 130 5.8 Renewable wind energy facilities and visual perception 131
PART II
6 The visual signatures of renewable energy projects 145 6.1 Introduction 145 6.2 Visual contrast 145 6.3 Visibility factors 149 6.4 Visual contrasts of onshore and offshore wind, solar, geothermal,
and electric transmission facilities 155 Case study 6.1: Comparing visibility of solar facilities 167 6.5 Summary and conclusions 174
7 Improving the visual fi t of renewable energy projects 176 7.1 Introduction 176 7.2 Assessing and incorporating landscape aesthetic characteristics 177

Contents vii
7.3 Recommended best practices 180 Case study 7.1: South Fork Valley PV Solar Project 191 7.4 Summary and conclusion 196
8 Measuring scenic impacts of renewable energy projects 198 8.1 Introduction 198 8.2 Visual Impact Assessment framework 200 8.3 Scope and objectives of the Visual Impact Assessment 201 8.4 Viewshed analysis 203 Case study 8.1: Sinclair-Thomas Matrix – using viewshed
analysis and threshold distances to summarize impacts 204 8.5 Baseline conditions 205 Case study 8.2: Cape Cod Commission Visual Impact Assessment
guidance for offshore development 207 Case study 8.3: Viewer intercept surveys 210 8.6 Visual Impact Assessment 211 8.7 Cumulative visual impact 215 8.8 Mitigation of visual impacts 217 Case study 8.4: Dry Lake Solar Energy Zone offsite mitigation 219 8.9 Summary 220
9 Visualizing proposed renewable energy projects 223 9.1 Introduction 223 9.2 Guidelines for producing and evaluating simulations 225 9.3 Photomontage production summary 228 Case study 9.1: Visualization study for offshore North Carolina 230 9.4 Animations 233 9.5 Limitations of simulations 234 9.6 Sources of error and inaccuracy in simulations 236 9.7 Other types of simulations 238 9.8 Summary 241
10 Engaging communities in creating new energy landscapes 243 10.1 Introduction 243 10.2 Consultation and participation methods 245 10.3 Participatory process evaluation 248 10.4 Visual impact assessment and the consultation process 248 10.5 Projecting landscape futures and alternatives 249 10.6 Landscape impact equity 250 10.7 Mitigation of impacts 251 10.8 Cumulative impacts 252 10.9 Summary and conclusion 254
11 Conclusion: Policy recommendations for the new energy landscape 258 11.1 Regulatory legal and policy issues 259
viii Contents
11.2 Developing multiple landscape zoning 259 11.3 Determining visibility across landscape zones 260 11.4 Building scenic inventory baselines 260 11.5 Integrated environmental planning for renewable energy 261 11.6 Best practices framework 263 11.7 Tightening visual and scenic analysis methods 265 11.8 Determination of acceptability or undue aesthetic impacts 267 11.9 Potential assessment and mitigation needs 268 11.10 Research needs 269 11.11 Final recommendations 270
Editors and contributors 275 Index 279

ILLUSTRATIONS
PLATES
1 Visual simulation of Cape Wind from the Hyannis Port Golf Club on Cape Cod, Massachusetts. (Source: Save Our Sound.)
2 Landscape contrast between growing wind development and the declining oil fi elds of Wolf Ridge, Texas. (Photo: M. Pasqualetti.)
3 In the early days for wind development in Southern California, substantial public opposition arose from the intrusion of the turbines on the natural landscape. Mt. San Jacinto is the backdrop to the City of Palm Springs, California. (Photo: M. Pasqualetti.)
4 Glare from Ivanpah solar power tower in Ivanpah Valley. View is from the SE at a distance of 40 miles at 35,000 feet in a commercial airliner. Ivanpah Dry Lake is crossed by the straight line of I-15 on the left side (south) of the glare. The airliner was 25 miles SSW of Las Vegas, Nevada. (Photo: M. Pasqualetti.)
5(a) Two maps from the Scottish Highland windfarm landscape supplementary planning guidance project: (a) the landscape character map for the study area (upper left); and (b) the map of landscape character sensitivity for the study area (upper right). Also on the map are the locations of the then constructed, approved or planned windfarm developments in order to see how well they related to the sensitivity assessment. This is reasonably satisfactory, showing that the project-based assessments were sound. (Reprinted by permission from James Hutton Institute.)
6 A map showing an example of the extent of the viewsheds from one set of selected viewpoints – those from the summits of Munros and Corbetts – out to 7 kilometers (short-medium distance visibility). (Reprinted by permission from James Hutton Institute. )
7 An example of a computer-generated zone of theoretical visibility for a project in Scotland, based on landform, to 35 kilometers radius from a perimeter around the extent of the proposed development. The colors show the number of turbine blade tips visible from different places, refl ecting the variability in visibility across the ZTV. The cluster of small circles represents the sites of the proposed turbines. (Reprinted by permission from Envision 3D Ltd.)
and (b)

x Illustrations
8 An example of a typical visualization as presented for an LVIA. The original photograph (top) is matched fi rst to a wireframe perspective (middle) and then used to create a photomontage of a development from a single viewpoint (bottom), using the photography and visualisation standards recommended by SNH. (Reprinted by permission from Envision 3D Ltd.)
9 Glare from the Ivanpah Solar electric generating system power towers, 40 miles southwest of Las Vegas, Nevada. (Photo: Robert Sullivan, Argonne National Laboratory.)
10 Different views of a photovoltaic solar facility at the same time of day along different bearings show dramatically different apparent color. Copper Mountain Solar Facility near Boulder City, Nevada. (Photo: Robert Sullivan, Argonne National Laboratory.)
11 Three views of the Dunlap Wind Energy Project in Wyoming at distances between 6 and 10 miles illustrate how the complex interaction of viewing geometry, lighting, and visual backdrop affect visibility. (Photo: Robert Sullivan, Argonne National Laboratory.)
12 Hazard navigation lighting atop wind turbines. (Photo: Terrence J. DeWan & Associates.)
13 Lighting at the Nevada Solar One parabolic trough facility near Boulder City, Nevada. (Photo: USDI Bureau of Land Management.)
14 Several views of the Nevada Solar One parabolic trough facility from different angles and under different lighting conditions show a wide range of color contrasts, including glare (second image from top). (Photo: Robert Sullivan, Argonne National Laboratory.)
15 Map showing the zones of theoretical visibility (ZTV) for existing wind turbines in Scotland and areas where new turbines could be installed with minimum impact on the remaining areas without a view of one or more turbines (non-visible areas or NVA). (Map and data supplied by Wildland Research Institute, 2016.)
16 Color treatment of geothermal plant (near Mammoth, California) to reduce contrast. (Photo: M. Pasqualetti.)
17 Visual clutter from mixing turbine and tower types. San Gorgonio Pass, CA. (Photo: M. Pasqualetti.)
18 Cape Cod landscape similarity zone map. (Reproduced by permission from the Cape Cod Commission.)
19 Map of the Mohave County Wind Farm cumulative effects analysis, shows spatial relationship with sensitive areas such as wilderness and recreation areas. (Source: USDI Bureau of Land Management, Mohave County Wind Farm Project Final Environmental Impact Statement (2013).)
20 A photograph of the project area for an offshore wind facility used as the base photograph for a photomontage. (Credit: Bureau of Ocean Energy Management.)
21 A 3D wireframe model of wind turbines overlaid onto a base photograph during the photomontage production. The wire frame turbines are visible just above the horizon. (Credit: Bureau of Ocean Energy Management.)
22 A spatially accurate and realistic simulation of an offshore wind facility. The simulated wind turbines are visible just above the horizon. (Note that the original simulation is 11 inches by 17 inches, at a much higher resolution, and with better color reproduction.) (Credit: Bureau of Ocean Energy Management.)
23 Appropriate supplementary documentation for a simulation provided separately from the simulation. (Credit: Bureau of Ocean Energy Management.)
24 Simulated wind turbines at four distances from a Cape Cod beach used as part of a public preference survey. (Reproduced by permission from the Cape Cod Commission.)

Illustrations xi
Simulation A. Wind turbines as close as 0.3 nautical miles (0.6 km). Simulation B. Wind turbines as close as 1.5 nautical miles (2.8 km). Simulation C. Wind turbines as close as 3 nautical miles (5.6 km). Simulation D. Wind turbines as close as 5 nautical miles (9.3 km). 25 Turbines in San Gorgonio Pass. Because the project is next to a busy highway, it is
unavoidably visible to thousands of people every day, starting from at least 35 miles away as in this photo. (Photo: M. Pasqualetti.)
26 Landscape and seascape maps used by the Cape Cod Commission identifi ed 52 critical viewpoints, thus reducing ambiguity about scenic resources. (Reproduced by permission from the Cape Cod Commission.)
27 Solar sharing. Panels make electricity while providing gathering space at Arizona State University. (Photo: M. Northum.)
28 Parcels of farmland near the crippled Fukushima nuclear plant are returning to life and being covered with solar panels, refl ecting government incentives to invest in renewable power. Solar sharing is being tested by Iitate Denryoku, a power company set up by residents. (Source: The Japan Times, Sept. 16, 2015.)
29 Map of the Draft California Desert Renewable Energy Plan. (Source: USDI Bureau of Land Management.)
FIGURES
1.1 Wind turbines integrated into ranchland, near Rio Vista, Solano County, California. (Photo: M. Pasqualetti.) 2
1.2 Wind turbines adjacent to pre-existing residence, San Gorgonio Pass, California. (Photo: M. Pasqualetti.) 3
1.3 Cluttered energy facilities at San Gorgonio Pass – transmission lines, wind turbines, solar panels, and a gas-fi red generating station, with Desert Hot Springs, California in the background. (Photo: M. Pasqualetti.) 4
1.4 A landscape in transition. New wind turbines in a legacy oil fi eld. Forty miles north of Dallas-Ft Worth, this is Wolf Ridge, Texas. (Photo: M. Pasqualetti.) 4
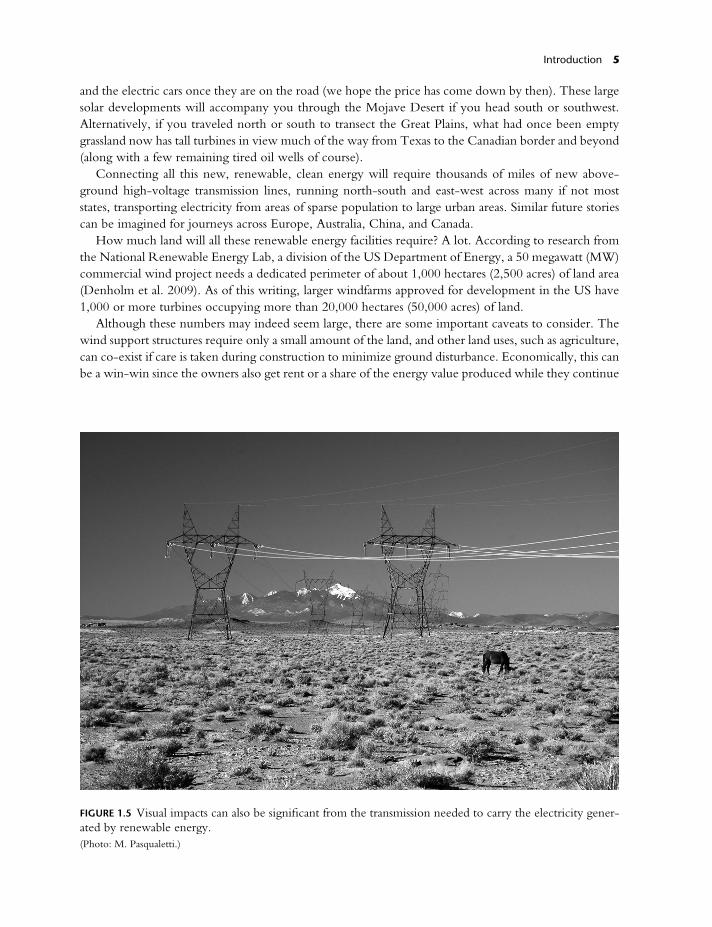
1.5 Visual impacts can also be signifi cant from the transmission needed to carry the electricity generated by renewable energy. (Photo: M. Pasqualetti.) 5
1.6 Dixon, Illinois farm growing maize and soybeans. The wind turbine array has little effect on the agriculture and more than doubles the income from the land. (Photo: M. Pasqualetti.) 6
1.7 Nysted Wind Facility, 8–12 miles (13–20 kilometers) offshore, Denmark, the North Sea. (Photo: National Renewable Energy Laboratory.) 7
1.8 Recreational beach at Carpentaria, California with offshore oil rigs at 15 miles. (Photo: M. Pasqualetti.) 8
2.1 Appreciable landscape remolding is required because of the site-specifi c nature of geothermal energy and the hilly topography at The Geysers, Northern California. (Photo: M. Pasqualetti.) 18
2.2 Integrating geothermal energy into the fl at Imperial Valley presents minimal diffi culties, although it can interfere with the irrigated agriculture that dominates the local economy. (Photo: M. Pasqualetti.) 19
2.3 Wind turbines installed immediately adjacent to an existing house in North Palm Springs, California can generate opposition from home owners who are impacted by the visual and auditory changes they bring. (Photo: M. Pasqualetti.) 20
xii Illustrations
2.4 Wind power resources are commonly located at a substantial distance from load centers, requiring additional transmission lines. These are in San Gorgonio Pass, near Palm Springs, California, directly in a power line corridor to Los Angeles. (Photo: M. Pasqualetti.) 21
2.5 Nine million cadmium telluride solar modules now cover part of Carrizo Plain in southern California. The modules are part of Topaz Solar Farm, one of the largest photovoltaic power plants in the world. At 9.5 square miles (25.6 square kilometers), the facility is about one-third the size of Manhattan island, or the equivalent of 4,600 football fi elds. (Photo: Earth Observatory image by Jesse Allen, using EO-1 ALI data provided courtesy of the NASA EO-1 team.) 22
2.6 Parabolic concentrators near Tucson, Arizona. (Photo: M. Pasqualetti.) 23 2.7 H-type Giromill wind turbine. (Photo: Stahlkocher, Wikipedia.) 26 2.8 Lattice being replaced by monopoles near Palm Springs, California. Monopoles are
less intrusive and preferred by the public. They also avoid nesting opportunity for birds. (Photo: M. Pasqualetti.) 27
2.9 Looking west toward San Gorgonio Pass from Edom Hill just after sunrise. Windfarms are about 15 miles distant (oval) and barely noticeable. 50 mm lens. (Photo: M. Pasqualetti.) 28
2.10 Glare off Solnova 1 and 3, two of the parabolic trough plants in operation at the Solucar Solar Complex, Seville, Spain. (Photo: Business Wire.) 35
2.11 Unit #2 at the Ivanpah Central Receiver station. View is toward the east. Ivanpah Dry Lake is in the center of the image. (Photo: R. Sullivan.) 35
3.1 BLM-administered lands with medium or high potential for wind development. (Redrawn by Mark Warfel Jr. and adapted from USDI BLM, 2005, pp. 2–4.) 44
3.2 BLM Final Programatic Environmental Impact Statement on Wind Energy Development. (Source: USDI BLM, 2005, cover.) 45
3.3 BLM PEIS solar exclusion zones. (Redrawn by Mark Warfel Jr. and adapted from USDI BLM executive summary, 2012, p. ES-12.) 46
3.4 Status of BOEM offshore leasing activity. (Redrawn by Mark Warfel Jr. and adapted from Showalter and Bowling, 2011, p. 5.) 49
3.5 US states with renewable portfolio standards or other renewable energy mandates. (Redrawn by Mark Warfel Jr. and adapted from Rabe, 2006, p. 4.) 50
4.1 Examples of windfarms in different European landscapes: (a) is a group of turbines located in western Spain but viewed from a natural park in Portugal – an international visual impact; (b) shows a small group located on the summit of a ridge in Portugal – a typical location which has a high impact from all around; (c) is a scene in eastern Germany where there are many inter-visible groups of turbines into the distance; (d) is an array in the fl at open landscape of the Netherlands. (Photos: Creative Commons.) 79
4.2(a) (a) A windfarm at Ardrossan in Scotland, showing the size of the turbines which dominate an otherwise rather small-scale landscape; (b) an example of an offshore windfarm at Scroby Sands in England which can be seen from the shore but whose scale is not as dominating. (Photos: Creative Commons.) 81
4.3 Wind turbines in Bernberg, East Germany viewed from the train, where, as can be seen, the landscape is dominated by turbines. What is not obvious from the photo is the movement which at this distance can be quite disturbing. The red bands also make the turbines more noticeable. (Photo: S. Bell.) 82
and (b)
(a)–(d)

Illustrations xiii
4.4 A series of photos capturing something of the range of European landscapes showing their diversity and distinct character as long-settled: (a) is a landscape in southern Finland, dominated by forest and lakes but with little relief; (b) is in the Austrian Alps, where alpine pastures lie among the forest; (c) shows vineyards in the Bordeaux region of France, famous for its wines; (d) Northern Portugal is rugged with much planted forest and white-painted houses; (e) the Peloponnese in Greece is mountainous, with isolated villages and terraces of olive and other trees; (f ) is an area in Herefordshire in England, where the strong pattern of enclosed fi elds and nucleated villages is typical of many parts of the countryside. (Photos: S. Bell.) 84
4.5 The urban edge next to heavily urbanized countryside is a common aspect of European, frequently relatively low-rise, cities. There is often little or no separation of one settlement from another in the most densely populated areas. In this example the center of Brussels can be seen from the outskirts. (Photo: S. Bell.) 85
4.6(a) Perception of the size of the turbines varies according to landscape characteristics: (a) shows turbines in a very open landscape with no elements to enable the viewer to judge the size and therefore the scale; (b) is an example where the landscape contains elements which allow the size of the turbines to be assessed and their scale impact evaluated by the viewer. (Source: Caroline Stanton.) 90
4.7 The relationship of turbine scale to the landform: (a) shows a large mountain which dwarfs the size of the turbines and so reduces their visual impact; (b) is a situation where the turbines are a similar size to the mountain; and (c) shows turbines appearing visually dominant in comparison to the mountain. (Source: Caroline Stanton.) 91
4.8 Some aspects of the interaction of turbines with landform: (a) depicts a group of turbines located on the summit of a hill, which are also sub-dominant to its scale; (b) shows a number of turbines whose position does not relate well to landform and which are big enough to dominate it; (c) shows the common problem of turbines sited in hollows being only partly visible and their rotating blades coming and going from view can be very intrusive. (Source: Caroline Stanton.) 92
4.9 The relationship of turbines to the overall pattern of the landscape has visual implications: (a) shows some turbines on part of a fairly simple landscape pattern where they appear fairly neutral; (b) shows the same turbines in a landscape with a stronger pattern where they tend to compete for attention; (c) shows the potential effect of the same type of turbines located in various parts of a landscape where issues of pattern and scale cause a severe visual confl ict. (Source: Caroline Stanton.) 93
4.10 Use of a virtual landscape theatre to show the effects of a development in an interactive way and with turbine rotation. Members of the public can discuss the pros and cons of a specifi c development proposal or of different alternatives. (Photo: Peeter Vassiljev.) 106
5.1 Opposition to wind power in western-most Virginia. (Photo: M. Pasqualetti.) 109 5.2 Opposition to wind power in France. (Photo: Paul Gipe. Used with permission.) 110 5.3 Opposition to solar power in California. (Photo: Miriam Raftery.
www.EastCountyMagazine.org. Used with permission.) 110 5.4 Installed wind capacity in Canada, as of September 2015. (Source: After
Canadian Wind Energy Association. Redrawn by Mark Warfel Jr.) 114
(a)–(f )
and (b)
(a)–(c)
(a)–(c)
(a)–(c)
xiv Illustrations
5.5 Installed wind power capacity in the United States, as of June 30, 2015. (Source: National Renewable Energy Laboratory.) 115
5.6 Installed wind power capacity in Europe through December 2014. (Source: After European Wind Energy Association. Redrawn by Mark Warfel Jr.) 116
5.7 Bonus Anglesey Cemaes wind development in Wales, with Wylfa nuclear power plant in the background. (Photo: Paul Gipe. Used with permission.) 117
5.8 Avoiding the scenic coastal and mountainous areas of the country, wind development in Sweden is more common on farmland, here south of Gothenburg. (Photo: M. Pasqualetti.) 119
5.9 Collocated solar and wind land use in San Gorgonio Pass, near Palm Springs, California. (Photo: M. Pasqualetti.) 127
5.10 Visibility thresholds linked to ratings. (Source: Redrawn by Mark Warfel Jr. from Sullivan et al. 2012a, p. 36.) 133
5.11 Visibility impact range, thresholds and visibility ratings. (Source: Sullivan et al. 2012a, p. 40.) 133
5.12 Glare from the Ivanpah solar installation. View is from the southeast, 30 miles south of Las Vegas, looking northwest from 30,000 feet in a commercial airliner. (Photo: M. Pasqualetti.) 136
6.1 Wind turbines create strong vertical line contrasts in fl at landscapes with strong horizon lines. Dunlap Ranch Wind Energy Project near Medicine Bow, Wyoming. (Credit: Robert Sullivan, Argonne National Laboratory.) 146
6.2 The massive forms of mountain ridges are an important element in this landscape. (Credit: Robert Sullivan, Argonne National Laboratory.) 148
6.3 Refl ections of the sky in this solar parabolic trough facility’s mirrors cause strong color contrast with the surrounding vegetation. Nevada Solar One near Boulder City, Nevada. (Credit: Robert Sullivan, Argonne National Laboratory.) 149
6.4 Schematic diagram of visibility factors (elements are not shown to scale). (Credit: Robert Sullivan, Argonne National Laboratory.) 150
6.5 A passing cloud has shaded the two foreground turbines, causing a dramatic change in apparent color. (Credit: Robert Sullivan, Argonne National Laboratory.) 151
6.6 Two views of the same solar facility from ground-level and elevated viewpoints show increased visual contrast for the elevated view. (Credit: Robert Sullivan, Argonne National Laboratory.) 153
6.7 The background can affect the visibility of lattice transmission towers. (Credit: Robert Sullivan, Argonne National Laboratory.) 154
6.8 White wind turbines visible against a dark ground backdrop. (Credit: Robert Sullivan, Argonne National Laboratory.) 154
6.9 Ancillary structures at a wind energy facility. (Credit: Robert Sullivan, Argonne National Laboratory.) 156
6.10 A wind facility substation. (Credit: Robert Sullivan, Argonne National Laboratory.) 156 6.11 Wind turbines on a mountain ridge in Maine. (Credit: James F. Palmer, Burlington,
Vermont.) 157 6.12 Burbo Bank Offshore Wind Facility in the United Kingdom. (Credit: Robert
Sullivan, Argonne National Laboratory.) 159 6.13 Parallel rows of turbines in an offshore wind facility. An electrical service platform is
visible between the two leftmost rows of turbines. (Credit: Robert Sullivan, Argonne National Laboratory.) 160

Illustrations xv
6.14 Receiver tower and heliostat array of the Ivanpah Solar Electric Generation Facility. The heliostat array is approximately 1.3 mi in diameter. (Credit: Robert Sullivan, Argonne National Laboratory.) 161
6.15 Illuminated receiver tower of a 20-MW power tower facility in Spain. (Credit: Robert Sullivan, Argonne National Laboratory.) 161
6.16 Mirrors of a parabolic trough facility. (Credit: Robert Sullivan, Argonne National Laboratory.) 162
6.17 A parabolic trough facility as seen from an elevated viewpoint 4 miles away. (Credit: Robert Sullivan, Argonne National Laboratory.) 162
6.18 A thin-fi lm PV facility seen from a slightly elevated viewpoint about 2 miles away. (Credit: Robert Sullivan, Argonne National Laboratory.) 163
6.19 PV solar panels convert sunlight directly into electricity. (Credit: Robert Sullivan, Argonne National Laboratory.) 163
6.20 Small (<550 acres) PV arrays (black) and a parabolic trough facility (white) viewed from a mountaintop 10 miles away. (Credit: Robert Sullivan, Argonne National Laboratory.) 165
6.21 Glare spot on parabolic trough facility. (Credit: Robert Sullivan, Argonne National Laboratory.) 165
6.22 Glare from solar power tower, Ivanpah Solar Electric Generating System. Power block visible at base of tower. (Credit: Robert Sullivan, Argonne National Laboratory.) 166
6.23 Concentrating PV facility. (Credit: Robert Sullivan, Argonne National Laboratory.) 167 6.24 Silver State North Thin-fi lm PV Facility from near I-15. (Credit: Robert Sullivan,
Argonne National Laboratory.) 169 6.25 ISEGS facility from I-15. (Credit: Robert Sullivan, Argonne National Laboratory.) 169 6.26 Vapor rising from cooling towers in a dry steam plant at the Geysers, 50 miles north of
Napa, California. (Credit: U.S. Geological Survey.) 171 6.27 Primary transmission tower types. Note vehicles and person at base of towers for
scale purposes. (Credit: Robert Sullivan, Argonne National Laboratory.) 172 6.28 Skylining makes these 500-kV lattice towers visible at 8 miles.
(Credit: Robert Sullivan, Argonne National Laboratory.) 173 6.29 Cleared ROWs in forested areas can be visible for very long distances. (Credit: BLM.) 174 7.1 The Daggett area along Historic Route 66 in California has been identifi ed in
Scenic Byway plans as a place where renewable energy development should be permitted because it has already disturbed land. Other much more pristine areas to the east will receive a higher level of protection from development. (Photo: Dean Apostol.) 184
7.2 Using local topography to screen wind turbines from a KOP. (Image courtesy of BLM.) 184
7.3 Examples of visual order in turbine layout: (a) visual order, but still interfering with agreeable mountain scenery; (b) visual order by clustering turbines. (Photos: Martin Pasqualetti and Dean Apostol.) 186
7.4 Turbines framed by landforms at Tehachapi Pass, California. (Photo: John McCarty.) 187 7.5 Nevada Solar One parabolic trough facility partly screened by a low hill.
(Photo: Robert Sullivan, Argonne National Laboratory.) 189 7.6 Panorama from Joshua Tree National Park. The dark horizontal stripe in the center of
the photo is a very large PV array. (Photo: Mark Meyer, US National Park Service.) 190
(a)–(b)

xvi Illustrations
7.7 Color was used on the back of these collectors at Nevada Solar One to reduce contrast from a distance. (Photo: John McCarty.) 190
8.1 Visual Impact Assessment framework. 200 8.2 Five-step Cape Cod Commission VIA process. (Rooney et al., 2012). 208 8.3 Criteria for determining impact signifi cance. 214 9.1 Photomontage production process.
(Credit: Robert Sullivan, Argonne National Laboratory.) 228 10.1 It is common for citizen opposition groups to use social media to share dark
humor about the consequences of large renewable energy projects. (Source: Basin and Range Watch.) 246
10.2 Middlegrunden wind turbine arc array near Copenhagen, Denmark. ( Source: Photo is public domain, through Wikipedia: https://commons.wikimedia.org/wiki/File:DanishWindTurbines.jpg) 247
10.3 Three-phase scenario development process. (Source: Pond et al., 2010, p. 5.) 250 10.4 Three-step cumulative assessment process. The “ LPA” is a local planning authority.
(Source: White Consultants, 2013, p. 6.) 252 10.5 Overall fl ow chart of cumulative assessment . (Source: White Consultants, 2013, p. 25 . ) 253 11.1 Solar sharing in Germany. Panels make electricity while allowing animal grazing.
Near Saarbrucken. (Photo: M. Pasqualetti.) 262 11.2 Wind sharing in Illinois. Wind turbines and farming coexist near Dillon.
(Photo: M. Pasqualetti.) 262
TABLES
2.1 Wind controversy case studies in the US ( Source: www.macalester.edu/windenergy/casestudies/casehome.html) 29
3.1 US state renewable energy policy guidance, incentives, authority and siting guidance 51 3.2 Canadian provincial renewable energy policy, incentives, authority and guidance 59 3.3 Wind energy by Australian state (Source: Wind and total energy production fi gures
from the Bureau of Resources and Energy Economics; installed and approved capacities from diverse online sources including Wikipedia.) 62
4.1 Strength of degree of public control over land use change policies, 7 being the highest and 1 the lowest (Source: Piorr et al , 2011.) 83
4.2 Factors contributing to the sensitivity of the landscape 97 4.3 Factors affecting visual sensitivity 100 4.4 Criteria used to assess the magnitude of the landscape effect 101 4.5 Defi nition of the degrees of signifi cance of the landscape effect 101 4.6 Assessment of signifi cance of landscape and visual effects 102 4.7 Criteria used to assess the magnitude of the visual effect 102 4.8 Factors that affect apparent magnitude 103 4.9 Criteria used to assess the signifi cance of the visual effect 103 4.10 Assessment of signifi cance of visual effects 103 5.1 General public reactions to renewable energy 111 5.2 Social-cultural attitudes and renewable acceptance 121 5.3 Socio-cultural factors affecting land-based wind development 123 5.4 Socio-cultural factors affecting offshore wind development 125 5.5 Socio-cultural factors affecting commercial solar development 128

Illustrations xvii
5.6 Socio-cultural factors affecting commercial geothermal development 130 5.7 Visibility level rating descriptions (Source: Sullivan et al. 2012a, p. 17.) 132 8.1 The Thomas and Sinclair-Thomas Matrices to estimate the potential visual impact
of different sizes of wind turbines ( Source : Campaign for the Protection of Rural Wales (1999).) 205
8.2 The attributes of observer perception and sensitivity to change 210 8.3 How criterion affects the strength of impact as measured by Hedges’ g 211 10.1 Summary of stakeholder consultation and statutory processes
(Source: BWEA, 2002, p. 11.) 244
FOREWORD
Dean Apostol and Martin Pasqualetti
This book results from a collaboration that began in 2012 during planning for a special symposium on visual impact assessments at the meeting of the National Association of Environmental Profession-als. Several of us discussed the possibility that, if we could assemble the right group, we could create a timely book that would look toward a future that was fast approaching, a future when renewable energy would be appreciably replacing conventional energy.
As we were assembling our team and getting started, we took note that the United Nations was thinking along complementary lines. After years of negotiations among 193 countries, the climate con-ference scheduled in Paris at the end of 2015 (COP21, as we went to press) would likely be a turning point in the emerging global emphasis on renewable energy. The UN planned to showcase a “renew-able energy track” that would demonstrate that the accelerated development of renewable energy would be the fastest, cleanest, most reliable and most economically benefi cial way to meet climate goals. 1 The book that you hold in your hands, while the result of an idea hatched in 2012, supports the prediction of the United Nations in 2015. It refl ects our collective determination to preserve scenic quality in valued landscapes while the world makes this necessary transition.
The fi eld of visual and scenic resources, as noted in Chapter 2, has developed over many years, yet reached something of a stalled point in the 1990s, at least in the US, when federal agencies that had been crucial in nurturing the fi eld began laying off or reassigning landscape architects. This was partly a consequence of budget cutting, but it also resulted from a decrease in the types of projects that threatened scenic values, especially on Forest Service lands when the annual timber harvest quotas were signifi cantly reduced to protect a wide variety of wildlife.
Well before the turn of the twenty-fi rst century the renewable energy movement had taken hold, and very large projects were proposed. This was particularly true of wind and solar development on lands managed by the US Bureau of Land Management, but it was also increasingly common on non-federal lands across much of the United States and elsewhere. A spate of policy shifts – including tax credits to energy developers, plus the rising concern over climate change helped drive this development forward.
A number of us with long experience working on scenic resource conservation were involved in this effort, either on the side of developers trying to address impacts on scenery, or on the side of opponents
Foreword xix
who resisted these changes, or in some cases as consultants to the regulators who had to develop policies that addressed both camps.
We found that prior ideas about scenic resources were diffi cult to apply to renewable energy. The facilities were so large, and their appearance so inherently contrasting, that the normal rules and miti-gation techniques seemed ill suited. We witnessed proposals that claimed there would be no visual impact because turbines were to be fi ve miles or more distant, previously considered “background” in visual resource impact assessment. Yet the scale, bright color, motion and lighting often made turbines high contrast even at these distances. Entire landscapes were transformed from undeveloped and open into new energy landscapes with dozens or even hundreds of gleaming white turbines set on ridges or covering plains.
The sheer scale and the wide geographic range of these facilities made them unlike anything in our prior experience. We realized it was more on the order of the interstate highway system; that is, a trans-formation that would change the very character of much of the country and developed world. It was apparent that this shift needed more attention before it had progressed too far.
We were fortunate that some of the pioneers of visual resources were delivering papers at the sym-posium. One by one we discussed our ideas, and a number eagerly signed up to make our initial idea a reality.
Our sincere hope is that this book will fi nd its way into the hands of practitioners, regulators, and developers who together are reshaping landscapes in countries all around the world. We also see it as a good tool for communities faced with the prospect of their surroundings being transformed by energy projects. A lot is at stake if we are going to retain landscape quality, and we hope we can help meet this challenge. Renewable energy, even with all its promise of helping us create a more sustainable future, should not simply be developed wherever the wind blows or the sun shines. We believe this book will help us avoid placing renewable energy where it should not be, while also helping it “grace” the land-scape where it should be.
Note
1 From a press release issued by IRENA. http://irenanewsroom.org/2015/07/15/retrack-at-cop21/

PREFACE
Ian Bishop
I am writing in a train – on a four-hour journey. I make this trip quite often – sometimes by car and often by train. The landscape is familiar, sometimes too familiar, and one looks for changes. I’ve been thinking about, and doing research on, wind turbines in the landscape for over ten years, but it is only in the last few years that I began to think about the cumulative effect that will be the consequence of a rapid expansion of renewable energy capacity.
Journeys have been a part of our life and culture for millennia – at least since Odysseus. Travel has been epitomized in the USA by the road movie and for many years families have enjoyed a sum-mer pilgrimage to the west or to the Keys. Chapter 1 of this volume paints a vivid picture of a road trip through American landscapes doing a new job. For millennia we have tamed our landscapes for habitation and food production. In isolated areas we have dug great holes or built huge dams to sup-port energy and mineral needs. Now we need to use the landscape for energy in a new way. The new infrastructure will be more visible – but more revocable, less isolated – but less damaging, than the old. On my four-hour journey I may, before too many years have passed, have wind turbines in my line of sight for 30 percent of the time. If I travelled in a different direction, to windier places, it might be 60 percent (Bishop, 2015).
Such radical change is going to meet opposition. In my country the Prime Minister called wind turbines ‘visually awful’, and our Treasurer said they are ‘utterly offensive’, fuelling the arguments of those who may support renewable energy in principle – as long as its somewhere else. It is therefore extremely timely for a book to emerge that encapsulates our knowledge and current thinking about the visual impacts of renewable energy infrastructure – especially wind energy as the public encapsulation of the alternative to fossil fuels.
As Chapter 1 also makes clear, we have to consider the visual impact of the alternatives. Carry on along our pathway of the last 150 years and we are also very likely to see radical changes in our landscape, not only visually but also in terms of both ecological and agricultural productivity. A comprehensive assessment must consider all options and all kinds of effects on the economic, social and environmental fabric. There is scope for several books, but the visual effects of the renewable options is a necessary component and one for which the authors and editors of this volume are very well equipped.
Planning for a future that involves radical changes to our view of the world requires skills and pro-cesses from multiple disciplines. A combination of natural and social sciences, engineering, planning

Preface xxi
and design, supported by effective visualization and communication are essential in support of reasoned public debate and sound decision-making within an appropriate regulatory framework.
Central to all this is the recognition that visual impacts are a tractable issue, made much easier by the similarity of view that people have about what makes a landscape beautiful, and (to a lesser extent) the ways in which infrastructure can detract from this beauty. This makes the type of analysis reviewed in Chapter 2, and described in more detail in Chapters 6, 7 and 8, both possible and meaningful. Over the years the developed theory and analytical techniques have been applied to landscapes at a wide range of scales. The difference now is that the size of area to be considered may be much more than can be encompassed in a single view. We need to be more aware of cumulative visual effects experienced through movement.
While people move they also typically have somewhere to call home. No more is it just one’s home that is one’s castle, it is the greater environs, the ‘backyard’, that people seek to project and keep in some idealized state. There is debate in the literature about whether NIMBY movements are really narrow-minded or tend also to take in the bigger picture, whether their complaints are against the pro-cess or the outcomes. Whatever the case, we need to be very aware of the potential trade-off between local loss and wider national or global benefi t. There is a rich body of relevant research and experience from parts of Europe, where renewable energy infrastructure is already ubiquitous, which is the basis of Chapter 5.
What constitutes best practice in the planning for, and design of, windfarms, large-scale solar proj-ects, and other renewable energy development is still an open question. What is clear is that an adver-sarial paradigm in which one party proposes and another opposes is not in anyone’s interest. In Chapter 10 a number of case studies are reviewed in the expectation that lessons can be learned, by all parties, about developers and communities working together. These discussions need, of course, to be about more than just visual effects – although that is often the starting point. Just as research, and acceptance of research, on the visual component is central to this volume, other factors need their own rigorous review and establishment of best practice.
Returning to the visual, there is a solid base of empirical information about people and their land-scape response, and a more specialized body of research on the visual impacts of wind energy, but there remain unanswered questions that require more research. As that body of knowledge develops we should continue to apply best information and best practice to the emerging energy landscape. We should be wise in recognizing that these decisions cannot be considered in isolation of a bigger picture, and we should not fear this future but should be prepared for it and recognize that it may require us all to shift our perspectives on landscape qualities. This book can only help with that process.
Reference
Bishop, I. D. (2015) Sequential experiences in energy producing landscapes, in C. Nunes Silva (ed.) Emerging Issues, Challenges and Opportunities in Urban E-Planning , IGI Global, Hershey, PA.
ACKNOWLEDGEMENTS
This book has resulted from a number of years of development, research and application. The authors and contributors cannot claim it entirely as our project, since we learned our craft from others, and have had many collaborators along the course of our careers that led us to this project. We acknowl-edge many of the landscape practitioners and educators that have contributed to the foundation of knowledge regarding landscape assessment, visual resource management, and impact assessment for the past thirty-fi ve years. This list includes Professor Donald Appleyard, R. Burton Litton Jr. (former US Forest Service LA), Professor Kenneth Craik, Professor Julius Fabos, Professor John Felleman, Grant Jones ( Jones & Jones), Bob Leopold (former BLM head LA), Professor Merlyn Paulson, Professor Angel Ramos (Spain), Robert Ross (former BLM head LA), Professor Sally Schauman (former NRCS LA), Professor Stephen R. J. Sheppard, Professor Carl Steinitz, Ed Stone (former US Forest Service head LA), Professor Joanne Vining, William Yeomans (former British Columbia Forest Service LA) and Professor Ervin Zube. Hopefully we have built well upon this foundation and so honored their past contributions. We also acknowledge the members of the Scenic Resources Working Group established after the 2012 NEAP Visual Impact Assessment (VIA) short course who strive to increase the calibre of VIA practice. Our individual and collective debt of gratitude is substantial.
Dean Apostol offers thanks to MIG Inc., which provided him a platform for professional practice and initial support in allowing him to use precious time to develop ideas for this book and get it started. He thanks his clients who provided him opportunities to apply his expertise to visual resource proj-ects, including Friends of the Columbia River Gorge, Portland General Electric, Oregon Department of Transportation, the Bureau of Land Management, Peter Goldman of the Washington Forest Law Center, and Oregon Energy Department. Dean thanks his former colleagues at the US Forest Service who taught him the trade of scenic resource management. In particular Warren Bacon, a pioneer of scenic resources provided early training and encouragement. Robert Ribe, University of Oregon has been a close colleague of Dean’s who has been a frequent collaborator and has demonstrated the value of research on the fi eld of landscape aesthetics. Stephen Sheppard of University of British Columbia is also engaged in important research and has been an inspiration and occasional colleague. Many thanks of course to Dean’s life partner Marcia Sinclair, who has put up with an idiosyncratic partner who wanders off on poorly paid projects and fails to fi nish household projects in a timely way.

Acknowledgements xxiii
Bob Sullivan would fi rst like to thank his mother, Elizabeth J. Sullivan for telling him the names of all the fl owers in the garden, and for letting him skip school sometimes to spend the day at science and art museums. Thanks also to Professor Brian Orland for fi rst introducing Bob to the scientifi c study of landscape aesthetics, and to John McCarty, Tom and Sherry Lahti, and Ray Brady of the BLM, for opening doors, offering encouragement, and reviewing numerous lengthy visual resource reports. Bob would also like to thank Carol McCoy of the National Park Service, whose vision and leadership has allowed Bob to pursue the most rewarding work of his career, and for the best of causes. Bob is also grateful for the opportunity to work with Mark Meyer of the National Park Service, with whom Bob has visited some of the most spectacular landscapes in our beautiful country. Bob would also like to express his gratitude to his co-editors, Dean, Rick, Mike and Jim, for their patience with the ‘newbie’ editor, and for all that Bob has learned from them about landscapes. Finally, and most importantly, Bob would like to thank his wife Susan who has patiently endured thirty years of Bob complaining either about not having enough work, or more often, having too much.


1 INTRODUCTION TO THE CHANGING LANDSCAPES OF RENEWABLE ENERGY
Dean Apostol, James Palmer, Martin Pasqualetti, Richard Smardon, and Robert Sullivan
Highlights
• Provides an overview of scenic challenges presented by renewable energy. • Illustrates that different renewable energy types have different impacts. • Summarizes themes presented in following chapters.
Lester Brown’s new book (2015) The Great Transition: Shifting from Fossil Fuels to Solar and Wind Energy promotes the ‘solar revolution’ in residential and commercial land use in the US, Canada, Italy, Germany, China and Australia. It also presents the “age of wind” as it is occurring in China, UK, Italy, France, Canada, Demark, Germany, Portugal and Massachusetts. And it discusses the potential for tapping the Earth’s heat (geothermal energy) in Chile, Peru, Columbia, Japan, China, Philippines, Indonesia, the Great Rift Valley in Africa, the Eastern Mediterranean, and of course, Iceland, where geothermal energy is already highly developed.
Brown makes a strong case for how the world is now making a signifi cant shift to renewable energy and why this is important, but he avoids the signifi cant and growing controversy over locating utility scale renewable energy facilities in visually sensitive landscapes. These may be highly valued nationally for their scenic qualities (i.e. a national park), or may have local importance that generates resistance to signifi cant changes in landscape and community, such as the everyday pastoral or historic settings near our homes.
While the authors support the trend away from fossil fuels and to renewable energy, our work in landscape and scenic conservation over many years has directed us to the subject of how our world can develop renewable energy while at the same time conserving what we value in our landscapes. This book represents our attempt at addressing this issue as it is being experienced around much of the world, with special attention to North America, Europe and Oceania. We offer both analysis of the challenge, and proposed approaches and solutions that should be useful to energy developers, regulators, and com-munities where renewable energy is being contemplated.

2 All editors
1.1 Driving across America in the year 2030
Picture a road trip across the United States in the year 2030. We begin at the coast of Maine and journey across the Appalachians through the mid-section of the country to the West Coast. Off in the distance near Mohegan Island a cluster of fl oating wind turbines punctures the horizon. Closer to shore other groupings appear on some of the small islands in Penobscot Bay. They dwarf the quaint fi shermen homes and villages. If you continued along the coastal highway and side trip to the beaches, you would see wind turbines offshore all the way south past the Carolinas. If instead you turned inland and head west or southwest, your encounters would be fewer and more widely spaced, with turbines appearing intermittently on ridgelines of Maine, New Hampshire, Vermont, Pennsylvania, and West Virginia. In addition, many small rural community fi elds are covered by arrays of photovoltaic panels, perhaps 10 to 30 acres each in size. These may coexist with sheep grazing in or near them.
Somewhere not too far from Cleveland, fi elds of turbines would be more frequently in view. There will be many on or along Lake Erie, and near Sandusky or Lorain, a distance of 10 to 15 miles north of the Interstate 90. If you continue through Indiana, near South Bend and Elkhart there will be evenly spaced grids of turbines right alongside the freeway. South of Joliet, Illinois, these will grow more frequent and densely spaced, and may extend to the horizon in any direction. By the time you reach Marshalltown, Iowa, wind turbines will have been near-constant roadside companions. It’s likely that you will now have giant wind turbines in view for the rest of your journey across the prairies and plains, through Wyoming if you stay north, or if you turn Southwest, through eastern Colorado and north Texas into New Mexico and especially in California at either Tehachapi Pass or San Gorgonio Pass near Palm Springs.
FIGURE 1.1 Wind turbines integrated into ranchland, near Rio Vista, Solano County, California.(Photo: M. Pasqualetti.)

Introduction 3
You may have a visual respite from turbines if you wind across the Rockies and out into the Western deserts and Ranges, but instead will encounter the eerily glowing towers of concentrated solar power plants, easily visible at 20 or more miles distant. If your route takes you northwest on I-84, you will see wind turbines in Idaho intermittently along the Snake River Plain. And if you stay on I-84 through Oregon, you will encounter wind turbines for much of the 250-mile (417-kilometer) ride from the eastern boundary of the state to the edge of the Columbia Gorge National Scenic Area. Traveling through the Gorge, if you look up at surrounding ridges only 2 or 3 miles from the Interstate you may see yet more turbines crowding the boundaries of the designated scenic area. You will get another turbine break as you pass through Portland, which is where I-84 ends (we hope you stopped for micro brew or some Northwest cuisine, or whatever gluten-free food people are eating and drinking in 2030). If you continue across the northern Willamette Valley west to the Oregon coast, you will see turbines again once you are most of the way through the Coast Range. The fi rst line of mountains in from the sea will have had the ridgeline partly shorn of forest to make way for more turbines. And of course you will likely see turbines out in the ocean, along with large yellow wave buoys, lights blinking to the watery horizon. The wave buoys in particular may be very close to the beaches that Governor Oswald West declared to be public in the 1890s.
If, instead of taking I-84, you had followed I-80 through Utah to California, you would encounter neat rows of turbines, possibly with solar panels under them, all through the Great Salt Lake Desert. In Nevada the wind resource is intermittent, although geothermal development is prominent. You will likely encounter massive solar projects on the valley fl oors, partially powering the Tesla battery factory
FIGURE 1.2 Wind turbines adjacent to pre-existing residence, San Gorgonio Pass, California.(Photo: M. Pasqualetti.)

FIGURE 1.3 Cluttered energy facilities at San Gorgonio Pass – transmission lines, wind turbines, solar panels, and a gas-fi red generating station, with Desert Hot Springs, California in the background.(Photo: M. Pasqualetti.)
FIGURE 1.4 A landscape in transition. New wind turbines in a legacy oil fi eld. Forty miles north of Dallas-Ft Worth, this is Wolf Ridge, Texas.(Photo: M. Pasqualetti.)
Introduction 5
and the electric cars once they are on the road (we hope the price has come down by then). These large solar developments will accompany you through the Mojave Desert if you head south or southwest. Alternatively, if you traveled north or south to transect the Great Plains, what had once been empty grassland now has tall turbines in view much of the way from Texas to the Canadian border and beyond (along with a few remaining tired oil wells of course).
Connecting all this new, renewable, clean energy will require thousands of miles of new above-ground high-voltage transmission lines, running north-south and east-west across many if not most states, transporting electricity from areas of sparse population to large urban areas. Similar future stories can be imagined for journeys across Europe, Australia, China, and Canada.
How much land will all these renewable energy facilities require? A lot. According to research from the National Renewable Energy Lab, a division of the US Department of Energy, a 50 megawatt (MW) commercial wind project needs a dedicated perimeter of about 1,000 hectares (2,500 acres) of land area (Denholm et al. 2009). As of this writing, larger windfarms approved for development in the US have 1,000 or more turbines occupying more than 20,000 hectares (50,000 acres) of land.
Although these numbers may indeed seem large, there are some important caveats to consider. The wind support structures require only a small amount of the land, and other land uses, such as agriculture, can co-exist if care is taken during construction to minimize ground disturbance. Economically, this can be a win-win since the owners also get rent or a share of the energy value produced while they continue
FIGURE 1.5 Visual impacts can also be signifi cant from the transmission needed to carry the electricity gener-ated by renewable energy.(Photo: M. Pasqualetti.)

6 All editors
FIGURE 1.6 Dixon, Illinois farm growing maize and soybeans. The wind turbine array has little effect on the agriculture and more than doubles the income from the land.(Photo: M. Pasqualetti.)
farming. As an example, a farmer in Dixon, Illinois (see Figure 1.6) reported that he made more from the turbines per year than from his soybeans and corn. This is also reportedly the case for wheat farmers in the Columbia Basin of Oregon and Washington.
But a key reason the turbines and commercial solar plants will be so visible in the future, so much a part of the landscape, is that these forms of energy require such large areas of land. To generate enough wind energy to provide 20 percent of US electricity by the year 2030, the amount of land required adds up to around 6 million hectares, equal to the entire state of West Virginia. Adding 16 kilometers around each project, and considering the number of turbines required, increases the potentially visually impacted area to nearly half the size of the continental United States. How much area ultimately is visu-ally impacted depends on a range of factors, including terrain and how turbines are spaced. But there is little question that views of turbines will be a lot more common than they are at this writing, when renewable energy provides only a small fraction of energy in most nations.
One strategy for reducing visual impacts on land is locating wind turbines offshore. Sea-based tur-bines are generally more expensive to install, but often require less surface area since winds over the water are consistently stronger and steadier, resulting in fewer total turbines needed to generate a given amount of electricity. In most cases, offshore turbines will be placed close enough to shore to be seen by coastal visitors because mounting them on the sea fl oor in shallow waters is less costly than fl oating turbines in deeper waters. The visual impact of offshore turbines depends on many factors, including their size, the angle of the sun, and the elevation of the viewer on shore. Turbines can be visible to the unaided eye at distances greater than 40 kilometers (Bishop 2002; Bishop & Miller 2007). At a distance

Introduction 7
of 16 kilometers they can be a major focus of visual attention, a common threshold distance for judging visual impacts (Sullivan et al. 2013)).
As we go to press, the US Bureau of Ocean Energy Management (BOEM) is leasing hundreds of thousands of hectares of ocean for wind energy development on the east coast of the US, and is attempt-ing to develop pilot projects in deep waters off the west coast. Meanwhile Europe has already developed substantial offshore wind energy, its fi rst project dating from 1991 in Denmark. Worldwide, the Wind Power database lists over 700 offshore wind projects either in planning, production or operation as of this writing (mid 2015), and some are very large, as are the installations in the Thames estuary. 1
Commercial scale solar energy also requires large land areas, as sunlight, like wind is a low-density source of energy. According to estimates by the Bureau of Land Management (BLM), a commercial solar facility located in the desert southwest needs about 4 hectares (10 acres) for every megawatt of pro-duction from photovoltaic panels. Thus, in order to reach a 20 percent electrical generation threshold, the US could need to dedicate 1.2 million hectares (3 million acres) of land to solar energy. (When the entire fuel cycle is considered, this amount of land is comparable to what is required for coal.) The issue from a scenic impact perspective is that, in the case of solar, all the land impact is in one place instead of being widely distributed.
FIGURE 1.7 Nysted Wind Facility, 8–12 miles (13–20 kilometers) offshore, Denmark, the North Sea.(Photo: National Renewable Energy Laboratory.)

8 All editors
As with wind projects, signifi cant visual impacts can extend 40 or more kilometers for some types of solar energy, such as power towers. However, photovoltaic (PV) installations, even large ones such as the 500 MW facility near Desert Center, California, can have low visual contrast and appear as shad-ows or bodies of water from a distance. Because PV panels are low to the ground, visibility is highly dependent on the elevation of the viewer and the surrounding terrain (Sullivan et al. 2012; Sullivan & Abplanalp 2012, 2015).
The potential near future of landscapes and seascapes in the US is for renewable energy installations stretching from sea to shining sea and then some. Similar pictures can be painted for much of Canada, Europe, North Africa, China and Australia. The Renewable Energy Age has dawned, and it will reshape the landscape around us. If the world is going to slow, stabilize, and hopefully reverse climate change, extensive development of new energy sources is inevitable and, arguably, both necessary and desirable. But as nations continue to plan for and deploy these clean energy devices, how can they best avoid major regional- and national-scale impacts to landscapes? Can they avoid turning highly valued scenic landscapes into industrial scale energy harvest landscapes?
1.2 The challenge
Many landscapes and seascapes around the world are highly valued for their natural and/or cultural sce-nic features, and have been granted some form of protected status refl ecting this value. Some examples include: UNESCO World Heritage landscapes, National, Provincial, and State Parks, Wilderness Areas,
FIGURE 1.8 Recreational beach at Carpentaria, California with offshore oil rigs at 15 miles.(Photo: M. Pasqualetti.)

Introduction 9
National Scenic Areas, Wild and Scenic Rivers, National Seashores, and Historic Landmarks. Other landscapes have local or regional recognition as being scenically or culturally important, but are not offi cially protected. Scenic Byways and designated tourist routes come to mind. Still other areas have no offi cial recognition at all, but have scenic characteristics, openness, interesting topography, mosaics of farms and woodlands, that many or most people would likely fi nd appealing and worthy of conservation at some level, if only local. However, the issue of conservation of these lands often does not arise until a large energy project is proposed that threatens the resource, and by then it is often too late.
Commercial scale renewable energy, particularly wind turbines and large solar arrays, have already encroached on protected scenic and cultural landscapes. Wind turbines press up against the Columbia Gorge National Scenic Area in Oregon and Washington states. The proposed (but as yet not built) Cape Wind in Nantucket Sound has been highly controversial on scenic impact grounds and permits have been held up for years (Rooney et al. 2012; Williams & Whitcomb 2007). The US Bureau for Ocean Energy Management is presently identifying leasing tracts for offshore wind projects from Beaufort to Nags Head, North Carolina, a distance of over 100 nautical miles that parallels the Outer Banks, including the Cape Hatteras National Seashore. They are also identifying leasing tracts off Massachusetts, Virginia, New Jersey and Rhode Island. Texas is planning windfarms directly adjacent to Padre Islands National Seashore. There are proposals for offshore wind in Oregon, near scenic headlands south of Coos Bay.
Large solar arrays are being developed adjacent to Joshua Tree National Park and Mojave National Preserve, as well as various National Historic Trails. Wind and solar facilities encroach on Native American cultural sites in Southern California. In the UK, dozens of offshore windfarms are visible from scenic areas, and wind energy is being pushed ever farther offshore to avoid impacts (Hill et al. 2001). Onshore wind facilities in the UK are routinely subject to fi erce opposition based on potential scenic impacts. Germany and the Netherlands have experienced increasing opposition to local wind projects (Sellman 2010). Many additional examples of opposition building can be found.
The authors have encountered a number of challenges that the existing scenic resource conservation toolbox may be insuffi ciently equipped to handle. These challenges include:
• The sheer scale of renewable energy harvest systems . Both solar and wind facilities may include towers 500 feet or more in height, and highly refl ective industrial devices spread over thousands of acres of rural or semi-wild land, visible from tens of kilometers distance. Very little in past scenic resource management has prepared regulators and professionals in the scenic resource fi eld for the scale and visibility of renewable energy facilities.
• Seascapes and ocean views . Up until now, with the exception of oil platforms in a few areas, there has been little placement of industrial facilities in our near-shore ocean environment. Most scenic assessment experience has thus been with landscapes, not seascapes, where topography, vegetation, and other mitigating visual factors are not found.
• The dynamic visual qualities of renewable energy . Blades turn, lights fl ash on and off, wave buoys bob up and down, and solar glare changes intensity and direction with the course of the sun across the sky. These all challenge the usual approaches to visualizing and measuring impacts, including simulation technology.
• Lack of meaningful mitigation measures . Reducing or mitigating the impacts of hundreds of white tow-ers, each over 500 feet tall, or massive arrays of highly refl ective mirrors placed in what had been an undeveloped landscape with few or no signs of human impact, is very challenging. There are very few reliable ways to lessen these impacts.
• Lack of relevant landscape perception studies . Scenic resource management over the last few decades has focused primarily on landscape changes from forestry, transmission lines, and highways. Research

10 All editors
was able to tease out the degree of change that would be acceptable to most people, largely by using various visual preference rating systems and surveys. But up until recently there have been few perception studies on renewable energy systems. We do not yet know the extent to which people view renewable energy through the fi lter of their bias on energy policy (i.e. clean = good, global warming = hoax).
• Lack of an integrated policy framework . In the US, federal and state policies have focused on facilitating rapid deployment of renewable energy as it becomes technically and fi nancially feasible. But the present regulatory infrastructure is not designed to manage the visual impacts of this development. The federal government can and does limit direct impacts to national parks, forests, and other public lands. States protect some limited areas but tend to leave land use rules and decisions to local authorities. Yet rural counties, where most renewable energy development will take place, especially east of the Rocky Mountains, rarely have any ordinances that deal with scenic impacts.
• Night sky visual impacts . Because of the height of wind turbines and solar towers, they must be lit day and night to help pilots avoid crashing planes into them. Valued dark, starlit skies in remote, previously undeveloped deserts and grasslands are at risk from thousands of blinking lights spreading as far as the eye can see. This is a problem that is new to scenic resource management, one that is diffi cult to evaluate impacts to night skies.
This book includes the thoughts and experience of leading experts on scenic conservation. We have striven to address the main issues renewable energy development presents to our visual environment. Our expertise and focus is primarily on North America, with excursions to Europe, and Australia, but we believe these issues will eventually also apply in Asia, Africa, the Pacifi c Island states, and Latin America as well. We do not pretend to have all the answers, but believe we have identifi ed the most pressing questions, and have identifi ed a number of technically defensible and widely applicable solu-tions. These solutions include avoidance, good design, and mitigation, described in Chapters 7 and 8. We have summarized the state of the art of scenic landscape assessment and conservation, and how this knowledge can be applied to renewable energy.
Some caveats are important to note. Given the magnitude of the challenge, we know that every scenic landscape cannot be preserved in its current state. In fact this is true whether or not renew-able energy is developed as extensively as it appears it will be. All landscapes change, often too slowly to notice at fi rst. But if nothing, or not enough is done to limit climate change, many highly valued parks, cultural landscapes, and even remote wilderness areas will transform beyond recognition, perhaps within the lifetimes of many readers, if not we aging authors.
According to climate modeling, ecosystem changes resulting from climate change will shift species and change entire plant assemblages (Kliejunas et al. 2008). Many forests will be stressed, plant diseases will spread, wildfi res will increase in size and intensity, glaciers will continue to shrink, and rivers may dry up. As we write this, California is in the fourth year of a severe drought that may have initiated irreversible changes to foothill woodland and forest ecosystems (Tansey 2015). 2 Thus preserving valued scenery must not mean fi ghting against renewable energy altogether. It cannot even mean signifi cantly impeding its development by over-arguing or exaggerating scenic impacts. It has to mean fi nding ways to identify the most important landscapes and making sure these are protected, not just to their bound-aries, but taking account of what we call “the viewshed,” or “zone of visual infl uence.” And it should mean limiting impacts in landscapes of lesser importance, but still valued for their aesthetics. In essence, the need is to determine the right and wrong places for renewable energy development, encourage development only in the “right places,” and then to use design and mitigation to reduce scenic impacts wherever renewable energy facilities are sited.
Introduction 11
While many valued landscapes and seascapes will no doubt be impacted visually, the authors believe there are ways to lessen these by designing energy facilities to better harmonize with their surroundings, by limiting the number of devices in a given area, or in some cases by adjusting our aesthetic expecta-tions to include renewable energy as a new cultural feature (Sellman 2010; Sheppard 2012).
The chief concern that led us to dedicate the time to research and write this book is that renewable energy development is proceeding at such a rapid pace and has an unprecedented potential to change our surroundings. This is happening in the absence of a suffi cient regulatory or analysis framework to address impacts related to scenic resources. While we do not mean to suggest that other impacts, most notably to wildlife, are any less of a concern, we do believe that landscape aesthetic impacts need to be addressed on their own merit, as well as within the context of a more comprehensive environmental analysis at both the individual project and cumulative scales.
There are multiple facets to this issue, and this book tries to address all of the most important ones. Part One lays the groundwork by offering a broad survey of the fi eld of visual and scenic resource assessment, and how this applies to renewable energy.
Chapter 2 is for readers who may have little knowledge of or experience in the fi eld of scenic conser-vation, and may falsely assume that scenery is simply “in the eye of the beholder” and lacks measurable objective criteria. This is not the case. The study of landscape scenery and human perceptions of it goes back very far; with roots in garden art thousands of years ago.
Beginning primarily in the 1960s, landscape architects in the UK, US, Canada, and Australia began developing the modern system of scenic resource assessment, which later became folded into envi-ronmental impact analysis (Smardon et al. 1986). This has become a largely objective, technical fi eld, albeit with some subjective judgment applied strategically. These systems are rooted in a deeper history of aesthetics, including both cultural (art) and scientifi c analysis that shed light on how people view landscapes and why. Though imperfect, they provide a good basis for understanding scenery and scenic impacts.
Chapter 3 summarizes the regulatory and legal framework and tools that apply to scenic resource conservation for siting renewable energy facilities for the US, Canada, and Australia. We fi nd that this framework is highly variable, from careful pre-consideration of land suitability for renewable energy at the federal US level, to a near absence of regulations at many local levels. We term this a regulatory mess, and hope regulators can fi nd places to improve by emulating the more successful examples.
Chapter 4 covers the European experience in managing scenic impacts from renewable energy, with an emphasis on the British Isles. Given Europe’s more dense population, richness of cultural landscapes, and rapid deployment of renewable energy, especially wind, our contributors provide an overview of approaches, including case studies and how Europeans are adjusting to an emerging renewable energy landscape.
Chapter 5 focuses on social acceptability of commercial scale renewable energy from an aesthetic perspective. It discusses the paradox of general support for renewable energy, but resistance in “my back yard” largely due to aesthetics. Opinion surveys are reviewed as a very important component of scenic management, including information from recent surveys on public perceptions regarding renewable energy development in multiple nations.
Part Two shifts the focus to the toolbox of scenic conservation and how it applies to renewable energy.
Chapter 6 discusses the visual characteristics of renewable energy facilities: their size, unique visual features, visibility from varying distances, and the degree of visual contrast they present. This chapter incorporates recent research fi ndings that are changing the way planners understand and can best address visual impacts from renewable energy.
12 All editors
Chapter 7 discusses design issues and approaches that can, at least to an extent, harmonize large-scale commercial energy facilities with landscapes. It includes good up-front planning to determine where such facilities should not be built, then moves into design issues such as composition, fi tting facilities to the land, clustering, glare reduction, shape, and avoidance of skylines.
Chapter 8 reviews methods to measure impacts objectively by combining elements such as visual sensitivity and contrast. It builds largely on the US federal experience in scenic impact analysis as a component of environmental impact statements. It includes a discussion of compensatory mitigation for situations where scenic impacts cannot be reduced to levels below signifi cant.
Chapter 9 provides a primer on the very important issue of visualization. Providing mapped and pictorial representations of renewable energy is a key element in understanding impacts and reducing them. The state of the art of visualization is changing rapidly with new technologies. We utilize recent work done by one of our authors for the US National Park Service that suggests standards for visual simulations and how to use them that could be adapted by local regulators.
Chapter 10 analyzes the social and community issues surrounding scenic impacts from renewable energy projects. We offer recommendations and case studies that can help communities stave off or cope with landscape impacts, and so can help energy developers work more effectively with local communities.
Chapter 11 closes the book with a summary of recommendations for regulators and fellow practitio-ners to improve and modernize visual resource assessment, and frankly to help raise the regulatory and performance bar. While renewable energy presents challenges, these are solvable using a best practices framework.
Throughout the book, case studies are provided to illustrate issues and point to solutions to typical scenic resource problems.
It is the hope of the authors that this book will help communities, energy developers, environmental practitioners, and regulators all better understand, manage, and limit scenic impacts related to renewable energy projects.
Notes
1 See www.thewindpower.net/windfarms_offshore_en.php 2 See www.fs.fed.us/research/climate-change/
References
Bishop, I. D. 2002. Determination of thresholds of visual impact: the case of wind turbines. Env. and Planning B: Planning and Design 29(5): 707–718.
Bishop, I.D. and D. R. Miller. 2007. Visual assessment of offshore wind turbines: the infl uence of distance, contrast, movement and social variables. Renewable Energy 32: 814–831.
Brown, Lester. 2015. The Great Transition: Shifting from Fossil Fuels to Solar and Wind Energy . W. W. Norton, New York and London.
Denholm, Paul, Maureen Hand, Maddalena Jackson, and Sean Ong. 2009. Land Use Requirements of Modern Wind Power Plants in the United States. Technical Report NREL/TP-6A2-45834, August 2009.
Hill, M., J. Briggs, P. Minto, D. Bagnall, K. Foley, and A. Williams. 2001. Guide to Best Practice in Seascape Assessment . Countryside Commission of Wales, Brady Simpson Marsh and University College Dublin. Available at www.marine.ie/NR/rdonlyres/683C8CDo-3367-4704-8542D3091607C9C2/0/interreg5_1.pdf
Kliejunas, John T., Brian Geils, Jessie Micales Glasser, Ellen Michaels Goheen, Paul Hannon, Mee-Sook Kim, Harry Kope, Jeff Stone, Rona Sturrock, and Susan Frankel. 2008. Climate and Forest Diseases of Western North America: A Literature Review . USDA Forest Service. Available as at www.fs.fed.us/wwetac/projects/PDFs/Climate_Forest_Disease_Lit_Review.pdf

Introduction 13
National Renewable Energy Lab. 2008. 20% Wind Energy by 2030: Increasing Wind Energy’s Contribution to the US Electricity Supply . US Department of Energy, Oak Ridge, TN.
Rooney, S., P. Dascomb, S. Korjett, and R. C. Smardon. 2012. Technical Bulletin #12-001 Visual Impact Assessment (VIA) Methodology for Offshore Development . Cape Cod Commission, Barnstable, MA.
Sellman, P. H. 2010. Learning to love the landscapes of carbon-neutrality. Landscape Research 35(2): 157–171. Sheppard, S.R.J. 2012. Visualizing Climate Change: A Guide to Visual Communication of Climate Change and Developing
Local Solutions . Routledge, London. Smardon, R. C., J. F. Palmer, and J. P. Felleman (eds.). 1986. Foundations for Visual Project Analysis . Wiley, New York.
Available at www.esf.edu/via Sullivan, R. G., L. B. Kirchler, C. McCoy, J. McCarty, K. Beckman, and P. Richmond. 2012. Visual impacts of utility-
scale solar energy facilities on southwestern desert landscapes. Paper presented at the National Association of Environmental Professionals, 37th Annual Conference (May 21–24, 2012, Portland, OR), pp. 897–942.
Sullivan, R. G., L. B. Kirchler, J. Cothren, and S. L. Winters. 2013. Offshore wind turbine visibility and visual impact threshold distances. Environmental Practice 15(1): 33–49.
Sullivan, R. G., and J. Abplanalp. 2012. Utility-Scale Solar Energy Facility Visual Impact Characterization and Miti-gation Project Final Report. Argonne National Laboratory, Argonne, IL, December.
Sullivan, R. G., and J. Abplanalp. 2015. Visibility and Visual Characteristics of the Ivanpah Solar Electric Generating System Power Tower Facility Project Final Report. Argonne National Laboratory, Argonne, IL, March.
Tansey, Michael. 2015 Personal Communication. (Michael Tansey is a Climate Change Modeler with the Bureau of Reclamation in California.)
Williams, W. and R. Whitcomb. 2007. Cape Wind: Money, Celebrity, Class Politics and the Battle for Our Energy Future . Public Affairs, New York.