instructions for use - eprints.lib.hokudai.ac.jp · source of inspiration to complete my phd...
TRANSCRIPT

Instructions for use
Title Thermokarst lake dynamics in the continuous and isolated permafrost zones, Mongolia
Author(s) ADIYA, SARUULZAYA
Issue Date 2017-03-23
DOI 10.14943/doctoral.k12664
Doc URL http://hdl.handle.net/2115/65522
Type theses (doctoral)
File Information Adiya_Saruulzaya.pdf
Hokkaido University Collection of Scholarly and Academic Papers : HUSCAP
Thermokarst lake dynamics in the continuous
and isolated permafrost zones, Mongolia
DOCTORAL THESIS
BY
ADIYA SARUULZAYA
Division of Earth System Science
Graduate School of Environmental Science
Hokkaido University
Sapporo, Japan
February 2017
II
Abstract
Thermokarst lakes are one of the most common features on the moist depressions and valleys in
Mongolian permafrost region. Although, the spatiotemporal changes of thermokarst lake
dynamics have not been investigated in the region so far. Thermokarst lakes are defined as lakes
that occupy generally closed depressions formed by the settlement of ground following of ice
rich permafrost or melting of massive ice. After a thermokarst lake has formed, the lake size may
change due to continued permafrost thaw, variations in air temperature, potential
evapotranspiration and precipitation. The factors controlling their dynamics in decadal scale have
been controversial and still the main research topics of permafrost regions. The aims of this study
are (1) to provide quantitative information on the spatiotemporal changes of thermokarst lakes in
Mongolia, (2) to categorize the extracted lake areas into four distinct size categories, (3) to
calculate volume changes of thermokarst lakes, and (4) to address the effects of the long-term
trends of hydro-climatic regimes and permafrost degradation on the changes of lakes.
This study used the high spatial resolution Corona KH-4, KH-4A and KH-4B (1962-
1968), Landsat ETM+ (1999-2001), and ALOS/AVNIR-2 (2006-2007) satellite images to
investigate changes of thermokarst lake dynamics at seven different study sites in the continuous
and isolated permafrost zones of Mongolia. Lakes larger than 0.1 ha (1000 m2) were analyzed
using remote sensing and geographical information system tools. On the other hand, this study
used the NCEP/NCAR data for air temperature, and APHRODITE data for precipitation.
Between 1962 and 2007, the total number and area of lakes increased by +21% (347 to 420)
and +7% (3680 ha to 3936 ha) in the continuous permafrost zone, respectively. These changes

III
correspond to the appearance of 85 new lakes (166 ha) during the last 45 years. In contrast, lakes
in the isolated permafrost zone have decreased by −42% (118 to 68) in number and −12% (422
ha to 371 ha) in area from 1962 to 2007. The changes in lake area and number are likely
attributed to shifts in climate regimes and local permafrost conditions. In order, the dramatic
increase in number of smaller lakes with sizes between 0.1-1 ha and 1-10 ha compared to larger
lakes (10-100 ha and 100-1000 ha) in the continuous permafrost zone is likely as a result of
permafrost degradation due to increasing temperature and evaporations. However, small lakes
(0.1 - 1 ha) had a significant reduction in number in the isolated permafrost zone. On the other
hand, the volume changes of thermokarst lakes are increased in the continuous permafrost zone,
which is likely attributed to the increasing area and number of lakes in the depression. In the
isolated permafrost zone, in contrast, that the volume changes observed only negative values.
Since 1962, the mean annual air temperature and potential evapotranspiration are
increased significantly in the northern continuous permafrost zone compared to the southern
isolated permafrost zone. Due to ongoing atmospheric warming without any significant trend in
annual precipitation, ice-rich permafrost has thawed, and the number and area of thermokarst
lakes have accordingly developed in the continuous permafrost zone. Shrinking of thermokarst
lakes in the isolated permafrost zone may be due to disappearing permafrost, deepening of the
active layer, and increased water loss through surface evaporation and subsurface drainage.
This study provides the first baseline information of thermokarst lake changes across
Mongolia, filling the gap in sub-Arctic lake inventories at regional scales such as the southern
fringe of Siberian permafrost region.
IV
Acknowledgements
First of all, I would like to express my most sincere appreciation to my supervisor, Associate
Professor, Dr. Mamoru Ishikawa, Faculty of Environmental Science, Hokkaido University, for
his constant supervision and support in every possible way to complete the thesis. Thanks for
your high level requirements in scientific working and for supporting my participation in
regional and international conferences. I will always be indebted to him for training me to
embark on this scientific field.
I am greatly indebted to Dr. Yamkhin Jambaljav, Department of Permafrost, Institute of
Geography and Geoecology, Mongolian Academy of Sciences, who gave me many constructive
suggestions in field and office, and actively encouraged me through the course. I wish to express
my enormous gratitude to Professor, Academician, and D.Sc. Dechingungaa Dorjgotov, former
director of the Institute of Geography, Mongolian Academy of Sciences, for his partial financial
support in this study.
I would like to express my enormous gratitude to Professor Dr. Takanobu Sawagaki,
Faculty of Environmental Science, Hokkaido University, for his constructive suggestions,
instructions, and comments during my initial stages of this study. I wish to express my cordial
thanks to Associate Professor Dr. Tomonori Sato, Faculty of Environmental Science, Hokkaido
University, for his comments and suggestions to improve this thesis. I must express my gratitude
to Dr. Lamsal Damodar of Hokkaido University, for his help in processing of high-resolution
images to orthorectify with the LPS.

V
I would like to appreciate all the members of the Course in Geoecology & Field
Informatics, Graduate School of Environmental Science, Hokkaido University, for their
assistance in various steps and also for their active participation in seminar and discussion.
I am deeply grateful to my parents, family, relatives, friends and well-wishers for their
cooperation, patience, encouragement and concern for my research and study. They are the
source of inspiration to complete my PhD thesis.
I would like to dedicate this work to my father D. Adiya and mother Sh. Altantsetseg, for
teaching me the value of education, whose love and character will forever positively impact my
life.
I am much thankful to my husband D. Otgonbaatar, our beautiful daughter O. Dulguun,
son O. Naranbaatar, and my young brother A. Erdenedalai. They allowed me to concentrate on
completing this dissertation and supported mentally during the course of this work. Without their
help and encouragement, this study would not have been completed.
Finally, I would like to express my sincere appreciation to the Global Centre of
Excellence (GCOE) program of Hokkaido University for supporting this study.

VI
Contents
Abstract……………………………………………………………………………………….….II
Acknowledgements……………………………………………………………………………..IV
List of contents……………………………………………………………………………….…VI
List of figures…………………………………………………………………………………..VII
List of photographic……………………………………………………………………………IX
List of tables……………………………………………………………………………………...X
List of abbreviations……………………………………………………………………………XI
Chapter I. Introduction………………………………………………………………………….1
1.1. Scientific background…………….……………………………………………………..........1
1.2. Permafrost and thermokarst lakes in Mongolia………………………………………………4
1.3. Research objectives……………………………………………………………………….......7
1.4. Outline of the thesis………………………………………………………………………......7
Chapter II. Physical settings of Mongolia………………………………………………………9
2.1. Topography and vegetation…………………………………………………………………...9
2.2. Climate condition…..………………………………………………………………………..10
2.3. Description of the study sites….…………………………………………………………….11
Chapter III. Climate and permafrost changes………………………………………………..19
3.1. Introduction………………………………………………………………………………….19
3.2. Data and methods……………………………………………………………………………21
3.3. Description of water balance model………………………………………………………...22
3.4. Results and Discussions……………………………………………… …………………...23
3.4.1. Data validation………………………………………………………………………23
VII
3.4.2. Hydro-climatic changes…………………………………………………………...26
3.4.3. Spatial pattern of the mean annual air temperature and precipitation ……………30
3.3.4. Permafrost changes in Mongolia………………………………………………….33
3.4. Conclusion…………………………………………………………………………………..35
Chapter IV. Thermokarst lake changes in the continuous and isolated
permafrost zones from 1962 to 2007………………………………………………………......36
4.1. Introduction………………………………………………………………………………….36
4.2. Remote sensing datasets…………………………………….................................................39
4.2.1. Corona KH-4, KH-4A, and KH-4B satellite data…………………………………40
4.2.2. Landsat ETM+ satellite data………………………………………………………42
4.2.3. ALOS/AVNIR-2 satellite data…………………………………………………….42
4.3. Remote sensing method……………………………………………………………………..43
4.3.1. Orthorectification and image co-registrations…………………………………….43
4.3.2. Delineation and analyzing of thermokarst lakes…………………………………..45
4.3.3. Lake water volume calculation……………………………………………………46
4.4. Results and Discussions………………………………………………………………… ...48
4.4.1. Thermokarst lake changes from 1962 to 2007…….………………………………48
4.4.2. Frequency of the number and area of thermokarst lakes……………………… ..56
4.4.3. Volume changes of thermokarst lakes (1962-2007)……………………………....59
4.5. Conclusion…………………………………………………………………………………..62
Chapter V. General discussion………………………………………………………………...63
Chapter VI. General conclusion……………………..………………………….......................65
References ………………………………………………………………………………………67

VIII
List of figures No
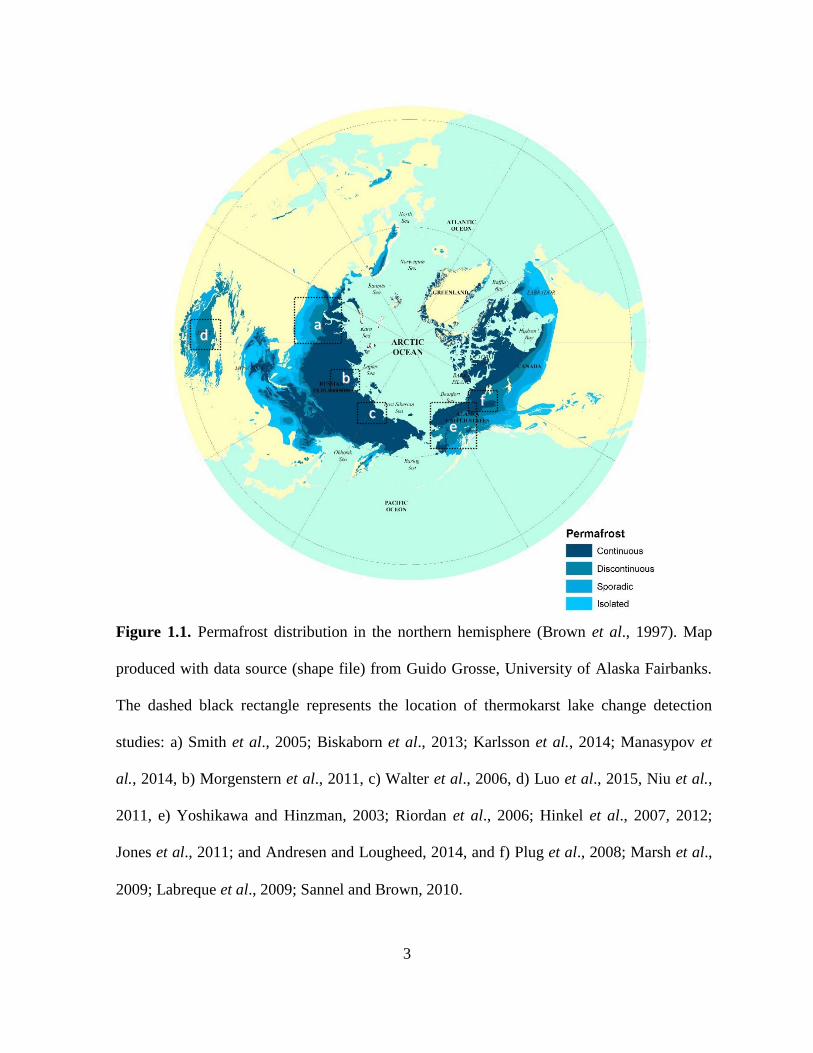
Figure 1.1. Permafrost distribution in the northern hemisphere (Brown et al., 1997).
Map produced with data source (shape file) from Guido Grosse, University of Alaska
Fairbanks. The dashed black rectangle represents the location of thermokarst lake
change detection studies: a) Smith et al., 2005; Biskaborn et al., 2013; Karlsson et al.,
2014; Manasypov et al., 2014, b) Morgenstern et al., 2011, c) Walter et al., 2006, d)
Niu et al., 2011; e) Yoshikawa and Hinzman, 2003; Riordan et al., 2006; Hinkel et al.,
2007, 2012; Jones et al., 2011; and Andresen and Lougheed, 2014, and f) Plug et al.,
2008; Marsh et al., 2009; Labreque et al., 2009; Sannel and Brown, 2010.
3
Figure 1.2. a) Permafrost distribution in Mongolia at the southern fringe of Siberian
permafrost region. b) Distribution of ice contents in the regions (high > 20%, medium
10 – 20%, and low 0 – 10%).
5
Figure 2.1. Topography of Mongolia 9
Figure 2.2. Location of study sites in different permafrost zones: a) Darkhad
depression, Mungut river valley, Chuluut river valley, Khongor-Ulun, Nalaikh
depression, Galuut depression, and Erdene. b) These study sites were located in
different ice-content ground.
12
Figure 2.3. Topography map of study sites in the continuous permafrost zone: a)
Darkhad depression, b) Mungut river valley, c) Chuluut river valley, and d) Khongor-
Ulun. Black polygons representing surface area of the identified thermokarst lakes at
these sites (as of 1962/1968).
14
Figure 2.4. Topography map of study sites in the isolated permafrost zone: a) Nalaikh
depression, b) Galuut depression, and c) Erdene. Black polygons represents surface
area of the identified thermokarst lakes at these sites (as of 1962/1968).
16
Figure 3.1. Diagram of the Thornthwaite water balance model (McCabe et al., 2007). 22
Figure 3.2. Scatterplots of the reanalysis data (NCEP/NCAR & APHRODITE), and
observation data such as Renchinkhlumbe, Numrug, Terkh, and Bayan-Ulgii from
1979 to 2007 in the continuous permafrost zone: a) NCEP/NCAR and observation
data for MAAT (C°), and b) APHRODITE and station data for total annual P (mm).
24
Figure 3.3. Scatterplots of the reanalysis data, and meteorological station data such as
Ulaanbaatar, Galuut, and Erdene from 1979 to 2007 in the isolated permafrost zone: a)
NCEP/NCAR and station data for MAAT (C°), and b) APHRODITE and station data
for total annual P (mm).
25
Figure 3.4. Hydro-climatic change trends (5-years moving average) at Darkhad,
Mungut river valley, Chuluut river valley, and Khongor-Ulun in the continuous
permafrost zone from 1962 to 2007: a) mean annual air temperature (MAAT), b) total
annual precipitation (P), c) total annual potential evapotranspiration (PET), and d)
water balance (P-PET).
27

IX
Figure 3.5. Hydro-climatic change trends (5-years moving average) at Nalaikh
depression, Galuut depression, and Erdene in the isolated permafrost zone from 1962
to 2007: a) mean annual air temperature (MAAT), b) total annual precipitation (P), c)
total annual potential evapotranspiration (PET), and d) water balance (P-PET).
28
Figure 3.6. The differences in the mean annual air temperature (MAAT, °C) during the
last four decades in Mongolia based on the NCEP/NCAR data. Black points indicate
the position of all study sites.
31
Figure 3.7. The differences in the total annual precipitation (P, mm) during the last
four decades in Mongolia based on the APHRODITE data. Black points indicate the
position of all study sites.
32
Figure 3.8. Permafrost changes at study sites in Mongolia from 1973 to 2009. 34
Figure 4.1. Arctic and sub-Arctic map showing probable thermokarst lake regions
(map compiled by Grosse et al., 2013). Black rectangle represents location of study
region.
37
Figure 4.2. Geometric distortion of Corona satellite image (Slama, 1980). 40
Figure 4.3. An example of the delineation for lake areas from Corona satellite image. 45
Figure 4.4. Calculating the water volume of layer of water in lake. 47
Figure 4.5. Mapping of thermokarst lake changes in the Darkhad depression from
1962 to 2006 in the continuous permafrost zone: very large lakes such as Dood Nuur,
Targan, and Tsoidon are excluded from the recent analysis.
49
Figure 4.6. Mapping of thermokarst lake changes in the Mungut river valley from
1968 to 2006 in the continuous permafrost zone.
51
Figure 4.7. Mapping of thermokarst lake changes in the Chuluut river valley from
1966 to 2007 in the continuous permafrost zone.
51
Figure 4.8. Mapping of thermokarst lake changes in the Khongor-Ulun from 1968 to
2007 in the continuous permafrost zone.
52
Figure 4.9. Mapping of thermokarst lake changes in the Nalaikh depression from 1968
to 2007 in the isolated permafrost zone.
54
Figure 4.10. Mapping of thermokarst lake changes in the Galuut depression from 1964
to 2007 in the isolated permafrost zone.
55

X
Figure 4.11. Mapping of thermokarst lake changes in the Erdene from 1962 to 2006 in
the isolated permafrost zone.
Figure 4.12. Lake size classes in the continuous (a-number; b-area of lakes) and
isolated (c-number; d-area of lakes) permafrost zones for 1962-2007.
56
Figure 4.13. An example for the formation of new thermokarst lake in the Darkhad
depression, the continuous permafrost zone from 1962 (a – Corona satellite image) to
2006 (b – ALOS satellite image).
57
Figure 4.14. An example of thermokarst lake that has been drained in the Galuut
depression, the isolated permafrost zone from 1964 to 2007. Blue polygon represents
the water surface area of lake.
58
Figure 4.15. Topographic maps of (a) Darkhad depression in the continuous
permafrost zone, and (b) Galuut depression in the isolated permafrost zone. Map
produced by ASTER GDEM.
59
Figure 4.16. Volume changes of thermokarst lakes: (a) Darkhad depression in the
continuous permafrost zone, and (b) Galuut depression in the isolated permafrost
zone.
60
List of photographic No
Photo 1.1. Exposure of ice-rich deposits at the Darkhad depression, in the northern
continuous permafrost zone, Mongolia. Photo was taken by researchers of Permafrost
Department at the Institute of Geography and Geoecology, Mongolian Academy of
Sciences.
6
Photo 2.1. Surface characteristics of each study site: (a) Darkhad depression, (b)
Mungut river valley, (c) Chuluut river valley, (d) Khongor-Ulun, (e) Nalaikh
depression, (f) Galuut depression, and (g) Erdene. All photos were taken during the
field work in 2009.
17

XI
List of tables No
Table 2.1. General hydro-climatology and environmental characteristics at all study
sites: Mean annual air temperature (MAAT/°C), summer air temperature (T/°C), mean
annual precipitation (MAP/mm), and summer precipitation (P/mm) between 1962 and
2007 based on long-term reanalysis data. Permafrost and ground ice-content datasets at
all study sites are updated from Brown et al., (1997). Ground control points (GCP)
were collected from field work in 2009.
18
Table 3.1. Linear trends in mean annual air temperature (MAAT), total annual
precipitation (P), total annual potential evapotranspiration (PET), and water balance (P-
PET). Their statistical parameters were computed such as changes (∆) between 1962
and 2007, coefficients of determination of the liner trend (r2) and significance level (p).
29
Table 4.1. The Corona KH-4, KH-4A, and KH-4B, Landsat ETM+, and
ALOS/AVNIR-2 satellite images used in this study.
31
Table 4.2. Important parameters of high-resolution satellite images used in this study. 41
Table 4.3. Thermokarst lake changes by sites and by permafrost zones over the study
period.
50

XII
List of Abbreviations
ALOS Advanced Land Observing Satellite
AVNIR-2 Advanced Visible and Near Infrared Radiometer type 2
A.S.L Above Sea Level
APHRODITE Asian Precipitation Highly Resolved Observational Data Integration
towards Evaluation
ASTER Advanced Spaceborne Thermal Emission and Reflection Radiometer
GDEM Global Digital Elevation Model
GrADS Grid Analysis Display System
GIS Geography Information System
GPS Global Positioning System
GCPs Ground Control Points
ETM+ Enhanced Thematic Mapper Plus
JAXA Japan Aerospace Exploration Agency
KH-4 Keyhole-4
KH-4A Keyhole-4A
KH-4B Keyhole-4B
LPS Leica Photogrammetric Suite
MAAT Mean annual air temperature
MSS Multi-spectral Scanner
NASA National Aeronautics and Space Administration
N/A Not Available
NCEP National Center for Environmental Prediction
NCAR National Center for Atmospheric Research
PALSAR Phased Array type L-band Synthetic Aperture Radar
P Precipitation
PET Potential Evapotranspiration
p significance level
RMSE Root Mean Square Error
TM Thematic Mapper
XIII
r2 coefficient of determination
WGS World Geodetic System
UTM Universal Transverse Mercator
∆ Changes
∆V1,2 Volume changes of the lake
∆H1,2 Difference in depth between two successive depth contours
h1,2,3 Lake level in different time periods as
S 1,2,3 Surface area of lake at depth

1
Chapter I. Introduction
1.1. Scientific background
Approximately 24% of the northern land surface is located in permafrost zones (Brown et al.,
1997). Permafrost, defined as the ground that remains at or below 0°C for more than two years,
can be differentiated by its spatial extent into continuous (90–100%), discontinuous (50–90%),
sporadic (10–50%), and isolated (0–10%) zones (Figure 1.1), as well as by its thickness, the
amount of ground ice present, and its temperature (van Everdingen, 1998). Recent global climate
warming is occurring in the northern hemisphere at a much faster rate than in other parts of the
world and therefore significantly affects permafrost regions, which has resulted in widespread
permafrost degradation and also its disappearance in some regions (IPCC, 2013).
A typical form of that permafrost degradation involves the formation and growth of
thermokarst lakes (Soloviev, 1962). Thermokarst lakes are defined as lakes that occupy generally
closed depressions formed by the settlement of ground following of ice-rich permafrost or
melting of massive ice (van Everdingen, 1998). Such lakes have mainly formed during the
transition from late Pleistocene to Holocene and are a sign of local permafrost degradation
following climate warming (Rampton, 1988; Walter et al., 2007). A thick overburden of
unconsolidated sediments, and high ground ice content (above 30% by volume), this often results
in the formation of thermokatst lakes in areas with lowland (Jones et al., 2011; Grosse et al.,
2013). However, thermokarst lakes can also occur in perennially frozen peat lands, poorly
consolidated and ice-rich bedrock, and in alpine permafrost, such as mountain valleys and
plateaus (Sannel and Brown, 2010).

2
Thermokarst lakes are one of the most dynamic and widespread features in permafrost
regions, covering up to 50% of the total land area of the northern hemisphere (Frohn et al., 2005;
Hikel et al., 2007). Scientific interest in the interactions between thermokarst lakes, permafrost,
and climate has increased over the last decades. Their importance to global climate change and
northern high latitude landscape and permafrost-stored carbon cycling has been identified
(Zimov et al., 1997; Walter et al., 2007). Therefore quantifying changes in thermokarst lake
dynamics is of importance for understanding potential positive feedback to climate warming.
Historical observations of changes in thermokarst lake dynamics in permafrost regions
have shown different trends over the last five to six decades using remote sensing imagery
(Figure 1.1). Several studies from areas of discontinuous to isolated permafrost zones agree in
general reduction in area and number of thermokarst lakes (Yoshikawa and Hinzman, 2003;
Smith et al., 2005; Riordan et al., 2006; Andresen and Lougheed, 2014) attributed to
evapotranspiration and permafrost degradation, resulting in lateral and subsurface drainage
(Anderson et al., 2013). However, other studies in the continuous permafrost zone are more
ambiguous with diverse responses to the effects of climate and permafrost including the area and
number of thermokarst lakes increases (Smith et al., 2005; Jones et al., 2011; Luo et al., 2015),
both increases and decreased (Plug et al., 2008; Labrecque et al., 2009), small changes (Hinkel et
al., 2007). This ambiguity can be attributed primarily to regional differences in climate (air
temperature, evapotranspiration, water balance) and permafrost conditions (ground ice content
and active layer thickness). Consequently, the factors controlling their dynamics in decadal scale
have been controversial and still the main research topics of permafrost regions.
3
dd
aa
cc
aa ee
aa
ff
aa
bb
aa
aa
aa
Figure 1.1. Permafrost distribution in the northern hemisphere (Brown et al., 1997). Map
produced with data source (shape file) from Guido Grosse, University of Alaska Fairbanks.
The dashed black rectangle represents the location of thermokarst lake change detection
studies: a) Smith et al., 2005; Biskaborn et al., 2013; Karlsson et al., 2014; Manasypov et
al., 2014, b) Morgenstern et al., 2011, c) Walter et al., 2006, d) Luo et al., 2015, Niu et al.,
2011, e) Yoshikawa and Hinzman, 2003; Riordan et al., 2006; Hinkel et al., 2007, 2012;
Jones et al., 2011; and Andresen and Lougheed, 2014, and f) Plug et al., 2008; Marsh et al.,
2009; Labreque et al., 2009; Sannel and Brown, 2010.
4
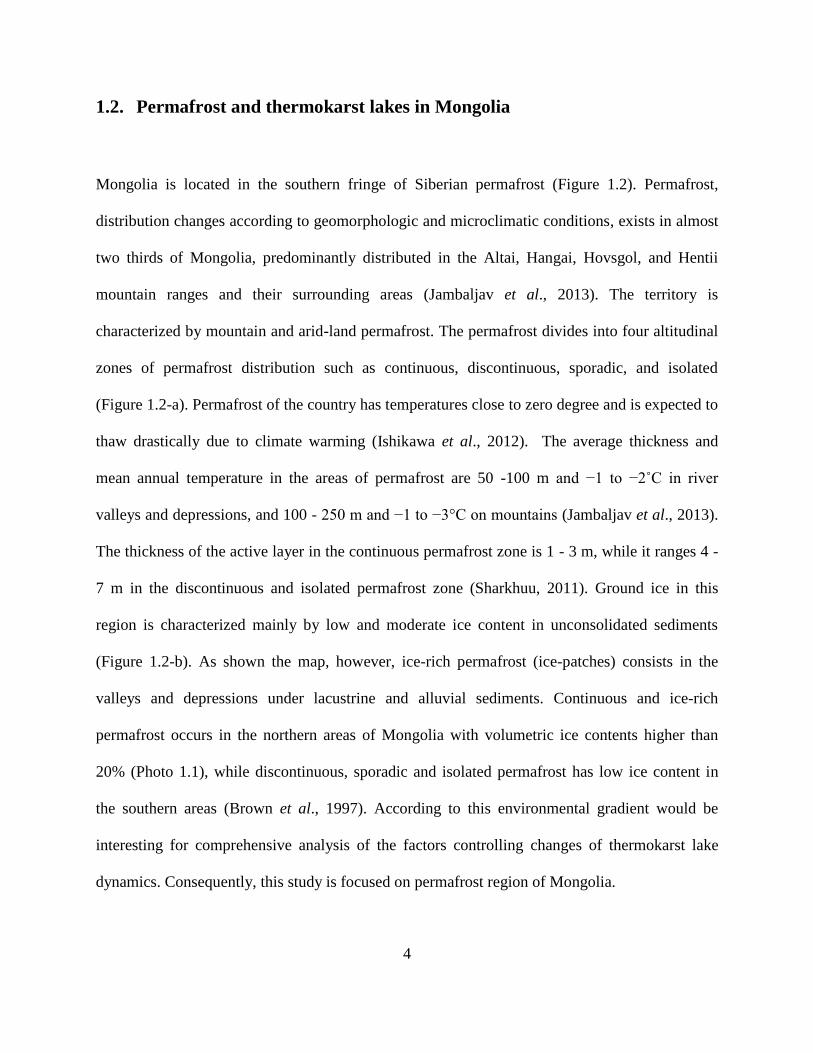
1.2. Permafrost and thermokarst lakes in Mongolia
Mongolia is located in the southern fringe of Siberian permafrost (Figure 1.2). Permafrost,
distribution changes according to geomorphologic and microclimatic conditions, exists in almost
two thirds of Mongolia, predominantly distributed in the Altai, Hangai, Hovsgol, and Hentii
mountain ranges and their surrounding areas (Jambaljav et al., 2013). The territory is
characterized by mountain and arid-land permafrost. The permafrost divides into four altitudinal
zones of permafrost distribution such as continuous, discontinuous, sporadic, and isolated
(Figure 1.2-a). Permafrost of the country has temperatures close to zero degree and is expected to
thaw drastically due to climate warming (Ishikawa et al., 2012). The average thickness and
mean annual temperature in the areas of permafrost are 50 -100 m and −1 to −2˚C in river
valleys and depressions, and 100 - 250 m and −1 to −3°C on mountains (Jambaljav et al., 2013).
The thickness of the active layer in the continuous permafrost zone is 1 - 3 m, while it ranges 4 -
7 m in the discontinuous and isolated permafrost zone (Sharkhuu, 2011). Ground ice in this
region is characterized mainly by low and moderate ice content in unconsolidated sediments
(Figure 1.2-b). As shown the map, however, ice-rich permafrost (ice-patches) consists in the
valleys and depressions under lacustrine and alluvial sediments. Continuous and ice-rich
permafrost occurs in the northern areas of Mongolia with volumetric ice contents higher than
20% (Photo 1.1), while discontinuous, sporadic and isolated permafrost has low ice content in
the southern areas (Brown et al., 1997). According to this environmental gradient would be
interesting for comprehensive analysis of the factors controlling changes of thermokarst lake
dynamics. Consequently, this study is focused on permafrost region of Mongolia.

5
Figure 1.2. a) Permafrost distribution in Mongolia at the southern fringe of Siberian
permafrost region. b) Distribution of ice content in the region (high > 20%, medium 10 –
20%, and low 0 – 10%).
a)
b)

6
Numerous thermokarst lakes exist on moist depression and river valleys within the four
mountain ranges in Mongolia, where permafrost shows significant spatial variations in the extent
and different ice contents. Information about thermokarst lakes in this region, at the southern
fringe of Siberian permafrost, however, is remarkably scarce. Tserensodnom (2000) published a
book entitled name “Lake catalog of Mongolia” which was indicated all lakes characteristics,
morphology, and type (e.g., glacial, flood plain, thermokarst, and others) by each provinces
across Mongolia. Other few researchers reported only the distribution of thermokarst lakes in
some specific areas (Tumurbaatar, 2001; Nishida and Jamsran, 2009; Sharkhuu, 2011). However,
these studies did not show the long-term changes of thermokarst lakes dynamics, the
spatiotemporal changes of these lakes have not been investigated in Mongolia so far.
Photo 1.1. Exposure of ice-rich deposits at the Darkhad depression, in the northern
continuous permafrost zone, Mongolia. Photo was taken by researchers of Permafrost
Department at the Institute of Geography and Geoecology, Mongolian Academy of
Sciences.

7
1.3. Research objectives
In light of the above background, this study aims i) to provide quantitative information on the
temporal and spatial changes of thermokarst lakes at seven sites in the continuous and isolated
permafrost zones of Mongolia, ii) to categorize the extracted lake areas into four distinct classes
in order to better understand the lake dynamics of individual lake size categories, iii) to calculate
volume changes of thermokarst lakes at study sites, and vi) to address the effects of the long-
term trends of hydro-climatic regimes and permafrost degradation on the areal changes of
thermokarst lakes.
To accomplish these objectives, remotely sensed, field survey, and the reanalysis data
were used in an integrated manner. Remote sensing data with spatial resolution 1.8-7.5 m
(Corona panchromatic images), 15 m (Landsat ETM; band 8 panchromatic images), and 10 m
(ALOS/AVNIR-2 images) were employed based on specific needs and their suitability for
achieving the desired level of details. This study used remote sensing data from the 1962 to 2007
to investigate thermokarst lake changes at the study sites, so that thermokarst lake changes can
be mapped over a relatively long period of time.
1.4. Outline of the thesis
This thesis contains six chapters. Chapter I describes the background information of thermokarst
lakes and their importance, previous studies on thermokarst lakes, permafrost and thermokarst
distributions in the study regions, research objectives, and outline of the thesis itself. Chapter II
presents the geography, climate settings of the study region, and description of each study site.
8
Chapter III concentrates on the long-term hydro-climatic, and permafrost changes at the
observation sites Mongolia, which follows the long-term reanalysis data and water balance
model, and literature review on permafrost data. Chapter IV focuses on thermokarst lake
dynamics at study sites in Mongolia from 1962 to 2007, which includes: the remote sensing
images, the general methods for image processing and analyzing, mapping of thermokarst lakes,
the areal changes on the categorized lake sizes, and volume changes of lakes in the continuous
and isolated permafrost zones. In addition, the field survey include the ground control points, and
remote sensing techniques, which has been recently used to orthorectify the high resolution
Corona KH-4, KH-4A, and KH-4B, and ALOS/AVNIR-2 satellite data. Chapter V presented the
general discussion on the thermokarst lake changes and lake size categorization in different
permafrost zones, long-term climate and permafrost changes reflects on thermokarst lakes.
Finally, Chapter VI presents the general conclusion of the study.
9
Chapter II. Physical settings of Mongolia
2.1. Topography and Vegetation
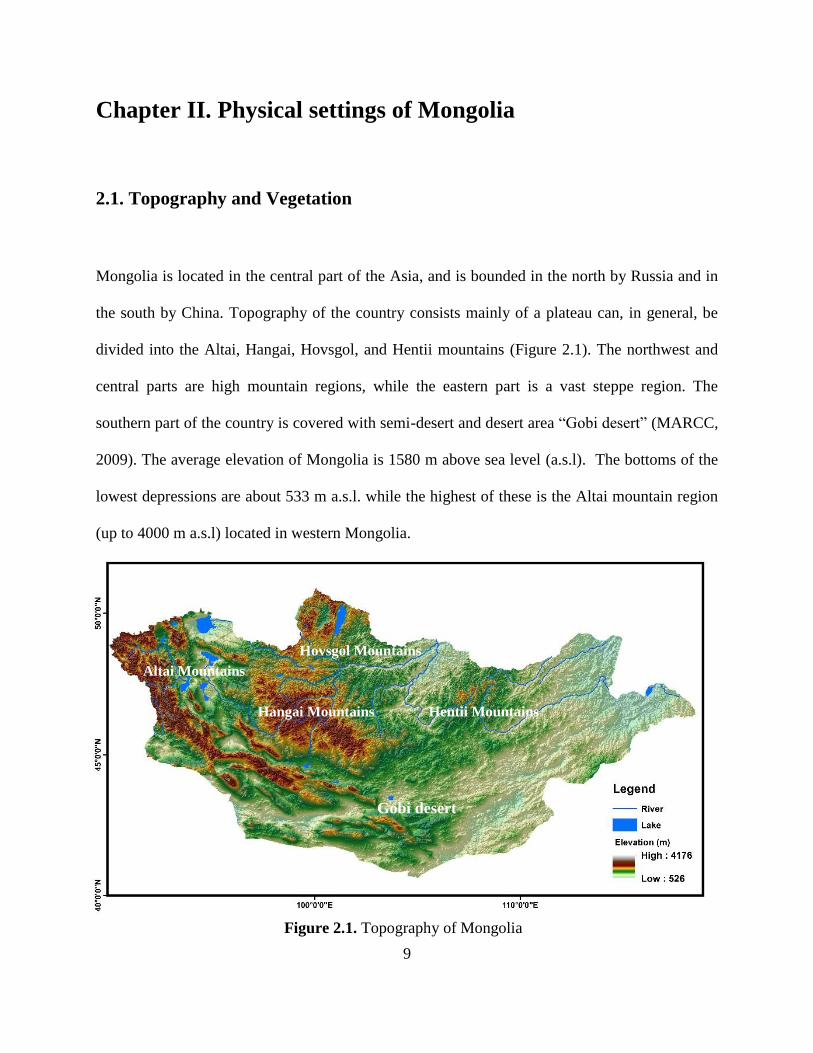
Mongolia is located in the central part of the Asia, and is bounded in the north by Russia and in
the south by China. Topography of the country consists mainly of a plateau can, in general, be
divided into the Altai, Hangai, Hovsgol, and Hentii mountains (Figure 2.1). The northwest and
central parts are high mountain regions, while the eastern part is a vast steppe region. The
southern part of the country is covered with semi-desert and desert area “Gobi desert” (MARCC,
2009). The average elevation of Mongolia is 1580 m above sea level (a.s.l). The bottoms of the
lowest depressions are about 533 m a.s.l. while the highest of these is the Altai mountain region
(up to 4000 m a.s.l) located in western Mongolia.
Altai Mountains
Hovsgol Mountains
Hangai Mountains Hentii Mountains
Figure 2.1. Topography of Mongolia
Gobi desert
10
On the other hand, the territory of Mongolia has a transition zone in its rainfall amount as
well as in its vegetation conditions, which change from desert to grassland and forest, over a
north-to-south distance of only several hundreds of kilometers. In general, this transition zone is
reflected in the vegetation patterns over Mongolia. The vegetation of Mongolia is characterized
by Siberian forest, especially in the Hangai, Hentii, and Hovsgol mountains, and also by high
mountain steppe vegetation in the Altai mountain region (Dorjsuren, 2014.).
2.2. Climate condition
Mongolia has a typically continental climate. A gradual temperature and moisture change is
reflected in the prevailing climate pattern along a latitudinal gradient (MARCC, 2009). Climate
of the country is characterized by, cold and moist conditions in the northern territories, warm and
dry conditions in the southern territories. Winter air temperatures often reach to -50°C in the
northern territory, and to 4°C in the south territory. In the warmest month, air temperatures range
between 10 and 15°C in Hovsgol, Hangai, Altai, and Hentii mountains and reach up to 20°C in
the southern province. The air temperatures are the lowest in mid-January and range between -25
and -30°C in the northern regions and between -15 and -20°C in the southern regions (Dagvadorj
et al., 2009). About 85% of total precipitation falls in warm season from April to September, of
which about 60% falls between July and August (AIACC, 2005). Total annual mean
precipitation is 300–400 mm in the Hangai, Hentii, and Hovsgol mountains, and it decreases to
100–200mm in southern Hangai and Altai mountains. Since 1940s, the precipitation over
Mongolia has decreased at a rate of 0.1–2.0 mm per year, while the air temperature in Mongolia
has increased by 2.14°C (Natsagdorj and Sarantuya, 2014).
11
2.3. Description of the study sites
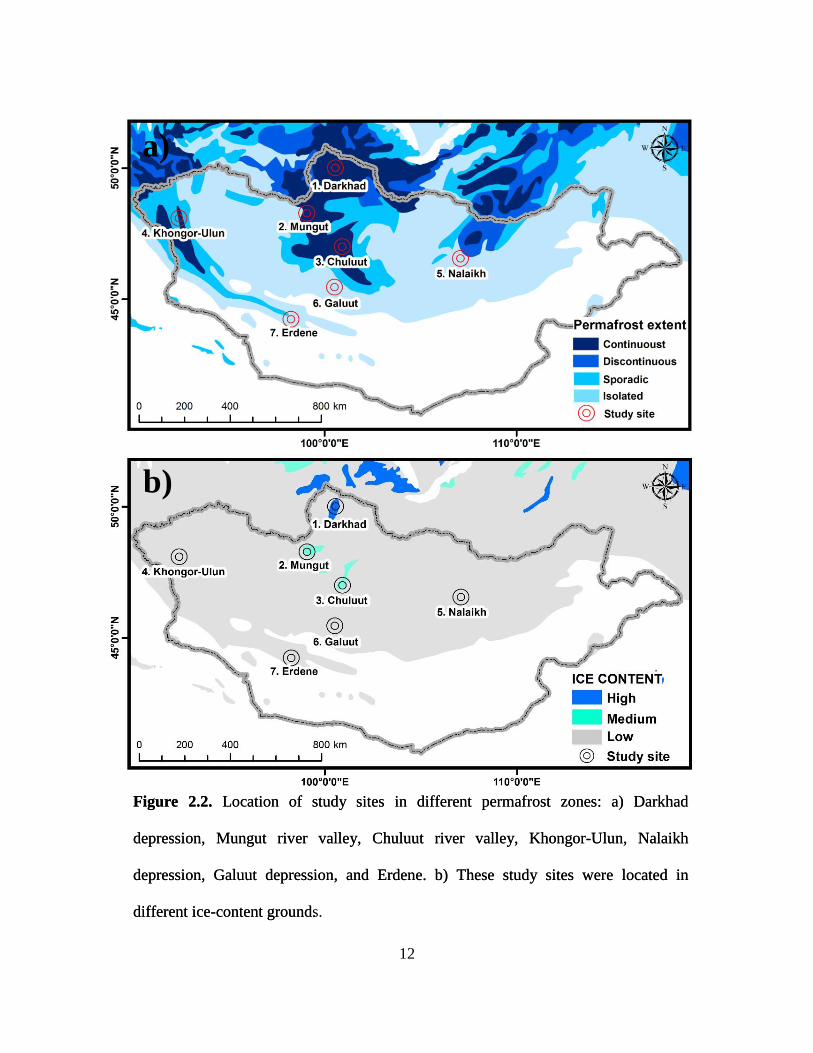
In this study, seven sites are selected within the continuous and isolated permafrost zones of
Mongolia (Figure 2.2-a): Darhad depression, Mungut river valley, Chuluut river valley, Khongor
Ulun, Nalaikh depression, Galuut depression, and Erdene. These sites contain long-term
permafrost monitoring boreholes located for our sites. Table 2.1 shows detailed information of
basic hydro-climatology and environmental characteristics at all study sites. On the other hand,
we collected ground control points (GCPs) at all study sites during the field work in 2009.
The Darkhad depression is located in the northern Hovsgol mountain region, within the
ice-rich continuous permafrost zone (Table 2.1, Figure 2.2-a, and b). It is up to 40 km wide and
110 km long extended from north to south, is bounded by high mountains on all sides, which
elevated up to 3300 m a.s.l (Figure 2.3-a). The depression has an extensive flat floor underlain by
thick lacustrine sediments (Ishikawa and Jambaljav, 2015). Permafrost generally extends to
depths of 150-200 m below ground in this depression, and the active layer ranges between 1–3 m
depth (Sharkhuu, 2011). The mean annual ground temperature has been recorded as -3°C within
the area (Ishikawa et al., 2012). The surface of the permafrost experienced strong thermal
erosion, which resulted in the formation of thermokarst lakes on the depression floor during the
Last Glacier Maximum (Krivonogov et al., 2012). Consequently, numerous thermokarst lakes
concentrate in the depression floor. The depression is characterized by periglacial features
including ice-wedge polygons, thermokarst, and frost mounds (Nishida and Jamsran, 2009;
Tserensodnom, 2000; Tumurbaatar, 2001; Sharkhuu, 2011; Ishikawa and Jambaljav, 2015). The
networks of ice-wedge polygons are only clearly visible at altitudes between 1560 and 1570m
a.s.l. (Krivonogov et al., 2005), near the lacustrine terraces.
12
Figure 2.2. Location of study sites in different permafrost zones: a) Darkhad
depression, Mungut river valley, Chuluut river valley, Khongor-Ulun, Nalaikh
depression, Galuut depression, and Erdene. b) These study sites were located in
different ice-content ground.
a)
b)
Figure 2.2. Location of study sites in different permafrost zones: a) Darkhad
depression, Mungut river valley, Chuluut river valley, Khongor-Ulun, Nalaikh
depression, Galuut depression, and Erdene. b) These study sites were located in
different ice-content grounds.
a)
b)

13
The Mungut river valley is situated in the continuous permafrost with medium ice
content, which is near the Hangain mountain region (Figure 2.2-a, and b; and Table 2.1). The
entire the river valley was filled with lacustrine sediments during the Late Pleistocene
(Yoshikawa et al., 2013). The sediment in the area is about 120 m thick, and permafrost is about
100 to 150 m thick, with a maximum depth of 200 m (Sharkhuu, 1969). Permafrost temperature
at the site ranges from -1.2°C to -1.5°C, and the thickness of the active layer is 2.0–2.8 m
(Sharkhuu, 2011; Ishikawa et al., 2012). The river valley is covered by small thermokarst lakes,
pingos, and hummocks, surface characteristic shows clearly on Photo 2.1-b and Figure 2.3-b.
In the northern part of the Hangai mountain region, the Chuluut river valley is located in
the continuous permafrost with medium ground ice content (Figure 2.2-a, and b). The valley is
characterized by the inter-layering silt and clay sediments, permafrost thickness ranges from 15
m to 30 m (Sharkhuu, 1969). Permafrost temperature has been recorded as -1.6°C at the study
site (Ishikawa et al., 2012), the active layer thickness ranges between 1.6 and 3 m (Jambaljav et
al., 2013). Thermokarst processes have greatly influenced the landscaped in this area due to
recent climate changes (Sharkhuu, 2011). Many small thermokarst lakes, pingo, and hummock
exist along the river valley (Photo 2.1-c). On the other hand, the site is surrounded by larch forest
on the northern slope of the mountains and by steppe grassland on the southern slope.
In the northwestern Altai mountain region, Khongor-Ulun is located within the high
mountains, which elevated up to 3500 m a.s.l (Figure 2.3-d, and Photo 2.1-d). The permafrost
temperature in this site, ranges between -2.4°C and -3.5°C, is colder than other study sites
(Ishikawa et al., 2012). The study site in continuous permafrost is covered by several
thermokarst lakes. These lakes probably formed as a result of permafrost degradation, which are
connected to channel outflow (Tserensodnom, 2000).

14
Figure 2.3. Topography map of study sites in the continuous permafrost zone: a) Darkhad
depression, b) Mungut river valley, c) Chuluut river valley, and d) Khongor-Ulun. Black
polygons represents surface area of the identified thermokarst lakes at these sites (as of
1962/1968).
a) b)
c) d)
15
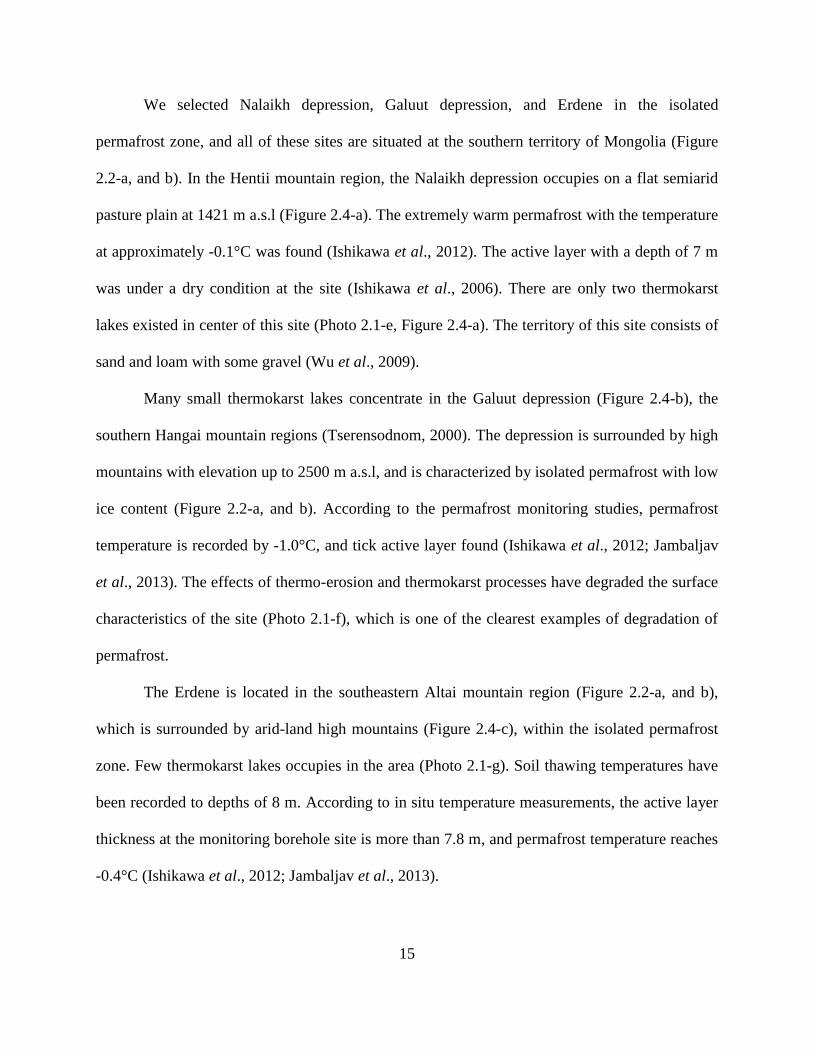
We selected Nalaikh depression, Galuut depression, and Erdene in the isolated
permafrost zone, and all of these sites are situated at the southern territory of Mongolia (Figure
2.2-a, and b). In the Hentii mountain region, the Nalaikh depression occupies on a flat semiarid
pasture plain at 1421 m a.s.l (Figure 2.4-a). The extremely warm permafrost with the temperature
at approximately -0.1°C was found (Ishikawa et al., 2012). The active layer with a depth of 7 m
was under a dry condition at the site (Ishikawa et al., 2006). There are only two thermokarst
lakes existed in center of this site (Photo 2.1-e, Figure 2.4-a). The territory of this site consists of
sand and loam with some gravel (Wu et al., 2009).
Many small thermokarst lakes concentrate in the Galuut depression (Figure 2.4-b), the
southern Hangai mountain regions (Tserensodnom, 2000). The depression is surrounded by high
mountains with elevation up to 2500 m a.s.l, and is characterized by isolated permafrost with low
ice content (Figure 2.2-a, and b). According to the permafrost monitoring studies, permafrost
temperature is recorded by -1.0°C, and tick active layer found (Ishikawa et al., 2012; Jambaljav
et al., 2013). The effects of thermo-erosion and thermokarst processes have degraded the surface
characteristics of the site (Photo 2.1-f), which is one of the clearest examples of degradation of
permafrost.
The Erdene is located in the southeastern Altai mountain region (Figure 2.2-a, and b),
which is surrounded by arid-land high mountains (Figure 2.4-c), within the isolated permafrost
zone. Few thermokarst lakes occupies in the area (Photo 2.1-g). Soil thawing temperatures have
been recorded to depths of 8 m. According to in situ temperature measurements, the active layer
thickness at the monitoring borehole site is more than 7.8 m, and permafrost temperature reaches
-0.4°C (Ishikawa et al., 2012; Jambaljav et al., 2013).
16
Figure 2.4. Topography map of study sites in the isolated permafrost zone: a) Nalaikh
depression, b) Galuut depression, and c) Erdene. Black polygons represent surface area of the
identified thermokarst lakes at these sites (as of 1962/1968).
a) b)
c)

17
Photo 2.1. Surface characteristics of each study site: (a) Darkhad depression, (b) Mungut river
valley, (c) Chuluut river valley, (d) Khongor-Ulun, (e) Nalaikh depression, (f) Galuut depression,
and (g) Erdene. All photos were taken during the field work in 2009.
a) b)
c) d)
e) f)
g)

18
Table 2.1. General hydro-climatology and environmental characteristics at all study sites: Mean
annual air temperature (MAAT/°C), summer air temperature (T/°C), mean annual precipitation
(MAP/mm), and summer precipitation (P/mm) between 1962 and 2007 based on long-term
reanalysis data. Permafrost and ground ice-content datasets at all study sites are updated from
Brown et al., (1997). Ground control points (GCP) were collected from field work in 2009.
Study sites MAAT
(°C)
Summer
T (°C)
MAP
(mm)
Summer
P (mm)
Permafrost
extent
Ice
content GCPs
Darhad
depression -8.0 7.1 248 203 Continuous > 20% 13
Mungut river
valley -6.4 8.0 199 153 Continuous 10-20% 5
Chuluut river
valley -6.3 8.7 229 185 Continuous 10-20% 11
Khongor -
Ulun -8.9 7.6 133 105 Continuous 0-10% 7
Nalaikh
depression -0.3 17.0 253 211 Isolated 0-10% 5
Galuut
depression -5.2 10.6 162 124 Isolated 0-10% 10
Erdene -0.9 15.1 55 42 Isolated 0-10% 10
19
Chapter III. Climate and permafrost changes
3.1. Introduction
Climate changes can have an enormous influence on the distribution and state of permafrost
(Brown and Pewe, 1973). It is the main factor controlling the formation and existence of
permafrost. Although a general relationship exists between air and ground temperatures, local
environmental factors play an important role on determining the permafrost distribution and its
thermal regime. Recent climate warming in most northern high-latitude permafrost region has
resulted in widespread warming of permafrost (IPCC, 2013), as proven by strong local evidence
in Alaska, Siberia, Canada, and Central Asia (Smith et al., 2005; Romanovsky et al., 2010; Zhao
et al., 2010). These studies have reported large spatial variations in warming rates in the northern
hemisphere.
The climate of Mongolia is characterized by long and cold winters, short summers, small
amount of precipitation, high temperature fluctuations (MARCC, 2014). Because of high altitude
and latitude, it is generally colder than of other countries. The territory has a transition zone and
mountainous regions, where that condition may change dramatically through short distances.
These differences are exhibited clearly by our study sites in the region (see Figure 2.1 and Figure
2.2). Mongolia is extremely vulnerable, hence, to climate change due to its geographical location
and environmental conditions. According to the observation data between 1940 and 2013 that the
air temperature has increased by 2.07°C in the country (MARCC, 2014). This increase has
occurred more intensively in the mountain regions and less so in the southern regions.

20
The permafrost occurring within the territory of Mongolia is significant different from
permafrost in Alaska, in Canada, and in Siberian as a latitudinal permafrost and in Tibetan
plateau (Davaa and Jambaljav, 2014). Permafrost in this country has temperatures close to 0°C
and hence is highly vulnerable to climate warming due to its geographic location and permafrost
extent (Ishikawa et al., 2012). Permafrost studies in this country have been conducted since
1950, however, continuous consistent measurements of permafrost temperature began mostly in
last two decades. Monitoring of permafrost conditions has been conducted at numerous locations
over the region at the southern fringe of Siberian permafrost region. Many studies have been
published the thermal state of permafrost, active-layer depths, ground ice-content, and
permafrost changes over Mongolian region (Brown et al., 1997; Sharkhuu et al., 2008, 2011;
Ishikawa et al., 2012; Jambaljav et al., 2013, Davaa and Jambaljav, 2014). Due to climate
warming, permafrost has not only been warming, but also disappearing, and the processes such
as active layer detachment, deepening of summer thaw, disappearing of shallow permafrost have
been determined (Davaa and Jambaljav, 2014). Overall, these studies have published suitable
and sufficient data of permafrost thermal state, and its changes over Mongolia. Consequently, in
this chapter, I obtained permafrost data at our study sites using the previously published articles.
The aim of this chapter is to present the two essential data sets such as climate and
permafrost changes needed to evaluate the changes of thermokarst lake dynamics at our sites.
The changes of lake area and numbers are due to several potential processes, including (1)
changes in precipitation, (2) changes in air temperature and evapotranspiration, (3) water
balance, and (4) changes in permafrost conditions such as subsurface drainage, ground ice
content, and active layers.

21
3.2. Data and methods
Systematic meteorological observations began in the early 1940s. However, Mongolia has a
sparse distribution of meteorological stations with weather records spanning more than 50 year;
therefore, we used the reanalysis data in this study. The mean annual air temperature (MAAT),
maximum and minimum air temperatures at 2 meter height data from 1962 to 2007 were
downloaded for the National Center for Environmental Prediction, National Center for
Atmospheric Research (NCEP/NCAR) data (Kanlay et al., 1996). The horizontal resolutions of
the compiled NCEP/NCAR precipitation datasets (2.5˚ × 2.5˚) were not sufficient to investigate
rainfall. Therefore, the annual total precipitation (P) was downloaded from the high-resolution
Asian Precipitation Highly Resolved Observational Data Integration Towards Evaluation
(APHRODITE) data with 0.5˚ × 0.5˚ resolution from 1962 to 2007 (Yatagai et al., 2009). In
addition, that the APHRODITE data is available until 2007. Therefore, we only used satellite
images from 1962 to 2007. Both reanalysis NCEP/NCAR and APHRODITE data were analyzed
in the Grid Analysis and Display System (GrADS) software.
On the other hand, this study used seven meteorological stations (e.g., Renchinkhlumbe,
Numrug, Terkh, Bayan-Ulgii, Ulaanbaatar, Galuut, and Gobi-Altai) for air temperature, and
precipitation (1979 to 2007), which are needed to validate the reanalysis data at all study sites.
These meteorological station data were obtained from Institute of Meteorology and Hydrological
in Mongolia. In addition, only two meteorological stations occupied at our study sites such as the
Darkhad and Galuut depressions. Other study sites are located so far from the stations, which are
distance from 50 to 150 km.
22
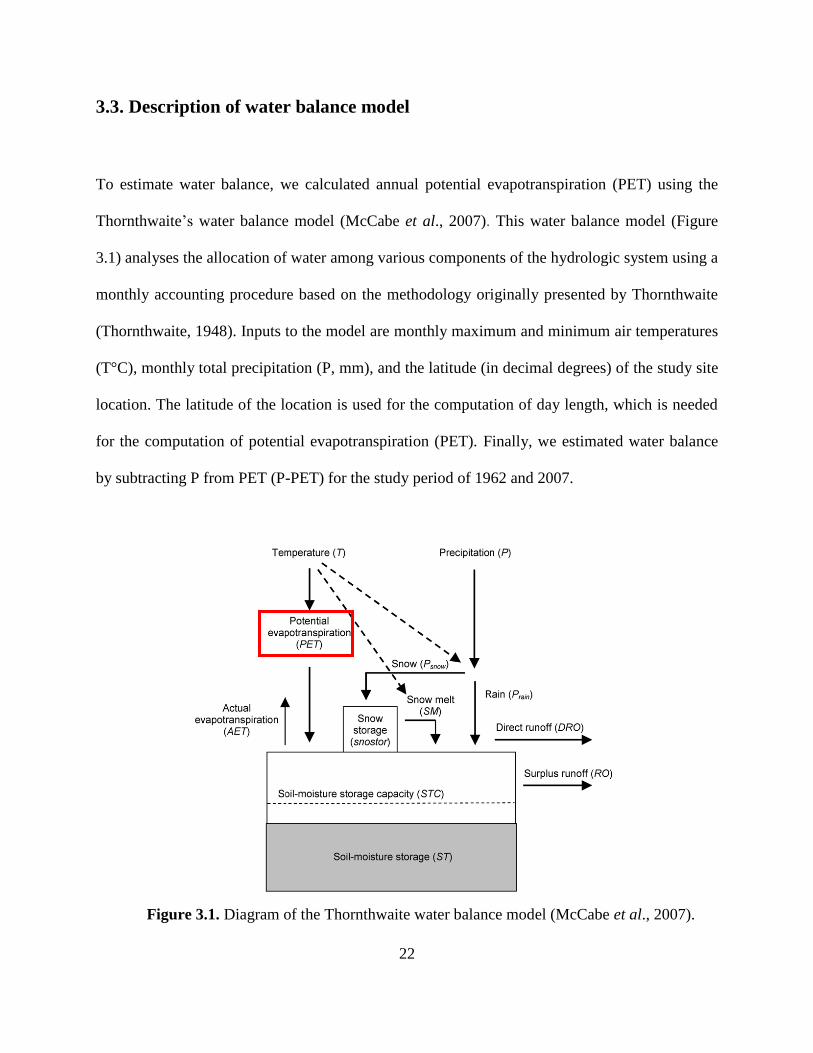
3.3. Description of water balance model
To estimate water balance, we calculated annual potential evapotranspiration (PET) using the
Thornthwaite’s water balance model (McCabe et al., 2007). This water balance model (Figure
3.1) analyses the allocation of water among various components of the hydrologic system using a
monthly accounting procedure based on the methodology originally presented by Thornthwaite
(Thornthwaite, 1948). Inputs to the model are monthly maximum and minimum air temperatures
(T°C), monthly total precipitation (P, mm), and the latitude (in decimal degrees) of the study site
location. The latitude of the location is used for the computation of day length, which is needed
for the computation of potential evapotranspiration (PET). Finally, we estimated water balance
by subtracting P from PET (P-PET) for the study period of 1962 and 2007.
Figure 3.1. Diagram of the Thornthwaite water balance model (McCabe et al., 2007).

23
3.4. Results and Discussions
3.4.1. Data validation
Figures 3.2 showed correlation between the reanalysis data and observation data for (a) the mean
annual air temperature and (b) total annual precipitation between 1979 and 2007. As shown the
results in the mean annual air temperature (Figure 3.2-a), correlation between NCEP/NCAR and
station data demonstrated good correlations demonstrated in the Darkhad depression (r2=0.67),
Mungut river valley (r2=0.63), Chuluut river valley (r
2=0.75), and Khongor-Ulun (r
2=0.52).
These results were depending on distance between our study sites and meteorological stations.
Therefore, we did not interest absolute values, but focused only on their trends.
Considering the graphic of the trends (Figure 3.2-b), we employed the APHRODITE data
for total annual precipitation. Their trends showed good correlations in the Dakhad depression
and Chuluut river valley (r2
=0.77-0.82). However, the insignificant correlations were observed
in the Mungut river valley, and Khongor-Ulun. Because, these sites are located so far from the
meteorological stations (approximately 100-150 km).
In the Nalaikh depression, the correlations showed good trends (r2
=0.71, r2
=0.60) for air
temperature and precipitation, respectively (Figure 3.3-a). This site located near to the
meteorological station. However, in the Galuut depression, and Erdene, the correlations between
NCEP/NCAR, APHRODITE, and observation data for temperature and precipitations were
represents sparse. One of the potential factor is likely consistent with the distances between study
sites and meteorological stations.

24
Figure 3.2. Scatterplots of the reanalysis data (NCEP/NCAR & APHRODITE), and
observation data such as Renchinkhlumbe, Numrug, Terkh, and Bayan-Ulgii from 1979 to
2007 in the continuous permafrost zone: a) NCEP/NCAR and observation data for MAAT
(C°), and b) APHRODITE and station data for total annual P (mm).
Study site
Study site

25
Figure 3.3. Scatterplots of the reanalysis data, and meteorological station data such as
Ulaanbaatar, Galuut, and Erdene from 1979 to 2007 in the isolated permafrost zone: a)
NCEP/NCAR and station data for MAAT (C°), and b) APHRODITE and station data for
total annual P (mm).
Study site
Study site
26
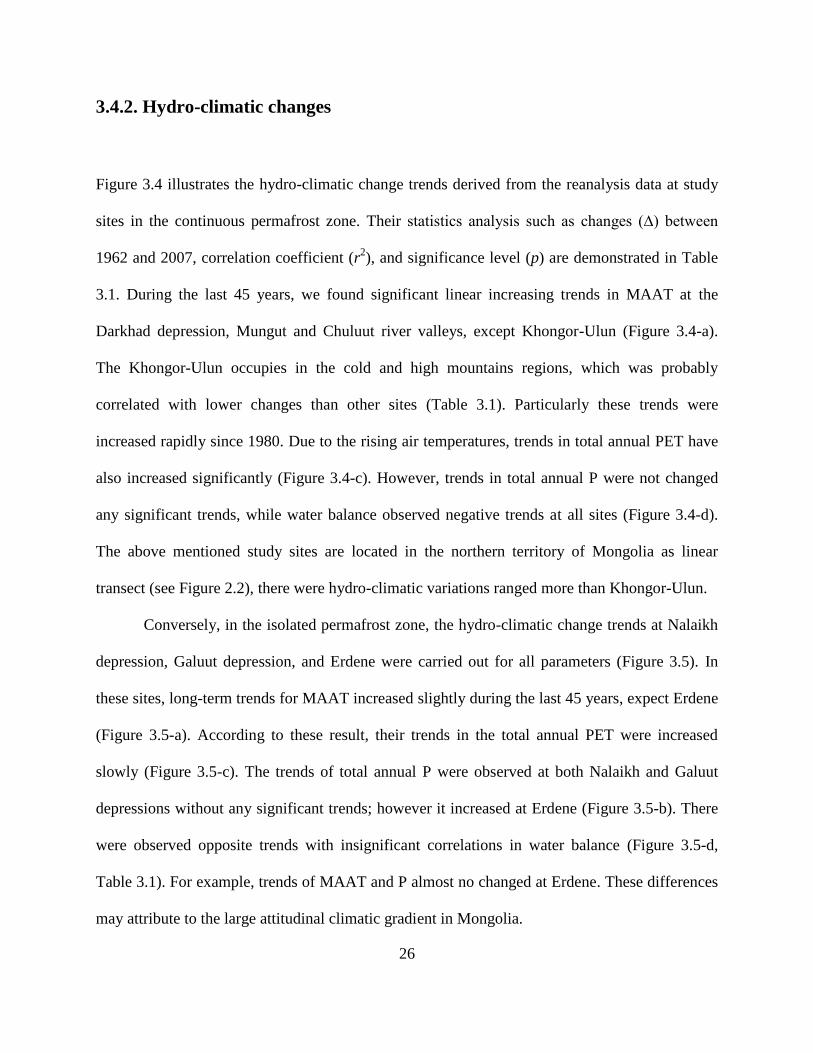
3.4.2. Hydro-climatic changes
Figure 3.4 illustrates the hydro-climatic change trends derived from the reanalysis data at study
sites in the continuous permafrost zone. Their statistics analysis such as changes (∆) between
1962 and 2007, correlation coefficient (r2), and significance level (p) are demonstrated in Table
3.1. During the last 45 years, we found significant linear increasing trends in MAAT at the
Darkhad depression, Mungut and Chuluut river valleys, except Khongor-Ulun (Figure 3.4-a).
The Khongor-Ulun occupies in the cold and high mountains regions, which was probably
correlated with lower changes than other sites (Table 3.1). Particularly these trends were
increased rapidly since 1980. Due to the rising air temperatures, trends in total annual PET have
also increased significantly (Figure 3.4-c). However, trends in total annual P were not changed
any significant trends, while water balance observed negative trends at all sites (Figure 3.4-d).
The above mentioned study sites are located in the northern territory of Mongolia as linear
transect (see Figure 2.2), there were hydro-climatic variations ranged more than Khongor-Ulun.
Conversely, in the isolated permafrost zone, the hydro-climatic change trends at Nalaikh
depression, Galuut depression, and Erdene were carried out for all parameters (Figure 3.5). In
these sites, long-term trends for MAAT increased slightly during the last 45 years, expect Erdene
(Figure 3.5-a). According to these result, their trends in the total annual PET were increased
slowly (Figure 3.5-c). The trends of total annual P were observed at both Nalaikh and Galuut
depressions without any significant trends; however it increased at Erdene (Figure 3.5-b). There
were observed opposite trends with insignificant correlations in water balance (Figure 3.5-d,
Table 3.1). For example, trends of MAAT and P almost no changed at Erdene. These differences
may attribute to the large attitudinal climatic gradient in Mongolia.

27
Figure 3.4. Hydro-climatic change trends (5-years moving average) at Darkhad, Mungut river
valley, Chuluut river valley, and Khongor-Ulun in the continuous permafrost zone from 1962
to 2007: a) mean annual air temperature (MAAT), b) total annual precipitation (P), c) total
annual potential evapotranspiration (PET), and d) water balance (P-PET).

28
Figure 3.5. Hydro-climatic change trends (5-years moving average) at Nalaikh depression,
Galuut depression, and Erdene in the isolated permafrost zone from 1962 to 2007: a) mean
annual air temperature (MAAT), b) total annual precipitation (P), c) total annual potential
evapotranspiration (PET), and d) water balance (P-PET).

29
Table 3.1. Linear trends in mean annual air temperature (MAAT), total annual precipitation (P), total
annual potential evapotranspiration (PET), and water balance (P-PET). Their statistical parameters
were computed such as changes (∆) between 1962 and 2007, coefficients of determination of the liner
trend (r2) and significance level (p).
Study sites
MAAT (°C) Total Annual P
(mm)
Total Annual PET
(mm)
Water Balance
(P-PET) (mm)
∆ r2
p ∆ r2
p ∆ r2
p ∆ r2
p
Darkhad
depression 2.65 0.33 0.001 -13.4 0.00 0.443 81.5 0.41 0.001 -94.9 0.17 0.001
Mungut river
valley 2.34 0.32 0.001 -14.9 0.00 0.651 81.6 0.41 0.001 -96.5 0.16 0.001
Chuluut river
valley 2.39 0.33 0.001 -100.5 0.21 0.006 94.9 0.47 0.001 -195.4 0.40 0.001
Khongor-Ulun 0.79 0.05 0.034 -41.5 0.03 0.044 37.8 0.13 0.001 -79.3 0.09 0.003
Nalaikh
depression 0.91 0.15 0.011 -49.1 0.06 0.007 4.63 0.00 0.721 -53.7 0.03 0.049
Galuut
depression 1.62 0.23 0.001 -32.3 0.04 0.076 66.1 0.29 0.001 -98.4 0.24 0.001
Erdene 0.35 0.01 0.322 +27.8 0.13 0.017 14.6 0.01 0.093 +13.2 0.00 0.859
30
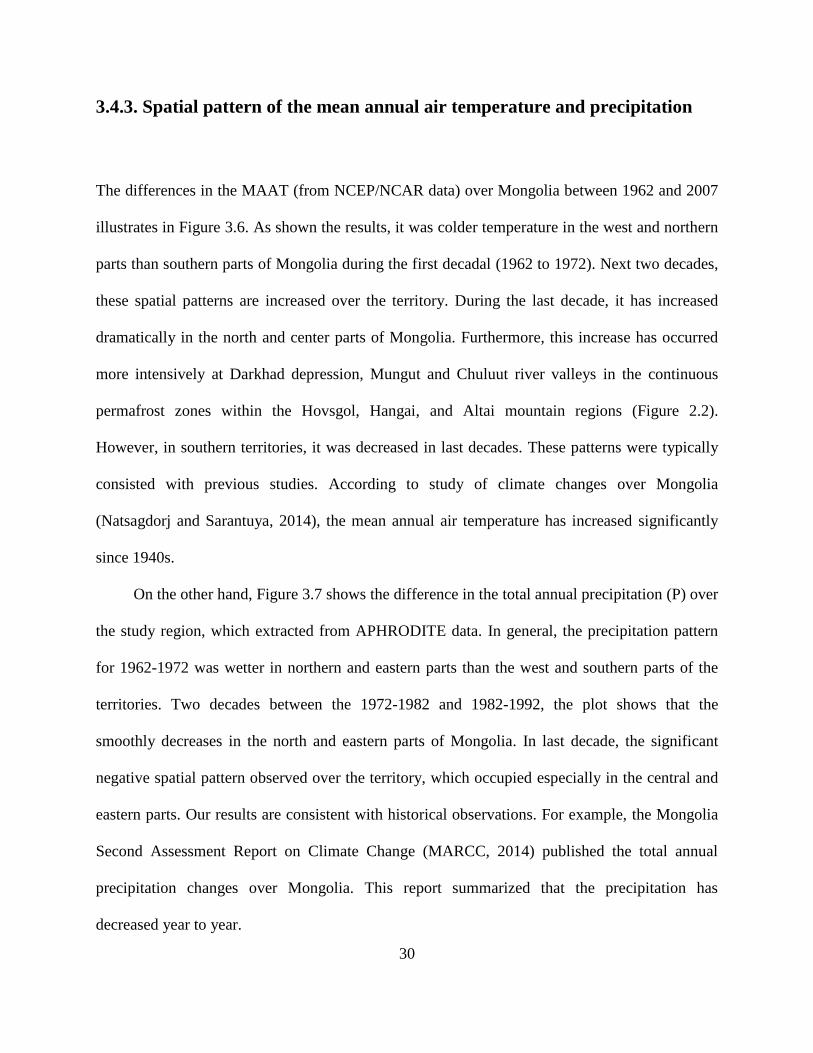
3.4.3. Spatial pattern of the mean annual air temperature and precipitation
The differences in the MAAT (from NCEP/NCAR data) over Mongolia between 1962 and 2007
illustrates in Figure 3.6. As shown the results, it was colder temperature in the west and northern
parts than southern parts of Mongolia during the first decadal (1962 to 1972). Next two decades,
these spatial patterns are increased over the territory. During the last decade, it has increased
dramatically in the north and center parts of Mongolia. Furthermore, this increase has occurred
more intensively at Darkhad depression, Mungut and Chuluut river valleys in the continuous
permafrost zones within the Hovsgol, Hangai, and Altai mountain regions (Figure 2.2).
However, in southern territories, it was decreased in last decades. These patterns were typically
consisted with previous studies. According to study of climate changes over Mongolia
(Natsagdorj and Sarantuya, 2014), the mean annual air temperature has increased significantly
since 1940s.
On the other hand, Figure 3.7 shows the difference in the total annual precipitation (P) over
the study region, which extracted from APHRODITE data. In general, the precipitation pattern
for 1962-1972 was wetter in northern and eastern parts than the west and southern parts of the
territories. Two decades between the 1972-1982 and 1982-1992, the plot shows that the
smoothly decreases in the north and eastern parts of Mongolia. In last decade, the significant
negative spatial pattern observed over the territory, which occupied especially in the central and
eastern parts. Our results are consistent with historical observations. For example, the Mongolia
Second Assessment Report on Climate Change (MARCC, 2014) published the total annual
precipitation changes over Mongolia. This report summarized that the precipitation has
decreased year to year.

31
1962-1972
1972-1982
1982-1992
1992-2007
Figure 3.6. The differences in the mean annual air temperature (MAAT, °C) during the
last four decades in Mongolia based on the NCEP/NCAR data. Black points indicate the
position of all study sites.

32
1962-1972
1972-1982
1982-1992
1992-2007
Figure 3.7. The differences in the total annual precipitation (P, mm) during the last four
decades in Mongolia based on the APHRODITE data. Black points indicate the position
of all study sites.
33
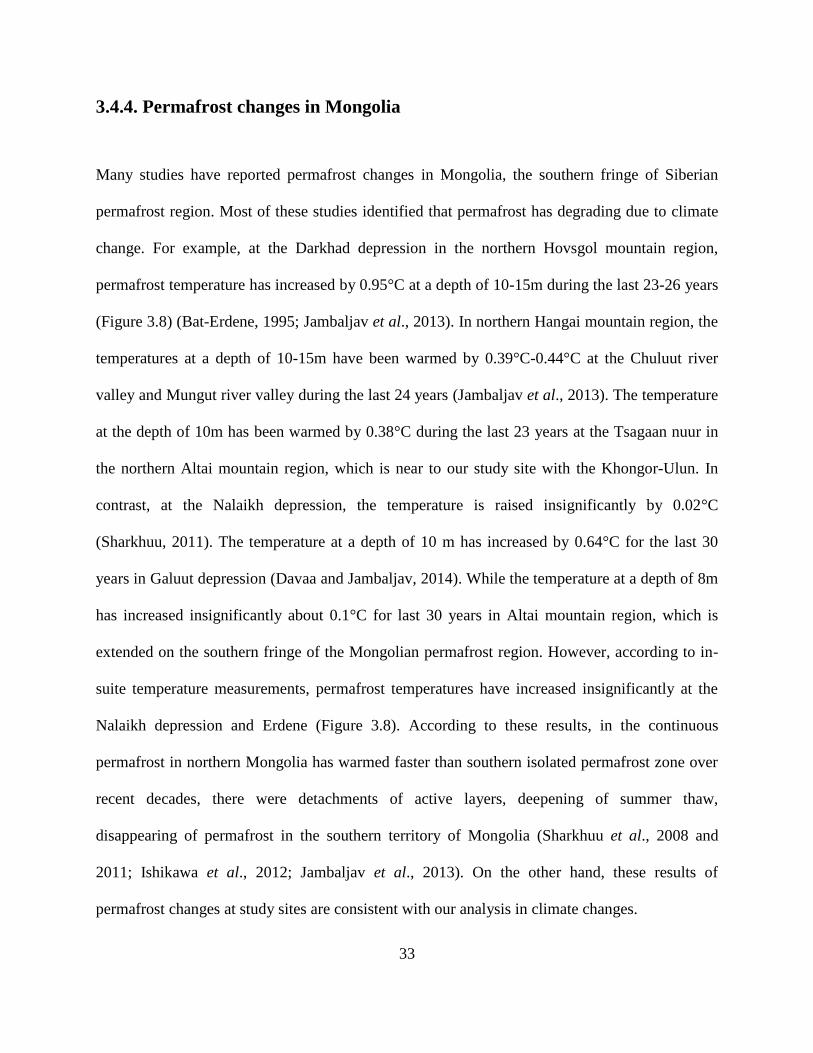
3.4.4. Permafrost changes in Mongolia
Many studies have reported permafrost changes in Mongolia, the southern fringe of Siberian
permafrost region. Most of these studies identified that permafrost has degrading due to climate
change. For example, at the Darkhad depression in the northern Hovsgol mountain region,
permafrost temperature has increased by 0.95°C at a depth of 10-15m during the last 23-26 years
(Figure 3.8) (Bat-Erdene, 1995; Jambaljav et al., 2013). In northern Hangai mountain region, the
temperatures at a depth of 10-15m have been warmed by 0.39°C-0.44°C at the Chuluut river
valley and Mungut river valley during the last 24 years (Jambaljav et al., 2013). The temperature
at the depth of 10m has been warmed by 0.38°C during the last 23 years at the Tsagaan nuur in
the northern Altai mountain region, which is near to our study site with the Khongor-Ulun. In
contrast, at the Nalaikh depression, the temperature is raised insignificantly by 0.02°C
(Sharkhuu, 2011). The temperature at a depth of 10 m has increased by 0.64°C for the last 30
years in Galuut depression (Davaa and Jambaljav, 2014). While the temperature at a depth of 8m
has increased insignificantly about 0.1°C for last 30 years in Altai mountain region, which is
extended on the southern fringe of the Mongolian permafrost region. However, according to in-
suite temperature measurements, permafrost temperatures have increased insignificantly at the
Nalaikh depression and Erdene (Figure 3.8). According to these results, in the continuous
permafrost in northern Mongolia has warmed faster than southern isolated permafrost zone over
recent decades, there were detachments of active layers, deepening of summer thaw,
disappearing of permafrost in the southern territory of Mongolia (Sharkhuu et al., 2008 and
2011; Ishikawa et al., 2012; Jambaljav et al., 2013). On the other hand, these results of
permafrost changes at study sites are consistent with our analysis in climate changes.

34
Figure 3.8. Permafrost changes at study sites in Mongolia from 1973 to 2009.
35
3.5. Conclusion
This study examined the climate and permafrost changes at seven study sites using long-term
reanalysis data and article review for permafrost data. The main conclusions of this chapter are
as follows:
1. During the last decade, mean annual air temperature and potential evapotranspiration
have increased dramatically in the north and center parts of Mongolia. This increase
has occurred more intensively at Darkhad depression, Mungut and Chuluut river
valleys in the continuous permafrost zones within the Hovsgol, Hangai, and Altai
mountain regions. However, such parameters were increased slightly in the southern
isolated permafrost. These patterns might have correlated to higher latitude gradients.
On the other hand, this study observed the negative water balance at all sites during
the same period, except a site (Erdene).
2. According to previous studies on permafrost, it is temperature increased at all study
sites, especially northern continuous permafrost zone (Darkhad deoression, Mungur,
and Chuluut river valleys). Recent degradation of permafrost in Mongolia is almost
similar to with other permafrost regions.

36
Chapter IV. Thermokarst lake changes in the continuous
and isolated permafrost zones from 1962 to 2007
4.1 Introduction
Thermokarst lake is one of the most obvious form of permafrost degradation in the northern
hemisphere (Morgenstren et al., 2011). Recently, northern permafrost regions are dotted with
tens of thousands of thermokarst lakes (Grosse et al., 2013). Thermokarst lakes have their largest
distribution in Arctic and sub-Arctic regions with ice-rich unconsolidated sediments, poorly
consolidated and ice-rich bedrock, and mountain valleys (Figure 4.1). They strongly influence
the surface energy balance in permafrost regions with feedbacks on the ground thermal regime
(Jorgenson et al., 2010). Thus, the lateral and vertical dynamics of thermokarst lake change
result in complex interactions with topography, stream, neighboring lakes, and permafrost (Jones
et al., 2011). Given current climate change it is important to conduct studies on thermokarst lake
dynamics as they are through to be indicator of the climate change on the permafrost landscape.
A suite of recent studies have utilized remotely sensed imagery to document changes in
thermokarst lake extent in various locations across the Arctic and sub-Arctic. Long-term
thermokarst lake dynamics in Canada and Alaska suggest that the inter-annual variation in
precipitation is the dominant driver of surface area extent (Plug et al., 2008). Inter-annual
variation in lake evaporation is generally less than precipitation, although recent trends in the
duration of open water season due to earlier ice-out suggest potentially increasing summer
evaporative losses from lakes (Labrecque et al., 2009). Since thermokarst lakes develop and

37
expand through degradation of surface permafrost, much interest exists in how these lakes are
changing with amplified climate warming. In a remote-sensing study, Smith et al. (2005)
analyzed lake change between 1973 and 1997–98 and found that thermokarst lakes in Siberia
increased in surface area extent and number in the continuous permafrost zone, which was
attributed to lake expansion through shoreline erosion. However, lake area and number decreased
in the discontinuous to isolated permafrost zones, which was attributed to the penetration of
taliks and subsurface drainage. This mechanism of thermokarst lake drainage has also been
documented in Alaska, detailing lake-groundwater connectivity and vertical hydraulic gradients
for a discontinuous permafrost environment (Yoshikawa and Hinzman, 2003). Riordan et al.
(2006) found dramatic trends of thermokarst lake shrinkage in the discontinuous permafrost zone
in Alaska and attributed these changes to increasing evapotranspiration.
Figure 4.1. Arctic and sub-Arctic map showing probable thermokarst lake regions (map
compiled by Grosse et al., 2013). Black rectangle represents location of study region.

38
A similar geographical shift of permafrost zones from continuous in northern territories
to sporadic in the southern region is seen in Mongolia. In addition, climatic gradients occur
along latitude as well; it is, colder and wetter in the northern territory, and warmer and drier in
the southern territory. Although this environmental gradient would be interesting for
comprehensive analysis of the factors controlling dynamics of thermokarst lakes, which have
extensively developed on the depressions and valleys in the Altai, Hangai, Hovsgol and Hentii
Mountain regions (Tserensodnom, 2000; Tumurbaatar, 2001; Nishida and Jamsran, 2009), the
spatiotemporal changes of these lakes have not been investigated in Mongolia so far.
This chapter focuses on the thermokarst lake dynamics at seven study sites in different
permafrost zones of Mongolia, where numerous thermokarst lakes exist on the depressions and
valleys within the various mountain regions. First objective of this chapter is to provide
quantitative information on the temporal and spatial changes of thermokarst lakes in Mongolia
using a time series of high-resolution satellite imagery. Second objective is to categorize the
extracted lake areas into four distinct classes in order to better understand the lake dynamics of
individual lake size categories. Last objective is to calculate water volume changes of
thermokarst lakes at two depressions, where numerous thermokarst lakes concentrate. High
resolution satellite imagery, digital elevation model, and field measurements were employed for
these objectives during long-term time period.

39
4.2. Remote sensing datasets
In this study, we used satellite imagery to identify areal extent of thermokarst lakes at study sites
for three different time series: 1962-1968, 1999-2001 and 2006-2007. All images were acquired
during the summer season. For this analysis we employed 14 Corona scenes, 7 Landsat
Enhanced Thematic Mapper Plus (ETM+) images, and 7 Advanced Land Observing Satellite
(ALOS) Advanced Visible and Near Infrared Radiometer type 2 (AVNIR-2) satellite data sets.
The detail information of these satellite datasets are illustrated in Table 4.1.
Table 4.1. The Corona KH-4, KH-4A, and KH-4B, Landsat ETM+, and ALOS/AVNIR-2 satellite
images used in this study.
Study sites Corona
date
Corona KH-4, KH-
4A, and KH-4B
Landsat
date
Landsat ETM+ ALOS date ALOS/AVNIR-
2
Darkhad
depression
1962/08/29 DS009044048AF031
DS009044048AA036
1999/09/05 LE71370241999248 2006/09/17 AVNIR-2
Mungut
river valley
1968/08/29 DS009044048AF024
DS009044048AA029
2000/09/07 LE71370262000251 2006/08/29 AVNIR-2
Chuluut
river valley
1966/09/21 DS1035-1006DF075
DS1035-1006DA076
1999/08/22 LE71350271999234 2007/06/17 AVNIR-2
Khongor-
Ulun
1968/08/11 DS1104-1055DF009
DS1104-1055DA015
2000/09/10 LE71420262000254 2007/09/01 AVNIR-2
Nalaikh
depression
1968/08/16 DS1104-2135DF001
DS1104-2135DA005
1999/08/10 LE71310271999222 2007/06/07 AVNIR-2
Galuut
depression
1964/06/10 DS1006-2085DF054
DS1104-2085DA058
1999/08/22 LE71350281999234 2007/09/27 AVNIR-2
Erdene 1962/08/29 DS009044032AF024
DS009044032AA030
2001/09/19 LE71360292001262 2006/08/31 AVNIR-2

40
4.2.1. Corona KH-4, KH-4A, and KH-4B satellite data
The high resolution images acquired from Corona camera systems KH-4, KH-4A, and KH-4B
were declassified in 1995 and first became available in a digital format in 2003 (McDonald,
1995). The systems were equipped with both forward and backward looking cameras (Table 4.1).
The satellite images have a higher spatial resolution (3.00-7.6 m, 2.70-7.6 m, and 1.8-7.6 m,
respectively) at a scale between 1:247,500 and 1:305,000 and wide area coverage. They are
available from the USGS Earth Resources Observation Systems (EROS) Data Center (Goossens
et al., 2006). The Corona images were scanned at 3600 dpi (7 microns) by USGS/EROS in a
digital format. Of the total (15 × 290 km, 17 × 232 km and 14 × 188 km, respectively) ground
coverage of Corona KH-4, KH-4A and KH-4B images.
On the other hand, Corona strips are known to contain significant geometric distortions
(Altamaier et al., 2002; Goossens et al., 2006). Geometric distortion inherent in filmstrips from a
panoramic camera need to be corrected achieve precise results (Slama, 1980). Typical geometric
distortions of Corona image gradually increase from the center to the extreme edges of an image
along the track (Figure 4.2).
Figure 4.2. Geometric distortion of Corona satellite image (Slama, 1980).

41
Corona satellite images have been used for several years for different scientific purposes
and in different regions of the world. It is especially useful in developing countries where aerial
photographs in wide area coverage are rarely available. Beside the presented technical
advantages, the high resolution Corona satellite images are also available at a reasonable price
and provide an excellent opportunity for change detection studies.
Table 4.2. Important parameters of high-resolution satellite images used in this study.
Parameters Corona KH-4 Corona KH-4A Corona KH-4B ALOS Landsat
Time period 1962-1963 1963-1969 1967-1972 2006-2007 1999-
2001
Camera/Sensor
type panoramic panoramic panoramic AVNIR-2 ETM+
Focal length (cm) 60.96 60.96 60.96 790
Ground resolution
(m) 7.6 2.7 1.8 10
15
(band 8)
Flight altitude (km) 170 to 460 185 150 691
Pixel scan (μm) 7 (3600dpi) 7 (3600dpi) 7 (3600dpi)
Ground coverage
(km) 15 x 290 17 x 232 14 x 188 70 x70 185x170
42
4.2.2. Landsat ETM+ satellite data
Landsat satellite imagery is available since 1972 from six satellites in the Landsat series. These
satellites have been a major component of the National Aeronautics and Space Administration's
(NASA) Earth observation program, with three primary sensors evolving over thirty years: MSS
(Multi-spectral Scanner), TM (Thematic Mapper), and ETM+ (Enhanced Thematic Mapper
Plus). Landsat supplies high resolution visible and infrared imagery, with thermal imagery and a
panchromatic image also available from the ETM+ sensor. The observation bands of ETM+ are
essentially the same seven bands as TM, and the newly added panchromatic band 8, with a high
resolution of 15m was added.
Landsat ETM+ panchromatic images were obtained from the USGS Global Visualization
Viewer with limited cloud coverage conditions. The Landsat ETM+ images have spatial
resolutions of 30 m (multispectral) and 15 m (panchromatic) over an area of 180 × 180 km. In
this study, a total seven Landsat ETM+ panchromatic images (band 8) from 1999 to 2001 were
used (Table 4.1). All data sets were registered to Universal Transverse Mercator (UTM)
coordinate system zones 46N, 47N and 48N, and elevation referenced to World Geodetic System
(WGS) 1984 datum.
4.2.3. ALOS/AVNIR-2 satellite data
Advanced Land Observation Satellite (ALOS) has launched in 2006 from the Tanegashima
Space Center. This satellite was one of the world's largest earth observation satellites whose
function is to collect global and high resolution land observation data. The ALOS satellite sensor
43
had three remote-sensing instruments: the Panchromatic Remote-sensing Instrument for Stereo
Mapping (PRISM) and for digital elevation models (DEM). The Advanced Visible and Near
Infrared Radiometer type 2 (AVNIR-2) for precise land coverage observation, and the Phased
Array type L-band Synthetic Aperture Radar (PALSAR) for day-and-night and all-weather land
observation and enabled precise land coverage observation and can collect enough data by itself
for mapping on a scale of 25,000:1, without relying on points of reference on the ground.
ALOS/AVNIR-2 satellite images between 2006 and 2007 (Table 4.1) were acquired from
the Japan Aerospace Exploration Agency (JAXA). ALOS/AVNIR-2 is a satellite sensor that has
four spectral bands and performance with a resolution of 10 m in the visible and near-infrared
bands (ground coverage 70 × 70 km).
4.3. Remote sensing method
4.3.1. Orthorectification and image co-registrations
In this study, two major image processing tasks carried out were: orthorectification and image
co-registration. Orthorectification is the process of making orthorectified images, which are in
principle, map like distortion free corrected products. To geometrically correct and orthorectify
the Corona strips, we used a non-metric camera model in ERDAS Leica Photogrammetric Suite
(LPS) version 9.3 software at the PLANAR SD 2020 Stereo MirrorTM
/3D Monitor, where we
assigned the focal length, the pixel size of the scanned scenes and flight altitude of the camera
platform (Goossens et al., 2006).
The most of our study sites are mountain regions with high and medium relief. In such
areas, some elevation data is essential to remove relief-induced displacement such as a kind of
44
geometric distortion; otherwise large distortion may occur. The Advanced Spaceborne Thermal
Emission and Reflection (ASTER) Global Digital Elevation Model (GDEM) with 30 m spatial
resolutions were used as the source of elevation data to orthorectify all datasets in this study. On
the other hand, I also surveyed the ground control points at each study site and surrounding area
during the field work on August to September 2009 which are needed to ortho-rectify of the high
resolution satellite images. As stated earlier, ground control points (GCPs) for all data except the
field data were collected from the Landsat ETM+ and ASTER GDEM in each site. We used the
bundle block adjustment procedure in LPS to simultaneously estimate the orientation of all
Corona strips based on ~100 ground control points (GCPs). Latitude (x) and longitude (y)
information of the GCPs were extracted from the panchromatic Landsat ETM+ images (band 8),
whereas elevation information (z) was extracted from the GDEM. All tie points were
automatically placed at the correct locations on both images (forward and backward) in LPS. The
Corona stripes were mosaicked in LPS to produce the final orthorectified images. Root mean
square error (RMSE) of the aerial triangulation for Corona images were less than 15 m because
of the small subset of data used at study sites.
Image co-registration is a process of mutually georefenrencing already orthorectified
images based on a reference image for an accurate alignment of the dataset. These tasks were
accomplished in order using remote sensing software as ERDAS IMAGINE. The
ALOS/AVNIR-2 images were co-registered using the Landsat ETM+ images in AutoSync
workstation of ERDAS based on at least 500 GCPs for each image. The orthorectified ALOS
images were a maximum RMSE of less than 1 m. For consistency of data processing and
presentation, all images were processed with different the projection parameters depends on

45
location of each study sites: categories-UTM WGS 84 North, projection-zones 46-48, spheroid-
WGS 84, datum-WGS 84, and horizontal and vertical measurement unit-m.
4.3.2. Delineation and analyzing of thermokarst lakes
Firstly, we attempted the automated classification of lake areas based on the orthorectified
images. However, we abandoned the automated spectral approaches commonly used in digital
image processing due to the issues where cloud shadows creating dark patches that were
spectrally similar to water, and sun glint near the edges of these images creating bright small
lakes were confused bright target such as meadows (Grosse et al., 2005).
We visually delineated all lake areas from each satellite image at study sites that were
above a minimum area of 0.1 ha (1000 m2). The shoreline of each lake was manually traced as a
polygon area using ArcGIS 9.1 software (Figure 4.3). Finally, we categorized the extracted lake
areas into four distinct classes (0.1 - 1 ha, 1 - 10 ha, 10 - 100 ha, and 100 - 1000 ha) in order to
better understand the lake dynamics of individual lake size categories.
Figure 4.3. An example of the delineation for lake areas from Corona satellite image.

46
4.3.3. Lake water volume calculation
The water volume of lake and its vitiations over time are fundamental properties, reflect the
balance between precipitation and evaporation (Brooks and Hayashi, 2002; Medina et al., 2010).
The volume of water bodies at particular times can be calculated by several methods depending
on the availability data. The volume of water in lakes is commonly estimated by combining data
of water level variations with accurate bathymetry and shore topography maps (Lu et al., 2013).
However, bathymetry and shore topography data are often difficult to acquire, due to high costs
for labour and equipment. The development of satellite remote-sensing images over the last half
century makes it possible to obtain information on the changes of water surface area of lakes at
different times (Wu and Lu, 2010). It is easy to understand that a series of water surface
boundaries of lake at different water levels are similar to contour lines on a digital elevation map
and can be used to determine the boundaries elevation of that lake.
The main objective is to estimate the water volume of thermokarst lakes at the Darkhad
and Galuut depressions. This study is used simple method for calculating of the water volume of
lakes by using the extracted boundaries of lake areas in 1962/64, 1999, and 2006/07, ASTER
GDEM, and mathematical equations relating area and volume to depth and water level (Figure
4.4). First, all lake water level (elevation) for each time period are determined by the extracted
boundaries of lake areas and DEM data with 3D patch analysis at Global Mapper software.
Finally, lake water volumes (between 1962/64 and 2006/07) were calculated by the basic
mathematical equations. In addition, the appeared and disappeared lakes at two depressions were
removed from this analysis.
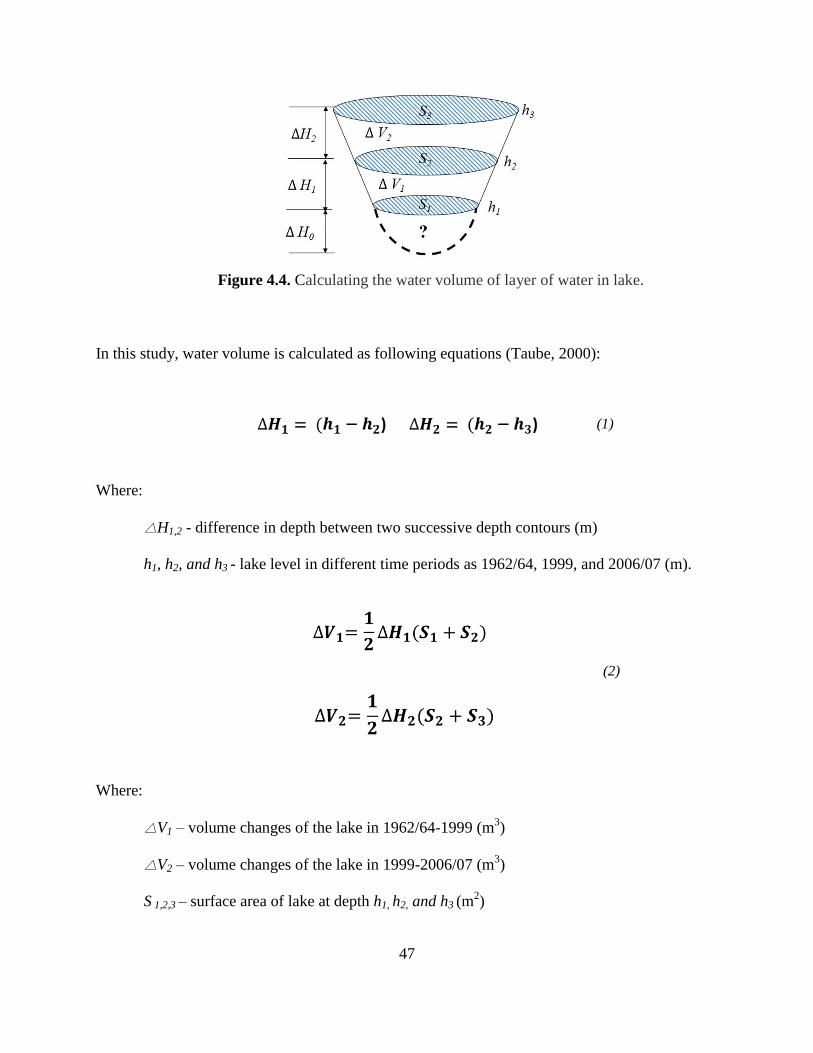
47
Figure 4.4. Calculating the water volume of layer of water in lake.
In this study, water volume is calculated as following equations (Taube, 2000):
Where:
△H1,2 - difference in depth between two successive depth contours (m)
h1, h2, and h3 - lake level in different time periods as 1962/64, 1999, and 2006/07 (m).
Where:
△V1 – volume changes of the lake in 1962/64-1999 (m3)
△V2 – volume changes of the lake in 1999-2006/07 (m3)
S 1,2,3 – surface area of lake at depth h1, h2, and h3 (m2)
(1)
(2)

48
4.4. Results and Discussions
4.4.1. Thermokarst lake changes from 1962 to 2007
Figure 4.5 illustrates the mapping of thermokarst lake changes in the Darkhad depression in the
continuous permafrost zone from 1962 to 2006, where is a predominance of small lakes. There
were total 84 new lakes formed with a water surface area of 338 ha between 1962 and 2006,
while the area of 173 lakes increased by 384 ha. However, some decreases in the lake areas were
also observed. The surface area of four lakes did not change during the observation periods.
Overall, the number of lakes increased from 296 to 371, and their area increased from 3350 ha to
3651 ha between 1962 and 2007, which are summarized in Table 4.3.
The behavior of these thermokarst lakes in the Darkhad depression can be explained by
the several factors such as climate and permafrost changes. According to the climate change
analysis, the water balance was showed negative value during last 45 years, which did not
attribute with the expansion and formation of thermokarst lake. However, there are significant
increasing trend resulted in the mean annual air temperature. This atmospheric warming
probably leads to permafrost degradation. Cause, permafrost temperature has increased
significantly in the site (Bat-Erdene, 1995, Jambaljav et al., 2013). Furthermore, the depression
has an extensive flat floor underlain by thick lacustrine sediments (Ishikawa and Jambaljav,
2015) with deep ice-rich permafrost (Photo 1.1) and shallow active layers (Sharkhuu, 2011).
These local permafrost conditions are more relative to thermokarst lake changes. Therefore, that
the expansion and formation of lakes probably caused by the thaw of ice-rich permafrost. In
continuous permafrost zone, Smith et al. (2005) reported the increasing number and area of
thermokarst lakes in the western Siberia, and is similar with observations from this study site.

49
The number of lakes in the Mungut river valley remained stable throughout the whole
study period (Table 4.3). However, area of lakes decreased from 161 ha to 122 ha between 1962
and 2007. Nevertheless, two lakes with a surface area of small sizes were formed, as illustrated
in Figures 4.6. Thermokart lakes in the Chuluut river valley showed a decrease from 34 to 29 in
number, and area (59 ha to 39 ha) respectively during the study period. Three small lakes
appeared in this site (Figures 4.7). These results demonstrate the importance of analyzing both
lake number and area to provide meaningful information for understanding thermokarst lake
dynamics.
Permafrost temperatures have increased in these sites (Jambaljav et al., 2013). According
to Sharkhuu (2011), thermokarst processes at the Chuluut river valley have started in late 1980s
and leads to maximum subsidence in the late 1990s. For these valleys, ground ice contents
characterized by medium and lacustrine sediments (Sharkhuu, 1969; Yoshikawa et al., 2013).
Figure 4.5. Mapping of thermokarst lake changes in the Darkhad depression from 1962 to 2006
in the continuous permafrost zone: very large lakes such as Dood Nuur, Targan, and Tsoidon
are excluded from the recent analysis.
Tsoidon

50
These combined facts at these sites may cause that formation of small lakes in the river valleys.
As shown the results of climate changes, the negative water balances were observed at both sites,
which might be attributed to the shrinking lake area and numbers.
Our results in lake number and area at both sites differ from Alaskan permafrost regions.
Jones et al. (2011) identified thermokarst lake changes in Alaska. They found that lakes had
increased in number, and decreased in area following partial drainage of large lakes.
Table 4.3. Thermokarst lake changes by sites and by permafrost zones over the study period.
Study sites
1962-1968 1999-2001 2006-2007
Number Area (ha) Number Area (ha) Number Area (ha)
Darkhad
depression 296 3350 350 3612 371 3651
Mungut river
valley 7 161 7 141 7 122
Chuluut river
valley 34 59 30 47 29 39
Khongor-Ulun 10 110 13 119 13 124
Nalaikh
depression 2 7 1 5 1 1
Galuut depression 108 409 73 371 64 367
Erdene 8 6 3 4 3 3
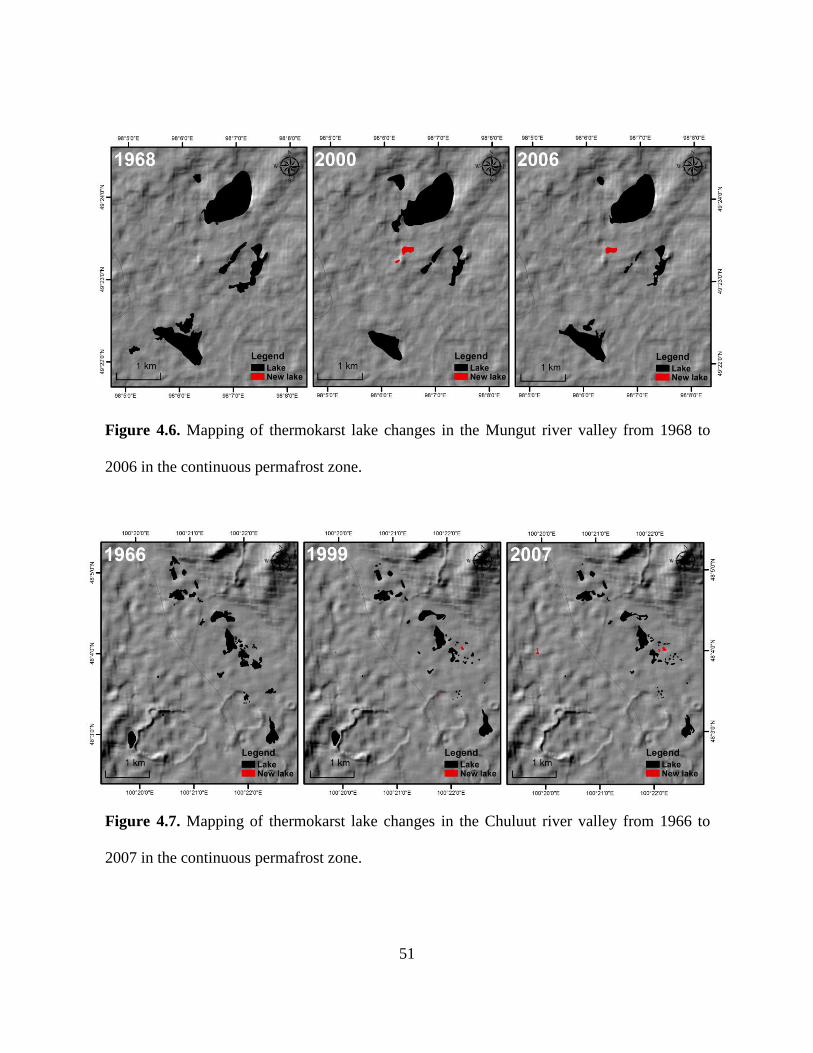
51
Figure 4.7. Mapping of thermokarst lake changes in the Chuluut river valley from 1966 to
2007 in the continuous permafrost zone.
Figure 4.6. Mapping of thermokarst lake changes in the Mungut river valley from 1968 to
2006 in the continuous permafrost zone.

52
In the Khongor-Ulun, ten lakes were delineated in 1962/68, then their number increased
by 3 in 1999/01 and later remained stable for 2006/07 (Table 4.3). Seven lakes increased in size
from 103 to 117 ha, and 3 new lakes appeared. Lake area in this site increased from 1962 to 2007
(Figure 4.8). These lake behaviors in the Khongor-Ulun are showed similar trends with Darkhad
depression. However, ground ice-content has characterized low in the Khongor-Ulun. According
to long-term borehole measurement, permafrost temperature is increased significantly due to the
warming air temperature (Figure 3.4, and Figure 3.8). We did not found any significant changes
in total annual precipitation. On the other hand, previous study reported (Tserensodnom, 2002),
thermokarst lakes probably formed as a result of permafrost degradation, which are connected to
channel outflow in this site, they did not determine their changes of area and number. These
information can be supported to the expansion and formation of thermokarst lakes.
Figure 4.8. Mapping of thermokarst lake changes in the Khongor-Ulun from 1968 to 2007 in
the continuous permafrost zone.

53
For the continuous permafrost zone, the total number of lakes increased by 73, from 347
in 1962/68 to 420 in 2006/07 (Table 4.3). The total lake area shows similar pattern as the lake
number, increasing the total area of lakes over the study period (1962/68 to 2006/07) from 3680
ha to 3936 ha.
On the other hand, for the isolated permafrost zone, only two lakes were determined in
the Nalaikh depression (1968), and one of them drained before 1999/01 (Figure 4.9, and Table
4.3). In terms of lake area change, there was a decrease of 6 ha for this site. While, the observed
lakes in Galuut depression decreased both in number and area from 1962 to 2007, respectively.
Many small lakes were disappeared in this area (Figure 4.10). In the Erdene, lake number shows
a decrease of 5 between 1962/68 and 1999/01, but remained stable afterwards for 2006/07
(Figure 4.9, and Table 4.3). However, lake area decreased by 3 ha in 2006/07. In the isolated
permafrost zone, the investigated thermokarst lakes have greatly decreased in number and area
between 1962 and 2007 as result of lake drainage. Overall, a total of 118 lakes (422 ha) were
delineated in the isolated permafrost zone for the period of 1962/68. The number of lakes
decreased by 50 lakes in 2007. The total area of lakes decreased by 51 ha during the last 45
years.
The above mentioned results in the Nalaikh depression, Galuut depression, and Erdene
are could be explained by long-term climate and permafrost changes. The observed reduction in
number and area of lakes in the southern isolated permafrost zone may be due to a combination
of several factors including the air temperature, the potential evapotranspiration, and negative
water balance, as well as permafrost disappearance (Sharkhuu et al., 2008 and 2011; Ishikawa et
al., 2012; Jambaljav et al., 2013). The mean annual air temperature trends increased slightly in
these sites in the isolated permafrost zone from 1962 to 2007 (Table 3.1). Furthermore, a
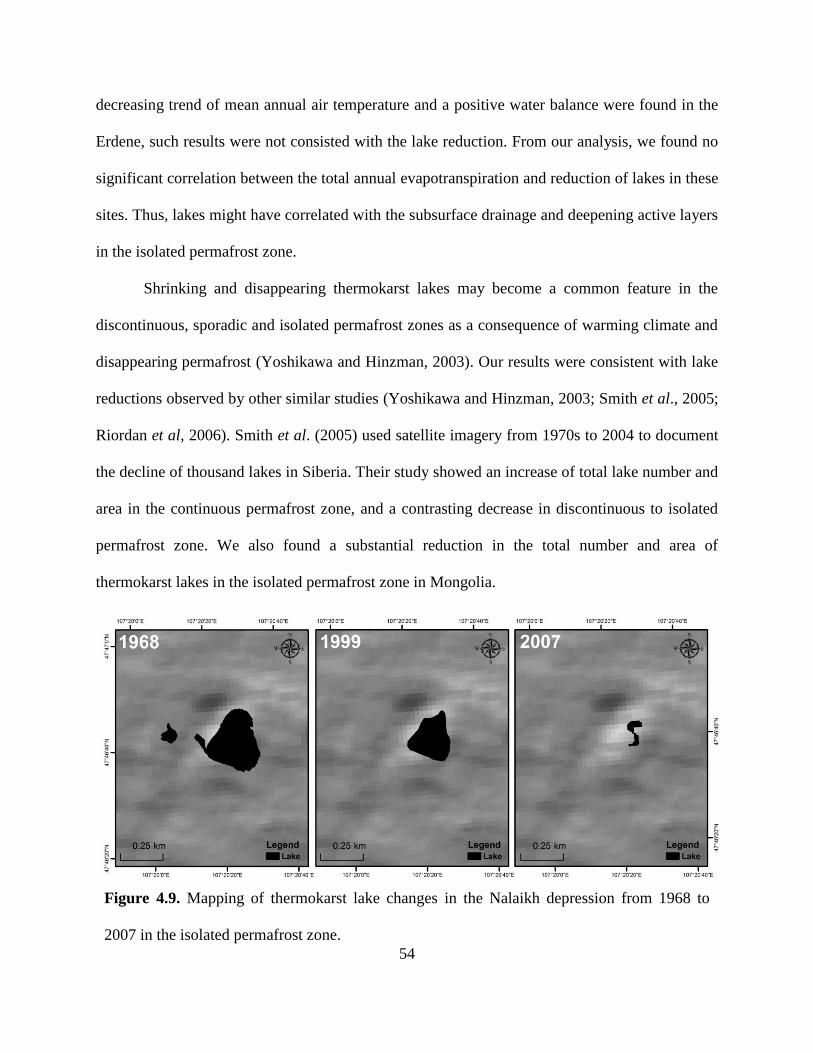
54
decreasing trend of mean annual air temperature and a positive water balance were found in the
Erdene, such results were not consisted with the lake reduction. From our analysis, we found no
significant correlation between the total annual evapotranspiration and reduction of lakes in these
sites. Thus, lakes might have correlated with the subsurface drainage and deepening active layers
in the isolated permafrost zone.
Shrinking and disappearing thermokarst lakes may become a common feature in the
discontinuous, sporadic and isolated permafrost zones as a consequence of warming climate and
disappearing permafrost (Yoshikawa and Hinzman, 2003). Our results were consistent with lake
reductions observed by other similar studies (Yoshikawa and Hinzman, 2003; Smith et al., 2005;
Riordan et al, 2006). Smith et al. (2005) used satellite imagery from 1970s to 2004 to document
the decline of thousand lakes in Siberia. Their study showed an increase of total lake number and
area in the continuous permafrost zone, and a contrasting decrease in discontinuous to isolated
permafrost zone. We also found a substantial reduction in the total number and area of
thermokarst lakes in the isolated permafrost zone in Mongolia.
Figure 4.9. Mapping of thermokarst lake changes in the Nalaikh depression from 1968 to
2007 in the isolated permafrost zone.
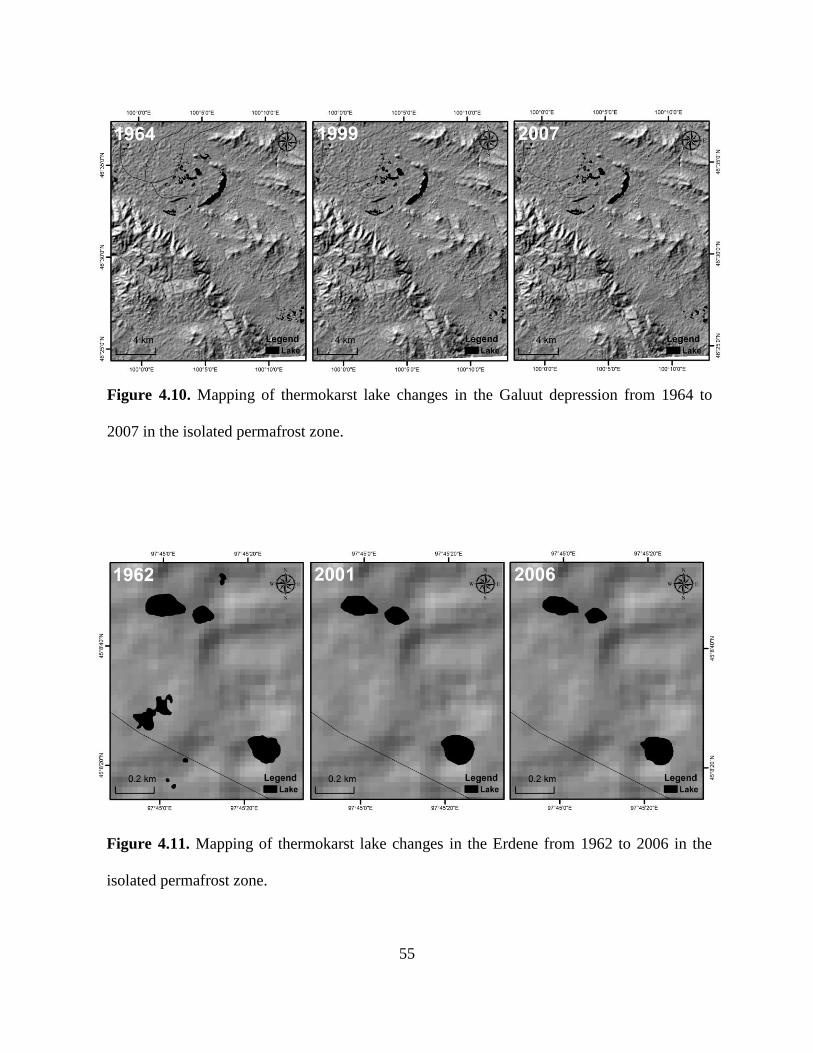
55
Figure 4.11. Mapping of thermokarst lake changes in the Erdene from 1962 to 2006 in the
isolated permafrost zone.
Figure 4.10. Mapping of thermokarst lake changes in the Galuut depression from 1964 to
2007 in the isolated permafrost zone.
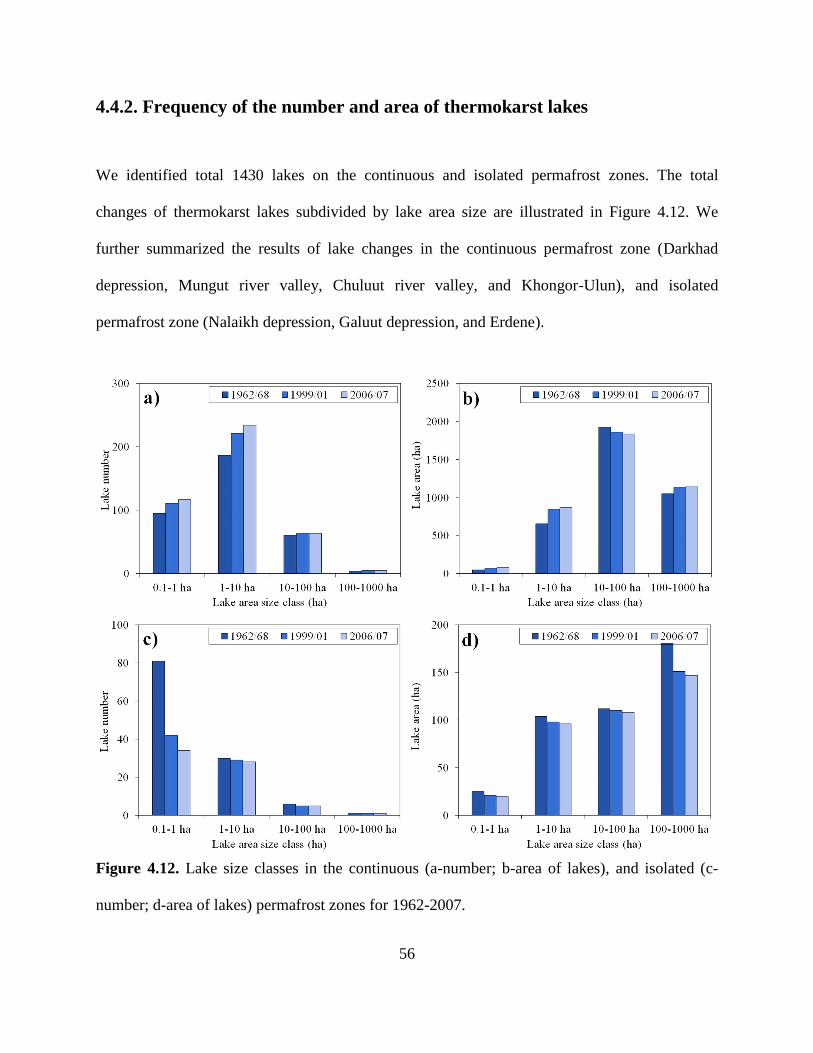
56
4.4.2. Frequency of the number and area of thermokarst lakes
We identified total 1430 lakes on the continuous and isolated permafrost zones. The total
changes of thermokarst lakes subdivided by lake area size are illustrated in Figure 4.12. We
further summarized the results of lake changes in the continuous permafrost zone (Darkhad
depression, Mungut river valley, Chuluut river valley, and Khongor-Ulun), and isolated
permafrost zone (Nalaikh depression, Galuut depression, and Erdene).
Figure 4.12. Lake size classes in the continuous (a-number; b-area of lakes), and isolated (c-
number; d-area of lakes) permafrost zones for 1962-2007.

57
The number and area of lakes in size class 0.1 - 1 ha greatly increased from 95 (48 ha) in
1962/68, to 111 (73 ha) in 1999/01, to 117 (77 ha) in 2006/07 in the continuous permafrost zone
(Figure 4.12-a, and b). The next smallest size class of 1-10 ha also experienced a large change in
both lake number (+47) and area (+215 ha) from 1962 to 2007. The number of lakes (10 - 100
ha) increased slightly (+3) from 1962 to 2007, however, their area decreased by 91 ha during the
same time period. The large size class 100 - 1000 ha also expanded by 103 ha in the area of lakes
since 1962, and the lake number actually increased in 1999/01 and remained stable in 2006/07.
The increases in both number and area of lakes can be explained by the formation of new
lakes as results of permafrost thaw due to climate warming. Figure 4.13 shows one example for
the formation of new thermokarst lake based on visual inspection.
Figure 4.13. An example for the formation of new thermokarst lake in the Darkhad depression,
the continuous permafrost zone from 1962 (a – Corona satellite image) to 2006 (b – ALOS
satellite image).

58
In the isolated permafrost zone, there is a predominance of smaller lakes as shown in
(Figure 4.12-c, and d), which divides thermokarst lakes into four size classes. From 1962 to 2007,
the number of lakes decreased in all size classes (except 100 - 1000 ha), and the most reduction
(from 117 lakes to 67 lakes) occurred in lake size classes between 0.1 - 1 ha and 10 - 100 ha.
Large lake size class of 100-1000 ha was 181 ha (1962/68) and decreased by 34 ha (2006/07).
Between 1962 and 2007, lake area decreased in all lake classes. In fact, fifty lakes completely
disappeared in the Nalaikh depression, Galuut depression, and Erdene. Most of the disappeared
lakes had an area of less than 1 ha. Figure 4.14 illustrates the disappeared thermokarst lake in the
Galuut depression between 1964 and 2007.
These results highlight the importance of the high resolution images, which can reveal
complex spatiotemporal changes to better understand of lake dynamics of individual lake size
categories
Figure 4.14. An example of thermokarst lake that has been drained in the Galuut depression, the
isolated permafrost zone from 1964 to 2007. Blue polygon represents the water surface area of
lake.

59
4.4.3. Volume changes of thermokarst lakes (1962-2007)
This study is calculated volume changes of thermokarst lakes in Darkhad and Galuut depressions,
which are located in the continuous and isolated permafrost zones, respectively. Most of
thermokarst lakes in the study were demonstrated for these depressions. Their topography were
quite different on the floor (Figure 4.15). As shown the map, Darkhad depression has
characterized by the highly undulated terrain (Figure 4.15-a), in contrast, it is gently undulated
landscapes in Galuut depression (Figure 4.15-b). These differences on topography and
permafrost conditions would be interesting for volume changes of thermokarst lakes.
Figure 4.16 shows the volume changes of thermokarst lakes in the continuous and
isolated permafrost zones. The estimated volume changes of thermokarst lakes in the Darkhad
depression are increased largely for lake sizes (1-10 ha to 100-1000 ha) between 1962 and 2007
(Figure 4.16-a), however, they increased slightly in small lake (0.1-1 ha). This result is likely
attributed to the increasing area and number of lakes in the depression (Table 4.3). Number of
small lakes was increased rapidly during the observation period (Figure 4.12), which may be
linked to the undulated terrain. The area and volume changes of thermokarst lakes probably
initiated as ice-rich permafrost thaws.
Figure 4.15. Topographic maps of (a) Darkhad depression in the continuous permafrost zone,
and (b) Galuut depression in the isolated permafrost zone. Map produced by ASTER GDEM.
a)
b)

60
Figure 4.16. Volume changes of thermokarst lakes: (a) Darkhad depression in the continuous
permafrost zone, and (b) Galuut depression in the isolated permafrost zone.
61
In the isolated permafrost zone, volume changes of thermokarst lakes showed a
decreasing trends for all lake sizes during the last 45 years, especially lake sizes larger than 10 ha
(Figure 4.15-b). This would be consistent with the above mentioned results on number and area
of lakes in the depression. During the observation period, lakes were disappeared and decreased
in the area (Table 4.3), which directly influenced for volume changes of these lakes. One
possible reason for the decreasing volume changes of lakes may be linked to smooth topography
or subsurface drainage of permafrost.
62
4.5. Conclusion
The main conclusions of this chapter are as follows:
1. This study demonstrated that high-resolution Corona, Landsat ETM+, and
ALOS/AVNIR-2 satellite imagery are more useful for precise delineation of
thermokarst lakes area.
2. In the continuous permafrost zone, total surface area and number of thermokarst
lakes increased by +21% (347 to 420), and +7% (3680ha to 3936 ha), respectively. In
contrary, their decreased by -40% (118 to 68) in number, and -10% (422 ha to 371 ha)
in area. These results likely attributed with the appearing and disappearing lakes.
3. We found significant differences in the spatio-temporal dynamics of thermokarst
lakes in the continuous and isolated permafrost zones. This difference concerns the
lake size classification. The number and area of small lakes between 0.1 and 10 ha
increased more dramatically than large lakes in the continuous permafrost zone. In the
isolated permafrost zone, however, small lakes (0.1 - 1 ha) had a significant reduction
in number in the isolated permafrost zone.
4. The volume changes of thermokarst lakes are increased in the continuous
permafrost zones (Darkhad depression), which is likely attributed to the increasing
area and number of lakes in the depression. In the isolated permafrost zone, in contrast,
that the volume changes observed only negative values (Galuut depression).

63
Chapter V. General discussion
This study identified the total 1430 thermokarst lakes in the continuous and isolated permafrost
zones during the last 45 years. Contrasting changes in thermokarst lake dynamics were observed
at seven study sites in Mongolia. That the results showed spatially heterogeneous patterns in lake
changes with identified increasing and decreasing lake number and areas for the continuous
permafrost sites. The increase in both number and area of lakes in the Darkhad depression and
Khongor-Ulun can be explained by the formation of new lakes as results of permafrost thaw due
to ongoing atmospheric warming. While many new lakes were found in the Darkhad depression,
where total of 53 lakes appeared in 142 ha in 1999/01 and 32 lakes appeared in 24 ha in 2006/07,
only a few lakes appeared in Khongor-Ulun. Decrease in Mungut river valley and Chuluut river
valley is a result of large lakes become fragmented following partial drainage. These results
demonstrate the importance of analyzing both lake number and area to provide meaningful
information for understanding thermokarst lake dynamics. The overall growth in the area of
lakes was due mostly to the expansion and appearance of lakes. Total numbers of lakes have
increased by 85 in the continuous permafrost zone. This is demonstrated by the appearance of
small lakes with areas of less than 10 ha. An increase in the number of lakes was reported in the
west Siberian continuous permafrost zone (Smith et al., 2005). In this study, we found a similar
trend in the continuous permafrost zone in Mongolia. However, in the isolated permafrost zone,
lake area and the number of lakes are decreasing, which is similar to the trend observed in other
regions (Yoshikawa and Hinzman, 2003; Smith et al., 2005; Riordan et al., 2006).
We attribute the increase in area and number of lakes observed in the continuous
permafrost zone to ongoing warming (Figures 3.6 and 3.8), which has been found as the main

64
driver for thermokarst lake expansion in this permafrost zone (Smith et al., 2005; Jorgenson et
al., 2006). During the last 45 years, MAAT and PET increased significantly at the Darkhad
depression, Mungut and Chuluut river valleys, and Khongor-Ulun in the northern continuous
permafrost zone which are correlated with horizontal distribution of MAAT pattern. Such
persistent warming trend has enhanced the permafrost degradation in northern Mongolia (Davaa
and Jambaljav, 2014). As a result, new thermokarst lakes were probably formed in the
continuous permafrost zone (Figure 4.12 and 4.13) may due to ice-rich permafrost thaw and
ground surface subsidence.
On the other hand, the observed reduction in number and area of lakes in the southern
isolated permafrost zone may be due to a combination of several factors including the air
temperature, the potential evapotranspiration, and negative water balance, as well as permafrost
disappearance (Davaa and Jambaljav, 2014). The MAAT trend increased slightly at Nalaikh
depression and Galuut depression in the isolated permafrost zone from 1962 to 2007.
Furthermore, a decreasing trend of MAAT with an increasing P was found at Erdene, such
results were not consisted with the lake reduction. From our analysis, we found no significant
correlation between the total annual PET and reduction of lakes in these sites. However, the total
annual PET was higher at Nalaikh depression, Galuut depression, and Erdene in the isolated
permafrost zone than Darkhad depression, Mungut river valley, Chuluut river valley, and
Khongor-Ulun in the continuous permafrost zone. Potentially, the reduction in area and number
of thermokarst lakes, especially small lakes, it likely associated with negative water balance (P-
PET), the disappearing permafrost and subsurface drainage observed in the isolated permafrost
zone (Yoshikawa and Hinzman, 2003; Riordan et al., 2006).
65
Chapter VI. General conclusion
This thesis quantified spatiotemporal changes of thermokarst lakes dynamics at seven sites in the
continuous and isolated permafrost zones of Mongolia from 1962 to 2007 using high-resolution
Corona KH-4, KH-4A, and KH-4B, Landsat ETM+ (panchromatic), and ALOS/AVNIR-2
satellite imagery. The following conclusions are demonstrated from this study.
1. We found contrasting changes of thermokarst lake dynamics in the continuous and
isolated permafrost zones. Thermokarst lakes in the continuous permafrost zone
have increased significantly in number and area during the last 45 years. However,
they decreased both number and area in the isolated permafrost.
2. The dramatic increase in number of smaller lakes with sizes between 0.1 - 1 ha and
1 - 10 ha compared to larger lakes (10 - 100 ha and 100-1000 ha) in the continuous
permafrost zone is likely as a result of permafrost degradation due to increasing
temperature and evaporations. However, small lakes (0.1 - 1 ha) had a significant
reduction in number in the isolated permafrost zone. The reduction of thermokarst
lake number and area might have attribute to a combination of disappearing
permafrost, deepening of the active layer and an increase water loss in this
permafrost zone.
3. The changes of thermokarst lakes in Mongolia are likely attributed to shifts in
climate regimes and local permafrost conditions. Since 1962, the mean annual air
temperature and potential evapotranspiration have increased significantly in the
northern continuous permafrost zone compared to the southern isolated permafrost
zone. Due to ongoing atmospheric warming without any significant trend in annual

66
precipitation, patches of ice-rich subsurface have thawed, and the number and area
of lakes have accordingly developed in the continuous permafrost zone. Shrinking
of thermokarst lakes in the isolated permafrost zone may be due to disappearing
permafrost, deepening of the active layer, and increased water loss through surface
evaporation and subsurface drainage.
4. The volume changes of thermokarst lakes are increased in the continuous
permafrost zones (Darkhad depression), which is likely attributed to the increasing
area and number of lakes in the depression. In the isolated permafrost zone, in
contrast, that the volume changes observed only negative values (Galuut
depression).
5. The time series data of high-resolution satellite imagery demonstrated useful in
determining changes in the number and areal extent of thermokarst lakes greater
than 0.1 ha in Mongolia from 1962 to 2007.
6. This study provides the first baseline information of thermokarst lake changes
across Mongolia, filling the gap in sub-Arctic lake inventories at regional scales
such as the southern fringe of Siberian permafrost region.

67
References
Anderson L, Birks J, Rover J, Guldager N. 2013. Control on recent Alaskan lake changes
identified from water isotopes and remote sensing, Journal of Geophysical Research Letter,
40: 3413-3418.
Andresen CG, Lougheed VL. 2014. Disappearing Arctic Tundra Ponds: Fine-Scale Analysis of
Surface Hydrology in Drained Thaw Lake Basins over a 65 Year Period (1948-2013).
Journal of Geophysical Research, Biogeosciences, 120, 466-479.
http://onlinelibrary.wiley.com/doi/10.1002/2014JG002778/epdf
Altamaier A, Kany Ch. 2002. Digital surface model generation from CORONA satellite images.
Photogrammetry and Remote Sensing 56: 221-235.
Assessments of Impacts and Adaptations to Climate Change (AIACC), 2005.
Bat-Erdene D. 1995. Heat flow of rocks in the territory of Mongolia and its impact on the
permafrost. Questions of Geography of Mongolia 30: 45-60 (in Mongolia).
Biskaborn BK, Herzschuh U, Bolshiyanov DY, Schwamborn G, Diekmann B. 2013.
Thermokarst processes and depositional events in a Tundra lake, northeastern Siberia.
Permafrost and Periglacial Processes 24: 160-174. DOI: 10.1002/ppp.1769.
Brooks RT, Hayashi M. 2002. Depth-Area-Volume and Hydroperiod Relationships of
Ephemeral (Vernal) Forest Pools in Southern New England. Wetlands 22: 247–255.
Brown RJE, PeweTL. 1973. Distribution of permafrost in North America and its relationship to
the environmental: a review, 1963-1973; in Proceedings Second International Conference
68
on Permafrost, North American Contribution, National Academy of Sciences, Washington,
D.C., p 71-100.
Brown J, Ferrians OJ, Heginbottom JA, Melnikov ES. 1997. Circum-Arctic map of permafrost
and ground-ice conditions. Circum-Pacific Map Series CP-45, scale 1:10,000,000, 1 sheet.
US Geological Survey in Cooperation with the Circum-Pacific Council for Energy and
Mineral Resources.
Dagvador D, Khuldorj B, Aldover RZ. 2009. In: Mongolia Assessment Report on Climate
Change 2009. First Edition. Ulaanbaatar, Mongolia. Vol. 1: 1-228.
Davaa G, Jambaljav Ya. 2014. Water resources, glacier and permafrost. In: Mongolia-Second
Assessment Report on Climate Change, Second Edition. Davagdorj D, Batjargal Z,
Natsagdorj L (eds). Ulaanbaatar: Mongolia; Vol. 2: 109-127.
Dorjsuren Ch. 2014. Forest ecosystem. In: Mongolia-Second Assessment Report on Climate
Change, Second Edition. Dagvadorj D, Batjargal Z, Natsagdorj L (eds). Ulaanbaatar:
Mongolia; Vol. 2: 94-100.
Dashora A, Lohani B, Malik JN. 2007. A Repository of Earth Resource Information-CORONA
satellite program. Current Science, 92, 926–932.
http://home.iitk.ac.in/~javed/malik%20sir%20papers/10-Dashora-etal-Curr-Sci-2007.pdf
Frohn R C, Hinkel KM, Eisner WR. 2005. Satellite remote sensing classification of thaw lakes
and drained thaw lake basins on the North Slope of Alaska, Remote Sensing Environment,
97, 116–126.
Goossens R, Wulf AD, Bourgeois J, Cheyle W, Willems T. 2006. Satellite imagery and
archaeology: the example of Corona in the Altai Mountains. Journal of Archaeological

69
Science 33: 745-755.
Grosse G, Schirrmeister L, Kunitsky VV, Hubberten HW. (2005) The Use of CORONA Images
in Remote Sensing of Periglacial Geomorphology: An Illustration from the NE-Siberian
Coast. Permafrost and Periglacial Processes, 16, 163-172.
http://onlinelibrary.wiley.com/doi/10.1002/ppp.509/pdf
Grosse G, Jones B, Arp C. 2013. Thermokarst lakes, drainage, and drained basins. In: John
Shroder F (Editor-in chief), Giardino R, Harbor J (Volume Editors). Treatise on
Geomorphology, Vol 8, Glacial and Periglacial Geomorphology, San Diego: Academic
Press; 325-353.
Hinkel KM, Jones MB, Eisner RW, Cuomo JC, Beck AR, Frohn R. 2007. Methods to assess
natural and anthropogenic thaw lake drainage on the western Arctic coastal plain of northern
Alaska. Journal of Geophysical Research 112: F02S16.
Hinkel KM, Lenters JD, Sheng Y, Lyons EA, Beck EA, Eisner WR, Maurer EF, Wang J, and
Potter BL. 2012. Thermokarst lakes on the Arctic coastal plain of Alaska: spatial and
temporal variability in summer water temperature. Permafrost and Periglacial Processes 23:
207-217.
Hinzman, L.D., Goring, D.J. and Kane, D.L. 1998. A Distributed Thermal Model for Calculating
Soil Thermal Temperature Profiles and Depth of Thaw in Permafrost Regions. Journal of
Geophysical Research, 103, 975-991.
Intergovernmental Panel on Climate Change (IPCC). 2013.
Ishikawa M, Zhang Y, Kadota T, Ohata T. 2006. Hydrothermal regimes of the dry active layer.
Water Resource Research 42:W04401. DOI:10.1029/2005WR004200.
70
Ishikawa M, Sharkhuu N, Jambaljav Ya, Davaa G, Yoshikawa K, Ohata T. 2012. Thermal state
of Mongolian permafrost. In: Proceedings of the Tenth International Conference on
Permafrost. Vol 1. 25-29 June, 2012, Hinkel KM (ed). Salekhard, Russia; 173-178.
Ishikawa M, Jambaljav Ya. 2015. Formation Chronology of Arsain Pingo, Darhad Basin,
Northern Mongolia. Permafrost and Periglacial Processes, 27, 297-306.
Jambaljav Ya, Vanchig T, Battogtokh D, Saruulzaya A, Gansukh Ya, Temuujin Kh,
Amarbaysgalan Yo. 2013. Scientific Report of Long Term Monitoring on Mongolian
permafrost region. Dorjgotov D, Ed. Institute of Geography, Mongolian Academy of
Sciences, Ulaanbaatar, Mongolia, 1-321.
JAXA (Japan Aerospace Exploration Agency). 2009.
Jones BM, Grosse G, Arp CD, Jones MC, Walter Anthony KM, Romanovsky VE. 2011. Modern
thermokarst lake dynamics in the continuous permafrost zone, northern Seward Peninsula,
Alaska. Journal of Geophysical Research 116:G00M03.
Jorgenson MT, Shur YL, Pullman ER. 2006. Abrupt increase in permafrost degradation in Arctic
Alaska. Geophysical Research Letter 33: 4 (L02503).
Kanlay L. 1996. The NCEP/NCAR 40-year reanalysis project. Bulletin of the American
Meteorological Society 77: 437-470.
Karlsson JM, Lyon SW, Destouni G. 2014. Temporal behavior of lake size-distribution in a
thawing permafrost landscape in northwestern Siberia. Remote Sensing 6:621-636;
doi:10.3390/rs6010621.
Krivonogova SK, Vladimir S, Sheinkmanb T, Anatoly A, Mistruykova B. 2005. Stages in the
development of the Darhad dammed lake (Northern Mongolia) during the Late Pleistocene
and Holocene, Quaternary International 136: 83–94.

71
Krivonogov SK, Yi S, Kashiwaya K, Kim JC, Narantsetseg T, Oyunchimeg T, Safonova IY,
Kazansky AY, Sitnikova T, Kim JY, Hasebe N. 2012. Solved and unsolved problems of
sedimentation, glaciation and paleolakes of the Dakhad Basin, northern Mongolia.
Quaternary Science Reviews 56: 142-163.
Labrecque S, Lacelle D, Duguay C, Lauriol B, Hawkings J. 2009. Contemporary (1951-2001)
evolution of lakes in the Old Crow Basin, northern Yukon, Canada, Remote sensing,
numerical modeling, and stable isotope analysis. Arctic 62: 225-238.
Ling F, Wu Q, Zhang T, Niu F. 2012. Modelling open-talik formation and permafrost lateral
thaw under a thermokarst lake, Beiluhe, Qinghai-Tibet Plateau. Permafrost and Periglacial
Processes 23: 312–321.
Lu Sh, Ouyang N, Wu B, Wei Y, Tesemma Z. 2013. Lake water volume calculation with time
series remote-sensing images. International Journal of Remote Sensing. Vol. 34, No.22,
7962-7973.
Manasypov RM, Pokrovsky OS, Kirpotin SN, Shirokova LS. 2014. Thermokarst lake waters
across the permafrost zones of western Siberia. The Cryosphere 8:1177-1193.
Marsh P, Russell M, Pohl S, Haywood H, Onclin C. 2009. Changes in thaw lake drainage in the
western Canadain Arctic from 1950 to 2000. Hydrological Processes 23: 145-158.
Medina CE, Gomez-Enri J, Alonso JJ, Villares P. 2010. Water Volume Variations in Lake Izabal
from In Situ Measurements and ENVISAT Radar Altimeter and Advanced Synthetic
Aperture Radar Data Products. Journal of Hydrology 382: 34–48.
Mongolia Assessment Report on Climate Change (MARCC). 2009. First Edition. Ulaanbaatar,
Mongolia. Vol. 1: 1-228.
72
Mongolia Assessment Report on Climate Change (MARCC). 2014. Second Edition.
Ulaanbaatar, Mongolia. Vol. 2: 1-302.
McCabe GJ, Markstrom SL. 2007. A Monthly Water-Balance Model Driven by a Graphical User
Interface.
McDonald RA. 1995. CORONA: Success for space reconnaissance, a look into the Cold War,
and a revolution for intelligence, Photogrammetric Engineering & Remote Sensing,
61(6):689–720.
Morgenstern A, Grosse G, Gunther F, Fedorova I, Schirrmeister L. 2011. Spatial analysis of
thermokarst lakes and basins in Yedoma landscapes of the Lena Delta. The Cryosphere 5:
849-867.
Melnikov PI. (Ed.). 1974. Geocryological Conditions of Public Republic Mongolia. Proceedings
of Joint Soviet-Mongolian Research Geological Expedition, vol. 10. Nauka, Moscow.
Natsagdorj L, Sarantuya G. 2014. Climate research and observed climate change in Mongolia.
In: Mongolia-Second Assessment Report on Climate Change, Second Edition. Dagvadorj D,
Batjargal Z, Natsagdorj L (eds). Ulaanbaatar: Mongolia; Vol. 2: 59-69.
Nishida H, Jamsran Ts (eds.). 2009. Darkhadyn wetland in Mongolia: synthesis investigation on
ecosystems. NPO Mongolia Ecology Information Center, Japan.
Niu F, Lin Zh, Liu H, Li J. 2011. Characteristics of thermokarst lakes and their influence on
permafrost in Qinghai-Tibet Plateau. Geomorphology 132: 222-233.
Oberman NG. 2008. Contemporary permafrost degradation of northern European Russia. In:
Proceedings of the 9th International Conference on Permafrost, 29 June–3 July 2008,

73
Institute of Northern Engineering, University of Alaska, Fairbanks, Kane DL, Hinkel KM
(eds). 1305–1310.
Plug LJ, Scott BM, Walls C. 2008. Tundra lake changes from 1978 to 2001 on the Tuktoyaktuk
Peninsula, western Canadian Arctic. Geophysical Research Letters 35:L03502.
DOI:10.1029/2007GL032303.
Rampton V M. 1988. Quaternary Geology of the Tuktoyaktuk Coastlands, Northwest Territories,
Mem. Geol. Surv. Can. 423: 98.
Riordan B, Verbyla D, McGuire AD. 2006. Shrinking ponds in subarctic Alaska based on 1950–
2002 remotely sensed images. Journal of Geophysical Research 111: G04002.
Romanovsky VE, Smith SL, Christiansen HH. 2010. Permafrost thermal state in the polar
Northern Hemisphere during the International Polar Year 2007-2009: A synthesis,
Permafrost Periglacial Processes 21.
Sannel ABK, Brown IA. 2010. High resolution remote sensing identification of thermokarst lake
dynamics in a subarctic peat plateau complex: Canadian Journal of Remote Sensing. 36:S1
26-40.
Slama CC, Theurer C, Henriksen SW (Eds). 1980. Manual of Photogrammetry, American
Society of Photogrammetry.
Soloviev PA. 1962. Alass relief and its origin in Central Yakutia. In: Monogoletnemerzlye
porody I soputstvuscie im yavleniya na territorii Yakutskoj ASSR. Akademi Nauk SSSR,
Moscow, pp. 38–53.
Sharkhuu N. 1969. Permafrost of Bulnai range’s plateau. Journal of Geographic Review of
Mongolia 9: 86-113.
74
Sharkhuu A, Sharkhuu N, Etzelmuller, Heggem ESF, Nelson FE, Shiklomanov NI, Goulden CE,
Brown J. 2007. Permafrost monitoring in the Hovsgol mountain region, Mongolia. Journal
of Geophysical Research 112: F02S06.
Sharkhuu N, Anarmaa Sh, Romanovsky VE, Nelson FE, Shiklomanov NI. 2008. Thermal state
of permafrost in Mongolia, In: Proceeding of the Ninth International Conference on
Permafrost, University of Fairbanks, Alaska, USA. 1633-1638.
Sharkhuu N. 2011. Field Guidebook to Mountain and Arid Land Permafrost in the Nalaikh and
Terelj Areas near Ulaanbaatar, and in the Hovsgol and Hangai mountainous regions,
Mongolia. 22-26 August 2011, Ulaanbaatar, Mongolia; 1-50.
Smith LC, Sheng Y, MacDonald GM, Hinzman LD. 2005. Disappearing Arctict lakes. Science
308: 1429.
Taube CM. 2000. Instructions for winter lake mapping. Chapter 12 in Schneider, James C. (ed.)
2000. Manual of fisheries survey methods II: with periodic updates. Michigan Department
of Natural Resources, Fisheries Special Report 25, Ann Arbor.
Tumurbaatar D. 2001. Permarfrost in the Darkhad depression of Hovsgol, In: Proceeding of the
International Symposium on Mountain and Arid Land Permafrost. Sharkhuu N (ed).
Ulaanbaatar, Mongolia; 79-82.
Tserensodnom J. 2000. In: Catalogy of Mongolain Lakes. First Edition. Ulaanbaatar, Mongolia.
Vol. 1: 1-141.
Thornthwaite CW. 1948. An approach toward a rational classification of climate: Geographical
Review, Vol. 38, 55–94.
Three Methods for Computing the Volume of a Lake Clarence M. Taube Manual of Fisheries
Survey Methods II: with periodic updates Suggested citation:
75
Wu T, Wang Q, Watanabe M, Chen J, Battogtogh D. 2009. Mapping vertical profile of
discontinuous permafrost ground penetrating radar at Nalaikh depression, Mongolia.
Environ Geology. 56:1577–1583.
Wu B, Lu S. 2011. Watershed Remote Sensing: Methodology and a Paradigm in Hai Baisn.
Journal of Remote Sensing, 15: 201–223.
Walter KM, Zimov AS, Chanton JP, D. Verbyla FS, Chapin III. 2006. Methane bubbling from
Siberian thaw lakes as a positive feedback to climate warming, Nature, 443, 71–75,
doi:10.1038/nature05040.
Walter KM, Edwards ME, Grosse G, Zimov AS, Chapin III. 2007. Thermokarst lakes as a source
of atmospheric CH4 during the last deglaciation, Science, 318, 633–636,
doi:10.1126/science.1142924.
Yatagai A, Arakawa O, Kamiguchi K, Kawamoto H, Nodzu MI, Hamada A. 2009. A 44-year
daily gridded precipitation dataset for Asia based on a dense network of rain gauges, SOLA
5:137-140. doi:10.2151/sola.2009-035.
Yoshikawa K, Hinzman LD. 2003. Shrinking Thermokarst Ponds and Groundwater Dynamics in
Discontinuous Permafrost near Council, Alaska. Permafrost and Periglacial Processes, 14,
151-160.
Zimov SA, Voropaev YV, Semiletov IP, Davidov SP, Prosiannikov SF, Chapin III, Chapin MS,
Trumbore S, Tyler S. 1997. North Siberian lakes: A methane source fueled by Pleistocene
carbon, Science, 277, 800–802, doi:10.1126/science.277.5327.800.

76
Zhao L, Wu G, Marchenko SS, Sharkhuu N. 2010. Thermal state of permafrost and active layer
in Central Asia during the International Polar Year. Permafrost and Periglacial Processes 21:
198-207.