instructional needs assessment for managing conflict
TRANSCRIPT

AN ABSTRACT OF THE THESIS OF
Ikram Saeed for the degree of Doctor of Philosophy in
Education presented on November 11 1993
Title Instructional Needs Assessment for Managing
Conflict between Watershed Resource Users in
Oregon The OWIC Case Study
Abstract approved Warren N Suzuki
The purpose of the study was to explore a needs
assessment method for suggesting target-based training
interventions for managing conflict between the resource
userinterest groups in Oregons riparian zones An
instrument was developed and then validated by an expert
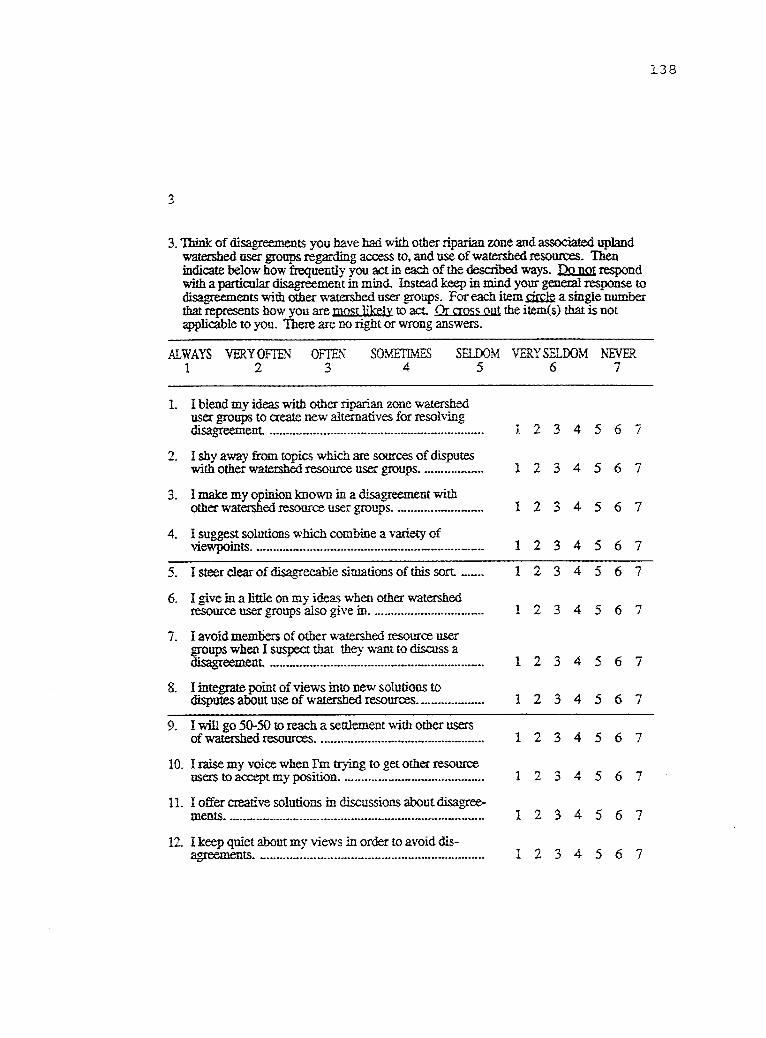
panel The questionnaire addressed three potential
conflict management factors multiple-use orientation
abundance philosophy and conflict management styles The
instrument was distributed to members of the Oregon Water
Improvement Coalition (OWIC) and to samples of its members
constituencies Responses from the environmental
business and professional groups were then compared to the
OWIC responses as well as to each others Usable
information was provided by 95 of the subjects (n = 19)
Redacted for Privacy
from OWIC and 55 of the subjects (n = 158) from the
constituencies
The OWIC and environmental group members were
relatively less multiple resource use oriented than
business and professional groups The OWIC group was
relatively more abundance philosophy oriented than
professional and business groups The professional and
business groups in turn were significantly different than
the environmentalist members Both OWIC and professional
groups were relatively more solution oriented than business
and environmentalist under the riparian zones resource use
conflict situation
The instrument appeared to be sufficiently reliable
and valid for its purpose Future research should employ
an interdisciplinary approach for improving the instrument
by adding questions on facilitating communication between
and among the interest groups The utility of gathering
information on the nonconfrontation and control conflict
management styles and philosophy of land management factors
deserves further study
Instructional Needs Assessment for Managing Conflict between Watershed Resource Users in Oregon
The OWIC Case Study
by
Ikram Saeed
A THESIS
submitted to
Oregon State University
in partial fulfillment of the requirements for the
degree of
Doctor of Philosophy
Completed November 11 1993
Commencement June 1994
APPROVED
Associate Professor of Educa ion in charge of major
he School of Education Director of he
Dean of Graduat chool
Date thesis is presented November 11 1993
Typed by researcher for Ikram Saeed
Redacted for Privacy
Redacted for Privacy
Redacted for Privacy
ACKNOWLEDGEMENTS
I am graciously thankful to almighty Allah who enabled
me to complete this project I appreciate the help of many
people and organizations who assisted in completing my
dissertation research I am forever thankful to my initial
Major Professor Dr Margaret Savige who guided me in the
design and development of the dissertation research and to
Dr William C Krueger a dissertation committee member
who guided my data collection and my understanding of
collaborative natural resource management issues I
express my sincerest thanks to the other committee members
Dr Wayne Haverson Dr Frederick W Obermiller and Dr
Arlene Holyoak for their encouragement and assistance
Because of Dr Saviges illness Dr Warren N Suzuki
graciously assumed the responsibility for guiding the final
completion of my research
I am thankful to all agencies and people who provided
financial and logistic support for my doctoral study
Pakistan Participant Training Program a joint government
cooperation between Pakistan and United States of America
My mentors Dr Agha Sajjad Haider and Dr Roger Kraynick
helped and encouraged me in my transition to the study of
instructional systems development My thanks extend to the
members of OWIC business environmental and professional
organizations who provided data to use for this study
Mawardi Hasan and Junaid Ikram for professional setting of
instrument and mailing arrangements and Chris Pyle for her
editing work
Finally to my parents Allah bless peace to the soul
of my father who died during my doctoral study my wife
Zahida Parveen my sons Junaid and Zubair and my
daughter Imama Haseeba who supported and prayed for my
success in my studies I am forever graceful
TABLE OF CONTENTS
CHAPTER
1 1 INTRODUCTION
Justification for the Study 2
Problem Statement
The OWIC Case An Example of Consensus
Conflict Management and Training
Background of the Study 3
Building 8
Intervention 10
Research Problem and Questions 13
2 REVIEW OF LITERATURE 15
Role and Limitations of Needs Analysis
Data Collection Techniques in Needs
Theoretical Framework of Conflict Management 38
Concepts and Theory of Needs Analysis 16
Concepts of Need and Needs Analysis 16
in Problem Solving 18
Needs Analysis and Training Development 22
Analysis 34
Credibility of Needs Analysis 35
Conflict Models 39
Theoretical Models of Conflict Management
Strategy d4
Theory of Conflict Management Styles 50
Constraints and Opportunities for Managing
Scarcity-Abundance Theory Assumptions 60
Natural Resource Use and Management 54
Issues of Multiple Use 54
Resources 59
3 METHODS AND PROCEDURES 66
Theoretical Framework
Population and Sample 68
Validity and Pilot Testing of
Data Collection
66
Instrument Development and Design 71
Survey Instruments for Measuring Behaviors 74
the Questionnaire 81
82
Data Analysis 83
4 RESULTS AND DISCUSSION 85
Results of Analyses of Needs Assessment Data 86
88 Resource Use Orientation
Resource Supply Philosophy 91
Conflict Management Style 94
Results of Analyses of Demographic Data 98
Gender 99
Years of Schooling 99
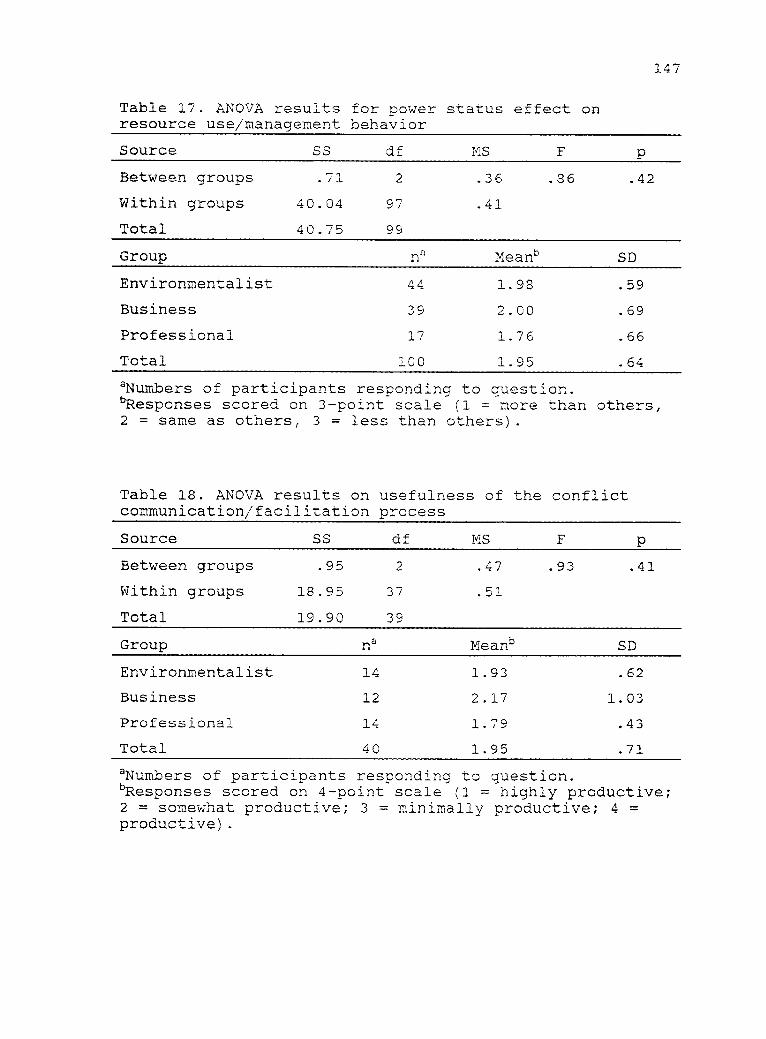
Power Status 101
Process Participation 101
Sources of Information 102
Riparian Resource UseManagement 103
Demographic Variables as Predictors 106
Credibility of the Instrument 109
5 SUMMARY AND CONCLUSIONS 115
118 Conclusions
122 REFERENCES
133 APPENDIX
APPENDIX A COVER LETTERS 133
APPENDIX D TABLES
APPENDIX B INSTRUMENT 135
APPENDIX C FOLLOW-UP POSTCARDS 145
146
LIST OF FIGURES
Figure Page
1 Conceptual model of needs assessment 25
2 Organizational elements model Three planning
domainslevels and scope of information 29
3 General model of instructional system design 33
4 Two-dimensional model of conflict management
styles 53
5 Watershed resource users needs assessment
(WRUNA) model 67
LIST OF TABLES
Table Page
1 Organizational elements with examples 30
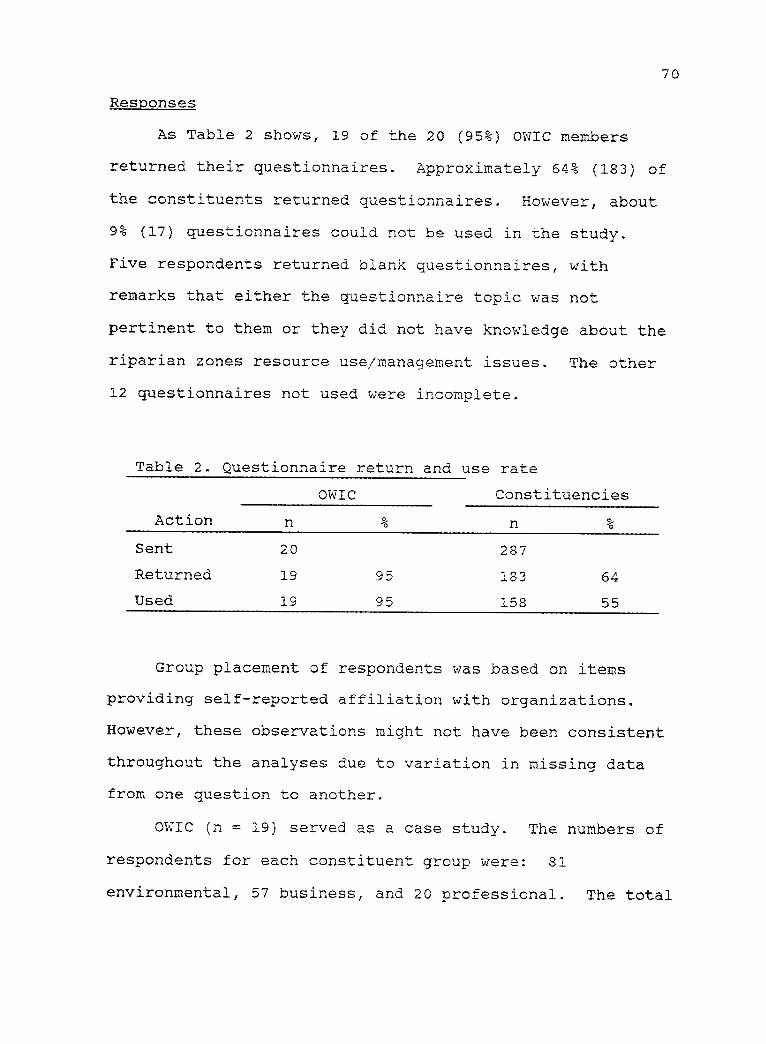
2 Questionnaire return and use rate 70
3 Comparison of Cronbachs alpha coefficients
across scales 77
4 ANOVA results on resource use orientation 89
5 ANOVA results on resource supply philosophy 92
6 ANOVA results on solution orientation
management style 95
7 ANOVA results on nonconfrontation conflict
management style 95
8 ANOVA results on control conflict management style 96
9 Gender of respondents
10 ANOVA results for years of schooling
100
100
11 ANOVA results for power status
in influencing others 102
12 Frequency of response on involvement in
communication facilitation process 102
13 Descriptive summary of results on importance
of selected sources of information 104
14 Frequency data on type of riparian land
management 106
15 Internal reliability of the WRUNA-based
instrument 110
16 Frequency data on power status in influencing
others 146
17 ANOVA results for power status effect on resource
usemanagement behavior 147
18 ANOVA results on usefulness of the conflict
communicationfacilitation process 147
19 comparison of mean ratings of importance
of sources of information 148
20 ANOVA results on importance of committee
meetings as a source of information 149
21 ANOVA results on importance of friends neighbors
and relatives as a source of information 149
22 ANOVA results on importance of displays at fairs
and other public meeting places as a source
of information 150
23 ANOVA results on importance of government
agencies as a source of information 150
24 ANOVA results on importance of extension
services as a source of information organizations 151
25 ANOVA results on importance of published
serials as a source of information 151
26 ANOVA results on importance of general membership
meetings as source of information 152
27 ANOVA results on importance of special membership
meetings as source of information 152
28 Frequency data on predicted success of conflict
management 153
29 ANOVA results on perceived degree of conflict
intensity 153
30 Summary results of regression analysis for both
environmentalist and business organizations 154
31 Summary results of regression analysis for
environmentalist organizations 155
32 Summary results of regression analysis for
business organizations 155
33 Alpha results on deletion of item for resource use
orientation 156
34 Alpha results on deletion of item for resource supply
philosophy 156
35 Alpha results on deletion of item for conflict
management styles 157
36 Correlation coefficients for OWIC 158
37 Correlation coefficients for the environment group 158
38 Correlation coefficients for the business group 159
159
39 Correlation coefficients for the
professional group
Instructional Needs Assessment for Managing Conflict between Watershed Resource Users in Oregon
The OWIC Case Study
1 INTRODUCTION
The present study was an investigation into how needs
analysis could be used in developing training interventions
for resolving conflict among natural resource userinterest
groups The study focused on userinterest groups in
potential conflict over usemanagement of watershed
resources in Oregon riparian zones The purpose of the
study was to develop a needs analysis approach for use with
these groups Toward that goal a review of literature was
conducted to establish the theoretical framework for the
needs assessment and to investigate topics relevant to
natural resource management conflict behavior and
conflict management strategies
Based on the theoretical framework an instrument was
developed to assess selected behavioralattitudinal
characteristics of the target population These
characteristics were conflict management style resource
use orientation (single vs multiple) and philosophical
orientation regarding availability of resources (scarcity
vs abundance) The instrument was reviewed by an expert
panel revised and then administered to two groups one
the Oregon Watershed Improvement Coalition (OWIC) whose
members represented watershed resource usersinterest
groups and had demonstrated consensus building the other a
2
sample representing various business and environmental
usersinterest groups at potential risk of conflict over
watershed resource usemanagement issues as well as
interested professionals
The OWIC served as a case study on the premise that
there was evidence of consensus building and methods of
achieving and maintaining it within this group It was
assumed that the profile of the OWIC group would be the
ideal It was also assumed that the profile would
indicate certain predispositions suggested by the OWIC
literature and members namely conflict management style
tending toward consensus building multiple-use
orientation and abundance philosophy
Justification for the Study
Presently conflict management strategies are generic
in nature they do not identify the behaviors or attitudes
that should be addressed by a given group It was
hypothesized that conflict management requires real changes
in behavior and attitude and that these changes can best
be achieved by identification of the behavior and attitude
needing to be changed and based on that information
development of traininginstructional interventions
specific to the target group This study investigated the
needs assessment phase of the planning process
3
Why are training interventions needed Conflict among
natural resource userinterest groups exists because of
interpersonal conflict behavior and opposing attitudes
toward natural resource use and management Conflict
resolution between conflicting parties is a temporary
measure In other words conflict resolution strategies do
not work effectively to resolve or reduce conflict
permanently Sustainable conflict management is required
for reducing the level of conflict in the long run
Possibly this can be achieved by imparting consensus-
building skills through training interventions among
userinterest groups in potential conflict situation
Background of the Study
Problem Statement
Natural resource usersinterest groups have been
divided into two categories business and environmentalist
based on their vested interests (Susskind amp Weinstein
1980) Both of these usersinterest groups value the
natural resources differently in the perspective of
anthropocentric-nonanthropocentric ethics Anthropocentric
philosophy works on a basic principle that each human being
controls hisher own environment Daly (1991) explains
All nonhuman species and their habitats are valued only instrumentally according to their capacity to satisfy human wants Their intrinsic value (capacity
4
to enjoy their own lives) is assumed to be zero (p 259)
On the other hand a nonanthropocentric perspective is the
holistic view the human being is a part of the whole
universe which includes human and nonhuman species The
proponents of the nonanthropocentric view that all species
human and nonhuman have an intrinsic right to live
(Eisgruber 1992 E Rosenberg 1992 Shearman 1990) The
nonanthropocentric philosophy holds that it is not
desirable to carry out rational economic analysis because
it does not always seem to offer a framework from which to
address development issues (Shearman 1990 p 5)
The gap between natural resource users (business
organization members) and interest groups
(environmentalist) is increasing due mainly to the lack of
direct communication and social interaction between them
(Krueger 1992) They individually as well as
collectively are increasingly becoming involved in the
process of public policy making (US Department of
Agriculture [USDA] 1990) Natural resource interest
groups are increasingly lobbying for legislation case law
(court rulings) and administrative policies that suit
their own goals resource needs and priorities beliefs
perceptions and attitudes experiences power and position
and problem-solution and conflict-resolution styles
(Clawson 1987 Howell 1981 Knapp Putnam amp Davis 1988
Miller 1982 Petak 1980 Rahim 1992 Rifkin 1992
5
Temkin amp Cummings 1986 Ting-Toomey 1984 USDA 1990
Ware 1983) These groups are greatly empowered to
influence regional development and decision-making that
lead to enactment of environmental legislation (Sullivan
1984) For example the Oregon Watershed Improvement
Coalition (OWIC) was successful in getting cooperation of
different userinterest groups to lobby legislators for
passage of the bill to establish the Governors Watershed
Enhancement Board (Krueger 1992)
Conflict and Its Consequences
Conflicts occur among natural resource usersinterest
groups mainly because of differences in their modes of
resource uses and management For example in the context
of forestry management Stankey and Clark (undated)
explained that if the resource users are not handled
appropriately then the potential for inequities
frustration and dissatisfaction grows and the stage is
set for conflict (p 26)
In the discipline of organizational conflict Rahim
(1992) defined conflict as
a process of social interaction involving a struggle over claim to resources power and status belief and other preferences and desires The aims of the parties in conflict may extend from simply attempting to gain acceptance of a preference or securing a resource advantage to the extremes of injuring or elimination of opponents (p 1)
6
Conacher (1980) distinguished two kinds of resource
userinterest group conflict
ocational conflict conflict between two or more potential uses of the same land or resource and
group conflict conflict between those who wish to see the land used differently but who are not themselves direct potential users of that land or resource (p393)
Conflict may influence positively (eg competition
motivates to win the game) and negatively (eg
frustration causes loss in productivity or the wastage of
time and resources) depending upon the nature and situation
of the conflict (Ware amp Barnes 1983) Conflict can effect
different types of responses behavioral (eg hardening
of position and avoidance of face-to-face contacts)
substantive (eg roles and responsibilities) emotional
(eg perceptions and feelings) and personal and cultural
(eg racenational origin gender and ability
disability) (Ting-Toomey 1984 Ware amp Barnes 1983)
Divergent goals between userinterest groups tend to
originate and accelerate natural resource use and
management conflicts (Fege McCarthy-Ryan Munson amp
Schreyer 1989) Attitudes toward multiple use and
allocation of resources are major factors influencing the
goals of these groups
Historically the Multiple-Use Sustained-Yield Act of
1960 formalized the conflict between single-use and
multiple-use natural resource userinterest groups In the
multiple-use scenario every citizen assumes stewardship
7
rights for using and managing resources especially open
access or common property resources The federal
government has successfully launched many acts to allocate
use of and protect the resources (Frederick amp Sedjo 1991)
These formal arrangements have not resolved the problems
between the userinterest groups for a number of reasons
(eg lack of communication and misinterpretation of
resource use values) Conflict has intensified because
each interest group translates the Multiple-Use Sustained-
Yield Act to promote its own preferred uses and disregards
the other resource users needs (Clawson 1987 Libecap
1981 Nelson 1989 Stankey amp Clark undated USDA 1990)
The visions of single-use interest groups were
critically analyzed by Hess (1992)
Those visions have attended to what people and nature ought to be not to what they could be in an environment of freedom and diversityThey have weakened our faith in the ability of people to live responsibly and in harmony with the land of the western rangeThey have diminished the ecological potential of human diversity (p xvii)
Most prevailing policy law and business systems
regarding watershed resources in America and other parts of
the world are operating under scarcity assumptions for
allocating resources with little or no regard to abundance
assumptions for sharing resources According to scarcity
philosophy each potential resource user must look out for
hisher own share The major underlying assumption behind
this view is that there is not enough resources for
everybody so each user will compete with other users for a
8
share of the limited resources and will get less than he or
she wants (Howell 1981 Krueger 1992) Conflict is
inevitable because the system is built around win-lose
criteria rather than cooperation (Ware amp Barnes 1983)
The concept of abundance theory was explained by
Krueger (1992)
The assumptions of this theory are There is more than enough people are basically needy not greedy and understanding is the best strategy (p 38 authors emphasis)
If[resources] were managed [to promote sound ecological and economical foundations]they would develop to their potential (p 39)
Scarcity assumptions encourage conflicts whereas
abundance assumptions discourage or mitigate conflicts
Hence the abundance philosophy of sharing resources would
facilitate the process of conflict negotiationconsensus
building (see Krueger 1992 Leritz 1987)
The OWIC Case An Example of Consensus Building
Consensus building between interest groups is
essential for fair use and effective management of natural
resources An example of consensus building among special
interest groups that potentially have conflicting stakes is
the Oregon Watershed Improvement Coalition (OWIC) Formed
in 1986 the OWIC promotes effective use and management of
riparian resources in Oregon It was created with a
mandate to develop communication among various
9
userinterest groups who are potentially at risk of
conflict for meeting their alternative resource use and
management needs The potential watershed resources are
used for livestock forage fish and wildlife habitat water
storage aesthetic enjoyment and recreation and aquifer
recharge
According to OWIC guidelines each member has full
liberty to participate in the affairs of OWIC for enhancing
understanding between members as well as among others To
avoid power relations between members the OWIC has no
formal hierarchical structure The OWIC operating
strategies allow each member to share hisher concerns
regarding management of site-specific watershed issues
Thus all the decisions made by the OWIC members are based
on mutual consensus building (see Krueger 1992)
Presently OWIC has 20 members including a publicist
Most members represent different regional and state
organizations Six are environmental groups Oregon Izaak
Walton League Oregon Trout Oregon Environmental Council
Pacific Rivers Council Oregon Chapter Sierra Club and The
Nature Conservancy Three of the organizations fall into
the business group category Oregon Cattlemens
Association Oregon Forest Industries Council and Oregon
Small Woodlands Association A professional association
the Pacific Northwest Section of the Society for Range
Management is also represented Although the business and
environmental interest groups continue to have conflicting
10
viewpoints regrading the use of riparian areas consensus
is reached among them
Diffusion of information to OWIC members is a process
of consensus building Simultaneously the OWIC members
have striven to bring along the constituent organizations
which they represent smoothing out the heterogenous
effects and achieving consensus among them
Conflict Management and Training Intervention
Conflict management strategies are widely discussed in
the literature on communication business and industrial
organizations social psychology and environmental
protection science Contemporary theories on conflict
management suggest that conflicts can be successfully
mitigated or reconciled if the participating interest
groups
a Build trust between each other
b Understand each others concerns
c Incorporate conflict management styles values
d Provide opportunity for joint fact finding (or
search for common groundsneeds) and
e Encourage cooperation and collaboration
(Krueger 1992 Susskind amp Weinstein 1980 Ware
amp Barnes 1983 Wondolleck 1988)
Since the mid 1970s academicians and practitioners have
explored conflict management techniques as mentioned
11
above rather than traditional adversarial practices
inherent in conflict resolution models Ethical models of
conflict management are referred to by terms such as win-
win no-lose collaborative integrative and system
(Filley 1975 Howell 1981 Nadler Hackman amp Lawler
1979 Rahim 1992)
The credibility of abundance philosophy for resource
use and management has been empirically tested by social
scientists who accept abundance theory as a fundamental
policy reject conventional narrowly defined rational
economic analysis (cost-benefit) and psychological models
(Conacher 1980 Rutte Wilke amp Messick 1987)
An appropriate training process may efficiently and
effectively enable learners to acquire requisite skills
knowledge and attitudes In addition it is relevant and
worth doing despite the fact that it may involve more
resources and be more expensive to design than generic
training (Talarowski 1982 Spitzer 1981) An appropriate
and meaningful training intervention can only be prepared
if all the potential participating interest groups are
directly or indirectly involved in the process of designing
training materials (Rahim 1992) For example all the
potential conflicting interest groups should provide
personal information regarding their philosophy of natural
resource use and management then the target based training
interventions can be developed
12
Literature on training and program development
frequently referred to instructional systems design (ISD)
models The concept of the ISD has been popular in
instructional program planning since the 1960s An ISD
model is designed to develop specific meaningful and
effective curriculum by involving the participation of
potential learners facilitatorsteachers and the
community An instructional specialist conducts a number
of analyses including needs assessment the most critical
element in the training needs analysis phase of the ISD
model (Okey 1990 Rosenberg 1982) The needs assessment
is a means of determining gaps in performance or
productivity (Okey 1990 p 28) The needs assessment is
useful in determining appropriate problem-solving technique
(Kaufman amp English 1976 Lewis amp Bjorkquist 1992
Rosenberg 1982 Tesolowski Newton amp Cureton 1988)
Training professionals employ a number of means to
identify the need for training interventions The key
means are observation interview inventory performance
system review and survey questionnaire (Kaufman 1988
Rossett 1987) Each technique has its own merits and
demerits depending upon the goals and objectives of the
data collection and availability of time and financial
resources Little has been reported about identifying the
need for training interventions among groups in potential
conflict over natural resource use and management issues
13
Research Problem and Questions
The specific problem addressed by this study was
What is an effective method for identifying potential needs
for meaningful training interventions when the goal is to
manage conflict by achieving consensus building among
watershed resource usersinterest groups in Oregon
Following are the research questions which were
investigated in this study
1 Do the conflict management style and natural resource
use and management philosophy of the OWIC members
differ from the assumed ideal profile
2 What are the discrepancies if any between OWIC
members and the members of constituent organizations
in regard to
a Preferred conflict management style (ie
nonconfrontation solution-orientation or
control)
b Relationship between conflict management style
and power status gender and source of
information for each group
c Relationship between conflict management style
and resource use orientation (single vs
multiple) and resource availability philosophy
(scarcity vs abundance) under the given
demographic circumstances
14
3 How much variance in the conflict management styles
can be accounted for as main effect of individual
organization and group differences
4 How can profiles of conflict management style in
combination with other independent variables be used
to compare differences within and between the
userinterest groups (eg OWIC vs constituencies
and environmentalist vs business)
a What demographic variables may affect
preferred conflict management style
b What demographic variables may affect attitudes
toward natural resource use and management
15
2 REVIEW OF LITERATURE
Most natural resource mediation tasks have been
conducted haphazardly or temporarily by the relevant
discipline experts based on their vested interests or
judiciary services (Amy 1987 Bingham 1986) Review of
the literature revealed no research on the use of needs
analysis in developing training interventions when the goal
is conflict resolution
The present study was an investigation into how needs
analysis could be used in developing training interventions
for resolving conflict among natural resource userinterest
groups The study focused on userinterest groups in
potential conflict over usemanagement of watershed
resources in Oregon riparian zones The purpose of the
study was to develop a needs analysis approach appropriate
for use with these groups and to the training development
problem
This review is divided into three sections The
first section discusses literature on needs analysis
concepts and theory the second on conflict management
theory and concepts and the third on natural resource use
and management specifically that dealing with multiple use
issues and scarcityabundance assumptions theory
16
Concepts and Theory of Needs Analysis
Concepts of Need and Needs Analysis
Concepts of Need
The concept of need has been presented in a myriad of
ways (Kowalski 1988 Monette 1977 1979) In adult
education literature Monette (1977) identified four
categories of need basic human need felt and expressed
need normative need and comparative need
1 Basic human need refers to a deficient state of
any individual Needs of this kind are either
innate (eg security) or acquired (eg
occupational achievement) In general there is
no unanimous agreement on what constitutes the
basic human needs of any society
2 Felt or expressed need refers to an individuals
want or desire For example individuals desire
to be skilled professionals drive them to
complete the required courses to qualify for the
requisite professional degree
3 Normative need refers to the gap between a
desired standard and the standard that actually
exists (Monette 1977 p 118) Kaufman and
English (1976) referred to this gap as ends or
outcomes (eg learning for self or society
17
satisfaction) rather than means (eg study aids
or facilities) The individual or group whose
performance falls short of a desired standard is
termed to be in need Normative needs are prone
to change from time to time
4 Comparative need refers to the difference between
what one receives (or has access to) and another
does not For example if one person receives
services that another does not receive the
person not receiving the services is said to be
in need Comparative need is not considered to
be an appropriate measure of real need
Kaufman (1988) defined need as a verb speaks to
means need as a noun speaks to gaps in results (p 14)
A problem is not a problem unless there is a needgap and
motivation to meet the need Symptomatic needsprovide
clues to identify real needs in terms of gap [ie ends
rather than means] (Nanette 1977 p 124)
Concept of Needs Analysis
Needs analysis is considered to be a diverse tool for
determining learning skills knowledge and attitudes in
respect to competence (ability to perform the range of
skills) relevance (usefulness of those skills that are
situation specific) and motivation (ones predisposition
to improve skills) (Monette 1977 p 125) In the
literature the terms needs analysis needs assessment
18
discrepancy analysis gap analysis and means-ends analysis
are treated as synonymous however as this discussion will
show each may take on separate meaning depending on its
context For the purposes of this study needs analysis
and needs assessment mean the same
Different disciplines tend to use different terms to
describe essentially the same concept of needs analysis
For example the concept of needs assessment applications
in a business environment is called a training needs
assessment and in an educational setting an educational
or instructional needs assessment (Kaufman 1982 Masberg
1992 Rossett 1987 Zemke amp Kramlinger 1989)
Role and Limitations of Needs Analysis in Problem Solving
It is almost mandatory to use needs analysis to
investigate optimal performance current performance
feelings of learners and facilitator causes of the
problem and suggested alternative solutions to the
problem The literature review revealed that most training
professionals and instructional technologists agreed that
needs analysis is an appropriate tool for-determining
problem-specific instructional interventions Spitzer
(1981) stressed the justification for relevant needs
assessment
Inappropriate training materialscould have easily been avoided The most important thing is to
19
investigate the performance system in which the user of the training is going to have to apply the new learning (p 37)
Analysis of context and client system is the function
of needs assessment It includes the histories
traditions policies and philosophical orientations of the
individualsinstitutions In this perspective the
opportunities and constraints that influence the planning
process are revealed
The limitations of needs analysis particularly
discrepancy analysis and means analysis were noted in the
literature
Discrepancy Analysis
According to Lewis and Bjorkquist (1992) discrepancy
analysis is a strategy for diagnosing and solving problems
It borrows principles from problem-solving theory that is
grounded on model strategies followed by successful
managers Historically this approach has been applied by
business and industrial professionals to solve problems
However little research is available on how successful
experts have processed the information for meaningful
problem solving
According to Rossett (1987) and Mcnette (1977)
consequent upon the study of the various sources and the
significance of the gapdiscrepancy between where they
are and where they want to or should be the extent of
gap justifies whether training interventions are needed
20
The gap may not always be abridged by employing the
training needs analysis approach however because problem
performance may be due to factors other than educational
training needs such as administrative mismanagement
environmental change motivational incentives and changes
in reward system (Okey 1990 Rosenberg 1982)
Discrepancy analysis is defective in schematic
building a prerequisite for the development of problem-
solving expertise Its static nature conflicts with the
uncommon nature of needs analysis questions The large gap
between novice and expert professionals tend to jeopardize
the needs analysis process Also there are logistic
problems uncertainty and mistrust
Means-Ends Analysis
Means-ends analysis is popular in the cognitive
sciences (Kaufman 1987 1988 Lewis amp Bjorkquist 1992
Rossett 1987) In discussing the theory of needs analysis
in detail Lewis and Bjorkquist (1992) referred to both
means-ends analysis and discrepancy analysis The
remainder of this section draws heavily from the writings
of Lewis and Bjorkquist (1992) and Gick (1986)
Gick (1986) explained the logic of means-ends analysis
is in reducing the difference between the current state
and the goal of the problem by applying approximate problem
solving operators (p 100) Means-ends analysis is
applied recursively until the goal is reached (Gick amp
21
Holyoak 1979 Kaufman 1972) Newell and Simon (1972)
reported that means-ends analysis is the major method for
carrying out problem-solving strategy especially under the
conditions when the content domain is unknown
Sweller and Levine (1982) documented that it is
theoretically possible for a problem solver [using means-
ends analysis] to attain the goaland yet to learn
absolutely nothing concerning the problem structure (p
464) Although it is recognized that problem solving can
take place without learning (Gick 1986) the possibility
of learning is not excluded (Sweller amp Levine 1982)
Thus it may be possible to speed up the process of
learning by using recursive strategy (ie means-ends
analysis) rather than standard instruction (Gick 1986)
Factors Affecting Problem Solving
Internal and external factors significantly affect
problem-solving strategies External factors appeal to
the domain from which the problem is drawn and the form
in which the problem is presented (Lewis amp Bjorkquist
1992 p 46) Internal factors include general and
domain-specific problem-solving knowledge
Smith (1991) a biologist explained that forward
reasoning and domain-specific procedures are used to solve
a standard problem and weaker procedures namely means-
ends analysis and trial-and-error for a problem that is
outside the domain of expertise Groen and Patel (1991)
22
experts in the field of medicine agreed with Smith that
successful problem solving is directly associated with
forward reasoning They synthesized their problem solving
theory from a number of relevant sources
Experts readily comprehend new information and integrate it into an existing knowledge base This results in an enhanced ability to recall and to chunk information It also results in the ability to cope with routine situations rapidly and efficiently by the use of forward reasoning through a limited problem search space (p 39)
The product of backward or recursive reasoning is
assumed to be incomplete compared to forward reasoning
because of differences in expertise between novice and
expert professional levels Novice rules do not map onto
expert rules (Groen amp Patel 1991 p 40) More empirical
studies are needed on problem-solving strategies like
means-ends analysis for training development purposes
Needs Analysis and Training Development
Needs Analysis Models
Marlette (1977) described two broad classifications of
needs assessment models
I Individual appraisalproblem-need models The
clients determine their own learning needs either
collaboratively or non-collaboratively
Collaborative models include both one-to-one approaches (as between client and counselor) and group approaches The self-appraisal model is non- collaborative diagnosis although the solitary learner may choose to use scales and other instrumented
23
exercises or a group setting (as in value clarification) or performance analysis techniques to determine training needs (sometimes also used collaboratively) (Monette 1977 p 120)
This type of model is suitable for problem remedial rather
than improvement in educational programs
2 System discrepancygoal-identification models
Educational needs of the social system are determined
through discrepancy analysis (the difference between
existing and desired goal) This type of model works in
defining and redefining the situation rather than focusing
on remedial aspects (eg improvement in the educational
programs) This type of model works in defining and
redefining the situation rather than only focusing on
remedial aspects Freires double-loop learning model is
representative of this type of model
Models in both classifications may use internal or
external information sources or both for planning
educationaltraining programs Internal-source models
obtain the required information from sources within the
organization (Kaufman 1988) These models are used in
non-integrated program planning (Kowalski 1988) An
intervention is introduced into an organizational system
a change occurs in the organization but goals and
objectives of the organization do not change (Kaufman amp
English 1976 p 69)
External-source models compile information from
sources outside the organization These models are used
24
in integrated program planning (Kowalski 1988) When an
intervention is introduced into an organizational system a
change may be reflected in the objectives and goals of the
organization This type of planning may benefit
interrelated organizations in a number of ways
1 Improve the feedback mechanism between the users
2 Reduce the margin for planning error
3 Update informed decisions about the content and
context of the training material (Kaufman amp
English 1976 Kowalski 1988 Masberg 1992)
Kaufman (1988) suggested guidelines for choosing the
appropriate needs assessment model
The choice of [needs assessment] model and techniques should be madeon the basis of what a needs assessment has to deliver for functional planning to take place not simply on the case of doing one (p 87)
A conceptual model of needs assessment is presented in
Figure 1
The System Approach Concept
This section highlights the main features of needs
assessment and problem solving from the perspective of the
system concepts The system approach concept became
popular among human resource performance specialists in the
1960s and 1970s It was introduced under a variety of
names including educational engineering system approach
systems approach and systematic approach (Kaufman 1988)
25
ORGANIZATION ELEMENTS
Means Ends
Inputs Products
Processes Outputs
Outcomes
NEEDS ASSESSMENT
Planning Levels Planning Partners
Middle Learners
Comprehensive FacilitatorsPlanners
Holistic CommunityOther Users
Source Adapted from Kaufman (1988)
Figure 1 Conceptual model of needs assessment
The system approach concept has gone through a series
evolutionary processes but all system models are similar
in certain features
- results-orientation - clear measurable objectives - systematic procedures for reaching stated objectives - accounting for the dynamic relationship among the parts of the system
26
requirement for continuous evaluation and revision (Kaufman 1988 p 5)
System approaches vary Kaufman (1988) distinguished
old system models with the updated system model in these
words
Older modelsfocused primarily on organizational or learning objectives [The new] system (no third s) modelsencouraged defining goals and objectives external to the organization as the proper place for educational planning Only a [new] system approach formally considers the individual and collective good of and for peopleOlder approaches tend to make the current system more efficient in reaching current goals and objectives while this one also helps to identify new visions and identify new outcomes (p 6)
The new system approach is external humanistic or people-
oriented practical effective and efficient innovative
and relevant future-oriented and result-based (Kaufman
1988 Sork amp Caffarella 1989)
The system approach to educational planning deals with
problem identification (via needs assessment) and
resolution process (via problem solving) The needs
assessment phase involves identifying scoping selecting
and prioritizing needs The problem-solving phase is a
six-step process (a) identify problems (priority needs)
(b) determine alternative solutions for meeting needs (c)
select solution tactics from the available alternatives
(d) implement the selected solutions (e) evaluate
performance effectiveness and efficiency and (f) revise
as required at any step in the problem-solving process
(Kaufman 1988)
27
The system analysis tool is primarily used in
performing discrepancy analysis using internal and external
needs assessment educational planning (Kaufman 1987 1988
Rossett 1987) It guides how to get from what is
(present) to what should be (futuredesired) (Kaufman
1988)
A gap may be determined between present and desired
levels of the soft and hard sensing needs information
depending upon the identified elements of the required
needs Soft need sensing data include perceptions
attitudes and personal values Hard need sensing
information is the actual gaps between human and
organizational performance needs derived through
observation or recording (Kaufman 1987 1988) The
identified needs may be prioritized by rating ranking or
Knowles filter analogy criteria (Kaufman 1987 1988 Sork
amp Caffarella 1989)
A meaningful decision-making process would be
facilitated through arriving at predicted futures
alternative solution scenarios and agreement on common
interests The techniques used for prediction of future
needs are assumed to be creative and dynamic Future needs
could be identified by using methods such as trend
extrapolation Delphi technique scenario construction
cross-impact analysis and technology assessment (Kaufman
1987 1988 Sork amp Caffarella 1989) The system approach
helps one to understand the interrelation and interaction
28
among the pieces of the whole system when educational
interventions are needed to plan develop and evaluate a
regular changing process (Kowalski 1988)
The Organizational Elements Model
The Organizational Elements Model (OEM) was developed
by Kaufman to provide a framework for properly identifying
needs analyzing them defining useful objectives and then
selecting effective and efficient educational interventions
(Kaufman 1987 1988 Masberg 1992) By employing the
OEM we can learn from each other (Kaufman 1988 p 29)
The five elements of OEM are input processes products
outputs and outcomes (see in Figure 2 and Table 1)
This model deals with different levels or domains of
educational planning namely middle comprehensive and
strategicholistic Middle level planning deals with the
performance improvement of the employees or the learners
This level involves elements like inputs processes and
products (Kaufman 1987 1988) Comprehensive planning
level deals with the performance improvement of the total
organization whatever the organization uses does and
delivers to itself It includes input process product
and output elements for educational planning This level
performs the educational planning for an entire
institution for example a school university or academy
The strategicholistic level of represents a region rather
than only a single institution (Kaufman 1988)
29
Inputs Processes Products Outputs Outcomes
Internal External
Middle Level Planning
Comprehensive Level Planning
HolisticStrategic Level Planning
Source Adapted from Kaufman (1988)
Figure 2 Organizational elements model Three planning domainslevels and scope of information
30
Table 1 Organizational elements with examples
Organizational Examples Elements
Inputs Learner (raw material) -goals
-needs -law -politics -values perceptions amp attitudes -quality of life -resource endowments
Processes Management (how-to-do-it) -interaction status
Educational means -mediating
Products Individual interventions (material) (enroute-results)
Outputs Reduced conflict (products of the system delivered or deliverable to society)
Outcomes Policy consensus building (the effects of outputs in and for society and the community
Source Adapted from Kaufman (1988)
Kaufman (1987) suggested that there is a need to
consider all potential planning partners In an
educational setting educational planning partners
providing soft and hard needs sensing data would be the
1 Learners the affecters of the needs assessment
planning results
31
2 Teachersfacilitatorseducational planner the
implementors of the needs assessment results and
3 Communitysociety receivers of the needs
assessment results (Kaufman 1987 Masberg
1992)
Kaufman (1987) cautioned that each participant in
educational planning should work with the same definitions
and descriptions of the needs analysis For example
Kaufman (1987) defined needs analysis as a need identifies
and documents a gap in results [rather than gaps in
process ie inputs and processes referred to as quasi
needs] (p80)
The needs analysis model reveals not only the
perceptions of the participants but also keeps the
participants in touch with the world of work to which they
are supposed to sell their product during the process of
planning educational objectives (Kaufman amp English 1976)
These types of models can be systematic or non-systematic
Instructional System Design Models
Instructional system design (ISD) models are system
approaches for not only looking at the nature of the tasks
to be performed but also figuring out possible ways to
assess the skills knowledge and attitudes concerning
performance
Robert Gagne and his colleagues are considered to be
significant contemporary contributors to the development of
32
the ISD model concept (Rossett 1987) The theoretical
basis for ISD modeling can be traced to the works of Dewey
London Tyler and Knowle on adult learning theory and
curriculum development The major elements of educational
planning described by London in the 1960s concerned the
decision-making process (Monette 1977 Sork amp Caffarella
1989)
The original ISD model was developed during World War
II to address the technological as well as skill
knowledge and attitudinal requisites for performing
military tasks (Rosenberg 1982) After the war educators
began using ISD models to develop training interventions to
meet supervisors needs in the area of business and
industrial development (Kaufman 1988 Lewis amp Bjorkquist
1992 Rossett 1987) They were introduced to replace
generic training models to deal with needs associated with
problem performance new technology and regular training
programs The ISD models increased the likelihood of
meaningful training development that met the needs of both
organization and learners Large corporations such as ATampT
have adapted ISD models to meet their training development
needs ISD models have gone through a series of changes
and probably will continue to change to meet the fluid
needs of learners educatorsfacilitators and community
(Kaufman amp English 1976 Monette 1977 1979 Rossett
1987)
33
Rosenberg (1982) and Rossett (1987) described ISD
models as having five phases analysis design
development implementation and evaluation (Figure 3)
These five phases were discussed in detail in a systems
context by Kaufman and English (1976) Kaufman and English
had suggested an additional step a feed-back-loop This
was covered in the evaluation phase of Rossetts (1987)
vision of the ISD model called the ADDIE model
Analysis Design Development Implementation
Needs Assessment
Facilitator Learner Other users
EVALUATION
Source Adapted from Rosenberg (1982)
Figure 3 General model of instructional system design
The perspectives of Rossetts ADDIE model are
comparable to those of the Kaufman and Englishs system
planning approach The approaches are alike in their
phases and analysis For example in both approaches
instruction is planned and produced in the development
phase and the conduct and impact of the instruction is
assessed in the evaluation phase (Okey 1990)
34
Needs analysis is the most important component of the
ISD model for arriving at a rational management system for
any institutioncommunity Kaufman and English (1976)
addressed the strengths of needs assessment
[It] allows all partners to act upon decisions based upon logical and consensual bases and provides a referent for changing decisions once made and found wanting or requiring change due to additional information and experience (p 47)
Data Collection Techniques in Needs Analysis
Needs assessment information can be collected in a
number of ways survey questionnaires (mail face-to-face
and telephone) checklist interview observation self-
reported interpretive activities test performance
analysis self-assessment instruments job needs and task
analysis (Dillman 1978 Kowalski 1988 Masberg 1992
Rosenberg 1982 Rossett 1987 Sork amp Caffarella 1989)
Whatever the data analysis techniques used the purpose of
the needs assessment should be stated clearly and precisely
in the language and at the language level of the
respondents (Kaufman amp English 1976 p 2)
Survey instruments are suitable for examining the
feelings perceptions and actual occurrences (Masberg
1992 Rossett 1987) The survey instrument for conducting
the needs assessment should allow for respondents to talk
about means and not definitively about ends (Kaufman amp
English 1976 p 58)
35
Credibility of Needs Analysis
In general a paucity in the literature was observed
in the area of needs analysis and its philosophical
orientations Monette (1977 1979) apprised the
philosophical orientations of needs assessment drawing
support from Freire Knowles and Knox that needs analysis
is inevitable until and unless values ethics aesthetic
and politics are discussed along with the productivity
status of improved scientific technologies Monette (1979)
supported the concept that appropriate instructional
interventions could be developed through better
understanding of the problem situation He discussed the
issue raised by Tylers curriculum development theory
that training objectives ought to be based on studies of
contemporary life learners and subject-matter specialist
in question Monette (1979) addressed Freires
instructional models for valuing educational activities
and double-loop learning training modes The aim of this
discussion was to justify the philosophy of education
which is a necessary and inescapable responsibility of an
educatorplanner
Instructional designers have questioned under what
circumstances needs analysis should be performed (Kaufman amp
English 1976 Kowalski 1988 Monette 1977 Rossett
1987) Rossett (1987) expressed the problem this way
36
How to do it Where [to] start What do you say or write or observe In what order should the study occur When are you finished What do you do with what you have learned (p 3)
Kowalski (1988) mentioned other reasons for the needs
analysis approach not being commonly used in designing
traininginstructional interventions Firstly few
empirical studies are available in which this planning
approach has been used thus there is a big gap between
theory and practice (Sork amp Caffarella 1989) Secondly
many instructional planners believe that they are not
competent enough to employ the needs assessment tool
successfully Lastly cost-effectiveness and time
efficiency are concerns
In the literature Sork and Caffarella (1989) found
several reasons given for the gap between theory and
practice
1 Practitioners adopt short-cut methods
2 Contextual factors largely determine how
planning is done
3 Planning theory is irrelevant to practice
Enhancing the Credibility of Needs Analysis
It might be more useful to focus on testing and
pondering the adequacy of ones explanations rather than
focus only on the problem-solving approach (Lewis amp
Bjorkquist 1992 p 43) It is the opinion of many
professionals that problem-solving strategies are not
37
always useful for resolving each kind of problem That is
problem-solving strategies vary from one case to another
thus instructional values may be better guided through a
careful study of cases as if they were a vehicle for
building scheme (Lewis amp Bjorkquist 1992 p 47)
A training professional may learn a lesson from the
theory of successful problem solving for future uses
Perez (1991) translated successful problem solving
strategies into the domains of troubleshooting He said
that it is necessary first to define what skills
knowledge heuristic and cognitive processes transfer from
diagnosis and troubleshooting to other situations
(p 147) For example to understand and teach about
general problem-solving strategies one should know how
domain-dependent (local) knowledge and domain independent
(global) knowledge are to be combined with heuristic
executive control and self-regulatory processes (Perez
1991 p 148)
Many organizations have accepted the worthiness of the
needs assessment tool (Rossett 1990 Tesolowski et al
1988) Rossett (1990) suggested ways to enhance the
recognition of training needs assessment Rossett (1990)
suggested ways to enhance the validity and reliability of
training needs assessment One way would be to change the
focus of the training professionals from what to how
Another would be to replace the terms needs analysis and
needs assessment with other terms or phrases in the
38
vocabulary of specific training programs depending upon
the situation of the target organization For example
change the name from needs analysis to planning
Rossett concluded that when management does not
support needs analysis trainers need to assert themselves
He found that doctors engineers and architects would not
initiate projects or interventions until and unless a
careful study was done of client needs
Theoretical Framework of Conflict Management
Effective management of conflict among userinterest
groups is critical to successful natural resource
protection and use allocation No conscionable society can
afford to waste potential riparian zones watershed resource
endowments due to bickering between greedy and selfish
resource users
At the time of the present study only a few studies
were available that showed successful resolution in
environmental disputes (Conacher 1980 Mernitz 1980
Susskind amp Weinstein 1980 Wondolleck 1988) In the
following discussion most of the concepts and theory are
drawn from literature on organizational conflict
management The focus is on the communicative types of
conflict
Before proceeding further with this discussion there
is a need to distinguish between the concepts of conflict
39
management and conflict resolution Boulding (1968)
addressed this issue when he questioned whether
resolution was the right word Perhaps management would have been a better word for the distinction between constructive and destructive conflicts is not necessarily the same as the distinction between those which are resolved and those which are not Conflicts are sometimes resolved in ways which are highly undesirable for one party if not for both Sometimes there is a need for protracting conflict and for keeping it unresolved perhaps by diminishing its intensity and increasing its duration Thus the more neutral word management may better describe the objectives of our enterprise though we are interested in looking at conflict from the point of view of both parties (p 410)
Organizational conflict management theory does not provide
precise guidelines regarding maintenance levels of conflict
under general and specific situations (Rahim 1992)
However in contrast conflict resolution theory does not
provide for any level of conflict to be maintained
Conflict Models
Successful conflict management requires skills in
communication and an understanding of the concerns of all
parties involved (Mayer 1990 Nadler et al 1979 Putnam
amp Pool 1987 Witteman 1986) A prerequisite to managing
a conflict situation is a clear understanding of the nature
of the conflict and why it has arisen (Witteman 1986)
Conflict management models tend to be situational models
(Pondy 1967 Putnam 1988 Putnam amp Wilson 1982 Thomas
1976 Wilson amp Waltman 1988 Womack 1988b) The general
40
types of theoretical models of conflict management are
bargaining bureaucratic and systems (Pondy 1967 Putnam
amp Pool 1987 Seiler 1963 Thomas 1976 Thompson 1960)
Bargaining Model
This model deals with the potential conflict which
arises among the interest groups due to excess of the
aggregate demand over the supply of resources at hand
Competition for the scarce resources leads to frustration
(Bower 1965 Howe 1979 Pondy 1967 Seiler 1963) The
situation can be relieved either by increasing supply or
decreasing aggregate demand (Pondy 1967) In a
competitive market environment each party generally
attempts to gain a larger slice of the pie instead of
working together to contribute toward a larger pie
However Walton and McKersie (1965) referred to conflicts
of this type as having underlying potential for both
integrative (cooperative) and distributive (competitive)
subprocesses The government capital budgeting process
between legislative and executive interest groups is a
practical example of the bargaining model in action (Pondy
1967 Walton amp Dutton 1969)
41
Bureaucratic Model
This model taps the hierarchical relationships along
vertical dimensions that is authoritypower relations
(Pondy 1967 Seiler 1963) Typically senior members or
those in high-rank positions in an organization rule over
junior members or those in lower-rank position (Pondy
1967) However this relationship of control is distorted
when actors on either side do not behave accordingly
Distortion in authoritypower relations can lead to
disagreements among the superiors and the juniors peers
and subordinates (Pondy 1967 Putnam amp Pool 1987) The
conflict problem between seniors and juniors can be
remedied to some extent through encouraging the
participative role of the leaders (eg leaders from both
sides of the conflict) as well as creating group norms or
peer pressures (Likert 1961 Pendell 1990 Pondy 1967)
Systems Model
This model is used to analyze conflict at the lateral
or horizontal level of relationships The model also is
used to study the problems of coordination between
horizontal levels of hierarchical relationships (Pondy
1967 Walton amp Dutton 1969) For example in an
industrial or business setting this model can be used to
analyze the conflict situation between two (or more) units
such as production and marketing In the systems model
the units are interdependent in making performance progress
42
toward aggregate production (Nadler et al 1979 Pondy
1967) Examples of interdependent facilities are common
uses of services routine hierarchical tasks and
agreements between the activities of the units (Pondy
1967) The major source of conflict behavior would be
development of negative attitudes between the heads of the
coordinating units
Pondy (1967) suggested two main strategies for
reconciling conflict between coordinating units at the
horizontal level First reduce goal differentiation
through for example proper training and selection of (or
change in) incentive system or allocation of assignment
procedures Second mitigate the conflict by reducing the
interdependence between the units
In summary conflict has been discussed in the context
of each of the three organizational models bargaining
bureaucratic and systems These models have their own
limitations and opportunities A bureaucratic model deals
with authority relations and the need to control the
outcomes or processes This model can be functional as
well as dysfunctional depending upon the relational
behavior between seniors or superiors and juniors or
subordinates Ruling groups can ignore the rights of their
juniors and mentoring relations can encourage the juniors
through participative leadership management Thus these
roles can lead toward either creative (eg positive
learning experience) or threatening (eg fear and
43
mistrust on each other) situations depending upon the
authority or autonomy role plays between the juniors and
seniors Of the three conflict management models the
bureaucratic model is the one that received more attention
from researchers across diverse disciplines in part
perhaps because of its easy access to all disciplines
(Pondy 1967)
Systems models deal with functional relations and the
need to coordinate among the parties at the same
hierarchical level In this model each party has its own
job mandate but they can function through coordinating
their efforts all parties are interdependent As an
example a possibility of coordination between the heads of
two departments say production and marketing could lead
to efficient production time and delivery of products as
per targeted demands and on clienteles prescribed needs
Otherwise if both of the department heads do not
coordinate their functional assignment their production
targets would be jeopardized in terms of need and place of
the clients Thus this model could be effectively used
for reducing or resolving the conflicts among the parties
through following the number of strategies depending upon
the nature of the conflict Pondy (1967) suggested two
main strategies for reconciling the conflict First there
are numbers of ways to reduce goal differentiation between
the parties such as proper training and selection or
change of incentive system and allocation of assignment
44
procedures Second the conflict can be mitigated by
reducing the interdependence between the parties or
functional units
Bargaining models deal with interest groups in
relation to competition of resources Thus it could be a
mixture of both cooperative and competitive subprocesses
For example divergent interest groups may combine their
efforts for resolving their common interest problems but
also securing their self interests simultaneously The
interest groups strive to meet their targeted demands
through the flexible behavior Contrarily interest groups
distribute their efforts through strategic bargaining
process when they are under the influence of competitive
behavioral action
Theoretical Models of Conflict Management Strategy
The conflict resolution techniques employed depend
upon the nature of the conflict and the philosophies of the
mediators (Pondy 1967 Putnam 1988) For example the
tension model works to evolve safety-valve institutions
and the semantic model promotes open communication among
the conflicting interest groups (Pondy 1967 Putnam amp
Wilson 1982)
The justification for developing conflict management
strategies is based in part on recognition of the
functional and dysfunctional consequences of the conflicts
45
The contemporary conflict management theorists view
conflict as productive creative and useful rather than
destructive deteriorating and inappropriate (Deutsch
1949 1971 Rahim 1992 Thomas 1976 1988 Thompson
1960)
A conflict episode can be resolved differently
According to some researchers there are three types of
conflict-managing systems (a) process model (b)
structural model and (c) mixed model (Chanin amp Schneer
1984 Nadler et al 1979 Thomas 1976) The models are
used to manage conflicts through understanding the behavior
of the potential stakeholders who are involved in a
conflict situation (Daves amp Holland 1989 Rahim 1992
Thomas 1976) For simplicity sake the discussion of
conflict management models is focused on dyadic
relationships that is the potential conflict between two
parties
Process Model
The process model is a systematic approach for
studying the internal dynamics of a conflict situation
The process model is concerned with the identification of
the events For example when two interest groups are in a
conflict situation then each of the conflicting group
passes through the events of frustration
conceptualization behavior and outcome (Pondy 1967
Putnam amp Wilson 1982 Thomas 1976 Wilson amp Waltman
46
1988) The process model views the events as occurring in
a continuous process from one episode to the next and is
concerned with the effect of each upcoming event Hence
the evidences about the conflict occurrence are dynamic and
process-oriented (Thomas 1976)
The process model has been used to develop strategies
that can be used by a third party (eg consultant or
mediator) in resolving or reducing conflict among the
stakeholders (Nadler et al 1979) Walton amp Dutton
(1969) classified these techniquestools into three general
approaches deescalation confrontation and collaboration
under organizational conflict management settings
Deescalation technique One group may react to a
conflicting situation by cooperating with an opposing
interest group Sometimes this type of conflict
behavioral manifestation may encourage an increase in the
intensity of the conflict Thus care is needed in
identifying the stage of the conflict before intervening
with any type of conflict resolution technique (Nadler et
al 1979)
Confrontation technique When a conflict event has
exceeded the escalation limit that is becomes visible a
direct confrontation technique would be suitable for
handling conflict between the interest groups The
perspective of the confrontation technique is that dialogue
must take place between the groups about their emotions and
47
concerns to reduce the intensity of conflict (Nadler et
al 1979)
Collaboration technique This strategy is often
employed especially when the conflict has advanced beyond
the escalation and the confrontation stages of the conflict
(Filley 1975 Nadler et al 1979) This technique is
referred to as a win-win strategy because it works through
integrating the goals of the interest groups (Filley 1975
Nadler et al 1979) In this way both parties gain
through achieving common goals
In all three process model techniques consultant or
mediator involvement is recommended in order to ensure
direct and open communication between the stakeholders
Open and direct communication is needed if the groups are
to trust each other As a consequence of conflict
behavior there are possibilities of reduced communication
distortion of perception and mistrust (Nadler et al
1979)
Structural Model
This model attempts to understand conflict phenomena
by studying how underlying conditions shape events
(Thomas 1976 p 893) Underlying structural conditions
are behavioral predispositions social pressures
(constituent and ambient) incentives (stakes interest)
rules and procedures (decision negotiation and
mediation) and organizational norms (Rahim 1992)
48
In this approach the foremost objective is to
identify the parameters that influence conflict behavior
Those parameters are supposed to be relatively static and
slow changing (Thomas 1976)
The structural model is grounded on preconceived
understanding scarce supply of resources interdependence
stake of the interest groups and antecedent conditions of
differentiation The most important structural model
technique is to minimize the differences by identifying the
goals which are equally shared among the interest groups
When both interest groups realize the importance of common
goals they have an collaborative incentive (eg to
defend against a common enemy) Group differences may be
resolved through restructuring the group or rewarding the
individuals on the basis of total productive performance
(Nadler et al 1979)
Mixed Model
Under certain conditions process and structural
approaches can be used together for managing conflict
(Nadler et al 1979) Strategies include (a) developing
rules that will motivate the conflicting groups to move
toward problem solving (Nadler et al 1979) (b)
establishing a third-party organization or individuals
capable of playing the role of mediator between the
interest groups (Amy 1987 Lawrence amp Lorsch 1967 Nadler
et al 1979) (c) promoting inter-group liaison role for
49
open communication (Nadler et al 1979) and (d) creating
task forcesteams in order to sort out the boundaries
between groups that cause conflicts (Nadler et al 1979)
In summary Rahim (1992) and others considered really
only two basic approaches process and structural The
process approach deals with the sequence of event or
activities to arrive at some desired outcome The
organizational processes are communication decision-
making and leadership development necessary for social
systems to function (Beer amp Walton 1987 Rahim 1992
Rahim amp Bonoma 1979) The process approach was designed
to manage conflict through aligning the conflict management
styles among the participant groups depending upon the
nature and situation of the conflict (Conflict management
styles will be discussed later)
The structural approach addresses stable arrangement
of the tasks technologies and other factors so that the
members of an organization can work together effectively
Moreover the structural approach is designed to manage the
conflict by modifying the structural factors in an
organization as per the characteristics of the conflicting
groups The major structural factors include reward
system rules and regulations (Nadler et al 1979
Rahim 1992)
Rahim (1992) concluded that conflict management
interventions are mainly needed when the intensity of the
conflict is either too little or too much A moderate
50
level of conflict is considered to be desirable for
maintaining productive performance between the conflicting
groups Traditional conflict management approaches (ie
obliging dominating and avoiding styles) are only
suitable if the conflict is minor or frictional in nature
Contemporary approaches referred to as win-win
integrative cooperative or problem solution approaches
are more appropriate interventions for long-term conflict
management (Filley 1975 Howell 1981 Nadler et al
1979 Rahim 1992)
Application of the process approach is primarily
recommended when there is a need to alter the conflict
management styles in the perspective of amount and
perception of conflict The best suggested means under the
process approach are training and educational interventions
(Rahim 1992)
Theory of Conflict Management Styles
Bisno (1988) author of Managing Conflict pointed out
that mastery of technical skills is no substitute for a
commitment to pro social objectives (p 169) In other
words before implementing any conflict management
strategy there is a need to conceptualize the significance
of the conflict and conflict situation (Ross 1982
Witteman 1986)
51
Early researchers treated conflict as a problem that
causes destruction (Ross 1982 Thompson 1960 Wilson amp
Waltman 1988 Witteman 1988) and thought it should either
be eliminated or avoided (Putnam amp Wilson 1982 Ware amp
Barnes 1983 Witteman 1988) Contemporary theorists on
the other hand are of the opinion that conflicts should be
embraced and managed with productive perspectives in mind
(Nadler et al 1979 Putnam amp Pool 1987 Putnam amp Wilson
1982 Ware 1983 Ware amp Barnes 1983) Along these lines
Nadler et al (1979) commented that
contrary to popular belief conflict is not necessarily undesirable[It can] stimulate the search for new creative solutions result in improvements in production methods or lead to insights that might not have been made otherwise (p 221)
By reviewing the significance of conflict and conflict
management styles of individuals groups and
organizations training professionals are better able to
manage conflict in a variety of organizational conflict
situations (Putnam 1988 Putnam amp Pool 1987 Shockley-
Zalaback 1984) Many types of instruments have been
designed to measure the conflict management styles of
individuals groups and organizations (Raves amp Holland
1989 Howell 1981 Putnam 1988 Putnam amp Pool 1987
Ross 1982 Thomas 1976)
In general early theorists in the conflict management
area assumed that a single dimensional model a continuum
with cooperation at one pole and competition at the other
52
was appropriate for measuring conflict management style A
prime example of a single dimensional model is Prisoners
Dilemma a matrix game (Buckley Burns amp Meeker 1974
Deutsch 1949 Putnam 1988 Stern 1976 1992)
A two-dimensional model of conflict management styles
was introduced by Blake and Mouton (1964) in the 1960s
The grid-oriented two-dimensional model of conflict
management styles is based on the concept of concern for
people versus concern for others or assertiveness and
cooperative orientation (Blake amp Mouton 1985 Howell
1981 Kilmann amp Thomas 1977 Putnam 1983 Ross 1982
Thomas 1976 Witteman 1991)
Putnam and Wilson (1982) discussed five management
styles as follows
Forcingsignified the use of competitive behaviors to win ones position even if it meant ignoring the needs of the opponent Confronting also called problem solving collaborating and integrating consisted of facing a conflict directlyTo reach creative solutions participants had to exchange information and to integrate alternative points of view Smoothing also called accommodating [aimed to cover up the conflict] referred to behaviors that glossed over concealed or played down differences by emphasizing common interests Avoiding was physical [and psychological] withdrawal refusal to discuss the conflict or the tendency to sidestep the situation Compromising behaviors aimed atfinding a middle- ground alternative Compromiserswho looked for easy solutions by finding the midpoint between the opposing viewpoints (p 631)
Figure 4 illustrates the relative position of these five
conflict management styles on a two-dimensional model
(Blake amp Mouton 1964 Howell 1981 Putnam amp Pool 1987
Thomas 1976 1988)
53
Forcing Confrontation
o Compromising
Avoiding o Smoothing
Cooperativeness
Source Adapted from Thomas (1976) and Blake and Mouton (1964)
Figure 4 Two-dimensional model of conflict management styles
In summary the effectiveness of each of the five
conflict management styles is dependent upon the nature and
situation of the conflict For example direct
confrontation or problem solving might be effective when
used by a supervisor in dealing with a subordinate in order
to end the conflict but the reverse is not true (Lawrence
amp Lorsch 1976 Witteman 1991) In order to be effective
it is critical that the conflict management style be linked
54
with the type of relationship between the conflicting
parties in terms of subjective cultures goals and
ideology (Gudykunst Ting-Toomey amp Chua 1988 Putnam amp
Wilson 1982 Temkin amp Cummings 1986 Ting-Toomey 1984)
Natural Resource Use and Management
There are a number of factors involved in the natural
resource usemanagement controversy This study focused on
two factors multiple use vs single use and scarcity vs
abundance assumptions for managing natural resources
Issues of Multiple Use
Overgrazing on public lands or common properties
became a main focus in lobbying efforts by the Bureau of
Land Management (BLM) and the US Department of the
Interior to get non-ranchers (eg environmentalists and
conservationists) to support passage of the Multiple-Use
Sustained-Yield Act of 1960 (Clawson 1987 Nelson 1989)
Single use (eg livestock grazing or crop production) of
these lands had been common since the 1800s Until the
1980s public land use decisions continued to favor the
interests of ranchers and livestock industry holders
Efficiency and multiple use were not major concerns
Several forces helped the passage of the Multiple-
Use Sustained-Yield Act of 1960 After World War II
population pressure increased especially in the urban
55
areas That and the improvement in means of transportation
tempted resource users to think about alternative uses of
the land (Clawson 1987 Frederick amp Sedjo 1991 Libecap
1981) Increasingly non-ranchers vested interests have
influenced decisions regarding public land use because
every citizen of America has the right to look after the
stewardship of the land (Clay 1962 Nelson 1989)
The Multiple-Use Sustained-Yield Act of 1960 was
passed with special considerations Land management was
to be based on biological sustained yield principles not
economic criteria to achieve multiple-use goals (Libecap
1981 p 79) The theme of the Act was explained by the
ecologist Aldo Leopold (cited in Hess 1992) in these
words
A land ethic rested on the premise that the individual is a member of a community of interdependent parts--a social community that includes soils bodies of water plants and animals (p 244)
Multiple use of natural resources is supposed to meet
the long-term blended needs of all resource users (Clawson
1987 Frederick amp Sedjo 1991 Libecap 1981 Stankey amp
Clark undated US Department of Agriculture [USDA]
1990) The mix of multiple uses allowed on public lands
varies depending upon the situation of the land Examples
of resource use are soil water wilderness timber
minerals livestock grazing national parks urban parks
outdoor recreation (eg hiking backpacking and other
leisure activities) fish and wildlife forage cultural
56
resources and air (Rifkin amp Rifkin 1992 Wondolleck
1988)
The philosophy of multiple use of land resources has
the potential for creating different types of conflicts
between resource users producers and managers (USDA
1990)
1 Commodity-commodity conflict this type of
conflict involves competition between different
types of commodity production for example
forest products vs livestock forest products
vs commercial fisheries
2 Amenity-amenity conflict this type of conflict
occurs when amenity oriented uses are not able
to co-exist (USDA 1990 p 6-57)
3 Commodity-amenity conflict this kind of
conflict erupts between interest groups who have
quite different outlooks on the management and
use of the resources Potentially this type of
conflict is considered to be more contentious
(USDA 1990)
The Federal land management agencies philosophy of
natural resource management is based on
scientifictechnical principles that consider measurable or
priced values Crop and livestock production have
measurable values whereas environmental interests (eg
aesthetic enjoyment and recreation fish and wildlife
57
hunting) have unmeasurable or unpriced values (Libecap
1981 Sinden amp Worrell 1979)
Regional economists and planners view the concept of
multiple use in terms of interindustry spillover effects
Alternative land uses differentially impact the community
and its sectors in regard to jobs income and levels of
fiscal activity (Robinson amp Miller 1989)
Each interest group needs to develop principles for
the use and management of resources given the available
body of knowledge about multiple use Based on the
researchers background in agricultural and resource
economics the following are a synthesis of principles of
multiple use concept
1 A consideration of long-run and sustained yield
should be made to meet the present and future generation
needs of both human and nonhuman species on private and
public properties (Izzak Walton League of America 1982
Libecap 1981 USDA 1980)
2 Any individual or group who wants to use the land
for its own purposes must pay attention to the values and
cultures of neighboring people under competitive market
conditions (Izzak Walton League of America 1982) For
example a business group venting its concerns against an
environmentalist group stated We need to get those
natural resources under control or there wont be a Lake
County because tourism is not going to maintain the culture
58
and heritage and wont support this community (Dechaud
1992 p 25)
3 The transfer of public and private property
rights should not work against the fair balance of
sustained yield multiple uses of the resources (Izzak
Walton League of America 1962)
4 Fair and balanced treatment should be given to
the mix of available multiple uses of resources in order to
maintain and increase high ouality and quantity of the
resources between agriculture and non-agriculture sectors
(Savonen 1992 USDA 1990)
5 Multiple use plans of land should be prepared
collaboratively with multi-disciplinary team efforts as
well as with the active participation of the concerned
interest groups under the approved guidelines of
environmental impact studies (eg scientific management
of the residual effects from the use of agricultural
chemicals) (Frederick amp Sedjo 1991) potential of
resources and production capabilities and alternative
technological substitutions (eg timber and product
shortages be met through cheap substitutions) (Frederick amp
Sedjo 1991 Gentile 1989 Hess 1992 Izzak Walton League
of America 1982 Rifkin amp Rifkin 1992 USDA 1990)
Planning based on cooperation is time saving and effective
especially when dealing with the management of public land
issues (Obermiller 1990)
59
Constraints and Opportunities for Managing Resources
Resource dilemma issues concerning common property and
open access are difficult to manage These issues concern
resources that roam such as streams creeks rivers
groundwater and wildlife A stream wanders freely from
one property to another property Similarly wildlife
moves between properties (Fredrick amp Sedjo 1991)
In the absence of property rights they [waterwildlife] are unowned until captured for use In the absence of effective management institutions this situation often results in the problem of the tragedy of the commons in which a common resource is overused because it is available for the taking on a first-come first-serve basis without responsible managerial constraint (p 17)
In common property situations individuals do not have
much incentive to manage natural resources (Frederick amp
Sedjo 1991 Hardin 1968 Platt 1973) Americans have
successfully regulated common property relationships
through promulgation of the land management acts For
example attenuated private property rights are sanctioned
to individuals or groups that have improved effective
management conditions of the common resources (eg
National Audubon Society and Nature Conservancy) Other
commons management acts including the Wild and Scenic
Rivers Act of 1968 the Clean Water Act of 1972 the
Endangered Species Act of 1973 and the National Forest
Management Act of 1976 and the Federal Land policy and
Management Act of 1976 ensure preservation of diverse
multiple uses on federal lands (Frederick amp Sedjo 1991)
60
Riparian habitat The riparian habitat is a common
refuge for migratory birds and other wildlife (Cusick
1993 Rifkin amp Rifkin 1992) Historically riparian
rights were sanctioned to the land owners placing
management of the riparian systems in their hands
However with watershed population expansion a different
system was demanded Frederick and Sedjo (1991) presented
this explanation
In the East where water was plentiful the English system of riparian rights (which gives owners of land adjacent to a water body the right to use the water) was adopted In the West however the riparian system was soon deemed inadequate and a system of appropriative rights (which gives priority to the earliest users) evolved and was enacted into law (p 18
In the Western states the prior appropriations
doctrine has evolved through different stages in order to
protect water delivery systems and facilitate the process
of transfer of water rights Each of the Western states
has passed its own laws to implement the water delivery
system between uses and places (Frederick amp Sedjo 1991)
Scarcity-Abundance Theory Assumptions
The focus of the section is on the philosophy toward
natural resource use and management when scarcity-abundance
dimensions are influencing the resource users Scarcity-
abundance theory posits that resources should be
61
allocatedshared based on individual or group demandneeds
(cf Krueger 1992)
In the literature the concept of scarcity is
attributed to the Malthusian theory of population and
economic growth This theory presents that there is a
limited supply of resources and unlimited demand (Sampson
1981) On the basis of Malthusian principles many
economic theories and models were developed The
proponents of Malthusian theory believe in the scarcity
perspective and argue that resources should be allocated
among the resource users Brown (1991) has interpreted the
philosophy of scarcity from a tragedy perspective
The world has lost nearly one fifth of the topsoil from its cropland a fifth of its tropical rain forests and tens of thousands of its plant and animal species (p 17)
Scarcity-Abundance Assumptions and Consensus Building
Scarcity assumptions Krueger (1992) and Leritz
(1987) discussed three assumptions of scarcity under the
context of negotiation between the interest groups
There is not enough [There is not enough in this world that everybody could get what heshe wants for living The resources are always limited]we are afraid we will have to do without compromise give in give up
People are greedy Everyone is out to get everything they can for themselves to line their pockets at our expense We are afraid we cant trust others
The best approach is strategizing Since the world is scarce and people are basically greedy it logically follows that our best approach to getting what we need is to be more clever to out-strategize others to get
62
ours before they beat us to it (Leritz 1987 p 16)
Abundance assumptions Krueger (1992) and Leritz
(1987) presented the assumptions of abundance theory in
resolving conflicts successfully
There is more than enough [In this limited world you have always gotten enough for your living]the obvious proof is the fact that you are alive If you had not always gotten more than enough you would be dead today That does not mean that the world has been abundant for everyone Nor does it mean that you have always gotten everything you wanted when you wanted it from whom you wanted it
People are basically needy not greedy [It makes a big difference when you perceive]that others are greedy means that you begin from a premise of nontrust self-protection defensiveness and non-cooperation Since people have a tendency to mirror our reflection and match our behavior (I push against you you push back)On the other hand by assuming that people are basically needy we are more open to identify who the other person really is and what he or she needs to be able to cooperate with us We are more likely to realistically perceive the real person with whom we have to negotiate rather than act out of our own fears
Understanding is our best strategy [If] the objective of every negotiation is [willing] to cooperate with us-to do what we want them to doOur task then is to create the conditions that will motivate others to want to cooperate We can only do this however if we understand who the other person is and what they need People are willing to cooperate when they are getting what they need (Leritz 1987 pp 17-18)
The proponents of abundance philosophy especially
Julian Simon an economist have argued that resource
supply in the long run is constantly increasing rather
than decreasing (Sampson 1981) Simon (1991) is
optimistic about the future
63
[As] population increases so does productivity thus the best that could happen would be to add to the supply of people who would in turn add new inventions technology advances and knowledge (p 22)
Simon (1991) described the abundance theory scenario with
these words It is reasonable to forecastcontinued
decline in resource prices and increase in availability
(p 24)
In empirical studies the concept of scarcity-
abundance was mostly discussed in the context of economic
analysis Social scientists particularly social
psychologists brought up the issue of abundance theory in
the context of resolving the resource dilemmas or commons
dilemmas or the tragedy of the commons (cf Buckley et al
1974 Hardin 1968 Jorgenson amp Papciak 1981 Olson amp
Ross 1984 Platt 1973 Rutte et al 1987 Stern 1976)
All of the empirical studies followed experimental methods
to resolve the resource allocationshare problem between
the resource users by giving treatment to wealth as a
resource The following are salient findings related to
the present study
Buckley et al (1974) suggested that collective action
problems between the individuals or groups can be resolved
effectively by promoting communication working on the
binding agreement possibilities altering the structure of
payments and building trust and a social cooperative
ideology
64
Olson and Ross (1984) studied the relationship of
resource availability (abundance-scarcity) on the
resentment behavior (general feeling of satisfaction)
They found that the severity of resentment was decreased
when the resource was scarce They did not find any
significant impact of scarcity on resentment
Rutte et al (1987) found that people respond
differently to people-induced scarcity-abundance than to
nature-induced They concluded that subjects harvested
more from the resource in abundance than that in a scarcity
situation
Stern (1976) conducted a study on 48 subjects using a
four-person commons game simulating carpooling in response
to conserve gasoline Findings suggested that education
and incentive options worked well in the perspective of
resource conservation He concluded in the long-term
educational strategies have greater opportunity for getting
people to conserve resources even in situations where the
incentive options cannot be used
In a study on the effects of communication feedback
and identifiability on behavior Jorgenson and Papciak
(1981) found that groups who maintained better resource
feedback or communication achieved more total money as well
as the commons for maximum number of trials compared to
those who did not
Scarcity-abundance philosophy influences differently
when implied under physical economic and natural
65
conditions Scarcity-oriented analysis is more concerned
with the short term and gives less weight to technological
innovations Contrarily abundance-oriented analysis
relies heavily on potential exploitations and technological
developments in the long term (Dewees 1989 Moncur amp
Pollock 1988 Sampson 1981)
66
3 METHODS AND PROCEDURES
The present study was an investigation into how needs
analysis could be used in developing training interventions
for reducing conflict among natural resource userinterest
groups The goal of this study was accomplished by
developing a theoretical model for assessing the conflict
management style resource use orientation (single vs
multiple use) and resource availability philosophy
(scarcity vs abundance) of individuals within resource
userinterest groups and applying that model to a
particular situation (see Kaufman 1988 Kaufman amp English
1976 Lewis amp Bjorkquist 1992) There are a myriad ways
to conduct needs analysis in a given situation (Kaufman
1987 Kowalski 1988 Lewis amp Bjorkquist 1992 Tesolowski
et al 1988)
Theoretical Framework
This study developed the watershed resource users need
assessment framework (WRUNA) to explore factors that may be
pertinent to be consensus-building The theoretical
concept for the WRUNA model was discrepancy analysis
Kaufmans (1988 1987) OEM and Rossett (1987) guidelines
were adapted (refer to Chapter 2 for details) As
previously discussed a gap may be determined between
present and desired levels of soft and hard sensing needs
information depending upon the identified elements of the
67
required needs For the purpose of this study soft needs
sensing data were perceptions attitudes and personal
values regarding single versus multiple use of natural
resources scarcity and abundance assumptions and conflict
management styles
The WRUNA model is illustrated in Figure 5 The term
where they area refers to present level of performance in
managing conflict over watershed resource use issues
Where they should be refers to the desired level of
performance (consensus building) All of the elements
under watershed resource uses conflict management styles
and demographics were used to compute the gap between the
present system (what they are) and the proposed system
(what they should be)
Where They Are Where They Should Be
Conflict management styles Conflict management styles a Control a -b Nonconfrontation b c Solution orientation c Solution orientation
Watershed resource uses Watershed resource uses a Single-multiple a Multiple b Scarcity-abundance b Abundance
Factors Influencing Behavior and Attitudes
Demographic variables Demographic variables
Figure 5 Watershed resource users needs assessment (WRUNA) model
68
In this study the Oregon Watershed Improvement
Coalition (OWIC) represented what they should be The
OWIC constituent organizations represented what they are
The model assisted in assessing the gap in the performance
of the OWIC (desired situation) and the constituent
organizations (existing situation) in order to identify
needs for educationaltraining interventions
Population and Sample
The target population for this study was the
membership of the Oregon Watershed Improvement Coalitions
(OWIC) constituent organizations Associate members of
OWIC represent professional business and environmental
organizations namely Izaak Walton League The Nature
Conservancy Oregon Cattlemens Association Oregon Chapter
Sierra Club Oregon Environmental Council Oregon Forest
Industries Council Oregon Small Woodlands Association
Oregon Trout Pacific Northwest Section-Society for Range
Management and Pacific Rivers Council A publicist is
also included There is no formal hierarchal structure
within the OWIC although one member was chosen to chair
meetings Decision-making is by consensus According to
the OWIC charter
The goal of this Coalition is to ensure the long term sustainability of Oregons watersheds and to improve communication among the diverse interests that affect watershed management
69
Implicit in the goal is OWICs desire to develop a healthy productive environment within the potential of the environment with yield as a secondary output Yields of all values can be expected to increase if the resource is management with this in mind
OWIC members view themselves as facilitators not mediators Compromises and trade-offs are not goals in and of themselves The concept that is fostered is that of a healthy watershed with the resulting effect that everyone benefits OWIC through its unique membership can provide the impetus and support for seeking pathways to develop working programs for sound watershed management
Selection Procedure
The 20 members of OWIC were contacted and agreed to
participate in the study A letter was sent to the ten
OWIC constituent organizations by Dr William C Krueger
Department of Rangeland Resources informing them of the
study and requesting a directory from which a random sample
of members could be identified (Appendix A)
One organization did not supply the requisite
information on time and therefore was not included in the
study Another organization could only provide information
on 17 members due to an organizational policy For the
eight remaining organizations 30 members were randomly
selected to participate in the study To adjust for the
disproportionately larger numbers of environmentalist The
sample was stratified by selecting an additional 30 members
from business organizations This brought the sample size
to 287 The distribution by group was environmentalist
137 business 120 and professional 30
70
Responses
As Table 2 shows 19 of the 20 (95) OWIC members
returned their questionnaires Approximately 64 (183) of
the constituents returned questionnaires However about
9 (17) questionnaires could not be used in the study
Five respondents returned blank questionnaires with
remarks that either the questionnaire topic was not
pertinent to them or they did not have knowledge about the
riparian zones resource usemanagement issues The other
12 questionnaires not used were incomplete
Table 2 Questionnaire return and use rate
OWIC Constituencies
Action n n
Sent 20 287
Returned 19 95 183 64
Used 19 95 158 55
Group placement of respondents was based on items
providing self-reported affiliation with organizations
However these observations might not have been consistent
throughout the analyses due to variation in missing data
from one question to another
OWIC (n = 19) served as a case study The numbers of
respondents for each constituent group were 81
environmental 57 business and 20 professional The total
71
sample size of constituents was 158 subjects therefore
the response rate was a nominal 55
There was considerable variation in the missing data
or not applicable responses for Section 1 through Section
18 with a range from 3 to 49 observations The greatest
number of observations was for Section 3 and Section 11
Instrument Development and Design
The watershed resource user needs analysis instrument
(WRUNAI) was designed to study the factors sources and
processes pertinent to identifying training needs The
instrument was revised on the advice of an expert panel
then used in the field to collect attitudinal and
demographic information from members of OWICs constituent
organizations
Initial effort to design this instrument was made
after reviewing literature which addressed issues raised in
the mandate of the OWIC especially the philosophical
underpinnings for managing and using watershed resources in
Oregons riparian zones There were four important issues
relevant to training needs analysis of the target group
covered in the design of the instrument conflict
management styles (CMS) orientations regarding single
versus multiple use of natural resources scarcity and
abundance assumptions and demographic information
(Clawson 1987 Frederick amp Sedjo 1991 Krueger 1992
Libecap 1981 Pondy 1967 Putnam amp Wilson 1982 Temkin amp
72
Cummings 1986 Ting-Toomey 1984 USDA 1990 Witteman
1988) Professionals who had expertise in natural resource
management and uses were consulted to discuss the contents
of the researchable issues for inclusion in the survey
instrument
The Uses of Watershed Resources questionnaire was
developed from the final WRUNAI instrument The
questionnaire contained 18 sections (Appendix B) Each
questionnaire section was developed to include self-
explanatory instructions Section 1 of the instrument
contained 15 possible paired comparison of six watershed
resource uses namely aesthetic enjoyment and recreation
aquifer recharge livestock forage fish habitat water
storage and wildlife habitat The paired resource uses
were developed by following Thurstones paired comparison
methodology
n(n - 1)2
where n denotes the number of stimuli The six resource
uses resulted in 15 possible dyads (Guilford 1954 p 159
Remmers 1954 p 225) A relative measure was shown on a
scale from 0 to 2 where zero represent both uses being
equally valued 1 or 2 in a given direction
representing favored and strongly favored use
respectively If undecided the respondent was asked to
draw a line through the item An example was given This
section represented the multiple-use measure of the
alternative watershed resource uses
73
Section 2 was designed to measure respondents views
hold toward abundance or scarcity Six comparable dyad
statements were developed in this manner For three
statements the right-side statement represented the
scarcity view and the left side statement represented the
abundance view This order was reversed for the other
three statements A relative measure was shown on a scale
from 0 to 2 where zero representing neither statement
being favored and 1 or 2 in a given direction
represented that one statement was favored or strongly
favored An example was provided
Section 3 of the questionnaire consisted of 30 items
These items were adapted from the Organizational Conflict
Communication Instrument (OCCI) (Putnam amp Wilson 1982) for
the purpose of this study This section measured the
respondents preferred conflict management styles (CMS)--
control nonconfrontation and solution orientation The
items were measured on a 7-point summated-rating scale
The scale spread measured from always (1) to never (7)
A low score indicated frequent use of certain conflict
communication strategies and high scores indicated
frequent use of certain conflict interaction behaviors
(Ting-Toomy 1984) The OCCI is a multidimensional measure
of conflict management styles rather than a single
dimensional measure Each CMS statement represented a
position in a group environment (a) ones own position
within a decision-making group (b) the opposing parties
74
position with in a group (c) the perceived extent of the
conflict situation (ie the significance of the conflict
in ones life such as prestige matter versus best
alternative uses) (Temkin amp Cumming 1986) If a statement
was not applicable the respondent was asked to cross it
out
Section 4 consisted of one forced-choice item that
solicited the respondents perceived status of power in
regard to influencing other users in how resources should
be used (1 = more 2 = same 3 = less 4 = not applicable)
Section 5 through Section 18 contained items
concerning demographic information such as education
level gender nature of job and interest group
affiliations source of information title and position
private and public land management options and intensity
of conflict This information helped to assess additive
and interactive predictive effects of the key factors
leading toward resolution of conflict management between
the watershed resource interest groups
Survey Instruments for Measuring Behaviors
Conflict management theorists have designed a number
of instruments to measure respondents conflict behavior
The five most frequently used self-reporting instruments
are the Thomas and Kilmanns MODE Survey Halls Conflict
Management Survey (CMS) Putnam and Wilsons Organizational
75
Communication Conflict Instrument (OCCI) Ross and DeWines
Conflict Management Message Style (CMMS) and Rahims
Organizational Conflict Inventory-II (ROCI-II) (Womack
1988b) Each instrument has a particular focus for
measuring respondents conflict behavior The following
discussion is limited to position and disposition and
communication-related behavioral strategies and tactics in
the context of the scope of the present study
Of the five instruments previously mentioned the MODE
and CMMS measure respondents conflict behavior
irrespective of context (Kilmann amp Thomas 1977 Ross
1988 Womack 1988a 1988b) In other words both MODE and
CMMS deviate only slightly in respect to measuring
respondents behavior across situations The remaining
three instruments namely CMS OCCI and ROCI-II measure
respondents behavior differently for each situation and
for each target Halls CMS instrument is situation-
biased Rahims ROCI-II instrument measures conflict
behavior influenced by the target that is the conflict
behavior between superiors and juniors peers and
subordinates Putnam and Wilsons OCCI instrument measures
the behaviors of the respondents that is influenced by both
target and situations (Thomas amp Kilmann 1978 Putnam amp
Wilson 1982 Shockley-Zalabak 1988 Weider-Hatfield
1988 Wilson amp Waltman 1988 Womack 1988b)
All five conflict behavior measuring instruments
consider communication behavioral aspects to different
76
degrees The OCCI and CMMS instruments are objectively
designed to measure communicative conflict type of behavior
(Putnam amp Wilson 1982 Wilson amp Waltman 1988 Womack
1988b) As Jandt and Hare (1976) noted for parties to be
in conflict they must also be in communication (p 3)
The major difference between the OCCI and the CMMS is
in presentation Items in the OCCI represent summaries of
message behavior for example I assert my opinion
forcefully (Putnam amp Wilson 1982 Wilson amp Waltman 1988
Womack 1988b) On the other hand the CMMS instrument
presents messages for the respondents selection for
example If you are not going to cooperate I will just go
to someone who will (Womack 1988b p 438)
Putnam and Jones (1982) suggested that the instruments
differ in their presentation of tactical perspectives
(ie game plans) and strategies For example the OCCI
and to a lesser extent the MODE embody both tactics and
strategies as well as general intention characteristics
The ROCI-II and the CMS instruments are worded to elicit
ones behavior as indicated by general intentions or
strategies (Womack 1988b p 438)
The tactical and strategic approaches have their own
strengths Because the OCCI and the MODE include tactical
and strategic approaches they identify the nature of
specific conflict behaviors among respondents Further
the tactical and strategic approaches are compatible with
77
each other and tend to merge into one approach
particularly in the case of the OCCI
Psychometric Properties of the Instruments
The reliability and validity estimates provided
relative evaluations of the best and more frequently used
instruments A comparison of the reliability alpha
coefficients for the five conflict-behavior measuring
instruments from earlier studies are presented in Table 3
Cronbachs alpha statistic was used for estimating internal
consistency reliability The reliability coefficients were
highest for the OCCI
Table 3 Comparison of Cronbachs alpha coefficients across scales
Thomas- Putnam- Ross-Instruments Killmann Hall Rahim Wilson Dewine
(OCCI)
Confrontation 65 73 77 85 78
Compromise 58 45 72 92
Forcing 71 61 72 85 76
Smoothing 43 55 72 94 73
Withdrawal 62 39 75 88 _ Overall means 60 55 74 89 76
N= 76 N= 76 N= 1219 N= 360 N= 123
Source Adapted from Womack (1988b) pp 440
According to Womack (1988b) in general conflict
management researchers have observed lower reliability
coefficients in their own studies than those reported by
the instrument developers They also found that only the
OCCI meets Nunnallys criteria for alpha coefficients
78
Nunnallys average standard alpha coefficients are 80 for
basic research and 90 for applied research (Womack
1988b)
The CMS and the MODE have been shown to have the
weakest content validity of the five instruments (Thomas amp
Kilmann 1978 Womack 1988b) Conflict management
researchers including those in the communication area
confirmed that three conflict management styles were
associated with the interrelationship of the message items
Sets of conflict management styles were termed differently
CMMS focus on self focus on issue and focus on
other (Ross 1982 Ross amp Dewine 1988)
OCCI non-confrontation solution-orientation and
control (Putnam amp Wilson 1982)
ROCI-II dominating integrating and avoiding
(Weider-Hatfield 1988)
Only Rahim (1992) confirmed the significance of the five
conflict management styles reported by Blake and Mouton
integrating obliging dominating avoiding and
compromising
The literature reported that construct validity is
weak for all available conflict management instruments In
general there is a problem in comparing the results of one
instrument with those of another due to variation in the
theoretical conceptualization for each instruments This
is a common problem for all self-report instruments
Predictive validity is unknown for all the instruments
79
(Canary Cunningham amp Cody 1988 Kabanoff 1987 Daves amp
Holland 1989 Womack 1988a 1988b)
The OCCI Instrument
Putnam and Wilson (1982) designed the OCCI instrument
in response to conceptual and methodological weaknesses of
previous conflict behavior measuring instruments The
instrument is specially designed to accommodate verbal and
non-verbal communications which are essential components
of any conflict behavior (Putnam 1988 Ross 1982 Wilson
amp Waltman 1988) In the past conflict theorists paid
less attention to communication than to role (eg
interdepartmental supervisor-subordinate) in conflicts
(Lawrence amp Lorsch 1967 Putnam amp Wilson 1982)
Putnam and Wilson (1982) pointed out methodological
weaknesses in the grid-oriented approach They are
1 Each individual has unique characteristics such
as subjective cultural differences that influence conflict
management style either positively or negatively (Rahim amp
Bonoma 1979 Ting-Toomey 1984)
2 There are disagreements in defining and
conceptualizing the conflict episodes that lead to
incompatible goals between individualsgroups (Witteman
1986 1988)
3 A failure to agree upon the specific source or
target of conflicts may be misguiding to the professional
for designing target-based conflict resolution
80
4 Each instrument measures conflict management
style according to some specific intention rather than
multiple objectives Examples of specific purpose design
elements are a one-item scale (Renwick 1977) a set of
aphorisms (Lawrence amp Lorsch 1967) Blake and Moutons
managerial grid (Howell 1981) and a forced-choice
questionnaire (Kilmann amp Thomas 1977)
Compared to other existing instruments the OCCI
instrument is a relatively better predictor and has higher
reliability and content validity (Putnam amp Wilson 1982
Witteman 1991) As already discussed the OCCI isolates
three conflict management styles solution-orientation
control and nonconfrontation (Putnam amp Wilson 1982
Womack 1988b) Compared to the original five conflict
management styles solution-orientation represents a
combination of confrontation and compromise conflict
management styles control style resembles forcing in
establishing direct communication between the groups for
resolving disagreements and nonconfrontation combines
avoiding and smoothing (Witteman 1991)
According to Nadler et al (1979) Filley identified
three approaches to resolve conflicts (a) win-lose (b)
lose-lose and (c) win-win With the OCCI instrument
Filleys conflict resolution approaches can be estimated
The approaches are comparable with the OCCI conflict
management styles (Filley 1975 Nadler Hackman amp Lawler
1979 Putnam amp Wilson 1982)
81
Approach (Piney) Management Style COCCI)
win-lose controlling lose-lose nonconfrontation win-win solution orientation A number of studies applied the OCCI instrument in
studying the relationship of subjective culture gender
and vertical and horizontal hierarchical positions in
voluntary and non-voluntary organizations with three
conflict management styles depending upon the nature and
situation of the conflicts (Putnam and Wilson 1982 Temkin
amp Cummings 1986 Ting-Toomey 1984 Wilson amp Waltman
1988) These studies concluded that diagnosis of conflict
management styles is not only sufficient to suggest the
conflict strategies until the conflict case associated
factors be included Thus the choice of conflict strategy
should be a joint function along with other supporting
factors (eg culture philosophy of natural resource
management) depending upon a given situation (Wilson amp
Waltman 1988)
Compared to the CMS and MODE the OCCI is difficult to
administer and interpret It is not recommended for use in
studying the impact of training programs due to
uncertainty regarding test-retest reliability (Putnam amp
Wilson 1982 Wilson amp Waltman 1988)
Validity and Pilot Testing of the Questionnaire
The questionnaire was validated by an expert panel
whose eight members understood watershed resource issues in
82
riparian zones The experts communicated their comments
independently on the consistency accuracy and clarity of
the questions concerning watershed resources These
comments were used to adjust the draft instrument
The revised WRUNAI was sent to the 20 OWIC members
Their feedback resulted in only minor editorial changes to
the questionnaire However their response on revising the
instrument was treated as a proposed (where they want to or
should be) component of the WRUNA model
Data Collection
The Uses of Watershed Resources questionnaire was
distributed to the 20 OWIC members and 287 associate
members randomly selected from the nine participating
constituent organizations to the individual members
Follow-up mailing was done by the researcher employing
mail survey techniques proposed by Dillman (1978) The
data collection was completed in 20 weeks (March to August
1993)
In the first phase survey packets were assembled and
mailed to the 20 OWIC members Each included a
questionnaire along with a cover letter representing the
Oregon State Universitys faculty a stamped self-addressed
envelope and a stamped return postcard to 20 OWIC members
(Appendix C) In addition to completing the
questionnaire the ten members representing OWIC
constituent organizations were asked to provide (a) their
83
respective organizations membership directory or list of
30 randomly selected associate members and (b) a cover
letter written on their organizations letterhead to be
included in the survey packets sent to select members of
the respective constituent organization
Dillmans (1978) total design method (TDM) guidelines
for mail survey were used in part to facilitate a high
return rate A postcard was mailed to all subjects two
weeks after mailing the first survey packet to remind those
who had not yet responded or to thank those who had
already responded (Appendix C) The subjects who did not
respond to the survey packet within four weeks were mailed
another survey packet
In the second phase survey packets were mailed to the
selected organizational members as soon as the required
materials were received If any constituent organization
was not able to supply membership directory it was asked
to provide a list of 30 members randomly selected from its
membership Dillmans procedures for mail survey were
repeated with the mailing to constituent organizations
Data Analysis
Data were coded and entered into a Quattro Pro
(Version 30) spreadsheet which was converted into a Lotus
1-2-3 (Version 3) spreadsheet The data were then analyzed
84
using SPSSPCplusmn (Version 30) on an IBM PS2 Model 80
microcomputer
85
4 RESULTS AND DISCUSSION
The present study was an investigation into how needs
analysis could be used in developing training interventions
for resolving conflict among natural resource userinterest
groups The primary purpose of the study was to develop a
needs assessment approach for use with userinterest groups
in potential conflict over watershed resource
usemanagement in Oregon riparian zones Criteria derived
from the review of literature on instructional system
design models were used to develop the watershed resource
users needs assessment (WRUNA) conceptual framework The
WRUNA model was in turn used in designing the instrument
to acquire information from watershed resource
userinterest groups
For the purposes of this study the Watershed Resource
Users questionnaire was designed based on the WRUNA model
to gather information from the Oregon Watershed Improvement
Coalition (OWIC) and its constituent organizations Each
of the 18 sections of the mail survey questionnaire was
designed to generate data on specific variables The first
three sections concerned the dependent variables in this
study namely resource use orientation resource supply
philosophy and preferred conflict management style The
remaining sections concerned independent (demographic)
variables
86
The statistical analyses performed were analysis of
variance with multiple range test multiple linear
regression Pearsons correlation and descriptive and
summary types of statistical analyses The 10 probability
level was used The results of these analyses served as
the bases for (a) evaluating the instrument developed in
this study (b) establishing how needs assessment could be
used in the development of target-based instructional
interventions when the goal is conflict management and (c)
generating questions for discussion and further research in
this area
The remainder of this chapter is divided into three
sections for presenting and discussing the results of
analyses The first section examines needs assessment data
(Sections 1 to 3) for OWIC and the environmental business
and professional groups The second covers demographic
data on the constituent groups and the third is a
discussion on the credibility of the instrument Summaries
of analyses are presented within the text More detailed
information are given in the Appendices
Results of Analyses of Needs Assessment Data
This section identifies and compares the resource use
orientation resource supply philosophy and preferred
conflict management style of the OWIC and constituent
groups as determined from data collected by the mail
87
survey questionnaire Section 1 of the questionnaire
contained 15 items pairing six watershed resource uses
Section 2 contained six comparable dyad statements
expressing abundance versus scarcity philosophical views
For Section 1 a relative measure was shown on a scale from
0 to 2 where zero represented that neither response choice
was favored and 1 or 2 in a given direction represented
that one response choice was favored (1) or strongly
favored (2) For Section 2 the analysis showed a
relative measure on a 5-point scale where smaller the value
the more one favors the scarcity orientation On the other
hand the larger the value the more one favors an abundance
orientation
Section 3 consisted of 30 items adapted from the
Organizational Conflict Communication Instrument (OCCI)
(Putnam amp Wilson 1982) for the purpose of this study
This section measured the respondents preferred conflict
management style (CMS)--control nonconfrontation or
solution orientation The items were measured on a
seven-point summated rating scale (1 = always and 7 =
never) A low score indicated frequent use of certain
conflict communication strategies and high scores
indicated frequent use (see Chapter 3 for detailed
discussion)
The purpose of the first three sections was to examine
the perceptual similarities and dissimilarities between
members of the OWIC and its constituencies and the assumed
88
ideal profile represented in the WRUNA framework (Figure
5) as where they should be The ideal profile was based
on suggestions in the OWIC literature that certain
predispositions were necessary for consensus building
namely (a) multiple-use orientation (b) abundance
philosophy and (c) conflict management style tending
toward solution orientation
Resource Use Orientation
Table 4 summarizes the results of statistical analyses
on resource use orientation The results indicated that
OWIC and constituent group respondents did not have the
same orientation toward use of riparian watershed resources
(F = 542 df = 3 173 p = 00) Individual differences
between the OWIC members and the members of each
environmental business and professional group were
identified by employing a post-hoc least square difference
(LSD) test with probability level of 10 (Kleinbaum amp
Kupper 1978 Williams 1986) The possible mean score
range was 0 to 2--the smaller the mean score the greater
the tendency toward multiple resource use According to
the LSD test the professional (mean = 75 SD = 41) and
business (mean = 79 SD = 45) groups tended toward
multiple resource use whereas the OWIC (mean = 102 SD =
35) and environmentalist (mean = 104 SD = 42) groups
tended toward single use However caution is
89
Table 4 ANOVA results on resource use orientation
Source SS df MS
Between groups 293 3 98 542 00
Within groups 3116 173 18
Total 3409 176
Group na Meanb SD
Environmentalist (EG) 81 104 42
Business (BG) 57 79 45
Professional (PG) 20 75 41
OWIC (0) 19 102 35
Total 177 92 44
Environ- Profes- Uses mentalist Business sional OWIC
Livestock- n 80 55 20 19 wildlife M 445 267 315 347
SE 09 15 23 35
Wildlife-Fish n 75 54 20 17 M 311 294 305 318 SE 09 10 15 20
Fish-Livestock n 81 56 19 19 M 129 318 279 232 SE 06 16 29 30
Livestock-Water n 79 53 20 18 storage M 438 313 345 400
SE 09 13 25 21
Water storage- 78 54 20 19 Fish M 371 250 270 295
SE 11 11 18 19
Fish-Aesthetic amp n 80 53 20 18 recreation M 228 247 23 194
SE 11 12 18 19
Aesthetic amp n 79 56 20 19 recreation- 162 380 345 295
r
M
Livestock SE 09 14 25 30
Livestock- n 80 57 20 19 Aquifer recharge M 450 293 340 411
SE 09 15 27 25
Aquifer n 76 55 20 19 recharge- M 313 284 285 258 wildlife SE 12 12 23 23
Wildlife-water a 77 55 20 19 storage 240 344 310 305
SE 11 12 20 24 11
90
Environ- Profes-
Uses Water storage- n
mentalist 78
Business 55
sional 20
OWIC 19
Aesthetic amp M 283 205 220 184 recreation SE 13 12 25 18
Aesthetic amp n 77 55 20 18 recreation- M 385 362 365 411 Wildlife SE 11 11 22 21
Aquifer n 77 55 19 19 recharge- M 242 222 195 158 aesthetic amp SE 11 13 21 16 recreation
Fish-aquifer n 77 55 20 19 recharge 21 269 320 335 332
SE 12 12 22 23
Water storage- 75 54 20 19 Aquifer recharge M 352 283 325 363
SE 10 10 14 21
Note 1 = always left use 5 = always right use aNumbers of participants responding to the question The smaller the mean the stronger the preference toward multiple use Scale 0 = multiple use 1 = favor single use 2 = strongly favor single use plt10
LSD test (PG = 8G)lt(0 = EG)
advised in interpreting these results which are based
solely on an examination of means Extreme scores may
distort the average The professional group compared to
those of the business group had a smaller range of scores
The distribution of scores for the business group appeared
to be more normally distributed (0 to 20) compared to
those for the professional group (27 to 180) There were
no outliers observed for these two groups
The difference in mean scores between members of the
OWIC group and the environmental group may be explained by
two outliers observed in the OWIC group one at each end of
the scale In other words one member of the OWIC group
91
represented an extreme position toward single use
orientation whereas another member represented the extreme
toward multiple use orientation The scores for the
majority of the members ranged between 6 and 13
The standard deviations for the OWIC and environmental
groups were about the same The score for the
environmental group members were heavily and evenly
distributed toward single use orientation except for the
means of two members that fell in between 0 and 4
representing a strong multiple-use orientation
In summary the findings indicated that the OWIC and
the environmental group members held almost similar
positions regarding resource use with a moderate tendency
toward single use The business and professional groups
showed a moderate tendency toward multiple use orientation
compared to the OWIC and environmental groups Therefore
the business and professional group members were more
inclined the WRUNA model ideal on resource use orientation
Resource Supply Philosophy
The results of analyses showed that the OWIC and the
constituency members shared a similar philosophical
orientation toward resource supply but not to the same
degree (F = 1001 df = 3 173 p = 00) As shown in
92
Table 5 the results indicated a greater tendency toward
abundance philosophy for the OWIC group (mean = 431
Table 5 ANOVA results on resource supply philosophy
Source SS df MS
Between groups 1168 3 389 1001 00
Within groups 6729 173
Total 7897 176
Group n8 Meanb SD
Environmentalist (EG) 79 350 70
Business (BG) 55 383 50
Professional (PB) 20 389 68
OWIC (0) 19 431 56
Total (197) 173 374 67
aNumbers of participants responding to question bResponses were scored on a 5-point scale 1 = Strongly favor scarcity philosophy 2 = Favor scarcity philosophy 3 = Neutral 4 = Favor abundance philosophy 5 = Strongly favor abundance philosophy The greater the mean the stronger the preference
LSD test EG PG BG ltO BG = PG EGltBG PG O
SD = 56) than for the environmental subjects The
environmental group slightly favored (mean = 350 SD =
70) the abundance philosophy Mean scores for the other
two groups business (mean = 383 SD = 50) and
professional (mean = 389 SD = 68) fell in between the
mean scores of the environmentalist and the OWIC groups
Mean scores indicated that members of OWIC and the
environmental group were in relative disagreement in terms
93
of resource supply philosophy Perceptual differences
regarding resource supply existed between the OWIC and
environmental group members who responded to the
questionnaire but the majority of the members in both
organizations (environmental = 74 OWIC = 100) were
strongly inclined toward abundance philosophy (mean greater
than 30) There was no critical outlier observed in
distributions of scores for either group Mean
distributions for both the business and professional groups
were normal with the exception of one outlier observed for
the business group This outlier may have influenced the
total mean score for the business group which indicated a
strong tendency toward abundance philosophical orientation
In summary a statistically significant difference was
found between mean scores for OWIC in terms of resource
supply philosophical orientation The data indicated
however that the environmental group tended less toward
the abundance philosophical orientation Although 42 of
OWIC members represented environmental organizations the
organization tended more toward abundance philosophy the
WRUNA model ideal than did the environmental constituent
groups The business and professional groups were
positioned between the environmentalist and OWIC groups
with mean scores indicating a moderate abundance
philosophical orientation
94
Conflict Management Style
Tables 6 through 8 summarize the one-way analysis of
variance results on preferred conflict management styles of
the OWIC and constituent groups Means indicated that the
preferred conflict management style was solution
orientation for all four groups The smaller the mean the
greater the tendency toward solution orientation conflict
management style (range 1 to 7) the tendency of the OWIC
(mean = 305 SD = 49) and professional (mean = 328 SD =
113) groups were relatively stronger (F = 392 df =
3148 p = 01) than that of the environmentalist (mean =
362 SD = 81) and business (mean = 377 SD = 93)
groups
The number of respondents for the OWIC and the
professional groups was about the same (19 and 20
respectively) but the standard deviation for the
professional group was nearly double that for OWIC (113
versus 49) The scores for the OWIC group were fairly
evenly distributed but to some extent it was skewed toward
very often on solution orientation There was no obvious
outlier observed in the data Score distribution for the
professional group was very uneven 90 of the members
scores fell between 2 (very often) and 4 (sometimes) on
questionnaire items related to solution orientation There
were two outliers observed but the more critical outlier
was toward the extreme of never
95
Table 6 ANOVA results on solution orientation management style
Source SS df MS p
Between groups 887 3 296 392 01
Within groups 11167 148 75
Total 12054 151
Group na Meanb SD
Environmentalist 61 362 81
Business 52 377 93
Professional 20 328 113
OWIC 19 305 49
Total 152 355 89
aNumbers of participants responding to question items bResponses scored on a relative scale (3 = strongly favored 4 = favored)
LSD test (0 = PG) lt (EG = BG)
Table 7 ANOVA results on nonconfrontation conflict management style
Source SS df MS p
Between groups 59 3 20 34 79
Within groups 8659 150 58
Total 8719 153
Group na Meanb SD
Environmentalist 63 497 75
Business 52 492 76
Professional 20 501 98
OWIC 19 512 50
Total 154 498 75
aNumbers of participants responding to question 6Responses re conflict management behavior were scored on a 7-point scale 4 = sometimes and 5 = seldom and 6 = very seldom
96
Table 8 ANOVA results on control conflict management style
Source SS df MS
Between groups 887 296 392 01
Within groups 11167 148 75
Total 12054 151
Group na Meanb SD
Environmentalist 62 432 88
Business 51 405 95
Professional 19 408 115
OWIC 19 450 87
Total 151 422 94
aNumbers of participants responding to question items bResponses were scored on a relative scale 4 = sometimes 5 = seldom
3
The business and environmental groups were moderately
oriented toward solution orientation Their mean standard
deviations were the same One outlier was observed in the
environmental group Two possibly three outliers were
observed in the business group Scores of these outliers
indicated that they preferred conflict management styles
other than solution orientation The respective group mean
scores regarding solution orientation as the preferred
conflict management style may have been skewed downward by
the outlier scores
Table 7 shows that the OWIC (mean = 512 SD = 50)
and constituent groups (mean score range = 492 to 501)
were consistent for items measuring nonconfrontation
conflict management style behavior (df = 3 150 F = 34
97
p = 79) On the 7-point scale used to measure conflict
management style preference 5 indicated seldom Thus
the mean scores indicated that all groups tended toward
seldom use of the nonconfrontation style As already
discussed in chapters 2 and 3 nonconfrontation combines
avoiding (ie refusal to discuss the conflict) and
smoothing (ie accommodate to cover up the conflict)
styles of conflict management (Putnam amp Wilson 1982
Witteman 1991) According to the WRUNAs ideal
guidelines the trend of the nonconfrontation scores toward
seldom indicated a desire to resolve the conflict
The mean score distribution for OWIC is a normal
distribution with scores spread from 38 to 61 The most
critical outliers were observed in the professional and
environmentalist groups The outliers may have influenced
higher mean scores for nonconfrontation conflict management
style The mean score distribution of the business group
is also normally distributed with scores ranging from 30
to 67 However the distribution curve for the business
group is flatter than that for the OWIC group
The four groups did not appear to differ in their
views of control conflict management style (F = 145 df =
3 147 p = 23) (see Table 8) Mean scores for the OWIC
(mean = 450 SD = 87) and environmental (mean = 432 SD
= 88) groups may have reduced because of outlier scores
resulting in a lower frequency for control behavior
Outlier scores may also have distorted the mean scores for
98
the business (mean = 405 SD = 95) and professional (mean
= 408 SD = 115) groups resulting in higher frequency
for control conflict management style
In summary a preference for solution orientation was
strongly indicated by mean scores (3 = often) for the
members of the OWIC and professional group and moderately
indicated by mean scores (4 = sometimes) for
environmentalist and business groups The members of OWIC
and its constituencies tended toward the solution
orientation conflict management style the WRUNA model
ideal
Results of analyses indicated significant difference
between the OWIC and the constituent groups on resource use
orientation resource supply philosophy and preferred
conflict management style The implication of these
findings is that the different instructional interventions
would be appropriate for heterogeneous groups
Results of Analyses of Demographic Data
Sections 4 through 18 of the questionnaire collected
demographic information Section 4 consisted of one
forced-choice item soliciting respondents perceived status
of power in regard to influencing other users in how
resources should be used (1 = more than others 2 = same
as others 3 = less than others 4 = not applicable)
The other sections concerned education level gender
nature of job and interest group affiliations sources of
99
information views toward private and public land
management options and perception of intensity of
conflict This information helped to assess additive and
interactive predictive effects of key variables leading
toward resolution of conflict between the watershed
resource userinterest groups
Demographic data were collected from participants in
the environmental business and professional groups as
well as OWIC In most cases only data on the members of
the constituent organizations were compared and discussed
to suggest instructional interventions Respondents
perceptions were analyses regarding power status and
interactive effect Presentation and discussion of the
results follow
Gender
As Table 9 shows less than one-fourth (234) of
total respondents were female The environmental group had
a larger proportion (367) of women than did the business
and professional groups (91 and 100 respectively) (x2
= 1610 df = 2 p = 00)
Years of Schooling
The mean scores for years of schooling for the
business group (1552) differed significantly from those
of respondents in the environmentalist and professional
100
Table 9 Gender of respondents
Male Female
Group na
Environmentalist 50 633 29 367
Business 50 909 5 91
Professional 18 900 2 100
Total 118 766 36 234
aNumbers of participants responding to question
groups (1706 and 1735 respectively) (F = 758 df = 2
143 p = 00) (Table 10) Results of regression analyses
indicated that educational attainment was a significant
variable in resource use orientation (B = 06 t = 285 p
= 01) however it only explained 6 of the variance (see
Appendix D Table 30)
Table 10 ANOVA results for years of schooling
Source SS df MS p
Between groups 8858 2 4429 758 00
Within groups 83581 143 584
Total 92439 145
aGroup n Mean2 SD
Environmentalist 72 1706 241
Business 54 1552 250
Professional 20 1735 216
Total 146 1653 252
aNumbers of participants responding to question lNean years of schooling possible range 1-22 plt10
101
Power Status
The majority of respondents in all four groups
perceived their power status to be the same as others
The t-test indicated no significant difference in means
either 3 t-test results or in ANOVA (Appendix D Table 16)
Analyses of variance revealed no significant power status
effect on preferred conflict management style (F = 74 df
= 3 115 p = 53) (Table 11 and see other details in
Appendix D Table 17)
Process Participation
Constituent group members were asked about their
involvement in facilitating communication among users of
riparian areas other than through OWIC Professional group
members indicated a relatively higher rate (74) of
participation in the process communication facilitation
than the environmentalist and the business constituencies
(x2 = 2630 df = 2 p = 00) (Table 12) Few
communication facilitation services have been extended
outside OWIC by the business (18) and environmentalist
(20) group members The perceived impact of those
communication facilitation efforts is presented in Appendix
D Table 18 The data revealed that constituent group
member communication facilitation efforts experiences were
similar (F = 93 df = 2 37 p = 41) The respondents
viewed the facilitation process as somewhat productive
(mean = 195 SD = 43)
102
Table 11 ANOVA results for power status in influencing others
Source SS df MS
Between groups 90 3 30 74 53
Within groups 4656 115 40
Total 4746 118
a Group n Meanb SD
Environmentalist 44 198 59
Business 39 200 69
Professional 17 176 66
OWIC 19 184 60
Total 119 193 63
aNumber of participants responding to question bResponses scored on 3-point scale (1 = more than others 2 = same as others 3 = less than others)
Table 12 Frequency of response on involvement in communication facilitation process
Yes No
Group na n
Environmentalist 15 195 62 805
Business 10 179 46 821
Professional 14 37 5 263
Total 39 257 113 743
Note Pearson x2 = 2630 df = 2 p = 00 aNumbers of participants responding to question
Sources of Information
Participants were asked to indicate the importance of
certain sources of information in promoting awareness and
the exchange of ideas in terns of technical social
103
economic and political aspects The sources of
information given in the questionnaire were general
membership meetings special membership meetings published
magazines newsletters and scientific journals committee
meetings friends neighbors and relatives displays at
fairs and other public meeting places government agencies
such as USFS and ELM extension services and personal
toursvisits The analysis of variance indicated
significant differences in mean scores for general
membership meetings (df = 2 128 F = 445 p = 01)
committee meetings (df = 2 120 F = 506 p = 01)
friends neighbors and relatives (df = 2 129 F = 308
p = 05) and Extension Service (df = 2 129 F = 537
p = 01) Table 13 summarizes in descriptive terms the
levels of importance each information See Table 19
through Table 27 (Appendix D) for results of statistical
analysis
Care is needed in interpreting these results because
they are merely based on mean scores The complexity of
the interconnected information network of these groups
warrants serious consideration when designing needs
analysis as well as instructional interventions
Riparian Resource Use Management
In regard to preferred type of riparian landresource
management the pattern of responses for the three groups
differed As Table 14 shows the professional group was
104
Table 13 Descriptive summary of results on importance of selected sources of information
Group
Source Environ- Profes-mentalist Business sional
Magazines Important Important Important newsletters scientific journals
Government agencies Important Important Important
Newspapers and news Important Important Important magazines
Extension Service Somewhat Important Somewhat important important
Special membership Somewhat Somewhat Somewhat meetings important important important
Friends neighbors Important important Somewhat and relatives important
Committee meetings Somewhat Important Important important
Displays--fairs Somewhat Somewhat Somewhat other public important important important meeting places
General membership Somewhat Important Important meetings important
Note Sources are arranged in descending order of mean scores
split between some private and some public lands being
controlled by entrepreneurs (59) and similar management
for all public and private lands (41) The
environmentalist group was similarly split except for one
outlier but similar management for all public and private
lands was strongly favored (76) The business groups
responses were widely and unevenly distributed but favored
private lands (37) or some private and some public lands
105
(39) being controlled by riparian areas resource users
Results of analyses indicated that views of the
environmentalist and business groups regarding riparian
landresource management differed significantly
(Kolmogorov-Smirnov 2-Sample Test Z = 310 p = 00)
Interestingly 80 or more of the participants in each
group responded that Oregons riparian areas resource
usemanagement conflict could be successfully managed
(Table 28 Appendix D)
Almost all of the study participants in the
environmental business and professional groups indicated
that riparian resource usemanagement is a controversial
issue The total group mean (277) indicated that the
perceived degree of conflict was greater than moderate but
less than severe (2 = moderate and 3 = severe) (Table
29 Appendix D) The implication of these findings was
that there is need for instructional intervention to reduce
conflict According to the literature on conflict
management conflict management intervention should be
attempted when a problem creates conflict of severe
intensity (Rahim 1992)
106
Table 14 Frequency data on type of riparian land management
Nonel One type2 Bothtvpes3 A114
Group n
Environmental 1 14 16 222 55 764
Business 2 39 19 373 20 392 10 196
Professional - - 10 588 7 412
Total 2 14 20 143 46 329 72 514
Note For environmental and business groups only Kolmogorov-Smirnov 2-Sample Test (n= 72 n = 51) Z= 310 p= 00
Land use philosophy Classi- Environ- Busi- Profes-fication mental ness sional
All public and all private 4 775 192 412 land
All public and some private 3 338 216 438 land
All public and no private land 2 86 347 63
Some public and all private 3 57 41 63 land
Some public and some private 3 86 300 500 land
Some public and no private 2 43 417 125 land
No public and all private land 2 29 41 63
No public and some private 2 29 61 63 land
No public and no private land 1 29 42 63
Demographic Variables as Predictors
Stepwise multiple regression analyses were employed to
determine whether any meaningful relationship existed
between dependent and independent variables The dependent
variables were preferred conflict management style (ie
control nonconfrontation and solution orientation)
107
resource use orientation and resource supply philosophy
Table 30 through Table 32 (see Appendix D) summarize the
results of these regression analyses The criterion for
inclusion of an independent variable was set at 1
probability confidence level exclusion was set at 15
probability level The independent variables included were
power status land management gender educational
attainment perceived level of conflict intensity and
conflict management
Five fitted regression equations when environmental
and business groups were pooled for analysis purposes
There was equal opportunity for each dependent variable to
pick among the independent variables Results of the
regression analyses indicated a significant educational
attainment effect on resource use orientation (n = 77 B =
06 t = 285 p = 01) (Table 30 in Appendix D) However
this independent variable explained only 10 of the total
variance The land management and conflict management
variables (third regression equation) explained 13 of the
total variance regarding resource supply philosophy was
explained Conflict management and power status variables
interacted significantly regarding the solution orientation
variable however they explained only 8 of the variance
Two regression equations for the environmentalist
organizations and four regression equations for the
business organizations were generated when individual
regression analyses were employed for the respective
108
organizations For the environmental group the conflict
management variable predicted 13 of the variance for the
resource supply philosophy variable (n = 40 B = -71 t =
-235 p = 02) and the land management variable predicted
15 of the variance for control conflict management style
(n = 40 B = -71 t = -254 p = 02) (Table 31 in
Appendix D)
For the business group the conflict management
variable was observed to be a pertinent predictor in the
first and second equations It accounted for 10 of the
variance for control conflict management style variable
(n = 37 B = -76 t = -202 p = 05) It played a key
role in predicting the variance for solution orientation
conflict management style but not for control conflict
management style The theoretical inference from this
finding is that instructional interventions designed to
reduce preference for control style will effect increased
preference for solution orientation style among business
group members In the third regression equation both
conflict management and power status variables contributed
25 of the variance for solution orientation conflict
management style (Table 32 Appendix D) In the last
equation the intensity of the conflict variable explained
8 of the total variance for nonconfrontation conflict
management style (n = 37 B = 52 t = 174 p = 09)
In summary the predictor variables supported logical
interpretation of the coefficients and persistency in tetms
109
of sign directions and magnitude of the standard errors of
the regression coefficients Of the given independent
variables the most frequent predictor variables observed
in the regression equations were land management conflict
management power status and educational attainment The
interactive effect of conflict management and power status
variables explained the maximum variance for solution
orientation style among the business organizations The
analyses revealed interrelated aspects between resource use
orientation resource supply philosophy and preferred
conflict management style under the given independent
variables of power status source of information and land
management
Credibility of the Instrument
Validation of the instrument developed for this study
occurred in two phases As discussed in Chapter 3 the
instrument a mail survey questionnaire was validated by
eight expert panel members who understood riparian
watershed resource issues The experts communicated their
comments independently on the consistency accuracy and
clarity of the questionnaire items The draft instrument
was revised on the basis of the experts comments The
researcher discussed the study and the instrument with the
OWIC member charged with moderating OWIC meetings He
110
confirmed that the WRUNA models targeted goals
corresponded with OWICs expectations
Cronbachs alpha was used to estimate the internal
consistency reliability of the instrument (Table 15) The
alpha coefficients were 85 and 78 for the corresponding
15 and 6 items in Sections 1 and 2 respectively of the
questionnaire For the 7 control 12 nonconfrontation and
11 solution orientation items the alpha coefficients were
79 91 and 71 respectively The conflict management
style items were adapted from the OCCI (Putnam Ey Wilson
1982)
Table 15 Internal reliability of the WRUNA-based instrument
Number Number Alpha of of Coeffi-
Variable Cases Items Mean SD cient
Resource use orientation 183 15 83 28 85 (single vs multiple
Resource supply philosophy 183 6 347 37 78 (abundance vs scarcity)
Conflict management style a Nonconfrontation
(avoidance) 105 12 505 66 79 b Solution Orientation 105 11 339 42 91 c Control 105 7 417 95 76
Note Resource use orientation mean could range from 0 to 2 the smaller the mean the stronger the orientation toward multiple use Resource supply philosophy mean could range from 1 to 5 the larger the mean the stronger the orientation toward abundance philosophy The conflict management style mean could range from I to 7 the smaller the mean the greater the frequent use of certain conflict communication strategies (1 = always and 7 = never)
111
The alpha coefficients for nonconfrontation and
solution orientation conflict management styles were very
close to the Nunnalys average standard alpha coefficient
(80 to 90) whereas the alpha coefficient for control
conflict style was not (Womack 1988b) (see Table 33
through Table 35 in Appendix D for the effect of item
changes on the alpha values)
Tables 36 through Table 39 (Appendix D) present
summaries of the correlation coefficients between the
dependent variables resource use orientation resource
supply philosophy and conflict management style (ie
control nonconfrontation or solution orientation) for the
different demographic conditions in this study Table 36
indicates no significant correlation coefficients The
magnitude of the coefficients ranged from 06 to 46 The
results indicated that the dependent variables were
independent measures
Table 37 through 39 indicate correlation of at least
one with independent variable and dependent variable Only
one significant negative correlation was observed at 01
probability level between control and nonconfrontation
conflict management styles for environmentalist group
conditions It had a -31 correlation coefficient
magnitude The negative sign was appropriate for control
and nonconfrontation conflict management styles because
when control is increased nonconfrontation decreases
This type of pattern was observed in the study Thus the
112
negative correlation sign helps rather than hinders the
measuring credibility of the instrument The other inter-
factor correlation measures presented in Table 37 were
observed to be independent
As Table 38 shows a significant negative correlation
(-49) was observed between solution orientation and
resource supply philosophy at 001 probability level for
business group conditions In other words as the
preference for solution orientation conflict management
style increases the orientation toward scarcity philosophy
would become weaker or toward abundance philosophy
stronger This relationship was previously described under
Conflict Management Style in the Results of Needs
Assessment section of this chapter The independence of
the estimates is reflected from non-correlation between
other factors in Table 38
As Table 39 shows only one negative correlation was
observed between solution orientation and control conflict
management styles at the 01 level of significance under
professional group conditions The magnitude of the
correlation coefficient was -67 The meaning of this
negative correlation appears to be if control conflict
management style is decreased then solution orientation
conflict management style is increased and vice versa
The table does not show other variables having significant
relationships with one another In summary it is
reasonable to interpret correlation measures of statistics
113
favoring the non-interdependence of the independent
variables in the WRUNA-based instrument namely resource
use orientation resource supply philosophy and conflict
management style (ie control nonconfrontation or
solution orientation) under OWIC environmentalist
business or professional group conditions
Following are key observations made by the researcher
regarding data collection during the course of the study
1 Many participants (range 35-51) did not respond to all
items in Section 3 especially to item numbers 13 15
16 18 21 25 and 29 Of these individuals five
indicated that they did not have the knowledge or the
items were not applicable to them A few of the
respondents did not feel comfortable in responding to
some of the items in Section 3
2 Sections 1 and 2 (on resource use orientation and
resource supply philosophy respectively) of the
instrument showed good return Only 8 to 12
respondents did not complete these sections
3 Section 11 on the land management independent
variable was not responded to by about 34
participants A few of the respondents provided
feedback that they did not understand the question or
they could not properly respond to the question unless
a specific site problem was given
In general the content of the questionnaire was
appreciated by many of the respondents as evidenced by
114
such comments as It is worth doing A few responded
that the questions might be hard because the riparian issue
is hard too
115
5 SUMMARY AND CONCLUSIONS
The purpose of the study was to investigate needs
assessment methods that would facilitate the development of
target-based instructional interventions designed for
managing conflict between Oregons riparian watershed
resource userinterest groups To achieve this goal a
needs assessment model specific to conflict management
needs of watershed resource userinterest groups was
developed based on the theoretical and conceptual
framework from available literature and discussion of the
natural resource usemanagement concepts and issues with
concerned authorities working on that area An instrument
was developed to assess the perceptions and attitudes of
watershed resource users toward watershed resource use
watershed resource supply and conflict management style
The instrument was administered to the 20 members of the
Oregon Watershed Improvement Coalition (OWIC) and 287
members randomly selected from its constituent
organizations The response rate was 95 from the OWIC (n
= 19) and about 64 (n = 183) from the constituencies
including five blank returned questionnaire who remarked
either the instrument questions were not applicable to
their interest or they dont have enough knowledge about
riparian zones resource usemanagement issues
OWIC is a case study for consensus building among
watershed resource usersinterest groups and other
116
concerned parties The primary target population the nine
OWIC constituencies are comprised of environmentalist
business and professional organizations
Natural resource use and management issues are complex
in nature and cannot be appropriately resolved until the
perceptions and attitudes of the usersinterest groups are
understood The present study was an exploratory
research-based attempt to justify the development of
target-based instructional interventions for managing
conflict among such groups in potential long-term conflict
Discrepancy analysis was employed to determine the gap
between the existing and desired orientations of OWIC and
constituent group members toward watershed resource
usemanagement and conflict management style The desired
or ideal profile (what they should be) is a component of
the watershed resource users needs assessment (WRUNA) model
developed in this study The three characteristics of the
ideal profile were derived from OWIC literature They are
multiple-use orientation abundance philosophy and
solution orientation conflict management style
Results of analyses indicated that regarding multiple
use OWICs profile was similar to that of the
environmental group and dissimilar to that of the business
and professional groups The OWIC and environmental groups
were relatively less oriented to multiple use compared to
the other groups It should be noted that OWIC membership
represents environmentalist (42) business (32)
117
professional (21) groups and also includes a (5)
publicist
Regarding resource supply philosophy the OWIC group
was more oriented toward abundance philosophy than were the
business and professional groups which were closer to that
orientation than the environmentalist group which tended
toward scarcity philosophy
The preferred conflict management style for OWIC and
the constituent groups was observed to be solution
orientation OWIC and professional group members were
relatively more oriented toward solution orientation style
than the environmentalist and business group members which
were similar in regards to this dependent variable The
OWIC and the constituent groups were not different from
each other in terms of nonconfrontation and control
conflict management style preference in riparian conflict
situations
In summary results showed that OWIC has achieved the
WRUNA model ideal profile in terms of abundance philosophy
and solution orientation style but not in terms of
multiple use of the riparian watershed resources OWIC and
the constituent groups were quite similar in terms of
control and nonconfrontation styles of conflict management
but they were different to some degree in terms of multiple
use abundance philosophy and solution orientation styles
OWIC differed from the business groups in terms of multiple
use and from the environmentalist and business groups in
118
terms of abundance and solution orientation styles
Similarly the business group differed from the
environmentalist group in terms of multiple use and
abundance philosophy but was similar in terms of the three
conflict management styles
Conclusions
The watershed resource users needs assessment (WRUNA)
instrument appeared to be fairly reliable except one
factor control conflict management style The content of
the instrument was validated by a panel of eight experts in
the field of natural resource management and by the
moderator of the OWIC organization The key factors are
fairly independent from each other when controlled under
the OWIC organization the only significant relationships
appeared between control and nonconfrontation conflict
management styles under the environmental organization
and between solution orientation conflict management style
and abundance philosophy under the business group
Care should be taken in interpreting the findings of
the study It was exploratory in design Most of the
findings were based on average scores Outliers were
observed therefore skewed distributions were possible
The study synthesized participants perceptions and
attitudes direct observation was lacking Case-related
119
information is restrictive in generalizing the study
results and implications to other situations
The question arises how can the data generated by the
needs assessment be used to develop instructional
interventions to manage conflict among the watershed
resource usersinterest groups and how can these
interventions be effectively implemented into the existing
communicationfacilitation process
First the instrument questions particularly the
multiple-single resource use items (Section 1) abundance-
scarcity items (Section 2) and conflict management style
items (Section 3) were reliable and appeared to be valid
Identification of variations between OWIC group and the
constituent groups as well as between the constituencies
and between the ideal profile was assisted Further the
analysis of the results showed that these three variables
estimated the parameters fairly independently No major
correlation problems were observed except with a couple of
parameters in conflict management style and abundance
philosophy Therefore a training interventions package
could be developed by looking at the homogeneous and
heterogeneous aspects revealed by the instrument For
example environmentalist and business groups were found to
be divergent in terms of multiple-use and abundance
philosophical orientations therefore different
instructional interventions are indicated for these groups
Both however could benefit from the solution orientation
120
instructional intervention as could OWIC and the
professional group
The exploration of opportunities and possibilities for
the promotion of communication among watershed resource
userinterest groups is a priority for future study
because it will assist in extendingimparting the
instructional interventions to those groups This study
reviewed the status of the constituencies in respect to the
means for acquiring information on managing riparian
resources Published material such as magazines
newsletters brochures and scientific journals were
indicated to be important to all groups and government
agencies were indicated to be important The importance of
other means of acquiring information to the three groups
varied However these findings should provide a guide for
better exchange and communication with Oregons riparian
resource userinterest groups that will assist in gathering
further demographic information and implementing target-
based instructional interventions
A research agenda was suggested by the experience of
this study It was realized that more efforts are needed
to simplify the instrument Some of the questions related
to the conflict management styles under the riparian
conflict conditions need to be rewritten This fact was
evidenced by the poor response rate for this section Some
of the unimportant and repeated items should be replaced
with item conveying clear meaning of the required
121
information Therefore interdisciplinary team research
efforts especially close collaboration of instructional
specialist speech and communications professionals and
naturalenvironmental resource usemanagement specialist
are suggested to find the relevant variables The land
management philosophy question (Question 11) needs to be
improved to generate more feedback from respondents
There is a need to add questions to the instrument
which would determine conflict and conflict management-
related communication exchange status and its directions
only between business and environmentalist groups This
information could promote communication facilities between
the usersinterest groups as well as facilitate planning
activities by instructional designers natural and
environmental resource usemanagement managers
researchers and mediators for reducingmanaging conflict
among natural resource usersinterest groups
122
REFERENCES
Amy D J (1987) The politics of environmental mediation New York Columbia University Press
Beer M amp Walton A E (1987) Organization and development Annual Review of Psychology 38 339-367
Bingham G (1986) Resolving environmental disputes Washington DC The Conservation Foundation
Bisno H (1988) Sage
Managing conflict Newbury Park CA
Blake R R amp Mouton J S (1964) grid Houston Gulf Publishing
The managerial
Blake R R amp Mouton J S (1985) III Houston Gulf Publishing
The managerial grid
Boulding K E (1968) Preface to special issue Journal of Conflict Resolution 12 409-411
Bower J L (1965) The role of conflict in economic decision-making groups Some empirical results Quarterly Journal of Economics 79(2) 263-77
Brown L R (1991) Global resource scarcity is a serious problem In M Polesetsky (Ed) Global resources Opposing viewpoints (pp 17-23) San Diego CA Greenhaven Press
Buckely W Burns T amp Meeker L D (1974) Structural resolutions of collective action problems Behavioral Science 19 277-297
Bureau of Land Management (1992) The range of our vision Range Magazine 1(1) p 39
Canary D J Cunningham E M amp Cody M J (1988) Goal types gender and locus of control in managing interpersonal conflict Communication Research 15(4) 426-446
Chanin M N amp Schneer J A (1984) A study of the relationship between Jungian personality dimensions and conflict-handling behavior Human Relations 37(10) 863-879
123
Clawson M (1987) From sagebrush to sage The making of a natural resource economist Washington DC Ana Publications
Clay J (1962) My life on the range An introduction by Donald R Ornduff Norman University of Oklahoma Press
Conacher A (1980) Environmental problem-solving and land-use management A proposed structure for Australia Environmental Management 4(5) 391-405
Cusick S (1993 September) After years of abuse federal policy on Western lands is ripe for reform Audubon Activist pp 1 4-5
Daly H E (1991) Towards an environmental macroeconomics Land Economics 67(2) 255-259
Daves W F amp Holland C L (1989) The structure of conflict behavior of managers assessed with self- and subordinate ratings Human Relations 42(8) 741-56
Dechaud S (1992) With quadrupled grazing fees threatened and the timber industry stressed the folks of Lake County Oregon have much to be worried about Range Magazine 1(1) pp 24-26
Deutsch M (1949) A theory of cooperation and competition Human Relations 2 129-152
Deutsch M (1971) Toward and understanding of conflict International Journal of Group Tensions 1 42-54
Dewees P A (1989) The woodfuel crisis reconsidered Observations on the dynamics of abundance and scarcity World Development 17(8) 1159-1172
Dillman D A (1978) Mail and telephone surveys The Total Design Method New York John Wiley amp Sons
Eisgruber L M (1992) Sustainable Development Ethics and Endangered Species Act Unpublished manuscript Oregon State University Department of Agricultural and Resource Economics Corvallis
Fege A S McCarthy-Ryan C Munson L amp Schreyer R (1989) Managing visitor conflicts In D W Lime (Ed) Proceedings of the Conference on Managing Americas Enduring Wilderness Resource (pp 383-396) Minneapolis University of Minnesota Tourism Center Minnesota Extension Service and Minnesota Agriculture Experiment Station
124
Filley A (1975) A interpersonal conflict resolution Glenview IL Scott Foresman
Frederick K D amp Sedjo R A (1991) Overview Renewable resource trends In K D Frederick amp R A Sedjo (Eds) Americas renewable resources Historical trends and current challenges (pp 1-21) Washington DC Resources for the Future
Gagne M (1982 June) Development in learning psychology Implications for instructional design and effects of computer technology on instructional design and development Educational Technology 22(6) 11-15
Gentile J R (1989) Environmental cooperation Panacea or myth Society and Natural Resources 2 85-90
Gick M L (1986) Problem-solving strategies Educational Psychologist 21(1 amp 2) 99-120
Gick M L amp Holyoak K J (1979) Problem solving and creativity In A Glass K Holyoak amp J Santa (Ed) Cognition (pp 391-441) Reading MA Addison Wesley
Groen G J amp Patel V L (1991) A view from medicine In M U Smith (Ed) Toward a unified theory of problem solving Views from the content domains (pp 35-44) Hillsdale NJ Lawrence Erlabaum Associates
Gudykunst W B Ting-Toomey S amp Chua E (1988) Culture and interpersonal communication (Sage Series Interpersonal Communication 8) London Sage
Guilford J P (1954) Psychometric methods New York McGraw-Hill
Hardin G (1968) The tragedy of the commons Science 162 1243-1248
Hess K Jr (1992) Visions upon the land Man and nature on the western range Washington DC Island Press
Howe C W (1979) Natural resource economics Issues analysis and policy New York John Wiley amp Sons
Howell J L (1981) The identification description and analysis of competencies focused on conflict management in a human services organization An
125
exploratory study Unpublished doctoral thesis University of Massachusetts
Izaak Walton League of America (1982) Conservation policies of the Izaak Walton League of America (IWLA) Arlington VA Author
Jandt F E amp Hare M (1976) Instruction in conflict resolution Urbana IL ERIC Clearinghouse on Reading and Communication Skills
Jorgenson D O amp Papciak A S (1981) The effects of communication resource feedback and identifiability on behavior in a simulated commons Journal of Experimental Social Psychology 17 373-385
Kabanoff B (1987) Predictive validity of the MODE conflict instrument Journal of Applied Psychology 72 160-163
Kaufman R A (1972) Educational system planning Englewood Cliffs NJ Prentice-Hall
Kaufman R (1982) Identifying and solving problems A system approach (3rd ed) San Diego CA University Associates Publishers
Kaufman R (1987) A needs assessment primer Training and Development Journal 41(10) 78-83
Kaufman R (1988) Planning educational systems A result based approach Lancaster PA Technomic Publishing Company Inc
Kaufman R A amp English F W (1976) Needs assessment A guide to improve school district management Arlington VA American Association of School Administrators
Kilmann R H amp Thomas K W (1977) Developing a forced-choice measure of conflict-handling behavior The MODE instrument Educational and Psychological Measurement 37 309-325
Kleinbaum D G amp Kupper L L (1978) Applied regression analysis and other multivariate methods Massachusetts Duxbury Press
Knapp M L Putnam L L amp Davis L J (1988) Measuring interpersonal conflict in organizations Where do we go from here Management Communication Quarterly 1(3) 414-429
126
Kowalski T J (1988) The organization and the planning of adult education Albany State University of New York Press
Krueger W C (1992) Building consensus for rangeland uses Rangelands 14(1) 38-41
Lawrence P R amp Lorch F W (1967) Differentiation and integration in complex organizations Administrative Science Quarterly 12(1) 1-47
Leritz L (1987) No-fault negotiating Portland OR Pacific Press
Lewis T amp Bjorkquist D C (1992) Needs assessment--A critical reappraisal Performance Improvement Quarterly 5(4) 33-54
Libecap G D (1981) Locking up the range Federal land control and grazing Cambridge MA Bollinger Publishing Company
Likert R (1961) New patterns of management New York McGraw-Hill
Masberg B A (1992) Determination of the value to planners of incorporating ecotourist needs data in the interpretive planning process Unpublished doctoral thesis Oregon State University Corvallis
Mayer R (1990) Conflict management The courage to confront Columbus OH Batelle Memorial Institute
Mernitz S (1980) Mediation of environmental disputes New York Praeger
Miller A (1982) Environmental problem-solving Psychosocial factors Environmental Management 6(6) 535-541
Miller A (1985) Psychosocial origins of conflict over pest control strategies Agriculture Ecosystems and Environment 12 235-251
Moncur J E T amp Pollock R L (1988) Scarcity rents for water A valuation and pricing model Land Economics 64(1) 62-72
Monette M L (1977) The concept of educational need An analysis of selected literature Adult Education 27(2) 116-127
127
Monette M L (1979) Need assessment A critique of philosophical assumptions Adult Education 29(2) 83-95
Nadler D A Hackman R J amp Lawler E E III (1979) Managing organizational behavior Boston Little Brown
Nelson G (1989) The public lands An endangered species In D W Lime (Ed) Proceedings of the Conference on Managing Americas Enduring Wilderness Resource (pp 18-21) Minneapolis University of Minnesota Tourism Center Minnesota Extension Service and Minnesota Agriculture Experiment Station
Newell A amp Simon H A (1972) Human problem solving Englewood Cliffs NJ Prentice Hall
Obermiller F W (1990) Introduction to the Economics Session Society for Range Management 1990 Annual Meeting Reno Nevada In F W Obermiller amp D Reesman (Eds) Current issues in rangeland resource economics (pp ii-vi) Corvallis Oregon State University Extension Service
Okey J R (1990) Tools of analysis in instructional development Educational Technology 30(6) 28-33
Olson J M amp Ross M (1984) Perceived qualifications resource abundance and resentment about deprivation Journal of Experimental Social Psychology 20 425-444
Pendell S D (1990) Deviance and conflict in small group decision making An exploratory study Small Group Research 21(3) 393-403
Perez R S (1991) A view form trouble-shooting In M U Smith (Ed) Toward a unified theory of problem solving Views from the content domains (pp 115-153) Hillsdale NJ Lawrence Erlbaum Associates
Petak W J (1980) Environmental planning and management The need for an integrative perspective Environmental Management 4(4) 287-295
Platt J (1973) Social traps American Psychologist 28 641-651
Pondy L R (1967) Organizational conflict Concepts and models Administrative Science Quarterly 12 296-320
128
Putnam L L (1988) Communication and interpersonal conflict in organizations Management Communication Quarterly 1(3) 293-301
Putnam L L amp Jones T S (1982) The role of communication in bargaining Human Communication Research 8 262-280
Putnam L L amp Poole M S (1987) Conflict and negotiation In F M Jablin L L Putnam K H Roberts amp L W Porter (Eds) Handbook of organizational communication An interdisciplinary perspective (pp 549-599) New York Sage
Putnam L L amp Wilson C E (1982) Communicative strategies in organizational conflicts Reliability and validity of a measurement scale In M Burgoon (Ed) Communication yearbook 6 (pp 629-652) Beverly Hills CA Sage
Rahim M A (1992) Managing conflict in organizations (2nd ed) New York Praeger
Rahim M A amp Bonoma T V (1979) Managing organizational conflict A model for diagnosis and intervention Psychological Report 44 1323-1344
Remmers H H (1954) Introduction to opinion and attitude measurement New York Harper amp Brothers
Renwick P A (1977) Effects of sex differences on the perception and management of conflict An exploratory study Organizational Behavior and Human Performance 19 403-415
Rifkin J (1992) Beyond beef The rise and fall of the cattle culture Dutton NY Penguin Books
Rifkin J amp Rifkin C G (1992) Your complete environmental guide to making political choices in the 1990s Voting green New York Doubleday
Robison M H amp Miller J R (1989) Regional economics and wild land amenity use In D W Lime (Ed) Proceedings of Conference on Managing Americas Enduring Wilderness Resource (pp 589-596) Minneapolis University of Minnesota Tourism Center Minnesota Extension Service and Minnesota Agriculture Experiment Station
Rosenberg E (1992) Towards sustainable development A holistic conceptual approach Unpublished manuscript
129
Oregon State University Department of Agricultural and Resource Economics Corvallis
Rosenberg M J (1982 September) The ABCs of ISD Training and Development Journal 36(9) 44-50
Ross R G (1982) The development and evaluation of a self-report instrument to measure conflict management style Unpublished doctoral thesis Ohio University
Ross R G amp DeWine S (1988) Assessing the Ross- Dewine conflict management message style Management Communication Quarterly 1(3) 389-413
Rossett A (1987) Training needs assessment New Jersey Educational Technology Publications
Rossett A (1990) Overcoming obstacles to needs assessment Training 27(3) 36-41
Rutte C G Wilke H A M amp Messick D M (1987) Scarcity or abundance caused by people or the environment as determinants of behavior in the resource dilemma Journal of Experimental Social Psychology 23 208-216
Sampson R N (1981) Farm land and wasteland A time to choose overcoming the threat to Americas farm and food future Emmaus PA Rodale Press
Savonen C (1992) Summer in the city Oregons Agricultural Progress 39(12) pp 24-29
Seiler J A (1963) Diagnosing interdepartmental conflict Harvard Business Review 41 121-32
Shearman R (1990) The meaning and ethics of sustainability Environmental Management 14(1) 1-8
Shockely-Zalabak P (1988) Assessing the Hall conflict management survey Management Communication Quarterly 1(3) 302-320
Simon J L (1991) Global resource scarcity is a serious problem In M Polesetsky (Ed) Global resources Opposing viewpoints (pp 24-28) San Diego CA Greenhaven Press
Sinden J A amp Worrell A C (1979) Unpriced values Decisions without market prices New York John Wiley amp Sons
130
Smith M U (1991) A view from biology In M U Smith (Ed) Toward a unified theory of problem solving (pp 1-19) Hillsdale NJ Lawrence Elbaum Associates
Sork T J amp Caffarella R S (1989) Planning programs for adults In S B Merriam amp P M Cunningham (Eds) Handbook of adult and continuing education (pp 233-245) San Francisco Jossey-Bass
Spitzer D R (1981) Training technology Analyzing training needs Educational Technology 21(11) 36-37
Stankey G H amp Clark R N (undated) Social aspects of new perspectives in forestry A problem analysis Milford PA Grey Tower Press
Stern P C (1976) Effect of incentives and education on resource conservation decisions in a simulated commons dilemma Journal of Personality and Social Psychology 43(6) 1285-1292
Stern P C (1992) Psychological dimensions of global environmental change Annual Review Psychology 43 269-302
Sullivan T J (1984) Resolving development disputes through negotiations New York Plenum Press
Susskind L amp Weinstein A (1980) Towards a theory of environmental dispute resolution Environmental Affairs 9 311-357
Sweller J amp Levine M (1982) Effects of goal specificity on means-ends analysis and learning Journal of Experimental Psychology Learning Memory and Cognition 8(5) 463-474
Talarowski F S Jr (1982) Attitude toward and perceptions of water conservation in a southern California community Unpublished doctoral thesis University of California Santa Barbara
Temkin T amp Cummings H W (1986) The use of conflict management behaviors in voluntary organizations An exploratory study Journal of Voluntary Action Research 15(1) 5-18
Tesolowski D G Newton A F amp Cureton J H (1988) Needs assessment The twilight zone of management Performance and Instruction 27(1) 26-30
Thomas K (1976) Conflict and conflict management In M D Dunnette (Ed) Handbook of industrial and
131
organizational psychology (pp 889-935) Chicago Rand McNally
Thomas K W (1988) The conflict handling modes toward more precise theory Management Communication Quarterly 1(3) 430-436
Thomas K W amp Kilmann R H (1978) Comparison of four instruments measuring conflict behavior Psychological Reports 42 1139-1145
Thompson J D (1960) Organizational management of conflict Administrative Science Quarterly 4(4) 389-409
Ting-Toomey S (1984) Conflict communication styles in black and white subjective cultures Paper presented at the Annual Meeting of the International Communication Association San Francisco CA
US Department of Agriculture (1990) The Forest Service program for forest and rangeland resources A long-term strategic clan Washington DC US Superintendent of Documents
Walton R E amp Dutton J M (1969) The management of interdepartmental conflict A model and review Administrative Science Quarterly 14 73-84
Walton R E amp McKersie R B (1965) A behavioral theory of labor negotiations An analysis of a social interaction system New York McGraw-Hill
Ware J (1983) Some aspects of problem solving and conflict resolution in management groups In L A Schlesinger R G Eccles amp J J Gabarro (Eds) Managing behavior in organizations Text cases readings (PP 101-115) New York McGraw-Hill
Ware J P amp Barnes L B (1983) Managing interpersonal conflict In L A Schlesinger R G Eccles amp J J Gabarro (Eds) Managing behavior in organizations Text cases readings (pp 196-209) New York McGraw-Hill
Watkins G A (1974) Developing a water concern scale Journal of Environmental Education 5(4) 54-58
Weider-Hatfield D (1988) Assessing the Rahim organizational conflict inventory-II (ROCI-II) Management Communication Quarterly 1(3) 350-366
132
Williams F (1986) Reasoning with statistics How to read auantitative research (3rd ed) New York Holt Rinehart Winston
Wilson S R amp Waltman M S (1988) Assessing the Putnam-Wilson organizational communication conflict instrument (OCCI) Management Communication Quarterly 1(3) 367-388
Witteman H (1986) The interpersonal problem solving process Problem conceptualization communication and outcome Unpublished doctoral thesis University of Wisconsin Madison
Witteman H (1988) Interpersonal problem solving Problem conceptualization and communication use Communication Monographs 55 336-359
Witteman H (1991) Group member satisfaction A conflict-related account Small Group Research 22(1) 24-58
Womack D F (1988a) Assessing the Thomas-Kilmann conflict mode survey Management Communication Ouarterly 1(3) 321-349
Womack D F (1988b) A review of conflict instruments in organizational settings Management Communication Quarterly 1(3) 437-445
Wondolleck J M (1988) Public lands conflict and resolution Managing national forest disputes New York Plenum Press
Zemke R amp Kramlinger T (1989) Figuring thins out A trainers guide to needs and task analysis Reading MA Addison-Wesley
APPENDICES
133
APPENDIX A
COVER LETTERS
DEPARTMENT OF RANGELAND RESOURCES
OREGON STATE UNIVERSITY Scrand Agriculsstre Kali 252 - Corvallis Oregon 97331-22IE
Teicphoec 503737-334 Fax 503-737-0504
March 5 1993
TO OWIC Members
FROM William C Krueger
SUBJECT Study of OWIC
Enclosed is the survey to study the attitudes of each of us as members of the Oregon Watershed Improvement Coalition_ Mr Ikram Saeed will use the results of this study as a part of his PhD program in Education In addition he needs to survey a random selection of members of the member organ nations Would each of you send me the directory of your organization so Ilc-am can draw 30 random members to complete the same survey If you would like the directory returned he will do that If you cannot send the directory because of orgpnizational policy please let me know and we will try to arrange a process to secure a random sample from our member organizations_
This approach will allow ampram to determine how we within OWIC believe how we relate to conflict and how we are the same or different from a random sample of our peers Since the OWIC membership is small it is important for each of us to respond Please take a few minutes to fill out and return this questionnaire this week
Tne results should be interesting to all of us
Enclosure
Redacted for privacy
134
DEPARTMENT OF RANGELAND RESOURCES
OREGON STATE UNIVERSITY Scran griculturc 202 - Corvallis Oregor 97332218
Ttitphmte 503737-3341 Fax 5037370504
March 11 1993
We are studying the ways for promoting communication among the many potential watershed resource users We are therefore asking users and others interested in the use of watershed resources about their perceptions and positions on the uses of resources This information will help the Oregon Watershed Improvement Coalition (OWIC) to work with its member organizations to optimize the use of Oregons watershed resources
Please complete the enclosed questionnaire Completion of this questionnaire is voluntary you may respond to any all or none of the questions However you are among only a small number of users and those interested in watershed resource use to participate in this study Your answers are very important to OWICs understanding of what should be accomplished Any information you provide will be held in strictest confidence Those analyzing the information will not know who you are as individuals Furthermore analysis will only involve group information great care will be taken to assure that individual answers will not be attributable
Please return your questionnaire in the enclosed pre-addressed stamped envelope regardless of how much information you provide
We appreciate your participation in this study Please feel free to call Dr Warren Suzuki (737-6393) or me (737-1615) at Oregon State University if you have any questions or concerns
Sincerely
William C Krueger Department Head
Enclosure
Redacted for privacy
135
APPENDIX B
INSTRUMENT
Riparian Zones Project School of Education
Oregon State University Corvallis Oregon 97331
USES OF WATERSHED RESOURCES
Instructions
Instructions are provided for each section of this questionnaire If you wish to comment on any question or qualify your response please feel free to write in the margins or the last page or on a separate sheet of paper Aglossary is provided on page 10
Return this Questionnaire in the enclosed pre-stamped and pre-addressed envelope Also return the enclosed post card at the same time Thank you
1
136
1 There are many uses and users of riparian zones and associated upland watershed areas Some watershed resource uses include aesthetic and recreation aquifer recharge livestock forage fish habitat water storage and wildlife habitat How do you value each of these uses For each pair of resource uses please circle a single number for the response that best indicates the relative value of the two uses to you
2 = I strongly favor this use 1 = I favor this use 0= the two uses are eguallytwortaat to me
(I have crossed out line(s) that lam unsure of)
For example If you strongly value bird habitat watershed resource against timber harvesting use then indicate this view as follows
bird habitat Z 1 0 1 2 timber harvesting
On the other hand if you are unsure about the relative values between bird habitat and timber harvesting then record your view as follows
a Livestock forage 2 1 0 1 2 Wildlife habitat
b Wildlife habitat 2 1 0 1 2 Fish habitat
c Fish habitat 2 1 0 1 2 Livestock forage
d Livestock forage 2 1 0 1 2 Water storage
e Water storage 2 1 0 1 2 Fish habitat
f Fish habitat 2 1 0 1 2 Aesthetic amp recreation
g Aesthetic amp recreation 2 1 0 1 2 Livestock forage
h Livestock forage 2 1 0 1 2 Aquifer recharge
i Aquifer recharge 2 1 0 1 2 Wildlife habitat
j Wildlife habitat 2 1 0 1 2 Water storage
k Water storage 2 1 0 1 2 Aesthetic amp recreation
1 Aesthetic amp recreation 2 1 0 1 2 Wildlife habitat
m Aquifer recharge 2 1 0 1 2 Aesthetic amp recreation
n Fish habitat 2 1 0 1 2 Aquifer recharge
o Water storage 2 1 0 1 2 Aquifer recharge
7
137
2 There are two basic views on the availability of watershed resources in a riparian areaOne perspective holds that the products from watershed are abundant resources The opposing view is that the products from watershed are scarce resources Somestatements regarding watershed resources in riparian areas are as follows Pleasecircle a single number for the response that best describes your position regarding thestatements
2= I stron ejv favor this statement1= I favor this statement 0= Neither option is true for me
For example If you favor the statement that water availability is a scarce watershed resource rather than an abundant resource then your response describes
water is an abundant resource 2 1 0 2 water is a scarce resource Similarly if you view that neither water resource is a scarce nor is an abundant then your position(water is an abundant resource 2 1 1 2 water is a scarce resource
a Human beings can solve watershed resource supplyproblems through im-proved land managementpractices 2 1 0 2
Watershed resource supply islimited and is beyond human control and thus can only bemanaged through cutting down the level of use
b Watershed resources would be appropriately distributed if resource shareholders give first andforemost preference to their own uses
2 1 0 2
Watershed resources would be appropriately distributed ifeach resource shareholder recognizes the concerns ofother users
c The number of watershed resource uses and users can be limited if users fix a proportional resource quota
2 1 0
The number of watershed resource uses and users can be increased if users coordi-nate their demands
d The number of watershed resource uses can be maximized if users are willing to explore the potential of the localripariat zones
2 1 0 1 2
The number of watershed resource uses should be limited according to the current smuts of the local riparian zones
e An individuals responsi-bility is more important for resource management program and policy tormation
2 1 0 2
A collective responsibility is more important for resource management program andpolicy formation
f Watershed resources can Watershed resources can bebe sustained through long- sustained best if there is onlyterm planning of multiple 2 1 0 1 2 limited uses uses
138
3
3 Think of disagreements you have had with other riparian zone and associated upland watershed user groups regarding access to and use of watershed resources Then indicate below how frequently you act in each of the described ways Do not respond with a particular disagreement in mind Instead keep in mind your general response to disagreements with other watershed user groups For each item circle a single number that represents how you are most likely to act Or cross out the item(s) that is not applicable to you There are no right or wrong answers
ALWAYS VERY OFTEN OFTEN SOMETIMES SELDOM VERY SELDOM NEVER 1 2 3 4 5 6 7
1 I blend my ideas with other riparian zone watershed user groups to create new alternatives for resolving disagreement 1 2 3 4 5 6 7
2 I shy away from topics which are sources of disputes with other watershed resource user groups 1 2 3 4 5 6 7
3 I make my opinion known in a clicagreement with other watershed resource user groups 1 2 3 4 5 6 7
4 I suggest solutions which combine a variety of viewpoints 1 2 3 4 5 6 7
5 I steer clear of disagreeable situations of this sort 1 2 3 4 5 6 7
6 I give in a little on my ideas when other watershed resource user groups also give in 1 2 3 4 5 6 7
7 I avoid members of other watershed resource user groups when I suspect that they want to discuss a disagreement 1 2 3 4 5 6 7
8 I integrate point of views into new solutions to disputes about use of watershed resources 1 2 3 4 5 6 7
9 I will go 50-50 to reach a settlement with other users o f w a t e r s h e d resources 1 2 3 4 5 6 7
10 I raise my voice when Im trying to get other resource users to accept my position 1 2 3 4 5 6 7
11 I offer creative solutions in discussions about disagree-ments 1 2 3 4 5 6 7
12 I keep quiet about my views in order to avoid dis-agreements 1 2 3 4 5 6 7
139
4
ALWAYS VERY OFTEN OFTEN SOMETIMES SELDOM VERY SELDOM NEVER 1 2 3 4 5 6 7
13 I give in if other resource users will meet me halfway 1 2 3 4 5 6 7 14 I am flexible on the alternative uses of resources 1 2 3 4 5 6 7 15 I reduce this disagreement by making differences seem
insignificant 1 2 3 4 5 6 7 16 I meet other riparian systems users at a mid-point of our
differences 1 2 3 4 5 6 7
17 I assert my opinion forcefully 1 2 3 4 5 6 7
18 I dominate arguments until the other riparian user groupsunderstand my position 1 2 3 4 5 6 7
19 I suggest we work together to create solutions to dis-agreements 1 3 5 7 2 4 6
20 I try to use other resource users ideas to generate solutions 1 2 3 4 5 6 7
21 I offer trade-offs to reach solutions in disagreements between user groups 1 2 3 4 5 6 7
22 I argue insistently for my stance 1 2 3 4 5 6 7
23 I withdraw when other riparian systems users confront me about a controversial issue 1 2 3 4 5 6 7
24 I side-step disagreements of this sort when they 1 2 3 4 5 6 7 25 I try to smooth over disagreements of this sort by making
them appear unimportant 1 2 3 4 5 6 7 26 I insist my position be accepted during a disagreement
with other resource users 1 2 3 4 5 6 7
27 I make our differences seem less serious 1 2 3 4 5 6 7 28 I hold my tongue rather than argue with other riparian
resource users 1 2 3 4 5 6 7 N I ease conflict by claiming our differences are tthiaL 1 2 3 4 5 6 7 30 I stand firm in expressing my viewpoints during a
disagreement with other riparian resource users 1 2 3 4 5 6 7
5
140
4 When you are in conflict with other watershed resource users to what degree do you consider yourself to influence how these resources should be used (Circle one number)
1 MORE THAN OTHERS 2 SAME AS OTHERS 3 LESS THAN OTHERS 4 NOT APPLICABT F TO ME
5 The organizations listed below make up the Oregon Watershed Improvement Coalition (OWIC) To which of these organizations do you belong Circle number(s) all that apply
YES NO
a PNW Section-Society for Range Management 1 2 b Oregon Environment Council 1 2 c Oregon Forest Industries Council 1 2 d Oregon Cattlemens Association 1 2 e Oregon Chapter Sierra Club 1 2 f Oregon Small Woodlands Association 1 2 g Oregon Trout 1 2 h Oregon Rivers Council 1 2 i Oregon Izaak Walton League 1 2 j The Nature Conservancy 1 2 k Others (specify) 1 2
6 If you belong to more than one Organization please write the letter(s) of those with whichyou have the strongest affiliations
7 How actively are you involved with these organi7ations Please list the committees andoffices you now hold or have held
Officecommittee Organization
(continue on the back of this questionnaire if needed)
141
6
II
8 Have you been involved in facilitating communication among users of riparian areasother than through OWIC
1 YES 2N 0
9 To that extent has this effort or these efforts been productive (Circle one number)
1 HIGHLY PRODUCTIVE 2 SOMEWHAT PRODUCTIVE 3 MINIMALLY PRODUCTIVE 4 NOT PRODUCTIVE
10 How important to you are each of the following means for acquiring information on resource usemanagement of riparian areas ((ircle number (s))
NOT SOMEWHAT LWPORTANT VERY IMPORTANT IMPORTANT IMPORTANTI
a General membership meetings 1 2 3 4 b Special membership meetings 1 2 3 4 c Newslettersmagazinesbrochures
Scientific Journals or other print (cica the specific source) 1 2 3 4
d_ Committee meetings 1 2 3 4 e Newspapers and news magazines
(Times Newsweek Range magazine etc) 1 2 3 4
f Friends neighbors and relatives 1 2 3 4 g Displays at fairs and other public
meeting places 1 2 3 4 h Government agencies (eg USFS
and BLM etc) 1 2 3 4 i Extension Service 1 2 3 4 j Other (please identify) 1 2 3 4
7
142
11 Where the ripanan areas consist of both public and private lands which type(s) of land should be managed with similar watershed resources management philosophy (Circle one number)
SHOULD SHOULD NOT
a_ All public land and all private land 1 2 b All public land and some private land 1 2 C All public land and no private land 1 2 d Some public land and all private land 1 2 e Some public land and some private land 1 2 f Some public land and no private land 1 2 g No public land and all private land 1 2 h No public land and some private land 1 2 1 No public land and no private land 1 2
DEMOGRAPHICS OF THE RESPONDENTS 12 Your current occupation (Please indicate your Le II)
13 What is your gender (Circle one number)
1 MALE 2 FEMALE
Education
14 What is the highest grade you attended in schoolcollegeuniversity
15 How many years of schooling
Your anonymity as a respondent involved in this survey will be protected to ensure confidentiality
143
8
16 Do you think that riparian zones resource usesmanagement is a controversial issue among the potential users (Circle one number)
7-- I YES 2N0
17 What is the degree of conflict (Circle one number)
1 SEVERE 2 MODERATE 3 MINIMAL
18 Do you believe that conflict management can be successful for this issue (Circle one number)
1 YES 2N0
144
9
Your comments or concerns are welcomed Use this space or attach additionalsheet of papers for your suggestions You may also note your concern in themargins of prior pages
Glossary
Watershed represents the entire catchment area of a stream or a system of the streams thatshares water discharge flow and drainage either through common inlets or outlets or bothof these
Riparian areazone is the green area immediately adjacent to water such as streams springs rivers ponds and lakes
Associated upland is the extension of the watershed area surrounding the riparian areaTherefore its vegetative and landscape status plays an important role in the yield qualityof the products of the riparian zones including the watershed resources
Watershed storage represents underground water storage in the soil and in underground aquifer
Aquifer recharge is the maintenance of the underground water table
Aesthetic and recreation use of watershed resource represents the degree of pleasure orleisure through observing natural scenic places and performing outdoor activities by theusers
Fish and wildlife habitat is a place for both fish and wildlife where they can live growbreed rear and nurture at their own liberty
Management philosophy dais witha way of logical thinking before starting to followany technological development and implementation actions
10
145
APPENDIX C
FOLLOW-UP POSTCARDS
Please return this post card if you have completedand mailed the questionnaire I am a member of The Nature Conservancy
Y NA ITE IS (Please print) The information that you provided is greatlyappreciated Would you like to receive a summary of the results (Please check one)
YES NO
1993
In the last couple of weeks you may have received a questionnaire about USES OF WATERSHED RESOURCES by mail
If you have already completed and returned the questionnaire please accept our sincerest thanks
If you have not returned the questionnaire we encourage you to do so Your participation in this study will be extremely valuable for our understanding about improving the qualify of watershed resource uses in Oregon
If we have not heard from you we will mail another questionnaire to you very soon
Thanks Riparian Zones Researchers
146
APPENDIX D
TABLES
Table 16 Frequency data on power status in influencing others
Less than Sane as More than others others others
Group na
Environmental 7 1591 29 6591 8 1818
Business 9 2308 21 5384 9 2308
Professional 2 1176 9 5295 6 3529
OWIC 2 1053 12 6315 5 2632
Total 20 1681 71 5966 28 2353
aNumbers of participants responding to question
147
Table 17 ANOVA results for power status effect on resource usemanagement behavior
Source SS df MS
Between groups 71 2 36 86 42
Within groups 4004 97 41
Total 4075 99
Group na Meanb SD
Environmentalist 44 198 59
Business 39 200 69
Professional 17 176 66
Total 100 195 64
aNumbers of participants responding to question bResponses scored on 3-point scale (1 = more than others 2 = same as others 3 = less than others)
Table 18 ANOVA results on usefulness of the conflict communicationfacilitation process
Source SS df MS p
Between groups 95 2 47 93 41
Within groups 1895 37 51
Total 1990 39
a Group n Meanb SD
Environmentalist 14 193 62
Business 12 217 103
Professional 14 179 43
Total 40 195 71
aNumbers of participants responding to question 6Responses scored on 4-point scale (1 = highly productive 2 = somewhat productive 3 = minimally productive 4 = productive)
Table 19 Comparison of mean ratings of importance of sources of information
Source of Information Environmental Business Professional
Newslettersmagazinesbrochur 328 (1) 320 (1) 327 (1) esscientific journals or other print
Government agencies 259 (2) 256 (4) 306 (2)
Newspaper and news magazines 257 (3) 238 (7) 267 (3)
Extension Service 221 (5) 282 (2) 261 (4)
Special membership meetings 213 (7) 252 (5) 244 (5)
Friends neighbors and 242 (4) 236 (8) 182 (9) relatives
Committee meetings 200 (8) 262 (3) 233 (7)
Displays at fairs and other 216 (6) 229 (9) 194 (8) public meeting places
General membership meetings 192 (9) 240 (6) 235 (6)
Note Numbers within parenthesis represent the rank order by total group means
149
Table 20 ANOVA results on importance of committee meetings as a source of information
Source SS df MS
Between groups 1016 2 508 506 01
Within groups 12044 120 100
Total 13060 122
Group na Meanb SD
Environmentalist 61 20C 13
Business 47 262 101
Professional 15 233 98
Total 123 228 103
aNumbers of participants responding to question bResponses scored on 4-point scale (1 = not important 2 = somewhat important 3 = important 4 = very important) plt10
Table 21 ANOVA results on importance of friends neighbors and relatives as a source of information
Source SS df MS
Between groups 486 2 243 308 05
Within groups 10178 129 79
Total 10664 131
Group na Meandeg SD
Environmentalist 65 242 88
Business 50 236 87
Professional 17 182 95
Total 132 232 90
aNumbers of participants responding to question bResponses scored on 4-point scale (1 = not important 2 = somewhat important 3 = important 4 = very important) plt10
150
Table 22 ANOVA results on importance of displays at fairs and other public meeting places as a source of information
Source SS df MS
Between groups 162 2 81 98 38
Within groups 10391 126 82
Total 10553 128
aGroup n Meanb SD
Environmentalist 62 216 98
Business 51 229 90
Professional 16 194 57
Total 129 219 91
aNumbers of participants responding to question bResponses scored on 4-point scale (1 = not important 2 = somewhat important 3 = important 4 = very important)
Table 23 ANOVA results on importance of government agencies as a source of information
Source SS df MS
Between groups 363 2 182 228 11
Within groups 10572 133 79
Total 10935 135
Group na Meanb SD
Environmentalist 64 259 89
Business 54 256 95
Professional 18 306 73
Total 136 264 90
aNumbers of participants responding to question bResponses scored on 4-point scale (1 = not important 2 = somewhat important 3 = important 4 = very important)
151
Table 24 ANOVA results on importance of extension services as a source of information organizations
Source SS df MS F
Between groups 1099 2 550 537 01
Within groups 13201 129 102
Total 14300 131
Group na Meanb SD
Environmentalist (EG) 63 221 102
Business (BG) 51 282 103
Professional (PG) 18 261 92
Total 132 250 104
aNumbers of participants responding to question bResponses scored on 4-point scale (1 = not important 2 = somewhat important 3 = important 4 = very important) plt10
LSD test PG EGltBG
Table 25 ANOVA results on importance of published serials as a source of information
Source SS df MS p
Between groups 18 2 09 20 82
Within groups 5157 113 46
Total 5175 115
Group n8 Mean b SD
Environmentalist 60 328 74
Business 45 320 63
Professional 11 327 47
Total 116 325 67
aNumbers of participants responding to question Responses scored on 4-point scale (1 = not important 2 = somewhat important 3 = important 4 = very important)
152
Table 26 ANOVA results on importance of general membership meetings as source of information
Source SS df MS
Between groups 731 2 365 445 01
Within groups 10500 128 82
Total 11230 130
Group a Meanb SD
Environmentalist 62 192 95
Business 52 240 87
Professional 17 235 86
Total 131 217 93
aNumbers of participants responding to question bResponses scored on 4-point scale (1 = not important 2 = somewhat important 3 = important 4 = very important) plt10
Table 27 ANOVA results on importance of special membership meetings as source of information
Source SS df MS
Between groups 431 2 215 199 14
Within groups 13335 123 108
Total 13766 125
Group na Meanb SD
Environmentalist 60 213 13
Business 50 252 109
Professional 16 244 96
Total 126 232 105
aNumbers of participants responding to question bResponses scored on 4-point scale (1 = not important 2 = somewhat important 3 = important 4 = very important)
153
Table 28 Frequency data on predicted success of conflict management
Yes No
Group n n
Environmentalist 62 886 8 114
Business 44 800 11 200
Professional 16 842 3 158
Total 122 847 22 153
Note X2 = 175 df = 2 p = 42
Table 29 ANOVA results on perceived degree of conflict intensity
Source SS df MS
Between groups 08 2 04 21 82
Within groups 2670 146 18
Total 2678 148
Group na Meanb SD
Environmentalist 74 274 44
Business 55 278 42
Professional 20 280 41
Total 149 277 43
aNumbers of participants responding to question bResponses scored on 3-point scale (1 = minimal 2 = moderate 3 = severe)
Table 30 Summary results of regression analysis for both environmentalist and business organizations
Dependent variable Independent variable SE a Beta t P R Sq
Multiple or single use School years 77 06 02 31 285 01 10
Abundance or scarcity views Land management 77 -18 09 -23 -201 04 05
Abundance or scarcity views Land management 77 -22 09 -28 -251 01 13 Conflict management -49 20 -27 -248 02
Control style -
Solution orientation Conflict management 77 46 27 19 170 09 04
Solution orientation Conflict management 77 51 27 21 188 06 08 Power status -27 15 -20 -179 08
Nonconfrontation ^
Note All significant at plt10
Table 31 Summary results of regression analysis for environmentalist organizations
Dependent variable Independent variable n o SE B Beta R Sq
Multiple or single use orientation
Abundance or scarcity views
Control style
Solution orientation
Conflict management
Land management
40
40
-78
-71
33
28
-36
-38
-235
-254
02
02
13
15
Nonconfrontation
Note All significant at p10
Table 32 Summary results of regression analysis for business organizations
Dependent variable Independent variable n B SE B Beta R Sq
Multiple or single use orientation
Abundance or scarcity views - - -
Control style Conflict management 37 -76 38 -32 -202 05 10
Solution orientation Conflict management 37 92 36 40 258 01 16
Solution orientation Conflict management 37 99 34 43 288 01 25 Power status -40 20 -30 -201 05
Nonconfrontation Conflict intensity 37 52 30 28 174 91 08
Note All significant at plt10
156
Table 33 Alpha results on deletion of item for resource use orientation (n = 183)
Corrected Squared Alpha Items of item total multiple if item resource uses correlation correlation deleted
Livestock vs wildlife habitat 47 64 85
Wildlife habitat vs fish habitat 31 31 85
Fish habitat vs livestock 57 61 84
Livestock vs water storage 41 46 85
Water storage vs fish habitat 61 57 84
Fish habitat vs aesthetic amp 42 40 85 recreation
Aesthetic amp recreation vs 50 41 85 livestock
Livestock vs aquifer recharge 52 62 84
Aquifer recharge vs wildlife 47 47 85 habitat
Wild habitat vs water storage 54 59 84
Water storage vs aquifer recharge 43 46 85
Aquifer recharge vs wildlife 50 46 85 habitat
Aquifer recharge vs 50 47 84 aesthetic amp recreation
Fish habitat vs 57 50 84 aquifer recharge
Water storage vs aquifer 48 42 85 recharge
Table 34 Alpha results on deletion of item for resource supply philosophy (n = 183)
Corrected Squared Alpha Items of abundance- item total multiple if item
scarcity views correlation correlation deleted
44 37 76
c 50 35 75
d 56 45 73
e 33 31 79
65 57 71
Note Descriotion of items (a through f) are given in the Uses of Watershed Resources instrument (Appendix B)
157
Table 35 Alpha results on deletion of item for conflict management styles (n = 105)
Corrected Squared Alpha Items of conflict item total multiple if item management styles correlation correlation deleted
Nonconfrontation
5 55 56 76
7 46 51 77
12 68 69 75
14 -06 21 82
15 42 45 77
23 53 56 76
24 68 70 75
25 47 36 77
27 23 30 79
28 29 23 79
29 37 44 78
Solution orientation 1 70 56 90
4 71 57 90
8 67 56 90
11 64 58 90
19 75 66 90
20 68 56 90
6 59 42 90
9 61 59 90
13 62 61 90
16 70 64 90
21 59 46 90
Control 3 32 28 77
1r1 37 25 76
17 52 44 73
18 60 53 71
22 64 44 70
26 51 9 73
30 41 39 75
Note See Appendix B for text of the items
Table 36 Correlation coefficients for OWIC (n = 19)
Multiple or Abundance or Solution single use scarcity Nonconfronta- orientation Control
Dependent variable orientation philosophy tion CMS CMS CMS
Multiple or single use 100 orientation
Abundance or scarcity philosophy -16 100
Nonconfrontation CMS 35 -35 100
Solution orientation CMS 16 -23 05 100
Control CMS 22 06 -16 -46 100
CMS = conflict management style
Table 37 Correlation coefficients for the environment group (n = 60)
Multiple or Abundance or Solution single use scarcity Nonconfronta- orientation Control
Dependent variable orientation philosophy tion CMS CMS CMS
Multiple or single use 100 orientation
Abundance or scarcity philosophy -20 100
Nonconfrontation CMS 22 00 100
Solution orientation -17 -23 -02 100
Control CMS -13 30 -31 -21 100
CMS = conflict management style plt01 one-tailed
Table 38 Correlation coefficients for the business group (n = 51)
Dependent variable
Multiple or single use orientation
Abundance or scarcity philosophy
Nonconfrontation CMSa
Solution orientation CMS
Control CMS
CMS = conflict management style plt001 one-tailed
Multi or Abundance or Solution single use scarcity Nonconfronta orientation Control orientation _philosophy -tion CMS CMS CMS
100
-25 100
02 -05 100
07 -49 -00 100
17 -11 -12 -18 100
Table 39 Correlation coefficients for the professional group (n = 19)
Dependent variable
Multiple or single use orientation
Abundance or scarcity philosophy
Nonconfrontation CMSa
Solution orientation CMS
Control CMS
CMS = conflict management style plt001 one-tailed
Multi or Abundance or Solution single use scarcity Nonconfronta orientation Control orientation philosophy -tion CMS CMS CMS
100
-35 100
45 -26 100
-16 -23 30 100
02 25 19 -67 100
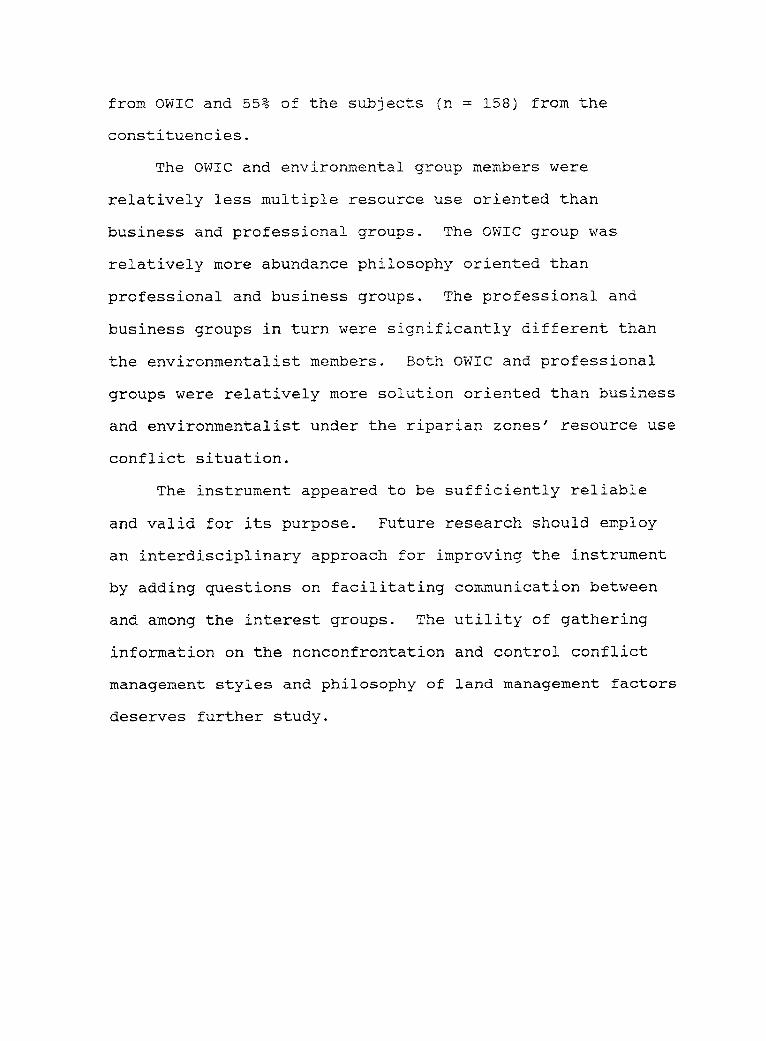
from OWIC and 55 of the subjects (n = 158) from the
constituencies
The OWIC and environmental group members were
relatively less multiple resource use oriented than
business and professional groups The OWIC group was
relatively more abundance philosophy oriented than
professional and business groups The professional and
business groups in turn were significantly different than
the environmentalist members Both OWIC and professional
groups were relatively more solution oriented than business
and environmentalist under the riparian zones resource use
conflict situation
The instrument appeared to be sufficiently reliable
and valid for its purpose Future research should employ
an interdisciplinary approach for improving the instrument
by adding questions on facilitating communication between
and among the interest groups The utility of gathering
information on the nonconfrontation and control conflict
management styles and philosophy of land management factors
deserves further study
Instructional Needs Assessment for Managing Conflict between Watershed Resource Users in Oregon
The OWIC Case Study
by
Ikram Saeed
A THESIS
submitted to
Oregon State University
in partial fulfillment of the requirements for the
degree of
Doctor of Philosophy
Completed November 11 1993
Commencement June 1994
APPROVED
Associate Professor of Educa ion in charge of major
he School of Education Director of he
Dean of Graduat chool
Date thesis is presented November 11 1993
Typed by researcher for Ikram Saeed
Redacted for Privacy
Redacted for Privacy
Redacted for Privacy
ACKNOWLEDGEMENTS
I am graciously thankful to almighty Allah who enabled
me to complete this project I appreciate the help of many
people and organizations who assisted in completing my
dissertation research I am forever thankful to my initial
Major Professor Dr Margaret Savige who guided me in the
design and development of the dissertation research and to
Dr William C Krueger a dissertation committee member
who guided my data collection and my understanding of
collaborative natural resource management issues I
express my sincerest thanks to the other committee members
Dr Wayne Haverson Dr Frederick W Obermiller and Dr
Arlene Holyoak for their encouragement and assistance
Because of Dr Saviges illness Dr Warren N Suzuki
graciously assumed the responsibility for guiding the final
completion of my research
I am thankful to all agencies and people who provided
financial and logistic support for my doctoral study
Pakistan Participant Training Program a joint government
cooperation between Pakistan and United States of America
My mentors Dr Agha Sajjad Haider and Dr Roger Kraynick
helped and encouraged me in my transition to the study of
instructional systems development My thanks extend to the
members of OWIC business environmental and professional
organizations who provided data to use for this study
Mawardi Hasan and Junaid Ikram for professional setting of
instrument and mailing arrangements and Chris Pyle for her
editing work
Finally to my parents Allah bless peace to the soul
of my father who died during my doctoral study my wife
Zahida Parveen my sons Junaid and Zubair and my
daughter Imama Haseeba who supported and prayed for my
success in my studies I am forever graceful
TABLE OF CONTENTS
CHAPTER
1 1 INTRODUCTION
Justification for the Study 2
Problem Statement
The OWIC Case An Example of Consensus
Conflict Management and Training
Background of the Study 3
Building 8
Intervention 10
Research Problem and Questions 13
2 REVIEW OF LITERATURE 15
Role and Limitations of Needs Analysis
Data Collection Techniques in Needs
Theoretical Framework of Conflict Management 38
Concepts and Theory of Needs Analysis 16
Concepts of Need and Needs Analysis 16
in Problem Solving 18
Needs Analysis and Training Development 22
Analysis 34
Credibility of Needs Analysis 35
Conflict Models 39
Theoretical Models of Conflict Management
Strategy d4
Theory of Conflict Management Styles 50
Constraints and Opportunities for Managing
Scarcity-Abundance Theory Assumptions 60
Natural Resource Use and Management 54
Issues of Multiple Use 54
Resources 59
3 METHODS AND PROCEDURES 66
Theoretical Framework
Population and Sample 68
Validity and Pilot Testing of
Data Collection
66
Instrument Development and Design 71
Survey Instruments for Measuring Behaviors 74
the Questionnaire 81
82
Data Analysis 83
4 RESULTS AND DISCUSSION 85
Results of Analyses of Needs Assessment Data 86
88 Resource Use Orientation
Resource Supply Philosophy 91
Conflict Management Style 94
Results of Analyses of Demographic Data 98
Gender 99
Years of Schooling 99
Power Status 101
Process Participation 101
Sources of Information 102
Riparian Resource UseManagement 103
Demographic Variables as Predictors 106
Credibility of the Instrument 109
5 SUMMARY AND CONCLUSIONS 115
118 Conclusions
122 REFERENCES
133 APPENDIX
APPENDIX A COVER LETTERS 133
APPENDIX D TABLES
APPENDIX B INSTRUMENT 135
APPENDIX C FOLLOW-UP POSTCARDS 145
146
LIST OF FIGURES
Figure Page
1 Conceptual model of needs assessment 25
2 Organizational elements model Three planning
domainslevels and scope of information 29
3 General model of instructional system design 33
4 Two-dimensional model of conflict management
styles 53
5 Watershed resource users needs assessment
(WRUNA) model 67
LIST OF TABLES
Table Page
1 Organizational elements with examples 30
2 Questionnaire return and use rate 70
3 Comparison of Cronbachs alpha coefficients
across scales 77
4 ANOVA results on resource use orientation 89
5 ANOVA results on resource supply philosophy 92
6 ANOVA results on solution orientation
management style 95
7 ANOVA results on nonconfrontation conflict
management style 95
8 ANOVA results on control conflict management style 96
9 Gender of respondents
10 ANOVA results for years of schooling
100
100
11 ANOVA results for power status
in influencing others 102
12 Frequency of response on involvement in
communication facilitation process 102
13 Descriptive summary of results on importance
of selected sources of information 104
14 Frequency data on type of riparian land
management 106
15 Internal reliability of the WRUNA-based
instrument 110
16 Frequency data on power status in influencing
others 146
17 ANOVA results for power status effect on resource
usemanagement behavior 147
18 ANOVA results on usefulness of the conflict
communicationfacilitation process 147
19 comparison of mean ratings of importance
of sources of information 148
20 ANOVA results on importance of committee
meetings as a source of information 149
21 ANOVA results on importance of friends neighbors
and relatives as a source of information 149
22 ANOVA results on importance of displays at fairs
and other public meeting places as a source
of information 150
23 ANOVA results on importance of government
agencies as a source of information 150
24 ANOVA results on importance of extension
services as a source of information organizations 151
25 ANOVA results on importance of published
serials as a source of information 151
26 ANOVA results on importance of general membership
meetings as source of information 152
27 ANOVA results on importance of special membership
meetings as source of information 152
28 Frequency data on predicted success of conflict
management 153
29 ANOVA results on perceived degree of conflict
intensity 153
30 Summary results of regression analysis for both
environmentalist and business organizations 154
31 Summary results of regression analysis for
environmentalist organizations 155
32 Summary results of regression analysis for
business organizations 155
33 Alpha results on deletion of item for resource use
orientation 156
34 Alpha results on deletion of item for resource supply
philosophy 156
35 Alpha results on deletion of item for conflict
management styles 157
36 Correlation coefficients for OWIC 158
37 Correlation coefficients for the environment group 158
38 Correlation coefficients for the business group 159
159
39 Correlation coefficients for the
professional group
Instructional Needs Assessment for Managing Conflict between Watershed Resource Users in Oregon
The OWIC Case Study
1 INTRODUCTION
The present study was an investigation into how needs
analysis could be used in developing training interventions
for resolving conflict among natural resource userinterest
groups The study focused on userinterest groups in
potential conflict over usemanagement of watershed
resources in Oregon riparian zones The purpose of the
study was to develop a needs analysis approach for use with
these groups Toward that goal a review of literature was
conducted to establish the theoretical framework for the
needs assessment and to investigate topics relevant to
natural resource management conflict behavior and
conflict management strategies
Based on the theoretical framework an instrument was
developed to assess selected behavioralattitudinal
characteristics of the target population These
characteristics were conflict management style resource
use orientation (single vs multiple) and philosophical
orientation regarding availability of resources (scarcity
vs abundance) The instrument was reviewed by an expert
panel revised and then administered to two groups one
the Oregon Watershed Improvement Coalition (OWIC) whose
members represented watershed resource usersinterest
groups and had demonstrated consensus building the other a
2
sample representing various business and environmental
usersinterest groups at potential risk of conflict over
watershed resource usemanagement issues as well as
interested professionals
The OWIC served as a case study on the premise that
there was evidence of consensus building and methods of
achieving and maintaining it within this group It was
assumed that the profile of the OWIC group would be the
ideal It was also assumed that the profile would
indicate certain predispositions suggested by the OWIC
literature and members namely conflict management style
tending toward consensus building multiple-use
orientation and abundance philosophy
Justification for the Study
Presently conflict management strategies are generic
in nature they do not identify the behaviors or attitudes
that should be addressed by a given group It was
hypothesized that conflict management requires real changes
in behavior and attitude and that these changes can best
be achieved by identification of the behavior and attitude
needing to be changed and based on that information
development of traininginstructional interventions
specific to the target group This study investigated the
needs assessment phase of the planning process
3
Why are training interventions needed Conflict among
natural resource userinterest groups exists because of
interpersonal conflict behavior and opposing attitudes
toward natural resource use and management Conflict
resolution between conflicting parties is a temporary
measure In other words conflict resolution strategies do
not work effectively to resolve or reduce conflict
permanently Sustainable conflict management is required
for reducing the level of conflict in the long run
Possibly this can be achieved by imparting consensus-
building skills through training interventions among
userinterest groups in potential conflict situation
Background of the Study
Problem Statement
Natural resource usersinterest groups have been
divided into two categories business and environmentalist
based on their vested interests (Susskind amp Weinstein
1980) Both of these usersinterest groups value the
natural resources differently in the perspective of
anthropocentric-nonanthropocentric ethics Anthropocentric
philosophy works on a basic principle that each human being
controls hisher own environment Daly (1991) explains
All nonhuman species and their habitats are valued only instrumentally according to their capacity to satisfy human wants Their intrinsic value (capacity
4
to enjoy their own lives) is assumed to be zero (p 259)
On the other hand a nonanthropocentric perspective is the
holistic view the human being is a part of the whole
universe which includes human and nonhuman species The
proponents of the nonanthropocentric view that all species
human and nonhuman have an intrinsic right to live
(Eisgruber 1992 E Rosenberg 1992 Shearman 1990) The
nonanthropocentric philosophy holds that it is not
desirable to carry out rational economic analysis because
it does not always seem to offer a framework from which to
address development issues (Shearman 1990 p 5)
The gap between natural resource users (business
organization members) and interest groups
(environmentalist) is increasing due mainly to the lack of
direct communication and social interaction between them
(Krueger 1992) They individually as well as
collectively are increasingly becoming involved in the
process of public policy making (US Department of
Agriculture [USDA] 1990) Natural resource interest
groups are increasingly lobbying for legislation case law
(court rulings) and administrative policies that suit
their own goals resource needs and priorities beliefs
perceptions and attitudes experiences power and position
and problem-solution and conflict-resolution styles
(Clawson 1987 Howell 1981 Knapp Putnam amp Davis 1988
Miller 1982 Petak 1980 Rahim 1992 Rifkin 1992
5
Temkin amp Cummings 1986 Ting-Toomey 1984 USDA 1990
Ware 1983) These groups are greatly empowered to
influence regional development and decision-making that
lead to enactment of environmental legislation (Sullivan
1984) For example the Oregon Watershed Improvement
Coalition (OWIC) was successful in getting cooperation of
different userinterest groups to lobby legislators for
passage of the bill to establish the Governors Watershed
Enhancement Board (Krueger 1992)
Conflict and Its Consequences
Conflicts occur among natural resource usersinterest
groups mainly because of differences in their modes of
resource uses and management For example in the context
of forestry management Stankey and Clark (undated)
explained that if the resource users are not handled
appropriately then the potential for inequities
frustration and dissatisfaction grows and the stage is
set for conflict (p 26)
In the discipline of organizational conflict Rahim
(1992) defined conflict as
a process of social interaction involving a struggle over claim to resources power and status belief and other preferences and desires The aims of the parties in conflict may extend from simply attempting to gain acceptance of a preference or securing a resource advantage to the extremes of injuring or elimination of opponents (p 1)
6
Conacher (1980) distinguished two kinds of resource
userinterest group conflict
ocational conflict conflict between two or more potential uses of the same land or resource and
group conflict conflict between those who wish to see the land used differently but who are not themselves direct potential users of that land or resource (p393)
Conflict may influence positively (eg competition
motivates to win the game) and negatively (eg
frustration causes loss in productivity or the wastage of
time and resources) depending upon the nature and situation
of the conflict (Ware amp Barnes 1983) Conflict can effect
different types of responses behavioral (eg hardening
of position and avoidance of face-to-face contacts)
substantive (eg roles and responsibilities) emotional
(eg perceptions and feelings) and personal and cultural
(eg racenational origin gender and ability
disability) (Ting-Toomey 1984 Ware amp Barnes 1983)
Divergent goals between userinterest groups tend to
originate and accelerate natural resource use and
management conflicts (Fege McCarthy-Ryan Munson amp
Schreyer 1989) Attitudes toward multiple use and
allocation of resources are major factors influencing the
goals of these groups
Historically the Multiple-Use Sustained-Yield Act of
1960 formalized the conflict between single-use and
multiple-use natural resource userinterest groups In the
multiple-use scenario every citizen assumes stewardship
7
rights for using and managing resources especially open
access or common property resources The federal
government has successfully launched many acts to allocate
use of and protect the resources (Frederick amp Sedjo 1991)
These formal arrangements have not resolved the problems
between the userinterest groups for a number of reasons
(eg lack of communication and misinterpretation of
resource use values) Conflict has intensified because
each interest group translates the Multiple-Use Sustained-
Yield Act to promote its own preferred uses and disregards
the other resource users needs (Clawson 1987 Libecap
1981 Nelson 1989 Stankey amp Clark undated USDA 1990)
The visions of single-use interest groups were
critically analyzed by Hess (1992)
Those visions have attended to what people and nature ought to be not to what they could be in an environment of freedom and diversityThey have weakened our faith in the ability of people to live responsibly and in harmony with the land of the western rangeThey have diminished the ecological potential of human diversity (p xvii)
Most prevailing policy law and business systems
regarding watershed resources in America and other parts of
the world are operating under scarcity assumptions for
allocating resources with little or no regard to abundance
assumptions for sharing resources According to scarcity
philosophy each potential resource user must look out for
hisher own share The major underlying assumption behind
this view is that there is not enough resources for
everybody so each user will compete with other users for a
8
share of the limited resources and will get less than he or
she wants (Howell 1981 Krueger 1992) Conflict is
inevitable because the system is built around win-lose
criteria rather than cooperation (Ware amp Barnes 1983)
The concept of abundance theory was explained by
Krueger (1992)
The assumptions of this theory are There is more than enough people are basically needy not greedy and understanding is the best strategy (p 38 authors emphasis)
If[resources] were managed [to promote sound ecological and economical foundations]they would develop to their potential (p 39)
Scarcity assumptions encourage conflicts whereas
abundance assumptions discourage or mitigate conflicts
Hence the abundance philosophy of sharing resources would
facilitate the process of conflict negotiationconsensus
building (see Krueger 1992 Leritz 1987)
The OWIC Case An Example of Consensus Building
Consensus building between interest groups is
essential for fair use and effective management of natural
resources An example of consensus building among special
interest groups that potentially have conflicting stakes is
the Oregon Watershed Improvement Coalition (OWIC) Formed
in 1986 the OWIC promotes effective use and management of
riparian resources in Oregon It was created with a
mandate to develop communication among various
9
userinterest groups who are potentially at risk of
conflict for meeting their alternative resource use and
management needs The potential watershed resources are
used for livestock forage fish and wildlife habitat water
storage aesthetic enjoyment and recreation and aquifer
recharge
According to OWIC guidelines each member has full
liberty to participate in the affairs of OWIC for enhancing
understanding between members as well as among others To
avoid power relations between members the OWIC has no
formal hierarchical structure The OWIC operating
strategies allow each member to share hisher concerns
regarding management of site-specific watershed issues
Thus all the decisions made by the OWIC members are based
on mutual consensus building (see Krueger 1992)
Presently OWIC has 20 members including a publicist
Most members represent different regional and state
organizations Six are environmental groups Oregon Izaak
Walton League Oregon Trout Oregon Environmental Council
Pacific Rivers Council Oregon Chapter Sierra Club and The
Nature Conservancy Three of the organizations fall into
the business group category Oregon Cattlemens
Association Oregon Forest Industries Council and Oregon
Small Woodlands Association A professional association
the Pacific Northwest Section of the Society for Range
Management is also represented Although the business and
environmental interest groups continue to have conflicting
10
viewpoints regrading the use of riparian areas consensus
is reached among them
Diffusion of information to OWIC members is a process
of consensus building Simultaneously the OWIC members
have striven to bring along the constituent organizations
which they represent smoothing out the heterogenous
effects and achieving consensus among them
Conflict Management and Training Intervention
Conflict management strategies are widely discussed in
the literature on communication business and industrial
organizations social psychology and environmental
protection science Contemporary theories on conflict
management suggest that conflicts can be successfully
mitigated or reconciled if the participating interest
groups
a Build trust between each other
b Understand each others concerns
c Incorporate conflict management styles values
d Provide opportunity for joint fact finding (or
search for common groundsneeds) and
e Encourage cooperation and collaboration
(Krueger 1992 Susskind amp Weinstein 1980 Ware
amp Barnes 1983 Wondolleck 1988)
Since the mid 1970s academicians and practitioners have
explored conflict management techniques as mentioned
11
above rather than traditional adversarial practices
inherent in conflict resolution models Ethical models of
conflict management are referred to by terms such as win-
win no-lose collaborative integrative and system
(Filley 1975 Howell 1981 Nadler Hackman amp Lawler
1979 Rahim 1992)
The credibility of abundance philosophy for resource
use and management has been empirically tested by social
scientists who accept abundance theory as a fundamental
policy reject conventional narrowly defined rational
economic analysis (cost-benefit) and psychological models
(Conacher 1980 Rutte Wilke amp Messick 1987)
An appropriate training process may efficiently and
effectively enable learners to acquire requisite skills
knowledge and attitudes In addition it is relevant and
worth doing despite the fact that it may involve more
resources and be more expensive to design than generic
training (Talarowski 1982 Spitzer 1981) An appropriate
and meaningful training intervention can only be prepared
if all the potential participating interest groups are
directly or indirectly involved in the process of designing
training materials (Rahim 1992) For example all the
potential conflicting interest groups should provide
personal information regarding their philosophy of natural
resource use and management then the target based training
interventions can be developed
12
Literature on training and program development
frequently referred to instructional systems design (ISD)
models The concept of the ISD has been popular in
instructional program planning since the 1960s An ISD
model is designed to develop specific meaningful and
effective curriculum by involving the participation of
potential learners facilitatorsteachers and the
community An instructional specialist conducts a number
of analyses including needs assessment the most critical
element in the training needs analysis phase of the ISD
model (Okey 1990 Rosenberg 1982) The needs assessment
is a means of determining gaps in performance or
productivity (Okey 1990 p 28) The needs assessment is
useful in determining appropriate problem-solving technique
(Kaufman amp English 1976 Lewis amp Bjorkquist 1992
Rosenberg 1982 Tesolowski Newton amp Cureton 1988)
Training professionals employ a number of means to
identify the need for training interventions The key
means are observation interview inventory performance
system review and survey questionnaire (Kaufman 1988
Rossett 1987) Each technique has its own merits and
demerits depending upon the goals and objectives of the
data collection and availability of time and financial
resources Little has been reported about identifying the
need for training interventions among groups in potential
conflict over natural resource use and management issues
13
Research Problem and Questions
The specific problem addressed by this study was
What is an effective method for identifying potential needs
for meaningful training interventions when the goal is to
manage conflict by achieving consensus building among
watershed resource usersinterest groups in Oregon
Following are the research questions which were
investigated in this study
1 Do the conflict management style and natural resource
use and management philosophy of the OWIC members
differ from the assumed ideal profile
2 What are the discrepancies if any between OWIC
members and the members of constituent organizations
in regard to
a Preferred conflict management style (ie
nonconfrontation solution-orientation or
control)
b Relationship between conflict management style
and power status gender and source of
information for each group
c Relationship between conflict management style
and resource use orientation (single vs
multiple) and resource availability philosophy
(scarcity vs abundance) under the given
demographic circumstances
14
3 How much variance in the conflict management styles
can be accounted for as main effect of individual
organization and group differences
4 How can profiles of conflict management style in
combination with other independent variables be used
to compare differences within and between the
userinterest groups (eg OWIC vs constituencies
and environmentalist vs business)
a What demographic variables may affect
preferred conflict management style
b What demographic variables may affect attitudes
toward natural resource use and management
15
2 REVIEW OF LITERATURE
Most natural resource mediation tasks have been
conducted haphazardly or temporarily by the relevant
discipline experts based on their vested interests or
judiciary services (Amy 1987 Bingham 1986) Review of
the literature revealed no research on the use of needs
analysis in developing training interventions when the goal
is conflict resolution
The present study was an investigation into how needs
analysis could be used in developing training interventions
for resolving conflict among natural resource userinterest
groups The study focused on userinterest groups in
potential conflict over usemanagement of watershed
resources in Oregon riparian zones The purpose of the
study was to develop a needs analysis approach appropriate
for use with these groups and to the training development
problem
This review is divided into three sections The
first section discusses literature on needs analysis
concepts and theory the second on conflict management
theory and concepts and the third on natural resource use
and management specifically that dealing with multiple use
issues and scarcityabundance assumptions theory
16
Concepts and Theory of Needs Analysis
Concepts of Need and Needs Analysis
Concepts of Need
The concept of need has been presented in a myriad of
ways (Kowalski 1988 Monette 1977 1979) In adult
education literature Monette (1977) identified four
categories of need basic human need felt and expressed
need normative need and comparative need
1 Basic human need refers to a deficient state of
any individual Needs of this kind are either
innate (eg security) or acquired (eg
occupational achievement) In general there is
no unanimous agreement on what constitutes the
basic human needs of any society
2 Felt or expressed need refers to an individuals
want or desire For example individuals desire
to be skilled professionals drive them to
complete the required courses to qualify for the
requisite professional degree
3 Normative need refers to the gap between a
desired standard and the standard that actually
exists (Monette 1977 p 118) Kaufman and
English (1976) referred to this gap as ends or
outcomes (eg learning for self or society
17
satisfaction) rather than means (eg study aids
or facilities) The individual or group whose
performance falls short of a desired standard is
termed to be in need Normative needs are prone
to change from time to time
4 Comparative need refers to the difference between
what one receives (or has access to) and another
does not For example if one person receives
services that another does not receive the
person not receiving the services is said to be
in need Comparative need is not considered to
be an appropriate measure of real need
Kaufman (1988) defined need as a verb speaks to
means need as a noun speaks to gaps in results (p 14)
A problem is not a problem unless there is a needgap and
motivation to meet the need Symptomatic needsprovide
clues to identify real needs in terms of gap [ie ends
rather than means] (Nanette 1977 p 124)
Concept of Needs Analysis
Needs analysis is considered to be a diverse tool for
determining learning skills knowledge and attitudes in
respect to competence (ability to perform the range of
skills) relevance (usefulness of those skills that are
situation specific) and motivation (ones predisposition
to improve skills) (Monette 1977 p 125) In the
literature the terms needs analysis needs assessment
18
discrepancy analysis gap analysis and means-ends analysis
are treated as synonymous however as this discussion will
show each may take on separate meaning depending on its
context For the purposes of this study needs analysis
and needs assessment mean the same
Different disciplines tend to use different terms to
describe essentially the same concept of needs analysis
For example the concept of needs assessment applications
in a business environment is called a training needs
assessment and in an educational setting an educational
or instructional needs assessment (Kaufman 1982 Masberg
1992 Rossett 1987 Zemke amp Kramlinger 1989)
Role and Limitations of Needs Analysis in Problem Solving
It is almost mandatory to use needs analysis to
investigate optimal performance current performance
feelings of learners and facilitator causes of the
problem and suggested alternative solutions to the
problem The literature review revealed that most training
professionals and instructional technologists agreed that
needs analysis is an appropriate tool for-determining
problem-specific instructional interventions Spitzer
(1981) stressed the justification for relevant needs
assessment
Inappropriate training materialscould have easily been avoided The most important thing is to
19
investigate the performance system in which the user of the training is going to have to apply the new learning (p 37)
Analysis of context and client system is the function
of needs assessment It includes the histories
traditions policies and philosophical orientations of the
individualsinstitutions In this perspective the
opportunities and constraints that influence the planning
process are revealed
The limitations of needs analysis particularly
discrepancy analysis and means analysis were noted in the
literature
Discrepancy Analysis
According to Lewis and Bjorkquist (1992) discrepancy
analysis is a strategy for diagnosing and solving problems
It borrows principles from problem-solving theory that is
grounded on model strategies followed by successful
managers Historically this approach has been applied by
business and industrial professionals to solve problems
However little research is available on how successful
experts have processed the information for meaningful
problem solving
According to Rossett (1987) and Mcnette (1977)
consequent upon the study of the various sources and the
significance of the gapdiscrepancy between where they
are and where they want to or should be the extent of
gap justifies whether training interventions are needed
20
The gap may not always be abridged by employing the
training needs analysis approach however because problem
performance may be due to factors other than educational
training needs such as administrative mismanagement
environmental change motivational incentives and changes
in reward system (Okey 1990 Rosenberg 1982)
Discrepancy analysis is defective in schematic
building a prerequisite for the development of problem-
solving expertise Its static nature conflicts with the
uncommon nature of needs analysis questions The large gap
between novice and expert professionals tend to jeopardize
the needs analysis process Also there are logistic
problems uncertainty and mistrust
Means-Ends Analysis
Means-ends analysis is popular in the cognitive
sciences (Kaufman 1987 1988 Lewis amp Bjorkquist 1992
Rossett 1987) In discussing the theory of needs analysis
in detail Lewis and Bjorkquist (1992) referred to both
means-ends analysis and discrepancy analysis The
remainder of this section draws heavily from the writings
of Lewis and Bjorkquist (1992) and Gick (1986)
Gick (1986) explained the logic of means-ends analysis
is in reducing the difference between the current state
and the goal of the problem by applying approximate problem
solving operators (p 100) Means-ends analysis is
applied recursively until the goal is reached (Gick amp
21
Holyoak 1979 Kaufman 1972) Newell and Simon (1972)
reported that means-ends analysis is the major method for
carrying out problem-solving strategy especially under the
conditions when the content domain is unknown
Sweller and Levine (1982) documented that it is
theoretically possible for a problem solver [using means-
ends analysis] to attain the goaland yet to learn
absolutely nothing concerning the problem structure (p
464) Although it is recognized that problem solving can
take place without learning (Gick 1986) the possibility
of learning is not excluded (Sweller amp Levine 1982)
Thus it may be possible to speed up the process of
learning by using recursive strategy (ie means-ends
analysis) rather than standard instruction (Gick 1986)
Factors Affecting Problem Solving
Internal and external factors significantly affect
problem-solving strategies External factors appeal to
the domain from which the problem is drawn and the form
in which the problem is presented (Lewis amp Bjorkquist
1992 p 46) Internal factors include general and
domain-specific problem-solving knowledge
Smith (1991) a biologist explained that forward
reasoning and domain-specific procedures are used to solve
a standard problem and weaker procedures namely means-
ends analysis and trial-and-error for a problem that is
outside the domain of expertise Groen and Patel (1991)
22
experts in the field of medicine agreed with Smith that
successful problem solving is directly associated with
forward reasoning They synthesized their problem solving
theory from a number of relevant sources
Experts readily comprehend new information and integrate it into an existing knowledge base This results in an enhanced ability to recall and to chunk information It also results in the ability to cope with routine situations rapidly and efficiently by the use of forward reasoning through a limited problem search space (p 39)
The product of backward or recursive reasoning is
assumed to be incomplete compared to forward reasoning
because of differences in expertise between novice and
expert professional levels Novice rules do not map onto
expert rules (Groen amp Patel 1991 p 40) More empirical
studies are needed on problem-solving strategies like
means-ends analysis for training development purposes
Needs Analysis and Training Development
Needs Analysis Models
Marlette (1977) described two broad classifications of
needs assessment models
I Individual appraisalproblem-need models The
clients determine their own learning needs either
collaboratively or non-collaboratively
Collaborative models include both one-to-one approaches (as between client and counselor) and group approaches The self-appraisal model is non- collaborative diagnosis although the solitary learner may choose to use scales and other instrumented
23
exercises or a group setting (as in value clarification) or performance analysis techniques to determine training needs (sometimes also used collaboratively) (Monette 1977 p 120)
This type of model is suitable for problem remedial rather
than improvement in educational programs
2 System discrepancygoal-identification models
Educational needs of the social system are determined
through discrepancy analysis (the difference between
existing and desired goal) This type of model works in
defining and redefining the situation rather than focusing
on remedial aspects (eg improvement in the educational
programs) This type of model works in defining and
redefining the situation rather than only focusing on
remedial aspects Freires double-loop learning model is
representative of this type of model
Models in both classifications may use internal or
external information sources or both for planning
educationaltraining programs Internal-source models
obtain the required information from sources within the
organization (Kaufman 1988) These models are used in
non-integrated program planning (Kowalski 1988) An
intervention is introduced into an organizational system
a change occurs in the organization but goals and
objectives of the organization do not change (Kaufman amp
English 1976 p 69)
External-source models compile information from
sources outside the organization These models are used
24
in integrated program planning (Kowalski 1988) When an
intervention is introduced into an organizational system a
change may be reflected in the objectives and goals of the
organization This type of planning may benefit
interrelated organizations in a number of ways
1 Improve the feedback mechanism between the users
2 Reduce the margin for planning error
3 Update informed decisions about the content and
context of the training material (Kaufman amp
English 1976 Kowalski 1988 Masberg 1992)
Kaufman (1988) suggested guidelines for choosing the
appropriate needs assessment model
The choice of [needs assessment] model and techniques should be madeon the basis of what a needs assessment has to deliver for functional planning to take place not simply on the case of doing one (p 87)
A conceptual model of needs assessment is presented in
Figure 1
The System Approach Concept
This section highlights the main features of needs
assessment and problem solving from the perspective of the
system concepts The system approach concept became
popular among human resource performance specialists in the
1960s and 1970s It was introduced under a variety of
names including educational engineering system approach
systems approach and systematic approach (Kaufman 1988)
25
ORGANIZATION ELEMENTS
Means Ends
Inputs Products
Processes Outputs
Outcomes
NEEDS ASSESSMENT
Planning Levels Planning Partners
Middle Learners
Comprehensive FacilitatorsPlanners
Holistic CommunityOther Users
Source Adapted from Kaufman (1988)
Figure 1 Conceptual model of needs assessment
The system approach concept has gone through a series
evolutionary processes but all system models are similar
in certain features
- results-orientation - clear measurable objectives - systematic procedures for reaching stated objectives - accounting for the dynamic relationship among the parts of the system
26
requirement for continuous evaluation and revision (Kaufman 1988 p 5)
System approaches vary Kaufman (1988) distinguished
old system models with the updated system model in these
words
Older modelsfocused primarily on organizational or learning objectives [The new] system (no third s) modelsencouraged defining goals and objectives external to the organization as the proper place for educational planning Only a [new] system approach formally considers the individual and collective good of and for peopleOlder approaches tend to make the current system more efficient in reaching current goals and objectives while this one also helps to identify new visions and identify new outcomes (p 6)
The new system approach is external humanistic or people-
oriented practical effective and efficient innovative
and relevant future-oriented and result-based (Kaufman
1988 Sork amp Caffarella 1989)
The system approach to educational planning deals with
problem identification (via needs assessment) and
resolution process (via problem solving) The needs
assessment phase involves identifying scoping selecting
and prioritizing needs The problem-solving phase is a
six-step process (a) identify problems (priority needs)
(b) determine alternative solutions for meeting needs (c)
select solution tactics from the available alternatives
(d) implement the selected solutions (e) evaluate
performance effectiveness and efficiency and (f) revise
as required at any step in the problem-solving process
(Kaufman 1988)
27
The system analysis tool is primarily used in
performing discrepancy analysis using internal and external
needs assessment educational planning (Kaufman 1987 1988
Rossett 1987) It guides how to get from what is
(present) to what should be (futuredesired) (Kaufman
1988)
A gap may be determined between present and desired
levels of the soft and hard sensing needs information
depending upon the identified elements of the required
needs Soft need sensing data include perceptions
attitudes and personal values Hard need sensing
information is the actual gaps between human and
organizational performance needs derived through
observation or recording (Kaufman 1987 1988) The
identified needs may be prioritized by rating ranking or
Knowles filter analogy criteria (Kaufman 1987 1988 Sork
amp Caffarella 1989)
A meaningful decision-making process would be
facilitated through arriving at predicted futures
alternative solution scenarios and agreement on common
interests The techniques used for prediction of future
needs are assumed to be creative and dynamic Future needs
could be identified by using methods such as trend
extrapolation Delphi technique scenario construction
cross-impact analysis and technology assessment (Kaufman
1987 1988 Sork amp Caffarella 1989) The system approach
helps one to understand the interrelation and interaction
28
among the pieces of the whole system when educational
interventions are needed to plan develop and evaluate a
regular changing process (Kowalski 1988)
The Organizational Elements Model
The Organizational Elements Model (OEM) was developed
by Kaufman to provide a framework for properly identifying
needs analyzing them defining useful objectives and then
selecting effective and efficient educational interventions
(Kaufman 1987 1988 Masberg 1992) By employing the
OEM we can learn from each other (Kaufman 1988 p 29)
The five elements of OEM are input processes products
outputs and outcomes (see in Figure 2 and Table 1)
This model deals with different levels or domains of
educational planning namely middle comprehensive and
strategicholistic Middle level planning deals with the
performance improvement of the employees or the learners
This level involves elements like inputs processes and
products (Kaufman 1987 1988) Comprehensive planning
level deals with the performance improvement of the total
organization whatever the organization uses does and
delivers to itself It includes input process product
and output elements for educational planning This level
performs the educational planning for an entire
institution for example a school university or academy
The strategicholistic level of represents a region rather
than only a single institution (Kaufman 1988)
29
Inputs Processes Products Outputs Outcomes
Internal External
Middle Level Planning
Comprehensive Level Planning
HolisticStrategic Level Planning
Source Adapted from Kaufman (1988)
Figure 2 Organizational elements model Three planning domainslevels and scope of information
30
Table 1 Organizational elements with examples
Organizational Examples Elements
Inputs Learner (raw material) -goals
-needs -law -politics -values perceptions amp attitudes -quality of life -resource endowments
Processes Management (how-to-do-it) -interaction status
Educational means -mediating
Products Individual interventions (material) (enroute-results)
Outputs Reduced conflict (products of the system delivered or deliverable to society)
Outcomes Policy consensus building (the effects of outputs in and for society and the community
Source Adapted from Kaufman (1988)
Kaufman (1987) suggested that there is a need to
consider all potential planning partners In an
educational setting educational planning partners
providing soft and hard needs sensing data would be the
1 Learners the affecters of the needs assessment
planning results
31
2 Teachersfacilitatorseducational planner the
implementors of the needs assessment results and
3 Communitysociety receivers of the needs
assessment results (Kaufman 1987 Masberg
1992)
Kaufman (1987) cautioned that each participant in
educational planning should work with the same definitions
and descriptions of the needs analysis For example
Kaufman (1987) defined needs analysis as a need identifies
and documents a gap in results [rather than gaps in
process ie inputs and processes referred to as quasi
needs] (p80)
The needs analysis model reveals not only the
perceptions of the participants but also keeps the
participants in touch with the world of work to which they
are supposed to sell their product during the process of
planning educational objectives (Kaufman amp English 1976)
These types of models can be systematic or non-systematic
Instructional System Design Models
Instructional system design (ISD) models are system
approaches for not only looking at the nature of the tasks
to be performed but also figuring out possible ways to
assess the skills knowledge and attitudes concerning
performance
Robert Gagne and his colleagues are considered to be
significant contemporary contributors to the development of
32
the ISD model concept (Rossett 1987) The theoretical
basis for ISD modeling can be traced to the works of Dewey
London Tyler and Knowle on adult learning theory and
curriculum development The major elements of educational
planning described by London in the 1960s concerned the
decision-making process (Monette 1977 Sork amp Caffarella
1989)
The original ISD model was developed during World War
II to address the technological as well as skill
knowledge and attitudinal requisites for performing
military tasks (Rosenberg 1982) After the war educators
began using ISD models to develop training interventions to
meet supervisors needs in the area of business and
industrial development (Kaufman 1988 Lewis amp Bjorkquist
1992 Rossett 1987) They were introduced to replace
generic training models to deal with needs associated with
problem performance new technology and regular training
programs The ISD models increased the likelihood of
meaningful training development that met the needs of both
organization and learners Large corporations such as ATampT
have adapted ISD models to meet their training development
needs ISD models have gone through a series of changes
and probably will continue to change to meet the fluid
needs of learners educatorsfacilitators and community
(Kaufman amp English 1976 Monette 1977 1979 Rossett
1987)
33
Rosenberg (1982) and Rossett (1987) described ISD
models as having five phases analysis design
development implementation and evaluation (Figure 3)
These five phases were discussed in detail in a systems
context by Kaufman and English (1976) Kaufman and English
had suggested an additional step a feed-back-loop This
was covered in the evaluation phase of Rossetts (1987)
vision of the ISD model called the ADDIE model
Analysis Design Development Implementation
Needs Assessment
Facilitator Learner Other users
EVALUATION
Source Adapted from Rosenberg (1982)
Figure 3 General model of instructional system design
The perspectives of Rossetts ADDIE model are
comparable to those of the Kaufman and Englishs system
planning approach The approaches are alike in their
phases and analysis For example in both approaches
instruction is planned and produced in the development
phase and the conduct and impact of the instruction is
assessed in the evaluation phase (Okey 1990)
34
Needs analysis is the most important component of the
ISD model for arriving at a rational management system for
any institutioncommunity Kaufman and English (1976)
addressed the strengths of needs assessment
[It] allows all partners to act upon decisions based upon logical and consensual bases and provides a referent for changing decisions once made and found wanting or requiring change due to additional information and experience (p 47)
Data Collection Techniques in Needs Analysis
Needs assessment information can be collected in a
number of ways survey questionnaires (mail face-to-face
and telephone) checklist interview observation self-
reported interpretive activities test performance
analysis self-assessment instruments job needs and task
analysis (Dillman 1978 Kowalski 1988 Masberg 1992
Rosenberg 1982 Rossett 1987 Sork amp Caffarella 1989)
Whatever the data analysis techniques used the purpose of
the needs assessment should be stated clearly and precisely
in the language and at the language level of the
respondents (Kaufman amp English 1976 p 2)
Survey instruments are suitable for examining the
feelings perceptions and actual occurrences (Masberg
1992 Rossett 1987) The survey instrument for conducting
the needs assessment should allow for respondents to talk
about means and not definitively about ends (Kaufman amp
English 1976 p 58)
35
Credibility of Needs Analysis
In general a paucity in the literature was observed
in the area of needs analysis and its philosophical
orientations Monette (1977 1979) apprised the
philosophical orientations of needs assessment drawing
support from Freire Knowles and Knox that needs analysis
is inevitable until and unless values ethics aesthetic
and politics are discussed along with the productivity
status of improved scientific technologies Monette (1979)
supported the concept that appropriate instructional
interventions could be developed through better
understanding of the problem situation He discussed the
issue raised by Tylers curriculum development theory
that training objectives ought to be based on studies of
contemporary life learners and subject-matter specialist
in question Monette (1979) addressed Freires
instructional models for valuing educational activities
and double-loop learning training modes The aim of this
discussion was to justify the philosophy of education
which is a necessary and inescapable responsibility of an
educatorplanner
Instructional designers have questioned under what
circumstances needs analysis should be performed (Kaufman amp
English 1976 Kowalski 1988 Monette 1977 Rossett
1987) Rossett (1987) expressed the problem this way
36
How to do it Where [to] start What do you say or write or observe In what order should the study occur When are you finished What do you do with what you have learned (p 3)
Kowalski (1988) mentioned other reasons for the needs
analysis approach not being commonly used in designing
traininginstructional interventions Firstly few
empirical studies are available in which this planning
approach has been used thus there is a big gap between
theory and practice (Sork amp Caffarella 1989) Secondly
many instructional planners believe that they are not
competent enough to employ the needs assessment tool
successfully Lastly cost-effectiveness and time
efficiency are concerns
In the literature Sork and Caffarella (1989) found
several reasons given for the gap between theory and
practice
1 Practitioners adopt short-cut methods
2 Contextual factors largely determine how
planning is done
3 Planning theory is irrelevant to practice
Enhancing the Credibility of Needs Analysis
It might be more useful to focus on testing and
pondering the adequacy of ones explanations rather than
focus only on the problem-solving approach (Lewis amp
Bjorkquist 1992 p 43) It is the opinion of many
professionals that problem-solving strategies are not
37
always useful for resolving each kind of problem That is
problem-solving strategies vary from one case to another
thus instructional values may be better guided through a
careful study of cases as if they were a vehicle for
building scheme (Lewis amp Bjorkquist 1992 p 47)
A training professional may learn a lesson from the
theory of successful problem solving for future uses
Perez (1991) translated successful problem solving
strategies into the domains of troubleshooting He said
that it is necessary first to define what skills
knowledge heuristic and cognitive processes transfer from
diagnosis and troubleshooting to other situations
(p 147) For example to understand and teach about
general problem-solving strategies one should know how
domain-dependent (local) knowledge and domain independent
(global) knowledge are to be combined with heuristic
executive control and self-regulatory processes (Perez
1991 p 148)
Many organizations have accepted the worthiness of the
needs assessment tool (Rossett 1990 Tesolowski et al
1988) Rossett (1990) suggested ways to enhance the
recognition of training needs assessment Rossett (1990)
suggested ways to enhance the validity and reliability of
training needs assessment One way would be to change the
focus of the training professionals from what to how
Another would be to replace the terms needs analysis and
needs assessment with other terms or phrases in the
38
vocabulary of specific training programs depending upon
the situation of the target organization For example
change the name from needs analysis to planning
Rossett concluded that when management does not
support needs analysis trainers need to assert themselves
He found that doctors engineers and architects would not
initiate projects or interventions until and unless a
careful study was done of client needs
Theoretical Framework of Conflict Management
Effective management of conflict among userinterest
groups is critical to successful natural resource
protection and use allocation No conscionable society can
afford to waste potential riparian zones watershed resource
endowments due to bickering between greedy and selfish
resource users
At the time of the present study only a few studies
were available that showed successful resolution in
environmental disputes (Conacher 1980 Mernitz 1980
Susskind amp Weinstein 1980 Wondolleck 1988) In the
following discussion most of the concepts and theory are
drawn from literature on organizational conflict
management The focus is on the communicative types of
conflict
Before proceeding further with this discussion there
is a need to distinguish between the concepts of conflict
39
management and conflict resolution Boulding (1968)
addressed this issue when he questioned whether
resolution was the right word Perhaps management would have been a better word for the distinction between constructive and destructive conflicts is not necessarily the same as the distinction between those which are resolved and those which are not Conflicts are sometimes resolved in ways which are highly undesirable for one party if not for both Sometimes there is a need for protracting conflict and for keeping it unresolved perhaps by diminishing its intensity and increasing its duration Thus the more neutral word management may better describe the objectives of our enterprise though we are interested in looking at conflict from the point of view of both parties (p 410)
Organizational conflict management theory does not provide
precise guidelines regarding maintenance levels of conflict
under general and specific situations (Rahim 1992)
However in contrast conflict resolution theory does not
provide for any level of conflict to be maintained
Conflict Models
Successful conflict management requires skills in
communication and an understanding of the concerns of all
parties involved (Mayer 1990 Nadler et al 1979 Putnam
amp Pool 1987 Witteman 1986) A prerequisite to managing
a conflict situation is a clear understanding of the nature
of the conflict and why it has arisen (Witteman 1986)
Conflict management models tend to be situational models
(Pondy 1967 Putnam 1988 Putnam amp Wilson 1982 Thomas
1976 Wilson amp Waltman 1988 Womack 1988b) The general
40
types of theoretical models of conflict management are
bargaining bureaucratic and systems (Pondy 1967 Putnam
amp Pool 1987 Seiler 1963 Thomas 1976 Thompson 1960)
Bargaining Model
This model deals with the potential conflict which
arises among the interest groups due to excess of the
aggregate demand over the supply of resources at hand
Competition for the scarce resources leads to frustration
(Bower 1965 Howe 1979 Pondy 1967 Seiler 1963) The
situation can be relieved either by increasing supply or
decreasing aggregate demand (Pondy 1967) In a
competitive market environment each party generally
attempts to gain a larger slice of the pie instead of
working together to contribute toward a larger pie
However Walton and McKersie (1965) referred to conflicts
of this type as having underlying potential for both
integrative (cooperative) and distributive (competitive)
subprocesses The government capital budgeting process
between legislative and executive interest groups is a
practical example of the bargaining model in action (Pondy
1967 Walton amp Dutton 1969)
41
Bureaucratic Model
This model taps the hierarchical relationships along
vertical dimensions that is authoritypower relations
(Pondy 1967 Seiler 1963) Typically senior members or
those in high-rank positions in an organization rule over
junior members or those in lower-rank position (Pondy
1967) However this relationship of control is distorted
when actors on either side do not behave accordingly
Distortion in authoritypower relations can lead to
disagreements among the superiors and the juniors peers
and subordinates (Pondy 1967 Putnam amp Pool 1987) The
conflict problem between seniors and juniors can be
remedied to some extent through encouraging the
participative role of the leaders (eg leaders from both
sides of the conflict) as well as creating group norms or
peer pressures (Likert 1961 Pendell 1990 Pondy 1967)
Systems Model
This model is used to analyze conflict at the lateral
or horizontal level of relationships The model also is
used to study the problems of coordination between
horizontal levels of hierarchical relationships (Pondy
1967 Walton amp Dutton 1969) For example in an
industrial or business setting this model can be used to
analyze the conflict situation between two (or more) units
such as production and marketing In the systems model
the units are interdependent in making performance progress
42
toward aggregate production (Nadler et al 1979 Pondy
1967) Examples of interdependent facilities are common
uses of services routine hierarchical tasks and
agreements between the activities of the units (Pondy
1967) The major source of conflict behavior would be
development of negative attitudes between the heads of the
coordinating units
Pondy (1967) suggested two main strategies for
reconciling conflict between coordinating units at the
horizontal level First reduce goal differentiation
through for example proper training and selection of (or
change in) incentive system or allocation of assignment
procedures Second mitigate the conflict by reducing the
interdependence between the units
In summary conflict has been discussed in the context
of each of the three organizational models bargaining
bureaucratic and systems These models have their own
limitations and opportunities A bureaucratic model deals
with authority relations and the need to control the
outcomes or processes This model can be functional as
well as dysfunctional depending upon the relational
behavior between seniors or superiors and juniors or
subordinates Ruling groups can ignore the rights of their
juniors and mentoring relations can encourage the juniors
through participative leadership management Thus these
roles can lead toward either creative (eg positive
learning experience) or threatening (eg fear and
43
mistrust on each other) situations depending upon the
authority or autonomy role plays between the juniors and
seniors Of the three conflict management models the
bureaucratic model is the one that received more attention
from researchers across diverse disciplines in part
perhaps because of its easy access to all disciplines
(Pondy 1967)
Systems models deal with functional relations and the
need to coordinate among the parties at the same
hierarchical level In this model each party has its own
job mandate but they can function through coordinating
their efforts all parties are interdependent As an
example a possibility of coordination between the heads of
two departments say production and marketing could lead
to efficient production time and delivery of products as
per targeted demands and on clienteles prescribed needs
Otherwise if both of the department heads do not
coordinate their functional assignment their production
targets would be jeopardized in terms of need and place of
the clients Thus this model could be effectively used
for reducing or resolving the conflicts among the parties
through following the number of strategies depending upon
the nature of the conflict Pondy (1967) suggested two
main strategies for reconciling the conflict First there
are numbers of ways to reduce goal differentiation between
the parties such as proper training and selection or
change of incentive system and allocation of assignment
44
procedures Second the conflict can be mitigated by
reducing the interdependence between the parties or
functional units
Bargaining models deal with interest groups in
relation to competition of resources Thus it could be a
mixture of both cooperative and competitive subprocesses
For example divergent interest groups may combine their
efforts for resolving their common interest problems but
also securing their self interests simultaneously The
interest groups strive to meet their targeted demands
through the flexible behavior Contrarily interest groups
distribute their efforts through strategic bargaining
process when they are under the influence of competitive
behavioral action
Theoretical Models of Conflict Management Strategy
The conflict resolution techniques employed depend
upon the nature of the conflict and the philosophies of the
mediators (Pondy 1967 Putnam 1988) For example the
tension model works to evolve safety-valve institutions
and the semantic model promotes open communication among
the conflicting interest groups (Pondy 1967 Putnam amp
Wilson 1982)
The justification for developing conflict management
strategies is based in part on recognition of the
functional and dysfunctional consequences of the conflicts
45
The contemporary conflict management theorists view
conflict as productive creative and useful rather than
destructive deteriorating and inappropriate (Deutsch
1949 1971 Rahim 1992 Thomas 1976 1988 Thompson
1960)
A conflict episode can be resolved differently
According to some researchers there are three types of
conflict-managing systems (a) process model (b)
structural model and (c) mixed model (Chanin amp Schneer
1984 Nadler et al 1979 Thomas 1976) The models are
used to manage conflicts through understanding the behavior
of the potential stakeholders who are involved in a
conflict situation (Daves amp Holland 1989 Rahim 1992
Thomas 1976) For simplicity sake the discussion of
conflict management models is focused on dyadic
relationships that is the potential conflict between two
parties
Process Model
The process model is a systematic approach for
studying the internal dynamics of a conflict situation
The process model is concerned with the identification of
the events For example when two interest groups are in a
conflict situation then each of the conflicting group
passes through the events of frustration
conceptualization behavior and outcome (Pondy 1967
Putnam amp Wilson 1982 Thomas 1976 Wilson amp Waltman
46
1988) The process model views the events as occurring in
a continuous process from one episode to the next and is
concerned with the effect of each upcoming event Hence
the evidences about the conflict occurrence are dynamic and
process-oriented (Thomas 1976)
The process model has been used to develop strategies
that can be used by a third party (eg consultant or
mediator) in resolving or reducing conflict among the
stakeholders (Nadler et al 1979) Walton amp Dutton
(1969) classified these techniquestools into three general
approaches deescalation confrontation and collaboration
under organizational conflict management settings
Deescalation technique One group may react to a
conflicting situation by cooperating with an opposing
interest group Sometimes this type of conflict
behavioral manifestation may encourage an increase in the
intensity of the conflict Thus care is needed in
identifying the stage of the conflict before intervening
with any type of conflict resolution technique (Nadler et
al 1979)
Confrontation technique When a conflict event has
exceeded the escalation limit that is becomes visible a
direct confrontation technique would be suitable for
handling conflict between the interest groups The
perspective of the confrontation technique is that dialogue
must take place between the groups about their emotions and
47
concerns to reduce the intensity of conflict (Nadler et
al 1979)
Collaboration technique This strategy is often
employed especially when the conflict has advanced beyond
the escalation and the confrontation stages of the conflict
(Filley 1975 Nadler et al 1979) This technique is
referred to as a win-win strategy because it works through
integrating the goals of the interest groups (Filley 1975
Nadler et al 1979) In this way both parties gain
through achieving common goals
In all three process model techniques consultant or
mediator involvement is recommended in order to ensure
direct and open communication between the stakeholders
Open and direct communication is needed if the groups are
to trust each other As a consequence of conflict
behavior there are possibilities of reduced communication
distortion of perception and mistrust (Nadler et al
1979)
Structural Model
This model attempts to understand conflict phenomena
by studying how underlying conditions shape events
(Thomas 1976 p 893) Underlying structural conditions
are behavioral predispositions social pressures
(constituent and ambient) incentives (stakes interest)
rules and procedures (decision negotiation and
mediation) and organizational norms (Rahim 1992)
48
In this approach the foremost objective is to
identify the parameters that influence conflict behavior
Those parameters are supposed to be relatively static and
slow changing (Thomas 1976)
The structural model is grounded on preconceived
understanding scarce supply of resources interdependence
stake of the interest groups and antecedent conditions of
differentiation The most important structural model
technique is to minimize the differences by identifying the
goals which are equally shared among the interest groups
When both interest groups realize the importance of common
goals they have an collaborative incentive (eg to
defend against a common enemy) Group differences may be
resolved through restructuring the group or rewarding the
individuals on the basis of total productive performance
(Nadler et al 1979)
Mixed Model
Under certain conditions process and structural
approaches can be used together for managing conflict
(Nadler et al 1979) Strategies include (a) developing
rules that will motivate the conflicting groups to move
toward problem solving (Nadler et al 1979) (b)
establishing a third-party organization or individuals
capable of playing the role of mediator between the
interest groups (Amy 1987 Lawrence amp Lorsch 1967 Nadler
et al 1979) (c) promoting inter-group liaison role for
49
open communication (Nadler et al 1979) and (d) creating
task forcesteams in order to sort out the boundaries
between groups that cause conflicts (Nadler et al 1979)
In summary Rahim (1992) and others considered really
only two basic approaches process and structural The
process approach deals with the sequence of event or
activities to arrive at some desired outcome The
organizational processes are communication decision-
making and leadership development necessary for social
systems to function (Beer amp Walton 1987 Rahim 1992
Rahim amp Bonoma 1979) The process approach was designed
to manage conflict through aligning the conflict management
styles among the participant groups depending upon the
nature and situation of the conflict (Conflict management
styles will be discussed later)
The structural approach addresses stable arrangement
of the tasks technologies and other factors so that the
members of an organization can work together effectively
Moreover the structural approach is designed to manage the
conflict by modifying the structural factors in an
organization as per the characteristics of the conflicting
groups The major structural factors include reward
system rules and regulations (Nadler et al 1979
Rahim 1992)
Rahim (1992) concluded that conflict management
interventions are mainly needed when the intensity of the
conflict is either too little or too much A moderate
50
level of conflict is considered to be desirable for
maintaining productive performance between the conflicting
groups Traditional conflict management approaches (ie
obliging dominating and avoiding styles) are only
suitable if the conflict is minor or frictional in nature
Contemporary approaches referred to as win-win
integrative cooperative or problem solution approaches
are more appropriate interventions for long-term conflict
management (Filley 1975 Howell 1981 Nadler et al
1979 Rahim 1992)
Application of the process approach is primarily
recommended when there is a need to alter the conflict
management styles in the perspective of amount and
perception of conflict The best suggested means under the
process approach are training and educational interventions
(Rahim 1992)
Theory of Conflict Management Styles
Bisno (1988) author of Managing Conflict pointed out
that mastery of technical skills is no substitute for a
commitment to pro social objectives (p 169) In other
words before implementing any conflict management
strategy there is a need to conceptualize the significance
of the conflict and conflict situation (Ross 1982
Witteman 1986)
51
Early researchers treated conflict as a problem that
causes destruction (Ross 1982 Thompson 1960 Wilson amp
Waltman 1988 Witteman 1988) and thought it should either
be eliminated or avoided (Putnam amp Wilson 1982 Ware amp
Barnes 1983 Witteman 1988) Contemporary theorists on
the other hand are of the opinion that conflicts should be
embraced and managed with productive perspectives in mind
(Nadler et al 1979 Putnam amp Pool 1987 Putnam amp Wilson
1982 Ware 1983 Ware amp Barnes 1983) Along these lines
Nadler et al (1979) commented that
contrary to popular belief conflict is not necessarily undesirable[It can] stimulate the search for new creative solutions result in improvements in production methods or lead to insights that might not have been made otherwise (p 221)
By reviewing the significance of conflict and conflict
management styles of individuals groups and
organizations training professionals are better able to
manage conflict in a variety of organizational conflict
situations (Putnam 1988 Putnam amp Pool 1987 Shockley-
Zalaback 1984) Many types of instruments have been
designed to measure the conflict management styles of
individuals groups and organizations (Raves amp Holland
1989 Howell 1981 Putnam 1988 Putnam amp Pool 1987
Ross 1982 Thomas 1976)
In general early theorists in the conflict management
area assumed that a single dimensional model a continuum
with cooperation at one pole and competition at the other
52
was appropriate for measuring conflict management style A
prime example of a single dimensional model is Prisoners
Dilemma a matrix game (Buckley Burns amp Meeker 1974
Deutsch 1949 Putnam 1988 Stern 1976 1992)
A two-dimensional model of conflict management styles
was introduced by Blake and Mouton (1964) in the 1960s
The grid-oriented two-dimensional model of conflict
management styles is based on the concept of concern for
people versus concern for others or assertiveness and
cooperative orientation (Blake amp Mouton 1985 Howell
1981 Kilmann amp Thomas 1977 Putnam 1983 Ross 1982
Thomas 1976 Witteman 1991)
Putnam and Wilson (1982) discussed five management
styles as follows
Forcingsignified the use of competitive behaviors to win ones position even if it meant ignoring the needs of the opponent Confronting also called problem solving collaborating and integrating consisted of facing a conflict directlyTo reach creative solutions participants had to exchange information and to integrate alternative points of view Smoothing also called accommodating [aimed to cover up the conflict] referred to behaviors that glossed over concealed or played down differences by emphasizing common interests Avoiding was physical [and psychological] withdrawal refusal to discuss the conflict or the tendency to sidestep the situation Compromising behaviors aimed atfinding a middle- ground alternative Compromiserswho looked for easy solutions by finding the midpoint between the opposing viewpoints (p 631)
Figure 4 illustrates the relative position of these five
conflict management styles on a two-dimensional model
(Blake amp Mouton 1964 Howell 1981 Putnam amp Pool 1987
Thomas 1976 1988)
53
Forcing Confrontation
o Compromising
Avoiding o Smoothing
Cooperativeness
Source Adapted from Thomas (1976) and Blake and Mouton (1964)
Figure 4 Two-dimensional model of conflict management styles
In summary the effectiveness of each of the five
conflict management styles is dependent upon the nature and
situation of the conflict For example direct
confrontation or problem solving might be effective when
used by a supervisor in dealing with a subordinate in order
to end the conflict but the reverse is not true (Lawrence
amp Lorsch 1976 Witteman 1991) In order to be effective
it is critical that the conflict management style be linked
54
with the type of relationship between the conflicting
parties in terms of subjective cultures goals and
ideology (Gudykunst Ting-Toomey amp Chua 1988 Putnam amp
Wilson 1982 Temkin amp Cummings 1986 Ting-Toomey 1984)
Natural Resource Use and Management
There are a number of factors involved in the natural
resource usemanagement controversy This study focused on
two factors multiple use vs single use and scarcity vs
abundance assumptions for managing natural resources
Issues of Multiple Use
Overgrazing on public lands or common properties
became a main focus in lobbying efforts by the Bureau of
Land Management (BLM) and the US Department of the
Interior to get non-ranchers (eg environmentalists and
conservationists) to support passage of the Multiple-Use
Sustained-Yield Act of 1960 (Clawson 1987 Nelson 1989)
Single use (eg livestock grazing or crop production) of
these lands had been common since the 1800s Until the
1980s public land use decisions continued to favor the
interests of ranchers and livestock industry holders
Efficiency and multiple use were not major concerns
Several forces helped the passage of the Multiple-
Use Sustained-Yield Act of 1960 After World War II
population pressure increased especially in the urban
55
areas That and the improvement in means of transportation
tempted resource users to think about alternative uses of
the land (Clawson 1987 Frederick amp Sedjo 1991 Libecap
1981) Increasingly non-ranchers vested interests have
influenced decisions regarding public land use because
every citizen of America has the right to look after the
stewardship of the land (Clay 1962 Nelson 1989)
The Multiple-Use Sustained-Yield Act of 1960 was
passed with special considerations Land management was
to be based on biological sustained yield principles not
economic criteria to achieve multiple-use goals (Libecap
1981 p 79) The theme of the Act was explained by the
ecologist Aldo Leopold (cited in Hess 1992) in these
words
A land ethic rested on the premise that the individual is a member of a community of interdependent parts--a social community that includes soils bodies of water plants and animals (p 244)
Multiple use of natural resources is supposed to meet
the long-term blended needs of all resource users (Clawson
1987 Frederick amp Sedjo 1991 Libecap 1981 Stankey amp
Clark undated US Department of Agriculture [USDA]
1990) The mix of multiple uses allowed on public lands
varies depending upon the situation of the land Examples
of resource use are soil water wilderness timber
minerals livestock grazing national parks urban parks
outdoor recreation (eg hiking backpacking and other
leisure activities) fish and wildlife forage cultural
56
resources and air (Rifkin amp Rifkin 1992 Wondolleck
1988)
The philosophy of multiple use of land resources has
the potential for creating different types of conflicts
between resource users producers and managers (USDA
1990)
1 Commodity-commodity conflict this type of
conflict involves competition between different
types of commodity production for example
forest products vs livestock forest products
vs commercial fisheries
2 Amenity-amenity conflict this type of conflict
occurs when amenity oriented uses are not able
to co-exist (USDA 1990 p 6-57)
3 Commodity-amenity conflict this kind of
conflict erupts between interest groups who have
quite different outlooks on the management and
use of the resources Potentially this type of
conflict is considered to be more contentious
(USDA 1990)
The Federal land management agencies philosophy of
natural resource management is based on
scientifictechnical principles that consider measurable or
priced values Crop and livestock production have
measurable values whereas environmental interests (eg
aesthetic enjoyment and recreation fish and wildlife
57
hunting) have unmeasurable or unpriced values (Libecap
1981 Sinden amp Worrell 1979)
Regional economists and planners view the concept of
multiple use in terms of interindustry spillover effects
Alternative land uses differentially impact the community
and its sectors in regard to jobs income and levels of
fiscal activity (Robinson amp Miller 1989)
Each interest group needs to develop principles for
the use and management of resources given the available
body of knowledge about multiple use Based on the
researchers background in agricultural and resource
economics the following are a synthesis of principles of
multiple use concept
1 A consideration of long-run and sustained yield
should be made to meet the present and future generation
needs of both human and nonhuman species on private and
public properties (Izzak Walton League of America 1982
Libecap 1981 USDA 1980)
2 Any individual or group who wants to use the land
for its own purposes must pay attention to the values and
cultures of neighboring people under competitive market
conditions (Izzak Walton League of America 1982) For
example a business group venting its concerns against an
environmentalist group stated We need to get those
natural resources under control or there wont be a Lake
County because tourism is not going to maintain the culture
58
and heritage and wont support this community (Dechaud
1992 p 25)
3 The transfer of public and private property
rights should not work against the fair balance of
sustained yield multiple uses of the resources (Izzak
Walton League of America 1962)
4 Fair and balanced treatment should be given to
the mix of available multiple uses of resources in order to
maintain and increase high ouality and quantity of the
resources between agriculture and non-agriculture sectors
(Savonen 1992 USDA 1990)
5 Multiple use plans of land should be prepared
collaboratively with multi-disciplinary team efforts as
well as with the active participation of the concerned
interest groups under the approved guidelines of
environmental impact studies (eg scientific management
of the residual effects from the use of agricultural
chemicals) (Frederick amp Sedjo 1991) potential of
resources and production capabilities and alternative
technological substitutions (eg timber and product
shortages be met through cheap substitutions) (Frederick amp
Sedjo 1991 Gentile 1989 Hess 1992 Izzak Walton League
of America 1982 Rifkin amp Rifkin 1992 USDA 1990)
Planning based on cooperation is time saving and effective
especially when dealing with the management of public land
issues (Obermiller 1990)
59
Constraints and Opportunities for Managing Resources
Resource dilemma issues concerning common property and
open access are difficult to manage These issues concern
resources that roam such as streams creeks rivers
groundwater and wildlife A stream wanders freely from
one property to another property Similarly wildlife
moves between properties (Fredrick amp Sedjo 1991)
In the absence of property rights they [waterwildlife] are unowned until captured for use In the absence of effective management institutions this situation often results in the problem of the tragedy of the commons in which a common resource is overused because it is available for the taking on a first-come first-serve basis without responsible managerial constraint (p 17)
In common property situations individuals do not have
much incentive to manage natural resources (Frederick amp
Sedjo 1991 Hardin 1968 Platt 1973) Americans have
successfully regulated common property relationships
through promulgation of the land management acts For
example attenuated private property rights are sanctioned
to individuals or groups that have improved effective
management conditions of the common resources (eg
National Audubon Society and Nature Conservancy) Other
commons management acts including the Wild and Scenic
Rivers Act of 1968 the Clean Water Act of 1972 the
Endangered Species Act of 1973 and the National Forest
Management Act of 1976 and the Federal Land policy and
Management Act of 1976 ensure preservation of diverse
multiple uses on federal lands (Frederick amp Sedjo 1991)
60
Riparian habitat The riparian habitat is a common
refuge for migratory birds and other wildlife (Cusick
1993 Rifkin amp Rifkin 1992) Historically riparian
rights were sanctioned to the land owners placing
management of the riparian systems in their hands
However with watershed population expansion a different
system was demanded Frederick and Sedjo (1991) presented
this explanation
In the East where water was plentiful the English system of riparian rights (which gives owners of land adjacent to a water body the right to use the water) was adopted In the West however the riparian system was soon deemed inadequate and a system of appropriative rights (which gives priority to the earliest users) evolved and was enacted into law (p 18
In the Western states the prior appropriations
doctrine has evolved through different stages in order to
protect water delivery systems and facilitate the process
of transfer of water rights Each of the Western states
has passed its own laws to implement the water delivery
system between uses and places (Frederick amp Sedjo 1991)
Scarcity-Abundance Theory Assumptions
The focus of the section is on the philosophy toward
natural resource use and management when scarcity-abundance
dimensions are influencing the resource users Scarcity-
abundance theory posits that resources should be
61
allocatedshared based on individual or group demandneeds
(cf Krueger 1992)
In the literature the concept of scarcity is
attributed to the Malthusian theory of population and
economic growth This theory presents that there is a
limited supply of resources and unlimited demand (Sampson
1981) On the basis of Malthusian principles many
economic theories and models were developed The
proponents of Malthusian theory believe in the scarcity
perspective and argue that resources should be allocated
among the resource users Brown (1991) has interpreted the
philosophy of scarcity from a tragedy perspective
The world has lost nearly one fifth of the topsoil from its cropland a fifth of its tropical rain forests and tens of thousands of its plant and animal species (p 17)
Scarcity-Abundance Assumptions and Consensus Building
Scarcity assumptions Krueger (1992) and Leritz
(1987) discussed three assumptions of scarcity under the
context of negotiation between the interest groups
There is not enough [There is not enough in this world that everybody could get what heshe wants for living The resources are always limited]we are afraid we will have to do without compromise give in give up
People are greedy Everyone is out to get everything they can for themselves to line their pockets at our expense We are afraid we cant trust others
The best approach is strategizing Since the world is scarce and people are basically greedy it logically follows that our best approach to getting what we need is to be more clever to out-strategize others to get
62
ours before they beat us to it (Leritz 1987 p 16)
Abundance assumptions Krueger (1992) and Leritz
(1987) presented the assumptions of abundance theory in
resolving conflicts successfully
There is more than enough [In this limited world you have always gotten enough for your living]the obvious proof is the fact that you are alive If you had not always gotten more than enough you would be dead today That does not mean that the world has been abundant for everyone Nor does it mean that you have always gotten everything you wanted when you wanted it from whom you wanted it
People are basically needy not greedy [It makes a big difference when you perceive]that others are greedy means that you begin from a premise of nontrust self-protection defensiveness and non-cooperation Since people have a tendency to mirror our reflection and match our behavior (I push against you you push back)On the other hand by assuming that people are basically needy we are more open to identify who the other person really is and what he or she needs to be able to cooperate with us We are more likely to realistically perceive the real person with whom we have to negotiate rather than act out of our own fears
Understanding is our best strategy [If] the objective of every negotiation is [willing] to cooperate with us-to do what we want them to doOur task then is to create the conditions that will motivate others to want to cooperate We can only do this however if we understand who the other person is and what they need People are willing to cooperate when they are getting what they need (Leritz 1987 pp 17-18)
The proponents of abundance philosophy especially
Julian Simon an economist have argued that resource
supply in the long run is constantly increasing rather
than decreasing (Sampson 1981) Simon (1991) is
optimistic about the future
63
[As] population increases so does productivity thus the best that could happen would be to add to the supply of people who would in turn add new inventions technology advances and knowledge (p 22)
Simon (1991) described the abundance theory scenario with
these words It is reasonable to forecastcontinued
decline in resource prices and increase in availability
(p 24)
In empirical studies the concept of scarcity-
abundance was mostly discussed in the context of economic
analysis Social scientists particularly social
psychologists brought up the issue of abundance theory in
the context of resolving the resource dilemmas or commons
dilemmas or the tragedy of the commons (cf Buckley et al
1974 Hardin 1968 Jorgenson amp Papciak 1981 Olson amp
Ross 1984 Platt 1973 Rutte et al 1987 Stern 1976)
All of the empirical studies followed experimental methods
to resolve the resource allocationshare problem between
the resource users by giving treatment to wealth as a
resource The following are salient findings related to
the present study
Buckley et al (1974) suggested that collective action
problems between the individuals or groups can be resolved
effectively by promoting communication working on the
binding agreement possibilities altering the structure of
payments and building trust and a social cooperative
ideology
64
Olson and Ross (1984) studied the relationship of
resource availability (abundance-scarcity) on the
resentment behavior (general feeling of satisfaction)
They found that the severity of resentment was decreased
when the resource was scarce They did not find any
significant impact of scarcity on resentment
Rutte et al (1987) found that people respond
differently to people-induced scarcity-abundance than to
nature-induced They concluded that subjects harvested
more from the resource in abundance than that in a scarcity
situation
Stern (1976) conducted a study on 48 subjects using a
four-person commons game simulating carpooling in response
to conserve gasoline Findings suggested that education
and incentive options worked well in the perspective of
resource conservation He concluded in the long-term
educational strategies have greater opportunity for getting
people to conserve resources even in situations where the
incentive options cannot be used
In a study on the effects of communication feedback
and identifiability on behavior Jorgenson and Papciak
(1981) found that groups who maintained better resource
feedback or communication achieved more total money as well
as the commons for maximum number of trials compared to
those who did not
Scarcity-abundance philosophy influences differently
when implied under physical economic and natural
65
conditions Scarcity-oriented analysis is more concerned
with the short term and gives less weight to technological
innovations Contrarily abundance-oriented analysis
relies heavily on potential exploitations and technological
developments in the long term (Dewees 1989 Moncur amp
Pollock 1988 Sampson 1981)
66
3 METHODS AND PROCEDURES
The present study was an investigation into how needs
analysis could be used in developing training interventions
for reducing conflict among natural resource userinterest
groups The goal of this study was accomplished by
developing a theoretical model for assessing the conflict
management style resource use orientation (single vs
multiple use) and resource availability philosophy
(scarcity vs abundance) of individuals within resource
userinterest groups and applying that model to a
particular situation (see Kaufman 1988 Kaufman amp English
1976 Lewis amp Bjorkquist 1992) There are a myriad ways
to conduct needs analysis in a given situation (Kaufman
1987 Kowalski 1988 Lewis amp Bjorkquist 1992 Tesolowski
et al 1988)
Theoretical Framework
This study developed the watershed resource users need
assessment framework (WRUNA) to explore factors that may be
pertinent to be consensus-building The theoretical
concept for the WRUNA model was discrepancy analysis
Kaufmans (1988 1987) OEM and Rossett (1987) guidelines
were adapted (refer to Chapter 2 for details) As
previously discussed a gap may be determined between
present and desired levels of soft and hard sensing needs
information depending upon the identified elements of the
67
required needs For the purpose of this study soft needs
sensing data were perceptions attitudes and personal
values regarding single versus multiple use of natural
resources scarcity and abundance assumptions and conflict
management styles
The WRUNA model is illustrated in Figure 5 The term
where they area refers to present level of performance in
managing conflict over watershed resource use issues
Where they should be refers to the desired level of
performance (consensus building) All of the elements
under watershed resource uses conflict management styles
and demographics were used to compute the gap between the
present system (what they are) and the proposed system
(what they should be)
Where They Are Where They Should Be
Conflict management styles Conflict management styles a Control a -b Nonconfrontation b c Solution orientation c Solution orientation
Watershed resource uses Watershed resource uses a Single-multiple a Multiple b Scarcity-abundance b Abundance
Factors Influencing Behavior and Attitudes
Demographic variables Demographic variables
Figure 5 Watershed resource users needs assessment (WRUNA) model
68
In this study the Oregon Watershed Improvement
Coalition (OWIC) represented what they should be The
OWIC constituent organizations represented what they are
The model assisted in assessing the gap in the performance
of the OWIC (desired situation) and the constituent
organizations (existing situation) in order to identify
needs for educationaltraining interventions
Population and Sample
The target population for this study was the
membership of the Oregon Watershed Improvement Coalitions
(OWIC) constituent organizations Associate members of
OWIC represent professional business and environmental
organizations namely Izaak Walton League The Nature
Conservancy Oregon Cattlemens Association Oregon Chapter
Sierra Club Oregon Environmental Council Oregon Forest
Industries Council Oregon Small Woodlands Association
Oregon Trout Pacific Northwest Section-Society for Range
Management and Pacific Rivers Council A publicist is
also included There is no formal hierarchal structure
within the OWIC although one member was chosen to chair
meetings Decision-making is by consensus According to
the OWIC charter
The goal of this Coalition is to ensure the long term sustainability of Oregons watersheds and to improve communication among the diverse interests that affect watershed management
69
Implicit in the goal is OWICs desire to develop a healthy productive environment within the potential of the environment with yield as a secondary output Yields of all values can be expected to increase if the resource is management with this in mind
OWIC members view themselves as facilitators not mediators Compromises and trade-offs are not goals in and of themselves The concept that is fostered is that of a healthy watershed with the resulting effect that everyone benefits OWIC through its unique membership can provide the impetus and support for seeking pathways to develop working programs for sound watershed management
Selection Procedure
The 20 members of OWIC were contacted and agreed to
participate in the study A letter was sent to the ten
OWIC constituent organizations by Dr William C Krueger
Department of Rangeland Resources informing them of the
study and requesting a directory from which a random sample
of members could be identified (Appendix A)
One organization did not supply the requisite
information on time and therefore was not included in the
study Another organization could only provide information
on 17 members due to an organizational policy For the
eight remaining organizations 30 members were randomly
selected to participate in the study To adjust for the
disproportionately larger numbers of environmentalist The
sample was stratified by selecting an additional 30 members
from business organizations This brought the sample size
to 287 The distribution by group was environmentalist
137 business 120 and professional 30
70
Responses
As Table 2 shows 19 of the 20 (95) OWIC members
returned their questionnaires Approximately 64 (183) of
the constituents returned questionnaires However about
9 (17) questionnaires could not be used in the study
Five respondents returned blank questionnaires with
remarks that either the questionnaire topic was not
pertinent to them or they did not have knowledge about the
riparian zones resource usemanagement issues The other
12 questionnaires not used were incomplete
Table 2 Questionnaire return and use rate
OWIC Constituencies
Action n n
Sent 20 287
Returned 19 95 183 64
Used 19 95 158 55
Group placement of respondents was based on items
providing self-reported affiliation with organizations
However these observations might not have been consistent
throughout the analyses due to variation in missing data
from one question to another
OWIC (n = 19) served as a case study The numbers of
respondents for each constituent group were 81
environmental 57 business and 20 professional The total
71
sample size of constituents was 158 subjects therefore
the response rate was a nominal 55
There was considerable variation in the missing data
or not applicable responses for Section 1 through Section
18 with a range from 3 to 49 observations The greatest
number of observations was for Section 3 and Section 11
Instrument Development and Design
The watershed resource user needs analysis instrument
(WRUNAI) was designed to study the factors sources and
processes pertinent to identifying training needs The
instrument was revised on the advice of an expert panel
then used in the field to collect attitudinal and
demographic information from members of OWICs constituent
organizations
Initial effort to design this instrument was made
after reviewing literature which addressed issues raised in
the mandate of the OWIC especially the philosophical
underpinnings for managing and using watershed resources in
Oregons riparian zones There were four important issues
relevant to training needs analysis of the target group
covered in the design of the instrument conflict
management styles (CMS) orientations regarding single
versus multiple use of natural resources scarcity and
abundance assumptions and demographic information
(Clawson 1987 Frederick amp Sedjo 1991 Krueger 1992
Libecap 1981 Pondy 1967 Putnam amp Wilson 1982 Temkin amp
72
Cummings 1986 Ting-Toomey 1984 USDA 1990 Witteman
1988) Professionals who had expertise in natural resource
management and uses were consulted to discuss the contents
of the researchable issues for inclusion in the survey
instrument
The Uses of Watershed Resources questionnaire was
developed from the final WRUNAI instrument The
questionnaire contained 18 sections (Appendix B) Each
questionnaire section was developed to include self-
explanatory instructions Section 1 of the instrument
contained 15 possible paired comparison of six watershed
resource uses namely aesthetic enjoyment and recreation
aquifer recharge livestock forage fish habitat water
storage and wildlife habitat The paired resource uses
were developed by following Thurstones paired comparison
methodology
n(n - 1)2
where n denotes the number of stimuli The six resource
uses resulted in 15 possible dyads (Guilford 1954 p 159
Remmers 1954 p 225) A relative measure was shown on a
scale from 0 to 2 where zero represent both uses being
equally valued 1 or 2 in a given direction
representing favored and strongly favored use
respectively If undecided the respondent was asked to
draw a line through the item An example was given This
section represented the multiple-use measure of the
alternative watershed resource uses
73
Section 2 was designed to measure respondents views
hold toward abundance or scarcity Six comparable dyad
statements were developed in this manner For three
statements the right-side statement represented the
scarcity view and the left side statement represented the
abundance view This order was reversed for the other
three statements A relative measure was shown on a scale
from 0 to 2 where zero representing neither statement
being favored and 1 or 2 in a given direction
represented that one statement was favored or strongly
favored An example was provided
Section 3 of the questionnaire consisted of 30 items
These items were adapted from the Organizational Conflict
Communication Instrument (OCCI) (Putnam amp Wilson 1982) for
the purpose of this study This section measured the
respondents preferred conflict management styles (CMS)--
control nonconfrontation and solution orientation The
items were measured on a 7-point summated-rating scale
The scale spread measured from always (1) to never (7)
A low score indicated frequent use of certain conflict
communication strategies and high scores indicated
frequent use of certain conflict interaction behaviors
(Ting-Toomy 1984) The OCCI is a multidimensional measure
of conflict management styles rather than a single
dimensional measure Each CMS statement represented a
position in a group environment (a) ones own position
within a decision-making group (b) the opposing parties
74
position with in a group (c) the perceived extent of the
conflict situation (ie the significance of the conflict
in ones life such as prestige matter versus best
alternative uses) (Temkin amp Cumming 1986) If a statement
was not applicable the respondent was asked to cross it
out
Section 4 consisted of one forced-choice item that
solicited the respondents perceived status of power in
regard to influencing other users in how resources should
be used (1 = more 2 = same 3 = less 4 = not applicable)
Section 5 through Section 18 contained items
concerning demographic information such as education
level gender nature of job and interest group
affiliations source of information title and position
private and public land management options and intensity
of conflict This information helped to assess additive
and interactive predictive effects of the key factors
leading toward resolution of conflict management between
the watershed resource interest groups
Survey Instruments for Measuring Behaviors
Conflict management theorists have designed a number
of instruments to measure respondents conflict behavior
The five most frequently used self-reporting instruments
are the Thomas and Kilmanns MODE Survey Halls Conflict
Management Survey (CMS) Putnam and Wilsons Organizational
75
Communication Conflict Instrument (OCCI) Ross and DeWines
Conflict Management Message Style (CMMS) and Rahims
Organizational Conflict Inventory-II (ROCI-II) (Womack
1988b) Each instrument has a particular focus for
measuring respondents conflict behavior The following
discussion is limited to position and disposition and
communication-related behavioral strategies and tactics in
the context of the scope of the present study
Of the five instruments previously mentioned the MODE
and CMMS measure respondents conflict behavior
irrespective of context (Kilmann amp Thomas 1977 Ross
1988 Womack 1988a 1988b) In other words both MODE and
CMMS deviate only slightly in respect to measuring
respondents behavior across situations The remaining
three instruments namely CMS OCCI and ROCI-II measure
respondents behavior differently for each situation and
for each target Halls CMS instrument is situation-
biased Rahims ROCI-II instrument measures conflict
behavior influenced by the target that is the conflict
behavior between superiors and juniors peers and
subordinates Putnam and Wilsons OCCI instrument measures
the behaviors of the respondents that is influenced by both
target and situations (Thomas amp Kilmann 1978 Putnam amp
Wilson 1982 Shockley-Zalabak 1988 Weider-Hatfield
1988 Wilson amp Waltman 1988 Womack 1988b)
All five conflict behavior measuring instruments
consider communication behavioral aspects to different
76
degrees The OCCI and CMMS instruments are objectively
designed to measure communicative conflict type of behavior
(Putnam amp Wilson 1982 Wilson amp Waltman 1988 Womack
1988b) As Jandt and Hare (1976) noted for parties to be
in conflict they must also be in communication (p 3)
The major difference between the OCCI and the CMMS is
in presentation Items in the OCCI represent summaries of
message behavior for example I assert my opinion
forcefully (Putnam amp Wilson 1982 Wilson amp Waltman 1988
Womack 1988b) On the other hand the CMMS instrument
presents messages for the respondents selection for
example If you are not going to cooperate I will just go
to someone who will (Womack 1988b p 438)
Putnam and Jones (1982) suggested that the instruments
differ in their presentation of tactical perspectives
(ie game plans) and strategies For example the OCCI
and to a lesser extent the MODE embody both tactics and
strategies as well as general intention characteristics
The ROCI-II and the CMS instruments are worded to elicit
ones behavior as indicated by general intentions or
strategies (Womack 1988b p 438)
The tactical and strategic approaches have their own
strengths Because the OCCI and the MODE include tactical
and strategic approaches they identify the nature of
specific conflict behaviors among respondents Further
the tactical and strategic approaches are compatible with
77
each other and tend to merge into one approach
particularly in the case of the OCCI
Psychometric Properties of the Instruments
The reliability and validity estimates provided
relative evaluations of the best and more frequently used
instruments A comparison of the reliability alpha
coefficients for the five conflict-behavior measuring
instruments from earlier studies are presented in Table 3
Cronbachs alpha statistic was used for estimating internal
consistency reliability The reliability coefficients were
highest for the OCCI
Table 3 Comparison of Cronbachs alpha coefficients across scales
Thomas- Putnam- Ross-Instruments Killmann Hall Rahim Wilson Dewine
(OCCI)
Confrontation 65 73 77 85 78
Compromise 58 45 72 92
Forcing 71 61 72 85 76
Smoothing 43 55 72 94 73
Withdrawal 62 39 75 88 _ Overall means 60 55 74 89 76
N= 76 N= 76 N= 1219 N= 360 N= 123
Source Adapted from Womack (1988b) pp 440
According to Womack (1988b) in general conflict
management researchers have observed lower reliability
coefficients in their own studies than those reported by
the instrument developers They also found that only the
OCCI meets Nunnallys criteria for alpha coefficients
78
Nunnallys average standard alpha coefficients are 80 for
basic research and 90 for applied research (Womack
1988b)
The CMS and the MODE have been shown to have the
weakest content validity of the five instruments (Thomas amp
Kilmann 1978 Womack 1988b) Conflict management
researchers including those in the communication area
confirmed that three conflict management styles were
associated with the interrelationship of the message items
Sets of conflict management styles were termed differently
CMMS focus on self focus on issue and focus on
other (Ross 1982 Ross amp Dewine 1988)
OCCI non-confrontation solution-orientation and
control (Putnam amp Wilson 1982)
ROCI-II dominating integrating and avoiding
(Weider-Hatfield 1988)
Only Rahim (1992) confirmed the significance of the five
conflict management styles reported by Blake and Mouton
integrating obliging dominating avoiding and
compromising
The literature reported that construct validity is
weak for all available conflict management instruments In
general there is a problem in comparing the results of one
instrument with those of another due to variation in the
theoretical conceptualization for each instruments This
is a common problem for all self-report instruments
Predictive validity is unknown for all the instruments
79
(Canary Cunningham amp Cody 1988 Kabanoff 1987 Daves amp
Holland 1989 Womack 1988a 1988b)
The OCCI Instrument
Putnam and Wilson (1982) designed the OCCI instrument
in response to conceptual and methodological weaknesses of
previous conflict behavior measuring instruments The
instrument is specially designed to accommodate verbal and
non-verbal communications which are essential components
of any conflict behavior (Putnam 1988 Ross 1982 Wilson
amp Waltman 1988) In the past conflict theorists paid
less attention to communication than to role (eg
interdepartmental supervisor-subordinate) in conflicts
(Lawrence amp Lorsch 1967 Putnam amp Wilson 1982)
Putnam and Wilson (1982) pointed out methodological
weaknesses in the grid-oriented approach They are
1 Each individual has unique characteristics such
as subjective cultural differences that influence conflict
management style either positively or negatively (Rahim amp
Bonoma 1979 Ting-Toomey 1984)
2 There are disagreements in defining and
conceptualizing the conflict episodes that lead to
incompatible goals between individualsgroups (Witteman
1986 1988)
3 A failure to agree upon the specific source or
target of conflicts may be misguiding to the professional
for designing target-based conflict resolution
80
4 Each instrument measures conflict management
style according to some specific intention rather than
multiple objectives Examples of specific purpose design
elements are a one-item scale (Renwick 1977) a set of
aphorisms (Lawrence amp Lorsch 1967) Blake and Moutons
managerial grid (Howell 1981) and a forced-choice
questionnaire (Kilmann amp Thomas 1977)
Compared to other existing instruments the OCCI
instrument is a relatively better predictor and has higher
reliability and content validity (Putnam amp Wilson 1982
Witteman 1991) As already discussed the OCCI isolates
three conflict management styles solution-orientation
control and nonconfrontation (Putnam amp Wilson 1982
Womack 1988b) Compared to the original five conflict
management styles solution-orientation represents a
combination of confrontation and compromise conflict
management styles control style resembles forcing in
establishing direct communication between the groups for
resolving disagreements and nonconfrontation combines
avoiding and smoothing (Witteman 1991)
According to Nadler et al (1979) Filley identified
three approaches to resolve conflicts (a) win-lose (b)
lose-lose and (c) win-win With the OCCI instrument
Filleys conflict resolution approaches can be estimated
The approaches are comparable with the OCCI conflict
management styles (Filley 1975 Nadler Hackman amp Lawler
1979 Putnam amp Wilson 1982)
81
Approach (Piney) Management Style COCCI)
win-lose controlling lose-lose nonconfrontation win-win solution orientation A number of studies applied the OCCI instrument in
studying the relationship of subjective culture gender
and vertical and horizontal hierarchical positions in
voluntary and non-voluntary organizations with three
conflict management styles depending upon the nature and
situation of the conflicts (Putnam and Wilson 1982 Temkin
amp Cummings 1986 Ting-Toomey 1984 Wilson amp Waltman
1988) These studies concluded that diagnosis of conflict
management styles is not only sufficient to suggest the
conflict strategies until the conflict case associated
factors be included Thus the choice of conflict strategy
should be a joint function along with other supporting
factors (eg culture philosophy of natural resource
management) depending upon a given situation (Wilson amp
Waltman 1988)
Compared to the CMS and MODE the OCCI is difficult to
administer and interpret It is not recommended for use in
studying the impact of training programs due to
uncertainty regarding test-retest reliability (Putnam amp
Wilson 1982 Wilson amp Waltman 1988)
Validity and Pilot Testing of the Questionnaire
The questionnaire was validated by an expert panel
whose eight members understood watershed resource issues in
82
riparian zones The experts communicated their comments
independently on the consistency accuracy and clarity of
the questions concerning watershed resources These
comments were used to adjust the draft instrument
The revised WRUNAI was sent to the 20 OWIC members
Their feedback resulted in only minor editorial changes to
the questionnaire However their response on revising the
instrument was treated as a proposed (where they want to or
should be) component of the WRUNA model
Data Collection
The Uses of Watershed Resources questionnaire was
distributed to the 20 OWIC members and 287 associate
members randomly selected from the nine participating
constituent organizations to the individual members
Follow-up mailing was done by the researcher employing
mail survey techniques proposed by Dillman (1978) The
data collection was completed in 20 weeks (March to August
1993)
In the first phase survey packets were assembled and
mailed to the 20 OWIC members Each included a
questionnaire along with a cover letter representing the
Oregon State Universitys faculty a stamped self-addressed
envelope and a stamped return postcard to 20 OWIC members
(Appendix C) In addition to completing the
questionnaire the ten members representing OWIC
constituent organizations were asked to provide (a) their
83
respective organizations membership directory or list of
30 randomly selected associate members and (b) a cover
letter written on their organizations letterhead to be
included in the survey packets sent to select members of
the respective constituent organization
Dillmans (1978) total design method (TDM) guidelines
for mail survey were used in part to facilitate a high
return rate A postcard was mailed to all subjects two
weeks after mailing the first survey packet to remind those
who had not yet responded or to thank those who had
already responded (Appendix C) The subjects who did not
respond to the survey packet within four weeks were mailed
another survey packet
In the second phase survey packets were mailed to the
selected organizational members as soon as the required
materials were received If any constituent organization
was not able to supply membership directory it was asked
to provide a list of 30 members randomly selected from its
membership Dillmans procedures for mail survey were
repeated with the mailing to constituent organizations
Data Analysis
Data were coded and entered into a Quattro Pro
(Version 30) spreadsheet which was converted into a Lotus
1-2-3 (Version 3) spreadsheet The data were then analyzed
84
using SPSSPCplusmn (Version 30) on an IBM PS2 Model 80
microcomputer
85
4 RESULTS AND DISCUSSION
The present study was an investigation into how needs
analysis could be used in developing training interventions
for resolving conflict among natural resource userinterest
groups The primary purpose of the study was to develop a
needs assessment approach for use with userinterest groups
in potential conflict over watershed resource
usemanagement in Oregon riparian zones Criteria derived
from the review of literature on instructional system
design models were used to develop the watershed resource
users needs assessment (WRUNA) conceptual framework The
WRUNA model was in turn used in designing the instrument
to acquire information from watershed resource
userinterest groups
For the purposes of this study the Watershed Resource
Users questionnaire was designed based on the WRUNA model
to gather information from the Oregon Watershed Improvement
Coalition (OWIC) and its constituent organizations Each
of the 18 sections of the mail survey questionnaire was
designed to generate data on specific variables The first
three sections concerned the dependent variables in this
study namely resource use orientation resource supply
philosophy and preferred conflict management style The
remaining sections concerned independent (demographic)
variables
86
The statistical analyses performed were analysis of
variance with multiple range test multiple linear
regression Pearsons correlation and descriptive and
summary types of statistical analyses The 10 probability
level was used The results of these analyses served as
the bases for (a) evaluating the instrument developed in
this study (b) establishing how needs assessment could be
used in the development of target-based instructional
interventions when the goal is conflict management and (c)
generating questions for discussion and further research in
this area
The remainder of this chapter is divided into three
sections for presenting and discussing the results of
analyses The first section examines needs assessment data
(Sections 1 to 3) for OWIC and the environmental business
and professional groups The second covers demographic
data on the constituent groups and the third is a
discussion on the credibility of the instrument Summaries
of analyses are presented within the text More detailed
information are given in the Appendices
Results of Analyses of Needs Assessment Data
This section identifies and compares the resource use
orientation resource supply philosophy and preferred
conflict management style of the OWIC and constituent
groups as determined from data collected by the mail
87
survey questionnaire Section 1 of the questionnaire
contained 15 items pairing six watershed resource uses
Section 2 contained six comparable dyad statements
expressing abundance versus scarcity philosophical views
For Section 1 a relative measure was shown on a scale from
0 to 2 where zero represented that neither response choice
was favored and 1 or 2 in a given direction represented
that one response choice was favored (1) or strongly
favored (2) For Section 2 the analysis showed a
relative measure on a 5-point scale where smaller the value
the more one favors the scarcity orientation On the other
hand the larger the value the more one favors an abundance
orientation
Section 3 consisted of 30 items adapted from the
Organizational Conflict Communication Instrument (OCCI)
(Putnam amp Wilson 1982) for the purpose of this study
This section measured the respondents preferred conflict
management style (CMS)--control nonconfrontation or
solution orientation The items were measured on a
seven-point summated rating scale (1 = always and 7 =
never) A low score indicated frequent use of certain
conflict communication strategies and high scores
indicated frequent use (see Chapter 3 for detailed
discussion)
The purpose of the first three sections was to examine
the perceptual similarities and dissimilarities between
members of the OWIC and its constituencies and the assumed
88
ideal profile represented in the WRUNA framework (Figure
5) as where they should be The ideal profile was based
on suggestions in the OWIC literature that certain
predispositions were necessary for consensus building
namely (a) multiple-use orientation (b) abundance
philosophy and (c) conflict management style tending
toward solution orientation
Resource Use Orientation
Table 4 summarizes the results of statistical analyses
on resource use orientation The results indicated that
OWIC and constituent group respondents did not have the
same orientation toward use of riparian watershed resources
(F = 542 df = 3 173 p = 00) Individual differences
between the OWIC members and the members of each
environmental business and professional group were
identified by employing a post-hoc least square difference
(LSD) test with probability level of 10 (Kleinbaum amp
Kupper 1978 Williams 1986) The possible mean score
range was 0 to 2--the smaller the mean score the greater
the tendency toward multiple resource use According to
the LSD test the professional (mean = 75 SD = 41) and
business (mean = 79 SD = 45) groups tended toward
multiple resource use whereas the OWIC (mean = 102 SD =
35) and environmentalist (mean = 104 SD = 42) groups
tended toward single use However caution is
89
Table 4 ANOVA results on resource use orientation
Source SS df MS
Between groups 293 3 98 542 00
Within groups 3116 173 18
Total 3409 176
Group na Meanb SD
Environmentalist (EG) 81 104 42
Business (BG) 57 79 45
Professional (PG) 20 75 41
OWIC (0) 19 102 35
Total 177 92 44
Environ- Profes- Uses mentalist Business sional OWIC
Livestock- n 80 55 20 19 wildlife M 445 267 315 347
SE 09 15 23 35
Wildlife-Fish n 75 54 20 17 M 311 294 305 318 SE 09 10 15 20
Fish-Livestock n 81 56 19 19 M 129 318 279 232 SE 06 16 29 30
Livestock-Water n 79 53 20 18 storage M 438 313 345 400
SE 09 13 25 21
Water storage- 78 54 20 19 Fish M 371 250 270 295
SE 11 11 18 19
Fish-Aesthetic amp n 80 53 20 18 recreation M 228 247 23 194
SE 11 12 18 19
Aesthetic amp n 79 56 20 19 recreation- 162 380 345 295
r
M
Livestock SE 09 14 25 30
Livestock- n 80 57 20 19 Aquifer recharge M 450 293 340 411
SE 09 15 27 25
Aquifer n 76 55 20 19 recharge- M 313 284 285 258 wildlife SE 12 12 23 23
Wildlife-water a 77 55 20 19 storage 240 344 310 305
SE 11 12 20 24 11
90
Environ- Profes-
Uses Water storage- n
mentalist 78
Business 55
sional 20
OWIC 19
Aesthetic amp M 283 205 220 184 recreation SE 13 12 25 18
Aesthetic amp n 77 55 20 18 recreation- M 385 362 365 411 Wildlife SE 11 11 22 21
Aquifer n 77 55 19 19 recharge- M 242 222 195 158 aesthetic amp SE 11 13 21 16 recreation
Fish-aquifer n 77 55 20 19 recharge 21 269 320 335 332
SE 12 12 22 23
Water storage- 75 54 20 19 Aquifer recharge M 352 283 325 363
SE 10 10 14 21
Note 1 = always left use 5 = always right use aNumbers of participants responding to the question The smaller the mean the stronger the preference toward multiple use Scale 0 = multiple use 1 = favor single use 2 = strongly favor single use plt10
LSD test (PG = 8G)lt(0 = EG)
advised in interpreting these results which are based
solely on an examination of means Extreme scores may
distort the average The professional group compared to
those of the business group had a smaller range of scores
The distribution of scores for the business group appeared
to be more normally distributed (0 to 20) compared to
those for the professional group (27 to 180) There were
no outliers observed for these two groups
The difference in mean scores between members of the
OWIC group and the environmental group may be explained by
two outliers observed in the OWIC group one at each end of
the scale In other words one member of the OWIC group
91
represented an extreme position toward single use
orientation whereas another member represented the extreme
toward multiple use orientation The scores for the
majority of the members ranged between 6 and 13
The standard deviations for the OWIC and environmental
groups were about the same The score for the
environmental group members were heavily and evenly
distributed toward single use orientation except for the
means of two members that fell in between 0 and 4
representing a strong multiple-use orientation
In summary the findings indicated that the OWIC and
the environmental group members held almost similar
positions regarding resource use with a moderate tendency
toward single use The business and professional groups
showed a moderate tendency toward multiple use orientation
compared to the OWIC and environmental groups Therefore
the business and professional group members were more
inclined the WRUNA model ideal on resource use orientation
Resource Supply Philosophy
The results of analyses showed that the OWIC and the
constituency members shared a similar philosophical
orientation toward resource supply but not to the same
degree (F = 1001 df = 3 173 p = 00) As shown in
92
Table 5 the results indicated a greater tendency toward
abundance philosophy for the OWIC group (mean = 431
Table 5 ANOVA results on resource supply philosophy
Source SS df MS
Between groups 1168 3 389 1001 00
Within groups 6729 173
Total 7897 176
Group n8 Meanb SD
Environmentalist (EG) 79 350 70
Business (BG) 55 383 50
Professional (PB) 20 389 68
OWIC (0) 19 431 56
Total (197) 173 374 67
aNumbers of participants responding to question bResponses were scored on a 5-point scale 1 = Strongly favor scarcity philosophy 2 = Favor scarcity philosophy 3 = Neutral 4 = Favor abundance philosophy 5 = Strongly favor abundance philosophy The greater the mean the stronger the preference
LSD test EG PG BG ltO BG = PG EGltBG PG O
SD = 56) than for the environmental subjects The
environmental group slightly favored (mean = 350 SD =
70) the abundance philosophy Mean scores for the other
two groups business (mean = 383 SD = 50) and
professional (mean = 389 SD = 68) fell in between the
mean scores of the environmentalist and the OWIC groups
Mean scores indicated that members of OWIC and the
environmental group were in relative disagreement in terms
93
of resource supply philosophy Perceptual differences
regarding resource supply existed between the OWIC and
environmental group members who responded to the
questionnaire but the majority of the members in both
organizations (environmental = 74 OWIC = 100) were
strongly inclined toward abundance philosophy (mean greater
than 30) There was no critical outlier observed in
distributions of scores for either group Mean
distributions for both the business and professional groups
were normal with the exception of one outlier observed for
the business group This outlier may have influenced the
total mean score for the business group which indicated a
strong tendency toward abundance philosophical orientation
In summary a statistically significant difference was
found between mean scores for OWIC in terms of resource
supply philosophical orientation The data indicated
however that the environmental group tended less toward
the abundance philosophical orientation Although 42 of
OWIC members represented environmental organizations the
organization tended more toward abundance philosophy the
WRUNA model ideal than did the environmental constituent
groups The business and professional groups were
positioned between the environmentalist and OWIC groups
with mean scores indicating a moderate abundance
philosophical orientation
94
Conflict Management Style
Tables 6 through 8 summarize the one-way analysis of
variance results on preferred conflict management styles of
the OWIC and constituent groups Means indicated that the
preferred conflict management style was solution
orientation for all four groups The smaller the mean the
greater the tendency toward solution orientation conflict
management style (range 1 to 7) the tendency of the OWIC
(mean = 305 SD = 49) and professional (mean = 328 SD =
113) groups were relatively stronger (F = 392 df =
3148 p = 01) than that of the environmentalist (mean =
362 SD = 81) and business (mean = 377 SD = 93)
groups
The number of respondents for the OWIC and the
professional groups was about the same (19 and 20
respectively) but the standard deviation for the
professional group was nearly double that for OWIC (113
versus 49) The scores for the OWIC group were fairly
evenly distributed but to some extent it was skewed toward
very often on solution orientation There was no obvious
outlier observed in the data Score distribution for the
professional group was very uneven 90 of the members
scores fell between 2 (very often) and 4 (sometimes) on
questionnaire items related to solution orientation There
were two outliers observed but the more critical outlier
was toward the extreme of never
95
Table 6 ANOVA results on solution orientation management style
Source SS df MS p
Between groups 887 3 296 392 01
Within groups 11167 148 75
Total 12054 151
Group na Meanb SD
Environmentalist 61 362 81
Business 52 377 93
Professional 20 328 113
OWIC 19 305 49
Total 152 355 89
aNumbers of participants responding to question items bResponses scored on a relative scale (3 = strongly favored 4 = favored)
LSD test (0 = PG) lt (EG = BG)
Table 7 ANOVA results on nonconfrontation conflict management style
Source SS df MS p
Between groups 59 3 20 34 79
Within groups 8659 150 58
Total 8719 153
Group na Meanb SD
Environmentalist 63 497 75
Business 52 492 76
Professional 20 501 98
OWIC 19 512 50
Total 154 498 75
aNumbers of participants responding to question 6Responses re conflict management behavior were scored on a 7-point scale 4 = sometimes and 5 = seldom and 6 = very seldom
96
Table 8 ANOVA results on control conflict management style
Source SS df MS
Between groups 887 296 392 01
Within groups 11167 148 75
Total 12054 151
Group na Meanb SD
Environmentalist 62 432 88
Business 51 405 95
Professional 19 408 115
OWIC 19 450 87
Total 151 422 94
aNumbers of participants responding to question items bResponses were scored on a relative scale 4 = sometimes 5 = seldom
3
The business and environmental groups were moderately
oriented toward solution orientation Their mean standard
deviations were the same One outlier was observed in the
environmental group Two possibly three outliers were
observed in the business group Scores of these outliers
indicated that they preferred conflict management styles
other than solution orientation The respective group mean
scores regarding solution orientation as the preferred
conflict management style may have been skewed downward by
the outlier scores
Table 7 shows that the OWIC (mean = 512 SD = 50)
and constituent groups (mean score range = 492 to 501)
were consistent for items measuring nonconfrontation
conflict management style behavior (df = 3 150 F = 34
97
p = 79) On the 7-point scale used to measure conflict
management style preference 5 indicated seldom Thus
the mean scores indicated that all groups tended toward
seldom use of the nonconfrontation style As already
discussed in chapters 2 and 3 nonconfrontation combines
avoiding (ie refusal to discuss the conflict) and
smoothing (ie accommodate to cover up the conflict)
styles of conflict management (Putnam amp Wilson 1982
Witteman 1991) According to the WRUNAs ideal
guidelines the trend of the nonconfrontation scores toward
seldom indicated a desire to resolve the conflict
The mean score distribution for OWIC is a normal
distribution with scores spread from 38 to 61 The most
critical outliers were observed in the professional and
environmentalist groups The outliers may have influenced
higher mean scores for nonconfrontation conflict management
style The mean score distribution of the business group
is also normally distributed with scores ranging from 30
to 67 However the distribution curve for the business
group is flatter than that for the OWIC group
The four groups did not appear to differ in their
views of control conflict management style (F = 145 df =
3 147 p = 23) (see Table 8) Mean scores for the OWIC
(mean = 450 SD = 87) and environmental (mean = 432 SD
= 88) groups may have reduced because of outlier scores
resulting in a lower frequency for control behavior
Outlier scores may also have distorted the mean scores for
98
the business (mean = 405 SD = 95) and professional (mean
= 408 SD = 115) groups resulting in higher frequency
for control conflict management style
In summary a preference for solution orientation was
strongly indicated by mean scores (3 = often) for the
members of the OWIC and professional group and moderately
indicated by mean scores (4 = sometimes) for
environmentalist and business groups The members of OWIC
and its constituencies tended toward the solution
orientation conflict management style the WRUNA model
ideal
Results of analyses indicated significant difference
between the OWIC and the constituent groups on resource use
orientation resource supply philosophy and preferred
conflict management style The implication of these
findings is that the different instructional interventions
would be appropriate for heterogeneous groups
Results of Analyses of Demographic Data
Sections 4 through 18 of the questionnaire collected
demographic information Section 4 consisted of one
forced-choice item soliciting respondents perceived status
of power in regard to influencing other users in how
resources should be used (1 = more than others 2 = same
as others 3 = less than others 4 = not applicable)
The other sections concerned education level gender
nature of job and interest group affiliations sources of
99
information views toward private and public land
management options and perception of intensity of
conflict This information helped to assess additive and
interactive predictive effects of key variables leading
toward resolution of conflict between the watershed
resource userinterest groups
Demographic data were collected from participants in
the environmental business and professional groups as
well as OWIC In most cases only data on the members of
the constituent organizations were compared and discussed
to suggest instructional interventions Respondents
perceptions were analyses regarding power status and
interactive effect Presentation and discussion of the
results follow
Gender
As Table 9 shows less than one-fourth (234) of
total respondents were female The environmental group had
a larger proportion (367) of women than did the business
and professional groups (91 and 100 respectively) (x2
= 1610 df = 2 p = 00)
Years of Schooling
The mean scores for years of schooling for the
business group (1552) differed significantly from those
of respondents in the environmentalist and professional
100
Table 9 Gender of respondents
Male Female
Group na
Environmentalist 50 633 29 367
Business 50 909 5 91
Professional 18 900 2 100
Total 118 766 36 234
aNumbers of participants responding to question
groups (1706 and 1735 respectively) (F = 758 df = 2
143 p = 00) (Table 10) Results of regression analyses
indicated that educational attainment was a significant
variable in resource use orientation (B = 06 t = 285 p
= 01) however it only explained 6 of the variance (see
Appendix D Table 30)
Table 10 ANOVA results for years of schooling
Source SS df MS p
Between groups 8858 2 4429 758 00
Within groups 83581 143 584
Total 92439 145
aGroup n Mean2 SD
Environmentalist 72 1706 241
Business 54 1552 250
Professional 20 1735 216
Total 146 1653 252
aNumbers of participants responding to question lNean years of schooling possible range 1-22 plt10
101
Power Status
The majority of respondents in all four groups
perceived their power status to be the same as others
The t-test indicated no significant difference in means
either 3 t-test results or in ANOVA (Appendix D Table 16)
Analyses of variance revealed no significant power status
effect on preferred conflict management style (F = 74 df
= 3 115 p = 53) (Table 11 and see other details in
Appendix D Table 17)
Process Participation
Constituent group members were asked about their
involvement in facilitating communication among users of
riparian areas other than through OWIC Professional group
members indicated a relatively higher rate (74) of
participation in the process communication facilitation
than the environmentalist and the business constituencies
(x2 = 2630 df = 2 p = 00) (Table 12) Few
communication facilitation services have been extended
outside OWIC by the business (18) and environmentalist
(20) group members The perceived impact of those
communication facilitation efforts is presented in Appendix
D Table 18 The data revealed that constituent group
member communication facilitation efforts experiences were
similar (F = 93 df = 2 37 p = 41) The respondents
viewed the facilitation process as somewhat productive
(mean = 195 SD = 43)
102
Table 11 ANOVA results for power status in influencing others
Source SS df MS
Between groups 90 3 30 74 53
Within groups 4656 115 40
Total 4746 118
a Group n Meanb SD
Environmentalist 44 198 59
Business 39 200 69
Professional 17 176 66
OWIC 19 184 60
Total 119 193 63
aNumber of participants responding to question bResponses scored on 3-point scale (1 = more than others 2 = same as others 3 = less than others)
Table 12 Frequency of response on involvement in communication facilitation process
Yes No
Group na n
Environmentalist 15 195 62 805
Business 10 179 46 821
Professional 14 37 5 263
Total 39 257 113 743
Note Pearson x2 = 2630 df = 2 p = 00 aNumbers of participants responding to question
Sources of Information
Participants were asked to indicate the importance of
certain sources of information in promoting awareness and
the exchange of ideas in terns of technical social
103
economic and political aspects The sources of
information given in the questionnaire were general
membership meetings special membership meetings published
magazines newsletters and scientific journals committee
meetings friends neighbors and relatives displays at
fairs and other public meeting places government agencies
such as USFS and ELM extension services and personal
toursvisits The analysis of variance indicated
significant differences in mean scores for general
membership meetings (df = 2 128 F = 445 p = 01)
committee meetings (df = 2 120 F = 506 p = 01)
friends neighbors and relatives (df = 2 129 F = 308
p = 05) and Extension Service (df = 2 129 F = 537
p = 01) Table 13 summarizes in descriptive terms the
levels of importance each information See Table 19
through Table 27 (Appendix D) for results of statistical
analysis
Care is needed in interpreting these results because
they are merely based on mean scores The complexity of
the interconnected information network of these groups
warrants serious consideration when designing needs
analysis as well as instructional interventions
Riparian Resource Use Management
In regard to preferred type of riparian landresource
management the pattern of responses for the three groups
differed As Table 14 shows the professional group was
104
Table 13 Descriptive summary of results on importance of selected sources of information
Group
Source Environ- Profes-mentalist Business sional
Magazines Important Important Important newsletters scientific journals
Government agencies Important Important Important
Newspapers and news Important Important Important magazines
Extension Service Somewhat Important Somewhat important important
Special membership Somewhat Somewhat Somewhat meetings important important important
Friends neighbors Important important Somewhat and relatives important
Committee meetings Somewhat Important Important important
Displays--fairs Somewhat Somewhat Somewhat other public important important important meeting places
General membership Somewhat Important Important meetings important
Note Sources are arranged in descending order of mean scores
split between some private and some public lands being
controlled by entrepreneurs (59) and similar management
for all public and private lands (41) The
environmentalist group was similarly split except for one
outlier but similar management for all public and private
lands was strongly favored (76) The business groups
responses were widely and unevenly distributed but favored
private lands (37) or some private and some public lands
105
(39) being controlled by riparian areas resource users
Results of analyses indicated that views of the
environmentalist and business groups regarding riparian
landresource management differed significantly
(Kolmogorov-Smirnov 2-Sample Test Z = 310 p = 00)
Interestingly 80 or more of the participants in each
group responded that Oregons riparian areas resource
usemanagement conflict could be successfully managed
(Table 28 Appendix D)
Almost all of the study participants in the
environmental business and professional groups indicated
that riparian resource usemanagement is a controversial
issue The total group mean (277) indicated that the
perceived degree of conflict was greater than moderate but
less than severe (2 = moderate and 3 = severe) (Table
29 Appendix D) The implication of these findings was
that there is need for instructional intervention to reduce
conflict According to the literature on conflict
management conflict management intervention should be
attempted when a problem creates conflict of severe
intensity (Rahim 1992)
106
Table 14 Frequency data on type of riparian land management
Nonel One type2 Bothtvpes3 A114
Group n
Environmental 1 14 16 222 55 764
Business 2 39 19 373 20 392 10 196
Professional - - 10 588 7 412
Total 2 14 20 143 46 329 72 514
Note For environmental and business groups only Kolmogorov-Smirnov 2-Sample Test (n= 72 n = 51) Z= 310 p= 00
Land use philosophy Classi- Environ- Busi- Profes-fication mental ness sional
All public and all private 4 775 192 412 land
All public and some private 3 338 216 438 land
All public and no private land 2 86 347 63
Some public and all private 3 57 41 63 land
Some public and some private 3 86 300 500 land
Some public and no private 2 43 417 125 land
No public and all private land 2 29 41 63
No public and some private 2 29 61 63 land
No public and no private land 1 29 42 63
Demographic Variables as Predictors
Stepwise multiple regression analyses were employed to
determine whether any meaningful relationship existed
between dependent and independent variables The dependent
variables were preferred conflict management style (ie
control nonconfrontation and solution orientation)
107
resource use orientation and resource supply philosophy
Table 30 through Table 32 (see Appendix D) summarize the
results of these regression analyses The criterion for
inclusion of an independent variable was set at 1
probability confidence level exclusion was set at 15
probability level The independent variables included were
power status land management gender educational
attainment perceived level of conflict intensity and
conflict management
Five fitted regression equations when environmental
and business groups were pooled for analysis purposes
There was equal opportunity for each dependent variable to
pick among the independent variables Results of the
regression analyses indicated a significant educational
attainment effect on resource use orientation (n = 77 B =
06 t = 285 p = 01) (Table 30 in Appendix D) However
this independent variable explained only 10 of the total
variance The land management and conflict management
variables (third regression equation) explained 13 of the
total variance regarding resource supply philosophy was
explained Conflict management and power status variables
interacted significantly regarding the solution orientation
variable however they explained only 8 of the variance
Two regression equations for the environmentalist
organizations and four regression equations for the
business organizations were generated when individual
regression analyses were employed for the respective
108
organizations For the environmental group the conflict
management variable predicted 13 of the variance for the
resource supply philosophy variable (n = 40 B = -71 t =
-235 p = 02) and the land management variable predicted
15 of the variance for control conflict management style
(n = 40 B = -71 t = -254 p = 02) (Table 31 in
Appendix D)
For the business group the conflict management
variable was observed to be a pertinent predictor in the
first and second equations It accounted for 10 of the
variance for control conflict management style variable
(n = 37 B = -76 t = -202 p = 05) It played a key
role in predicting the variance for solution orientation
conflict management style but not for control conflict
management style The theoretical inference from this
finding is that instructional interventions designed to
reduce preference for control style will effect increased
preference for solution orientation style among business
group members In the third regression equation both
conflict management and power status variables contributed
25 of the variance for solution orientation conflict
management style (Table 32 Appendix D) In the last
equation the intensity of the conflict variable explained
8 of the total variance for nonconfrontation conflict
management style (n = 37 B = 52 t = 174 p = 09)
In summary the predictor variables supported logical
interpretation of the coefficients and persistency in tetms
109
of sign directions and magnitude of the standard errors of
the regression coefficients Of the given independent
variables the most frequent predictor variables observed
in the regression equations were land management conflict
management power status and educational attainment The
interactive effect of conflict management and power status
variables explained the maximum variance for solution
orientation style among the business organizations The
analyses revealed interrelated aspects between resource use
orientation resource supply philosophy and preferred
conflict management style under the given independent
variables of power status source of information and land
management
Credibility of the Instrument
Validation of the instrument developed for this study
occurred in two phases As discussed in Chapter 3 the
instrument a mail survey questionnaire was validated by
eight expert panel members who understood riparian
watershed resource issues The experts communicated their
comments independently on the consistency accuracy and
clarity of the questionnaire items The draft instrument
was revised on the basis of the experts comments The
researcher discussed the study and the instrument with the
OWIC member charged with moderating OWIC meetings He
110
confirmed that the WRUNA models targeted goals
corresponded with OWICs expectations
Cronbachs alpha was used to estimate the internal
consistency reliability of the instrument (Table 15) The
alpha coefficients were 85 and 78 for the corresponding
15 and 6 items in Sections 1 and 2 respectively of the
questionnaire For the 7 control 12 nonconfrontation and
11 solution orientation items the alpha coefficients were
79 91 and 71 respectively The conflict management
style items were adapted from the OCCI (Putnam Ey Wilson
1982)
Table 15 Internal reliability of the WRUNA-based instrument
Number Number Alpha of of Coeffi-
Variable Cases Items Mean SD cient
Resource use orientation 183 15 83 28 85 (single vs multiple
Resource supply philosophy 183 6 347 37 78 (abundance vs scarcity)
Conflict management style a Nonconfrontation
(avoidance) 105 12 505 66 79 b Solution Orientation 105 11 339 42 91 c Control 105 7 417 95 76
Note Resource use orientation mean could range from 0 to 2 the smaller the mean the stronger the orientation toward multiple use Resource supply philosophy mean could range from 1 to 5 the larger the mean the stronger the orientation toward abundance philosophy The conflict management style mean could range from I to 7 the smaller the mean the greater the frequent use of certain conflict communication strategies (1 = always and 7 = never)
111
The alpha coefficients for nonconfrontation and
solution orientation conflict management styles were very
close to the Nunnalys average standard alpha coefficient
(80 to 90) whereas the alpha coefficient for control
conflict style was not (Womack 1988b) (see Table 33
through Table 35 in Appendix D for the effect of item
changes on the alpha values)
Tables 36 through Table 39 (Appendix D) present
summaries of the correlation coefficients between the
dependent variables resource use orientation resource
supply philosophy and conflict management style (ie
control nonconfrontation or solution orientation) for the
different demographic conditions in this study Table 36
indicates no significant correlation coefficients The
magnitude of the coefficients ranged from 06 to 46 The
results indicated that the dependent variables were
independent measures
Table 37 through 39 indicate correlation of at least
one with independent variable and dependent variable Only
one significant negative correlation was observed at 01
probability level between control and nonconfrontation
conflict management styles for environmentalist group
conditions It had a -31 correlation coefficient
magnitude The negative sign was appropriate for control
and nonconfrontation conflict management styles because
when control is increased nonconfrontation decreases
This type of pattern was observed in the study Thus the
112
negative correlation sign helps rather than hinders the
measuring credibility of the instrument The other inter-
factor correlation measures presented in Table 37 were
observed to be independent
As Table 38 shows a significant negative correlation
(-49) was observed between solution orientation and
resource supply philosophy at 001 probability level for
business group conditions In other words as the
preference for solution orientation conflict management
style increases the orientation toward scarcity philosophy
would become weaker or toward abundance philosophy
stronger This relationship was previously described under
Conflict Management Style in the Results of Needs
Assessment section of this chapter The independence of
the estimates is reflected from non-correlation between
other factors in Table 38
As Table 39 shows only one negative correlation was
observed between solution orientation and control conflict
management styles at the 01 level of significance under
professional group conditions The magnitude of the
correlation coefficient was -67 The meaning of this
negative correlation appears to be if control conflict
management style is decreased then solution orientation
conflict management style is increased and vice versa
The table does not show other variables having significant
relationships with one another In summary it is
reasonable to interpret correlation measures of statistics
113
favoring the non-interdependence of the independent
variables in the WRUNA-based instrument namely resource
use orientation resource supply philosophy and conflict
management style (ie control nonconfrontation or
solution orientation) under OWIC environmentalist
business or professional group conditions
Following are key observations made by the researcher
regarding data collection during the course of the study
1 Many participants (range 35-51) did not respond to all
items in Section 3 especially to item numbers 13 15
16 18 21 25 and 29 Of these individuals five
indicated that they did not have the knowledge or the
items were not applicable to them A few of the
respondents did not feel comfortable in responding to
some of the items in Section 3
2 Sections 1 and 2 (on resource use orientation and
resource supply philosophy respectively) of the
instrument showed good return Only 8 to 12
respondents did not complete these sections
3 Section 11 on the land management independent
variable was not responded to by about 34
participants A few of the respondents provided
feedback that they did not understand the question or
they could not properly respond to the question unless
a specific site problem was given
In general the content of the questionnaire was
appreciated by many of the respondents as evidenced by
114
such comments as It is worth doing A few responded
that the questions might be hard because the riparian issue
is hard too
115
5 SUMMARY AND CONCLUSIONS
The purpose of the study was to investigate needs
assessment methods that would facilitate the development of
target-based instructional interventions designed for
managing conflict between Oregons riparian watershed
resource userinterest groups To achieve this goal a
needs assessment model specific to conflict management
needs of watershed resource userinterest groups was
developed based on the theoretical and conceptual
framework from available literature and discussion of the
natural resource usemanagement concepts and issues with
concerned authorities working on that area An instrument
was developed to assess the perceptions and attitudes of
watershed resource users toward watershed resource use
watershed resource supply and conflict management style
The instrument was administered to the 20 members of the
Oregon Watershed Improvement Coalition (OWIC) and 287
members randomly selected from its constituent
organizations The response rate was 95 from the OWIC (n
= 19) and about 64 (n = 183) from the constituencies
including five blank returned questionnaire who remarked
either the instrument questions were not applicable to
their interest or they dont have enough knowledge about
riparian zones resource usemanagement issues
OWIC is a case study for consensus building among
watershed resource usersinterest groups and other
116
concerned parties The primary target population the nine
OWIC constituencies are comprised of environmentalist
business and professional organizations
Natural resource use and management issues are complex
in nature and cannot be appropriately resolved until the
perceptions and attitudes of the usersinterest groups are
understood The present study was an exploratory
research-based attempt to justify the development of
target-based instructional interventions for managing
conflict among such groups in potential long-term conflict
Discrepancy analysis was employed to determine the gap
between the existing and desired orientations of OWIC and
constituent group members toward watershed resource
usemanagement and conflict management style The desired
or ideal profile (what they should be) is a component of
the watershed resource users needs assessment (WRUNA) model
developed in this study The three characteristics of the
ideal profile were derived from OWIC literature They are
multiple-use orientation abundance philosophy and
solution orientation conflict management style
Results of analyses indicated that regarding multiple
use OWICs profile was similar to that of the
environmental group and dissimilar to that of the business
and professional groups The OWIC and environmental groups
were relatively less oriented to multiple use compared to
the other groups It should be noted that OWIC membership
represents environmentalist (42) business (32)
117
professional (21) groups and also includes a (5)
publicist
Regarding resource supply philosophy the OWIC group
was more oriented toward abundance philosophy than were the
business and professional groups which were closer to that
orientation than the environmentalist group which tended
toward scarcity philosophy
The preferred conflict management style for OWIC and
the constituent groups was observed to be solution
orientation OWIC and professional group members were
relatively more oriented toward solution orientation style
than the environmentalist and business group members which
were similar in regards to this dependent variable The
OWIC and the constituent groups were not different from
each other in terms of nonconfrontation and control
conflict management style preference in riparian conflict
situations
In summary results showed that OWIC has achieved the
WRUNA model ideal profile in terms of abundance philosophy
and solution orientation style but not in terms of
multiple use of the riparian watershed resources OWIC and
the constituent groups were quite similar in terms of
control and nonconfrontation styles of conflict management
but they were different to some degree in terms of multiple
use abundance philosophy and solution orientation styles
OWIC differed from the business groups in terms of multiple
use and from the environmentalist and business groups in
118
terms of abundance and solution orientation styles
Similarly the business group differed from the
environmentalist group in terms of multiple use and
abundance philosophy but was similar in terms of the three
conflict management styles
Conclusions
The watershed resource users needs assessment (WRUNA)
instrument appeared to be fairly reliable except one
factor control conflict management style The content of
the instrument was validated by a panel of eight experts in
the field of natural resource management and by the
moderator of the OWIC organization The key factors are
fairly independent from each other when controlled under
the OWIC organization the only significant relationships
appeared between control and nonconfrontation conflict
management styles under the environmental organization
and between solution orientation conflict management style
and abundance philosophy under the business group
Care should be taken in interpreting the findings of
the study It was exploratory in design Most of the
findings were based on average scores Outliers were
observed therefore skewed distributions were possible
The study synthesized participants perceptions and
attitudes direct observation was lacking Case-related
119
information is restrictive in generalizing the study
results and implications to other situations
The question arises how can the data generated by the
needs assessment be used to develop instructional
interventions to manage conflict among the watershed
resource usersinterest groups and how can these
interventions be effectively implemented into the existing
communicationfacilitation process
First the instrument questions particularly the
multiple-single resource use items (Section 1) abundance-
scarcity items (Section 2) and conflict management style
items (Section 3) were reliable and appeared to be valid
Identification of variations between OWIC group and the
constituent groups as well as between the constituencies
and between the ideal profile was assisted Further the
analysis of the results showed that these three variables
estimated the parameters fairly independently No major
correlation problems were observed except with a couple of
parameters in conflict management style and abundance
philosophy Therefore a training interventions package
could be developed by looking at the homogeneous and
heterogeneous aspects revealed by the instrument For
example environmentalist and business groups were found to
be divergent in terms of multiple-use and abundance
philosophical orientations therefore different
instructional interventions are indicated for these groups
Both however could benefit from the solution orientation
120
instructional intervention as could OWIC and the
professional group
The exploration of opportunities and possibilities for
the promotion of communication among watershed resource
userinterest groups is a priority for future study
because it will assist in extendingimparting the
instructional interventions to those groups This study
reviewed the status of the constituencies in respect to the
means for acquiring information on managing riparian
resources Published material such as magazines
newsletters brochures and scientific journals were
indicated to be important to all groups and government
agencies were indicated to be important The importance of
other means of acquiring information to the three groups
varied However these findings should provide a guide for
better exchange and communication with Oregons riparian
resource userinterest groups that will assist in gathering
further demographic information and implementing target-
based instructional interventions
A research agenda was suggested by the experience of
this study It was realized that more efforts are needed
to simplify the instrument Some of the questions related
to the conflict management styles under the riparian
conflict conditions need to be rewritten This fact was
evidenced by the poor response rate for this section Some
of the unimportant and repeated items should be replaced
with item conveying clear meaning of the required
121
information Therefore interdisciplinary team research
efforts especially close collaboration of instructional
specialist speech and communications professionals and
naturalenvironmental resource usemanagement specialist
are suggested to find the relevant variables The land
management philosophy question (Question 11) needs to be
improved to generate more feedback from respondents
There is a need to add questions to the instrument
which would determine conflict and conflict management-
related communication exchange status and its directions
only between business and environmentalist groups This
information could promote communication facilities between
the usersinterest groups as well as facilitate planning
activities by instructional designers natural and
environmental resource usemanagement managers
researchers and mediators for reducingmanaging conflict
among natural resource usersinterest groups
122
REFERENCES
Amy D J (1987) The politics of environmental mediation New York Columbia University Press
Beer M amp Walton A E (1987) Organization and development Annual Review of Psychology 38 339-367
Bingham G (1986) Resolving environmental disputes Washington DC The Conservation Foundation
Bisno H (1988) Sage
Managing conflict Newbury Park CA
Blake R R amp Mouton J S (1964) grid Houston Gulf Publishing
The managerial
Blake R R amp Mouton J S (1985) III Houston Gulf Publishing
The managerial grid
Boulding K E (1968) Preface to special issue Journal of Conflict Resolution 12 409-411
Bower J L (1965) The role of conflict in economic decision-making groups Some empirical results Quarterly Journal of Economics 79(2) 263-77
Brown L R (1991) Global resource scarcity is a serious problem In M Polesetsky (Ed) Global resources Opposing viewpoints (pp 17-23) San Diego CA Greenhaven Press
Buckely W Burns T amp Meeker L D (1974) Structural resolutions of collective action problems Behavioral Science 19 277-297
Bureau of Land Management (1992) The range of our vision Range Magazine 1(1) p 39
Canary D J Cunningham E M amp Cody M J (1988) Goal types gender and locus of control in managing interpersonal conflict Communication Research 15(4) 426-446
Chanin M N amp Schneer J A (1984) A study of the relationship between Jungian personality dimensions and conflict-handling behavior Human Relations 37(10) 863-879
123
Clawson M (1987) From sagebrush to sage The making of a natural resource economist Washington DC Ana Publications
Clay J (1962) My life on the range An introduction by Donald R Ornduff Norman University of Oklahoma Press
Conacher A (1980) Environmental problem-solving and land-use management A proposed structure for Australia Environmental Management 4(5) 391-405
Cusick S (1993 September) After years of abuse federal policy on Western lands is ripe for reform Audubon Activist pp 1 4-5
Daly H E (1991) Towards an environmental macroeconomics Land Economics 67(2) 255-259
Daves W F amp Holland C L (1989) The structure of conflict behavior of managers assessed with self- and subordinate ratings Human Relations 42(8) 741-56
Dechaud S (1992) With quadrupled grazing fees threatened and the timber industry stressed the folks of Lake County Oregon have much to be worried about Range Magazine 1(1) pp 24-26
Deutsch M (1949) A theory of cooperation and competition Human Relations 2 129-152
Deutsch M (1971) Toward and understanding of conflict International Journal of Group Tensions 1 42-54
Dewees P A (1989) The woodfuel crisis reconsidered Observations on the dynamics of abundance and scarcity World Development 17(8) 1159-1172
Dillman D A (1978) Mail and telephone surveys The Total Design Method New York John Wiley amp Sons
Eisgruber L M (1992) Sustainable Development Ethics and Endangered Species Act Unpublished manuscript Oregon State University Department of Agricultural and Resource Economics Corvallis
Fege A S McCarthy-Ryan C Munson L amp Schreyer R (1989) Managing visitor conflicts In D W Lime (Ed) Proceedings of the Conference on Managing Americas Enduring Wilderness Resource (pp 383-396) Minneapolis University of Minnesota Tourism Center Minnesota Extension Service and Minnesota Agriculture Experiment Station
124
Filley A (1975) A interpersonal conflict resolution Glenview IL Scott Foresman
Frederick K D amp Sedjo R A (1991) Overview Renewable resource trends In K D Frederick amp R A Sedjo (Eds) Americas renewable resources Historical trends and current challenges (pp 1-21) Washington DC Resources for the Future
Gagne M (1982 June) Development in learning psychology Implications for instructional design and effects of computer technology on instructional design and development Educational Technology 22(6) 11-15
Gentile J R (1989) Environmental cooperation Panacea or myth Society and Natural Resources 2 85-90
Gick M L (1986) Problem-solving strategies Educational Psychologist 21(1 amp 2) 99-120
Gick M L amp Holyoak K J (1979) Problem solving and creativity In A Glass K Holyoak amp J Santa (Ed) Cognition (pp 391-441) Reading MA Addison Wesley
Groen G J amp Patel V L (1991) A view from medicine In M U Smith (Ed) Toward a unified theory of problem solving Views from the content domains (pp 35-44) Hillsdale NJ Lawrence Erlabaum Associates
Gudykunst W B Ting-Toomey S amp Chua E (1988) Culture and interpersonal communication (Sage Series Interpersonal Communication 8) London Sage
Guilford J P (1954) Psychometric methods New York McGraw-Hill
Hardin G (1968) The tragedy of the commons Science 162 1243-1248
Hess K Jr (1992) Visions upon the land Man and nature on the western range Washington DC Island Press
Howe C W (1979) Natural resource economics Issues analysis and policy New York John Wiley amp Sons
Howell J L (1981) The identification description and analysis of competencies focused on conflict management in a human services organization An
125
exploratory study Unpublished doctoral thesis University of Massachusetts
Izaak Walton League of America (1982) Conservation policies of the Izaak Walton League of America (IWLA) Arlington VA Author
Jandt F E amp Hare M (1976) Instruction in conflict resolution Urbana IL ERIC Clearinghouse on Reading and Communication Skills
Jorgenson D O amp Papciak A S (1981) The effects of communication resource feedback and identifiability on behavior in a simulated commons Journal of Experimental Social Psychology 17 373-385
Kabanoff B (1987) Predictive validity of the MODE conflict instrument Journal of Applied Psychology 72 160-163
Kaufman R A (1972) Educational system planning Englewood Cliffs NJ Prentice-Hall
Kaufman R (1982) Identifying and solving problems A system approach (3rd ed) San Diego CA University Associates Publishers
Kaufman R (1987) A needs assessment primer Training and Development Journal 41(10) 78-83
Kaufman R (1988) Planning educational systems A result based approach Lancaster PA Technomic Publishing Company Inc
Kaufman R A amp English F W (1976) Needs assessment A guide to improve school district management Arlington VA American Association of School Administrators
Kilmann R H amp Thomas K W (1977) Developing a forced-choice measure of conflict-handling behavior The MODE instrument Educational and Psychological Measurement 37 309-325
Kleinbaum D G amp Kupper L L (1978) Applied regression analysis and other multivariate methods Massachusetts Duxbury Press
Knapp M L Putnam L L amp Davis L J (1988) Measuring interpersonal conflict in organizations Where do we go from here Management Communication Quarterly 1(3) 414-429
126
Kowalski T J (1988) The organization and the planning of adult education Albany State University of New York Press
Krueger W C (1992) Building consensus for rangeland uses Rangelands 14(1) 38-41
Lawrence P R amp Lorch F W (1967) Differentiation and integration in complex organizations Administrative Science Quarterly 12(1) 1-47
Leritz L (1987) No-fault negotiating Portland OR Pacific Press
Lewis T amp Bjorkquist D C (1992) Needs assessment--A critical reappraisal Performance Improvement Quarterly 5(4) 33-54
Libecap G D (1981) Locking up the range Federal land control and grazing Cambridge MA Bollinger Publishing Company
Likert R (1961) New patterns of management New York McGraw-Hill
Masberg B A (1992) Determination of the value to planners of incorporating ecotourist needs data in the interpretive planning process Unpublished doctoral thesis Oregon State University Corvallis
Mayer R (1990) Conflict management The courage to confront Columbus OH Batelle Memorial Institute
Mernitz S (1980) Mediation of environmental disputes New York Praeger
Miller A (1982) Environmental problem-solving Psychosocial factors Environmental Management 6(6) 535-541
Miller A (1985) Psychosocial origins of conflict over pest control strategies Agriculture Ecosystems and Environment 12 235-251
Moncur J E T amp Pollock R L (1988) Scarcity rents for water A valuation and pricing model Land Economics 64(1) 62-72
Monette M L (1977) The concept of educational need An analysis of selected literature Adult Education 27(2) 116-127
127
Monette M L (1979) Need assessment A critique of philosophical assumptions Adult Education 29(2) 83-95
Nadler D A Hackman R J amp Lawler E E III (1979) Managing organizational behavior Boston Little Brown
Nelson G (1989) The public lands An endangered species In D W Lime (Ed) Proceedings of the Conference on Managing Americas Enduring Wilderness Resource (pp 18-21) Minneapolis University of Minnesota Tourism Center Minnesota Extension Service and Minnesota Agriculture Experiment Station
Newell A amp Simon H A (1972) Human problem solving Englewood Cliffs NJ Prentice Hall
Obermiller F W (1990) Introduction to the Economics Session Society for Range Management 1990 Annual Meeting Reno Nevada In F W Obermiller amp D Reesman (Eds) Current issues in rangeland resource economics (pp ii-vi) Corvallis Oregon State University Extension Service
Okey J R (1990) Tools of analysis in instructional development Educational Technology 30(6) 28-33
Olson J M amp Ross M (1984) Perceived qualifications resource abundance and resentment about deprivation Journal of Experimental Social Psychology 20 425-444
Pendell S D (1990) Deviance and conflict in small group decision making An exploratory study Small Group Research 21(3) 393-403
Perez R S (1991) A view form trouble-shooting In M U Smith (Ed) Toward a unified theory of problem solving Views from the content domains (pp 115-153) Hillsdale NJ Lawrence Erlbaum Associates
Petak W J (1980) Environmental planning and management The need for an integrative perspective Environmental Management 4(4) 287-295
Platt J (1973) Social traps American Psychologist 28 641-651
Pondy L R (1967) Organizational conflict Concepts and models Administrative Science Quarterly 12 296-320
128
Putnam L L (1988) Communication and interpersonal conflict in organizations Management Communication Quarterly 1(3) 293-301
Putnam L L amp Jones T S (1982) The role of communication in bargaining Human Communication Research 8 262-280
Putnam L L amp Poole M S (1987) Conflict and negotiation In F M Jablin L L Putnam K H Roberts amp L W Porter (Eds) Handbook of organizational communication An interdisciplinary perspective (pp 549-599) New York Sage
Putnam L L amp Wilson C E (1982) Communicative strategies in organizational conflicts Reliability and validity of a measurement scale In M Burgoon (Ed) Communication yearbook 6 (pp 629-652) Beverly Hills CA Sage
Rahim M A (1992) Managing conflict in organizations (2nd ed) New York Praeger
Rahim M A amp Bonoma T V (1979) Managing organizational conflict A model for diagnosis and intervention Psychological Report 44 1323-1344
Remmers H H (1954) Introduction to opinion and attitude measurement New York Harper amp Brothers
Renwick P A (1977) Effects of sex differences on the perception and management of conflict An exploratory study Organizational Behavior and Human Performance 19 403-415
Rifkin J (1992) Beyond beef The rise and fall of the cattle culture Dutton NY Penguin Books
Rifkin J amp Rifkin C G (1992) Your complete environmental guide to making political choices in the 1990s Voting green New York Doubleday
Robison M H amp Miller J R (1989) Regional economics and wild land amenity use In D W Lime (Ed) Proceedings of Conference on Managing Americas Enduring Wilderness Resource (pp 589-596) Minneapolis University of Minnesota Tourism Center Minnesota Extension Service and Minnesota Agriculture Experiment Station
Rosenberg E (1992) Towards sustainable development A holistic conceptual approach Unpublished manuscript
129
Oregon State University Department of Agricultural and Resource Economics Corvallis
Rosenberg M J (1982 September) The ABCs of ISD Training and Development Journal 36(9) 44-50
Ross R G (1982) The development and evaluation of a self-report instrument to measure conflict management style Unpublished doctoral thesis Ohio University
Ross R G amp DeWine S (1988) Assessing the Ross- Dewine conflict management message style Management Communication Quarterly 1(3) 389-413
Rossett A (1987) Training needs assessment New Jersey Educational Technology Publications
Rossett A (1990) Overcoming obstacles to needs assessment Training 27(3) 36-41
Rutte C G Wilke H A M amp Messick D M (1987) Scarcity or abundance caused by people or the environment as determinants of behavior in the resource dilemma Journal of Experimental Social Psychology 23 208-216
Sampson R N (1981) Farm land and wasteland A time to choose overcoming the threat to Americas farm and food future Emmaus PA Rodale Press
Savonen C (1992) Summer in the city Oregons Agricultural Progress 39(12) pp 24-29
Seiler J A (1963) Diagnosing interdepartmental conflict Harvard Business Review 41 121-32
Shearman R (1990) The meaning and ethics of sustainability Environmental Management 14(1) 1-8
Shockely-Zalabak P (1988) Assessing the Hall conflict management survey Management Communication Quarterly 1(3) 302-320
Simon J L (1991) Global resource scarcity is a serious problem In M Polesetsky (Ed) Global resources Opposing viewpoints (pp 24-28) San Diego CA Greenhaven Press
Sinden J A amp Worrell A C (1979) Unpriced values Decisions without market prices New York John Wiley amp Sons
130
Smith M U (1991) A view from biology In M U Smith (Ed) Toward a unified theory of problem solving (pp 1-19) Hillsdale NJ Lawrence Elbaum Associates
Sork T J amp Caffarella R S (1989) Planning programs for adults In S B Merriam amp P M Cunningham (Eds) Handbook of adult and continuing education (pp 233-245) San Francisco Jossey-Bass
Spitzer D R (1981) Training technology Analyzing training needs Educational Technology 21(11) 36-37
Stankey G H amp Clark R N (undated) Social aspects of new perspectives in forestry A problem analysis Milford PA Grey Tower Press
Stern P C (1976) Effect of incentives and education on resource conservation decisions in a simulated commons dilemma Journal of Personality and Social Psychology 43(6) 1285-1292
Stern P C (1992) Psychological dimensions of global environmental change Annual Review Psychology 43 269-302
Sullivan T J (1984) Resolving development disputes through negotiations New York Plenum Press
Susskind L amp Weinstein A (1980) Towards a theory of environmental dispute resolution Environmental Affairs 9 311-357
Sweller J amp Levine M (1982) Effects of goal specificity on means-ends analysis and learning Journal of Experimental Psychology Learning Memory and Cognition 8(5) 463-474
Talarowski F S Jr (1982) Attitude toward and perceptions of water conservation in a southern California community Unpublished doctoral thesis University of California Santa Barbara
Temkin T amp Cummings H W (1986) The use of conflict management behaviors in voluntary organizations An exploratory study Journal of Voluntary Action Research 15(1) 5-18
Tesolowski D G Newton A F amp Cureton J H (1988) Needs assessment The twilight zone of management Performance and Instruction 27(1) 26-30
Thomas K (1976) Conflict and conflict management In M D Dunnette (Ed) Handbook of industrial and
131
organizational psychology (pp 889-935) Chicago Rand McNally
Thomas K W (1988) The conflict handling modes toward more precise theory Management Communication Quarterly 1(3) 430-436
Thomas K W amp Kilmann R H (1978) Comparison of four instruments measuring conflict behavior Psychological Reports 42 1139-1145
Thompson J D (1960) Organizational management of conflict Administrative Science Quarterly 4(4) 389-409
Ting-Toomey S (1984) Conflict communication styles in black and white subjective cultures Paper presented at the Annual Meeting of the International Communication Association San Francisco CA
US Department of Agriculture (1990) The Forest Service program for forest and rangeland resources A long-term strategic clan Washington DC US Superintendent of Documents
Walton R E amp Dutton J M (1969) The management of interdepartmental conflict A model and review Administrative Science Quarterly 14 73-84
Walton R E amp McKersie R B (1965) A behavioral theory of labor negotiations An analysis of a social interaction system New York McGraw-Hill
Ware J (1983) Some aspects of problem solving and conflict resolution in management groups In L A Schlesinger R G Eccles amp J J Gabarro (Eds) Managing behavior in organizations Text cases readings (PP 101-115) New York McGraw-Hill
Ware J P amp Barnes L B (1983) Managing interpersonal conflict In L A Schlesinger R G Eccles amp J J Gabarro (Eds) Managing behavior in organizations Text cases readings (pp 196-209) New York McGraw-Hill
Watkins G A (1974) Developing a water concern scale Journal of Environmental Education 5(4) 54-58
Weider-Hatfield D (1988) Assessing the Rahim organizational conflict inventory-II (ROCI-II) Management Communication Quarterly 1(3) 350-366
132
Williams F (1986) Reasoning with statistics How to read auantitative research (3rd ed) New York Holt Rinehart Winston
Wilson S R amp Waltman M S (1988) Assessing the Putnam-Wilson organizational communication conflict instrument (OCCI) Management Communication Quarterly 1(3) 367-388
Witteman H (1986) The interpersonal problem solving process Problem conceptualization communication and outcome Unpublished doctoral thesis University of Wisconsin Madison
Witteman H (1988) Interpersonal problem solving Problem conceptualization and communication use Communication Monographs 55 336-359
Witteman H (1991) Group member satisfaction A conflict-related account Small Group Research 22(1) 24-58
Womack D F (1988a) Assessing the Thomas-Kilmann conflict mode survey Management Communication Ouarterly 1(3) 321-349
Womack D F (1988b) A review of conflict instruments in organizational settings Management Communication Quarterly 1(3) 437-445
Wondolleck J M (1988) Public lands conflict and resolution Managing national forest disputes New York Plenum Press
Zemke R amp Kramlinger T (1989) Figuring thins out A trainers guide to needs and task analysis Reading MA Addison-Wesley
APPENDICES
133
APPENDIX A
COVER LETTERS
DEPARTMENT OF RANGELAND RESOURCES
OREGON STATE UNIVERSITY Scrand Agriculsstre Kali 252 - Corvallis Oregon 97331-22IE
Teicphoec 503737-334 Fax 503-737-0504
March 5 1993
TO OWIC Members
FROM William C Krueger
SUBJECT Study of OWIC
Enclosed is the survey to study the attitudes of each of us as members of the Oregon Watershed Improvement Coalition_ Mr Ikram Saeed will use the results of this study as a part of his PhD program in Education In addition he needs to survey a random selection of members of the member organ nations Would each of you send me the directory of your organization so Ilc-am can draw 30 random members to complete the same survey If you would like the directory returned he will do that If you cannot send the directory because of orgpnizational policy please let me know and we will try to arrange a process to secure a random sample from our member organizations_
This approach will allow ampram to determine how we within OWIC believe how we relate to conflict and how we are the same or different from a random sample of our peers Since the OWIC membership is small it is important for each of us to respond Please take a few minutes to fill out and return this questionnaire this week
Tne results should be interesting to all of us
Enclosure
Redacted for privacy
134
DEPARTMENT OF RANGELAND RESOURCES
OREGON STATE UNIVERSITY Scran griculturc 202 - Corvallis Oregor 97332218
Ttitphmte 503737-3341 Fax 5037370504
March 11 1993
We are studying the ways for promoting communication among the many potential watershed resource users We are therefore asking users and others interested in the use of watershed resources about their perceptions and positions on the uses of resources This information will help the Oregon Watershed Improvement Coalition (OWIC) to work with its member organizations to optimize the use of Oregons watershed resources
Please complete the enclosed questionnaire Completion of this questionnaire is voluntary you may respond to any all or none of the questions However you are among only a small number of users and those interested in watershed resource use to participate in this study Your answers are very important to OWICs understanding of what should be accomplished Any information you provide will be held in strictest confidence Those analyzing the information will not know who you are as individuals Furthermore analysis will only involve group information great care will be taken to assure that individual answers will not be attributable
Please return your questionnaire in the enclosed pre-addressed stamped envelope regardless of how much information you provide
We appreciate your participation in this study Please feel free to call Dr Warren Suzuki (737-6393) or me (737-1615) at Oregon State University if you have any questions or concerns
Sincerely
William C Krueger Department Head
Enclosure
Redacted for privacy
135
APPENDIX B
INSTRUMENT
Riparian Zones Project School of Education
Oregon State University Corvallis Oregon 97331
USES OF WATERSHED RESOURCES
Instructions
Instructions are provided for each section of this questionnaire If you wish to comment on any question or qualify your response please feel free to write in the margins or the last page or on a separate sheet of paper Aglossary is provided on page 10
Return this Questionnaire in the enclosed pre-stamped and pre-addressed envelope Also return the enclosed post card at the same time Thank you
1
136
1 There are many uses and users of riparian zones and associated upland watershed areas Some watershed resource uses include aesthetic and recreation aquifer recharge livestock forage fish habitat water storage and wildlife habitat How do you value each of these uses For each pair of resource uses please circle a single number for the response that best indicates the relative value of the two uses to you
2 = I strongly favor this use 1 = I favor this use 0= the two uses are eguallytwortaat to me
(I have crossed out line(s) that lam unsure of)
For example If you strongly value bird habitat watershed resource against timber harvesting use then indicate this view as follows
bird habitat Z 1 0 1 2 timber harvesting
On the other hand if you are unsure about the relative values between bird habitat and timber harvesting then record your view as follows
a Livestock forage 2 1 0 1 2 Wildlife habitat
b Wildlife habitat 2 1 0 1 2 Fish habitat
c Fish habitat 2 1 0 1 2 Livestock forage
d Livestock forage 2 1 0 1 2 Water storage
e Water storage 2 1 0 1 2 Fish habitat
f Fish habitat 2 1 0 1 2 Aesthetic amp recreation
g Aesthetic amp recreation 2 1 0 1 2 Livestock forage
h Livestock forage 2 1 0 1 2 Aquifer recharge
i Aquifer recharge 2 1 0 1 2 Wildlife habitat
j Wildlife habitat 2 1 0 1 2 Water storage
k Water storage 2 1 0 1 2 Aesthetic amp recreation
1 Aesthetic amp recreation 2 1 0 1 2 Wildlife habitat
m Aquifer recharge 2 1 0 1 2 Aesthetic amp recreation
n Fish habitat 2 1 0 1 2 Aquifer recharge
o Water storage 2 1 0 1 2 Aquifer recharge
7
137
2 There are two basic views on the availability of watershed resources in a riparian areaOne perspective holds that the products from watershed are abundant resources The opposing view is that the products from watershed are scarce resources Somestatements regarding watershed resources in riparian areas are as follows Pleasecircle a single number for the response that best describes your position regarding thestatements
2= I stron ejv favor this statement1= I favor this statement 0= Neither option is true for me
For example If you favor the statement that water availability is a scarce watershed resource rather than an abundant resource then your response describes
water is an abundant resource 2 1 0 2 water is a scarce resource Similarly if you view that neither water resource is a scarce nor is an abundant then your position(water is an abundant resource 2 1 1 2 water is a scarce resource
a Human beings can solve watershed resource supplyproblems through im-proved land managementpractices 2 1 0 2
Watershed resource supply islimited and is beyond human control and thus can only bemanaged through cutting down the level of use
b Watershed resources would be appropriately distributed if resource shareholders give first andforemost preference to their own uses
2 1 0 2
Watershed resources would be appropriately distributed ifeach resource shareholder recognizes the concerns ofother users
c The number of watershed resource uses and users can be limited if users fix a proportional resource quota
2 1 0
The number of watershed resource uses and users can be increased if users coordi-nate their demands
d The number of watershed resource uses can be maximized if users are willing to explore the potential of the localripariat zones
2 1 0 1 2
The number of watershed resource uses should be limited according to the current smuts of the local riparian zones
e An individuals responsi-bility is more important for resource management program and policy tormation
2 1 0 2
A collective responsibility is more important for resource management program andpolicy formation
f Watershed resources can Watershed resources can bebe sustained through long- sustained best if there is onlyterm planning of multiple 2 1 0 1 2 limited uses uses
138
3
3 Think of disagreements you have had with other riparian zone and associated upland watershed user groups regarding access to and use of watershed resources Then indicate below how frequently you act in each of the described ways Do not respond with a particular disagreement in mind Instead keep in mind your general response to disagreements with other watershed user groups For each item circle a single number that represents how you are most likely to act Or cross out the item(s) that is not applicable to you There are no right or wrong answers
ALWAYS VERY OFTEN OFTEN SOMETIMES SELDOM VERY SELDOM NEVER 1 2 3 4 5 6 7
1 I blend my ideas with other riparian zone watershed user groups to create new alternatives for resolving disagreement 1 2 3 4 5 6 7
2 I shy away from topics which are sources of disputes with other watershed resource user groups 1 2 3 4 5 6 7
3 I make my opinion known in a clicagreement with other watershed resource user groups 1 2 3 4 5 6 7
4 I suggest solutions which combine a variety of viewpoints 1 2 3 4 5 6 7
5 I steer clear of disagreeable situations of this sort 1 2 3 4 5 6 7
6 I give in a little on my ideas when other watershed resource user groups also give in 1 2 3 4 5 6 7
7 I avoid members of other watershed resource user groups when I suspect that they want to discuss a disagreement 1 2 3 4 5 6 7
8 I integrate point of views into new solutions to disputes about use of watershed resources 1 2 3 4 5 6 7
9 I will go 50-50 to reach a settlement with other users o f w a t e r s h e d resources 1 2 3 4 5 6 7
10 I raise my voice when Im trying to get other resource users to accept my position 1 2 3 4 5 6 7
11 I offer creative solutions in discussions about disagree-ments 1 2 3 4 5 6 7
12 I keep quiet about my views in order to avoid dis-agreements 1 2 3 4 5 6 7
139
4
ALWAYS VERY OFTEN OFTEN SOMETIMES SELDOM VERY SELDOM NEVER 1 2 3 4 5 6 7
13 I give in if other resource users will meet me halfway 1 2 3 4 5 6 7 14 I am flexible on the alternative uses of resources 1 2 3 4 5 6 7 15 I reduce this disagreement by making differences seem
insignificant 1 2 3 4 5 6 7 16 I meet other riparian systems users at a mid-point of our
differences 1 2 3 4 5 6 7
17 I assert my opinion forcefully 1 2 3 4 5 6 7
18 I dominate arguments until the other riparian user groupsunderstand my position 1 2 3 4 5 6 7
19 I suggest we work together to create solutions to dis-agreements 1 3 5 7 2 4 6
20 I try to use other resource users ideas to generate solutions 1 2 3 4 5 6 7
21 I offer trade-offs to reach solutions in disagreements between user groups 1 2 3 4 5 6 7
22 I argue insistently for my stance 1 2 3 4 5 6 7
23 I withdraw when other riparian systems users confront me about a controversial issue 1 2 3 4 5 6 7
24 I side-step disagreements of this sort when they 1 2 3 4 5 6 7 25 I try to smooth over disagreements of this sort by making
them appear unimportant 1 2 3 4 5 6 7 26 I insist my position be accepted during a disagreement
with other resource users 1 2 3 4 5 6 7
27 I make our differences seem less serious 1 2 3 4 5 6 7 28 I hold my tongue rather than argue with other riparian
resource users 1 2 3 4 5 6 7 N I ease conflict by claiming our differences are tthiaL 1 2 3 4 5 6 7 30 I stand firm in expressing my viewpoints during a
disagreement with other riparian resource users 1 2 3 4 5 6 7
5
140
4 When you are in conflict with other watershed resource users to what degree do you consider yourself to influence how these resources should be used (Circle one number)
1 MORE THAN OTHERS 2 SAME AS OTHERS 3 LESS THAN OTHERS 4 NOT APPLICABT F TO ME
5 The organizations listed below make up the Oregon Watershed Improvement Coalition (OWIC) To which of these organizations do you belong Circle number(s) all that apply
YES NO
a PNW Section-Society for Range Management 1 2 b Oregon Environment Council 1 2 c Oregon Forest Industries Council 1 2 d Oregon Cattlemens Association 1 2 e Oregon Chapter Sierra Club 1 2 f Oregon Small Woodlands Association 1 2 g Oregon Trout 1 2 h Oregon Rivers Council 1 2 i Oregon Izaak Walton League 1 2 j The Nature Conservancy 1 2 k Others (specify) 1 2
6 If you belong to more than one Organization please write the letter(s) of those with whichyou have the strongest affiliations
7 How actively are you involved with these organi7ations Please list the committees andoffices you now hold or have held
Officecommittee Organization
(continue on the back of this questionnaire if needed)
141
6
II
8 Have you been involved in facilitating communication among users of riparian areasother than through OWIC
1 YES 2N 0
9 To that extent has this effort or these efforts been productive (Circle one number)
1 HIGHLY PRODUCTIVE 2 SOMEWHAT PRODUCTIVE 3 MINIMALLY PRODUCTIVE 4 NOT PRODUCTIVE
10 How important to you are each of the following means for acquiring information on resource usemanagement of riparian areas ((ircle number (s))
NOT SOMEWHAT LWPORTANT VERY IMPORTANT IMPORTANT IMPORTANTI
a General membership meetings 1 2 3 4 b Special membership meetings 1 2 3 4 c Newslettersmagazinesbrochures
Scientific Journals or other print (cica the specific source) 1 2 3 4
d_ Committee meetings 1 2 3 4 e Newspapers and news magazines
(Times Newsweek Range magazine etc) 1 2 3 4
f Friends neighbors and relatives 1 2 3 4 g Displays at fairs and other public
meeting places 1 2 3 4 h Government agencies (eg USFS
and BLM etc) 1 2 3 4 i Extension Service 1 2 3 4 j Other (please identify) 1 2 3 4
7
142
11 Where the ripanan areas consist of both public and private lands which type(s) of land should be managed with similar watershed resources management philosophy (Circle one number)
SHOULD SHOULD NOT
a_ All public land and all private land 1 2 b All public land and some private land 1 2 C All public land and no private land 1 2 d Some public land and all private land 1 2 e Some public land and some private land 1 2 f Some public land and no private land 1 2 g No public land and all private land 1 2 h No public land and some private land 1 2 1 No public land and no private land 1 2
DEMOGRAPHICS OF THE RESPONDENTS 12 Your current occupation (Please indicate your Le II)
13 What is your gender (Circle one number)
1 MALE 2 FEMALE
Education
14 What is the highest grade you attended in schoolcollegeuniversity
15 How many years of schooling
Your anonymity as a respondent involved in this survey will be protected to ensure confidentiality
143
8
16 Do you think that riparian zones resource usesmanagement is a controversial issue among the potential users (Circle one number)
7-- I YES 2N0
17 What is the degree of conflict (Circle one number)
1 SEVERE 2 MODERATE 3 MINIMAL
18 Do you believe that conflict management can be successful for this issue (Circle one number)
1 YES 2N0
144
9
Your comments or concerns are welcomed Use this space or attach additionalsheet of papers for your suggestions You may also note your concern in themargins of prior pages
Glossary
Watershed represents the entire catchment area of a stream or a system of the streams thatshares water discharge flow and drainage either through common inlets or outlets or bothof these
Riparian areazone is the green area immediately adjacent to water such as streams springs rivers ponds and lakes
Associated upland is the extension of the watershed area surrounding the riparian areaTherefore its vegetative and landscape status plays an important role in the yield qualityof the products of the riparian zones including the watershed resources
Watershed storage represents underground water storage in the soil and in underground aquifer
Aquifer recharge is the maintenance of the underground water table
Aesthetic and recreation use of watershed resource represents the degree of pleasure orleisure through observing natural scenic places and performing outdoor activities by theusers
Fish and wildlife habitat is a place for both fish and wildlife where they can live growbreed rear and nurture at their own liberty
Management philosophy dais witha way of logical thinking before starting to followany technological development and implementation actions
10
145
APPENDIX C
FOLLOW-UP POSTCARDS
Please return this post card if you have completedand mailed the questionnaire I am a member of The Nature Conservancy
Y NA ITE IS (Please print) The information that you provided is greatlyappreciated Would you like to receive a summary of the results (Please check one)
YES NO
1993
In the last couple of weeks you may have received a questionnaire about USES OF WATERSHED RESOURCES by mail
If you have already completed and returned the questionnaire please accept our sincerest thanks
If you have not returned the questionnaire we encourage you to do so Your participation in this study will be extremely valuable for our understanding about improving the qualify of watershed resource uses in Oregon
If we have not heard from you we will mail another questionnaire to you very soon
Thanks Riparian Zones Researchers
146
APPENDIX D
TABLES
Table 16 Frequency data on power status in influencing others
Less than Sane as More than others others others
Group na
Environmental 7 1591 29 6591 8 1818
Business 9 2308 21 5384 9 2308
Professional 2 1176 9 5295 6 3529
OWIC 2 1053 12 6315 5 2632
Total 20 1681 71 5966 28 2353
aNumbers of participants responding to question
147
Table 17 ANOVA results for power status effect on resource usemanagement behavior
Source SS df MS
Between groups 71 2 36 86 42
Within groups 4004 97 41
Total 4075 99
Group na Meanb SD
Environmentalist 44 198 59
Business 39 200 69
Professional 17 176 66
Total 100 195 64
aNumbers of participants responding to question bResponses scored on 3-point scale (1 = more than others 2 = same as others 3 = less than others)
Table 18 ANOVA results on usefulness of the conflict communicationfacilitation process
Source SS df MS p
Between groups 95 2 47 93 41
Within groups 1895 37 51
Total 1990 39
a Group n Meanb SD
Environmentalist 14 193 62
Business 12 217 103
Professional 14 179 43
Total 40 195 71
aNumbers of participants responding to question 6Responses scored on 4-point scale (1 = highly productive 2 = somewhat productive 3 = minimally productive 4 = productive)
Table 19 Comparison of mean ratings of importance of sources of information
Source of Information Environmental Business Professional
Newslettersmagazinesbrochur 328 (1) 320 (1) 327 (1) esscientific journals or other print
Government agencies 259 (2) 256 (4) 306 (2)
Newspaper and news magazines 257 (3) 238 (7) 267 (3)
Extension Service 221 (5) 282 (2) 261 (4)
Special membership meetings 213 (7) 252 (5) 244 (5)
Friends neighbors and 242 (4) 236 (8) 182 (9) relatives
Committee meetings 200 (8) 262 (3) 233 (7)
Displays at fairs and other 216 (6) 229 (9) 194 (8) public meeting places
General membership meetings 192 (9) 240 (6) 235 (6)
Note Numbers within parenthesis represent the rank order by total group means
149
Table 20 ANOVA results on importance of committee meetings as a source of information
Source SS df MS
Between groups 1016 2 508 506 01
Within groups 12044 120 100
Total 13060 122
Group na Meanb SD
Environmentalist 61 20C 13
Business 47 262 101
Professional 15 233 98
Total 123 228 103
aNumbers of participants responding to question bResponses scored on 4-point scale (1 = not important 2 = somewhat important 3 = important 4 = very important) plt10
Table 21 ANOVA results on importance of friends neighbors and relatives as a source of information
Source SS df MS
Between groups 486 2 243 308 05
Within groups 10178 129 79
Total 10664 131
Group na Meandeg SD
Environmentalist 65 242 88
Business 50 236 87
Professional 17 182 95
Total 132 232 90
aNumbers of participants responding to question bResponses scored on 4-point scale (1 = not important 2 = somewhat important 3 = important 4 = very important) plt10
150
Table 22 ANOVA results on importance of displays at fairs and other public meeting places as a source of information
Source SS df MS
Between groups 162 2 81 98 38
Within groups 10391 126 82
Total 10553 128
aGroup n Meanb SD
Environmentalist 62 216 98
Business 51 229 90
Professional 16 194 57
Total 129 219 91
aNumbers of participants responding to question bResponses scored on 4-point scale (1 = not important 2 = somewhat important 3 = important 4 = very important)
Table 23 ANOVA results on importance of government agencies as a source of information
Source SS df MS
Between groups 363 2 182 228 11
Within groups 10572 133 79
Total 10935 135
Group na Meanb SD
Environmentalist 64 259 89
Business 54 256 95
Professional 18 306 73
Total 136 264 90
aNumbers of participants responding to question bResponses scored on 4-point scale (1 = not important 2 = somewhat important 3 = important 4 = very important)
151
Table 24 ANOVA results on importance of extension services as a source of information organizations
Source SS df MS F
Between groups 1099 2 550 537 01
Within groups 13201 129 102
Total 14300 131
Group na Meanb SD
Environmentalist (EG) 63 221 102
Business (BG) 51 282 103
Professional (PG) 18 261 92
Total 132 250 104
aNumbers of participants responding to question bResponses scored on 4-point scale (1 = not important 2 = somewhat important 3 = important 4 = very important) plt10
LSD test PG EGltBG
Table 25 ANOVA results on importance of published serials as a source of information
Source SS df MS p
Between groups 18 2 09 20 82
Within groups 5157 113 46
Total 5175 115
Group n8 Mean b SD
Environmentalist 60 328 74
Business 45 320 63
Professional 11 327 47
Total 116 325 67
aNumbers of participants responding to question Responses scored on 4-point scale (1 = not important 2 = somewhat important 3 = important 4 = very important)
152
Table 26 ANOVA results on importance of general membership meetings as source of information
Source SS df MS
Between groups 731 2 365 445 01
Within groups 10500 128 82
Total 11230 130
Group a Meanb SD
Environmentalist 62 192 95
Business 52 240 87
Professional 17 235 86
Total 131 217 93
aNumbers of participants responding to question bResponses scored on 4-point scale (1 = not important 2 = somewhat important 3 = important 4 = very important) plt10
Table 27 ANOVA results on importance of special membership meetings as source of information
Source SS df MS
Between groups 431 2 215 199 14
Within groups 13335 123 108
Total 13766 125
Group na Meanb SD
Environmentalist 60 213 13
Business 50 252 109
Professional 16 244 96
Total 126 232 105
aNumbers of participants responding to question bResponses scored on 4-point scale (1 = not important 2 = somewhat important 3 = important 4 = very important)
153
Table 28 Frequency data on predicted success of conflict management
Yes No
Group n n
Environmentalist 62 886 8 114
Business 44 800 11 200
Professional 16 842 3 158
Total 122 847 22 153
Note X2 = 175 df = 2 p = 42
Table 29 ANOVA results on perceived degree of conflict intensity
Source SS df MS
Between groups 08 2 04 21 82
Within groups 2670 146 18
Total 2678 148
Group na Meanb SD
Environmentalist 74 274 44
Business 55 278 42
Professional 20 280 41
Total 149 277 43
aNumbers of participants responding to question bResponses scored on 3-point scale (1 = minimal 2 = moderate 3 = severe)
Table 30 Summary results of regression analysis for both environmentalist and business organizations
Dependent variable Independent variable SE a Beta t P R Sq
Multiple or single use School years 77 06 02 31 285 01 10
Abundance or scarcity views Land management 77 -18 09 -23 -201 04 05
Abundance or scarcity views Land management 77 -22 09 -28 -251 01 13 Conflict management -49 20 -27 -248 02
Control style -
Solution orientation Conflict management 77 46 27 19 170 09 04
Solution orientation Conflict management 77 51 27 21 188 06 08 Power status -27 15 -20 -179 08
Nonconfrontation ^
Note All significant at plt10
Table 31 Summary results of regression analysis for environmentalist organizations
Dependent variable Independent variable n o SE B Beta R Sq
Multiple or single use orientation
Abundance or scarcity views
Control style
Solution orientation
Conflict management
Land management
40
40
-78
-71
33
28
-36
-38
-235
-254
02
02
13
15
Nonconfrontation
Note All significant at p10
Table 32 Summary results of regression analysis for business organizations
Dependent variable Independent variable n B SE B Beta R Sq
Multiple or single use orientation
Abundance or scarcity views - - -
Control style Conflict management 37 -76 38 -32 -202 05 10
Solution orientation Conflict management 37 92 36 40 258 01 16
Solution orientation Conflict management 37 99 34 43 288 01 25 Power status -40 20 -30 -201 05
Nonconfrontation Conflict intensity 37 52 30 28 174 91 08
Note All significant at plt10
156
Table 33 Alpha results on deletion of item for resource use orientation (n = 183)
Corrected Squared Alpha Items of item total multiple if item resource uses correlation correlation deleted
Livestock vs wildlife habitat 47 64 85
Wildlife habitat vs fish habitat 31 31 85
Fish habitat vs livestock 57 61 84
Livestock vs water storage 41 46 85
Water storage vs fish habitat 61 57 84
Fish habitat vs aesthetic amp 42 40 85 recreation
Aesthetic amp recreation vs 50 41 85 livestock
Livestock vs aquifer recharge 52 62 84
Aquifer recharge vs wildlife 47 47 85 habitat
Wild habitat vs water storage 54 59 84
Water storage vs aquifer recharge 43 46 85
Aquifer recharge vs wildlife 50 46 85 habitat
Aquifer recharge vs 50 47 84 aesthetic amp recreation
Fish habitat vs 57 50 84 aquifer recharge
Water storage vs aquifer 48 42 85 recharge
Table 34 Alpha results on deletion of item for resource supply philosophy (n = 183)
Corrected Squared Alpha Items of abundance- item total multiple if item
scarcity views correlation correlation deleted
44 37 76
c 50 35 75
d 56 45 73
e 33 31 79
65 57 71
Note Descriotion of items (a through f) are given in the Uses of Watershed Resources instrument (Appendix B)
157
Table 35 Alpha results on deletion of item for conflict management styles (n = 105)
Corrected Squared Alpha Items of conflict item total multiple if item management styles correlation correlation deleted
Nonconfrontation
5 55 56 76
7 46 51 77
12 68 69 75
14 -06 21 82
15 42 45 77
23 53 56 76
24 68 70 75
25 47 36 77
27 23 30 79
28 29 23 79
29 37 44 78
Solution orientation 1 70 56 90
4 71 57 90
8 67 56 90
11 64 58 90
19 75 66 90
20 68 56 90
6 59 42 90
9 61 59 90
13 62 61 90
16 70 64 90
21 59 46 90
Control 3 32 28 77
1r1 37 25 76
17 52 44 73
18 60 53 71
22 64 44 70
26 51 9 73
30 41 39 75
Note See Appendix B for text of the items
Table 36 Correlation coefficients for OWIC (n = 19)
Multiple or Abundance or Solution single use scarcity Nonconfronta- orientation Control
Dependent variable orientation philosophy tion CMS CMS CMS
Multiple or single use 100 orientation
Abundance or scarcity philosophy -16 100
Nonconfrontation CMS 35 -35 100
Solution orientation CMS 16 -23 05 100
Control CMS 22 06 -16 -46 100
CMS = conflict management style
Table 37 Correlation coefficients for the environment group (n = 60)
Multiple or Abundance or Solution single use scarcity Nonconfronta- orientation Control
Dependent variable orientation philosophy tion CMS CMS CMS
Multiple or single use 100 orientation
Abundance or scarcity philosophy -20 100
Nonconfrontation CMS 22 00 100
Solution orientation -17 -23 -02 100
Control CMS -13 30 -31 -21 100
CMS = conflict management style plt01 one-tailed
Table 38 Correlation coefficients for the business group (n = 51)
Dependent variable
Multiple or single use orientation
Abundance or scarcity philosophy
Nonconfrontation CMSa
Solution orientation CMS
Control CMS
CMS = conflict management style plt001 one-tailed
Multi or Abundance or Solution single use scarcity Nonconfronta orientation Control orientation _philosophy -tion CMS CMS CMS
100
-25 100
02 -05 100
07 -49 -00 100
17 -11 -12 -18 100
Table 39 Correlation coefficients for the professional group (n = 19)
Dependent variable
Multiple or single use orientation
Abundance or scarcity philosophy
Nonconfrontation CMSa
Solution orientation CMS
Control CMS
CMS = conflict management style plt001 one-tailed
Multi or Abundance or Solution single use scarcity Nonconfronta orientation Control orientation philosophy -tion CMS CMS CMS
100
-35 100
45 -26 100
-16 -23 30 100
02 25 19 -67 100

Instructional Needs Assessment for Managing Conflict between Watershed Resource Users in Oregon
The OWIC Case Study
by
Ikram Saeed
A THESIS
submitted to
Oregon State University
in partial fulfillment of the requirements for the
degree of
Doctor of Philosophy
Completed November 11 1993
Commencement June 1994
APPROVED
Associate Professor of Educa ion in charge of major
he School of Education Director of he
Dean of Graduat chool
Date thesis is presented November 11 1993
Typed by researcher for Ikram Saeed
Redacted for Privacy
Redacted for Privacy
Redacted for Privacy
ACKNOWLEDGEMENTS
I am graciously thankful to almighty Allah who enabled
me to complete this project I appreciate the help of many
people and organizations who assisted in completing my
dissertation research I am forever thankful to my initial
Major Professor Dr Margaret Savige who guided me in the
design and development of the dissertation research and to
Dr William C Krueger a dissertation committee member
who guided my data collection and my understanding of
collaborative natural resource management issues I
express my sincerest thanks to the other committee members
Dr Wayne Haverson Dr Frederick W Obermiller and Dr
Arlene Holyoak for their encouragement and assistance
Because of Dr Saviges illness Dr Warren N Suzuki
graciously assumed the responsibility for guiding the final
completion of my research
I am thankful to all agencies and people who provided
financial and logistic support for my doctoral study
Pakistan Participant Training Program a joint government
cooperation between Pakistan and United States of America
My mentors Dr Agha Sajjad Haider and Dr Roger Kraynick
helped and encouraged me in my transition to the study of
instructional systems development My thanks extend to the
members of OWIC business environmental and professional
organizations who provided data to use for this study
Mawardi Hasan and Junaid Ikram for professional setting of
instrument and mailing arrangements and Chris Pyle for her
editing work
Finally to my parents Allah bless peace to the soul
of my father who died during my doctoral study my wife
Zahida Parveen my sons Junaid and Zubair and my
daughter Imama Haseeba who supported and prayed for my
success in my studies I am forever graceful
TABLE OF CONTENTS
CHAPTER
1 1 INTRODUCTION
Justification for the Study 2
Problem Statement
The OWIC Case An Example of Consensus
Conflict Management and Training
Background of the Study 3
Building 8
Intervention 10
Research Problem and Questions 13
2 REVIEW OF LITERATURE 15
Role and Limitations of Needs Analysis
Data Collection Techniques in Needs
Theoretical Framework of Conflict Management 38
Concepts and Theory of Needs Analysis 16
Concepts of Need and Needs Analysis 16
in Problem Solving 18
Needs Analysis and Training Development 22
Analysis 34
Credibility of Needs Analysis 35
Conflict Models 39
Theoretical Models of Conflict Management
Strategy d4
Theory of Conflict Management Styles 50
Constraints and Opportunities for Managing
Scarcity-Abundance Theory Assumptions 60
Natural Resource Use and Management 54
Issues of Multiple Use 54
Resources 59
3 METHODS AND PROCEDURES 66
Theoretical Framework
Population and Sample 68
Validity and Pilot Testing of
Data Collection
66
Instrument Development and Design 71
Survey Instruments for Measuring Behaviors 74
the Questionnaire 81
82
Data Analysis 83
4 RESULTS AND DISCUSSION 85
Results of Analyses of Needs Assessment Data 86
88 Resource Use Orientation
Resource Supply Philosophy 91
Conflict Management Style 94
Results of Analyses of Demographic Data 98
Gender 99
Years of Schooling 99
Power Status 101
Process Participation 101
Sources of Information 102
Riparian Resource UseManagement 103
Demographic Variables as Predictors 106
Credibility of the Instrument 109
5 SUMMARY AND CONCLUSIONS 115
118 Conclusions
122 REFERENCES
133 APPENDIX
APPENDIX A COVER LETTERS 133
APPENDIX D TABLES
APPENDIX B INSTRUMENT 135
APPENDIX C FOLLOW-UP POSTCARDS 145
146
LIST OF FIGURES
Figure Page
1 Conceptual model of needs assessment 25
2 Organizational elements model Three planning
domainslevels and scope of information 29
3 General model of instructional system design 33
4 Two-dimensional model of conflict management
styles 53
5 Watershed resource users needs assessment
(WRUNA) model 67
LIST OF TABLES
Table Page
1 Organizational elements with examples 30
2 Questionnaire return and use rate 70
3 Comparison of Cronbachs alpha coefficients
across scales 77
4 ANOVA results on resource use orientation 89
5 ANOVA results on resource supply philosophy 92
6 ANOVA results on solution orientation
management style 95
7 ANOVA results on nonconfrontation conflict
management style 95
8 ANOVA results on control conflict management style 96
9 Gender of respondents
10 ANOVA results for years of schooling
100
100
11 ANOVA results for power status
in influencing others 102
12 Frequency of response on involvement in
communication facilitation process 102
13 Descriptive summary of results on importance
of selected sources of information 104
14 Frequency data on type of riparian land
management 106
15 Internal reliability of the WRUNA-based
instrument 110
16 Frequency data on power status in influencing
others 146
17 ANOVA results for power status effect on resource
usemanagement behavior 147
18 ANOVA results on usefulness of the conflict
communicationfacilitation process 147
19 comparison of mean ratings of importance
of sources of information 148
20 ANOVA results on importance of committee
meetings as a source of information 149
21 ANOVA results on importance of friends neighbors
and relatives as a source of information 149
22 ANOVA results on importance of displays at fairs
and other public meeting places as a source
of information 150
23 ANOVA results on importance of government
agencies as a source of information 150
24 ANOVA results on importance of extension
services as a source of information organizations 151
25 ANOVA results on importance of published
serials as a source of information 151
26 ANOVA results on importance of general membership
meetings as source of information 152
27 ANOVA results on importance of special membership
meetings as source of information 152
28 Frequency data on predicted success of conflict
management 153
29 ANOVA results on perceived degree of conflict
intensity 153
30 Summary results of regression analysis for both
environmentalist and business organizations 154
31 Summary results of regression analysis for
environmentalist organizations 155
32 Summary results of regression analysis for
business organizations 155
33 Alpha results on deletion of item for resource use
orientation 156
34 Alpha results on deletion of item for resource supply
philosophy 156
35 Alpha results on deletion of item for conflict
management styles 157
36 Correlation coefficients for OWIC 158
37 Correlation coefficients for the environment group 158
38 Correlation coefficients for the business group 159
159
39 Correlation coefficients for the
professional group
Instructional Needs Assessment for Managing Conflict between Watershed Resource Users in Oregon
The OWIC Case Study
1 INTRODUCTION
The present study was an investigation into how needs
analysis could be used in developing training interventions
for resolving conflict among natural resource userinterest
groups The study focused on userinterest groups in
potential conflict over usemanagement of watershed
resources in Oregon riparian zones The purpose of the
study was to develop a needs analysis approach for use with
these groups Toward that goal a review of literature was
conducted to establish the theoretical framework for the
needs assessment and to investigate topics relevant to
natural resource management conflict behavior and
conflict management strategies
Based on the theoretical framework an instrument was
developed to assess selected behavioralattitudinal
characteristics of the target population These
characteristics were conflict management style resource
use orientation (single vs multiple) and philosophical
orientation regarding availability of resources (scarcity
vs abundance) The instrument was reviewed by an expert
panel revised and then administered to two groups one
the Oregon Watershed Improvement Coalition (OWIC) whose
members represented watershed resource usersinterest
groups and had demonstrated consensus building the other a
2
sample representing various business and environmental
usersinterest groups at potential risk of conflict over
watershed resource usemanagement issues as well as
interested professionals
The OWIC served as a case study on the premise that
there was evidence of consensus building and methods of
achieving and maintaining it within this group It was
assumed that the profile of the OWIC group would be the
ideal It was also assumed that the profile would
indicate certain predispositions suggested by the OWIC
literature and members namely conflict management style
tending toward consensus building multiple-use
orientation and abundance philosophy
Justification for the Study
Presently conflict management strategies are generic
in nature they do not identify the behaviors or attitudes
that should be addressed by a given group It was
hypothesized that conflict management requires real changes
in behavior and attitude and that these changes can best
be achieved by identification of the behavior and attitude
needing to be changed and based on that information
development of traininginstructional interventions
specific to the target group This study investigated the
needs assessment phase of the planning process
3
Why are training interventions needed Conflict among
natural resource userinterest groups exists because of
interpersonal conflict behavior and opposing attitudes
toward natural resource use and management Conflict
resolution between conflicting parties is a temporary
measure In other words conflict resolution strategies do
not work effectively to resolve or reduce conflict
permanently Sustainable conflict management is required
for reducing the level of conflict in the long run
Possibly this can be achieved by imparting consensus-
building skills through training interventions among
userinterest groups in potential conflict situation
Background of the Study
Problem Statement
Natural resource usersinterest groups have been
divided into two categories business and environmentalist
based on their vested interests (Susskind amp Weinstein
1980) Both of these usersinterest groups value the
natural resources differently in the perspective of
anthropocentric-nonanthropocentric ethics Anthropocentric
philosophy works on a basic principle that each human being
controls hisher own environment Daly (1991) explains
All nonhuman species and their habitats are valued only instrumentally according to their capacity to satisfy human wants Their intrinsic value (capacity
4
to enjoy their own lives) is assumed to be zero (p 259)
On the other hand a nonanthropocentric perspective is the
holistic view the human being is a part of the whole
universe which includes human and nonhuman species The
proponents of the nonanthropocentric view that all species
human and nonhuman have an intrinsic right to live
(Eisgruber 1992 E Rosenberg 1992 Shearman 1990) The
nonanthropocentric philosophy holds that it is not
desirable to carry out rational economic analysis because
it does not always seem to offer a framework from which to
address development issues (Shearman 1990 p 5)
The gap between natural resource users (business
organization members) and interest groups
(environmentalist) is increasing due mainly to the lack of
direct communication and social interaction between them
(Krueger 1992) They individually as well as
collectively are increasingly becoming involved in the
process of public policy making (US Department of
Agriculture [USDA] 1990) Natural resource interest
groups are increasingly lobbying for legislation case law
(court rulings) and administrative policies that suit
their own goals resource needs and priorities beliefs
perceptions and attitudes experiences power and position
and problem-solution and conflict-resolution styles
(Clawson 1987 Howell 1981 Knapp Putnam amp Davis 1988
Miller 1982 Petak 1980 Rahim 1992 Rifkin 1992
5
Temkin amp Cummings 1986 Ting-Toomey 1984 USDA 1990
Ware 1983) These groups are greatly empowered to
influence regional development and decision-making that
lead to enactment of environmental legislation (Sullivan
1984) For example the Oregon Watershed Improvement
Coalition (OWIC) was successful in getting cooperation of
different userinterest groups to lobby legislators for
passage of the bill to establish the Governors Watershed
Enhancement Board (Krueger 1992)
Conflict and Its Consequences
Conflicts occur among natural resource usersinterest
groups mainly because of differences in their modes of
resource uses and management For example in the context
of forestry management Stankey and Clark (undated)
explained that if the resource users are not handled
appropriately then the potential for inequities
frustration and dissatisfaction grows and the stage is
set for conflict (p 26)
In the discipline of organizational conflict Rahim
(1992) defined conflict as
a process of social interaction involving a struggle over claim to resources power and status belief and other preferences and desires The aims of the parties in conflict may extend from simply attempting to gain acceptance of a preference or securing a resource advantage to the extremes of injuring or elimination of opponents (p 1)
6
Conacher (1980) distinguished two kinds of resource
userinterest group conflict
ocational conflict conflict between two or more potential uses of the same land or resource and
group conflict conflict between those who wish to see the land used differently but who are not themselves direct potential users of that land or resource (p393)
Conflict may influence positively (eg competition
motivates to win the game) and negatively (eg
frustration causes loss in productivity or the wastage of
time and resources) depending upon the nature and situation
of the conflict (Ware amp Barnes 1983) Conflict can effect
different types of responses behavioral (eg hardening
of position and avoidance of face-to-face contacts)
substantive (eg roles and responsibilities) emotional
(eg perceptions and feelings) and personal and cultural
(eg racenational origin gender and ability
disability) (Ting-Toomey 1984 Ware amp Barnes 1983)
Divergent goals between userinterest groups tend to
originate and accelerate natural resource use and
management conflicts (Fege McCarthy-Ryan Munson amp
Schreyer 1989) Attitudes toward multiple use and
allocation of resources are major factors influencing the
goals of these groups
Historically the Multiple-Use Sustained-Yield Act of
1960 formalized the conflict between single-use and
multiple-use natural resource userinterest groups In the
multiple-use scenario every citizen assumes stewardship
7
rights for using and managing resources especially open
access or common property resources The federal
government has successfully launched many acts to allocate
use of and protect the resources (Frederick amp Sedjo 1991)
These formal arrangements have not resolved the problems
between the userinterest groups for a number of reasons
(eg lack of communication and misinterpretation of
resource use values) Conflict has intensified because
each interest group translates the Multiple-Use Sustained-
Yield Act to promote its own preferred uses and disregards
the other resource users needs (Clawson 1987 Libecap
1981 Nelson 1989 Stankey amp Clark undated USDA 1990)
The visions of single-use interest groups were
critically analyzed by Hess (1992)
Those visions have attended to what people and nature ought to be not to what they could be in an environment of freedom and diversityThey have weakened our faith in the ability of people to live responsibly and in harmony with the land of the western rangeThey have diminished the ecological potential of human diversity (p xvii)
Most prevailing policy law and business systems
regarding watershed resources in America and other parts of
the world are operating under scarcity assumptions for
allocating resources with little or no regard to abundance
assumptions for sharing resources According to scarcity
philosophy each potential resource user must look out for
hisher own share The major underlying assumption behind
this view is that there is not enough resources for
everybody so each user will compete with other users for a
8
share of the limited resources and will get less than he or
she wants (Howell 1981 Krueger 1992) Conflict is
inevitable because the system is built around win-lose
criteria rather than cooperation (Ware amp Barnes 1983)
The concept of abundance theory was explained by
Krueger (1992)
The assumptions of this theory are There is more than enough people are basically needy not greedy and understanding is the best strategy (p 38 authors emphasis)
If[resources] were managed [to promote sound ecological and economical foundations]they would develop to their potential (p 39)
Scarcity assumptions encourage conflicts whereas
abundance assumptions discourage or mitigate conflicts
Hence the abundance philosophy of sharing resources would
facilitate the process of conflict negotiationconsensus
building (see Krueger 1992 Leritz 1987)
The OWIC Case An Example of Consensus Building
Consensus building between interest groups is
essential for fair use and effective management of natural
resources An example of consensus building among special
interest groups that potentially have conflicting stakes is
the Oregon Watershed Improvement Coalition (OWIC) Formed
in 1986 the OWIC promotes effective use and management of
riparian resources in Oregon It was created with a
mandate to develop communication among various
9
userinterest groups who are potentially at risk of
conflict for meeting their alternative resource use and
management needs The potential watershed resources are
used for livestock forage fish and wildlife habitat water
storage aesthetic enjoyment and recreation and aquifer
recharge
According to OWIC guidelines each member has full
liberty to participate in the affairs of OWIC for enhancing
understanding between members as well as among others To
avoid power relations between members the OWIC has no
formal hierarchical structure The OWIC operating
strategies allow each member to share hisher concerns
regarding management of site-specific watershed issues
Thus all the decisions made by the OWIC members are based
on mutual consensus building (see Krueger 1992)
Presently OWIC has 20 members including a publicist
Most members represent different regional and state
organizations Six are environmental groups Oregon Izaak
Walton League Oregon Trout Oregon Environmental Council
Pacific Rivers Council Oregon Chapter Sierra Club and The
Nature Conservancy Three of the organizations fall into
the business group category Oregon Cattlemens
Association Oregon Forest Industries Council and Oregon
Small Woodlands Association A professional association
the Pacific Northwest Section of the Society for Range
Management is also represented Although the business and
environmental interest groups continue to have conflicting
10
viewpoints regrading the use of riparian areas consensus
is reached among them
Diffusion of information to OWIC members is a process
of consensus building Simultaneously the OWIC members
have striven to bring along the constituent organizations
which they represent smoothing out the heterogenous
effects and achieving consensus among them
Conflict Management and Training Intervention
Conflict management strategies are widely discussed in
the literature on communication business and industrial
organizations social psychology and environmental
protection science Contemporary theories on conflict
management suggest that conflicts can be successfully
mitigated or reconciled if the participating interest
groups
a Build trust between each other
b Understand each others concerns
c Incorporate conflict management styles values
d Provide opportunity for joint fact finding (or
search for common groundsneeds) and
e Encourage cooperation and collaboration
(Krueger 1992 Susskind amp Weinstein 1980 Ware
amp Barnes 1983 Wondolleck 1988)
Since the mid 1970s academicians and practitioners have
explored conflict management techniques as mentioned
11
above rather than traditional adversarial practices
inherent in conflict resolution models Ethical models of
conflict management are referred to by terms such as win-
win no-lose collaborative integrative and system
(Filley 1975 Howell 1981 Nadler Hackman amp Lawler
1979 Rahim 1992)
The credibility of abundance philosophy for resource
use and management has been empirically tested by social
scientists who accept abundance theory as a fundamental
policy reject conventional narrowly defined rational
economic analysis (cost-benefit) and psychological models
(Conacher 1980 Rutte Wilke amp Messick 1987)
An appropriate training process may efficiently and
effectively enable learners to acquire requisite skills
knowledge and attitudes In addition it is relevant and
worth doing despite the fact that it may involve more
resources and be more expensive to design than generic
training (Talarowski 1982 Spitzer 1981) An appropriate
and meaningful training intervention can only be prepared
if all the potential participating interest groups are
directly or indirectly involved in the process of designing
training materials (Rahim 1992) For example all the
potential conflicting interest groups should provide
personal information regarding their philosophy of natural
resource use and management then the target based training
interventions can be developed
12
Literature on training and program development
frequently referred to instructional systems design (ISD)
models The concept of the ISD has been popular in
instructional program planning since the 1960s An ISD
model is designed to develop specific meaningful and
effective curriculum by involving the participation of
potential learners facilitatorsteachers and the
community An instructional specialist conducts a number
of analyses including needs assessment the most critical
element in the training needs analysis phase of the ISD
model (Okey 1990 Rosenberg 1982) The needs assessment
is a means of determining gaps in performance or
productivity (Okey 1990 p 28) The needs assessment is
useful in determining appropriate problem-solving technique
(Kaufman amp English 1976 Lewis amp Bjorkquist 1992
Rosenberg 1982 Tesolowski Newton amp Cureton 1988)
Training professionals employ a number of means to
identify the need for training interventions The key
means are observation interview inventory performance
system review and survey questionnaire (Kaufman 1988
Rossett 1987) Each technique has its own merits and
demerits depending upon the goals and objectives of the
data collection and availability of time and financial
resources Little has been reported about identifying the
need for training interventions among groups in potential
conflict over natural resource use and management issues
13
Research Problem and Questions
The specific problem addressed by this study was
What is an effective method for identifying potential needs
for meaningful training interventions when the goal is to
manage conflict by achieving consensus building among
watershed resource usersinterest groups in Oregon
Following are the research questions which were
investigated in this study
1 Do the conflict management style and natural resource
use and management philosophy of the OWIC members
differ from the assumed ideal profile
2 What are the discrepancies if any between OWIC
members and the members of constituent organizations
in regard to
a Preferred conflict management style (ie
nonconfrontation solution-orientation or
control)
b Relationship between conflict management style
and power status gender and source of
information for each group
c Relationship between conflict management style
and resource use orientation (single vs
multiple) and resource availability philosophy
(scarcity vs abundance) under the given
demographic circumstances
14
3 How much variance in the conflict management styles
can be accounted for as main effect of individual
organization and group differences
4 How can profiles of conflict management style in
combination with other independent variables be used
to compare differences within and between the
userinterest groups (eg OWIC vs constituencies
and environmentalist vs business)
a What demographic variables may affect
preferred conflict management style
b What demographic variables may affect attitudes
toward natural resource use and management
15
2 REVIEW OF LITERATURE
Most natural resource mediation tasks have been
conducted haphazardly or temporarily by the relevant
discipline experts based on their vested interests or
judiciary services (Amy 1987 Bingham 1986) Review of
the literature revealed no research on the use of needs
analysis in developing training interventions when the goal
is conflict resolution
The present study was an investigation into how needs
analysis could be used in developing training interventions
for resolving conflict among natural resource userinterest
groups The study focused on userinterest groups in
potential conflict over usemanagement of watershed
resources in Oregon riparian zones The purpose of the
study was to develop a needs analysis approach appropriate
for use with these groups and to the training development
problem
This review is divided into three sections The
first section discusses literature on needs analysis
concepts and theory the second on conflict management
theory and concepts and the third on natural resource use
and management specifically that dealing with multiple use
issues and scarcityabundance assumptions theory
16
Concepts and Theory of Needs Analysis
Concepts of Need and Needs Analysis
Concepts of Need
The concept of need has been presented in a myriad of
ways (Kowalski 1988 Monette 1977 1979) In adult
education literature Monette (1977) identified four
categories of need basic human need felt and expressed
need normative need and comparative need
1 Basic human need refers to a deficient state of
any individual Needs of this kind are either
innate (eg security) or acquired (eg
occupational achievement) In general there is
no unanimous agreement on what constitutes the
basic human needs of any society
2 Felt or expressed need refers to an individuals
want or desire For example individuals desire
to be skilled professionals drive them to
complete the required courses to qualify for the
requisite professional degree
3 Normative need refers to the gap between a
desired standard and the standard that actually
exists (Monette 1977 p 118) Kaufman and
English (1976) referred to this gap as ends or
outcomes (eg learning for self or society
17
satisfaction) rather than means (eg study aids
or facilities) The individual or group whose
performance falls short of a desired standard is
termed to be in need Normative needs are prone
to change from time to time
4 Comparative need refers to the difference between
what one receives (or has access to) and another
does not For example if one person receives
services that another does not receive the
person not receiving the services is said to be
in need Comparative need is not considered to
be an appropriate measure of real need
Kaufman (1988) defined need as a verb speaks to
means need as a noun speaks to gaps in results (p 14)
A problem is not a problem unless there is a needgap and
motivation to meet the need Symptomatic needsprovide
clues to identify real needs in terms of gap [ie ends
rather than means] (Nanette 1977 p 124)
Concept of Needs Analysis
Needs analysis is considered to be a diverse tool for
determining learning skills knowledge and attitudes in
respect to competence (ability to perform the range of
skills) relevance (usefulness of those skills that are
situation specific) and motivation (ones predisposition
to improve skills) (Monette 1977 p 125) In the
literature the terms needs analysis needs assessment
18
discrepancy analysis gap analysis and means-ends analysis
are treated as synonymous however as this discussion will
show each may take on separate meaning depending on its
context For the purposes of this study needs analysis
and needs assessment mean the same
Different disciplines tend to use different terms to
describe essentially the same concept of needs analysis
For example the concept of needs assessment applications
in a business environment is called a training needs
assessment and in an educational setting an educational
or instructional needs assessment (Kaufman 1982 Masberg
1992 Rossett 1987 Zemke amp Kramlinger 1989)
Role and Limitations of Needs Analysis in Problem Solving
It is almost mandatory to use needs analysis to
investigate optimal performance current performance
feelings of learners and facilitator causes of the
problem and suggested alternative solutions to the
problem The literature review revealed that most training
professionals and instructional technologists agreed that
needs analysis is an appropriate tool for-determining
problem-specific instructional interventions Spitzer
(1981) stressed the justification for relevant needs
assessment
Inappropriate training materialscould have easily been avoided The most important thing is to
19
investigate the performance system in which the user of the training is going to have to apply the new learning (p 37)
Analysis of context and client system is the function
of needs assessment It includes the histories
traditions policies and philosophical orientations of the
individualsinstitutions In this perspective the
opportunities and constraints that influence the planning
process are revealed
The limitations of needs analysis particularly
discrepancy analysis and means analysis were noted in the
literature
Discrepancy Analysis
According to Lewis and Bjorkquist (1992) discrepancy
analysis is a strategy for diagnosing and solving problems
It borrows principles from problem-solving theory that is
grounded on model strategies followed by successful
managers Historically this approach has been applied by
business and industrial professionals to solve problems
However little research is available on how successful
experts have processed the information for meaningful
problem solving
According to Rossett (1987) and Mcnette (1977)
consequent upon the study of the various sources and the
significance of the gapdiscrepancy between where they
are and where they want to or should be the extent of
gap justifies whether training interventions are needed
20
The gap may not always be abridged by employing the
training needs analysis approach however because problem
performance may be due to factors other than educational
training needs such as administrative mismanagement
environmental change motivational incentives and changes
in reward system (Okey 1990 Rosenberg 1982)
Discrepancy analysis is defective in schematic
building a prerequisite for the development of problem-
solving expertise Its static nature conflicts with the
uncommon nature of needs analysis questions The large gap
between novice and expert professionals tend to jeopardize
the needs analysis process Also there are logistic
problems uncertainty and mistrust
Means-Ends Analysis
Means-ends analysis is popular in the cognitive
sciences (Kaufman 1987 1988 Lewis amp Bjorkquist 1992
Rossett 1987) In discussing the theory of needs analysis
in detail Lewis and Bjorkquist (1992) referred to both
means-ends analysis and discrepancy analysis The
remainder of this section draws heavily from the writings
of Lewis and Bjorkquist (1992) and Gick (1986)
Gick (1986) explained the logic of means-ends analysis
is in reducing the difference between the current state
and the goal of the problem by applying approximate problem
solving operators (p 100) Means-ends analysis is
applied recursively until the goal is reached (Gick amp
21
Holyoak 1979 Kaufman 1972) Newell and Simon (1972)
reported that means-ends analysis is the major method for
carrying out problem-solving strategy especially under the
conditions when the content domain is unknown
Sweller and Levine (1982) documented that it is
theoretically possible for a problem solver [using means-
ends analysis] to attain the goaland yet to learn
absolutely nothing concerning the problem structure (p
464) Although it is recognized that problem solving can
take place without learning (Gick 1986) the possibility
of learning is not excluded (Sweller amp Levine 1982)
Thus it may be possible to speed up the process of
learning by using recursive strategy (ie means-ends
analysis) rather than standard instruction (Gick 1986)
Factors Affecting Problem Solving
Internal and external factors significantly affect
problem-solving strategies External factors appeal to
the domain from which the problem is drawn and the form
in which the problem is presented (Lewis amp Bjorkquist
1992 p 46) Internal factors include general and
domain-specific problem-solving knowledge
Smith (1991) a biologist explained that forward
reasoning and domain-specific procedures are used to solve
a standard problem and weaker procedures namely means-
ends analysis and trial-and-error for a problem that is
outside the domain of expertise Groen and Patel (1991)
22
experts in the field of medicine agreed with Smith that
successful problem solving is directly associated with
forward reasoning They synthesized their problem solving
theory from a number of relevant sources
Experts readily comprehend new information and integrate it into an existing knowledge base This results in an enhanced ability to recall and to chunk information It also results in the ability to cope with routine situations rapidly and efficiently by the use of forward reasoning through a limited problem search space (p 39)
The product of backward or recursive reasoning is
assumed to be incomplete compared to forward reasoning
because of differences in expertise between novice and
expert professional levels Novice rules do not map onto
expert rules (Groen amp Patel 1991 p 40) More empirical
studies are needed on problem-solving strategies like
means-ends analysis for training development purposes
Needs Analysis and Training Development
Needs Analysis Models
Marlette (1977) described two broad classifications of
needs assessment models
I Individual appraisalproblem-need models The
clients determine their own learning needs either
collaboratively or non-collaboratively
Collaborative models include both one-to-one approaches (as between client and counselor) and group approaches The self-appraisal model is non- collaborative diagnosis although the solitary learner may choose to use scales and other instrumented
23
exercises or a group setting (as in value clarification) or performance analysis techniques to determine training needs (sometimes also used collaboratively) (Monette 1977 p 120)
This type of model is suitable for problem remedial rather
than improvement in educational programs
2 System discrepancygoal-identification models
Educational needs of the social system are determined
through discrepancy analysis (the difference between
existing and desired goal) This type of model works in
defining and redefining the situation rather than focusing
on remedial aspects (eg improvement in the educational
programs) This type of model works in defining and
redefining the situation rather than only focusing on
remedial aspects Freires double-loop learning model is
representative of this type of model
Models in both classifications may use internal or
external information sources or both for planning
educationaltraining programs Internal-source models
obtain the required information from sources within the
organization (Kaufman 1988) These models are used in
non-integrated program planning (Kowalski 1988) An
intervention is introduced into an organizational system
a change occurs in the organization but goals and
objectives of the organization do not change (Kaufman amp
English 1976 p 69)
External-source models compile information from
sources outside the organization These models are used
24
in integrated program planning (Kowalski 1988) When an
intervention is introduced into an organizational system a
change may be reflected in the objectives and goals of the
organization This type of planning may benefit
interrelated organizations in a number of ways
1 Improve the feedback mechanism between the users
2 Reduce the margin for planning error
3 Update informed decisions about the content and
context of the training material (Kaufman amp
English 1976 Kowalski 1988 Masberg 1992)
Kaufman (1988) suggested guidelines for choosing the
appropriate needs assessment model
The choice of [needs assessment] model and techniques should be madeon the basis of what a needs assessment has to deliver for functional planning to take place not simply on the case of doing one (p 87)
A conceptual model of needs assessment is presented in
Figure 1
The System Approach Concept
This section highlights the main features of needs
assessment and problem solving from the perspective of the
system concepts The system approach concept became
popular among human resource performance specialists in the
1960s and 1970s It was introduced under a variety of
names including educational engineering system approach
systems approach and systematic approach (Kaufman 1988)
25
ORGANIZATION ELEMENTS
Means Ends
Inputs Products
Processes Outputs
Outcomes
NEEDS ASSESSMENT
Planning Levels Planning Partners
Middle Learners
Comprehensive FacilitatorsPlanners
Holistic CommunityOther Users
Source Adapted from Kaufman (1988)
Figure 1 Conceptual model of needs assessment
The system approach concept has gone through a series
evolutionary processes but all system models are similar
in certain features
- results-orientation - clear measurable objectives - systematic procedures for reaching stated objectives - accounting for the dynamic relationship among the parts of the system
26
requirement for continuous evaluation and revision (Kaufman 1988 p 5)
System approaches vary Kaufman (1988) distinguished
old system models with the updated system model in these
words
Older modelsfocused primarily on organizational or learning objectives [The new] system (no third s) modelsencouraged defining goals and objectives external to the organization as the proper place for educational planning Only a [new] system approach formally considers the individual and collective good of and for peopleOlder approaches tend to make the current system more efficient in reaching current goals and objectives while this one also helps to identify new visions and identify new outcomes (p 6)
The new system approach is external humanistic or people-
oriented practical effective and efficient innovative
and relevant future-oriented and result-based (Kaufman
1988 Sork amp Caffarella 1989)
The system approach to educational planning deals with
problem identification (via needs assessment) and
resolution process (via problem solving) The needs
assessment phase involves identifying scoping selecting
and prioritizing needs The problem-solving phase is a
six-step process (a) identify problems (priority needs)
(b) determine alternative solutions for meeting needs (c)
select solution tactics from the available alternatives
(d) implement the selected solutions (e) evaluate
performance effectiveness and efficiency and (f) revise
as required at any step in the problem-solving process
(Kaufman 1988)
27
The system analysis tool is primarily used in
performing discrepancy analysis using internal and external
needs assessment educational planning (Kaufman 1987 1988
Rossett 1987) It guides how to get from what is
(present) to what should be (futuredesired) (Kaufman
1988)
A gap may be determined between present and desired
levels of the soft and hard sensing needs information
depending upon the identified elements of the required
needs Soft need sensing data include perceptions
attitudes and personal values Hard need sensing
information is the actual gaps between human and
organizational performance needs derived through
observation or recording (Kaufman 1987 1988) The
identified needs may be prioritized by rating ranking or
Knowles filter analogy criteria (Kaufman 1987 1988 Sork
amp Caffarella 1989)
A meaningful decision-making process would be
facilitated through arriving at predicted futures
alternative solution scenarios and agreement on common
interests The techniques used for prediction of future
needs are assumed to be creative and dynamic Future needs
could be identified by using methods such as trend
extrapolation Delphi technique scenario construction
cross-impact analysis and technology assessment (Kaufman
1987 1988 Sork amp Caffarella 1989) The system approach
helps one to understand the interrelation and interaction
28
among the pieces of the whole system when educational
interventions are needed to plan develop and evaluate a
regular changing process (Kowalski 1988)
The Organizational Elements Model
The Organizational Elements Model (OEM) was developed
by Kaufman to provide a framework for properly identifying
needs analyzing them defining useful objectives and then
selecting effective and efficient educational interventions
(Kaufman 1987 1988 Masberg 1992) By employing the
OEM we can learn from each other (Kaufman 1988 p 29)
The five elements of OEM are input processes products
outputs and outcomes (see in Figure 2 and Table 1)
This model deals with different levels or domains of
educational planning namely middle comprehensive and
strategicholistic Middle level planning deals with the
performance improvement of the employees or the learners
This level involves elements like inputs processes and
products (Kaufman 1987 1988) Comprehensive planning
level deals with the performance improvement of the total
organization whatever the organization uses does and
delivers to itself It includes input process product
and output elements for educational planning This level
performs the educational planning for an entire
institution for example a school university or academy
The strategicholistic level of represents a region rather
than only a single institution (Kaufman 1988)
29
Inputs Processes Products Outputs Outcomes
Internal External
Middle Level Planning
Comprehensive Level Planning
HolisticStrategic Level Planning
Source Adapted from Kaufman (1988)
Figure 2 Organizational elements model Three planning domainslevels and scope of information
30
Table 1 Organizational elements with examples
Organizational Examples Elements
Inputs Learner (raw material) -goals
-needs -law -politics -values perceptions amp attitudes -quality of life -resource endowments
Processes Management (how-to-do-it) -interaction status
Educational means -mediating
Products Individual interventions (material) (enroute-results)
Outputs Reduced conflict (products of the system delivered or deliverable to society)
Outcomes Policy consensus building (the effects of outputs in and for society and the community
Source Adapted from Kaufman (1988)
Kaufman (1987) suggested that there is a need to
consider all potential planning partners In an
educational setting educational planning partners
providing soft and hard needs sensing data would be the
1 Learners the affecters of the needs assessment
planning results
31
2 Teachersfacilitatorseducational planner the
implementors of the needs assessment results and
3 Communitysociety receivers of the needs
assessment results (Kaufman 1987 Masberg
1992)
Kaufman (1987) cautioned that each participant in
educational planning should work with the same definitions
and descriptions of the needs analysis For example
Kaufman (1987) defined needs analysis as a need identifies
and documents a gap in results [rather than gaps in
process ie inputs and processes referred to as quasi
needs] (p80)
The needs analysis model reveals not only the
perceptions of the participants but also keeps the
participants in touch with the world of work to which they
are supposed to sell their product during the process of
planning educational objectives (Kaufman amp English 1976)
These types of models can be systematic or non-systematic
Instructional System Design Models
Instructional system design (ISD) models are system
approaches for not only looking at the nature of the tasks
to be performed but also figuring out possible ways to
assess the skills knowledge and attitudes concerning
performance
Robert Gagne and his colleagues are considered to be
significant contemporary contributors to the development of
32
the ISD model concept (Rossett 1987) The theoretical
basis for ISD modeling can be traced to the works of Dewey
London Tyler and Knowle on adult learning theory and
curriculum development The major elements of educational
planning described by London in the 1960s concerned the
decision-making process (Monette 1977 Sork amp Caffarella
1989)
The original ISD model was developed during World War
II to address the technological as well as skill
knowledge and attitudinal requisites for performing
military tasks (Rosenberg 1982) After the war educators
began using ISD models to develop training interventions to
meet supervisors needs in the area of business and
industrial development (Kaufman 1988 Lewis amp Bjorkquist
1992 Rossett 1987) They were introduced to replace
generic training models to deal with needs associated with
problem performance new technology and regular training
programs The ISD models increased the likelihood of
meaningful training development that met the needs of both
organization and learners Large corporations such as ATampT
have adapted ISD models to meet their training development
needs ISD models have gone through a series of changes
and probably will continue to change to meet the fluid
needs of learners educatorsfacilitators and community
(Kaufman amp English 1976 Monette 1977 1979 Rossett
1987)
33
Rosenberg (1982) and Rossett (1987) described ISD
models as having five phases analysis design
development implementation and evaluation (Figure 3)
These five phases were discussed in detail in a systems
context by Kaufman and English (1976) Kaufman and English
had suggested an additional step a feed-back-loop This
was covered in the evaluation phase of Rossetts (1987)
vision of the ISD model called the ADDIE model
Analysis Design Development Implementation
Needs Assessment
Facilitator Learner Other users
EVALUATION
Source Adapted from Rosenberg (1982)
Figure 3 General model of instructional system design
The perspectives of Rossetts ADDIE model are
comparable to those of the Kaufman and Englishs system
planning approach The approaches are alike in their
phases and analysis For example in both approaches
instruction is planned and produced in the development
phase and the conduct and impact of the instruction is
assessed in the evaluation phase (Okey 1990)
34
Needs analysis is the most important component of the
ISD model for arriving at a rational management system for
any institutioncommunity Kaufman and English (1976)
addressed the strengths of needs assessment
[It] allows all partners to act upon decisions based upon logical and consensual bases and provides a referent for changing decisions once made and found wanting or requiring change due to additional information and experience (p 47)
Data Collection Techniques in Needs Analysis
Needs assessment information can be collected in a
number of ways survey questionnaires (mail face-to-face
and telephone) checklist interview observation self-
reported interpretive activities test performance
analysis self-assessment instruments job needs and task
analysis (Dillman 1978 Kowalski 1988 Masberg 1992
Rosenberg 1982 Rossett 1987 Sork amp Caffarella 1989)
Whatever the data analysis techniques used the purpose of
the needs assessment should be stated clearly and precisely
in the language and at the language level of the
respondents (Kaufman amp English 1976 p 2)
Survey instruments are suitable for examining the
feelings perceptions and actual occurrences (Masberg
1992 Rossett 1987) The survey instrument for conducting
the needs assessment should allow for respondents to talk
about means and not definitively about ends (Kaufman amp
English 1976 p 58)
35
Credibility of Needs Analysis
In general a paucity in the literature was observed
in the area of needs analysis and its philosophical
orientations Monette (1977 1979) apprised the
philosophical orientations of needs assessment drawing
support from Freire Knowles and Knox that needs analysis
is inevitable until and unless values ethics aesthetic
and politics are discussed along with the productivity
status of improved scientific technologies Monette (1979)
supported the concept that appropriate instructional
interventions could be developed through better
understanding of the problem situation He discussed the
issue raised by Tylers curriculum development theory
that training objectives ought to be based on studies of
contemporary life learners and subject-matter specialist
in question Monette (1979) addressed Freires
instructional models for valuing educational activities
and double-loop learning training modes The aim of this
discussion was to justify the philosophy of education
which is a necessary and inescapable responsibility of an
educatorplanner
Instructional designers have questioned under what
circumstances needs analysis should be performed (Kaufman amp
English 1976 Kowalski 1988 Monette 1977 Rossett
1987) Rossett (1987) expressed the problem this way
36
How to do it Where [to] start What do you say or write or observe In what order should the study occur When are you finished What do you do with what you have learned (p 3)
Kowalski (1988) mentioned other reasons for the needs
analysis approach not being commonly used in designing
traininginstructional interventions Firstly few
empirical studies are available in which this planning
approach has been used thus there is a big gap between
theory and practice (Sork amp Caffarella 1989) Secondly
many instructional planners believe that they are not
competent enough to employ the needs assessment tool
successfully Lastly cost-effectiveness and time
efficiency are concerns
In the literature Sork and Caffarella (1989) found
several reasons given for the gap between theory and
practice
1 Practitioners adopt short-cut methods
2 Contextual factors largely determine how
planning is done
3 Planning theory is irrelevant to practice
Enhancing the Credibility of Needs Analysis
It might be more useful to focus on testing and
pondering the adequacy of ones explanations rather than
focus only on the problem-solving approach (Lewis amp
Bjorkquist 1992 p 43) It is the opinion of many
professionals that problem-solving strategies are not
37
always useful for resolving each kind of problem That is
problem-solving strategies vary from one case to another
thus instructional values may be better guided through a
careful study of cases as if they were a vehicle for
building scheme (Lewis amp Bjorkquist 1992 p 47)
A training professional may learn a lesson from the
theory of successful problem solving for future uses
Perez (1991) translated successful problem solving
strategies into the domains of troubleshooting He said
that it is necessary first to define what skills
knowledge heuristic and cognitive processes transfer from
diagnosis and troubleshooting to other situations
(p 147) For example to understand and teach about
general problem-solving strategies one should know how
domain-dependent (local) knowledge and domain independent
(global) knowledge are to be combined with heuristic
executive control and self-regulatory processes (Perez
1991 p 148)
Many organizations have accepted the worthiness of the
needs assessment tool (Rossett 1990 Tesolowski et al
1988) Rossett (1990) suggested ways to enhance the
recognition of training needs assessment Rossett (1990)
suggested ways to enhance the validity and reliability of
training needs assessment One way would be to change the
focus of the training professionals from what to how
Another would be to replace the terms needs analysis and
needs assessment with other terms or phrases in the
38
vocabulary of specific training programs depending upon
the situation of the target organization For example
change the name from needs analysis to planning
Rossett concluded that when management does not
support needs analysis trainers need to assert themselves
He found that doctors engineers and architects would not
initiate projects or interventions until and unless a
careful study was done of client needs
Theoretical Framework of Conflict Management
Effective management of conflict among userinterest
groups is critical to successful natural resource
protection and use allocation No conscionable society can
afford to waste potential riparian zones watershed resource
endowments due to bickering between greedy and selfish
resource users
At the time of the present study only a few studies
were available that showed successful resolution in
environmental disputes (Conacher 1980 Mernitz 1980
Susskind amp Weinstein 1980 Wondolleck 1988) In the
following discussion most of the concepts and theory are
drawn from literature on organizational conflict
management The focus is on the communicative types of
conflict
Before proceeding further with this discussion there
is a need to distinguish between the concepts of conflict
39
management and conflict resolution Boulding (1968)
addressed this issue when he questioned whether
resolution was the right word Perhaps management would have been a better word for the distinction between constructive and destructive conflicts is not necessarily the same as the distinction between those which are resolved and those which are not Conflicts are sometimes resolved in ways which are highly undesirable for one party if not for both Sometimes there is a need for protracting conflict and for keeping it unresolved perhaps by diminishing its intensity and increasing its duration Thus the more neutral word management may better describe the objectives of our enterprise though we are interested in looking at conflict from the point of view of both parties (p 410)
Organizational conflict management theory does not provide
precise guidelines regarding maintenance levels of conflict
under general and specific situations (Rahim 1992)
However in contrast conflict resolution theory does not
provide for any level of conflict to be maintained
Conflict Models
Successful conflict management requires skills in
communication and an understanding of the concerns of all
parties involved (Mayer 1990 Nadler et al 1979 Putnam
amp Pool 1987 Witteman 1986) A prerequisite to managing
a conflict situation is a clear understanding of the nature
of the conflict and why it has arisen (Witteman 1986)
Conflict management models tend to be situational models
(Pondy 1967 Putnam 1988 Putnam amp Wilson 1982 Thomas
1976 Wilson amp Waltman 1988 Womack 1988b) The general
40
types of theoretical models of conflict management are
bargaining bureaucratic and systems (Pondy 1967 Putnam
amp Pool 1987 Seiler 1963 Thomas 1976 Thompson 1960)
Bargaining Model
This model deals with the potential conflict which
arises among the interest groups due to excess of the
aggregate demand over the supply of resources at hand
Competition for the scarce resources leads to frustration
(Bower 1965 Howe 1979 Pondy 1967 Seiler 1963) The
situation can be relieved either by increasing supply or
decreasing aggregate demand (Pondy 1967) In a
competitive market environment each party generally
attempts to gain a larger slice of the pie instead of
working together to contribute toward a larger pie
However Walton and McKersie (1965) referred to conflicts
of this type as having underlying potential for both
integrative (cooperative) and distributive (competitive)
subprocesses The government capital budgeting process
between legislative and executive interest groups is a
practical example of the bargaining model in action (Pondy
1967 Walton amp Dutton 1969)
41
Bureaucratic Model
This model taps the hierarchical relationships along
vertical dimensions that is authoritypower relations
(Pondy 1967 Seiler 1963) Typically senior members or
those in high-rank positions in an organization rule over
junior members or those in lower-rank position (Pondy
1967) However this relationship of control is distorted
when actors on either side do not behave accordingly
Distortion in authoritypower relations can lead to
disagreements among the superiors and the juniors peers
and subordinates (Pondy 1967 Putnam amp Pool 1987) The
conflict problem between seniors and juniors can be
remedied to some extent through encouraging the
participative role of the leaders (eg leaders from both
sides of the conflict) as well as creating group norms or
peer pressures (Likert 1961 Pendell 1990 Pondy 1967)
Systems Model
This model is used to analyze conflict at the lateral
or horizontal level of relationships The model also is
used to study the problems of coordination between
horizontal levels of hierarchical relationships (Pondy
1967 Walton amp Dutton 1969) For example in an
industrial or business setting this model can be used to
analyze the conflict situation between two (or more) units
such as production and marketing In the systems model
the units are interdependent in making performance progress
42
toward aggregate production (Nadler et al 1979 Pondy
1967) Examples of interdependent facilities are common
uses of services routine hierarchical tasks and
agreements between the activities of the units (Pondy
1967) The major source of conflict behavior would be
development of negative attitudes between the heads of the
coordinating units
Pondy (1967) suggested two main strategies for
reconciling conflict between coordinating units at the
horizontal level First reduce goal differentiation
through for example proper training and selection of (or
change in) incentive system or allocation of assignment
procedures Second mitigate the conflict by reducing the
interdependence between the units
In summary conflict has been discussed in the context
of each of the three organizational models bargaining
bureaucratic and systems These models have their own
limitations and opportunities A bureaucratic model deals
with authority relations and the need to control the
outcomes or processes This model can be functional as
well as dysfunctional depending upon the relational
behavior between seniors or superiors and juniors or
subordinates Ruling groups can ignore the rights of their
juniors and mentoring relations can encourage the juniors
through participative leadership management Thus these
roles can lead toward either creative (eg positive
learning experience) or threatening (eg fear and
43
mistrust on each other) situations depending upon the
authority or autonomy role plays between the juniors and
seniors Of the three conflict management models the
bureaucratic model is the one that received more attention
from researchers across diverse disciplines in part
perhaps because of its easy access to all disciplines
(Pondy 1967)
Systems models deal with functional relations and the
need to coordinate among the parties at the same
hierarchical level In this model each party has its own
job mandate but they can function through coordinating
their efforts all parties are interdependent As an
example a possibility of coordination between the heads of
two departments say production and marketing could lead
to efficient production time and delivery of products as
per targeted demands and on clienteles prescribed needs
Otherwise if both of the department heads do not
coordinate their functional assignment their production
targets would be jeopardized in terms of need and place of
the clients Thus this model could be effectively used
for reducing or resolving the conflicts among the parties
through following the number of strategies depending upon
the nature of the conflict Pondy (1967) suggested two
main strategies for reconciling the conflict First there
are numbers of ways to reduce goal differentiation between
the parties such as proper training and selection or
change of incentive system and allocation of assignment
44
procedures Second the conflict can be mitigated by
reducing the interdependence between the parties or
functional units
Bargaining models deal with interest groups in
relation to competition of resources Thus it could be a
mixture of both cooperative and competitive subprocesses
For example divergent interest groups may combine their
efforts for resolving their common interest problems but
also securing their self interests simultaneously The
interest groups strive to meet their targeted demands
through the flexible behavior Contrarily interest groups
distribute their efforts through strategic bargaining
process when they are under the influence of competitive
behavioral action
Theoretical Models of Conflict Management Strategy
The conflict resolution techniques employed depend
upon the nature of the conflict and the philosophies of the
mediators (Pondy 1967 Putnam 1988) For example the
tension model works to evolve safety-valve institutions
and the semantic model promotes open communication among
the conflicting interest groups (Pondy 1967 Putnam amp
Wilson 1982)
The justification for developing conflict management
strategies is based in part on recognition of the
functional and dysfunctional consequences of the conflicts
45
The contemporary conflict management theorists view
conflict as productive creative and useful rather than
destructive deteriorating and inappropriate (Deutsch
1949 1971 Rahim 1992 Thomas 1976 1988 Thompson
1960)
A conflict episode can be resolved differently
According to some researchers there are three types of
conflict-managing systems (a) process model (b)
structural model and (c) mixed model (Chanin amp Schneer
1984 Nadler et al 1979 Thomas 1976) The models are
used to manage conflicts through understanding the behavior
of the potential stakeholders who are involved in a
conflict situation (Daves amp Holland 1989 Rahim 1992
Thomas 1976) For simplicity sake the discussion of
conflict management models is focused on dyadic
relationships that is the potential conflict between two
parties
Process Model
The process model is a systematic approach for
studying the internal dynamics of a conflict situation
The process model is concerned with the identification of
the events For example when two interest groups are in a
conflict situation then each of the conflicting group
passes through the events of frustration
conceptualization behavior and outcome (Pondy 1967
Putnam amp Wilson 1982 Thomas 1976 Wilson amp Waltman
46
1988) The process model views the events as occurring in
a continuous process from one episode to the next and is
concerned with the effect of each upcoming event Hence
the evidences about the conflict occurrence are dynamic and
process-oriented (Thomas 1976)
The process model has been used to develop strategies
that can be used by a third party (eg consultant or
mediator) in resolving or reducing conflict among the
stakeholders (Nadler et al 1979) Walton amp Dutton
(1969) classified these techniquestools into three general
approaches deescalation confrontation and collaboration
under organizational conflict management settings
Deescalation technique One group may react to a
conflicting situation by cooperating with an opposing
interest group Sometimes this type of conflict
behavioral manifestation may encourage an increase in the
intensity of the conflict Thus care is needed in
identifying the stage of the conflict before intervening
with any type of conflict resolution technique (Nadler et
al 1979)
Confrontation technique When a conflict event has
exceeded the escalation limit that is becomes visible a
direct confrontation technique would be suitable for
handling conflict between the interest groups The
perspective of the confrontation technique is that dialogue
must take place between the groups about their emotions and
47
concerns to reduce the intensity of conflict (Nadler et
al 1979)
Collaboration technique This strategy is often
employed especially when the conflict has advanced beyond
the escalation and the confrontation stages of the conflict
(Filley 1975 Nadler et al 1979) This technique is
referred to as a win-win strategy because it works through
integrating the goals of the interest groups (Filley 1975
Nadler et al 1979) In this way both parties gain
through achieving common goals
In all three process model techniques consultant or
mediator involvement is recommended in order to ensure
direct and open communication between the stakeholders
Open and direct communication is needed if the groups are
to trust each other As a consequence of conflict
behavior there are possibilities of reduced communication
distortion of perception and mistrust (Nadler et al
1979)
Structural Model
This model attempts to understand conflict phenomena
by studying how underlying conditions shape events
(Thomas 1976 p 893) Underlying structural conditions
are behavioral predispositions social pressures
(constituent and ambient) incentives (stakes interest)
rules and procedures (decision negotiation and
mediation) and organizational norms (Rahim 1992)
48
In this approach the foremost objective is to
identify the parameters that influence conflict behavior
Those parameters are supposed to be relatively static and
slow changing (Thomas 1976)
The structural model is grounded on preconceived
understanding scarce supply of resources interdependence
stake of the interest groups and antecedent conditions of
differentiation The most important structural model
technique is to minimize the differences by identifying the
goals which are equally shared among the interest groups
When both interest groups realize the importance of common
goals they have an collaborative incentive (eg to
defend against a common enemy) Group differences may be
resolved through restructuring the group or rewarding the
individuals on the basis of total productive performance
(Nadler et al 1979)
Mixed Model
Under certain conditions process and structural
approaches can be used together for managing conflict
(Nadler et al 1979) Strategies include (a) developing
rules that will motivate the conflicting groups to move
toward problem solving (Nadler et al 1979) (b)
establishing a third-party organization or individuals
capable of playing the role of mediator between the
interest groups (Amy 1987 Lawrence amp Lorsch 1967 Nadler
et al 1979) (c) promoting inter-group liaison role for
49
open communication (Nadler et al 1979) and (d) creating
task forcesteams in order to sort out the boundaries
between groups that cause conflicts (Nadler et al 1979)
In summary Rahim (1992) and others considered really
only two basic approaches process and structural The
process approach deals with the sequence of event or
activities to arrive at some desired outcome The
organizational processes are communication decision-
making and leadership development necessary for social
systems to function (Beer amp Walton 1987 Rahim 1992
Rahim amp Bonoma 1979) The process approach was designed
to manage conflict through aligning the conflict management
styles among the participant groups depending upon the
nature and situation of the conflict (Conflict management
styles will be discussed later)
The structural approach addresses stable arrangement
of the tasks technologies and other factors so that the
members of an organization can work together effectively
Moreover the structural approach is designed to manage the
conflict by modifying the structural factors in an
organization as per the characteristics of the conflicting
groups The major structural factors include reward
system rules and regulations (Nadler et al 1979
Rahim 1992)
Rahim (1992) concluded that conflict management
interventions are mainly needed when the intensity of the
conflict is either too little or too much A moderate
50
level of conflict is considered to be desirable for
maintaining productive performance between the conflicting
groups Traditional conflict management approaches (ie
obliging dominating and avoiding styles) are only
suitable if the conflict is minor or frictional in nature
Contemporary approaches referred to as win-win
integrative cooperative or problem solution approaches
are more appropriate interventions for long-term conflict
management (Filley 1975 Howell 1981 Nadler et al
1979 Rahim 1992)
Application of the process approach is primarily
recommended when there is a need to alter the conflict
management styles in the perspective of amount and
perception of conflict The best suggested means under the
process approach are training and educational interventions
(Rahim 1992)
Theory of Conflict Management Styles
Bisno (1988) author of Managing Conflict pointed out
that mastery of technical skills is no substitute for a
commitment to pro social objectives (p 169) In other
words before implementing any conflict management
strategy there is a need to conceptualize the significance
of the conflict and conflict situation (Ross 1982
Witteman 1986)
51
Early researchers treated conflict as a problem that
causes destruction (Ross 1982 Thompson 1960 Wilson amp
Waltman 1988 Witteman 1988) and thought it should either
be eliminated or avoided (Putnam amp Wilson 1982 Ware amp
Barnes 1983 Witteman 1988) Contemporary theorists on
the other hand are of the opinion that conflicts should be
embraced and managed with productive perspectives in mind
(Nadler et al 1979 Putnam amp Pool 1987 Putnam amp Wilson
1982 Ware 1983 Ware amp Barnes 1983) Along these lines
Nadler et al (1979) commented that
contrary to popular belief conflict is not necessarily undesirable[It can] stimulate the search for new creative solutions result in improvements in production methods or lead to insights that might not have been made otherwise (p 221)
By reviewing the significance of conflict and conflict
management styles of individuals groups and
organizations training professionals are better able to
manage conflict in a variety of organizational conflict
situations (Putnam 1988 Putnam amp Pool 1987 Shockley-
Zalaback 1984) Many types of instruments have been
designed to measure the conflict management styles of
individuals groups and organizations (Raves amp Holland
1989 Howell 1981 Putnam 1988 Putnam amp Pool 1987
Ross 1982 Thomas 1976)
In general early theorists in the conflict management
area assumed that a single dimensional model a continuum
with cooperation at one pole and competition at the other
52
was appropriate for measuring conflict management style A
prime example of a single dimensional model is Prisoners
Dilemma a matrix game (Buckley Burns amp Meeker 1974
Deutsch 1949 Putnam 1988 Stern 1976 1992)
A two-dimensional model of conflict management styles
was introduced by Blake and Mouton (1964) in the 1960s
The grid-oriented two-dimensional model of conflict
management styles is based on the concept of concern for
people versus concern for others or assertiveness and
cooperative orientation (Blake amp Mouton 1985 Howell
1981 Kilmann amp Thomas 1977 Putnam 1983 Ross 1982
Thomas 1976 Witteman 1991)
Putnam and Wilson (1982) discussed five management
styles as follows
Forcingsignified the use of competitive behaviors to win ones position even if it meant ignoring the needs of the opponent Confronting also called problem solving collaborating and integrating consisted of facing a conflict directlyTo reach creative solutions participants had to exchange information and to integrate alternative points of view Smoothing also called accommodating [aimed to cover up the conflict] referred to behaviors that glossed over concealed or played down differences by emphasizing common interests Avoiding was physical [and psychological] withdrawal refusal to discuss the conflict or the tendency to sidestep the situation Compromising behaviors aimed atfinding a middle- ground alternative Compromiserswho looked for easy solutions by finding the midpoint between the opposing viewpoints (p 631)
Figure 4 illustrates the relative position of these five
conflict management styles on a two-dimensional model
(Blake amp Mouton 1964 Howell 1981 Putnam amp Pool 1987
Thomas 1976 1988)
53
Forcing Confrontation
o Compromising
Avoiding o Smoothing
Cooperativeness
Source Adapted from Thomas (1976) and Blake and Mouton (1964)
Figure 4 Two-dimensional model of conflict management styles
In summary the effectiveness of each of the five
conflict management styles is dependent upon the nature and
situation of the conflict For example direct
confrontation or problem solving might be effective when
used by a supervisor in dealing with a subordinate in order
to end the conflict but the reverse is not true (Lawrence
amp Lorsch 1976 Witteman 1991) In order to be effective
it is critical that the conflict management style be linked
54
with the type of relationship between the conflicting
parties in terms of subjective cultures goals and
ideology (Gudykunst Ting-Toomey amp Chua 1988 Putnam amp
Wilson 1982 Temkin amp Cummings 1986 Ting-Toomey 1984)
Natural Resource Use and Management
There are a number of factors involved in the natural
resource usemanagement controversy This study focused on
two factors multiple use vs single use and scarcity vs
abundance assumptions for managing natural resources
Issues of Multiple Use
Overgrazing on public lands or common properties
became a main focus in lobbying efforts by the Bureau of
Land Management (BLM) and the US Department of the
Interior to get non-ranchers (eg environmentalists and
conservationists) to support passage of the Multiple-Use
Sustained-Yield Act of 1960 (Clawson 1987 Nelson 1989)
Single use (eg livestock grazing or crop production) of
these lands had been common since the 1800s Until the
1980s public land use decisions continued to favor the
interests of ranchers and livestock industry holders
Efficiency and multiple use were not major concerns
Several forces helped the passage of the Multiple-
Use Sustained-Yield Act of 1960 After World War II
population pressure increased especially in the urban
55
areas That and the improvement in means of transportation
tempted resource users to think about alternative uses of
the land (Clawson 1987 Frederick amp Sedjo 1991 Libecap
1981) Increasingly non-ranchers vested interests have
influenced decisions regarding public land use because
every citizen of America has the right to look after the
stewardship of the land (Clay 1962 Nelson 1989)
The Multiple-Use Sustained-Yield Act of 1960 was
passed with special considerations Land management was
to be based on biological sustained yield principles not
economic criteria to achieve multiple-use goals (Libecap
1981 p 79) The theme of the Act was explained by the
ecologist Aldo Leopold (cited in Hess 1992) in these
words
A land ethic rested on the premise that the individual is a member of a community of interdependent parts--a social community that includes soils bodies of water plants and animals (p 244)
Multiple use of natural resources is supposed to meet
the long-term blended needs of all resource users (Clawson
1987 Frederick amp Sedjo 1991 Libecap 1981 Stankey amp
Clark undated US Department of Agriculture [USDA]
1990) The mix of multiple uses allowed on public lands
varies depending upon the situation of the land Examples
of resource use are soil water wilderness timber
minerals livestock grazing national parks urban parks
outdoor recreation (eg hiking backpacking and other
leisure activities) fish and wildlife forage cultural
56
resources and air (Rifkin amp Rifkin 1992 Wondolleck
1988)
The philosophy of multiple use of land resources has
the potential for creating different types of conflicts
between resource users producers and managers (USDA
1990)
1 Commodity-commodity conflict this type of
conflict involves competition between different
types of commodity production for example
forest products vs livestock forest products
vs commercial fisheries
2 Amenity-amenity conflict this type of conflict
occurs when amenity oriented uses are not able
to co-exist (USDA 1990 p 6-57)
3 Commodity-amenity conflict this kind of
conflict erupts between interest groups who have
quite different outlooks on the management and
use of the resources Potentially this type of
conflict is considered to be more contentious
(USDA 1990)
The Federal land management agencies philosophy of
natural resource management is based on
scientifictechnical principles that consider measurable or
priced values Crop and livestock production have
measurable values whereas environmental interests (eg
aesthetic enjoyment and recreation fish and wildlife
57
hunting) have unmeasurable or unpriced values (Libecap
1981 Sinden amp Worrell 1979)
Regional economists and planners view the concept of
multiple use in terms of interindustry spillover effects
Alternative land uses differentially impact the community
and its sectors in regard to jobs income and levels of
fiscal activity (Robinson amp Miller 1989)
Each interest group needs to develop principles for
the use and management of resources given the available
body of knowledge about multiple use Based on the
researchers background in agricultural and resource
economics the following are a synthesis of principles of
multiple use concept
1 A consideration of long-run and sustained yield
should be made to meet the present and future generation
needs of both human and nonhuman species on private and
public properties (Izzak Walton League of America 1982
Libecap 1981 USDA 1980)
2 Any individual or group who wants to use the land
for its own purposes must pay attention to the values and
cultures of neighboring people under competitive market
conditions (Izzak Walton League of America 1982) For
example a business group venting its concerns against an
environmentalist group stated We need to get those
natural resources under control or there wont be a Lake
County because tourism is not going to maintain the culture
58
and heritage and wont support this community (Dechaud
1992 p 25)
3 The transfer of public and private property
rights should not work against the fair balance of
sustained yield multiple uses of the resources (Izzak
Walton League of America 1962)
4 Fair and balanced treatment should be given to
the mix of available multiple uses of resources in order to
maintain and increase high ouality and quantity of the
resources between agriculture and non-agriculture sectors
(Savonen 1992 USDA 1990)
5 Multiple use plans of land should be prepared
collaboratively with multi-disciplinary team efforts as
well as with the active participation of the concerned
interest groups under the approved guidelines of
environmental impact studies (eg scientific management
of the residual effects from the use of agricultural
chemicals) (Frederick amp Sedjo 1991) potential of
resources and production capabilities and alternative
technological substitutions (eg timber and product
shortages be met through cheap substitutions) (Frederick amp
Sedjo 1991 Gentile 1989 Hess 1992 Izzak Walton League
of America 1982 Rifkin amp Rifkin 1992 USDA 1990)
Planning based on cooperation is time saving and effective
especially when dealing with the management of public land
issues (Obermiller 1990)
59
Constraints and Opportunities for Managing Resources
Resource dilemma issues concerning common property and
open access are difficult to manage These issues concern
resources that roam such as streams creeks rivers
groundwater and wildlife A stream wanders freely from
one property to another property Similarly wildlife
moves between properties (Fredrick amp Sedjo 1991)
In the absence of property rights they [waterwildlife] are unowned until captured for use In the absence of effective management institutions this situation often results in the problem of the tragedy of the commons in which a common resource is overused because it is available for the taking on a first-come first-serve basis without responsible managerial constraint (p 17)
In common property situations individuals do not have
much incentive to manage natural resources (Frederick amp
Sedjo 1991 Hardin 1968 Platt 1973) Americans have
successfully regulated common property relationships
through promulgation of the land management acts For
example attenuated private property rights are sanctioned
to individuals or groups that have improved effective
management conditions of the common resources (eg
National Audubon Society and Nature Conservancy) Other
commons management acts including the Wild and Scenic
Rivers Act of 1968 the Clean Water Act of 1972 the
Endangered Species Act of 1973 and the National Forest
Management Act of 1976 and the Federal Land policy and
Management Act of 1976 ensure preservation of diverse
multiple uses on federal lands (Frederick amp Sedjo 1991)
60
Riparian habitat The riparian habitat is a common
refuge for migratory birds and other wildlife (Cusick
1993 Rifkin amp Rifkin 1992) Historically riparian
rights were sanctioned to the land owners placing
management of the riparian systems in their hands
However with watershed population expansion a different
system was demanded Frederick and Sedjo (1991) presented
this explanation
In the East where water was plentiful the English system of riparian rights (which gives owners of land adjacent to a water body the right to use the water) was adopted In the West however the riparian system was soon deemed inadequate and a system of appropriative rights (which gives priority to the earliest users) evolved and was enacted into law (p 18
In the Western states the prior appropriations
doctrine has evolved through different stages in order to
protect water delivery systems and facilitate the process
of transfer of water rights Each of the Western states
has passed its own laws to implement the water delivery
system between uses and places (Frederick amp Sedjo 1991)
Scarcity-Abundance Theory Assumptions
The focus of the section is on the philosophy toward
natural resource use and management when scarcity-abundance
dimensions are influencing the resource users Scarcity-
abundance theory posits that resources should be
61
allocatedshared based on individual or group demandneeds
(cf Krueger 1992)
In the literature the concept of scarcity is
attributed to the Malthusian theory of population and
economic growth This theory presents that there is a
limited supply of resources and unlimited demand (Sampson
1981) On the basis of Malthusian principles many
economic theories and models were developed The
proponents of Malthusian theory believe in the scarcity
perspective and argue that resources should be allocated
among the resource users Brown (1991) has interpreted the
philosophy of scarcity from a tragedy perspective
The world has lost nearly one fifth of the topsoil from its cropland a fifth of its tropical rain forests and tens of thousands of its plant and animal species (p 17)
Scarcity-Abundance Assumptions and Consensus Building
Scarcity assumptions Krueger (1992) and Leritz
(1987) discussed three assumptions of scarcity under the
context of negotiation between the interest groups
There is not enough [There is not enough in this world that everybody could get what heshe wants for living The resources are always limited]we are afraid we will have to do without compromise give in give up
People are greedy Everyone is out to get everything they can for themselves to line their pockets at our expense We are afraid we cant trust others
The best approach is strategizing Since the world is scarce and people are basically greedy it logically follows that our best approach to getting what we need is to be more clever to out-strategize others to get
62
ours before they beat us to it (Leritz 1987 p 16)
Abundance assumptions Krueger (1992) and Leritz
(1987) presented the assumptions of abundance theory in
resolving conflicts successfully
There is more than enough [In this limited world you have always gotten enough for your living]the obvious proof is the fact that you are alive If you had not always gotten more than enough you would be dead today That does not mean that the world has been abundant for everyone Nor does it mean that you have always gotten everything you wanted when you wanted it from whom you wanted it
People are basically needy not greedy [It makes a big difference when you perceive]that others are greedy means that you begin from a premise of nontrust self-protection defensiveness and non-cooperation Since people have a tendency to mirror our reflection and match our behavior (I push against you you push back)On the other hand by assuming that people are basically needy we are more open to identify who the other person really is and what he or she needs to be able to cooperate with us We are more likely to realistically perceive the real person with whom we have to negotiate rather than act out of our own fears
Understanding is our best strategy [If] the objective of every negotiation is [willing] to cooperate with us-to do what we want them to doOur task then is to create the conditions that will motivate others to want to cooperate We can only do this however if we understand who the other person is and what they need People are willing to cooperate when they are getting what they need (Leritz 1987 pp 17-18)
The proponents of abundance philosophy especially
Julian Simon an economist have argued that resource
supply in the long run is constantly increasing rather
than decreasing (Sampson 1981) Simon (1991) is
optimistic about the future
63
[As] population increases so does productivity thus the best that could happen would be to add to the supply of people who would in turn add new inventions technology advances and knowledge (p 22)
Simon (1991) described the abundance theory scenario with
these words It is reasonable to forecastcontinued
decline in resource prices and increase in availability
(p 24)
In empirical studies the concept of scarcity-
abundance was mostly discussed in the context of economic
analysis Social scientists particularly social
psychologists brought up the issue of abundance theory in
the context of resolving the resource dilemmas or commons
dilemmas or the tragedy of the commons (cf Buckley et al
1974 Hardin 1968 Jorgenson amp Papciak 1981 Olson amp
Ross 1984 Platt 1973 Rutte et al 1987 Stern 1976)
All of the empirical studies followed experimental methods
to resolve the resource allocationshare problem between
the resource users by giving treatment to wealth as a
resource The following are salient findings related to
the present study
Buckley et al (1974) suggested that collective action
problems between the individuals or groups can be resolved
effectively by promoting communication working on the
binding agreement possibilities altering the structure of
payments and building trust and a social cooperative
ideology
64
Olson and Ross (1984) studied the relationship of
resource availability (abundance-scarcity) on the
resentment behavior (general feeling of satisfaction)
They found that the severity of resentment was decreased
when the resource was scarce They did not find any
significant impact of scarcity on resentment
Rutte et al (1987) found that people respond
differently to people-induced scarcity-abundance than to
nature-induced They concluded that subjects harvested
more from the resource in abundance than that in a scarcity
situation
Stern (1976) conducted a study on 48 subjects using a
four-person commons game simulating carpooling in response
to conserve gasoline Findings suggested that education
and incentive options worked well in the perspective of
resource conservation He concluded in the long-term
educational strategies have greater opportunity for getting
people to conserve resources even in situations where the
incentive options cannot be used
In a study on the effects of communication feedback
and identifiability on behavior Jorgenson and Papciak
(1981) found that groups who maintained better resource
feedback or communication achieved more total money as well
as the commons for maximum number of trials compared to
those who did not
Scarcity-abundance philosophy influences differently
when implied under physical economic and natural
65
conditions Scarcity-oriented analysis is more concerned
with the short term and gives less weight to technological
innovations Contrarily abundance-oriented analysis
relies heavily on potential exploitations and technological
developments in the long term (Dewees 1989 Moncur amp
Pollock 1988 Sampson 1981)
66
3 METHODS AND PROCEDURES
The present study was an investigation into how needs
analysis could be used in developing training interventions
for reducing conflict among natural resource userinterest
groups The goal of this study was accomplished by
developing a theoretical model for assessing the conflict
management style resource use orientation (single vs
multiple use) and resource availability philosophy
(scarcity vs abundance) of individuals within resource
userinterest groups and applying that model to a
particular situation (see Kaufman 1988 Kaufman amp English
1976 Lewis amp Bjorkquist 1992) There are a myriad ways
to conduct needs analysis in a given situation (Kaufman
1987 Kowalski 1988 Lewis amp Bjorkquist 1992 Tesolowski
et al 1988)
Theoretical Framework
This study developed the watershed resource users need
assessment framework (WRUNA) to explore factors that may be
pertinent to be consensus-building The theoretical
concept for the WRUNA model was discrepancy analysis
Kaufmans (1988 1987) OEM and Rossett (1987) guidelines
were adapted (refer to Chapter 2 for details) As
previously discussed a gap may be determined between
present and desired levels of soft and hard sensing needs
information depending upon the identified elements of the
67
required needs For the purpose of this study soft needs
sensing data were perceptions attitudes and personal
values regarding single versus multiple use of natural
resources scarcity and abundance assumptions and conflict
management styles
The WRUNA model is illustrated in Figure 5 The term
where they area refers to present level of performance in
managing conflict over watershed resource use issues
Where they should be refers to the desired level of
performance (consensus building) All of the elements
under watershed resource uses conflict management styles
and demographics were used to compute the gap between the
present system (what they are) and the proposed system
(what they should be)
Where They Are Where They Should Be
Conflict management styles Conflict management styles a Control a -b Nonconfrontation b c Solution orientation c Solution orientation
Watershed resource uses Watershed resource uses a Single-multiple a Multiple b Scarcity-abundance b Abundance
Factors Influencing Behavior and Attitudes
Demographic variables Demographic variables
Figure 5 Watershed resource users needs assessment (WRUNA) model
68
In this study the Oregon Watershed Improvement
Coalition (OWIC) represented what they should be The
OWIC constituent organizations represented what they are
The model assisted in assessing the gap in the performance
of the OWIC (desired situation) and the constituent
organizations (existing situation) in order to identify
needs for educationaltraining interventions
Population and Sample
The target population for this study was the
membership of the Oregon Watershed Improvement Coalitions
(OWIC) constituent organizations Associate members of
OWIC represent professional business and environmental
organizations namely Izaak Walton League The Nature
Conservancy Oregon Cattlemens Association Oregon Chapter
Sierra Club Oregon Environmental Council Oregon Forest
Industries Council Oregon Small Woodlands Association
Oregon Trout Pacific Northwest Section-Society for Range
Management and Pacific Rivers Council A publicist is
also included There is no formal hierarchal structure
within the OWIC although one member was chosen to chair
meetings Decision-making is by consensus According to
the OWIC charter
The goal of this Coalition is to ensure the long term sustainability of Oregons watersheds and to improve communication among the diverse interests that affect watershed management
69
Implicit in the goal is OWICs desire to develop a healthy productive environment within the potential of the environment with yield as a secondary output Yields of all values can be expected to increase if the resource is management with this in mind
OWIC members view themselves as facilitators not mediators Compromises and trade-offs are not goals in and of themselves The concept that is fostered is that of a healthy watershed with the resulting effect that everyone benefits OWIC through its unique membership can provide the impetus and support for seeking pathways to develop working programs for sound watershed management
Selection Procedure
The 20 members of OWIC were contacted and agreed to
participate in the study A letter was sent to the ten
OWIC constituent organizations by Dr William C Krueger
Department of Rangeland Resources informing them of the
study and requesting a directory from which a random sample
of members could be identified (Appendix A)
One organization did not supply the requisite
information on time and therefore was not included in the
study Another organization could only provide information
on 17 members due to an organizational policy For the
eight remaining organizations 30 members were randomly
selected to participate in the study To adjust for the
disproportionately larger numbers of environmentalist The
sample was stratified by selecting an additional 30 members
from business organizations This brought the sample size
to 287 The distribution by group was environmentalist
137 business 120 and professional 30
70
Responses
As Table 2 shows 19 of the 20 (95) OWIC members
returned their questionnaires Approximately 64 (183) of
the constituents returned questionnaires However about
9 (17) questionnaires could not be used in the study
Five respondents returned blank questionnaires with
remarks that either the questionnaire topic was not
pertinent to them or they did not have knowledge about the
riparian zones resource usemanagement issues The other
12 questionnaires not used were incomplete
Table 2 Questionnaire return and use rate
OWIC Constituencies
Action n n
Sent 20 287
Returned 19 95 183 64
Used 19 95 158 55
Group placement of respondents was based on items
providing self-reported affiliation with organizations
However these observations might not have been consistent
throughout the analyses due to variation in missing data
from one question to another
OWIC (n = 19) served as a case study The numbers of
respondents for each constituent group were 81
environmental 57 business and 20 professional The total
71
sample size of constituents was 158 subjects therefore
the response rate was a nominal 55
There was considerable variation in the missing data
or not applicable responses for Section 1 through Section
18 with a range from 3 to 49 observations The greatest
number of observations was for Section 3 and Section 11
Instrument Development and Design
The watershed resource user needs analysis instrument
(WRUNAI) was designed to study the factors sources and
processes pertinent to identifying training needs The
instrument was revised on the advice of an expert panel
then used in the field to collect attitudinal and
demographic information from members of OWICs constituent
organizations
Initial effort to design this instrument was made
after reviewing literature which addressed issues raised in
the mandate of the OWIC especially the philosophical
underpinnings for managing and using watershed resources in
Oregons riparian zones There were four important issues
relevant to training needs analysis of the target group
covered in the design of the instrument conflict
management styles (CMS) orientations regarding single
versus multiple use of natural resources scarcity and
abundance assumptions and demographic information
(Clawson 1987 Frederick amp Sedjo 1991 Krueger 1992
Libecap 1981 Pondy 1967 Putnam amp Wilson 1982 Temkin amp
72
Cummings 1986 Ting-Toomey 1984 USDA 1990 Witteman
1988) Professionals who had expertise in natural resource
management and uses were consulted to discuss the contents
of the researchable issues for inclusion in the survey
instrument
The Uses of Watershed Resources questionnaire was
developed from the final WRUNAI instrument The
questionnaire contained 18 sections (Appendix B) Each
questionnaire section was developed to include self-
explanatory instructions Section 1 of the instrument
contained 15 possible paired comparison of six watershed
resource uses namely aesthetic enjoyment and recreation
aquifer recharge livestock forage fish habitat water
storage and wildlife habitat The paired resource uses
were developed by following Thurstones paired comparison
methodology
n(n - 1)2
where n denotes the number of stimuli The six resource
uses resulted in 15 possible dyads (Guilford 1954 p 159
Remmers 1954 p 225) A relative measure was shown on a
scale from 0 to 2 where zero represent both uses being
equally valued 1 or 2 in a given direction
representing favored and strongly favored use
respectively If undecided the respondent was asked to
draw a line through the item An example was given This
section represented the multiple-use measure of the
alternative watershed resource uses
73
Section 2 was designed to measure respondents views
hold toward abundance or scarcity Six comparable dyad
statements were developed in this manner For three
statements the right-side statement represented the
scarcity view and the left side statement represented the
abundance view This order was reversed for the other
three statements A relative measure was shown on a scale
from 0 to 2 where zero representing neither statement
being favored and 1 or 2 in a given direction
represented that one statement was favored or strongly
favored An example was provided
Section 3 of the questionnaire consisted of 30 items
These items were adapted from the Organizational Conflict
Communication Instrument (OCCI) (Putnam amp Wilson 1982) for
the purpose of this study This section measured the
respondents preferred conflict management styles (CMS)--
control nonconfrontation and solution orientation The
items were measured on a 7-point summated-rating scale
The scale spread measured from always (1) to never (7)
A low score indicated frequent use of certain conflict
communication strategies and high scores indicated
frequent use of certain conflict interaction behaviors
(Ting-Toomy 1984) The OCCI is a multidimensional measure
of conflict management styles rather than a single
dimensional measure Each CMS statement represented a
position in a group environment (a) ones own position
within a decision-making group (b) the opposing parties
74
position with in a group (c) the perceived extent of the
conflict situation (ie the significance of the conflict
in ones life such as prestige matter versus best
alternative uses) (Temkin amp Cumming 1986) If a statement
was not applicable the respondent was asked to cross it
out
Section 4 consisted of one forced-choice item that
solicited the respondents perceived status of power in
regard to influencing other users in how resources should
be used (1 = more 2 = same 3 = less 4 = not applicable)
Section 5 through Section 18 contained items
concerning demographic information such as education
level gender nature of job and interest group
affiliations source of information title and position
private and public land management options and intensity
of conflict This information helped to assess additive
and interactive predictive effects of the key factors
leading toward resolution of conflict management between
the watershed resource interest groups
Survey Instruments for Measuring Behaviors
Conflict management theorists have designed a number
of instruments to measure respondents conflict behavior
The five most frequently used self-reporting instruments
are the Thomas and Kilmanns MODE Survey Halls Conflict
Management Survey (CMS) Putnam and Wilsons Organizational
75
Communication Conflict Instrument (OCCI) Ross and DeWines
Conflict Management Message Style (CMMS) and Rahims
Organizational Conflict Inventory-II (ROCI-II) (Womack
1988b) Each instrument has a particular focus for
measuring respondents conflict behavior The following
discussion is limited to position and disposition and
communication-related behavioral strategies and tactics in
the context of the scope of the present study
Of the five instruments previously mentioned the MODE
and CMMS measure respondents conflict behavior
irrespective of context (Kilmann amp Thomas 1977 Ross
1988 Womack 1988a 1988b) In other words both MODE and
CMMS deviate only slightly in respect to measuring
respondents behavior across situations The remaining
three instruments namely CMS OCCI and ROCI-II measure
respondents behavior differently for each situation and
for each target Halls CMS instrument is situation-
biased Rahims ROCI-II instrument measures conflict
behavior influenced by the target that is the conflict
behavior between superiors and juniors peers and
subordinates Putnam and Wilsons OCCI instrument measures
the behaviors of the respondents that is influenced by both
target and situations (Thomas amp Kilmann 1978 Putnam amp
Wilson 1982 Shockley-Zalabak 1988 Weider-Hatfield
1988 Wilson amp Waltman 1988 Womack 1988b)
All five conflict behavior measuring instruments
consider communication behavioral aspects to different
76
degrees The OCCI and CMMS instruments are objectively
designed to measure communicative conflict type of behavior
(Putnam amp Wilson 1982 Wilson amp Waltman 1988 Womack
1988b) As Jandt and Hare (1976) noted for parties to be
in conflict they must also be in communication (p 3)
The major difference between the OCCI and the CMMS is
in presentation Items in the OCCI represent summaries of
message behavior for example I assert my opinion
forcefully (Putnam amp Wilson 1982 Wilson amp Waltman 1988
Womack 1988b) On the other hand the CMMS instrument
presents messages for the respondents selection for
example If you are not going to cooperate I will just go
to someone who will (Womack 1988b p 438)
Putnam and Jones (1982) suggested that the instruments
differ in their presentation of tactical perspectives
(ie game plans) and strategies For example the OCCI
and to a lesser extent the MODE embody both tactics and
strategies as well as general intention characteristics
The ROCI-II and the CMS instruments are worded to elicit
ones behavior as indicated by general intentions or
strategies (Womack 1988b p 438)
The tactical and strategic approaches have their own
strengths Because the OCCI and the MODE include tactical
and strategic approaches they identify the nature of
specific conflict behaviors among respondents Further
the tactical and strategic approaches are compatible with
77
each other and tend to merge into one approach
particularly in the case of the OCCI
Psychometric Properties of the Instruments
The reliability and validity estimates provided
relative evaluations of the best and more frequently used
instruments A comparison of the reliability alpha
coefficients for the five conflict-behavior measuring
instruments from earlier studies are presented in Table 3
Cronbachs alpha statistic was used for estimating internal
consistency reliability The reliability coefficients were
highest for the OCCI
Table 3 Comparison of Cronbachs alpha coefficients across scales
Thomas- Putnam- Ross-Instruments Killmann Hall Rahim Wilson Dewine
(OCCI)
Confrontation 65 73 77 85 78
Compromise 58 45 72 92
Forcing 71 61 72 85 76
Smoothing 43 55 72 94 73
Withdrawal 62 39 75 88 _ Overall means 60 55 74 89 76
N= 76 N= 76 N= 1219 N= 360 N= 123
Source Adapted from Womack (1988b) pp 440
According to Womack (1988b) in general conflict
management researchers have observed lower reliability
coefficients in their own studies than those reported by
the instrument developers They also found that only the
OCCI meets Nunnallys criteria for alpha coefficients
78
Nunnallys average standard alpha coefficients are 80 for
basic research and 90 for applied research (Womack
1988b)
The CMS and the MODE have been shown to have the
weakest content validity of the five instruments (Thomas amp
Kilmann 1978 Womack 1988b) Conflict management
researchers including those in the communication area
confirmed that three conflict management styles were
associated with the interrelationship of the message items
Sets of conflict management styles were termed differently
CMMS focus on self focus on issue and focus on
other (Ross 1982 Ross amp Dewine 1988)
OCCI non-confrontation solution-orientation and
control (Putnam amp Wilson 1982)
ROCI-II dominating integrating and avoiding
(Weider-Hatfield 1988)
Only Rahim (1992) confirmed the significance of the five
conflict management styles reported by Blake and Mouton
integrating obliging dominating avoiding and
compromising
The literature reported that construct validity is
weak for all available conflict management instruments In
general there is a problem in comparing the results of one
instrument with those of another due to variation in the
theoretical conceptualization for each instruments This
is a common problem for all self-report instruments
Predictive validity is unknown for all the instruments
79
(Canary Cunningham amp Cody 1988 Kabanoff 1987 Daves amp
Holland 1989 Womack 1988a 1988b)
The OCCI Instrument
Putnam and Wilson (1982) designed the OCCI instrument
in response to conceptual and methodological weaknesses of
previous conflict behavior measuring instruments The
instrument is specially designed to accommodate verbal and
non-verbal communications which are essential components
of any conflict behavior (Putnam 1988 Ross 1982 Wilson
amp Waltman 1988) In the past conflict theorists paid
less attention to communication than to role (eg
interdepartmental supervisor-subordinate) in conflicts
(Lawrence amp Lorsch 1967 Putnam amp Wilson 1982)
Putnam and Wilson (1982) pointed out methodological
weaknesses in the grid-oriented approach They are
1 Each individual has unique characteristics such
as subjective cultural differences that influence conflict
management style either positively or negatively (Rahim amp
Bonoma 1979 Ting-Toomey 1984)
2 There are disagreements in defining and
conceptualizing the conflict episodes that lead to
incompatible goals between individualsgroups (Witteman
1986 1988)
3 A failure to agree upon the specific source or
target of conflicts may be misguiding to the professional
for designing target-based conflict resolution
80
4 Each instrument measures conflict management
style according to some specific intention rather than
multiple objectives Examples of specific purpose design
elements are a one-item scale (Renwick 1977) a set of
aphorisms (Lawrence amp Lorsch 1967) Blake and Moutons
managerial grid (Howell 1981) and a forced-choice
questionnaire (Kilmann amp Thomas 1977)
Compared to other existing instruments the OCCI
instrument is a relatively better predictor and has higher
reliability and content validity (Putnam amp Wilson 1982
Witteman 1991) As already discussed the OCCI isolates
three conflict management styles solution-orientation
control and nonconfrontation (Putnam amp Wilson 1982
Womack 1988b) Compared to the original five conflict
management styles solution-orientation represents a
combination of confrontation and compromise conflict
management styles control style resembles forcing in
establishing direct communication between the groups for
resolving disagreements and nonconfrontation combines
avoiding and smoothing (Witteman 1991)
According to Nadler et al (1979) Filley identified
three approaches to resolve conflicts (a) win-lose (b)
lose-lose and (c) win-win With the OCCI instrument
Filleys conflict resolution approaches can be estimated
The approaches are comparable with the OCCI conflict
management styles (Filley 1975 Nadler Hackman amp Lawler
1979 Putnam amp Wilson 1982)
81
Approach (Piney) Management Style COCCI)
win-lose controlling lose-lose nonconfrontation win-win solution orientation A number of studies applied the OCCI instrument in
studying the relationship of subjective culture gender
and vertical and horizontal hierarchical positions in
voluntary and non-voluntary organizations with three
conflict management styles depending upon the nature and
situation of the conflicts (Putnam and Wilson 1982 Temkin
amp Cummings 1986 Ting-Toomey 1984 Wilson amp Waltman
1988) These studies concluded that diagnosis of conflict
management styles is not only sufficient to suggest the
conflict strategies until the conflict case associated
factors be included Thus the choice of conflict strategy
should be a joint function along with other supporting
factors (eg culture philosophy of natural resource
management) depending upon a given situation (Wilson amp
Waltman 1988)
Compared to the CMS and MODE the OCCI is difficult to
administer and interpret It is not recommended for use in
studying the impact of training programs due to
uncertainty regarding test-retest reliability (Putnam amp
Wilson 1982 Wilson amp Waltman 1988)
Validity and Pilot Testing of the Questionnaire
The questionnaire was validated by an expert panel
whose eight members understood watershed resource issues in
82
riparian zones The experts communicated their comments
independently on the consistency accuracy and clarity of
the questions concerning watershed resources These
comments were used to adjust the draft instrument
The revised WRUNAI was sent to the 20 OWIC members
Their feedback resulted in only minor editorial changes to
the questionnaire However their response on revising the
instrument was treated as a proposed (where they want to or
should be) component of the WRUNA model
Data Collection
The Uses of Watershed Resources questionnaire was
distributed to the 20 OWIC members and 287 associate
members randomly selected from the nine participating
constituent organizations to the individual members
Follow-up mailing was done by the researcher employing
mail survey techniques proposed by Dillman (1978) The
data collection was completed in 20 weeks (March to August
1993)
In the first phase survey packets were assembled and
mailed to the 20 OWIC members Each included a
questionnaire along with a cover letter representing the
Oregon State Universitys faculty a stamped self-addressed
envelope and a stamped return postcard to 20 OWIC members
(Appendix C) In addition to completing the
questionnaire the ten members representing OWIC
constituent organizations were asked to provide (a) their
83
respective organizations membership directory or list of
30 randomly selected associate members and (b) a cover
letter written on their organizations letterhead to be
included in the survey packets sent to select members of
the respective constituent organization
Dillmans (1978) total design method (TDM) guidelines
for mail survey were used in part to facilitate a high
return rate A postcard was mailed to all subjects two
weeks after mailing the first survey packet to remind those
who had not yet responded or to thank those who had
already responded (Appendix C) The subjects who did not
respond to the survey packet within four weeks were mailed
another survey packet
In the second phase survey packets were mailed to the
selected organizational members as soon as the required
materials were received If any constituent organization
was not able to supply membership directory it was asked
to provide a list of 30 members randomly selected from its
membership Dillmans procedures for mail survey were
repeated with the mailing to constituent organizations
Data Analysis
Data were coded and entered into a Quattro Pro
(Version 30) spreadsheet which was converted into a Lotus
1-2-3 (Version 3) spreadsheet The data were then analyzed
84
using SPSSPCplusmn (Version 30) on an IBM PS2 Model 80
microcomputer
85
4 RESULTS AND DISCUSSION
The present study was an investigation into how needs
analysis could be used in developing training interventions
for resolving conflict among natural resource userinterest
groups The primary purpose of the study was to develop a
needs assessment approach for use with userinterest groups
in potential conflict over watershed resource
usemanagement in Oregon riparian zones Criteria derived
from the review of literature on instructional system
design models were used to develop the watershed resource
users needs assessment (WRUNA) conceptual framework The
WRUNA model was in turn used in designing the instrument
to acquire information from watershed resource
userinterest groups
For the purposes of this study the Watershed Resource
Users questionnaire was designed based on the WRUNA model
to gather information from the Oregon Watershed Improvement
Coalition (OWIC) and its constituent organizations Each
of the 18 sections of the mail survey questionnaire was
designed to generate data on specific variables The first
three sections concerned the dependent variables in this
study namely resource use orientation resource supply
philosophy and preferred conflict management style The
remaining sections concerned independent (demographic)
variables
86
The statistical analyses performed were analysis of
variance with multiple range test multiple linear
regression Pearsons correlation and descriptive and
summary types of statistical analyses The 10 probability
level was used The results of these analyses served as
the bases for (a) evaluating the instrument developed in
this study (b) establishing how needs assessment could be
used in the development of target-based instructional
interventions when the goal is conflict management and (c)
generating questions for discussion and further research in
this area
The remainder of this chapter is divided into three
sections for presenting and discussing the results of
analyses The first section examines needs assessment data
(Sections 1 to 3) for OWIC and the environmental business
and professional groups The second covers demographic
data on the constituent groups and the third is a
discussion on the credibility of the instrument Summaries
of analyses are presented within the text More detailed
information are given in the Appendices
Results of Analyses of Needs Assessment Data
This section identifies and compares the resource use
orientation resource supply philosophy and preferred
conflict management style of the OWIC and constituent
groups as determined from data collected by the mail
87
survey questionnaire Section 1 of the questionnaire
contained 15 items pairing six watershed resource uses
Section 2 contained six comparable dyad statements
expressing abundance versus scarcity philosophical views
For Section 1 a relative measure was shown on a scale from
0 to 2 where zero represented that neither response choice
was favored and 1 or 2 in a given direction represented
that one response choice was favored (1) or strongly
favored (2) For Section 2 the analysis showed a
relative measure on a 5-point scale where smaller the value
the more one favors the scarcity orientation On the other
hand the larger the value the more one favors an abundance
orientation
Section 3 consisted of 30 items adapted from the
Organizational Conflict Communication Instrument (OCCI)
(Putnam amp Wilson 1982) for the purpose of this study
This section measured the respondents preferred conflict
management style (CMS)--control nonconfrontation or
solution orientation The items were measured on a
seven-point summated rating scale (1 = always and 7 =
never) A low score indicated frequent use of certain
conflict communication strategies and high scores
indicated frequent use (see Chapter 3 for detailed
discussion)
The purpose of the first three sections was to examine
the perceptual similarities and dissimilarities between
members of the OWIC and its constituencies and the assumed
88
ideal profile represented in the WRUNA framework (Figure
5) as where they should be The ideal profile was based
on suggestions in the OWIC literature that certain
predispositions were necessary for consensus building
namely (a) multiple-use orientation (b) abundance
philosophy and (c) conflict management style tending
toward solution orientation
Resource Use Orientation
Table 4 summarizes the results of statistical analyses
on resource use orientation The results indicated that
OWIC and constituent group respondents did not have the
same orientation toward use of riparian watershed resources
(F = 542 df = 3 173 p = 00) Individual differences
between the OWIC members and the members of each
environmental business and professional group were
identified by employing a post-hoc least square difference
(LSD) test with probability level of 10 (Kleinbaum amp
Kupper 1978 Williams 1986) The possible mean score
range was 0 to 2--the smaller the mean score the greater
the tendency toward multiple resource use According to
the LSD test the professional (mean = 75 SD = 41) and
business (mean = 79 SD = 45) groups tended toward
multiple resource use whereas the OWIC (mean = 102 SD =
35) and environmentalist (mean = 104 SD = 42) groups
tended toward single use However caution is
89
Table 4 ANOVA results on resource use orientation
Source SS df MS
Between groups 293 3 98 542 00
Within groups 3116 173 18
Total 3409 176
Group na Meanb SD
Environmentalist (EG) 81 104 42
Business (BG) 57 79 45
Professional (PG) 20 75 41
OWIC (0) 19 102 35
Total 177 92 44
Environ- Profes- Uses mentalist Business sional OWIC
Livestock- n 80 55 20 19 wildlife M 445 267 315 347
SE 09 15 23 35
Wildlife-Fish n 75 54 20 17 M 311 294 305 318 SE 09 10 15 20
Fish-Livestock n 81 56 19 19 M 129 318 279 232 SE 06 16 29 30
Livestock-Water n 79 53 20 18 storage M 438 313 345 400
SE 09 13 25 21
Water storage- 78 54 20 19 Fish M 371 250 270 295
SE 11 11 18 19
Fish-Aesthetic amp n 80 53 20 18 recreation M 228 247 23 194
SE 11 12 18 19
Aesthetic amp n 79 56 20 19 recreation- 162 380 345 295
r
M
Livestock SE 09 14 25 30
Livestock- n 80 57 20 19 Aquifer recharge M 450 293 340 411
SE 09 15 27 25
Aquifer n 76 55 20 19 recharge- M 313 284 285 258 wildlife SE 12 12 23 23
Wildlife-water a 77 55 20 19 storage 240 344 310 305
SE 11 12 20 24 11
90
Environ- Profes-
Uses Water storage- n
mentalist 78
Business 55
sional 20
OWIC 19
Aesthetic amp M 283 205 220 184 recreation SE 13 12 25 18
Aesthetic amp n 77 55 20 18 recreation- M 385 362 365 411 Wildlife SE 11 11 22 21
Aquifer n 77 55 19 19 recharge- M 242 222 195 158 aesthetic amp SE 11 13 21 16 recreation
Fish-aquifer n 77 55 20 19 recharge 21 269 320 335 332
SE 12 12 22 23
Water storage- 75 54 20 19 Aquifer recharge M 352 283 325 363
SE 10 10 14 21
Note 1 = always left use 5 = always right use aNumbers of participants responding to the question The smaller the mean the stronger the preference toward multiple use Scale 0 = multiple use 1 = favor single use 2 = strongly favor single use plt10
LSD test (PG = 8G)lt(0 = EG)
advised in interpreting these results which are based
solely on an examination of means Extreme scores may
distort the average The professional group compared to
those of the business group had a smaller range of scores
The distribution of scores for the business group appeared
to be more normally distributed (0 to 20) compared to
those for the professional group (27 to 180) There were
no outliers observed for these two groups
The difference in mean scores between members of the
OWIC group and the environmental group may be explained by
two outliers observed in the OWIC group one at each end of
the scale In other words one member of the OWIC group
91
represented an extreme position toward single use
orientation whereas another member represented the extreme
toward multiple use orientation The scores for the
majority of the members ranged between 6 and 13
The standard deviations for the OWIC and environmental
groups were about the same The score for the
environmental group members were heavily and evenly
distributed toward single use orientation except for the
means of two members that fell in between 0 and 4
representing a strong multiple-use orientation
In summary the findings indicated that the OWIC and
the environmental group members held almost similar
positions regarding resource use with a moderate tendency
toward single use The business and professional groups
showed a moderate tendency toward multiple use orientation
compared to the OWIC and environmental groups Therefore
the business and professional group members were more
inclined the WRUNA model ideal on resource use orientation
Resource Supply Philosophy
The results of analyses showed that the OWIC and the
constituency members shared a similar philosophical
orientation toward resource supply but not to the same
degree (F = 1001 df = 3 173 p = 00) As shown in
92
Table 5 the results indicated a greater tendency toward
abundance philosophy for the OWIC group (mean = 431
Table 5 ANOVA results on resource supply philosophy
Source SS df MS
Between groups 1168 3 389 1001 00
Within groups 6729 173
Total 7897 176
Group n8 Meanb SD
Environmentalist (EG) 79 350 70
Business (BG) 55 383 50
Professional (PB) 20 389 68
OWIC (0) 19 431 56
Total (197) 173 374 67
aNumbers of participants responding to question bResponses were scored on a 5-point scale 1 = Strongly favor scarcity philosophy 2 = Favor scarcity philosophy 3 = Neutral 4 = Favor abundance philosophy 5 = Strongly favor abundance philosophy The greater the mean the stronger the preference
LSD test EG PG BG ltO BG = PG EGltBG PG O
SD = 56) than for the environmental subjects The
environmental group slightly favored (mean = 350 SD =
70) the abundance philosophy Mean scores for the other
two groups business (mean = 383 SD = 50) and
professional (mean = 389 SD = 68) fell in between the
mean scores of the environmentalist and the OWIC groups
Mean scores indicated that members of OWIC and the
environmental group were in relative disagreement in terms
93
of resource supply philosophy Perceptual differences
regarding resource supply existed between the OWIC and
environmental group members who responded to the
questionnaire but the majority of the members in both
organizations (environmental = 74 OWIC = 100) were
strongly inclined toward abundance philosophy (mean greater
than 30) There was no critical outlier observed in
distributions of scores for either group Mean
distributions for both the business and professional groups
were normal with the exception of one outlier observed for
the business group This outlier may have influenced the
total mean score for the business group which indicated a
strong tendency toward abundance philosophical orientation
In summary a statistically significant difference was
found between mean scores for OWIC in terms of resource
supply philosophical orientation The data indicated
however that the environmental group tended less toward
the abundance philosophical orientation Although 42 of
OWIC members represented environmental organizations the
organization tended more toward abundance philosophy the
WRUNA model ideal than did the environmental constituent
groups The business and professional groups were
positioned between the environmentalist and OWIC groups
with mean scores indicating a moderate abundance
philosophical orientation
94
Conflict Management Style
Tables 6 through 8 summarize the one-way analysis of
variance results on preferred conflict management styles of
the OWIC and constituent groups Means indicated that the
preferred conflict management style was solution
orientation for all four groups The smaller the mean the
greater the tendency toward solution orientation conflict
management style (range 1 to 7) the tendency of the OWIC
(mean = 305 SD = 49) and professional (mean = 328 SD =
113) groups were relatively stronger (F = 392 df =
3148 p = 01) than that of the environmentalist (mean =
362 SD = 81) and business (mean = 377 SD = 93)
groups
The number of respondents for the OWIC and the
professional groups was about the same (19 and 20
respectively) but the standard deviation for the
professional group was nearly double that for OWIC (113
versus 49) The scores for the OWIC group were fairly
evenly distributed but to some extent it was skewed toward
very often on solution orientation There was no obvious
outlier observed in the data Score distribution for the
professional group was very uneven 90 of the members
scores fell between 2 (very often) and 4 (sometimes) on
questionnaire items related to solution orientation There
were two outliers observed but the more critical outlier
was toward the extreme of never
95
Table 6 ANOVA results on solution orientation management style
Source SS df MS p
Between groups 887 3 296 392 01
Within groups 11167 148 75
Total 12054 151
Group na Meanb SD
Environmentalist 61 362 81
Business 52 377 93
Professional 20 328 113
OWIC 19 305 49
Total 152 355 89
aNumbers of participants responding to question items bResponses scored on a relative scale (3 = strongly favored 4 = favored)
LSD test (0 = PG) lt (EG = BG)
Table 7 ANOVA results on nonconfrontation conflict management style
Source SS df MS p
Between groups 59 3 20 34 79
Within groups 8659 150 58
Total 8719 153
Group na Meanb SD
Environmentalist 63 497 75
Business 52 492 76
Professional 20 501 98
OWIC 19 512 50
Total 154 498 75
aNumbers of participants responding to question 6Responses re conflict management behavior were scored on a 7-point scale 4 = sometimes and 5 = seldom and 6 = very seldom
96
Table 8 ANOVA results on control conflict management style
Source SS df MS
Between groups 887 296 392 01
Within groups 11167 148 75
Total 12054 151
Group na Meanb SD
Environmentalist 62 432 88
Business 51 405 95
Professional 19 408 115
OWIC 19 450 87
Total 151 422 94
aNumbers of participants responding to question items bResponses were scored on a relative scale 4 = sometimes 5 = seldom
3
The business and environmental groups were moderately
oriented toward solution orientation Their mean standard
deviations were the same One outlier was observed in the
environmental group Two possibly three outliers were
observed in the business group Scores of these outliers
indicated that they preferred conflict management styles
other than solution orientation The respective group mean
scores regarding solution orientation as the preferred
conflict management style may have been skewed downward by
the outlier scores
Table 7 shows that the OWIC (mean = 512 SD = 50)
and constituent groups (mean score range = 492 to 501)
were consistent for items measuring nonconfrontation
conflict management style behavior (df = 3 150 F = 34
97
p = 79) On the 7-point scale used to measure conflict
management style preference 5 indicated seldom Thus
the mean scores indicated that all groups tended toward
seldom use of the nonconfrontation style As already
discussed in chapters 2 and 3 nonconfrontation combines
avoiding (ie refusal to discuss the conflict) and
smoothing (ie accommodate to cover up the conflict)
styles of conflict management (Putnam amp Wilson 1982
Witteman 1991) According to the WRUNAs ideal
guidelines the trend of the nonconfrontation scores toward
seldom indicated a desire to resolve the conflict
The mean score distribution for OWIC is a normal
distribution with scores spread from 38 to 61 The most
critical outliers were observed in the professional and
environmentalist groups The outliers may have influenced
higher mean scores for nonconfrontation conflict management
style The mean score distribution of the business group
is also normally distributed with scores ranging from 30
to 67 However the distribution curve for the business
group is flatter than that for the OWIC group
The four groups did not appear to differ in their
views of control conflict management style (F = 145 df =
3 147 p = 23) (see Table 8) Mean scores for the OWIC
(mean = 450 SD = 87) and environmental (mean = 432 SD
= 88) groups may have reduced because of outlier scores
resulting in a lower frequency for control behavior
Outlier scores may also have distorted the mean scores for
98
the business (mean = 405 SD = 95) and professional (mean
= 408 SD = 115) groups resulting in higher frequency
for control conflict management style
In summary a preference for solution orientation was
strongly indicated by mean scores (3 = often) for the
members of the OWIC and professional group and moderately
indicated by mean scores (4 = sometimes) for
environmentalist and business groups The members of OWIC
and its constituencies tended toward the solution
orientation conflict management style the WRUNA model
ideal
Results of analyses indicated significant difference
between the OWIC and the constituent groups on resource use
orientation resource supply philosophy and preferred
conflict management style The implication of these
findings is that the different instructional interventions
would be appropriate for heterogeneous groups
Results of Analyses of Demographic Data
Sections 4 through 18 of the questionnaire collected
demographic information Section 4 consisted of one
forced-choice item soliciting respondents perceived status
of power in regard to influencing other users in how
resources should be used (1 = more than others 2 = same
as others 3 = less than others 4 = not applicable)
The other sections concerned education level gender
nature of job and interest group affiliations sources of
99
information views toward private and public land
management options and perception of intensity of
conflict This information helped to assess additive and
interactive predictive effects of key variables leading
toward resolution of conflict between the watershed
resource userinterest groups
Demographic data were collected from participants in
the environmental business and professional groups as
well as OWIC In most cases only data on the members of
the constituent organizations were compared and discussed
to suggest instructional interventions Respondents
perceptions were analyses regarding power status and
interactive effect Presentation and discussion of the
results follow
Gender
As Table 9 shows less than one-fourth (234) of
total respondents were female The environmental group had
a larger proportion (367) of women than did the business
and professional groups (91 and 100 respectively) (x2
= 1610 df = 2 p = 00)
Years of Schooling
The mean scores for years of schooling for the
business group (1552) differed significantly from those
of respondents in the environmentalist and professional
100
Table 9 Gender of respondents
Male Female
Group na
Environmentalist 50 633 29 367
Business 50 909 5 91
Professional 18 900 2 100
Total 118 766 36 234
aNumbers of participants responding to question
groups (1706 and 1735 respectively) (F = 758 df = 2
143 p = 00) (Table 10) Results of regression analyses
indicated that educational attainment was a significant
variable in resource use orientation (B = 06 t = 285 p
= 01) however it only explained 6 of the variance (see
Appendix D Table 30)
Table 10 ANOVA results for years of schooling
Source SS df MS p
Between groups 8858 2 4429 758 00
Within groups 83581 143 584
Total 92439 145
aGroup n Mean2 SD
Environmentalist 72 1706 241
Business 54 1552 250
Professional 20 1735 216
Total 146 1653 252
aNumbers of participants responding to question lNean years of schooling possible range 1-22 plt10
101
Power Status
The majority of respondents in all four groups
perceived their power status to be the same as others
The t-test indicated no significant difference in means
either 3 t-test results or in ANOVA (Appendix D Table 16)
Analyses of variance revealed no significant power status
effect on preferred conflict management style (F = 74 df
= 3 115 p = 53) (Table 11 and see other details in
Appendix D Table 17)
Process Participation
Constituent group members were asked about their
involvement in facilitating communication among users of
riparian areas other than through OWIC Professional group
members indicated a relatively higher rate (74) of
participation in the process communication facilitation
than the environmentalist and the business constituencies
(x2 = 2630 df = 2 p = 00) (Table 12) Few
communication facilitation services have been extended
outside OWIC by the business (18) and environmentalist
(20) group members The perceived impact of those
communication facilitation efforts is presented in Appendix
D Table 18 The data revealed that constituent group
member communication facilitation efforts experiences were
similar (F = 93 df = 2 37 p = 41) The respondents
viewed the facilitation process as somewhat productive
(mean = 195 SD = 43)
102
Table 11 ANOVA results for power status in influencing others
Source SS df MS
Between groups 90 3 30 74 53
Within groups 4656 115 40
Total 4746 118
a Group n Meanb SD
Environmentalist 44 198 59
Business 39 200 69
Professional 17 176 66
OWIC 19 184 60
Total 119 193 63
aNumber of participants responding to question bResponses scored on 3-point scale (1 = more than others 2 = same as others 3 = less than others)
Table 12 Frequency of response on involvement in communication facilitation process
Yes No
Group na n
Environmentalist 15 195 62 805
Business 10 179 46 821
Professional 14 37 5 263
Total 39 257 113 743
Note Pearson x2 = 2630 df = 2 p = 00 aNumbers of participants responding to question
Sources of Information
Participants were asked to indicate the importance of
certain sources of information in promoting awareness and
the exchange of ideas in terns of technical social
103
economic and political aspects The sources of
information given in the questionnaire were general
membership meetings special membership meetings published
magazines newsletters and scientific journals committee
meetings friends neighbors and relatives displays at
fairs and other public meeting places government agencies
such as USFS and ELM extension services and personal
toursvisits The analysis of variance indicated
significant differences in mean scores for general
membership meetings (df = 2 128 F = 445 p = 01)
committee meetings (df = 2 120 F = 506 p = 01)
friends neighbors and relatives (df = 2 129 F = 308
p = 05) and Extension Service (df = 2 129 F = 537
p = 01) Table 13 summarizes in descriptive terms the
levels of importance each information See Table 19
through Table 27 (Appendix D) for results of statistical
analysis
Care is needed in interpreting these results because
they are merely based on mean scores The complexity of
the interconnected information network of these groups
warrants serious consideration when designing needs
analysis as well as instructional interventions
Riparian Resource Use Management
In regard to preferred type of riparian landresource
management the pattern of responses for the three groups
differed As Table 14 shows the professional group was
104
Table 13 Descriptive summary of results on importance of selected sources of information
Group
Source Environ- Profes-mentalist Business sional
Magazines Important Important Important newsletters scientific journals
Government agencies Important Important Important
Newspapers and news Important Important Important magazines
Extension Service Somewhat Important Somewhat important important
Special membership Somewhat Somewhat Somewhat meetings important important important
Friends neighbors Important important Somewhat and relatives important
Committee meetings Somewhat Important Important important
Displays--fairs Somewhat Somewhat Somewhat other public important important important meeting places
General membership Somewhat Important Important meetings important
Note Sources are arranged in descending order of mean scores
split between some private and some public lands being
controlled by entrepreneurs (59) and similar management
for all public and private lands (41) The
environmentalist group was similarly split except for one
outlier but similar management for all public and private
lands was strongly favored (76) The business groups
responses were widely and unevenly distributed but favored
private lands (37) or some private and some public lands
105
(39) being controlled by riparian areas resource users
Results of analyses indicated that views of the
environmentalist and business groups regarding riparian
landresource management differed significantly
(Kolmogorov-Smirnov 2-Sample Test Z = 310 p = 00)
Interestingly 80 or more of the participants in each
group responded that Oregons riparian areas resource
usemanagement conflict could be successfully managed
(Table 28 Appendix D)
Almost all of the study participants in the
environmental business and professional groups indicated
that riparian resource usemanagement is a controversial
issue The total group mean (277) indicated that the
perceived degree of conflict was greater than moderate but
less than severe (2 = moderate and 3 = severe) (Table
29 Appendix D) The implication of these findings was
that there is need for instructional intervention to reduce
conflict According to the literature on conflict
management conflict management intervention should be
attempted when a problem creates conflict of severe
intensity (Rahim 1992)
106
Table 14 Frequency data on type of riparian land management
Nonel One type2 Bothtvpes3 A114
Group n
Environmental 1 14 16 222 55 764
Business 2 39 19 373 20 392 10 196
Professional - - 10 588 7 412
Total 2 14 20 143 46 329 72 514
Note For environmental and business groups only Kolmogorov-Smirnov 2-Sample Test (n= 72 n = 51) Z= 310 p= 00
Land use philosophy Classi- Environ- Busi- Profes-fication mental ness sional
All public and all private 4 775 192 412 land
All public and some private 3 338 216 438 land
All public and no private land 2 86 347 63
Some public and all private 3 57 41 63 land
Some public and some private 3 86 300 500 land
Some public and no private 2 43 417 125 land
No public and all private land 2 29 41 63
No public and some private 2 29 61 63 land
No public and no private land 1 29 42 63
Demographic Variables as Predictors
Stepwise multiple regression analyses were employed to
determine whether any meaningful relationship existed
between dependent and independent variables The dependent
variables were preferred conflict management style (ie
control nonconfrontation and solution orientation)
107
resource use orientation and resource supply philosophy
Table 30 through Table 32 (see Appendix D) summarize the
results of these regression analyses The criterion for
inclusion of an independent variable was set at 1
probability confidence level exclusion was set at 15
probability level The independent variables included were
power status land management gender educational
attainment perceived level of conflict intensity and
conflict management
Five fitted regression equations when environmental
and business groups were pooled for analysis purposes
There was equal opportunity for each dependent variable to
pick among the independent variables Results of the
regression analyses indicated a significant educational
attainment effect on resource use orientation (n = 77 B =
06 t = 285 p = 01) (Table 30 in Appendix D) However
this independent variable explained only 10 of the total
variance The land management and conflict management
variables (third regression equation) explained 13 of the
total variance regarding resource supply philosophy was
explained Conflict management and power status variables
interacted significantly regarding the solution orientation
variable however they explained only 8 of the variance
Two regression equations for the environmentalist
organizations and four regression equations for the
business organizations were generated when individual
regression analyses were employed for the respective
108
organizations For the environmental group the conflict
management variable predicted 13 of the variance for the
resource supply philosophy variable (n = 40 B = -71 t =
-235 p = 02) and the land management variable predicted
15 of the variance for control conflict management style
(n = 40 B = -71 t = -254 p = 02) (Table 31 in
Appendix D)
For the business group the conflict management
variable was observed to be a pertinent predictor in the
first and second equations It accounted for 10 of the
variance for control conflict management style variable
(n = 37 B = -76 t = -202 p = 05) It played a key
role in predicting the variance for solution orientation
conflict management style but not for control conflict
management style The theoretical inference from this
finding is that instructional interventions designed to
reduce preference for control style will effect increased
preference for solution orientation style among business
group members In the third regression equation both
conflict management and power status variables contributed
25 of the variance for solution orientation conflict
management style (Table 32 Appendix D) In the last
equation the intensity of the conflict variable explained
8 of the total variance for nonconfrontation conflict
management style (n = 37 B = 52 t = 174 p = 09)
In summary the predictor variables supported logical
interpretation of the coefficients and persistency in tetms
109
of sign directions and magnitude of the standard errors of
the regression coefficients Of the given independent
variables the most frequent predictor variables observed
in the regression equations were land management conflict
management power status and educational attainment The
interactive effect of conflict management and power status
variables explained the maximum variance for solution
orientation style among the business organizations The
analyses revealed interrelated aspects between resource use
orientation resource supply philosophy and preferred
conflict management style under the given independent
variables of power status source of information and land
management
Credibility of the Instrument
Validation of the instrument developed for this study
occurred in two phases As discussed in Chapter 3 the
instrument a mail survey questionnaire was validated by
eight expert panel members who understood riparian
watershed resource issues The experts communicated their
comments independently on the consistency accuracy and
clarity of the questionnaire items The draft instrument
was revised on the basis of the experts comments The
researcher discussed the study and the instrument with the
OWIC member charged with moderating OWIC meetings He
110
confirmed that the WRUNA models targeted goals
corresponded with OWICs expectations
Cronbachs alpha was used to estimate the internal
consistency reliability of the instrument (Table 15) The
alpha coefficients were 85 and 78 for the corresponding
15 and 6 items in Sections 1 and 2 respectively of the
questionnaire For the 7 control 12 nonconfrontation and
11 solution orientation items the alpha coefficients were
79 91 and 71 respectively The conflict management
style items were adapted from the OCCI (Putnam Ey Wilson
1982)
Table 15 Internal reliability of the WRUNA-based instrument
Number Number Alpha of of Coeffi-
Variable Cases Items Mean SD cient
Resource use orientation 183 15 83 28 85 (single vs multiple
Resource supply philosophy 183 6 347 37 78 (abundance vs scarcity)
Conflict management style a Nonconfrontation
(avoidance) 105 12 505 66 79 b Solution Orientation 105 11 339 42 91 c Control 105 7 417 95 76
Note Resource use orientation mean could range from 0 to 2 the smaller the mean the stronger the orientation toward multiple use Resource supply philosophy mean could range from 1 to 5 the larger the mean the stronger the orientation toward abundance philosophy The conflict management style mean could range from I to 7 the smaller the mean the greater the frequent use of certain conflict communication strategies (1 = always and 7 = never)
111
The alpha coefficients for nonconfrontation and
solution orientation conflict management styles were very
close to the Nunnalys average standard alpha coefficient
(80 to 90) whereas the alpha coefficient for control
conflict style was not (Womack 1988b) (see Table 33
through Table 35 in Appendix D for the effect of item
changes on the alpha values)
Tables 36 through Table 39 (Appendix D) present
summaries of the correlation coefficients between the
dependent variables resource use orientation resource
supply philosophy and conflict management style (ie
control nonconfrontation or solution orientation) for the
different demographic conditions in this study Table 36
indicates no significant correlation coefficients The
magnitude of the coefficients ranged from 06 to 46 The
results indicated that the dependent variables were
independent measures
Table 37 through 39 indicate correlation of at least
one with independent variable and dependent variable Only
one significant negative correlation was observed at 01
probability level between control and nonconfrontation
conflict management styles for environmentalist group
conditions It had a -31 correlation coefficient
magnitude The negative sign was appropriate for control
and nonconfrontation conflict management styles because
when control is increased nonconfrontation decreases
This type of pattern was observed in the study Thus the
112
negative correlation sign helps rather than hinders the
measuring credibility of the instrument The other inter-
factor correlation measures presented in Table 37 were
observed to be independent
As Table 38 shows a significant negative correlation
(-49) was observed between solution orientation and
resource supply philosophy at 001 probability level for
business group conditions In other words as the
preference for solution orientation conflict management
style increases the orientation toward scarcity philosophy
would become weaker or toward abundance philosophy
stronger This relationship was previously described under
Conflict Management Style in the Results of Needs
Assessment section of this chapter The independence of
the estimates is reflected from non-correlation between
other factors in Table 38
As Table 39 shows only one negative correlation was
observed between solution orientation and control conflict
management styles at the 01 level of significance under
professional group conditions The magnitude of the
correlation coefficient was -67 The meaning of this
negative correlation appears to be if control conflict
management style is decreased then solution orientation
conflict management style is increased and vice versa
The table does not show other variables having significant
relationships with one another In summary it is
reasonable to interpret correlation measures of statistics
113
favoring the non-interdependence of the independent
variables in the WRUNA-based instrument namely resource
use orientation resource supply philosophy and conflict
management style (ie control nonconfrontation or
solution orientation) under OWIC environmentalist
business or professional group conditions
Following are key observations made by the researcher
regarding data collection during the course of the study
1 Many participants (range 35-51) did not respond to all
items in Section 3 especially to item numbers 13 15
16 18 21 25 and 29 Of these individuals five
indicated that they did not have the knowledge or the
items were not applicable to them A few of the
respondents did not feel comfortable in responding to
some of the items in Section 3
2 Sections 1 and 2 (on resource use orientation and
resource supply philosophy respectively) of the
instrument showed good return Only 8 to 12
respondents did not complete these sections
3 Section 11 on the land management independent
variable was not responded to by about 34
participants A few of the respondents provided
feedback that they did not understand the question or
they could not properly respond to the question unless
a specific site problem was given
In general the content of the questionnaire was
appreciated by many of the respondents as evidenced by
114
such comments as It is worth doing A few responded
that the questions might be hard because the riparian issue
is hard too
115
5 SUMMARY AND CONCLUSIONS
The purpose of the study was to investigate needs
assessment methods that would facilitate the development of
target-based instructional interventions designed for
managing conflict between Oregons riparian watershed
resource userinterest groups To achieve this goal a
needs assessment model specific to conflict management
needs of watershed resource userinterest groups was
developed based on the theoretical and conceptual
framework from available literature and discussion of the
natural resource usemanagement concepts and issues with
concerned authorities working on that area An instrument
was developed to assess the perceptions and attitudes of
watershed resource users toward watershed resource use
watershed resource supply and conflict management style
The instrument was administered to the 20 members of the
Oregon Watershed Improvement Coalition (OWIC) and 287
members randomly selected from its constituent
organizations The response rate was 95 from the OWIC (n
= 19) and about 64 (n = 183) from the constituencies
including five blank returned questionnaire who remarked
either the instrument questions were not applicable to
their interest or they dont have enough knowledge about
riparian zones resource usemanagement issues
OWIC is a case study for consensus building among
watershed resource usersinterest groups and other
116
concerned parties The primary target population the nine
OWIC constituencies are comprised of environmentalist
business and professional organizations
Natural resource use and management issues are complex
in nature and cannot be appropriately resolved until the
perceptions and attitudes of the usersinterest groups are
understood The present study was an exploratory
research-based attempt to justify the development of
target-based instructional interventions for managing
conflict among such groups in potential long-term conflict
Discrepancy analysis was employed to determine the gap
between the existing and desired orientations of OWIC and
constituent group members toward watershed resource
usemanagement and conflict management style The desired
or ideal profile (what they should be) is a component of
the watershed resource users needs assessment (WRUNA) model
developed in this study The three characteristics of the
ideal profile were derived from OWIC literature They are
multiple-use orientation abundance philosophy and
solution orientation conflict management style
Results of analyses indicated that regarding multiple
use OWICs profile was similar to that of the
environmental group and dissimilar to that of the business
and professional groups The OWIC and environmental groups
were relatively less oriented to multiple use compared to
the other groups It should be noted that OWIC membership
represents environmentalist (42) business (32)
117
professional (21) groups and also includes a (5)
publicist
Regarding resource supply philosophy the OWIC group
was more oriented toward abundance philosophy than were the
business and professional groups which were closer to that
orientation than the environmentalist group which tended
toward scarcity philosophy
The preferred conflict management style for OWIC and
the constituent groups was observed to be solution
orientation OWIC and professional group members were
relatively more oriented toward solution orientation style
than the environmentalist and business group members which
were similar in regards to this dependent variable The
OWIC and the constituent groups were not different from
each other in terms of nonconfrontation and control
conflict management style preference in riparian conflict
situations
In summary results showed that OWIC has achieved the
WRUNA model ideal profile in terms of abundance philosophy
and solution orientation style but not in terms of
multiple use of the riparian watershed resources OWIC and
the constituent groups were quite similar in terms of
control and nonconfrontation styles of conflict management
but they were different to some degree in terms of multiple
use abundance philosophy and solution orientation styles
OWIC differed from the business groups in terms of multiple
use and from the environmentalist and business groups in
118
terms of abundance and solution orientation styles
Similarly the business group differed from the
environmentalist group in terms of multiple use and
abundance philosophy but was similar in terms of the three
conflict management styles
Conclusions
The watershed resource users needs assessment (WRUNA)
instrument appeared to be fairly reliable except one
factor control conflict management style The content of
the instrument was validated by a panel of eight experts in
the field of natural resource management and by the
moderator of the OWIC organization The key factors are
fairly independent from each other when controlled under
the OWIC organization the only significant relationships
appeared between control and nonconfrontation conflict
management styles under the environmental organization
and between solution orientation conflict management style
and abundance philosophy under the business group
Care should be taken in interpreting the findings of
the study It was exploratory in design Most of the
findings were based on average scores Outliers were
observed therefore skewed distributions were possible
The study synthesized participants perceptions and
attitudes direct observation was lacking Case-related
119
information is restrictive in generalizing the study
results and implications to other situations
The question arises how can the data generated by the
needs assessment be used to develop instructional
interventions to manage conflict among the watershed
resource usersinterest groups and how can these
interventions be effectively implemented into the existing
communicationfacilitation process
First the instrument questions particularly the
multiple-single resource use items (Section 1) abundance-
scarcity items (Section 2) and conflict management style
items (Section 3) were reliable and appeared to be valid
Identification of variations between OWIC group and the
constituent groups as well as between the constituencies
and between the ideal profile was assisted Further the
analysis of the results showed that these three variables
estimated the parameters fairly independently No major
correlation problems were observed except with a couple of
parameters in conflict management style and abundance
philosophy Therefore a training interventions package
could be developed by looking at the homogeneous and
heterogeneous aspects revealed by the instrument For
example environmentalist and business groups were found to
be divergent in terms of multiple-use and abundance
philosophical orientations therefore different
instructional interventions are indicated for these groups
Both however could benefit from the solution orientation
120
instructional intervention as could OWIC and the
professional group
The exploration of opportunities and possibilities for
the promotion of communication among watershed resource
userinterest groups is a priority for future study
because it will assist in extendingimparting the
instructional interventions to those groups This study
reviewed the status of the constituencies in respect to the
means for acquiring information on managing riparian
resources Published material such as magazines
newsletters brochures and scientific journals were
indicated to be important to all groups and government
agencies were indicated to be important The importance of
other means of acquiring information to the three groups
varied However these findings should provide a guide for
better exchange and communication with Oregons riparian
resource userinterest groups that will assist in gathering
further demographic information and implementing target-
based instructional interventions
A research agenda was suggested by the experience of
this study It was realized that more efforts are needed
to simplify the instrument Some of the questions related
to the conflict management styles under the riparian
conflict conditions need to be rewritten This fact was
evidenced by the poor response rate for this section Some
of the unimportant and repeated items should be replaced
with item conveying clear meaning of the required
121
information Therefore interdisciplinary team research
efforts especially close collaboration of instructional
specialist speech and communications professionals and
naturalenvironmental resource usemanagement specialist
are suggested to find the relevant variables The land
management philosophy question (Question 11) needs to be
improved to generate more feedback from respondents
There is a need to add questions to the instrument
which would determine conflict and conflict management-
related communication exchange status and its directions
only between business and environmentalist groups This
information could promote communication facilities between
the usersinterest groups as well as facilitate planning
activities by instructional designers natural and
environmental resource usemanagement managers
researchers and mediators for reducingmanaging conflict
among natural resource usersinterest groups
122
REFERENCES
Amy D J (1987) The politics of environmental mediation New York Columbia University Press
Beer M amp Walton A E (1987) Organization and development Annual Review of Psychology 38 339-367
Bingham G (1986) Resolving environmental disputes Washington DC The Conservation Foundation
Bisno H (1988) Sage
Managing conflict Newbury Park CA
Blake R R amp Mouton J S (1964) grid Houston Gulf Publishing
The managerial
Blake R R amp Mouton J S (1985) III Houston Gulf Publishing
The managerial grid
Boulding K E (1968) Preface to special issue Journal of Conflict Resolution 12 409-411
Bower J L (1965) The role of conflict in economic decision-making groups Some empirical results Quarterly Journal of Economics 79(2) 263-77
Brown L R (1991) Global resource scarcity is a serious problem In M Polesetsky (Ed) Global resources Opposing viewpoints (pp 17-23) San Diego CA Greenhaven Press
Buckely W Burns T amp Meeker L D (1974) Structural resolutions of collective action problems Behavioral Science 19 277-297
Bureau of Land Management (1992) The range of our vision Range Magazine 1(1) p 39
Canary D J Cunningham E M amp Cody M J (1988) Goal types gender and locus of control in managing interpersonal conflict Communication Research 15(4) 426-446
Chanin M N amp Schneer J A (1984) A study of the relationship between Jungian personality dimensions and conflict-handling behavior Human Relations 37(10) 863-879
123
Clawson M (1987) From sagebrush to sage The making of a natural resource economist Washington DC Ana Publications
Clay J (1962) My life on the range An introduction by Donald R Ornduff Norman University of Oklahoma Press
Conacher A (1980) Environmental problem-solving and land-use management A proposed structure for Australia Environmental Management 4(5) 391-405
Cusick S (1993 September) After years of abuse federal policy on Western lands is ripe for reform Audubon Activist pp 1 4-5
Daly H E (1991) Towards an environmental macroeconomics Land Economics 67(2) 255-259
Daves W F amp Holland C L (1989) The structure of conflict behavior of managers assessed with self- and subordinate ratings Human Relations 42(8) 741-56
Dechaud S (1992) With quadrupled grazing fees threatened and the timber industry stressed the folks of Lake County Oregon have much to be worried about Range Magazine 1(1) pp 24-26
Deutsch M (1949) A theory of cooperation and competition Human Relations 2 129-152
Deutsch M (1971) Toward and understanding of conflict International Journal of Group Tensions 1 42-54
Dewees P A (1989) The woodfuel crisis reconsidered Observations on the dynamics of abundance and scarcity World Development 17(8) 1159-1172
Dillman D A (1978) Mail and telephone surveys The Total Design Method New York John Wiley amp Sons
Eisgruber L M (1992) Sustainable Development Ethics and Endangered Species Act Unpublished manuscript Oregon State University Department of Agricultural and Resource Economics Corvallis
Fege A S McCarthy-Ryan C Munson L amp Schreyer R (1989) Managing visitor conflicts In D W Lime (Ed) Proceedings of the Conference on Managing Americas Enduring Wilderness Resource (pp 383-396) Minneapolis University of Minnesota Tourism Center Minnesota Extension Service and Minnesota Agriculture Experiment Station
124
Filley A (1975) A interpersonal conflict resolution Glenview IL Scott Foresman
Frederick K D amp Sedjo R A (1991) Overview Renewable resource trends In K D Frederick amp R A Sedjo (Eds) Americas renewable resources Historical trends and current challenges (pp 1-21) Washington DC Resources for the Future
Gagne M (1982 June) Development in learning psychology Implications for instructional design and effects of computer technology on instructional design and development Educational Technology 22(6) 11-15
Gentile J R (1989) Environmental cooperation Panacea or myth Society and Natural Resources 2 85-90
Gick M L (1986) Problem-solving strategies Educational Psychologist 21(1 amp 2) 99-120
Gick M L amp Holyoak K J (1979) Problem solving and creativity In A Glass K Holyoak amp J Santa (Ed) Cognition (pp 391-441) Reading MA Addison Wesley
Groen G J amp Patel V L (1991) A view from medicine In M U Smith (Ed) Toward a unified theory of problem solving Views from the content domains (pp 35-44) Hillsdale NJ Lawrence Erlabaum Associates
Gudykunst W B Ting-Toomey S amp Chua E (1988) Culture and interpersonal communication (Sage Series Interpersonal Communication 8) London Sage
Guilford J P (1954) Psychometric methods New York McGraw-Hill
Hardin G (1968) The tragedy of the commons Science 162 1243-1248
Hess K Jr (1992) Visions upon the land Man and nature on the western range Washington DC Island Press
Howe C W (1979) Natural resource economics Issues analysis and policy New York John Wiley amp Sons
Howell J L (1981) The identification description and analysis of competencies focused on conflict management in a human services organization An
125
exploratory study Unpublished doctoral thesis University of Massachusetts
Izaak Walton League of America (1982) Conservation policies of the Izaak Walton League of America (IWLA) Arlington VA Author
Jandt F E amp Hare M (1976) Instruction in conflict resolution Urbana IL ERIC Clearinghouse on Reading and Communication Skills
Jorgenson D O amp Papciak A S (1981) The effects of communication resource feedback and identifiability on behavior in a simulated commons Journal of Experimental Social Psychology 17 373-385
Kabanoff B (1987) Predictive validity of the MODE conflict instrument Journal of Applied Psychology 72 160-163
Kaufman R A (1972) Educational system planning Englewood Cliffs NJ Prentice-Hall
Kaufman R (1982) Identifying and solving problems A system approach (3rd ed) San Diego CA University Associates Publishers
Kaufman R (1987) A needs assessment primer Training and Development Journal 41(10) 78-83
Kaufman R (1988) Planning educational systems A result based approach Lancaster PA Technomic Publishing Company Inc
Kaufman R A amp English F W (1976) Needs assessment A guide to improve school district management Arlington VA American Association of School Administrators
Kilmann R H amp Thomas K W (1977) Developing a forced-choice measure of conflict-handling behavior The MODE instrument Educational and Psychological Measurement 37 309-325
Kleinbaum D G amp Kupper L L (1978) Applied regression analysis and other multivariate methods Massachusetts Duxbury Press
Knapp M L Putnam L L amp Davis L J (1988) Measuring interpersonal conflict in organizations Where do we go from here Management Communication Quarterly 1(3) 414-429
126
Kowalski T J (1988) The organization and the planning of adult education Albany State University of New York Press
Krueger W C (1992) Building consensus for rangeland uses Rangelands 14(1) 38-41
Lawrence P R amp Lorch F W (1967) Differentiation and integration in complex organizations Administrative Science Quarterly 12(1) 1-47
Leritz L (1987) No-fault negotiating Portland OR Pacific Press
Lewis T amp Bjorkquist D C (1992) Needs assessment--A critical reappraisal Performance Improvement Quarterly 5(4) 33-54
Libecap G D (1981) Locking up the range Federal land control and grazing Cambridge MA Bollinger Publishing Company
Likert R (1961) New patterns of management New York McGraw-Hill
Masberg B A (1992) Determination of the value to planners of incorporating ecotourist needs data in the interpretive planning process Unpublished doctoral thesis Oregon State University Corvallis
Mayer R (1990) Conflict management The courage to confront Columbus OH Batelle Memorial Institute
Mernitz S (1980) Mediation of environmental disputes New York Praeger
Miller A (1982) Environmental problem-solving Psychosocial factors Environmental Management 6(6) 535-541
Miller A (1985) Psychosocial origins of conflict over pest control strategies Agriculture Ecosystems and Environment 12 235-251
Moncur J E T amp Pollock R L (1988) Scarcity rents for water A valuation and pricing model Land Economics 64(1) 62-72
Monette M L (1977) The concept of educational need An analysis of selected literature Adult Education 27(2) 116-127
127
Monette M L (1979) Need assessment A critique of philosophical assumptions Adult Education 29(2) 83-95
Nadler D A Hackman R J amp Lawler E E III (1979) Managing organizational behavior Boston Little Brown
Nelson G (1989) The public lands An endangered species In D W Lime (Ed) Proceedings of the Conference on Managing Americas Enduring Wilderness Resource (pp 18-21) Minneapolis University of Minnesota Tourism Center Minnesota Extension Service and Minnesota Agriculture Experiment Station
Newell A amp Simon H A (1972) Human problem solving Englewood Cliffs NJ Prentice Hall
Obermiller F W (1990) Introduction to the Economics Session Society for Range Management 1990 Annual Meeting Reno Nevada In F W Obermiller amp D Reesman (Eds) Current issues in rangeland resource economics (pp ii-vi) Corvallis Oregon State University Extension Service
Okey J R (1990) Tools of analysis in instructional development Educational Technology 30(6) 28-33
Olson J M amp Ross M (1984) Perceived qualifications resource abundance and resentment about deprivation Journal of Experimental Social Psychology 20 425-444
Pendell S D (1990) Deviance and conflict in small group decision making An exploratory study Small Group Research 21(3) 393-403
Perez R S (1991) A view form trouble-shooting In M U Smith (Ed) Toward a unified theory of problem solving Views from the content domains (pp 115-153) Hillsdale NJ Lawrence Erlbaum Associates
Petak W J (1980) Environmental planning and management The need for an integrative perspective Environmental Management 4(4) 287-295
Platt J (1973) Social traps American Psychologist 28 641-651
Pondy L R (1967) Organizational conflict Concepts and models Administrative Science Quarterly 12 296-320
128
Putnam L L (1988) Communication and interpersonal conflict in organizations Management Communication Quarterly 1(3) 293-301
Putnam L L amp Jones T S (1982) The role of communication in bargaining Human Communication Research 8 262-280
Putnam L L amp Poole M S (1987) Conflict and negotiation In F M Jablin L L Putnam K H Roberts amp L W Porter (Eds) Handbook of organizational communication An interdisciplinary perspective (pp 549-599) New York Sage
Putnam L L amp Wilson C E (1982) Communicative strategies in organizational conflicts Reliability and validity of a measurement scale In M Burgoon (Ed) Communication yearbook 6 (pp 629-652) Beverly Hills CA Sage
Rahim M A (1992) Managing conflict in organizations (2nd ed) New York Praeger
Rahim M A amp Bonoma T V (1979) Managing organizational conflict A model for diagnosis and intervention Psychological Report 44 1323-1344
Remmers H H (1954) Introduction to opinion and attitude measurement New York Harper amp Brothers
Renwick P A (1977) Effects of sex differences on the perception and management of conflict An exploratory study Organizational Behavior and Human Performance 19 403-415
Rifkin J (1992) Beyond beef The rise and fall of the cattle culture Dutton NY Penguin Books
Rifkin J amp Rifkin C G (1992) Your complete environmental guide to making political choices in the 1990s Voting green New York Doubleday
Robison M H amp Miller J R (1989) Regional economics and wild land amenity use In D W Lime (Ed) Proceedings of Conference on Managing Americas Enduring Wilderness Resource (pp 589-596) Minneapolis University of Minnesota Tourism Center Minnesota Extension Service and Minnesota Agriculture Experiment Station
Rosenberg E (1992) Towards sustainable development A holistic conceptual approach Unpublished manuscript
129
Oregon State University Department of Agricultural and Resource Economics Corvallis
Rosenberg M J (1982 September) The ABCs of ISD Training and Development Journal 36(9) 44-50
Ross R G (1982) The development and evaluation of a self-report instrument to measure conflict management style Unpublished doctoral thesis Ohio University
Ross R G amp DeWine S (1988) Assessing the Ross- Dewine conflict management message style Management Communication Quarterly 1(3) 389-413
Rossett A (1987) Training needs assessment New Jersey Educational Technology Publications
Rossett A (1990) Overcoming obstacles to needs assessment Training 27(3) 36-41
Rutte C G Wilke H A M amp Messick D M (1987) Scarcity or abundance caused by people or the environment as determinants of behavior in the resource dilemma Journal of Experimental Social Psychology 23 208-216
Sampson R N (1981) Farm land and wasteland A time to choose overcoming the threat to Americas farm and food future Emmaus PA Rodale Press
Savonen C (1992) Summer in the city Oregons Agricultural Progress 39(12) pp 24-29
Seiler J A (1963) Diagnosing interdepartmental conflict Harvard Business Review 41 121-32
Shearman R (1990) The meaning and ethics of sustainability Environmental Management 14(1) 1-8
Shockely-Zalabak P (1988) Assessing the Hall conflict management survey Management Communication Quarterly 1(3) 302-320
Simon J L (1991) Global resource scarcity is a serious problem In M Polesetsky (Ed) Global resources Opposing viewpoints (pp 24-28) San Diego CA Greenhaven Press
Sinden J A amp Worrell A C (1979) Unpriced values Decisions without market prices New York John Wiley amp Sons
130
Smith M U (1991) A view from biology In M U Smith (Ed) Toward a unified theory of problem solving (pp 1-19) Hillsdale NJ Lawrence Elbaum Associates
Sork T J amp Caffarella R S (1989) Planning programs for adults In S B Merriam amp P M Cunningham (Eds) Handbook of adult and continuing education (pp 233-245) San Francisco Jossey-Bass
Spitzer D R (1981) Training technology Analyzing training needs Educational Technology 21(11) 36-37
Stankey G H amp Clark R N (undated) Social aspects of new perspectives in forestry A problem analysis Milford PA Grey Tower Press
Stern P C (1976) Effect of incentives and education on resource conservation decisions in a simulated commons dilemma Journal of Personality and Social Psychology 43(6) 1285-1292
Stern P C (1992) Psychological dimensions of global environmental change Annual Review Psychology 43 269-302
Sullivan T J (1984) Resolving development disputes through negotiations New York Plenum Press
Susskind L amp Weinstein A (1980) Towards a theory of environmental dispute resolution Environmental Affairs 9 311-357
Sweller J amp Levine M (1982) Effects of goal specificity on means-ends analysis and learning Journal of Experimental Psychology Learning Memory and Cognition 8(5) 463-474
Talarowski F S Jr (1982) Attitude toward and perceptions of water conservation in a southern California community Unpublished doctoral thesis University of California Santa Barbara
Temkin T amp Cummings H W (1986) The use of conflict management behaviors in voluntary organizations An exploratory study Journal of Voluntary Action Research 15(1) 5-18
Tesolowski D G Newton A F amp Cureton J H (1988) Needs assessment The twilight zone of management Performance and Instruction 27(1) 26-30
Thomas K (1976) Conflict and conflict management In M D Dunnette (Ed) Handbook of industrial and
131
organizational psychology (pp 889-935) Chicago Rand McNally
Thomas K W (1988) The conflict handling modes toward more precise theory Management Communication Quarterly 1(3) 430-436
Thomas K W amp Kilmann R H (1978) Comparison of four instruments measuring conflict behavior Psychological Reports 42 1139-1145
Thompson J D (1960) Organizational management of conflict Administrative Science Quarterly 4(4) 389-409
Ting-Toomey S (1984) Conflict communication styles in black and white subjective cultures Paper presented at the Annual Meeting of the International Communication Association San Francisco CA
US Department of Agriculture (1990) The Forest Service program for forest and rangeland resources A long-term strategic clan Washington DC US Superintendent of Documents
Walton R E amp Dutton J M (1969) The management of interdepartmental conflict A model and review Administrative Science Quarterly 14 73-84
Walton R E amp McKersie R B (1965) A behavioral theory of labor negotiations An analysis of a social interaction system New York McGraw-Hill
Ware J (1983) Some aspects of problem solving and conflict resolution in management groups In L A Schlesinger R G Eccles amp J J Gabarro (Eds) Managing behavior in organizations Text cases readings (PP 101-115) New York McGraw-Hill
Ware J P amp Barnes L B (1983) Managing interpersonal conflict In L A Schlesinger R G Eccles amp J J Gabarro (Eds) Managing behavior in organizations Text cases readings (pp 196-209) New York McGraw-Hill
Watkins G A (1974) Developing a water concern scale Journal of Environmental Education 5(4) 54-58
Weider-Hatfield D (1988) Assessing the Rahim organizational conflict inventory-II (ROCI-II) Management Communication Quarterly 1(3) 350-366
132
Williams F (1986) Reasoning with statistics How to read auantitative research (3rd ed) New York Holt Rinehart Winston
Wilson S R amp Waltman M S (1988) Assessing the Putnam-Wilson organizational communication conflict instrument (OCCI) Management Communication Quarterly 1(3) 367-388
Witteman H (1986) The interpersonal problem solving process Problem conceptualization communication and outcome Unpublished doctoral thesis University of Wisconsin Madison
Witteman H (1988) Interpersonal problem solving Problem conceptualization and communication use Communication Monographs 55 336-359
Witteman H (1991) Group member satisfaction A conflict-related account Small Group Research 22(1) 24-58
Womack D F (1988a) Assessing the Thomas-Kilmann conflict mode survey Management Communication Ouarterly 1(3) 321-349
Womack D F (1988b) A review of conflict instruments in organizational settings Management Communication Quarterly 1(3) 437-445
Wondolleck J M (1988) Public lands conflict and resolution Managing national forest disputes New York Plenum Press
Zemke R amp Kramlinger T (1989) Figuring thins out A trainers guide to needs and task analysis Reading MA Addison-Wesley
APPENDICES
133
APPENDIX A
COVER LETTERS
DEPARTMENT OF RANGELAND RESOURCES
OREGON STATE UNIVERSITY Scrand Agriculsstre Kali 252 - Corvallis Oregon 97331-22IE
Teicphoec 503737-334 Fax 503-737-0504
March 5 1993
TO OWIC Members
FROM William C Krueger
SUBJECT Study of OWIC
Enclosed is the survey to study the attitudes of each of us as members of the Oregon Watershed Improvement Coalition_ Mr Ikram Saeed will use the results of this study as a part of his PhD program in Education In addition he needs to survey a random selection of members of the member organ nations Would each of you send me the directory of your organization so Ilc-am can draw 30 random members to complete the same survey If you would like the directory returned he will do that If you cannot send the directory because of orgpnizational policy please let me know and we will try to arrange a process to secure a random sample from our member organizations_
This approach will allow ampram to determine how we within OWIC believe how we relate to conflict and how we are the same or different from a random sample of our peers Since the OWIC membership is small it is important for each of us to respond Please take a few minutes to fill out and return this questionnaire this week
Tne results should be interesting to all of us
Enclosure
Redacted for privacy
134
DEPARTMENT OF RANGELAND RESOURCES
OREGON STATE UNIVERSITY Scran griculturc 202 - Corvallis Oregor 97332218
Ttitphmte 503737-3341 Fax 5037370504
March 11 1993
We are studying the ways for promoting communication among the many potential watershed resource users We are therefore asking users and others interested in the use of watershed resources about their perceptions and positions on the uses of resources This information will help the Oregon Watershed Improvement Coalition (OWIC) to work with its member organizations to optimize the use of Oregons watershed resources
Please complete the enclosed questionnaire Completion of this questionnaire is voluntary you may respond to any all or none of the questions However you are among only a small number of users and those interested in watershed resource use to participate in this study Your answers are very important to OWICs understanding of what should be accomplished Any information you provide will be held in strictest confidence Those analyzing the information will not know who you are as individuals Furthermore analysis will only involve group information great care will be taken to assure that individual answers will not be attributable
Please return your questionnaire in the enclosed pre-addressed stamped envelope regardless of how much information you provide
We appreciate your participation in this study Please feel free to call Dr Warren Suzuki (737-6393) or me (737-1615) at Oregon State University if you have any questions or concerns
Sincerely
William C Krueger Department Head
Enclosure
Redacted for privacy
135
APPENDIX B
INSTRUMENT
Riparian Zones Project School of Education
Oregon State University Corvallis Oregon 97331
USES OF WATERSHED RESOURCES
Instructions
Instructions are provided for each section of this questionnaire If you wish to comment on any question or qualify your response please feel free to write in the margins or the last page or on a separate sheet of paper Aglossary is provided on page 10
Return this Questionnaire in the enclosed pre-stamped and pre-addressed envelope Also return the enclosed post card at the same time Thank you
1
136
1 There are many uses and users of riparian zones and associated upland watershed areas Some watershed resource uses include aesthetic and recreation aquifer recharge livestock forage fish habitat water storage and wildlife habitat How do you value each of these uses For each pair of resource uses please circle a single number for the response that best indicates the relative value of the two uses to you
2 = I strongly favor this use 1 = I favor this use 0= the two uses are eguallytwortaat to me
(I have crossed out line(s) that lam unsure of)
For example If you strongly value bird habitat watershed resource against timber harvesting use then indicate this view as follows
bird habitat Z 1 0 1 2 timber harvesting
On the other hand if you are unsure about the relative values between bird habitat and timber harvesting then record your view as follows
a Livestock forage 2 1 0 1 2 Wildlife habitat
b Wildlife habitat 2 1 0 1 2 Fish habitat
c Fish habitat 2 1 0 1 2 Livestock forage
d Livestock forage 2 1 0 1 2 Water storage
e Water storage 2 1 0 1 2 Fish habitat
f Fish habitat 2 1 0 1 2 Aesthetic amp recreation
g Aesthetic amp recreation 2 1 0 1 2 Livestock forage
h Livestock forage 2 1 0 1 2 Aquifer recharge
i Aquifer recharge 2 1 0 1 2 Wildlife habitat
j Wildlife habitat 2 1 0 1 2 Water storage
k Water storage 2 1 0 1 2 Aesthetic amp recreation
1 Aesthetic amp recreation 2 1 0 1 2 Wildlife habitat
m Aquifer recharge 2 1 0 1 2 Aesthetic amp recreation
n Fish habitat 2 1 0 1 2 Aquifer recharge
o Water storage 2 1 0 1 2 Aquifer recharge
7
137
2 There are two basic views on the availability of watershed resources in a riparian areaOne perspective holds that the products from watershed are abundant resources The opposing view is that the products from watershed are scarce resources Somestatements regarding watershed resources in riparian areas are as follows Pleasecircle a single number for the response that best describes your position regarding thestatements
2= I stron ejv favor this statement1= I favor this statement 0= Neither option is true for me
For example If you favor the statement that water availability is a scarce watershed resource rather than an abundant resource then your response describes
water is an abundant resource 2 1 0 2 water is a scarce resource Similarly if you view that neither water resource is a scarce nor is an abundant then your position(water is an abundant resource 2 1 1 2 water is a scarce resource
a Human beings can solve watershed resource supplyproblems through im-proved land managementpractices 2 1 0 2
Watershed resource supply islimited and is beyond human control and thus can only bemanaged through cutting down the level of use
b Watershed resources would be appropriately distributed if resource shareholders give first andforemost preference to their own uses
2 1 0 2
Watershed resources would be appropriately distributed ifeach resource shareholder recognizes the concerns ofother users
c The number of watershed resource uses and users can be limited if users fix a proportional resource quota
2 1 0
The number of watershed resource uses and users can be increased if users coordi-nate their demands
d The number of watershed resource uses can be maximized if users are willing to explore the potential of the localripariat zones
2 1 0 1 2
The number of watershed resource uses should be limited according to the current smuts of the local riparian zones
e An individuals responsi-bility is more important for resource management program and policy tormation
2 1 0 2
A collective responsibility is more important for resource management program andpolicy formation
f Watershed resources can Watershed resources can bebe sustained through long- sustained best if there is onlyterm planning of multiple 2 1 0 1 2 limited uses uses
138
3
3 Think of disagreements you have had with other riparian zone and associated upland watershed user groups regarding access to and use of watershed resources Then indicate below how frequently you act in each of the described ways Do not respond with a particular disagreement in mind Instead keep in mind your general response to disagreements with other watershed user groups For each item circle a single number that represents how you are most likely to act Or cross out the item(s) that is not applicable to you There are no right or wrong answers
ALWAYS VERY OFTEN OFTEN SOMETIMES SELDOM VERY SELDOM NEVER 1 2 3 4 5 6 7
1 I blend my ideas with other riparian zone watershed user groups to create new alternatives for resolving disagreement 1 2 3 4 5 6 7
2 I shy away from topics which are sources of disputes with other watershed resource user groups 1 2 3 4 5 6 7
3 I make my opinion known in a clicagreement with other watershed resource user groups 1 2 3 4 5 6 7
4 I suggest solutions which combine a variety of viewpoints 1 2 3 4 5 6 7
5 I steer clear of disagreeable situations of this sort 1 2 3 4 5 6 7
6 I give in a little on my ideas when other watershed resource user groups also give in 1 2 3 4 5 6 7
7 I avoid members of other watershed resource user groups when I suspect that they want to discuss a disagreement 1 2 3 4 5 6 7
8 I integrate point of views into new solutions to disputes about use of watershed resources 1 2 3 4 5 6 7
9 I will go 50-50 to reach a settlement with other users o f w a t e r s h e d resources 1 2 3 4 5 6 7
10 I raise my voice when Im trying to get other resource users to accept my position 1 2 3 4 5 6 7
11 I offer creative solutions in discussions about disagree-ments 1 2 3 4 5 6 7
12 I keep quiet about my views in order to avoid dis-agreements 1 2 3 4 5 6 7
139
4
ALWAYS VERY OFTEN OFTEN SOMETIMES SELDOM VERY SELDOM NEVER 1 2 3 4 5 6 7
13 I give in if other resource users will meet me halfway 1 2 3 4 5 6 7 14 I am flexible on the alternative uses of resources 1 2 3 4 5 6 7 15 I reduce this disagreement by making differences seem
insignificant 1 2 3 4 5 6 7 16 I meet other riparian systems users at a mid-point of our
differences 1 2 3 4 5 6 7
17 I assert my opinion forcefully 1 2 3 4 5 6 7
18 I dominate arguments until the other riparian user groupsunderstand my position 1 2 3 4 5 6 7
19 I suggest we work together to create solutions to dis-agreements 1 3 5 7 2 4 6
20 I try to use other resource users ideas to generate solutions 1 2 3 4 5 6 7
21 I offer trade-offs to reach solutions in disagreements between user groups 1 2 3 4 5 6 7
22 I argue insistently for my stance 1 2 3 4 5 6 7
23 I withdraw when other riparian systems users confront me about a controversial issue 1 2 3 4 5 6 7
24 I side-step disagreements of this sort when they 1 2 3 4 5 6 7 25 I try to smooth over disagreements of this sort by making
them appear unimportant 1 2 3 4 5 6 7 26 I insist my position be accepted during a disagreement
with other resource users 1 2 3 4 5 6 7
27 I make our differences seem less serious 1 2 3 4 5 6 7 28 I hold my tongue rather than argue with other riparian
resource users 1 2 3 4 5 6 7 N I ease conflict by claiming our differences are tthiaL 1 2 3 4 5 6 7 30 I stand firm in expressing my viewpoints during a
disagreement with other riparian resource users 1 2 3 4 5 6 7
5
140
4 When you are in conflict with other watershed resource users to what degree do you consider yourself to influence how these resources should be used (Circle one number)
1 MORE THAN OTHERS 2 SAME AS OTHERS 3 LESS THAN OTHERS 4 NOT APPLICABT F TO ME
5 The organizations listed below make up the Oregon Watershed Improvement Coalition (OWIC) To which of these organizations do you belong Circle number(s) all that apply
YES NO
a PNW Section-Society for Range Management 1 2 b Oregon Environment Council 1 2 c Oregon Forest Industries Council 1 2 d Oregon Cattlemens Association 1 2 e Oregon Chapter Sierra Club 1 2 f Oregon Small Woodlands Association 1 2 g Oregon Trout 1 2 h Oregon Rivers Council 1 2 i Oregon Izaak Walton League 1 2 j The Nature Conservancy 1 2 k Others (specify) 1 2
6 If you belong to more than one Organization please write the letter(s) of those with whichyou have the strongest affiliations
7 How actively are you involved with these organi7ations Please list the committees andoffices you now hold or have held
Officecommittee Organization
(continue on the back of this questionnaire if needed)
141
6
II
8 Have you been involved in facilitating communication among users of riparian areasother than through OWIC
1 YES 2N 0
9 To that extent has this effort or these efforts been productive (Circle one number)
1 HIGHLY PRODUCTIVE 2 SOMEWHAT PRODUCTIVE 3 MINIMALLY PRODUCTIVE 4 NOT PRODUCTIVE
10 How important to you are each of the following means for acquiring information on resource usemanagement of riparian areas ((ircle number (s))
NOT SOMEWHAT LWPORTANT VERY IMPORTANT IMPORTANT IMPORTANTI
a General membership meetings 1 2 3 4 b Special membership meetings 1 2 3 4 c Newslettersmagazinesbrochures
Scientific Journals or other print (cica the specific source) 1 2 3 4
d_ Committee meetings 1 2 3 4 e Newspapers and news magazines
(Times Newsweek Range magazine etc) 1 2 3 4
f Friends neighbors and relatives 1 2 3 4 g Displays at fairs and other public
meeting places 1 2 3 4 h Government agencies (eg USFS
and BLM etc) 1 2 3 4 i Extension Service 1 2 3 4 j Other (please identify) 1 2 3 4
7
142
11 Where the ripanan areas consist of both public and private lands which type(s) of land should be managed with similar watershed resources management philosophy (Circle one number)
SHOULD SHOULD NOT
a_ All public land and all private land 1 2 b All public land and some private land 1 2 C All public land and no private land 1 2 d Some public land and all private land 1 2 e Some public land and some private land 1 2 f Some public land and no private land 1 2 g No public land and all private land 1 2 h No public land and some private land 1 2 1 No public land and no private land 1 2
DEMOGRAPHICS OF THE RESPONDENTS 12 Your current occupation (Please indicate your Le II)
13 What is your gender (Circle one number)
1 MALE 2 FEMALE
Education
14 What is the highest grade you attended in schoolcollegeuniversity
15 How many years of schooling
Your anonymity as a respondent involved in this survey will be protected to ensure confidentiality
143
8
16 Do you think that riparian zones resource usesmanagement is a controversial issue among the potential users (Circle one number)
7-- I YES 2N0
17 What is the degree of conflict (Circle one number)
1 SEVERE 2 MODERATE 3 MINIMAL
18 Do you believe that conflict management can be successful for this issue (Circle one number)
1 YES 2N0
144
9
Your comments or concerns are welcomed Use this space or attach additionalsheet of papers for your suggestions You may also note your concern in themargins of prior pages
Glossary
Watershed represents the entire catchment area of a stream or a system of the streams thatshares water discharge flow and drainage either through common inlets or outlets or bothof these
Riparian areazone is the green area immediately adjacent to water such as streams springs rivers ponds and lakes
Associated upland is the extension of the watershed area surrounding the riparian areaTherefore its vegetative and landscape status plays an important role in the yield qualityof the products of the riparian zones including the watershed resources
Watershed storage represents underground water storage in the soil and in underground aquifer
Aquifer recharge is the maintenance of the underground water table
Aesthetic and recreation use of watershed resource represents the degree of pleasure orleisure through observing natural scenic places and performing outdoor activities by theusers
Fish and wildlife habitat is a place for both fish and wildlife where they can live growbreed rear and nurture at their own liberty
Management philosophy dais witha way of logical thinking before starting to followany technological development and implementation actions
10
145
APPENDIX C
FOLLOW-UP POSTCARDS
Please return this post card if you have completedand mailed the questionnaire I am a member of The Nature Conservancy
Y NA ITE IS (Please print) The information that you provided is greatlyappreciated Would you like to receive a summary of the results (Please check one)
YES NO
1993
In the last couple of weeks you may have received a questionnaire about USES OF WATERSHED RESOURCES by mail
If you have already completed and returned the questionnaire please accept our sincerest thanks
If you have not returned the questionnaire we encourage you to do so Your participation in this study will be extremely valuable for our understanding about improving the qualify of watershed resource uses in Oregon
If we have not heard from you we will mail another questionnaire to you very soon
Thanks Riparian Zones Researchers
146
APPENDIX D
TABLES
Table 16 Frequency data on power status in influencing others
Less than Sane as More than others others others
Group na
Environmental 7 1591 29 6591 8 1818
Business 9 2308 21 5384 9 2308
Professional 2 1176 9 5295 6 3529
OWIC 2 1053 12 6315 5 2632
Total 20 1681 71 5966 28 2353
aNumbers of participants responding to question
147
Table 17 ANOVA results for power status effect on resource usemanagement behavior
Source SS df MS
Between groups 71 2 36 86 42
Within groups 4004 97 41
Total 4075 99
Group na Meanb SD
Environmentalist 44 198 59
Business 39 200 69
Professional 17 176 66
Total 100 195 64
aNumbers of participants responding to question bResponses scored on 3-point scale (1 = more than others 2 = same as others 3 = less than others)
Table 18 ANOVA results on usefulness of the conflict communicationfacilitation process
Source SS df MS p
Between groups 95 2 47 93 41
Within groups 1895 37 51
Total 1990 39
a Group n Meanb SD
Environmentalist 14 193 62
Business 12 217 103
Professional 14 179 43
Total 40 195 71
aNumbers of participants responding to question 6Responses scored on 4-point scale (1 = highly productive 2 = somewhat productive 3 = minimally productive 4 = productive)
Table 19 Comparison of mean ratings of importance of sources of information
Source of Information Environmental Business Professional
Newslettersmagazinesbrochur 328 (1) 320 (1) 327 (1) esscientific journals or other print
Government agencies 259 (2) 256 (4) 306 (2)
Newspaper and news magazines 257 (3) 238 (7) 267 (3)
Extension Service 221 (5) 282 (2) 261 (4)
Special membership meetings 213 (7) 252 (5) 244 (5)
Friends neighbors and 242 (4) 236 (8) 182 (9) relatives
Committee meetings 200 (8) 262 (3) 233 (7)
Displays at fairs and other 216 (6) 229 (9) 194 (8) public meeting places
General membership meetings 192 (9) 240 (6) 235 (6)
Note Numbers within parenthesis represent the rank order by total group means
149
Table 20 ANOVA results on importance of committee meetings as a source of information
Source SS df MS
Between groups 1016 2 508 506 01
Within groups 12044 120 100
Total 13060 122
Group na Meanb SD
Environmentalist 61 20C 13
Business 47 262 101
Professional 15 233 98
Total 123 228 103
aNumbers of participants responding to question bResponses scored on 4-point scale (1 = not important 2 = somewhat important 3 = important 4 = very important) plt10
Table 21 ANOVA results on importance of friends neighbors and relatives as a source of information
Source SS df MS
Between groups 486 2 243 308 05
Within groups 10178 129 79
Total 10664 131
Group na Meandeg SD
Environmentalist 65 242 88
Business 50 236 87
Professional 17 182 95
Total 132 232 90
aNumbers of participants responding to question bResponses scored on 4-point scale (1 = not important 2 = somewhat important 3 = important 4 = very important) plt10
150
Table 22 ANOVA results on importance of displays at fairs and other public meeting places as a source of information
Source SS df MS
Between groups 162 2 81 98 38
Within groups 10391 126 82
Total 10553 128
aGroup n Meanb SD
Environmentalist 62 216 98
Business 51 229 90
Professional 16 194 57
Total 129 219 91
aNumbers of participants responding to question bResponses scored on 4-point scale (1 = not important 2 = somewhat important 3 = important 4 = very important)
Table 23 ANOVA results on importance of government agencies as a source of information
Source SS df MS
Between groups 363 2 182 228 11
Within groups 10572 133 79
Total 10935 135
Group na Meanb SD
Environmentalist 64 259 89
Business 54 256 95
Professional 18 306 73
Total 136 264 90
aNumbers of participants responding to question bResponses scored on 4-point scale (1 = not important 2 = somewhat important 3 = important 4 = very important)
151
Table 24 ANOVA results on importance of extension services as a source of information organizations
Source SS df MS F
Between groups 1099 2 550 537 01
Within groups 13201 129 102
Total 14300 131
Group na Meanb SD
Environmentalist (EG) 63 221 102
Business (BG) 51 282 103
Professional (PG) 18 261 92
Total 132 250 104
aNumbers of participants responding to question bResponses scored on 4-point scale (1 = not important 2 = somewhat important 3 = important 4 = very important) plt10
LSD test PG EGltBG
Table 25 ANOVA results on importance of published serials as a source of information
Source SS df MS p
Between groups 18 2 09 20 82
Within groups 5157 113 46
Total 5175 115
Group n8 Mean b SD
Environmentalist 60 328 74
Business 45 320 63
Professional 11 327 47
Total 116 325 67
aNumbers of participants responding to question Responses scored on 4-point scale (1 = not important 2 = somewhat important 3 = important 4 = very important)
152
Table 26 ANOVA results on importance of general membership meetings as source of information
Source SS df MS
Between groups 731 2 365 445 01
Within groups 10500 128 82
Total 11230 130
Group a Meanb SD
Environmentalist 62 192 95
Business 52 240 87
Professional 17 235 86
Total 131 217 93
aNumbers of participants responding to question bResponses scored on 4-point scale (1 = not important 2 = somewhat important 3 = important 4 = very important) plt10
Table 27 ANOVA results on importance of special membership meetings as source of information
Source SS df MS
Between groups 431 2 215 199 14
Within groups 13335 123 108
Total 13766 125
Group na Meanb SD
Environmentalist 60 213 13
Business 50 252 109
Professional 16 244 96
Total 126 232 105
aNumbers of participants responding to question bResponses scored on 4-point scale (1 = not important 2 = somewhat important 3 = important 4 = very important)
153
Table 28 Frequency data on predicted success of conflict management
Yes No
Group n n
Environmentalist 62 886 8 114
Business 44 800 11 200
Professional 16 842 3 158
Total 122 847 22 153
Note X2 = 175 df = 2 p = 42
Table 29 ANOVA results on perceived degree of conflict intensity
Source SS df MS
Between groups 08 2 04 21 82
Within groups 2670 146 18
Total 2678 148
Group na Meanb SD
Environmentalist 74 274 44
Business 55 278 42
Professional 20 280 41
Total 149 277 43
aNumbers of participants responding to question bResponses scored on 3-point scale (1 = minimal 2 = moderate 3 = severe)
Table 30 Summary results of regression analysis for both environmentalist and business organizations
Dependent variable Independent variable SE a Beta t P R Sq
Multiple or single use School years 77 06 02 31 285 01 10
Abundance or scarcity views Land management 77 -18 09 -23 -201 04 05
Abundance or scarcity views Land management 77 -22 09 -28 -251 01 13 Conflict management -49 20 -27 -248 02
Control style -
Solution orientation Conflict management 77 46 27 19 170 09 04
Solution orientation Conflict management 77 51 27 21 188 06 08 Power status -27 15 -20 -179 08
Nonconfrontation ^
Note All significant at plt10
Table 31 Summary results of regression analysis for environmentalist organizations
Dependent variable Independent variable n o SE B Beta R Sq
Multiple or single use orientation
Abundance or scarcity views
Control style
Solution orientation
Conflict management
Land management
40
40
-78
-71
33
28
-36
-38
-235
-254
02
02
13
15
Nonconfrontation
Note All significant at p10
Table 32 Summary results of regression analysis for business organizations
Dependent variable Independent variable n B SE B Beta R Sq
Multiple or single use orientation
Abundance or scarcity views - - -
Control style Conflict management 37 -76 38 -32 -202 05 10
Solution orientation Conflict management 37 92 36 40 258 01 16
Solution orientation Conflict management 37 99 34 43 288 01 25 Power status -40 20 -30 -201 05
Nonconfrontation Conflict intensity 37 52 30 28 174 91 08
Note All significant at plt10
156
Table 33 Alpha results on deletion of item for resource use orientation (n = 183)
Corrected Squared Alpha Items of item total multiple if item resource uses correlation correlation deleted
Livestock vs wildlife habitat 47 64 85
Wildlife habitat vs fish habitat 31 31 85
Fish habitat vs livestock 57 61 84
Livestock vs water storage 41 46 85
Water storage vs fish habitat 61 57 84
Fish habitat vs aesthetic amp 42 40 85 recreation
Aesthetic amp recreation vs 50 41 85 livestock
Livestock vs aquifer recharge 52 62 84
Aquifer recharge vs wildlife 47 47 85 habitat
Wild habitat vs water storage 54 59 84
Water storage vs aquifer recharge 43 46 85
Aquifer recharge vs wildlife 50 46 85 habitat
Aquifer recharge vs 50 47 84 aesthetic amp recreation
Fish habitat vs 57 50 84 aquifer recharge
Water storage vs aquifer 48 42 85 recharge
Table 34 Alpha results on deletion of item for resource supply philosophy (n = 183)
Corrected Squared Alpha Items of abundance- item total multiple if item
scarcity views correlation correlation deleted
44 37 76
c 50 35 75
d 56 45 73
e 33 31 79
65 57 71
Note Descriotion of items (a through f) are given in the Uses of Watershed Resources instrument (Appendix B)
157
Table 35 Alpha results on deletion of item for conflict management styles (n = 105)
Corrected Squared Alpha Items of conflict item total multiple if item management styles correlation correlation deleted
Nonconfrontation
5 55 56 76
7 46 51 77
12 68 69 75
14 -06 21 82
15 42 45 77
23 53 56 76
24 68 70 75
25 47 36 77
27 23 30 79
28 29 23 79
29 37 44 78
Solution orientation 1 70 56 90
4 71 57 90
8 67 56 90
11 64 58 90
19 75 66 90
20 68 56 90
6 59 42 90
9 61 59 90
13 62 61 90
16 70 64 90
21 59 46 90
Control 3 32 28 77
1r1 37 25 76
17 52 44 73
18 60 53 71
22 64 44 70
26 51 9 73
30 41 39 75
Note See Appendix B for text of the items
Table 36 Correlation coefficients for OWIC (n = 19)
Multiple or Abundance or Solution single use scarcity Nonconfronta- orientation Control
Dependent variable orientation philosophy tion CMS CMS CMS
Multiple or single use 100 orientation
Abundance or scarcity philosophy -16 100
Nonconfrontation CMS 35 -35 100
Solution orientation CMS 16 -23 05 100
Control CMS 22 06 -16 -46 100
CMS = conflict management style
Table 37 Correlation coefficients for the environment group (n = 60)
Multiple or Abundance or Solution single use scarcity Nonconfronta- orientation Control
Dependent variable orientation philosophy tion CMS CMS CMS
Multiple or single use 100 orientation
Abundance or scarcity philosophy -20 100
Nonconfrontation CMS 22 00 100
Solution orientation -17 -23 -02 100
Control CMS -13 30 -31 -21 100
CMS = conflict management style plt01 one-tailed
Table 38 Correlation coefficients for the business group (n = 51)
Dependent variable
Multiple or single use orientation
Abundance or scarcity philosophy
Nonconfrontation CMSa
Solution orientation CMS
Control CMS
CMS = conflict management style plt001 one-tailed
Multi or Abundance or Solution single use scarcity Nonconfronta orientation Control orientation _philosophy -tion CMS CMS CMS
100
-25 100
02 -05 100
07 -49 -00 100
17 -11 -12 -18 100
Table 39 Correlation coefficients for the professional group (n = 19)
Dependent variable
Multiple or single use orientation
Abundance or scarcity philosophy
Nonconfrontation CMSa
Solution orientation CMS
Control CMS
CMS = conflict management style plt001 one-tailed
Multi or Abundance or Solution single use scarcity Nonconfronta orientation Control orientation philosophy -tion CMS CMS CMS
100
-35 100
45 -26 100
-16 -23 30 100
02 25 19 -67 100