instruction manual on using gonioreflectometer …metrology.hut.fi/quality/imgon.pdfschool of...
TRANSCRIPT

Aalto University
School of Electrical Engineering
Metrology Research Institute
Version 1.2
7/10/2015
Priit Jaanson
Saulius Nevas
Farshid Manoocheri
Instruction Manual on
Using Gonioreflectometer Setup
for Diffuse Reflectance Measurements

Instruction Manual on UsingGonioreflectometer Setup for
Diffuse Reflectance Measurements
Page 2 (20)
Version: 1.2 Date: October 9, 2015 Last edited by: FM
1. Table of contents
Instruction Manual on ............................................................................................ 1Using Gonioreflectometer Setup ............................................................................ 1for Diffuse Reflectance Measurements ................................................................... 11. Table of contents ............................................................................................. 22. Definition ........................................................................................................ 3
2.1. Scope .......................................................................................................... 32.2. Object and field of application .................................................................... 32.3. Features ...................................................................................................... 32.4. Principles and Definitions ............................................................................ 3
3. Traceability Chain ............................................................................................ 44. Equipment ....................................................................................................... 5
4.1. Gonioreflectometer setup ........................................................................... 54.2. Maintenance of the equipment ................................................................... 7
5. Uncertainty components ................................................................................. 96. Measurement ranges and best measurement capabilities ............................... 107. Calibration methods and procedures ............................................................... 12
7.1. Measurement method ................................................................................ 127.2. Procedures for preparing the gonioreflectometer setup for the
measurements ............................................................................................ 128. Laboratory accommodation and environment ................................................. 189. Records ........................................................................................................... 1910. Certificates ...................................................................................................... 20

Instruction Manual on UsingGonioreflectometer Setup for
Diffuse Reflectance Measurements
Page 3 (20)
Version: 1.2 Date: October 9, 2015 Last edited by: FM
2. Definition
2.1. Scope
This instruction manual describes principles and operation of the gonioreflectometersetup at the Metrology Research Institute (MRI) that is used to perform absolutemeasurements of diffuse reflectance factors. Procedures for the characterization of theinstrument and calibration of diffuse reflectance standards are also given. Thisequipment can be also used for measuring spectral regular reflectance.
2.2. Object and field of application
Gonioreflectometer: setup for measuring reflectance factors.
Reflectance factor: ratio of the reflectance of a test sample to that of the perfectreflecting diffuser under standardized geometrical conditions, such as incidence at 0°and collection of the diffuse component or the reflected flux (0°:d), or incidence at 8°and collection over the whole hemisphere (8°:t), or incidence at 0° and collection at 45°(0°:45°).
2.3. Features
The gonioreflectometer setup consists of a light source and a one-axis goniometricdetection systems [1]. The setup is mounted on an optical table in thegonioreflectometer lab of the MRI. The instrument is designed to perform angle-resolved spectrophotometric measurements. In the case of normal incidence of thebeam, smallest possible viewing angle is 10° while for the incidence angles 10° it is 0°.The incidence angle can be adjusted to any value within +90° to -90°. By integrating themeasured angular distribution of the reflected radiant flux, hemispherical reflectancefactors can be derived, such as 0°:d or 8°:t. The diffuse reflectance factors from the rangeof 0.05 – 1.0 can be determined over the wavelengths from 360 to 830 nm.
2.4. Principles and Definitions
The hemispherical reflectance factors are derived from the measured distribution of thereflected flux as a function of the polar angle. The distribution of the flux is obtainedfrom the detector signal readings, known area of the detector aperture and knowndistance between the aperture and the reflecting surface / axis of rotation. Theprinciples and definitions necessary for deriving the diffuse reflectance factors whenusing the gonioreflectometer setup are described with more details in ref. [1].
[1] S. Nevas, F. Manoocheri, and E. Ikonen, “Gonioreflectometer for measuring spectral diffusereflectance,” Applied Optics 43, 6391-6399 (2004).

Instruction Manual on UsingGonioreflectometer Setup for
Diffuse Reflectance Measurements
Page 4 (20)
Version: 1.2 Date: October 9, 2015 Last edited by: FM
3. Traceability Chain
The hemispherical reflectance factors are determined from the measured angulardistribution of the reflected radiant flux i.e. from the Bidirectional reflectanceDistribution Function (BRDF). The flow chart below shows the traceability chain for theBRDF measurement results.
Bidirectional Reflectance Distribution Function (BRDF) Traceability chain
NatinalStandard of
spectraltransmittance
Known NDfilters
Linearity ofdetectors
NatinalStandard of
Length
Aperturediameter
Sample-ApertureDistance
Reference rod
Sample-Detector
Angle settings
BRDF
Measurement Geometry
Hg-Lampemission lines
Holmium oxideAbsorption
lines
Wavelength Scale
McCronedoped glassAbsorption
lines

Instruction Manual on UsingGonioreflectometer Setup for
Diffuse Reflectance Measurements
Page 5 (20)
Version: 1.2 Date: October 9, 2015 Last edited by: FM
4. Equipment
4.1. Gonioreflectometer setup
The gonioreflectometer consists of a double monochromator-based light source system,a one-axis goniometric receiver system, two digital voltage meters (DVMs), and a controlcomputer. A schematic representation of the source and the receiver systems of thegonioreflectometer setup is shown in Figure 1. The components utilized in themeasurement setup are listed in Table 1.
Figure 1. Schematics of the gonioreflectometer setup.
Table 1. Equipment used in the gonioreflectometer setup.
Description Quantity Identification
A. Light source system
1. Double monochromator 1 Bentham DTMc 300
2. Quartz-tungsten-halogen(QTH) lamp with power supply
1 OSRAM, 50W 12V; Elekro-Automatik GmbH, EA 7030-100
3. Xenon lamp 1
4. Spherical concave mirror 1 Teknofokus, custom design,Æ 100 mm, F = 125 mm

Instruction Manual on UsingGonioreflectometer Setup for
Diffuse Reflectance Measurements
Page 6 (20)
Version: 1.2 Date: October 9, 2015 Last edited by: FM
5. Off-axis parabolic mirror 1 Melles Griot POA017
6. Flat mirror 1 Melles Griot 02MFG019/028
7. Monitor detector 1 Silicon diode with preamplifierand housing made at MRI
8. Beam splitter 1 50x50 plate of C7059 opticalglass
9. Polarizer 1 Melles Griot Glan-Taylor prism,attached to PI M-038.DGturntable
10. Adjustable iris 3 Thorlabs
B. Goniometric Detection system
1. Detector turntable with thecontroller
1 HUBER GmbH one-circlegoniometer 420 and 9012controller
2. Linear translator with thecontroller
1 Physik Instrumente (PI) GmbH &Co. M-415.PD with powersupply, C-862.00 / Mercury IIPalm-Top DC-Motor-Controller
3. Sample turntable 1 PI M-038, operated manually
4. Sample-holder unit 1 Designed and made at MRI
5. Si detector withtransimpedance amplifier andpower supply
1 Hamamatsu S1337 photodiode,transimpedance amplifier madeat MRI, 15 V power supply(Signaali)
6. Detector optics package 1 Two SM2L30 Thorlabs lenstubes, Æ 25 mm black anodisedAl aperture, Thorlabs LA4545fused-silica plano-convex Lens
7. Tools for setting the distancebetween the detector and thesample surface
1 Calibrated 498-mm long rod ofAl, caliper, specially designedplate for the sample holder andcover for the detector tube
C. Control and Data Acquisition
1. Digital multimeter 2 HP 3458A
Instruction Manual on UsingGonioreflectometer Setup for
Diffuse Reflectance Measurements
Page 7 (20)
Version: 1.2 Date: October 9, 2015 Last edited by: FM
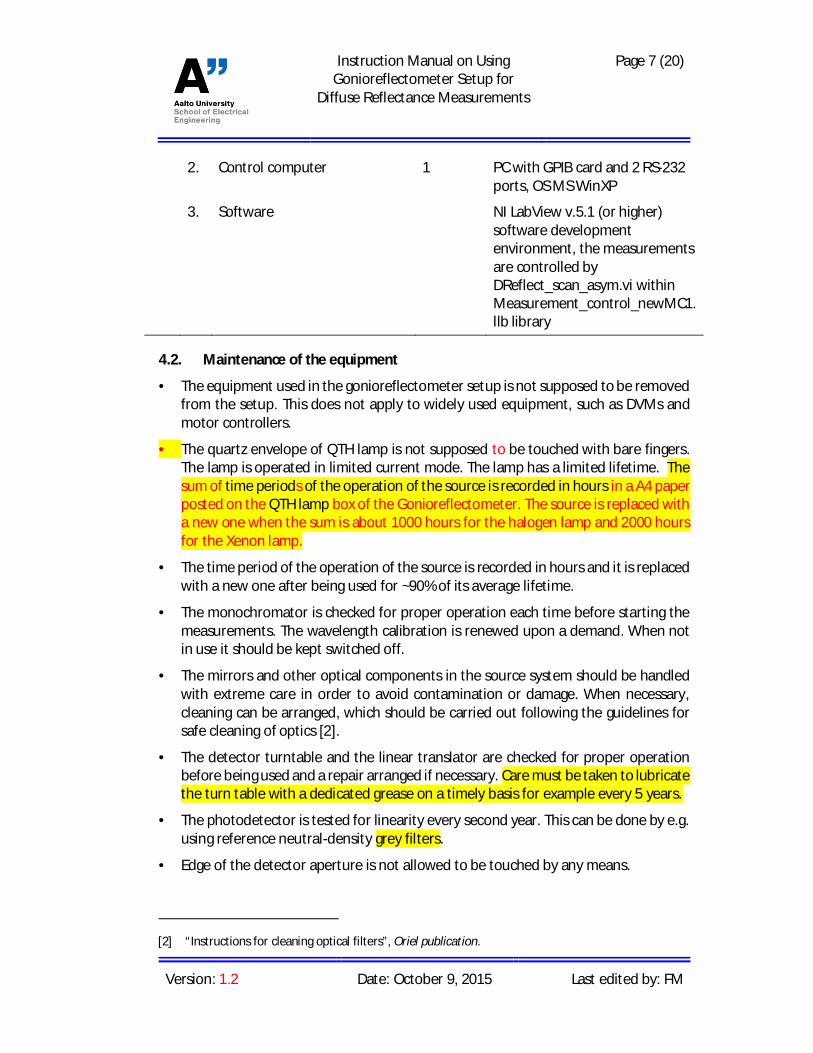
2. Control computer 1 PC with GPIB card and 2 RS-232ports, OS MS WinXP
3. Software NI LabView v.5.1 (or higher)software developmentenvironment, the measurementsare controlled byDReflect_scan_asym.vi withinMeasurement_control_newMC1.llb library
4.2. Maintenance of the equipment
· The equipment used in the gonioreflectometer setup is not supposed to be removedfrom the setup. This does not apply to widely used equipment, such as DVMs andmotor controllers.
· The quartz envelope of QTH lamp is not supposed to be touched with bare fingers.The lamp is operated in limited current mode. The lamp has a limited lifetime. Thesum of time periods of the operation of the source is recorded in hours in a A4 paperposted on the QTH lamp box of the Gonioreflectometer. The source is replaced witha new one when the sum is about 1000 hours for the halogen lamp and 2000 hoursfor the Xenon lamp.
· The time period of the operation of the source is recorded in hours and it is replacedwith a new one after being used for ~90% of its average lifetime.
· The monochromator is checked for proper operation each time before starting themeasurements. The wavelength calibration is renewed upon a demand. When notin use it should be kept switched off.
· The mirrors and other optical components in the source system should be handledwith extreme care in order to avoid contamination or damage. When necessary,cleaning can be arranged, which should be carried out following the guidelines forsafe cleaning of optics [2].
· The detector turntable and the linear translator are checked for proper operationbefore being used and a repair arranged if necessary. Care must be taken to lubricatethe turn table with a dedicated grease on a timely basis for example every 5 years.
· The photodetector is tested for linearity every second year. This can be done by e.g.using reference neutral-density grey filters.
· Edge of the detector aperture is not allowed to be touched by any means.
[2] “Instructions for cleaning optical filters”, Oriel publication.

Instruction Manual on UsingGonioreflectometer Setup for
Diffuse Reflectance Measurements
Page 8 (20)
Version: 1.2 Date: October 9, 2015 Last edited by: FM
· The calibrated aluminum rod used for setting the detector distance should be storedin a safe place with the plastic protective caps on both ends. When handling, careshould be exercised to avoid mechanical damage.
· The digital multimeters are auto calibrated every day before the start of themeasurements. Calibration of the multimeters is performed according to thecalibration schedule of MRI.
Instruction Manual on UsingGonioreflectometer Setup for
Diffuse Reflectance Measurements
Page 9 (20)
Version: 1.2 Date: October 9, 2015 Last edited by: FM
5. Uncertainty components
The uncertainty components for the measurements of spectral diffuse reflectance usingthe gonioreflectometer setup are described in ref. [1].
Instruction Manual on UsingGonioreflectometer Setup for
Diffuse Reflectance Measurements
Page 10 (20)
Version: 1.2 Date: October 9, 2015 Last edited by: FM
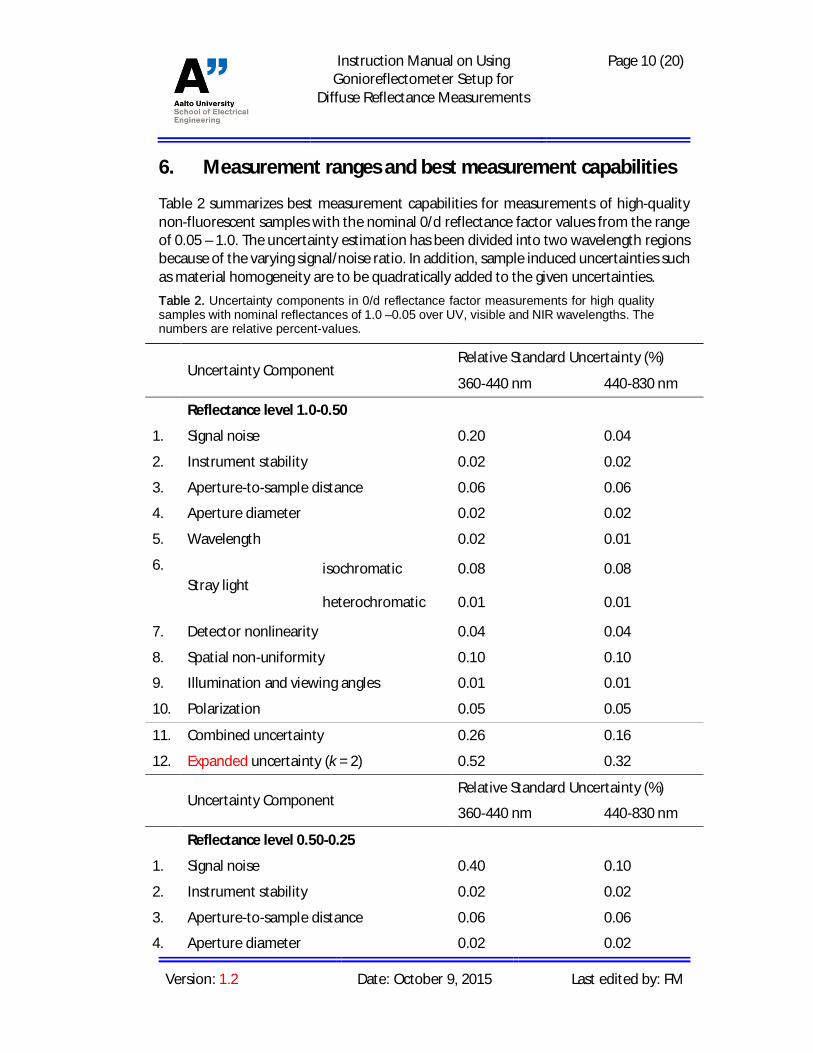
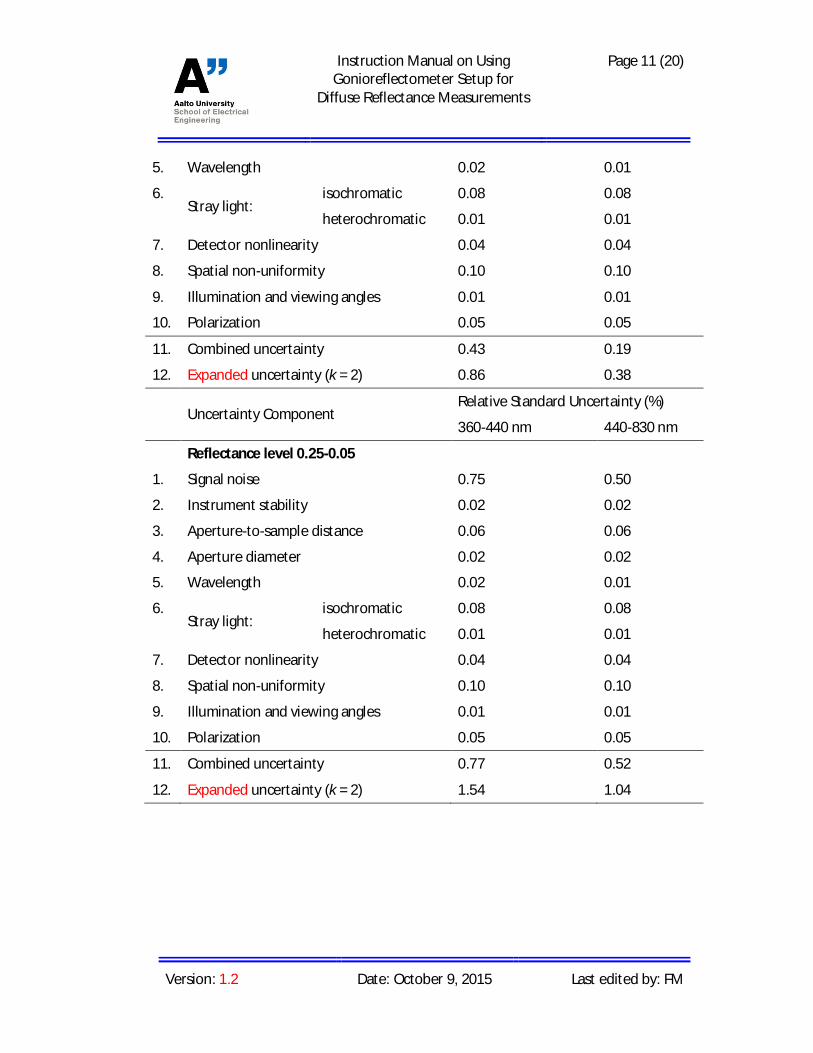
6. Measurement ranges and best measurement capabilities
Table 2 summarizes best measurement capabilities for measurements of high-qualitynon-fluorescent samples with the nominal 0/d reflectance factor values from the rangeof 0.05 – 1.0. The uncertainty estimation has been divided into two wavelength regionsbecause of the varying signal/noise ratio. In addition, sample induced uncertainties suchas material homogeneity are to be quadratically added to the given uncertainties.Table 2. Uncertainty components in 0/d reflectance factor measurements for high qualitysamples with nominal reflectances of 1.0 – 0.05 over UV, visible and NIR wavelengths. Thenumbers are relative percent-values.
Uncertainty ComponentRelative Standard Uncertainty (%)
360-440 nm 440-830 nm
Reflectance level 1.0-0.50
1. Signal noise 0.20 0.04
2. Instrument stability 0.02 0.02
3. Aperture-to-sample distance 0.06 0.06
4. Aperture diameter 0.02 0.02
5. Wavelength 0.02 0.01
6.Stray light
isochromatic 0.08 0.08
heterochromatic 0.01 0.01
7. Detector nonlinearity 0.04 0.04
8. Spatial non-uniformity 0.10 0.10
9. Illumination and viewing angles 0.01 0.01
10. Polarization 0.05 0.05
11. Combined uncertainty 0.26 0.16
12. Expanded uncertainty (k = 2) 0.52 0.32
Uncertainty ComponentRelative Standard Uncertainty (%)
360-440 nm 440-830 nm
Reflectance level 0.50-0.25
1. Signal noise 0.40 0.10
2. Instrument stability 0.02 0.02
3. Aperture-to-sample distance 0.06 0.06
4. Aperture diameter 0.02 0.02
Instruction Manual on UsingGonioreflectometer Setup for
Diffuse Reflectance Measurements
Page 11 (20)
Version: 1.2 Date: October 9, 2015 Last edited by: FM
5. Wavelength 0.02 0.01
6.Stray light:
isochromatic 0.08 0.08
heterochromatic 0.01 0.01
7. Detector nonlinearity 0.04 0.04
8. Spatial non-uniformity 0.10 0.10
9. Illumination and viewing angles 0.01 0.01
10. Polarization 0.05 0.05
11. Combined uncertainty 0.43 0.19
12. Expanded uncertainty (k = 2) 0.86 0.38
Uncertainty ComponentRelative Standard Uncertainty (%)
360-440 nm 440-830 nm
Reflectance level 0.25-0.05
1. Signal noise 0.75 0.50
2. Instrument stability 0.02 0.02
3. Aperture-to-sample distance 0.06 0.06
4. Aperture diameter 0.02 0.02
5. Wavelength 0.02 0.01
6.Stray light:
isochromatic 0.08 0.08
heterochromatic 0.01 0.01
7. Detector nonlinearity 0.04 0.04
8. Spatial non-uniformity 0.10 0.10
9. Illumination and viewing angles 0.01 0.01
10. Polarization 0.05 0.05
11. Combined uncertainty 0.77 0.52
12. Expanded uncertainty (k = 2) 1.54 1.04

Instruction Manual on UsingGonioreflectometer Setup for
Diffuse Reflectance Measurements
Page 12 (20)
Version: 1.2 Date: October 9, 2015 Last edited by: FM
7. Calibration methods and procedures
7.1. Measurement method
The hemispherical reflectance factors are determined from the measured angulardistribution of the reflected radiant flux. The measurements are performed over thepolar angles only. More information of the measurement method is provided in [1].Procedure for calculating the hemispherical reflectance factor values is built in theLabView program that controls the measurements. Alternatively, the raw measurementdata can be post processed with the help of a Mathlab code that is in a file calledProcess_DR_file_InclMon2.m.
7.2. Procedures for preparing the gonioreflectometer setup for the measurements
Before the measurements can be started, both source and receiver systems of thegonioreflectometer have to be set up, aligned, and calibrated.
The optical components at the input and output slits of the double monochromator(DMC) are set up and aligned according to the schematic representation of Figure 1. Thelight from the QTH lamp is collected by a spherical mirror and coupled into the input slitof the DMC assembly [1]. The positioning of the lamp and the mirror at the input slit isdepicted in Figure 2. Under the depicted configuration, the image of the lamp filamentat the DMC input slit is magnified by a factor of two and the F/# of the input optics ismatched to that of the DMC.
Figure 2. Coupling the light from QTH lamp into the DMC.
The configuration of the output optics as shown in Figure 1 is slightly different from whatis described in ref. [1]. In the present setup, the spherical mirror and one flat mirror areabsent. This is due to changes in the DMC, which made it astigmatism free. Hence theastigmatism correction became unnecessary and some of the optical componentsbecame redundant. However, the purpose of the remaining optical components is thesame as described in [1] and the guidelines for their alignment are valid.

Instruction Manual on UsingGonioreflectometer Setup for
Diffuse Reflectance Measurements
Page 13 (20)
Version: 1.2 Date: October 9, 2015 Last edited by: FM
Procedures for calibrating the wavelength scale of the instrument are described in [1].The additional equipment needed for the wavelength calibration is the same as in [3].The result of the wavelength calibrations is expressed in the form of wavelength-correction polynomials determined separately for each of the gratings in use. Thepolynomial formulas are then input to the DMC control VIs within theMeasurement_control_newMC1.llb.
The receiver system is aligned in a series of consecutive steps that are discussed in [1].This instruction manual supplements the description with some important practicaldetails. As mentioned in [1], the alignments are carried out with the help of a two beamalignment laser. It is fixed on the optical table just after the flat mirror that is used forsteering the beam towards the receiver system (Figure 1).
The first step in the alignment procedure is to adjust the beam to be in the plane that isat the height of the DMC exit slit and parallel to the surface of the optical table (Figure3). The plane of rotation by the detector and the sample are also parallel to the surfaceof the optical table.
For the next step, finding the rotational axis of the detector turntable and making thebeam to intercept it, the following approach should be used. Attach an adjustable irisdiaphragm (or a piece of paper with a reference mark such as pinhole) to the detectorarm at the height of the optical axis. Steer the laser beam to be passing as close aspossible to the center of the turntable and incident on the center of the small openingwhen it is at the detector reference position (Figure 1). Turn the detector arm 180°(XHV_back_forth.vi from the Measurement_control_newMC1.llb should be used forthis purpose). The displacement of the beam from the center of the iris opening at thenew position is an indication of how much and to which direction the laser should bemoved (Figure 4). After that, rotate the iris opening back to its initial position. Iteratethe previous procedure several times until the laser beam passes through the center ofthe iris opening at both positions of the detector turntable.
[3] Quality manual of reference spectrometer laboratory.

Instruction Manual on UsingGonioreflectometer Setup for
Diffuse Reflectance Measurements
Page 14 (20)
Version: 1.2 Date: October 9, 2015 Last edited by: FM
Figure 3. An alignment laser is used for the alignment of the receiver system.
Rotationaxis
Pinhole,position 1
Pinhole,position 2
Laser
Rotate 180 deg
Movelaserhere
Detector arm
Beam
Figure 4. Finding the axis of rotation of the detector turntable with the help of an alignmentlaser and a small aperture opening fixed on the detector arm.
The following steps in the receiver alignment procedure are aimed at aligning therotational axis of the second turntable (sample) to be lying in the plane of the samplefront surface and making both the sample and the detector axis of rotation to becollinear. For that purpose, a dummy sample with cross hair markings on its surface isfixed at the sample holder. The concept of the alignment procedure is based on tracking

Instruction Manual on UsingGonioreflectometer Setup for
Diffuse Reflectance Measurements
Page 15 (20)
Version: 1.2 Date: October 9, 2015 Last edited by: FM
the displacement of the beam spot position on the sample surface with respect to thereference mark while the sample is rotated both clockwise and counterclockwise.
In the first move, align the dummy sample such that the laser beam is incident at normalangle on the center of the cross hair marking. Now, if the sample is rotated fourscenarios are possible. In the ideal case, the center of the illuminated spot on the samplesurface does not change its position with respect to the reference mark no matter howmuch and to which direction the sample is rotated. This would mean that the alignmentis already achieved. The other three scenarios are depicted in Figure 5: 1) the rotationalaxis of the sample turntable lies in the sample front surface but it is away from theincident beam (and from the rotational axis of the detector turntable); 2) the rotationalaxis of the sample turntable is away from the sample front surface but it lies in the planeformed by the incident beam and the rotational axis of the detector turntable); 3) therotational axis of the sample turntable is away both from the sample front surface andfrom the laser beam (and also from the rotational axis of the detector turntable). As itis demonstrated in Figure 5, rotation of the sample by ± causes a displacementbetween the reference mark and the beam spot on the sample surface that is denotedby A and B, respectively. Obviously, observing the sign and the size of A and B allowsdeducing the type and the amount for the misalignment among the rotational axis,sample surface, and the optical axis (laser beam).
Hence one should proceed as follows. Turn the sample by e.g. +80° and note the signand the magnitude for the displacement A. Then turn the sample by -80° and note thesign and the magnitude for the displacement B. Compare A and B and refer to Figure 5.Depending on the situation, use the PI linear translator to move the sample turntablesideways with respect to the beam and/or the small translator with an adjustment knobto adjust the position of the sample holder along the direction of the laser beam suchthat A and B get smaller. Readjust the position of the dummy sample. Iterate thesequence until both A and B converge at zero.
PI translator is controlled by MR_LT.vi (move relative from current position),GoHomeLT.vi (move to reference home position), and DefHomeLT.vi (define currentposition as home). For the alignment purposes, however, it may be more convenient toadjust the position of the translator manually and then use the DefHomeLT.vi to markthe adjusted position as the reference home position.
The next action to be taken is to adjust the position of the rotational axis of the sampleturntable along the optical axis (laser beam) such that it is at the position of therotational axis of the detector turntable. The required degree of freedom for thisadjustment is provided by the horizontal slide (Oriel) on which the sample turntable isfixed. The measure for the necessary adjustment to be applied is again a displacementbetween the beam spot and the reference mark on the dummy sample. This time,however, the laser is fixed on the detector arm and the laser itself is rotated rather thanthe sample.

Instruction Manual on UsingGonioreflectometer Setup for
Diffuse Reflectance Measurements
Page 16 (20)
Version: 1.2 Date: October 9, 2015 Last edited by: FM
Figure 5. Three types of misalignment among sample, rotational axis, and incident beam.Rotation of the sample causes displacement between the beam spot and the referencemark on the sample surface.

Instruction Manual on UsingGonioreflectometer Setup for
Diffuse Reflectance Measurements
Page 17 (20)
Version: 1.2 Date: October 9, 2015 Last edited by: FM
The purpose of the final stage in the alignment procedure is to define the distancebetween the detector aperture and the sample plane. For this purpose, the alignmentlaser, a calibrated-length aluminum rod, a specially designed cover for the detector tubeand a special plate for the sample holder are used. First of all, the detector package ismounted on the cantilever at the reference position of the detector turntable. Thedetector tube is aligned such that the optical axis goes through its center. The part ofthe tube containing the lens and the aperture is removed and the cover is put on theremaining part of the tube. The plate is put into the sample holder and aligned such thatthe laser beam (optical axis) is incident at zero degree on a small hole at its centre. Thenthe detector is rotated 180° to face the sample. The aluminum rod is put in between thesample holder and the detector (Figure 6). One end of the rod slides into a clearance inthe plate. The other end is matched by a clearance in the detector tube cover. Thedistance setting is carried out by releasing the fixing screws on the detector rail carrierand carefully pushing the detector towards the sample until the detector cover justtouches the aluminum rod. When the distance is set, the removed part of the detectortube is put back. The distance between the detector aperture and the sample iscalculated from the known length of the aluminum rod and that of the removable partof the detector tube, the measured distance between the aperture and the tube edge(caliper can be used for that purpose), the thickness of the tube cover, the thickness ofthe plate in the sample holder, and the thickness of the front part of the sample holder.
Figure 6. Defining the distance between the detector and the sample with the help of acalibrated-length aluminum rod.

Instruction Manual on UsingGonioreflectometer Setup for
Diffuse Reflectance Measurements
Page 18 (20)
Version: 1.2 Date: October 9, 2015 Last edited by: FM
8. Laboratory accommodation and environment
The gonioreflectometer laboratory is located in room I135 in the basement of thedepartment of Electrical and Communications Engineering. The laboratory is a cleanroom. Instructions for using the clean rooms have been given in [4].
During the calibrations, the ambient temperature and the relative humidity should bemonitored. Temperature and relative humidity values during the calibrations are writtento calibration certificates.
[4] P.Kärhä, “Clean room instructions / Puhdastilaohjeet”, MRI publication.

Instruction Manual on UsingGonioreflectometer Setup for
Diffuse Reflectance Measurements
Page 19 (20)
Version: 1.2 Date: October 9, 2015 Last edited by: FM
9. Records
The measurement data coming from the calibrations and development of theequipment is archived. The measurement notes (comments on the measurement setupetc.) are written down to measurement data file (the measurement control program hasa place where to type in the comments) and/or a dedicated notebook. The raw data filesare stored in the control computer and backed-up in responsible person’s PC.

Instruction Manual on UsingGonioreflectometer Setup for
Diffuse Reflectance Measurements
Page 20 (20)
Version: 1.2 Date: October 9, 2015 Last edited by: FM
10. Certificates
Calibration certificates are handled according to [5]. In the calibration certificatesincluded are:
· Ambient temperature and relative humidity,
· Source of traceability,
· Spectral diffuse reflectance values at the measurement wavelengths and uncertaintyestimates.
[5] Instructions on writing calibration certificates.