instream flow studies on muddy, little muddy, littlefield ... flow/isf_150... · fish division,...
TRANSCRIPT

Wyoming Game and Fish Department
Fish Division, Administrative Report 2011
Grizzly WHMA Streams, 2011
Instream flow studies on Muddy, Little Muddy, Littlefield, and McKinney Creeks on the Grizzly Wildlife Habitat Management Area
Thomas C. Annear, Water Management Supervisor, Wyoming Game and Fish Department, 5400
Bishop Blvd, Cheyenne, WY 82006
Mike Robertson, Fisheries Biologist, Wyoming Game and Fish Department, 5400 Bishop Blvd,
Cheyenne, WY 82006
Abstract
Four streams in the upper Muddy Creek drainage south of Rawlins, WY were selected for
instream flow water rights filing consideration (Muddy, Littlefield, McKinney, and Little Muddy
creeks). Studies were done on these streams to maintain or improve habitat for populations of
native Colorado River cutthroat trout (CRC) as well as other fish species on the Game and Fish
Commission’s Grizzly Wildlife Habitat Management Area (WHMA). Quantifying flow needs
for fisheries will also assist with multiple species management decisions on the WHMA. This
report (available online at http://gf.state.wy.us/fish/instreamflow/) provides flow
recommendations for the four streams based on studies done in 2010. Instream flow
recommendations are from a combination of methods including a) Physical Habitat Simulation
for spawning habitat suitability, b) Habitat Retention modeling to identify flows to maintain
riffle hydraulic characteristics, and c) the Habitat Quality Index model to assess stream flow
versus juvenile and adult trout summer habitat quality relationships. During the winter months,
October through March, natural winter flows up to levels identified by Habitat Retention
modeling were recommended to maintain all life stages. A dynamic hydrograph model was used
to quantify flow needs for maintaining existing habitat characteristics, processes, and
maintenance of channel geomorphology. Seasonal flow recommendations and the proposed
length of instream flow segments for each stream segment are shown in Table 1.
TABLE 1. Seasonal flow recommendations (in cubic feet per second) for Muddy, Little
Muddy, Littlefield, and McKinney creeks on the Grizzly WHMA.
Length of
Stream
Segment
(miles)
Winter
Survival
Oct 1 to
Mar 31
Early Spring
Connectivity
Apr 1 to
May 14
Spawning
May 15 to
Jun 30
Summer
Production
Jul 1 to Sep 30
Muddy Creek 5.43 2.0 2.0 3.5 2.0
Little Muddy
Creek 1.98 0.7 0.7 2.0 1.0
Littlefield Creek 7.03 1.0 1.0 3.5 1.0
McKinney Creek 1.86 1.1 1.1 8.0 1.5

Grizzly WHMA Streams, 2011 2
Introduction
Riverine Components of Rivers and Streams
There are five primary riverine components that are used to characterize a stream or river;
its hydrology, biology, geomorphology, water quality and connectivity (Annear et al. 2004).
When the hydrology is changed, other components are influenced to varying degrees. As water
resources are developed in Wyoming for out-of-stream, or consumptive, uses there are
corresponding changes in other riverine components that may alter the quality of a stream for
supporting fisheries habitat. Rivers and streams are important to the residents of Wyoming, as
evidenced by the passage of W.S. 41-3-1001-1014 in 1986 that established instream flows as a
beneficial use of water when used to maintain or improve existing fisheries. The statute directed
that any unappropriated water flowing in any stream or drainage in Wyoming may be
appropriated for instream flows when it provides this beneficial use. The statute and Wyoming
water law clearly note that all existing water rights in that stream remain unaffected.
Purpose for Grizzly WHMA Instream Flow Studies and Water Rights
Studies designed to evaluate the instream flow needs for fisheries in Wyoming are
initiated by the Wyoming Game and Fish Commission. These studies do not fully address all
five riverine ecosystem components (e.g. long-term habitat processes), but focus on maintaining
or improving existing habitat for important fish species throughout the state as if those
characteristics will remain static over time (see Appendix A for more information on instream
flows in Wyoming).
Guidance for selecting most streams to evaluate statewide is provided by the Wyoming
Game and Fish Department (WGFD) Water Management Unit’s five-year plan (Annear and Dey
2006). That plan identifies and prioritizes important habitats for instream flow studies. Native
Yellowstone cutthroat trout (YSC; Oncorhynchus clarki bouvieri) and Snake River cutthroat
trout (SRC; Oncorhynchus clarki behnkei) were identified as the highest priority species for that
planning period. However the plan directs that instream flow filings may also reflect specific
needs in other parts of the state. A request from the Green River fish management office to
quantify instream flow needs to maintain habitat for Colorado River cutthroat trout (CRC;
Oncorhynchus clarki pleuriticus) on upper Muddy Creek tributaries on the commission’s Grizzly
Wildlife Habitat Management Area (Grizzly WHMA) served as the basis for conducting studies
in this report.
Colorado River cutthroat trout are one of three subspecies of native trout found in
Wyoming. They historically occupied portions of the Colorado River drainage in Wyoming,
Colorado, Utah, Arizona, and New Mexico. Widespread introductions of non-native salmonids
over the last century have served to limit current distributions primarily to isolated headwater
streams and lakes. Jesperson (1981) observed that a wide variety of land management practices
as well as water depletion and diversion negatively affect CRC populations. A recent assessment
by Hirsch et al. (2005) indicates that CRC presently occupy about 14% of their historical range.
In 1994, member states of the Colorado River Fish and Wildlife Council (a consortium of
state fish and wildlife agency directors) recognized the need for state wildlife agencies to
coordinate conservation actions for CRC, and directed Colorado, Utah, and Wyoming to develop
a conservation team. This team developed conservation strategies to provide a framework for
the long-term conservation of CRC, and to reduce or eliminate the threats that warrant its status
as a species of special concern (CRCT Coordination Team, 2006). One of the important

Grizzly WHMA Streams, 2011 3
strategies identified in this report is the need to protect or restore instream flow regimes in
streams that contain CRC or are within the historic range of the species.
Objectives
The objectives of these studies were to 1) quantify year-round instream flow levels
needed to maintain habitat for and populations of CRC 2) use those data to file for current day
priority instream flow water rights, and 3) identify channel maintenance flow levels that will
maintain long-term trout habitat and related physical and biological processes. The audience for
this report is broad and includes the State Engineer and staff, the Water Development
Commission and staff, aquatic habitat and fishery managers, and non-governmental
organizations and individuals interested in instream flow water rights and native trout
management in general or in the Muddy Creek watershed in particular.
Study Area
The Upper Muddy Creek basin (5th
level hydrologic unit code 1405000401) is located
about 35 miles south of Rawlins (Figure 1) in the foothills of the Sierra Madre Mountains. The
streams in this study are all within the Muddy Creek conservation population that was defined as
a 4th
level HUC (14050004; CRCT Coordination Team, 2006). Mountain shrubs, sagebrush
communities, and aspen stands dominate the uplands of the watershed while various willow
species and river birch are found in the riparian corridors. Land ownership in the upper basin
where studies were conducted is a mix of Bureau of Land Management, Game and Fish
Commission (Grizzly WHMA), private, and Wyoming State Land Board lands. The relatively
small size and low flows of all streams provides limited angling opportunities. Other
recreational uses in the drainage include hunting, camping, and livestock ranching.
Due to the high conservation values and the potential for addressing habitat issues, the
Muddy Creek watershed was recognized as both a “crucial” and an “enhancement” priority area
under the department’s Strategic Habitat Plan (SHP, WGFD 2011). These streams are uniquely
recognized for the presence of important native species as identified in the State Wildlife Action
Plan (WGFD 2010). According to the SHP, “crucial habitats have the highest biological values,
which should be protected and managed to maintain healthy, viable populations of terrestrial and
aquatic wildlife. These include habitats that need to be maintained as well as habitats that have
deteriorated and should be enhanced or restored.” The plan also states that enhancement areas
“are important wildlife areas that can or should be actively enhanced or improved by WGFD and
partners over the next few years if opportunities exist.”
Elevation within the basin ranges from approximately 7,100 feet at the mouth of
McKinney Creek to over 8,200 feet along portions of Atlantic Rim. Stream channels throughout
the Grizzly WHMA are primarily classified as Rosgen type “B” and “E” based on observations
at study sites. The basin’s primary aspect is west or northwest facing. According to the
Wyoming Climate Atlas (www.wrds.uwyo.edu/sco/climateatlas/title_page.html) annual
precipitation is approximately 11.0 inches per year, the majority of which is derived from winter
snows. The average maximum and minimum summer temperatures at Rawlins over the period
of record were 87.1oF and 43.6
oF respectively according to data from the Western Regional
Climate Center (www.wrcc.dri.edu/CLIMATEDATA.html). Depending on snow cover (or the
lack thereof), winter conditions can result in the formation of frazil and anchor ice. Repeated

Grizzly WHMA Streams, 2011 4
melting and formation of ice may impact over-winter habitat for fish. In years of heavy snow
cover, these streams likely form snow bridges that afford secure, stable habitats for all life stages
and species of fish in the streams.
FIGURE 1. Location of instream flow segments in the upper Muddy Creek watershed.

Grizzly WHMA Streams, 2011 5
Geomorphology Channel form is a direct result of interactions among flow regimes (Schumm 1969),
sediment loads (Komura and Simmons 1967), and riparian vegetation, which are in turn a direct
function of the form and condition of the watershed (Leopold et al. 1964; Heede 1992; Leopold
1994). For many alluvial streams in their natural state, the channel exists in a state of dynamic
equilibrium in which the sediment load is balanced with the stream’s transport capacity over time
(Bovee et al. 1998). When sediment load exceeds transport capacity, aggradation or other
alteration of channel form will occur. When transport capacity exceeds sediment load, the
channel may adjust through enlarging the channel or degrading the bed.
Steep, unstable slopes occur in portions of the watershed. In addition, highly erodible
sedimentary rocks contribute sediment loads to all four streams primarily during spring runoff.
Additional sediment inputs arise from practices such as livestock and big game grazing as well
as numerous roads throughout the watershed. Typical of many low order foothill streams,
relatively high sediment loads in combination with a general lack of large woody inputs (trees)
result in stream channels dominated by long runs and riffles with relatively few deep pools.
Beaver activity is virtually absent in all four segments though their presence and construction of
dams would enhance habitat complexity for trout and other fish species. Regional aquatic
habitat personnel have recognized this opportunity and anticipate increasing beaver management
activities in the future along portions of some of the streams in this study (Kevin Spence, WGFD
aquatic habitat biologist, Green River; personal communication).
Hydrology
Efforts to sustain, rehabilitate, or restore ecosystem processes generally involve
managing water inputs and levels to provide appropriate inter- and intra-annual variable flow
regimes. In many settings, flow regime management also addresses instream and out-of-stream
needs that integrate biotic and abiotic processes (Annear et. al 2004). As a consequence,
development of flow recommendations requires an understanding of local stream flow
characteristics within and between years. Long-term gage data are often heavily relied upon to
provide this information, however in many cases stream gage data are not available within or
near the segment. In these situations, hydrology data must be estimated by referencing an
established and appropriate stream gage with at least 10 years of continuous data.
There is no localized stream gage or data available on or near the study site. As noted
below in this report, the most appropriate reference gage for this stream was located on Jack
Creek near Saratoga, Wyoming (USGS gage 06627800). Though this gage has not recorded
data during the winter, it has a continuous period of flow data during ice-free periods for over 20
years.
Biology
Quantifying flow needs in Wyoming streams involves designing studies to answer
specific questions about biological resources. The state’s instream flow law specifically restricts
instream flow needs to the direct in-channel habitat needs of fishes, however biology also
extends to the wider ecosystem of plants and animals associated with the stream in terms of how
(for example) upland and riparian vegetation helps shape the stream channel and provide
important energy to stream organisms in the form of woody debris and terrestrial insects.
Questions to answer when quantifying flow needs include things such as whether flow
regimes are needed to protect all species in the fish community, whether a single species is the

Grizzly WHMA Streams, 2011 6
focus of attention and what life stages are in need of protection. Consequently, it is necessary to
establish the composition of biological communities, what important life stages and habitats are
found within the study area, and what seasonal flows are needed to support those organisms and
life stages. In consideration of these facts it is important to establish whether the goal is to target
flow protection for a particular game species, forage species, or threatened/endangered species).
Fish and Other Aquatic Resources The fish communities found in the four candidate
streams consist of a mix of native and non-native species. Fisheries in Littlefield and Upper
Muddy creeks have both been managed by the department in recent years to remove all non-
native fishes. Today they contain viable populations of CRC, mountain sucker (MTS;
Catostomus platyrhynchus), and speckled dace (SPD; Rhinichthys osculus). Little Muddy and
McKinney creeks contain primarily non-native fishes including brook trout (BKT, salvelinus
fontinalis). McKinney Creek also contains white suckers (WHS, Catostomus commersoni), and
creek chubs (CKC, Semotilus atromaculatus) as well as MTS, SPD.
There are also several amphibians associated with riparian habitat in the watershed that
are listed as “species of greatest conservation need” (SGCN, WGFD 2005b). This classification
of organisms includes species whose conservation status warrants increased management
attention, and funding, as well as consideration in conservation, land use, and development
planning. There are currently 180 such species that have been identified in Wyoming. SGCN
species in the project area include the blotched tiger salamander (Ambystoma mavortium
melanostictum), boreal toad (Anaxyrus boreas boreas), great basin spadefoot (Spea
intermontana), American bullfrog (Lithobates catesbeianus), northern leopard frog (Lithobates
pipiens), boreal chorus frog (Pseudocris maculata), and Columbia spotted frog (Rana
luteiventris).
Habitat preferences of target species, and their life stages, are important components of
instream flow studies since flow recommendations are based on maintaining sufficient habitat for
target species to carry out life history functions (e.g., spawning, growth, and survival). These
habitat preferences are used to develop habitat suitability curves that are used in instream flow
models (described below).
Growth of adult and juvenile CRC is most important during the summer and early fall
periods. Habitat for these life stages is also critical during winter to allow over-winter survival.
Upland and Riparian Resources Terrestrial vegetation species include mountain shrubs,
sagebrush communities, aspen, and water birch that occur in discontinuous patches along
riparian creek bottoms and upland slopes of the each of these streams. Mature cottonwood and
other deciduous trees are rare though are present along portions of Littlefield and McKinney
Creeks. Aspen are the predominant tree species found on slopes of upland areas. Riparian
vegetation in the form of grasses and sedges is relatively well established along most of the
stream segments.
Methods
Overall Approach for Developing Instream Flow Recommendations
A combination of several different methods was used to develop instream flow
recommendations to maintain or improve the fisheries in the study streams. When possible, data

Grizzly WHMA Streams, 2011 7
were collected to run each of several habitat models for a study site. These models provide an
evaluation of the relationship between flow level (regime) and physical habitat for trout in terms
of variables such as water depth, velocity, and cover as well as water quality, flow regime
variability, macro-invertebrate production and stream bank stability. Recommended flows were
designed to protect habitat during portions of the year that are most critical for the target species
and life stage. Recommendations were developed relative to natural flow conditions, but
because none of the instream flow segments had stream gage data, estimates of stream flow were
developed for these comparisons.
Basis for Instream Flow Recommendations
Instream flow recommendations for each stream segment were developed for four
seasonal periods using various methods that are described in more detail below. Seasonally
appropriate flows are needed for: 1) over-winter survival, 2) early spring hydrologic
connectivity, 3) physical habitat for spawning, and 4) summer growth and production (Table 2).
Over-winter survival of adult and juvenile CRC is based on either the Habitat Retention
method or the natural 20% exceedance flow from October 1 through March 31. Flow needed to
maintain in-stream hydrologic connectivity between all habitat types for juvenile and adult CRC
in the early spring period (April 1 to May 14) is also based on the Habitat Retention method.
Flow needed for CRC spawning for the period May 15 to June 30 is drawn from habitat
modeling results for this life stage using the Physical Habitat Simulation (PHABSIM) model
(Bovee et al. 1998). Summer flow for growth and production of CRC for the period July 1 to
September 30 is determined with Habitat Quality Index results.
When two or more methods could be used for a recommendation, the method typically
chosen is the one that yields the higher flow needed for a particular fishery maintenance purpose.
For example, the Habitat Retention approach that provides an estimate of flow needed for basic
survival and hydrologic connectivity in a stream segment may be insufficient to protect adequate
habitat for trout spawning. In these cases the method that indicates a higher flow need is used.
In situations where the models used yield a flow recommendation that is higher than the
likely available flow, the 20% exceedence flow is relied on to provide the recommended flow
level.
One limitation of these flow recommendations is an underlying assumption that the
physical habitat conditions and geomorphic processes in the stream are static. The analyses
presented in this report generate flows that provide suitable hydraulic habitat within the existing
channel form of each stream. However if water depletions were to occur that removed high
flows and permanently altered the flow regime of these streams, it is likely the channel form
would change over time. If the channel form changes significantly, flow regime
recommendations for the target species may change as well. Flows needed to allow channel
maintenance and provide a flow pattern that fully maintains fishery habitat form and function are
presented in Appendix B. These channel maintenance flows perform their function during the
rising and falling legs of the hydrograph in April, May, and June. As noted in the Introduction,
the results from this analysis are provided for informational purposes only and are not the basis
of flow regime recommendations at this time.
TABLE 2. Colorado River cutthroat trout life stages and seasons considered in
developing instream flow recommendations. Numbers indicate the method used for each

Grizzly WHMA Streams, 2011 8
combination of season and life stage, and grey shading indicates the primary data used for flow
recommendations in each season.
Life stage and
Fishery Function
Over-Winter
Oct 1 – Mar 31
Early Spring
Apr 1 – May 14
Spring
May 15 – Jun 30
Summer
Jul 1 – Sep 30
Survival of all life
stages 1 2 2 2
Connectivity between
habitats for adult
& juvenile CRC
2 2 2 2
Spawning &
incubation 3
Adult & juvenile
growth 4
All life stages habitat* 5 5
1=Natural 20% exceedance flow or Habitat Retention, whichever is greater, 2=Habitat Retention, 3=Physical
Habitat Simulation, 4=Habitat Quality Index, 5=Channel Maintenance.
* Channel maintenance flow needs are presented in Appendices B through E.
Hydrology There are no active stream flow gages on any of the instream flow segments
however three U. S. Geological Survey (USGS) gages currently operate in the general area. Two
of these gages are located on downstream portions of Muddy Creek. Gage number 09258050 is
located above Olson Draw, near Dad, WY. The other Muddy Creek gage (09258980) is located
below Young Draw near Baggs, WY. Neither gage has an adequate period of record (a
minimum of 10 years and preferably at least 20 years) for relating to the study segments – gage
09258050 has only been operated for short periods during the summer beginning in July 2010.
The gage below Young Draw has only been operated since 2004. Neither gage is rated by the
USGS.
The other nearby USGS gage (06627800) is located on Jack Creek, a tributary of the
North Platte River near Saratoga. This gage has been operated only during ice-free periods
(April through September) from 1990 to the present. Though data for ice-prone periods of year
are lacking, the extended period of record during open water periods was an adequate reference
for developing hydrographs for each of the study streams. This gage was also judged to be more
reflective of conditions at the four study streams than the lower Muddy Creek gages because it
was located at a similar elevation (7,050 feet), reflected similar rainfall according to the
Wyoming Climate Atlas, and exhibited a northerly aspect of flow from the Sierra Madre. Both
Muddy Creek gages are in a portion of the watershed that exhibit a southerly aspect, had lower
precipitation, and were at considerably lower elevations than the study streams.
The annual stream flow pattern at the Jack Creek gage is typical of snowmelt runoff
streams with short periods of high (runoff) flow with relatively low flows occurring over a
substantial period of the water year (Figure 2). Annual peak flow occurred between May 1 and
June 15 over the period of record. Base flow recession occurs throughout summer with lowest
flow levels attained in September. Annual flow minima typically occur in the winter in
snowmelt runoff streams like this one and likely approximate flows recorded in September.
Winter flows (October through February) for the Jack Creek reference gage were estimated to be
80% of September flows. March flows were obtained by interpolating between average April

Grizzly WHMA Streams, 2011 9
flows and September flows and were not used as a basis for determining winter flow needs. A
representative year within each flow exceedence class (wet 0-10%, average 30-70% and dry 90-
100%) was selected to display the range of conditions in the period of record. The daily flow
values are plotted for these representative hydrographs in Figure 3.
FIGURE 2. Average monthly flow at Jack Creek (USGS stream gage 06627800) from
1990 to 2010. Flows from October through February were estimated by assuming 80% of
average September flow. March flows were interpolated based on April and September flows.
0.0
20.0
40.0
60.0
80.0
100.0
120.0
140.0
Jan Feb Mar Apr May Jun Jul Aug Sep Oct Nov Dec
Ave
rage
mo
nty
ly f
low
(cf
s)
Month
0
100
200
300
400
500
600
Flo
w (
cfs)
Calendar Day
High
Average
Low

Grizzly WHMA Streams, 2011 10
FIGURE 3. Daily flow in high (2009), average (2005), and low (2001) water years for
the reference gage (Jack Creek USGS stream gage 06627800). Representative water years were
selected from within each of three flow exceedence classes for this gage (high 0–10%, average
30–70%, and low 90–100%) and used for generating flow estimates for the proposed instream
flow segments.
The model selected to estimate average annual flow (QAA) at each of the four study sites
was determined by assessing the relative accuracy of three potential flow simulation models to
predict QAA for the reference gage. Two models by Miselis et al. (1999) were considered. One
model was based on streams in the Medicine Bow Mountains and the other used a formula for
streams in all mountainous regions of the state. Another model by Lowham (1988) was also
evaluated. All of these models involved formulae based on contributing basin area
characteristics. Lowham’s (1988) model also included average annual precipitation. The model
by Lowham yielded the most accurate estimate for flow at the gage and was used for calculating
flow characteristics at all study sites (Table 3).
A dimensionless analysis approach was used to estimate hydrologic characteristics at
each study segment, including peak annual flow, annual daily minimum flow, 1.5 year flood
frequency, and monthly 20% exceedence flow. Dimensionless data were created for the
reference gage by dividing each flow statistic (QW) by the average annual flow (i.e., QW / QAA).
The dimensionless flow value for each flow statistic was then multiplied by the estimated QAA
for the instream flow segment in question (from Lowham, 1988) to develop flow values for that
segment. Flood frequency was determined using the Log Pearson III method through an online
program at San Diego State University (http://ponce.sdsu.edu/onlilnepearson.php (Ponce 2009).
TABLE 3. Comparison of hydrograph simulation model results for three models to
assess their ability to predict the measured average annual flow (QAA) at the Jack Creek gage
(27.3 cfs). Drainage area (DA) at the gage was 109 square miles and average annual
precipitation (PR) was 11.0 inches.
Model Formula Estimated QAA (cfs)
Miselis, et. al (1999):
Medicine Bow Mountains,
Drainage Area
2.53250 * DA0.72
74.2
Miselis, et. al: (1999)
Mountainous for Wyoming;
Drainage Area
1.20976 * DA0.894
80.2
Lowham (1988): Drainage
Area and Precipitation 0.013 * DA
0.93 * PR
1.43 31.5
Average annual flow estimates were used in applying the Habitat Quality Index and
Habitat Retention models (described below). The 1.5-year return interval on the flood frequency
series was used to estimate bankfull flow (Rosgen 1996) for use in the Habitat Retention method
and for developing channel maintenance flow recommendations. Channel maintenance
calculations also required the 25-year peak flow estimate from the flood frequency analysis. The
monthly flow duration series was used in developing winter flow recommendations. Throughout
this report, the term “exceedance” is used, as in “20% exceedance flow.” The 20% exceedance

Grizzly WHMA Streams, 2011 11
flow refers to the flow level that would be exceeded 20% of the time or that would be available
approximately one year out of every five consecutive years. As noted above, because winter
flow measurements were lacking at the Jack Creek gage, we estimated the 20% exceedence
value from October 1 through the end of February as 80% of the September 20% value. Flow
measurements collected by WGFD during instream flow habitat studies were used to help
validate the models.
Geomorphology – Channel Maintenance Channel form is a direct function of
interactions among eight variables: discharge, sediment supply, sediment size, channel width,
depth, velocity, slope, and roughness of channel materials (Leopold et al. 1964; Heede 1992;
Leopold 1994). For many alluvial streams in their natural state, the channel exists in a state of
dynamic equilibrium in which the sediment load is balanced with the stream’s transport capacity
over time (Bovee et al. 1998). When a stream is not in dynamic equilibrium, as associated with
a lack of important high flow conditions, fine sediment buildup can occur causing, for example, a
reduction in spawning habitat suitability. Higher, channel-maintenance flows are critical for
maintaining long-term habitat availability for stream fish. These flow levels sustain the river
channel conditions by permitting a connection to the floodplain, preventing buildup of fine
sediments, and facilitating a variety of other important ecological processes (Carling 1995,
Annear et al. 2004, Locke et al. 2008).
Wyoming statute 41-3-1001-1014 declares that instream flows may be appropriated for
maintaining or improving fisheries, which has been interpreted by the Wyoming State Engineer
to include only static physical components of habitat. The law does not specifically provide that
other widely accepted components of a fishery such as geomorphology, water quality,
connectivity, or riverine processes may serve as a basis for quantifying flow regime needs for
fisheries. As a result, the instream flow recommendations generated in this report focus on
results of fish habitat models that provide estimates of only physical habitat availability for CRC.
Because all five of the riverine components are interconnected and maintain natural processes
that support the form and function of natural stream fisheries, a flow regime that does not
provide sufficient flow at appropriate times of year to maintain the necessary geomorphology,
water quality, or connectivity conditions and processes will likely not achieve the statutorily
authorized beneficial use of maintaining the existing fishery in perpetuity. Although current
interpretation of the law does not permit using these other components to quantify an instream
flow appropriation, the flow needs for each are described and presented in this report.
Biology – Fish Habitat The availability of habitat for CRC was evaluated using several
different habitat models for each study site. “Habitat” in this report refers the suitability of
physical conditions (depth, velocity, substrate, and cover) for a given area. These physical
conditions vary with discharge. It is important to note that these variables do not represent a
complete account of all variables that comprise trout habitat. Habitat for trout also includes
environmental elements such as water temperature, dissolved oxygen, stream bank stability,
distribution and abundance of prey and competitor species, the timing and extent of fish
movements, and other variables. Interpretation of model results based on these habitat
parameters assumes that habitat within the study segment for each stream provides a reasonable
estimate of habitat availability throughout each designated instream flow segment.

Grizzly WHMA Streams, 2011 12
Biology – Physical Habitat Simulation Model The Physical Habitat Simulation
(PHABSIM) approach was used to estimate flows that will maintain habitat for individual life
stages during critical time periods. The PHABSIM approach uses computer models to calculate
the relative suitability of each modeled flow for target species and life stages based on depth,
velocity, and substrate or cover (Bovee et al. 1998). Calculations are repeated at user-specified
discharges to develop a relationship between suitable area (termed “weighted useable area” or
WUA) and discharge. Model calibration data are collected across the stream at each of several
locations (transects) and involve measuring depth and velocity at multiple locations (cells) along
each transect. Measurements are repeated at three or more different discharge levels. By using
depths and velocities measured at one flow level, the user calibrates a PHABSIM model to
accurately predict the depths and velocities measured at the other discharge levels (Bovee and
Milhous 1978, Milhous et al. 1984, Milhous et al. 1989).
Following calibration, the model simulates depths and velocities over a range of user-
specified discharges. These predicted depths and velocities, along with substrate or cover
information, are then incorporated with established habitat suitability curves (HSC) to generate
an estimate of physical habitat throughout the study site at specified flows. The relative value of
predicted depths, velocities, substrates, and cover elements range between “0” (no suitability)
and “1” (maximum suitability). At any particular discharge, a combined suitability for every cell
is generated. That suitability is multiplied by the surface area of the cell and summed across all
cells to yield weighted useable area for the discharge level. Results are often depicted by
graphing WUA for a particular fish life stage versus a range of simulated discharges (Bovee et
al. 1998). For each life stage, the WUA for each flow is divided by the maximum WUA to
obtain a unit-less measure of relative suitability. This allows an objective comparison of the
relative suitability of each flow for each life stage.
Habitat Retention Method The Habitat Retention Method (Nehring 1979, Annear and
Conder 1984) was used to identify the flow that maintains specified hydraulic criteria (Table 4)
in riffles. Maintaining depth, velocity, and wetted perimeter criteria in riffles is based on an
assumption that other habitat types like runs or pools remain viable for fish when adequate flows
are provided in shallow riffles that serve as hydraulic controls (Nehring 1979). Flow
recommendations derived from the Habitat Retention Method describe instream flows needed to
maintain hydrologic connectivity (fish passage) between habitat types and as well as survival of
fish and benthic invertebrates at any time of year when the recommended flow is naturally
available. The flow identified by the Habitat Retention Method is important year round, except
when higher instream flows are required to meet other fishery management purposes.
Simulation tools and calibration techniques used for hydraulic simulation in PHABSIM
are also used with the Habitat Retention approach. The difference is that Habitat Retention
provides a single, threshold recommendation and does not provide an incremental analysis of the
benefits of depth, width, and velocity for aquatic organisms. The AVPERM model within the
PHABSIM methodology is used to produce estimates of cross section depth, wetted perimeter,
and velocity for a range of flows. The flow that maintains 2 out of the 3 criteria in Table 4 for all
three transects is then identified; however, because of the critical importance of depth for
maintaining fish passage, that criterion must be one of the criteria met for each transect.

Grizzly WHMA Streams, 2011 13
TABLE 4. Hydraulic criteria for determining maintenance flow with the Habitat
Retention method. For streams with a mean bankfull width greater than 20 feet the mean depth
criteria is the product of 0.01 times mean bankfull width.
Category Criteria
Mean Depth (ft) 0.20 or 1% average
bankfull width
Mean Velocity (ft/s) 1.00
Wetted Perimeter a (%) 50
a - Percent of bankfull wetted perimeter
Biology – Habitat Quality Index Model The Habitat Quality Index model (HQI; Binns
and Eiserman 1979, Binns 1982) was used to determine relative trout habitat suitability or
production potential over a range of late summer (July through September) flow conditions.
Most of the annual trout production in Wyoming streams occurs during the late summer,
following peak runoff, when longer days and warmer water temperatures facilitate growth. The
HQI was developed by the WGFD to provide an index of relative habitat suitability, which is
correlated to trout production as a function of nine biological, chemical, and physical trout
habitat attributes. Each attribute is assigned a rating from 0 to 4 with higher ratings representing
better trout habitat features. Attribute ratings are combined in the model with results expressed
in trout Habitat Units (HU's), where one HU is defined as the amount of habitat that will support
about one pound of trout, though the precise relationship can vary between streams. HQI results
were used to identify the relationship between flow levels and trout production potential from
July 1 to September 30, 2010. Results are based on an assumption that flow needs for all other
life stages of trout are adequate at all other times of year and that water quality is not a limiting
factor.
In the HQI analysis, habitat attributes measured at various flow events are assumed to
be typical of late summer flow conditions. For example, stream widths measured in June under
high flow conditions are considered an estimate of stream width that would occur if that flow
level were a base flow occurring in late summer. Under this assumption, HU estimates are
extrapolated through a range of potential late summer flows (Conder and Annear 1987). Some
attribute ratings were mathematically derived to establish the relationship between discharge
and trout habitat at discharges other than those measured. In calculating HU’s over a range of
discharges, temperature, nitrate concentration, invertebrate numbers, and eroding banks were
held constant because these variables are unlikely to exhibit significant change over the range
of flows being studied.
Article 10, Section d of the Wyoming Instream Flow statute states that waters used for
providing instream flows “shall be the minimum flow necessary to maintain or improve existing
fisheries.” The HQI is used to identify a flow to maintain the existing fishery in the following
manner: the number of habitat units that occur under normal July through September flow
conditions is quantified and then the flow that maintains that level of habitat is identified. The
August 20% monthly exceedance flow was used as a reference of normal late summer flow
levels. This flow is not the minimum flow needed to keep the target fish species alive, but is the
amount of water needed to realize the statutorily authorized beneficial use of maintaining the
existing fishery within its range of natural variability.

Grizzly WHMA Streams, 2011 14
Natural Winter Flow The three habitat modeling approaches described above are not
necessarily well suited to determine flow needs for trout during ice-prone times of year (late
October through early April). These methods were all developed for and apply primarily to
open-water periods. Ice-forming and break-up processes during winter months can change the
hydraulic properties of water flowing through stream channels and limit the utility of models
developed for open water conditions. The complexities of variable ice forming processes and
patterns make direct modeling of winter trout habitat over a range of flows relatively imprecise.
For example, frazil and surface ice may form and break up on multiple occasions during the
winter over widely ranging spatial and temporal scales. Even cases that can be modeled, for
example a stable ice cap over a simple pool, may not yield a result worthy of the considerable
time and expense necessary to calibrate an ice model. There are no widely accepted aquatic
habitat models for quantifying instream flow needs for fish in under-ice conditions (Annear et al.
2004). As a result, a different approach was used to determine winter flow needs.
For Wyoming Rocky Mountain headwater streams, a conservative approach is needed
when addressing flow requirements during harsh winter habitat conditions. The scientific
literature indicates that the stressful winter conditions for fish would become more limiting if
winter water depletions were to occur. Even relatively minor flow reduction at this time of year
can change the frequency and severity of ice formation, force trout to move more frequently,
affect distribution and retention of trout, and reduce the holding capacity of the few large pools
often harboring a substantial proportion of the total trout population (Lindstrom and Hubert
2004). Hubert et al. (1997) observed that poor gage records often associated with the winter
season requires use of a conservative discharge value. The 50% monthly exceedance does not
provide an appropriate estimate of naturally occurring winter flow. It may be appropriate from
the standpoint of maintaining fisheries to select the higher flows of a 20% monthly exceedance
(drawn from the lowest monthly flow in the winter). Such an approach assures that even in cases
where flow availability is prone to being underestimated due to poor gage records or other
estimation errors, flow approximating the natural winter condition will be recommended. This
approach has been used for many recent instream flow recommendations (Robertson and Dey
2008) and consequently was adopted for the instream flow segment on Muddy Creek. For these
studies, no data were available at the reference gage on Jack Creek so the 20% exceedence was
estimated at 80% of the September flow. In keeping with the precautionary principle approach
described here, the higher flow of these two determinants served as the basis for recommending
winter flow needs.
Water Quality The amount of flow is one of several factors that affects maintenance of
water quality. Chemical characteristics of a river, such as DO and levels of alkalinity, nitrogen,
and pH reflect local geography, land use, climate, and sources of organic matter. These factors
ultimately determine the river’s biological productivity. Management of point source (e.g.,
chemical, temperature) and nonpoint source (e.g., sediment) pollutants is an important, on-going
part of addressing instream flow needs. Sediment and temperature are the primary physical
constituents of water quality assessments that affect fisheries.
In this study, the primary water quality elements included water temperature and nitrate
concentration since both were needed in models used to develop the impact analysis and
mitigation recommendations. Continuous recording thermometers were placed in Little Muddy
and McKinney Creeks from early June through September. Temperature data for Littlefield and
Muddy Creeks were obtained from a previous study by the Green River aquatic habitat biologist.

Grizzly WHMA Streams, 2011 15
Per USGS records for Jack Creek, mean monthly flows in July through September of 1999 were
similar to flows recorded in the same period of 2010. Nitrate concentrations were collected in
mid-August, kept cool and dark, and analyzed by the Wyoming Agriculture Station lab within 48
hours of collection.
Dissolved oxygen concentrations and other elements were assumed to be non-limiting to
the fishery.
Connectivity Connectivity of a river system refers to the flow, exchange, and pathways
that move organisms, energy, and matter through these systems. These pathways are not always
linear. The interrelated components of watershed, hydrology, biology, geomorphology, and
water quality, together with climate, determine the flow and distribution of energy and material
in river ecosystems. Complexity and interdependence are key elements of connectivity. The
interaction of primary factors (i.e., water, energy and matter) creates an extensive physical
environment that varies over time.
River system connectivity is manifested along four dimensions: longitudinal, lateral,
vertical, and time (Ward 1989). Lateral connectivity is critical to the functioning of floodplain-
based stream ecosystems because of the transport of nutrients and organic matter from the
floodplain to the stream during floods. This process often drives development of aquatic food
resources that affect fish productivity. The seasonal flooding of unregulated streams creates and
maintains diverse species of riparian vegetation (Nilsson et al. 1989), which, in turn, fosters
diverse animal communities both within and adjacent to the stream channel.
When developing instream flow prescriptions, it is important to address the presence of
physical, chemical, and even biological barriers to connectivity within any of the four
dimensions.
The Habitat Retention Method described above was used to quantify the flow needed to
maintain continuous hydrologic connectivity within the stream channel. Studies were not done
to quantify flows needed to maintain lateral connectivity nor were assessments done of the
relationship between ground water and flow (vertical connectivity). The roles of nutrient and
energy cycling and sediment transport was assumed to be addressed by maintaining longitudinal
connectivity for target fish in this report and were not directly studied.
Results
Muddy Creek
Study Site Location and Description The stream segment proposed for this instream
flow water right filing extends from the point where the stream crosses the downstream boundary
of Bureau of Land Management land below the boundary of the Grizzly WHMA in Range 89 W,
Township 17 N, Section 18 (UTM Zone 13; 296,189.6 E, 4,588,021.4 N) upstream
approximately 4.04 miles to UTM Zone 13: 298,591.5 E: 4,584,358.6 N (Figure 4, Figure 1).
The fish community in this section of the stream is composed of native Colorado River
cutthroat trout, mountain suckers, and speckled dace. The stream is managed for CRC. As a
consequence, flow quantification methods focused on quantifying seasonal flow regime needs
for CRC with the implicit assumption that an adequate flow regime for that species would
provide an acceptable amount of aquatic habitat for other fish species. Instream flow

Grizzly WHMA Streams, 2011 16
recommendations were developed to maintain or improve habitat for spawning and adult life
stages of fish at all times of year. Securing instream flow water rights on this stream segment
will help ensure the future of CRC and other native fish species by protecting existing base flow
conditions in priority against potential but presently unidentified future consumptive and
diversionary demands.
The instream flow segment is located entirely on public land. There is no private
property or water rights upstream from the segment. Though there are privately owned land and
water rights downstream from the segment, non-consumptive instream rights that may result
from this filing will not affect those rights. Because there were no nearby private property
sections, there was no need to contact individual landowners and assess interest in extending the
proposed segment through private lands. However, interested landowners may contact the
WGFD to discuss and assess opportunities for establishing separate, state-owned instream flow
rights through their property. In such situations, new studies would be needed to quantify those
flow regime needs. The department has no plans to conduct such studies at the present time.
FIGURE 4. Location of Muddy Creek study site.

Grizzly WHMA Streams, 2011 17
Data Collection Data upon which instream flow recommendations were based were
collected at three different flow events to obtain the needed range of information (Table 5). The
wide in flow levels was sufficient for effectively calibrating the models used for flow
quantification.
TABLE 5. Dates and stream flow levels at which field data were collected for
quantifying instream flow needs for CRC on Muddy Creek.
Date Flow (cfs)
6/02/2010 5.2
6/23/2010 2.5
8/05/2010 1.6
Two study sites consisting of two cross sections each were established on spawning
riffles within the target segment to model flow needs for CRC spawning. These sites were about
300 feet apart and located near the downstream boundary of the segment. A section of stream
225 feet in length and encompassing one of the spawning riffles was established to collect
Habitat Quality Index (HQI) information. The bankfull width in this reach was approximately
10 feet so the HQI study site length was approximately 22 channel widths. This is longer than
recommended by Binns (1982; 10 times the channel width). The complexity of habitat features
within the HQI site is representative of the range of habitat features available in the instream
flow segment. Results from analyzing habitat availability over a range of flows from these study
sites were extrapolated to the entire proposed instream flow segment. Because recommendations
are based on simulated flow conditions, the results and recommendations would not be different
during unusually wet or dry years.
Hydrology Based on the Lowham model (1988), average annual flow (QAA) in Muddy
Creek was 4.04 cfs. This value was inserted into the dimensionless model based on flows in
Jack Creek to generate all needed hydrologic statistics (Table 6). Average monthly flows for the
period of record range from less than 1 cfs in late summer to over 18 cfs in May (Figure 5).
Estimates of the 20 percent exceedance flow by month (Table 7) show the level of flow in each
month that is available approximately 1 year in 5. The 1.5 year flood frequency is about 22 cfs
and the 25 year flood event is 89.0 cfs). The average daily peak flow was 39 cfs and the average
daily minimum flow was 0.4 cfs. Estimates of monthly 20% exceedance flows range from about
1 cfs in the fall and winter to about 28 cfs in May. As with all modeling efforts, some error is
inherently unavoidable. For example the error range for most USGS gages can run as high as
10% or higher. Field measurements of flow can similarly err by up to 5% per transect. However
averaging flow measurements at multiple cross sections for these studies minimizes that error.
All of the measured flows were within or above the simulated flow levels for each month,
indicating that the estimated flow values were reasonable for this study.
TABLE 6. Estimated hydrologic characteristics for the Muddy Creek instream flow
segment.
Flow Parameter Estimated Flow (cfs)
Average daily minimum flow 0.4

Grizzly WHMA Streams, 2011 18
Average annual flow (QAA) 4.0
Average daily peak flow) 39
1.5-year flood frequency 23
25-year flood frequency 89
FIGURE 5. Estimated mean monthly flow in Muddy Creek for the period of record.
Flow in October through March is estimated.
TABLE 7. Calculated 20% exceedence flows for each month that gage data are available
at the Jack Creek gage and estimated values for the Muddy Creek study site. Exceedance flows
for winter months were not available. Flow estimates are in cubic feet per second (cfs).
Month
Jack Creek 20%
exceedance flow
Muddy Creek 20%
exceedance
January NA* 1*
February NA 1*
March NA 1*
April 48.9 7.2
May 190.1 28.2
June 170.7 25.3
July 37.1 5.5
August 11.7 1.7
September 8.5 1.3
October NA 1*
November NA 1*
December NA 1*
NA - Not Available; * - estimated based on 80% of September flow
0
4
8
12
16
20
Jan Feb Mar Apr May Jun Jul Aug Sep Oct Nov Dec
Dis
char
ge (
cfs)
Month
Grizzly WHMA Streams, 2011 19
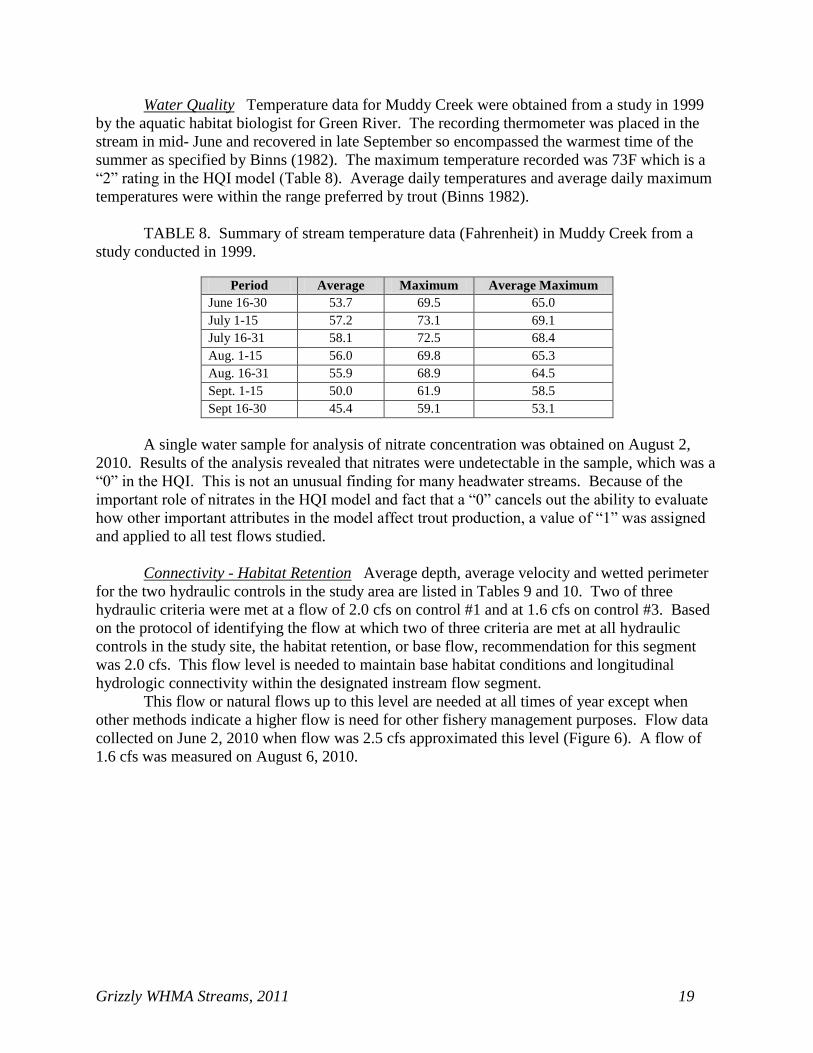
Water Quality Temperature data for Muddy Creek were obtained from a study in 1999
by the aquatic habitat biologist for Green River. The recording thermometer was placed in the
stream in mid- June and recovered in late September so encompassed the warmest time of the
summer as specified by Binns (1982). The maximum temperature recorded was 73F which is a
“2” rating in the HQI model (Table 8). Average daily temperatures and average daily maximum
temperatures were within the range preferred by trout (Binns 1982).
TABLE 8. Summary of stream temperature data (Fahrenheit) in Muddy Creek from a
study conducted in 1999.
Period Average Maximum Average Maximum
June 16-30 53.7 69.5 65.0
July 1-15 57.2 73.1 69.1
July 16-31 58.1 72.5 68.4
Aug. 1-15 56.0 69.8 65.3
Aug. 16-31 55.9 68.9 64.5
Sept. 1-15 50.0 61.9 58.5
Sept 16-30 45.4 59.1 53.1
A single water sample for analysis of nitrate concentration was obtained on August 2,
2010. Results of the analysis revealed that nitrates were undetectable in the sample, which was a
“0” in the HQI. This is not an unusual finding for many headwater streams. Because of the
important role of nitrates in the HQI model and fact that a “0” cancels out the ability to evaluate
how other important attributes in the model affect trout production, a value of “1” was assigned
and applied to all test flows studied.
Connectivity - Habitat Retention Average depth, average velocity and wetted perimeter
for the two hydraulic controls in the study area are listed in Tables 9 and 10. Two of three
hydraulic criteria were met at a flow of 2.0 cfs on control #1 and at 1.6 cfs on control #3. Based
on the protocol of identifying the flow at which two of three criteria are met at all hydraulic
controls in the study site, the habitat retention, or base flow, recommendation for this segment
was 2.0 cfs. This flow level is needed to maintain base habitat conditions and longitudinal
hydrologic connectivity within the designated instream flow segment.
This flow or natural flows up to this level are needed at all times of year except when
other methods indicate a higher flow is need for other fishery management purposes. Flow data
collected on June 2, 2010 when flow was 2.5 cfs approximated this level (Figure 6). A flow of
1.6 cfs was measured on August 6, 2010.

Grizzly WHMA Streams, 2011 20
FIGURE 6. Muddy Creek upper study site on June 2, 2010 at a flow of 2.5 cfs.
TABLE 9. Simulated hydraulic criteria for hydraulic control 1 on Muddy Creek.
Bankfull flow based on the estimated 1.5 year flood frequency was approximately 20 cfs. The
flow at which individual criteria are met is indicated by shading.
Flow
(cfs)
Average
Velocity
(ft/sec)
Hydraulic
depth (ft)
Wetted
Perimeter
(ft)
1 2.44 0.07 5.85
1.6 1.90 0.13 6.49
2.0 1.67 0.18 6.61
2.5 1.70 0.24 6.75
4.0 1.64 0.37 7.09
5.2 1.64 0.47 7.35
6.0 1.65 0.53 7.51
8.0 1.66 0.61 8.70
8.5 1.65 0.62 9.08
16.0 1.5 0.8 14.0
20.0 1.4 0.9 16.6
TABLE 10. Simulated hydraulic criteria for hydraulic control 3 on Muddy Creek.
Bankfull flow based on the estimated 1.5 year flood frequency was approximately 20 cfs. The
flow at which individual criteria are met is indicated by shading.
Flow
(cfs)
Average
Velocity
(ft/sec)
Hydraulic
depth (ft)
Wetted
Perimeter
(ft)
1.0 3.2 0.1 3.4
1.6 2.7 0.2 3.8
2.0 2.5 0.2 4.2
2.5 2.3 0.3 4.6

Grizzly WHMA Streams, 2011 21
4.0 2.1 0.4 5.0
5.2 2.0 0.6 5.4
5.5 2.0 0.6 5.5
6.0 1.9 0.6 5.8
8.0 1.8 0.7 6.9
10.0 1.7 0.9 7.9
20.0 1.3 1.7 11.3
Biology – PHABSIM The combined data for CRC spawning physical habitat from all
four transects showed that weighted usable area (WUA) was maximized at a flow of 3.5 cfs with
a second peak noted at 9.5 cfs (Figure 7). This secondary bump was a function of unique habitat
characteristics associated with the downstream pair of transects (numbers 3 and 4). This is a
function of increased suitability of velocities and depths in cells along the margin of the stream at
this flow. However because the combined maximum WUA occurs at 3.5 cfs, this relatively
lower flow is most beneficial for spawning within the entire stream segment.
FIGURE 7. Weighted usable area available for CRC spawning at two study sites in
Muddy Creek over a range of flows.
Biology – Habitat Quality Index The HQI model data (Figure 8) was important in
evaluating late summer habitat production potential for this instream flow segment. The 20%
exceedence flow value for August (1.7 cfs; TABLE 7) was used as an estimate of existing habitat
conditions in late summer on a long-term basis. At this flow, the stream provides 21.2 Habitat
Units. The lowest flow that would provide that amount of habitat is 1.5 cfs. Decreasing
discharge to 1cfs would decrease the number of Habitat Units by over 50%. Therefore, the
lowest instream flow level needed to maintain adult CRC habitat during the late summer period
is 1.5 cfs.
0
20
40
60
80
100
0 5 10 15 20Pe
rce
nt
of
Max
imu
m U
sab
le A
rea
Flow (cubic feet per second)
Xsec's 1 & 2 (upper)
Xsec 3 & 4 (lower)
Combined WUA

Grizzly WHMA Streams, 2011 22
FIGURE 8. Habitat Quality Index vs. discharge in the Muddy Creek instream flow
segment. The recommended flow (1.5 cfs) is indicated by the light shaded bar.
Geomorphology Channel maintenance flow analyses and results are contained in
Appendix B. This flow regime allows natural stream channel processes to occur and maintain
existing quantity and quality of in-channel habitat as well as a healthy riparian assemblage of
plants and animals (Stromberg and Patten 1990, Rood et al. 1995, Mahoney and Rood 1998).
These flow regimes are consistent with scientifically accepted principles of fisheries
management (Annear et al. 2004). The instream flow recommendations drawn from other
methods used in this study to maintain short-term habitat for CRC in Muddy Creek were based
on the premise that geomorphic characteristics and processes of the stream will not change over
time. This is a valid assumption under existing conditions since no major diversions or flow
altering activities presently occur upstream from or within the instream flow segment. Should
development occur that changes the free-flowing nature of the existing hydrograph, especially by
removing peak flows, this assumption would no longer be valid. In such a situation, as the
stream habitat changes, the flow recommendations provided here may not maintain the existing
fishery.
Instream Flow Recommendations
Flow needs during four seasonal time periods were identified to maintain the existing
fishery (Table 11, Figure 9). These distinct seasons and habitat functions include winter CRC
survival (October 1 – March 31), maintenance of longitudinal habitat connectivity in anticipation
of CRC spawning in early spring (April 1 – May 14), early summer CRC spawning (May 15 –
June 30), and maintenance of CRC production potential in the summer months (July 1 –
September 30).
Winter flow recommendations were based primarily on Habitat Retention results and are
equal to natural flow up to 2.0 cfs. This flow will maintain over-winter survival of all life stages
of CRC at existing levels Though data were lacking to estimate monthly 20% flow exceedance
levels, it appears the recommended winter flow based on the Habitat Retention method is equal
0
5
10
15
20
25
30
35
0.5 1.5 2.5 3.5 4.5 5.5 6.5 7.5 8.5 9.5
Hab
itat
Un
its
Discharge (cfs)

Grizzly WHMA Streams, 2011 23
to or slightly higher than what that level would be if data were available to calculate exceedance
flow levels.
Early spring recommendations were based on the Habitat Retention method as well (2.0
cfs). This flow is needed to maintain longitudinal connectivity between habitats and ensure that
CRC can reach important spawning areas before the spawning season begins.
Recommendations for the early summer spawning period were based on the average peak
CRC spawning habitat suitability at two study sites using the PHABSIM model (3.5 cfs). Data
from each of the study sites in the analysis were normalized to a percent reduction from the
maximum available at each site. The available WUA calculations at each flow were combined to
form a single curve that reflected the relationship between flow and WUA throughout the
proposed instream flow segment. This recommended flow level is considerably lower than the
estimated 20% exceedance flow levels for the months to which this recommendation applies.
Summer flow recommendations were based on habitat requirements from the HQI model
to maintain adult and juvenile CRC production (1.5 cfs). This flow recommendation is slightly
less than the 2.0 cfs recommendation that was obtained with the Habitat Retention method, but
because of the importance of movement between suitable habitat features and per flow
recommendation development protocol, the results of the Habitat Retention model of 2.0 cfs are
recommended as the flow for this seasonal period. This number is similar to the August 20%
exceedance level (1.7 cfs).
Channel maintenance flows perform their function during runoff in April, May, June, and
July (Appendix B) but are not included in the instream flow water right application as described
in the Introduction.
TABLE 11. Flow recommendations (cfs) for the proposed instream flow segment in
Muddy Creek.
Study Segment
Winter
Survival
Oct 1 – Mar 31
Early Spring
Connectivity
Apr 1 – May 14*
Spring
Spawning
May 15 – Jun 30*
Summer
Production
Jul 1 – Sep 30
Muddy Creek 2.0 2.0 3.5 2.0
* - Channel maintenance flow recommendations for the spring runoff period are presented in Appendix B.

Grizzly WHMA Streams, 2011 24
FIGURE 9. Recommended instream flows in Muddy Creek relative to high, average and
dry water years for times of year when gage data are available (April through September).
Littlefield Creek
Study Site Location and Description The stream segment proposed for an instream flow
water right filing extends from near the downstream boundary of Bureau of Land Management
land below the boundary of the Grizzly WHMA in Range 89 W, Township 17 N, Section 17
(UTM Zone 13; 296,602.9 E, 4,591,600.8 N) upstream 7.03 miles to UTM Zone 13; 301,819.0
E; 4,590,477.9 N (Figure 10, Figure 1).
The fish community in this section of the stream is composed of native CRC, mountain
suckers, and speckled dace. The stream is managed for CRC. As a consequence, flow
quantification methods focused on quantifying seasonal flow regime needs for CRC with the
implicit assumption that an adequate flow regime for that species would provide an acceptable
amount of aquatic habitat for other fish species. Instream flow recommendations were
developed to maintain or improve habitat for spawning and adult life stages of fish at all times of
year. Securing instream flow water rights on this stream segment will help ensure the future of
CRC and other native fish species by protecting existing base flow conditions in priority against
potential but presently unidentified future consumptive and diversionary demands.
The instream flow segment is located entirely on public land. There is no private
property or water rights upstream from the segment. Though there are privately owned land and
water rights downstream from the segment, non-consumptive instream rights that may result
from this filing will have no effect on those rights. Because there were no nearby private
property sections, no individual landowners were contacted. However, interested downstream
landowners may voluntarily contact the WGFD to assess opportunities for establishing state-
owned instream flow rights through their property (separate from this anticipated filing). In such
0
20
40
60
80
100
4/1
5/1
5/3
1
6/3
0
7/3
0
8/2
9
9/2
8
Flo
w (
cfs)
High Average Low Recommended flow

Grizzly WHMA Streams, 2011 25
situations, new studies would be needed to quantify those flow regime needs. The department
has no plans to conduct such studies at the present time.
FIGURE 10. Location of study site where data were collected to evaluate fish habitat at
the potential instream flow segment on Littlefield Creek.
Data Collection Data upon which instream flow recommendations are based were
collected at three different flow events to obtain the needed range of information (Table 12).
The wide range in flow levels was sufficient for effectively calibrating the models used for flow
quantification.
Three study sites consisting of two cross sections each were established on spawning
riffles within the target segment to model flow needs for CRC spawning. A section of stream
244 feet in length and encompassing two of the spawning riffles was established to collect
Habitat Quality Index (HQI) information. The bankfull width in this reach was approximately 4
feet so the HQI study site length was over 60 channel widths in length. This is longer than the
10 bank widths recommended by Binns (1982). The complexity of habitat features within the
HQI site is representative of the range of habitat features available in the instream flow segment.
Results from analyzing habitat availability over a range of flows from these study sites were
extrapolated to the entire proposed instream flow segment. Because recommendations are based

Grizzly WHMA Streams, 2011 26
on simulated flow conditions, the results and recommendations would not be different during
unusually wet or dry years.
TABLE 12. Dates and stream flow levels at which field data were collected for
quantifying instream flow needs for CRC on Muddy Creek.
Date Flow (cfs)
6/02/2010 4.1
6/23/2010 2.6
8/05/2010 1.1
Hydrology Based on the Lowham model (1988), QAA in Littlefield Creek was 2.9 cfs
(Table 13). This value was inserted into the dimensionless model based on flows in Jack Creek
to generate needed hydrologic statistics. Average monthly flows for the period of record range
from less than 1.0 cfs in late summer to over 13 cfs in May (Figure 11). The 1.5 year flood
frequency is about 16 cfs and the 25 year flood event is 64 cfs. The average daily peak flow was
28 cfs and the average daily minimum flow was 0.3 cfs. Estimates of the 20 percent exceedance
flow by month (Table 14) show the level of flow in each month that is available approximately
one year in five. Monthly 20% exceedance flows range from slightly less than 1.0 cfs in the fall
and winter to about 20 cfs in May.
As with all modeling efforts, some error is inherently unavoidable. For example the error
range for most USGS gages can run as high as 10% or higher. Field measurements of flow can
similarly bear error in estimating flow of 5% per transect. However collection of flow
measurements at multiple cross sections as was done here minimizes that error and we note that
all of the measured flows were within or above the simulated flow levels for each month.
Consequently we determined the estimated flow values were adequate for this study.
TABLE 13. Estimated hydrologic characteristics for the Littlefield Creek instream flow
segment.
Flow Parameter Estimated Flow (cfs)
Average daily minimum flow 0.3
Average annual flow (QAA) 2.9
Average daily peak flow 28
1.5-year flood frequency 16
25-year flood frequency 64

Grizzly WHMA Streams, 2011 27
FIGURE 11. Estimated mean monthly flow in Littlefield Creek for the period of record.
Flow in October through March is estimated.
TABLE 14. Estimated 20 percent exceedence flows for each month that gage data are
available at the Jack Creek gage. Exceedance flows for winter months were not available. Flow
estimates are in cubic feet per second (cfs).
Month
Jack Creek mean
monthly 20% daily
exceedence
Littlefield Creek
average monthly
20% exceedence
(QW/QAA)*QAA
January NA 0.7*
February NA 0.7*
March NA 0.7*
April 48.9 5.2
May 190.1 20
June 170.7 18
July 37.1 3.9
August 11.7 1.2
September 8.5 0.9
October NA 0.7*
November NA 0.7*
December NA 0.7*
NA - Not Available; * - estimated based on 80% of September flow
Water Quality Temperature data for Littlefield Creek were obtained from a study in
1999 by the aquatic habitat biologist for Green River (Kevin Spence, personal communication).
The recording thermometer was placed in the stream in mid-June and recovered in late
September so encompassed the warmest time of the summer as specified by Binns (1982). The
0
2
4
6
8
10
12
14
16
Jan Feb Mar Apr May Jun Jul Aug Sep Oct Nov Dec
Dis
char
ge (
cfs)
Month

Grizzly WHMA Streams, 2011 28
maximum temperature recorded was 73F which is a “2” rating in the HQI model (Table 15).
Average daily temperatures and average daily maximum temperatures were within a range
preferred by trout.
TABLE 15. Summary of stream temperature data (Fahrenheit) in Littlefield Creek from
a study conducted in 1999.
Period
Average
Temperature
Maximum
Temperature
Average
Maximum
Temperature
June 16-30 53.7 69.5 65.0
July 1-15 57.2 73.1 69.1
July 16-31 58.1 72.5 68.4
Aug. 1-15 56.0 69.8 65.3
Aug. 16-31 55.9 68.9 64.5
Sept. 1-15 50.0 61.9 58.5
Sept 16-30 45.4 59.1 53.1
A single water sample for analysis of nitrate concentration was obtained on August 2,
2010. Results of the analysis revealed that nitrates were undetectable in the sample, which was a
“0” in the HQI. This is not an unusual finding for many headwater streams. Because of the
important role of nitrates in the HQI model and fact that a “0” cancels out the ability to evaluate
how other important attributes in the model affect trout production, a value of “1” was assigned
and applied to all test flows studied.
Connectivity - Habitat Retention Average depth, average velocity and wetted perimeter
for the three hydraulic controls in the study area are listed in Tables 16, 17 and 18. Two of three
hydraulic criteria were met at a flow of 1.0 cfs on transects #1 and #3 and at 0.5 cfs on transect
#5. Based on the protocol of identifying the flow at which two of three criteria are met at all
hydraulic controls in the study site, the habitat retention, or base flow, recommendation for this
segment was 1.0 cfs. Considering that the estimated 20% exceedence flow in late summer is 1.2
cfs (Table 14), the recommendation obtained from transects #1 and #3 (1.0 cfs) was judged
reasonable and used as the basis for the recommendation derived from this method. This flow
level is needed to maintain base habitat conditions and longitudinal hydrologic connectivity
within the designated instream flow segment. This flow or natural flows up to this level are
needed at all times of year except when other methods indicate a higher flow is need for other
fishery management purposes. Figure 12 shows the stream at a flow of 1.1 cfs.

Grizzly WHMA Streams, 2011 29
FIGURE 12. Littlefield Creek upper study site on August 5, 2010 at a flow of 1.1 cfs.
TABLE 16. Simulated hydraulic criteria for the hydraulic controls at transect 1 on
Littlefield Creek. Bankfull flow based on the 1.5 year flood frequency was approximately 16
cfs. The flow at which individual criteria are met is indicated by shading. Two of three criteria
were met at 1.0 cfs.
Flow
(cfs)
Average Velocity
(ft/sec)
Depth
(ft)
Wetted
Perimeter (ft)
0.5 1.54 0.08 3.91
1.0 1.18 0.19 4.62
1.2 1.16 0.22 4.69
1.5 1.12 0.30 4.86
2.6 1.11 0.49 5.33
3.0 1.11 0.57 5.51
4.1 1.12 0.72 5.98
5.0 1.12 0.81 6.59
6.0 1.11 0.89 7.26
8.0 1.07 1.06 8.46
10 1.03 1.26 9.33
12 1.00 1.44 10.16

Grizzly WHMA Streams, 2011 30
TABLE 17. Simulated hydraulic criteria for the hydraulic controls at transect 3 on
Littlefield Creek. Bankfull flow based on the 1.5 year flood frequency was approximately 16
cfs. Two of three criteria were met at 1.0 cfs.
Flow
(cfs)
Average Velocity
ft/sec
Depth
(ft)
Wetted
Perimeter (ft)
0.5 0.83 0.20 3.37
1.0 1.01 0.32 3.67
1.2 1.06 0.35 3.74
2.0 1.31 0.48 4.12
2.6 1.45 0.55 4.34
3.0 1.54 0.60 4.49
4.1 1.74 0.70 4.83
5.0 1.90 0.78 5.10
6.0 2.06 0.86 5.37
8.0 2.33 0.99 6.40
10 2.56 1.07 7.82
12 2.74 1.05 9.15
TABLE 18. Simulated hydraulic criteria for the hydraulic controls at transect 5 on
Littlefield Creek. Bankfull flow based on the 1.5 year flood frequency was approximately 16
cfs. Two of three criteria were met at 1.0 cfs.
Flow
(cfs)
Average Velocity
(ft/sec)
Depth
(ft)
Wetted
Perimeter (ft)
0.5 1.08 0.11 4.21
1.0 0.92 0.19 5.87
1.2 0.94 0.21 5.93
2.0 1.06 0.33 6.17
2.6 1.14 0.39 6.31
3.0 1.19 0.43 6.40
4.1 1.31 0.52 6.61
5.0 1.41 0.60 6.77
6.0 1.50 0.66 6.93
8.0 1.66 0.79 7.22
10 1.81 0.90 7.47
12 1.93 0.99 7.70
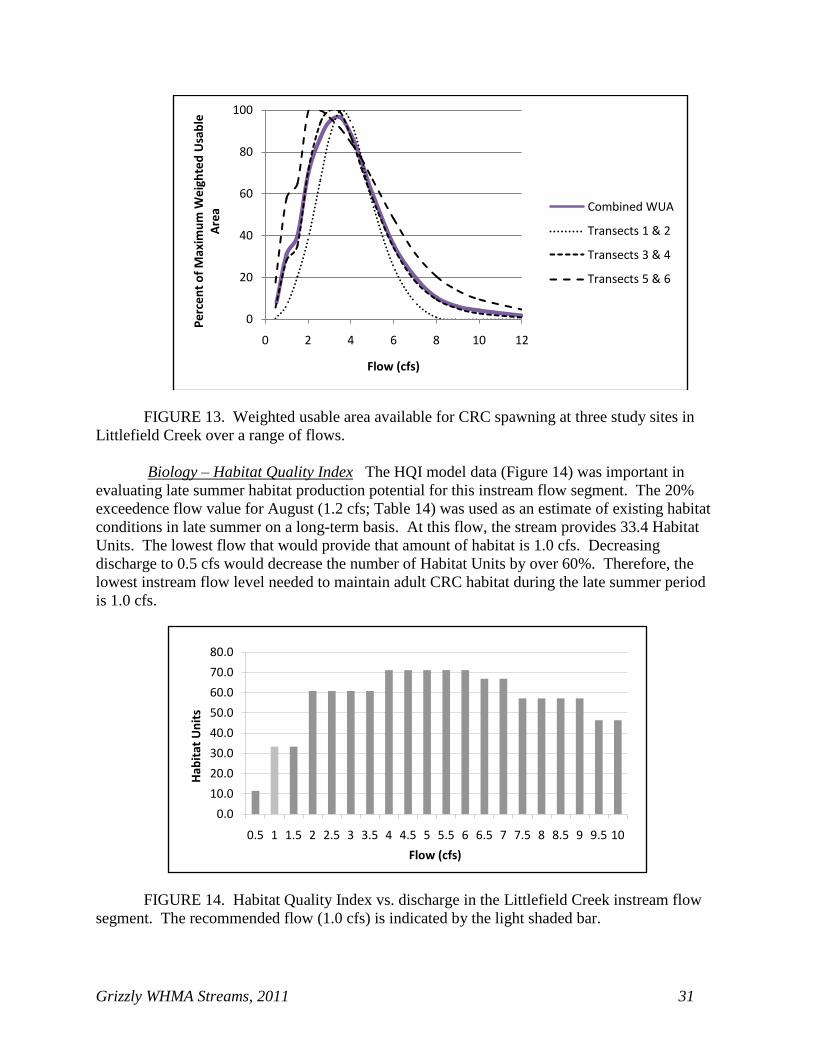
Biology – PHABSIM The combined data for spawning physical habitat showed that
weighted usable area (WUA) was maximized at a flow of 3.5 cfs (Figure 13). This relatively
lower flow is most beneficial for spawning within the entire stream segment.
Grizzly WHMA Streams, 2011 31
FIGURE 13. Weighted usable area available for CRC spawning at three study sites in
Littlefield Creek over a range of flows.
Biology – Habitat Quality Index The HQI model data (Figure 14) was important in
evaluating late summer habitat production potential for this instream flow segment. The 20%
exceedence flow value for August (1.2 cfs; Table 14) was used as an estimate of existing habitat
conditions in late summer on a long-term basis. At this flow, the stream provides 33.4 Habitat
Units. The lowest flow that would provide that amount of habitat is 1.0 cfs. Decreasing
discharge to 0.5 cfs would decrease the number of Habitat Units by over 60%. Therefore, the
lowest instream flow level needed to maintain adult CRC habitat during the late summer period
is 1.0 cfs.
FIGURE 14. Habitat Quality Index vs. discharge in the Littlefield Creek instream flow
segment. The recommended flow (1.0 cfs) is indicated by the light shaded bar.
0
20
40
60
80
100
0 2 4 6 8 10 12
Pe
rce
nt
of
Max
imu
m W
eig
hte
d U
sab
le
Are
a
Flow (cfs)
Combined WUA
Transects 1 & 2
Transects 3 & 4
Transects 5 & 6
0.0
10.0
20.0
30.0
40.0
50.0
60.0
70.0
80.0
0.5 1 1.5 2 2.5 3 3.5 4 4.5 5 5.5 6 6.5 7 7.5 8 8.5 9 9.5 10
Hab
itat
Un
its
Flow (cfs)

Grizzly WHMA Streams, 2011 32
Geomorphology Channel maintenance flow analyses and results are contained in
Appendix B. This flow regime allows natural stream channel processes to occur and maintain
existing quantity and quality of in-channel habitat as well as a healthy riparian assemblage of
plants and animals (Stromberg and Patten 1990, Rood et al. 1995, Mahoney and Rood 1998).
These flow regimes are consistent with scientifically accepted principles of fisheries
management (Annear et al. 2004). The instream flow recommendations drawn from other
methods used in this study to maintain short-term habitat for CRC in Muddy Creek were based
on the premise that geomorphic characteristics and processes of the stream will not change over
time. This is a valid assumption under existing conditions since no major diversions or flow
altering activities presently occur upstream from or within the instream flow segment. Should
development occur that changes the free-flowing nature of the existing hydrograph, especially by
removing peak flows, this assumption would no longer be valid. In such a situation, if the
stream habitat changed, the flow recommendations provided here would likely not maintain the
existing fishery.
Instream Flow Recommendations
Flow needs during four seasonal time periods were identified to maintain the existing
fishery (Table 19, Figure 15). These distinct seasons and habitat functions include winter CRC
survival (October 1 – March 31), maintenance of longitudinal habitat connectivity in anticipation
of CRC spawning in early spring (April 1 – May 14), early summer CRC spawning (May 15 –
June 30), and maintenance of trout production potential in mid to late summer months (July 1 –
September 30).
Winter flow recommendations were based primarily on Habitat Retention results and are
equal to natural flow up to 1.0 cfs. This flow will maintain over-winter survival of all life stages
of CRC at existing levels Though data were lacking to estimate monthly 20% flow exceedance
levels, it appears the recommended winter flow based on the Habitat Retention method is equal
to or slightly higher than what that level would be if data were available to calculate exceedance
flow levels.
Early spring recommendations were based on the Habitat Retention method as well (1.0
cfs). This flow is needed to maintain longitudinal connectivity between habitats and ensure that
CRC can reach important spawning areas before the spawning season begins.
Recommendations for the early summer spawning period were based on the average peak
CRC spawning habitat suitability at three study sites using the PHABSIM model (3.5 cfs). Data
from each of the study sites in the analysis were normalized to a percent reduction from the
maximum available at each site. The available WUA calculations at each flow were combined to
form a single curve that reflected the relationship between flow and WUA throughout the
proposed instream flow segment. This recommended flow level is considerably lower than the
estimated 20% exceedance flow levels for the months to which this recommendation applies
(Table 14).
Summer flow recommendations were based on habitat requirements from the HQI model
to maintain adult and juvenile CRC production (1.0 cfs). This flow recommendation is the same
as was obtained with the Habitat Retention method so per flow recommendation development
protocol, the summer flow recommendation is 1.0 cfs.

Grizzly WHMA Streams, 2011 33
Channel maintenance flows perform their function during runoff in April, May, June, and
July (Appendix B) but are not included in the instream flow water right application as described
in the Introduction.
TABLE 19. Flow recommendations (cfs) for the proposed instream flow segment in
Littlefield Creek.
Study Segment
Winter
Survival
Oct 1 – Mar 31
Early Spring
Connectivity
Apr 1 – May 14*
Spring
Spawning
May 15 – Jun 30*
Summer
Production
Jul 1 – Sep 30
Littlefield Creek 1.0 1.0 3.5 1.0
* - Channel maintenance flow recommendations for the spring runoff period are presented in Appendix B.
FIGURE 15. Recommended instream flows in Littlefield Creek relative to high, average,
and dry water years for times of year when gage data are available (April through September).
Little Muddy Creek
Study Site Location and Description The stream segment proposed for an instream flow
water right filing extends from the downstream boundary the Grizzly WHMA in Range 88 West,
Township 18 N, Section 6 (UTM Zone 13; 303,189.4 E, 4,594,810.3 N) upstream approximately
2.01 miles to UTM Zone 13; 304,487.2 E; 4,592,695.4 N (Figure 16, Figure 1).
The fish community in this section of the stream is composed solely of non-native brook
trout, however the stream is within historic CRC range and long-term plans call for ultimately
restoring the stream to CRC. As a consequence, flow quantification methods focused on
quantifying seasonal flow regime needs for CRC with the implicit assumption that an adequate
flow regime for that species would provide an acceptable amount of aquatic habitat for other
aquatic organisms within the segment. Instream flow recommendations were developed to
maintain or improve habitat for spawning and adult life stages of fish at all times of year.
0
10
20
30
40
50
60
1-A
pr
1-M
ay
31
-May
30
-Ju
n
30
-Ju
l
29
-Au
g
28
-Sep
Flo
w (
cfs)
High Average Low Recommended flow

Grizzly WHMA Streams, 2011 34
Securing instream flow water rights on this stream segment will help ensure survival and
perpetuation of CRC if and when they are reintroduced by protecting existing base flow
conditions in priority against potential but presently unidentified future consumptive and
diversionary demands.
The instream flow segment is located entirely on public land. There is no private
property or water rights upstream from or within the segment. Though there is a small amount of
privately owned land downstream from the segment there are no diversions or irrigable lands that
may be affected by this filing. As a consequence, no individual landowners were contacted.
However, interested the downstream landowner may voluntarily contact the WGFD to assess
opportunities for establishing state-owned instream flow rights through their property (separate
from this anticipated filing). In such situations, new studies would be needed to quantify those
flow regime needs. The department has no plans to conduct such studies at the present time.
FIGURE 16. Location of study site where data were collected to evaluate fish habitat at
the potential instream flow segment on Little Muddy Creek.
Data Collection Data were collected at three different flow events to obtain the needed
range of information (Table 20). The wide range in flow levels was sufficient for effectively
calibrating the models used for flow quantification.
Three study sites consisting of two cross sections each were established on spawning
riffles within the target segment to model flow needs for CRC spawning. An additional stand-
alone transect was also placed on another hydraulic control to ensure that suitable data collection
sites were included for analyses. A section of stream 293 feet in length and encompassing the
spawning riffle at the downstream end of the study area was established to collect Habitat

Grizzly WHMA Streams, 2011 35
Quality Index (HQI) information. The bankfull width in this reach was approximately 5 feet so
the HQI study site length was almost 60 channel widths in length. This is longer than the 10
bank widths recommended by Binns (1982). The complexity of habitat features within the HQI
site is representative of the range of habitat features available in the instream flow segment.
Results from analyzing habitat availability over a range of flows from these study sites were
extrapolated to the entire proposed instream flow segment. Because recommendations are based
on simulated flow conditions, the results and recommendations would not be different during
unusually wet or dry years.
TABLE 20. Dates and stream flow levels at which field data were collected for
quantifying instream flow needs for CRC on Muddy Creek.
Date Flow (cfs)
6/02/2010 8.5
6/23/2010 3.5
8/26/2010 0.8
Hydrology Based on the Lowham model (1988) QAA in Little Muddy Creek was 2.3 cfs
(Table 21). This value was inserted into the dimensionless model based on flows in Jack Creek
to generate needed hydrologic statistics. Average monthly flows for the period of record range
from less than 0.3 cfs in late summer to about 11 cfs in May (Figure 17). The 1.5 year flood
frequency is about 13 cfs and the 25 year flood event is 51 cfs). The average daily peak flow
was 28cfs and the average daily minimum flow was 0.3 cfs. Estimates of the 20 percent
exceedance flow by month (Table 22) show the level of flow in each month that is available
approximately 1 year in 5. These flows range from slightly less than 1 cfs in the fall and winter
to about 16 cfs in May.
As with all modeling efforts, some error is inherently unavoidable. For example the error
range for most USGS gages can run as high as 10% or higher. Field measurements of flow can
similarly bear error in estimating flow of 5% per transect. However collection of flow
measurements at multiple cross sections as was done here minimizes that error and we note that
all of the measured flows were within or above the simulated flow levels for each month.
Consequently we determined the estimated flow values were reasonable.
TABLE 21. Estimated hydrologic characteristics for the Little Muddy Creek instream
flow segment.
Flow Parameter Estimated Flow (cfs)
Average daily minimum flow 0.2
Average annual flow (QAA) 2.3
Average daily peak flow 22
1.5-year flood frequency 13
25-year flood frequency 51
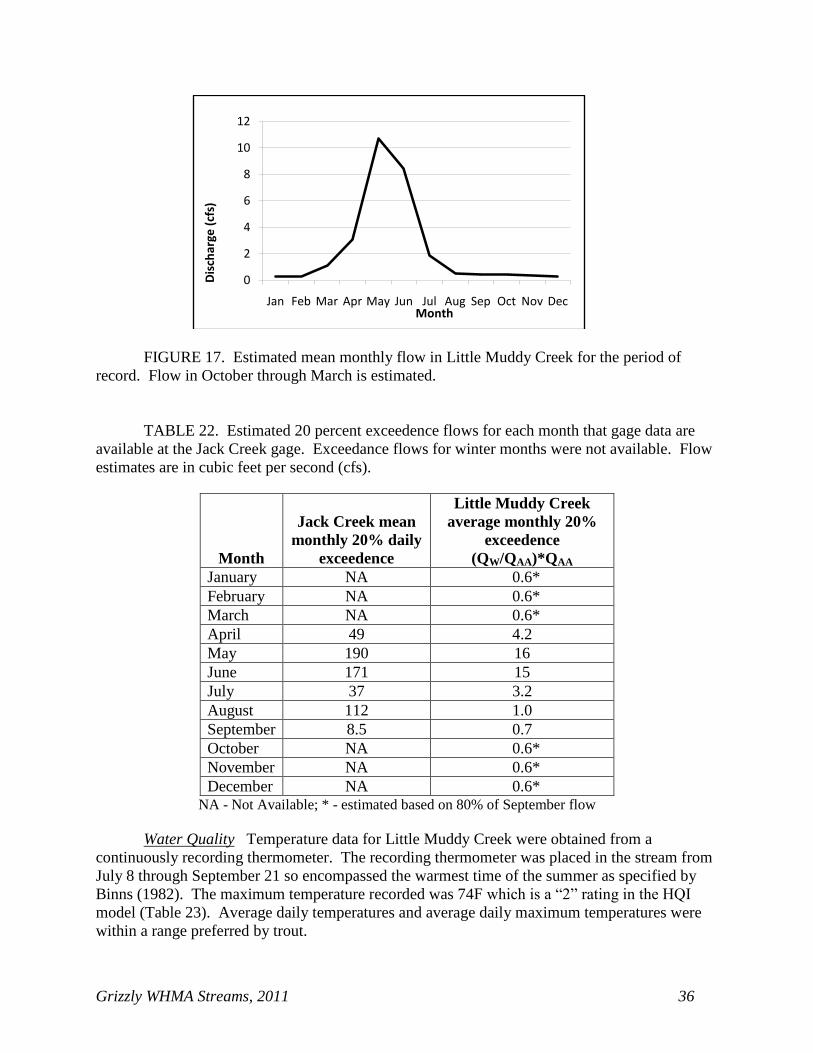
Grizzly WHMA Streams, 2011 36
FIGURE 17. Estimated mean monthly flow in Little Muddy Creek for the period of
record. Flow in October through March is estimated.
TABLE 22. Estimated 20 percent exceedence flows for each month that gage data are
available at the Jack Creek gage. Exceedance flows for winter months were not available. Flow
estimates are in cubic feet per second (cfs).
Month
Jack Creek mean
monthly 20% daily
exceedence
Little Muddy Creek
average monthly 20%
exceedence
(QW/QAA)*QAA
January NA 0.6*
February NA 0.6*
March NA 0.6*
April 49 4.2
May 190 16
June 171 15
July 37 3.2
August 112 1.0
September 8.5 0.7
October NA 0.6*
November NA 0.6*
December NA 0.6* NA - Not Available; * - estimated based on 80% of September flow
Water Quality Temperature data for Little Muddy Creek were obtained from a
continuously recording thermometer. The recording thermometer was placed in the stream from
July 8 through September 21 so encompassed the warmest time of the summer as specified by
Binns (1982). The maximum temperature recorded was 74F which is a “2” rating in the HQI
model (Table 23). Average daily temperatures and average daily maximum temperatures were
within a range preferred by trout.
0
2
4
6
8
10
12
Jan Feb Mar Apr May Jun Jul Aug Sep Oct Nov Dec
Dis
char
ge (
cfs)
Month

Grizzly WHMA Streams, 2011 37
TABLE 23. Summary of stream temperature data (Farenheit) in Little Muddy Creek in
2010.
Period
Average
Temperature
Maximum
Temperature
Average Maximum
Temperature
July 8-15 59.4 69.0 66.8
July 16-31 62.6 74.1 70.6
Aug. 1-15 60.5 73.7 67.8
Aug. 16-31 57.1 67.8 65.7
Sept. 1-15 51.8 61.8 58.7
Sept 16-21 50.8 58.9 57.6
A single water sample for analysis of nitrate concentration was obtained on August 2,
2010. Results of the analysis revealed that nitrates were undetectable in the sample, which was a
“0” in the HQI. This is not an unusual finding for many headwater streams. Because of the
important role of nitrates in the HQI model and fact that a “0” cancels out the ability to evaluate
how other important attributes in the model affect trout production, a value of “1” was assigned
and applied to all test flows studied.
Connectivity- Habitat Retention Average depth, average velocity and wetted perimeter
for the four hydraulic controls in the study area are listed in Tables 24-27. Two of three
hydraulic criteria were met at a flow of 1.2 cfs on transect #1, 1.8 cfs on transect #3, 0.7 cfs on
transect 4, and 2.0 cfs on transect 6. Considering that the estimated 20% exceedence flow in late
summer is 0.7 cfs and in the winter is about 0.6 cfs (Table 22), the recommendation obtained
from transect #4 (0.7 cfs) was considered the most reasonable estimate of available flow and was
used as the basis for the recommendation derived from this method. This flow level is needed to
maintain base habitat conditions and longitudinal hydrologic connectivity within the designated
instream flow segment. This flow or natural flows up to this level are needed at all times of year
except when other methods indicate a higher flow is need for other fishery management
purposes. Figure 18 shows a portion of the study site at a flow of 0.8 cfs.

Grizzly WHMA Streams, 2011 38
FIGURE 18. Little Muddy Creek on August 26, 2010 at a flow of 0.8 cfs.
TABLE 24. Simulated hydraulic criteria for the hydraulic controls at transect 1 on Little
Muddy Creek. Bankfull flow based on the 1.5 year flood frequency was approximately 13 cfs.
The flow at which individual criteria are met is indicated by shading.
Flow
(cfs)
Average
Velocity (ft/sec) Depth (ft)
Wetted
Perimeter (ft)
0.74 0.55 0.26 5.60
1.2 0.67 0.28 6.75
2.0 0.78 0.31 8.81
3.5 0.95 0.43 9.33
4.0 1.00 0.46 9.49
6.0 1.19 0.56 10.09
8.5 1.39 0.63 11.11
10.0 1.50 0.66 11.89
13.0 1.67 0.68 13.50

Grizzly WHMA Streams, 2011 39
TABLE 25. Simulated hydraulic criteria for the hydraulic controls at transect 3 on Little
Muddy Creek. Bankfull flow based on the 1.5 year flood frequency was approximately 13 cfs.
The flow at which individual criteria are met is indicated by shading.
Flow
(cfs)
Average
Velocity ft/sec Depth (ft)
Wetted
Perimeter (ft)
0.70 0.65 0.28 4.19
1.80 0.89 0.47 4.75
2.00 0.93 0.50 4.87
3.50 1.12 0.57 6.21
4.00 1.15 0.59 6.65
6.00 1.24 0.65 8.22
8.50 1.30 0.80 9.10
10.00 1.34 0.91 9.24
13.00 1.41 1.09 9.50
TABLE 26. Simulated hydraulic criteria for the hydraulic controls at transect 4 on Little
Muddy Creek. Bankfull flow based on the 1.5 year flood frequency was approximately 13 cfs.
The flow at which individual criteria are met is indicated by shading.
Flow
(cfs)
Average
Velocity (ft/sec) Depth (ft)
Wetted
Perimeter (ft)
0.74 1.36 0.20 3.01
2.00 1.62 0.41 3.56
3.47 1.80 0.53 4.42
4.00 1.84 0.58 4.60
6.00 1.78 0.49 7.92
7.00 1.69 0.52 8.98
8.50 1.57 0.54 11.09
10.00 1.45 0.57 13.15
13.00 1.26 0.66 16.61
TABLE 27. Simulated hydraulic criteria for the hydraulic controls at transect 6 on Little
Muddy Creek. Bankfull flow based on the 1.5 year flood frequency was approximately 13 cfs.
The flow at which individual criteria are met is indicated by shading.
Flow
(cfs)
Average
Velocity (ft/sec) Depth (ft)
Wetted
Perimeter (ft)
0.74 0.84 0.18 5.07
2.00 0.99 0.29 7.29
2.7 1.05 0.32 8.05
3.50 1.11 0.36 8.86
4.00 1.15 0.38 9.36
6.00 1.25 0.46 10.88
10.00 1.32 0.50 15.61
13.00 1.37 0.61 16.10

Grizzly WHMA Streams, 2011 40
Biology – PHABSIM The combined data for spawning physical habitat showed that
weighted usable area (WUA) was maximized at a flow of 2.0 cfs (Figure 19). All four of the
sites where data were collected revealed generally similar preferred flows. As a consequence,
the recommended flow will be appropriate for the majority of riffles within the instream flow
segment for CRC spawning.
FIGURE 19. Weighted usable area available for CRC spawning at three study sites in
Little Muddy Creek over a range of flows.
Biology Habitat Quality Index The HQI model data (Figure 20) was important in
evaluating late summer habitat production potential for this instream flow segment. The 20%
exceedence flow value for August (1.0 cfs; Table 22) was used as an estimate of existing habitat
conditions in late summer on a long-term basis. At this flow, the stream provides 25.1 habitat
units. The lowest flow that would provide that amount of habitat is 1.0 cfs. Decreasing
discharge to 0.5 cfs would decrease the number of Habitat Units by at least 20%. Because
stream temperature is associated with flow, this reduction would likely be greater if late summer
maximum temperature increased as little as 1 or 2 degrees Fahrenheit. Therefore, the lowest
instream flow level needed to maintain adult CRC habitat during the late summer months is 1.0
cfs.
0
20
40
60
80
100
0 5 10 15 20 25
Pe
rce
nt
of
Max
imu
m W
UA
Discharge (cfs)
Transects 1 & 2
Transect 3
Transects 4 & 5
Transects 6 & 7
Combined transects

Grizzly WHMA Streams, 2011 41
FIGURE 20. Habitat Quality Index vs. discharge in the Little Muddy Creek instream
flow segment. The recommended flow (1.0 cfs) is indicated by the light shaded bar.
Geomorphology Channel maintenance flow analyses and results are contained in
Appendix B. This flow regime allows natural stream channel processes to occur and maintain
existing quantity and quality of in-channel habitat as well as a healthy riparian assemblage of
plants and animals (Stromberg and Patten 1990, Rood et al. 1995, Mahoney and Rood 1998).
These flow regimes are consistent with scientifically accepted principles of fisheries
management (Annear et al. 2004). The instream flow recommendations drawn from other
methods used in this study to maintain short-term habitat for CRC in Muddy Creek were based
on the premise that geomorphic characteristics and processes of the stream will not change over
time. This is a valid assumption under existing conditions since no major diversions or flow
altering activities presently occur upstream from or within the instream flow segment. Should
development occur that changes the free-flowing nature of the existing hydrograph, especially by
removing peak flows, this assumption would no longer be valid. In such a situation, if the
stream habitat changed, the flow recommendations provided here would likely not maintain the
existing fishery.
Instream Flow Recommendations
Flow needs during four seasonal time periods were identified to maintain the existing
fishery (Figure 21, Table 28). These distinct seasons and habitat functions include winter CRC
survival (October 1 – February 28), maintenance of longitudinal habitat connectivity in
anticipation of CRC spawning in early spring (March 1 – April 30), early summer CRC
spawning (May 1 – June 30), and maintenance of trout production potential in mid to late
summer months (July 1 – September 30).
Winter flow recommendations were based primarily on Habitat Retention results and are
equal to natural flow up to 0.7 cfs. This flow will maintain over-winter survival of all life stages
of CRC at existing levels Though data were lacking to estimate monthly 20% flow exceedance
levels, it appears the recommended winter flow based on the Habitat Retention method is
conservatively equal to or slightly higher than what that level would be if data were available to
calculate exceedance flow levels.
0
10
20
30
40
50
60
70
0.5 1.5 2.5 3.5 4.5 5.5 6.5 7.5 8.5 9.5
Hab
itat
Un
its
Discharge (cfs)

Grizzly WHMA Streams, 2011 42
Early spring recommendations were based on the Habitat Retention method as well (0.7
cfs). This flow is needed to maintain longitudinal connectivity between habitats and ensure that
CRC can reach important spawning areas before the spawning season begins.
Recommendations for the early summer spawning period were based on the average peak
CRC spawning habitat suitability at three study sites using the PHABSIM model (2.0 cfs). Data
from each of the study sites in the analysis were normalized to a percent reduction from the
maximum available at each site. The available WUA calculations at each flow were combined to
form a single curve that reflected the relationship between flow and WUA throughout the
proposed instream flow segment. This recommended flow level is considerably lower than the
estimated 20% exceedance flow levels for the months to which this recommendation applies
(Table 22).
Summer flow recommendations were based on habitat requirements from the HQI model
to maintain adult and juvenile CRC production (1.0 cfs). This flow recommendation is slightly
higher than the Habitat Retention method so per flow recommendation development protocol,
the summer flow recommendation is 1.0 cfs. Figure 21 shows how the recommended flow
regime compares to estimated natural flow regimes during dry, normal, and wet periods.
Channel maintenance flows perform their function during runoff in April, May, June, and
July (Appendix B) but are not included in the instream flow water right application as described
in the Introduction.
TABLE 28. Flow recommendations (cfs) for the proposed instream flow segment in
Little Muddy Creek.
Study Segment
Winter
Survival
Oct 1 – Mar 31
Early Spring
Connectivity
Apr 1 – May 14*
Spring
Spawning
May 15 – Jun 30*
Summer
Production
Jul 1 – Sep 30
Little Muddy Creek 0.7 0.7 2.0 1.0
* - Channel maintenance flow recommendations for the spring runoff period are presented in Appendix B

Grizzly WHMA Streams, 2011 43
.
FIGURE 21. Recommended instream flows in Little Muddy Creek relative to high,
average, and low flow years for times of year when gage data are available (April through
September).
McKinney Creek
Study Site Location and Description The stream segment proposed for an instream flow
water right filing extends from the downstream boundary the Grizzly WHMA in Range 89 W,
Township 18 N, Section 3 (UTM Zone 13; 299,232.1 E; 4,594,550 N) upstream approximately
1.86 miles to UTM Zone 13; 301,885.5 E; 4,595,089.1 N (Figure 22, Figure 1).
The fish community in this section of the stream is composed solely of non-native brook
trout, mountain suckers, and speckled dace, however the stream is within historic CRC range and
long-term plans call for ultimately restoring the stream to CRC. As a consequence, flow
quantification methods focused on quantifying seasonal flow regime needs for CRC with the
implicit assumption that an adequate flow regime for that species would provide an acceptable
amount of aquatic habitat for other aquatic organisms within the segment. Instream flow
recommendations were developed to maintain or improve habitat for spawning and adult life
stages of fish at all times of year. Securing instream flow water rights on this stream segment
will help ensure the future of CRC by protecting existing base flow conditions in priority against
potential but presently unidentified future consumptive and diversionary demands.
The instream flow segment is located entirely on public land. There is a small amount of
private property upstream from the segment but no water rights are associated with those lands
per a check of the State Engineer’s records. Though there is a small amount of privately owned
land downstream from the segment, non-consumptive instream rights that may result from this
0
10
20
30
40
50
60
1-A
pr
1-M
ay
31
-May
30
-Ju
n
30
-Ju
l
29
-Au
g
28
-Sep
Flo
w (
cfs)
High Average Low Recommended flow

Grizzly WHMA Streams, 2011 44
filing will have no effect on those lands. Interested downstream landowners may voluntarily
contact the WGFD to assess opportunities for establishing state-owned instream flow rights
through their property (separate from this anticipated filing). In such situations, new studies
would be needed to quantify those flow regime needs. The department has no plans to conduct
such studies at the present time.
FIGURE 22. Location of study site where data were collected to evaluate fish habitat at
the potential instream flow segment on McKinney Creek.
Data Collection Data were collected at three different flow events to obtain the needed
range of information (Table 29). The wide range and effective difference in flow levels was
sufficient for effectively calibrating the models used for flow quantification.
Three study sites consisting of two cross sections each were established on spawning
riffles within the target segment to model flow needs for CRC spawning. An additional stand-
alone transect was also placed on another hydraulic control to ensure that suitable data collection
sites were included for analyses. A section of stream 370 feet in length and encompassing the
spawning riffle at the downstream end of the study area was established to collect Habitat
Quality Index (HQI) information. The bankfull width in this reach was approximately 7.5 feet so
the HQI study site length was almost 50 channel widths in length. This is longer than the 10
bank widths recommended by Binns (1982). The complexity of habitat features within the HQI
site is representative of the range of habitat features available in the instream flow segment.
Results from analyzing habitat availability over a range of flows from these study sites were
extrapolated to the entire proposed instream flow segment. Because recommendations are based
on simulated flow conditions, the results and recommendations would not be different during
unusually wet or dry years.

Grizzly WHMA Streams, 2011 45
TABLE 29. Dates and stream flow levels at which field data were collected for
quantifying instream flow needs for CRC on McKinney Creek.
Date Flow (cfs)
6/03/2010 18.5
6/23/2010 6.1
8/26/2010 1.0
Hydrology Based on the Lowham model (1988), QAA in McKinney Creek was 4.7 cfs
(Table 30). This value was inserted into the dimensionless model based on flows in Jack Creek
to generate needed hydrologic statistics. Average monthly flows for the period of record range
from about 1.0 cfs in late summer to over 21 cfs in May (Figure 23). The 1.5 year flood
frequency is about 26 cfs and the 25 year flood event is 103 cfs. The average daily peak flow
was 45 cfs and the average daily minimum flow was 0.5 cfs. Estimates of the 20 percent
exceedance flow by month (Table 31) show the level of flow in each month that is available
approximately 1 year in 5. These flows range from about 1.0 cfs in the fall and winter to about
33 cfs in May.
As with all modeling efforts, some error is inherently unavoidable. For example the error
range for most USGS gages can run as high as 10% or higher. Field measurements of flow can
similarly bear error in estimating flow of 5% per transect. However collection of flow
measurements at multiple cross sections as was done here minimizes that error and we note that
all of the measured flows were within or above the simulated flow levels for each month.
Consequently we determined the estimated flow values were adequate for this study.
TABLE 30. Estimated hydrologic characteristics for the McKinney Creek instream flow
segment.
Flow Parameter Estimated Flow (cfs)
Average daily minimum flow 0.5
Average annual flow (QAA) 4.7
Average daily peak flow 45
1.5-year flood frequency 26
25-year flood frequency 103

Grizzly WHMA Streams, 2011 46
FIGURE 23. Estimated mean monthly flow in McKinney Creek for the period of record.
Flow in October through March is estimated.
TABLE 31. Estimated 20 percent exceedence flows for each month that gage data are
available at the Jack Creek gage. Exceedance flows for winter months were not available. Flow
estimates are in cubic feet per second (cfs).
Month
Jack Creek mean
monthly 20% daily
exceedence
McKinney Creek mean
monthly 20%
exceedence
(QW/QAA)*QAA
January NA 1.2*
February NA 1.2*
March NA 1.2*
April 49 8.4
May 190 33
June 171 29
July 37 6.3
August 12 2.0
September 8.5 1.5
October NA 1.2*
November NA 1.2*
December NA 1.2*
NA - Not Available; * - estimated based on 80% of September flow
Water Quality Temperature data for McKinney Creek were obtained from a
continuously recording thermometer. The recording thermometer was placed in the stream from
July 9 through September 21 so encompassed the warmest time of the summer as specified by
0
5
10
15
20
25
Jan Feb Mar Apr May Jun Jul Aug Sep Oct Nov Dec
Dis
char
ge (
cfs)
Month

Grizzly WHMA Streams, 2011 47
Binns (1982). The maximum temperature recorded was 75F which is a “2” rating in the HQI
model (Table 32). Average daily temperatures and average daily maximum temperatures were
within a range preferred by trout.
TABLE 32. Summary of stream temperature data (Fahrenheit) in McKinney Creek in
2010.
Period
Average
Temperature
Maximum
Temperature
Average
Maximum
Temperature
July 8-15 59.4 69.4 67.4
July 16-31 62.5 75.3 70.9
Aug. 1-15 60.5 73.9 68.7
Aug. 16-31 56.8 68.6 64.8
Sept. 1-15 51.4 62.6 59.5
Sept 16-21 50.3 59.7 58.3
A single water sample for analysis of nitrate concentration was obtained on August 2,
2010. Results of the analysis revealed that nitrates were undetectable in the sample, which was a
“0” in the HQI. This is not an unusual finding for many headwater streams. Because of the
important role of nitrates in the HQI model and fact that a “0” cancels out the ability to evaluate
how other important attributes in the model affect trout production, a value of “1” was assigned
and applied to all test flows studied.
Connectivity – Habitat Retention Average depth, average velocity and wetted perimeter
for the three hydraulic controls in the study area are listed in Tables 33-35. Two of three
hydraulic criteria were met at a flow of 1.1 cfs on all hydraulic control transects #1, #3, and #5.
This flow is slightly less than the estimated 20% exceedence flow in late summer of about 2.0 cfs
(Table 31). This flow level is needed to maintain base habitat conditions and longitudinal
hydrologic connectivity within the designated instream flow segment. This flow or natural flows
up to this level are needed at all times of year except when other methods indicate a higher flow
is need for other fishery management purposes. A flow approximating the level obtained from
this method was measured on August 26 (Figure 24).
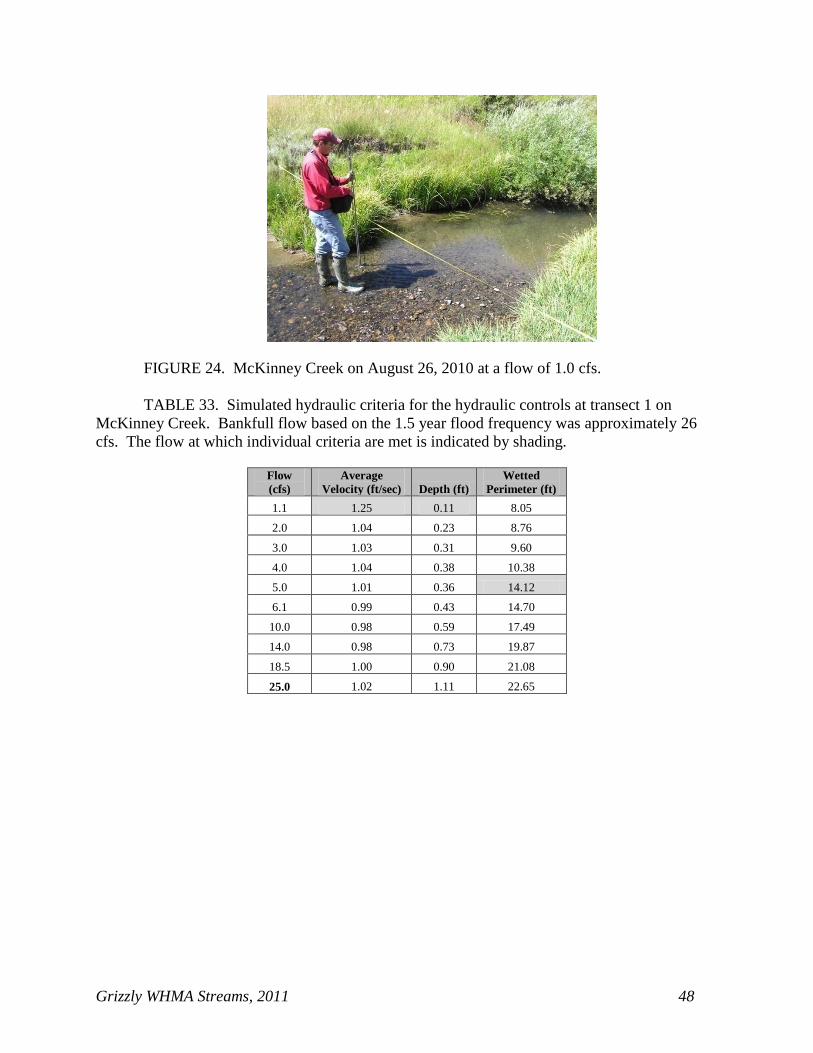
Grizzly WHMA Streams, 2011 48
FIGURE 24. McKinney Creek on August 26, 2010 at a flow of 1.0 cfs.
TABLE 33. Simulated hydraulic criteria for the hydraulic controls at transect 1 on
McKinney Creek. Bankfull flow based on the 1.5 year flood frequency was approximately 26
cfs. The flow at which individual criteria are met is indicated by shading.
Flow
(cfs)
Average
Velocity (ft/sec) Depth (ft)
Wetted
Perimeter (ft)
1.1 1.25 0.11 8.05
2.0 1.04 0.23 8.76
3.0 1.03 0.31 9.60
4.0 1.04 0.38 10.38
5.0 1.01 0.36 14.12
6.1 0.99 0.43 14.70
10.0 0.98 0.59 17.49
14.0 0.98 0.73 19.87
18.5 1.00 0.90 21.08
25.0 1.02 1.11 22.65

Grizzly WHMA Streams, 2011 49
TABLE 34. Simulated hydraulic criteria for the hydraulic controls at transect 3 on
McKinney Creek. Bankfull flow based on the 1.5 year flood frequency was approximately 26
cfs. The flow at which individual criteria are met is indicated by shading.
Flow
(cfs)
Average
Velocity ft/sec Depth (ft)
Wetted
Perimeter (ft)
1.1 1.11 0.13 7.6
2.0 1.13 0.22 8.1
3.0 1.20 0.30 8.4
4.0 1.25 0.37 8.9
5.0 1.29 0.44 9.1
6.1 1.35 0.51 9.4
10.0 1.48 0.72 10.0
14.0 1.60 0.90 10.6
18.5 1.70 1.09 11.1
25.0 1.82 1.32 11.8
TABLE 35. Simulated hydraulic criteria for the hydraulic controls at transect 5 on
McKinney Creek. Bankfull flow based on the 1.5 year flood frequency was approximately 26
cfs. The flow at which individual criteria are met is indicated by shading.
Flow
(cfs)
Average
Velocity
(ft/sec)
Depth
(ft)
Wetted
Perimeter
(ft)
1.1 1.84 0.14 4.29
2.0 2.02 0.18 5.65
3.0 2.05 0.23 6.75
4.0 2.11 0.29 6.96
5.0 2.18 0.35 7.09
6.1 2.26 0.41 7.22
10.0 2.54 0.59 7.62
14.0 2.79 0.74 7.97
18.5 3.02 0.85 8.55
25.0 3.27 1.00 9.20
Biology – PHABSIM The combined data for spawning physical habitat showed that
weighted usable area (WUA) was maximized at a flow of 8.0 cfs (Figure 25). All three of the
sites where data were collected revealed generally similar preferred flows although WUA was
maximized at 19 cfs at the spawning area described by transects 5 and 6. As a consequence, the
recommended flow will be appropriate for the majority of riffles within the instream flow
segment for CRC spawning.

Grizzly WHMA Streams, 2011 50
FIGURE 25. Percent of maximum weighted usable area (WUA) available for CRC
spawning over a range of flows at three study sites in McKinney Creek.
Biology – Habitat Quality Index The HQI model data (Figure 26) was important in
evaluating late summer habitat production potential for this instream flow segment. The 20%
exceedence flow value for August (2.0 cfs; Table 31) was used as an estimate of existing habitat
conditions in late summer on a long-term basis. At this flow, the stream provides 27 habitat
units. The lowest flow that would provide that amount of habitat is 1.5 cfs. Decreasing
discharge to 0.5 cfs would decrease the number of Habitat Units by at least 20%. Because
stream temperature is associated with flow, this reduction would likely be greater if late summer
maximum temperature increased as little as 1 or 2 degrees Fahrenheit. Therefore, the lowest
instream flow level needed to maintain adult CRC habitat during the late summer months is 1.5
cfs.
0
20
40
60
80
100
0 10 20 30 40 50
Pe
rce
nt
Max
imu
m W
UA
Flow (cfs)
Transects 1 & 2 Transects 3 & 4 Transects 5 & 6 Combined

Grizzly WHMA Streams, 2011 51
FIGURE 26. Habitat Quality Index vs. discharge in the McKinney Creek instream flow
segment. The recommended flow (1.0 cfs) is indicated by the light shaded bar.
Geomorphology Channel maintenance flow analyses and results are contained in
Appendix B. This flow regime allows natural stream channel processes to occur and maintain
existing quantity and quality of in-channel habitat as well as a healthy riparian assemblage of
plants and animals (Stromberg and Patten 1990, Rood et al. 1995, Mahoney and Rood 1998).
These flow regimes are consistent with scientifically accepted principles of fisheries
management (Annear et al. 2004). The instream flow recommendations drawn from other
methods used in this study to maintain short-term habitat for CRC in Muddy Creek were based
on the premise that geomorphic characteristics and processes of the stream will not change over
time. This is a valid assumption under existing conditions since no major diversions or flow
altering activities presently occur upstream from or within the instream flow segment. Should
development occur that changes the free-flowing nature of the existing hydrograph, especially by
removing peak flows, this assumption would no longer be valid. In such a situation, if the
stream habitat changed, the flow recommendations provided here would likely not maintain the
existing fishery.
Instream Flow Recommendations
Flow needs during four seasonal time periods were identified to maintain the existing
fishery (Table 36). These distinct seasons and habitat functions include winter CRC survival
(October 1 – February 28), maintenance of longitudinal habitat connectivity in anticipation of
CRC spawning in early spring (March 1 – April 30), early summer CRC spawning (May 1 –
June 30), and maintenance of trout production potential in mid to late summer months (July 1 –
September 30).
Winter flow recommendations were based primarily on Habitat Retention results and are
equal to natural flow up to 1.1 cfs. This flow will maintain over-winter survival of all life stages
of CRC at existing levels. Though data were lacking to estimate monthly 20% flow exceedance
levels, it appears the recommended winter flow based on the Habitat Retention method is equal
0.0
10.0
20.0
30.0
40.0
50.0
60.0
0.5 1 1.5 2 2.5 3 3.5 4 4.5 5 5.5 6 6.5 7 7.5 8 8.5 9 9.5 10
Hab
itat
Un
its
Discharge (cfs)

Grizzly WHMA Streams, 2011 52
to or slightly higher than what that level would be if data were available to calculate exceedance
flow levels.
Early spring recommendations were based on the Habitat Retention method as well (1.1
cfs). This flow is needed to maintain longitudinal connectivity between habitats and ensure that
CRC can reach important spawning areas before the spawning season begins.
Recommendations for the early summer spawning period were based on the average peak
CRC spawning habitat suitability at three study sites using the PHABSIM model (8.0 cfs). Data
from each of the study sites in the analysis were normalized to a percent reduction from the
maximum available at each site. The available WUA calculations at each flow were combined to
form a single curve that reflected the relationship between flow and WUA throughout the
proposed instream flow segment. This recommended flow level is considerably lower than the
estimated 20% exceedance flow levels for the months to which this recommendation applies
(Table 31).
Summer flow recommendations were based on habitat requirements from the HQI model
to maintain adult and juvenile CRC production (1.5 cfs). This flow recommendation is slightly
higher than the Habitat Retention method so per flow recommendation development protocol,
the summer flow recommendation is 1.5 cfs. Figure 27 shows how the recommended flow
regime compares to estimated natural flow regimes during high, average, and dry periods.
Channel maintenance flows perform their function during runoff in April, May, June, and
July (Appendix B) but are not included in the instream flow water right application as explained
in the Introduction.
TABLE 36. Flow recommendations (cfs) for the proposed instream flow segment in
McKinney Creek.
Study Segment
Winter
Survival
Oct 1 – Mar 31
Early Spring
Connectivity
Apr 1 – May 14*
Spring
Spawning
May 15 – Jun 30*
Summer
Production
Jul 1 – Sep 30
McKinney Creek 1.1 1.1 8 1.5
* - Channel maintenance flow recommendations for the spring runoff period are presented in Appendix B.

Grizzly WHMA Streams, 2011 53
FIGURE 27. Recommended instream flows in McKinney Creek relative to high, average
and low flow years for times of year when gage data are available (April through September).
0
20
40
60
80
100
1-A
pr
1-M
ay
31
-May
30
-Ju
n
30
-Ju
l
29
-Au
g
28
-Sep
Flo
w (
cfs)
High Average Low Recommended flow

Grizzly WHMA Streams, 2011 54
Literature Cited
Andrews, E. D. 1984. Bed-material entrainment and hydraulic geometry of gravel-bed rivers in
Colorado. Geological Society of America Bulletin, 95:371–378.
Annear, T. C., and A. L. Conder. 1984. Relative bias of several fisheries instream flow
methods. North American Journal of Fisheries Management 4:531–539.
Annear, T., I. Chisholm, H. Beecher, A. Locke, and 12 other authors. 2004. Instream Flows for
Riverine Resource Stewardship. Revised edition. Instream Flow Council, Cheyenne,
Wyoming.
Annear, T., and P. Dey. 2006. Water management unit 5-year plan: 2006–2010. Administrative
Report. Wyoming Game and Fish Department, Fish Division, Cheyenne.
Binns, N. A. 1982. Habitat Quality Index Procedures Manual. Wyoming Game and Fish
Department, Cheyenne.
Binns, N. A. and F. Eiserman. 1979. Quantification of fluvial trout habitat in Wyoming.
Transactions of the American Fisheries Society 108:215–228.
Bohn, C. C., and J. G. King. 2001. Stream channel responses to streamflow diversion on small
streams in Idaho. Stream Notes. Stream Systems Technology Center, U.S. Forest
Service, Fort Collins, Colorado. pp 6–7.
Bovee, K., and R. Milhous. 1978. Hydraulic simulation in instream flow studies: theory and
technique. Instream Flow Information Paper 5, FWS/OBS-78/33, Cooperative Instream
Flow Service Group, U.S. Fish and Wildlife Service. Fort Collins, Colorado.
Bovee, K. D, B. L. Lamb, J. M. Bartholow, C. B. Stalnaker, J. Taylor, and J. Henriksen. 1998.
Stream habitat analysis using the instream flow incremental methodology. U.S.
Geological Survey, Biological Resources Division Information and Technology Report
USGS/BRD-1998-0004. viii + 131 pp.
Carling, P. 1995. Implications of sediment transport for instream flow modeling of aquatic
habitat. In D. Harper and A. Ferguson, editors. The Ecological Basis for River
Management. John Wiley & Sons, Chichester, England. pp17–32.
CRCT Coordination Team. 2006. Conservation strategy for Colorado River cutthroat trout
(Oncorhynchus clarkii pleuriticus) in the States of Colorado, Utah, and Wyoming.
Colorado Division of Wildlife, Fort Collins. 24p.
Conder, A. L., and T. C. Annear. 1987. Test of weighted usable area estimates derived from a
PHABSIM model for instream flow studies on trout streams. North American Journal of
Fisheries Management 7:339–350.

Grizzly WHMA Streams, 2011 55
Emmett, W. W. 1975. The channels and waters of the upper Salmon River area, Idaho. U.S.
Geological Survey, Professional Paper 870-A. 116 pp.
Gordon, N. 1995. Summary of technical testimony in the Colorado Water Division 1 Trial.
USDA Forest Service, General Technical Report RM-GTR-270. 140 pp.
Heede, B. H. 1992. Stream dynamics: An overview for land managers. Fort Collins: U.S.
Forest Service, Rocky Mountain Forest and Range Experiment Station (General
Technical Report RM-72).
Hirsch, C. L., T. P. Nesler, and S. Q. Albeke. 2005. Range-wide status of Colorado River cutthroat
trout. (Oncorhynchus clarkii pleuriticus) Colorado River cutthroat trout Conservation
Coordination Team Report. Craig, Colorado.
Hill, M. T., W. S. Platts, and R. L. Beschta. 1991. Ecological and geo-morphological concepts
for instream and out-of-channel flow requirements. Rivers, 2(3): 198–210.
Hubert, W. A. C. A. Pru, T. A. Wesche, and T. Bray. 1997. Evaluation of flow duration
analysis to establish winter instream flow standards for Wyoming trout streams. Final
Report WWRC-97-03. Wyoming Water Resources Center, Laramie.
Jespersen, D. M. 1981. A study of the effects of water diversion on the Colorado River
cutthroat trout (Salmo clarki pleuriticus) in the drainage of the North Fork of the Little
Snake River in Wyoming. Master's thesis, University of Wyoming, Laramie.
Komura, S., and D. B. Simmons. 1967. River bed degradation below dams. American Society of
Civil Engineers Journal of the Hydraulics Division 93:1-14.
Kuhnle, R. A., A. Simon, and R. L. Bingner. 1999. Dominant discharge of the incised channels
of Goodwin Creek. Published in the Proceedings 1999 Water Resources Conference,
American Society of Civil Engineers. Seattle, Washington.
Lageson, D. R., and D. R. Spearing. 1996. Roadside Geology of Wyoming. Mountain Press
Publishing Company, Missoula, Montana. 271 pp.
Leopold, L. B., M. G. Wolman, and J. P. Miller. 1964. Fluvial Processes in Geomorphology.
San Francisco: W. H. Freeman.
Leopold, L. B. 1994. A View of the River. Harvard University Press, Cambridge,
Massachusetts, 298 p.
Lindstrom, J. W., and W. A. Hubert. 2004. Ice processes affect habitat use and movements of
adult cutthroat trout and brook trout in a Wyoming foothills stream. North American
Journal of Fisheries Management 24:1341–1352.
Locke, A., C. Stalnaker, S. Zellmer, K. Williams, H. Beecher, T. Richards, C. Robertson, A.
Wald, A. Paul, and T. Annear. 2008. Integrated approaches to riverine resource

Grizzly WHMA Streams, 2011 56
management: Case studies, science, law, people, and policy. Instream Flow Council,
Cheyenne, Wyoming. 430 pp.
Lowham, H. W. 1988. Streamflows in Wyoming. Water-Resources Investigations Report 88-
4045, U.S. Geological Survey, Cheyenne, Wyoming.
Mahoney, J. M., and S. B. Rood. 1998. Streamflow requirements for cottonwood seedling
recruitment: An integrative model. Wetlands 18(4): 634–645.
Milhous, R. T., D. L. Wegner, and T. Waddle. 1984. User's guide to the physical habitat
simulation system. Instream Flow Paper 11, FWS/OBS-81/43, U.S. Fish and Wildlife
Service, Fort Collins, Colorado.
Milhous, R. T., M. A. Updike, and D. M. Schneider. 1989. Physical habitat simulation system
reference manual - version II. Instream Flow Information Paper No. 26. U.S. Fish and
Wildlife Service, Biol. Rep. 89(16).
Miselis, D. V., T. A. Wesche and H. W. Lowham. 1999. Development of hydrologic models for
estimating streamflow characteristics of Wyoming’s mountainous basins. Wyoming
Water Resource Center Report, University of Wyoming, Laramie.
Nehring, R. 1979. Evaluation of instream flow methods and determination of water quantity
needs for streams in the state of Colorado. Colorado Division of Wildlife, Fort Collins.
Nilsson, C., G. Grelsson, M. Johansson, and U. Sperens. 1989. Patterns of plant species
richness along riverbanks. Ecology 70:77-84.
Ponce, V. M. 2009. Online flood frequency by the Log Pearson III method.
http://ponce.sdsu.edu/onlinepearson.php San Diego State University, San Diego, CA.
Richter, B. D., J. V. Baumgartner, J. Powell, and D. P. Braun. 1996. A method for assessing
hydrologic alteration within ecosystems. Conservation Biology 10:1163–1174.
Robertson and Dey. 2008. Instream flow studies on the East Fork Wind River. Administrative
Report. Wyoming Game and Fish Department, Fish Division, Cheyenne.
Rood, S. B., J. M. Mahoney, D. E. Reid, and L. Zilm. 1995. Instream flows and the decline of
riparian cottonwoods along the St. Mary River, Alberta. Canadian Journal of Botany
73:1250–1260.
Rosgen, D. 1996. Applied river morphology. Wildland Hydrology, Pagosa Springs, Colorado.
Ryan, S. E. 1996. Bedload transport patterns in coarse-grained channels under varying
conditions of flow. In Proceedings of the 6th
Inter-agency sedimentation conference, Las
Vegas, Nevada, March 10–14. p VI-22 to VI-27b.

Grizzly WHMA Streams, 2011 57
Schmidt, L. D., and J. P. Potyondy. 2004. Quantifying channel maintenance instream flows: an
approach for gravel-bed streams in the Western United States. United States Department
of Agriculture, Forest Service, Rocky Mountain Research Station. General Technical
Report RMRS-GTR-128.
Schumm, S. A. 1969. River metamorphosis. American Society of Civil Engineers, Journal of
Hydraulics Division, HY1:255-273.
Stromberg, J. C., and D. C. Patten. 1990. Riparian vegetation instream flow requirements: A
case study from a diverted stream in the eastern Sierra Nevada, California, USA.
Environmental Management 14(2): 185–194.
Trush B., and S. McBain. 2000. Alluvial river ecosystem attributes. Stream Notes. January
2000. Stream systems technology Center, USDA Forest Service. pp 1–3.
Ward, J. V. 1989. The four-dimensional nature of lotic ecosystems. Journal of the North
American Benthological Society 8(1):2-8.
Western Regional Climate Center. Available: www.wrcc.dri.edu. (October 2009).
Wolman M. G., and J. P. Miller. 1960. Magnitude and frequency of forces in geomorphic
processes. Journal of Geology 68:54–74.
WGFD (Wyoming Game and Fish Department). 2005b. A Comprehensive Wildlife
Conservation Strategy for Wyoming. Administrative Report. Wyoming Game and Fish
Department, Fish Division, Cheyenne.
Wyoming Game and Fish Department. 2010. State Wildlife Action Plan. Wyoming Game and
Fish Department, Cheyenne, Wyoming. Available online:
http://gf.state.wy.us/SWAP2010/Plan/index.asp.
WGFD (Wyoming Game and Fish Department). 2011. Strategic Habitat Plan. Administrative
Report. Wyoming Game and Fish Department, Fish Division, Cheyenne.

Grizzly WHMA Streams, 2011 58
Appendix A. Instream Flows in Wyoming
Guiding Principles for Instream Flow Recommendations
The analyses and interpretation of data collected for this report included consideration of
the important components of an aquatic ecosystem and their relationship to stream flow. Stream
ecosystems are complex, and maintaining this complexity requires an appropriate flow regime.
This report describes recommendations for instream flows that were developed using an
ecosystem approach that is consistent with contemporary understanding of stream complexity
and effective resource management. The recommendations of the Instream Flow Council (IFC),
an organization of state and provincial fishery and wildlife management agencies, provide
comprehensive guidance on conducting instream flow studies. The approach described by the
IFC includes consideration of three policy components (legal, institutional, and public
involvement) and five riverine components (hydrology, geomorphology, biology, water quality
and connectivity; Annear et al. 2004). Sections of this report were selected to reflect appropriate
components of that template as closely as possible. By using the eight components described by
the IFC as a guide, we strive to develop instream flow recommendations that work within
Wyoming’s legal and institutional environment to maintain or improve important aquatic
resources for public benefit while also employing a generally recognized flow quantification
protocol.
Legal and Institutional Background
The Wyoming Game and Fish Department (WGFD) manages fish and wildlife resources
under Title 23 of Wyoming statutes (W.S.). The WGFD was created and placed under the
direction and supervision of the Wyoming Game and Fish Commission (Commission) in W.S.
23-1-401 and the responsibilities of the Commission and the WGFD are defined in W.S. 23-1-
103. In these and associated statutes, the WGFD is charged with providing “. . . an adequate and
flexible system for the control, propagation, management, protection and regulation of all
Wyoming wildlife.” The WGFD mission statement is: “Conserving Wildlife - Serving People”,
while the WGFD Fish Division mission statement details a stewardship role toward aquatic
resources and the people who enjoy them. In a 2005 policy statement, the Commission formally
assigned certain responsibilities for implementing instream flow water rights to the WGFD and
specified procedures for notifying the Commission of instream flow filing activities. Briefly, the
Department is directed to notify a Commission member when a stream in his or her district is
identified as a candidate for filing. If that Commission member has concern about the proposed
recommendation, it will be brought to the full Commission in open session. In addition, the
Department will advise all Commission members at least two weeks prior to submitting
materials for each instream flow filing recommendation, as well as notice of any changes in the
Instream Flow Program.
The instream flow law, W.S. 41-3-1001-1014, was passed in 1986 and establishes that
“unappropriated water flowing in any stream or drainage in Wyoming may be appropriated for
instream flows to maintain or improve existing fisheries and declared a beneficial use...” The
statute directs that the Commission is responsible for determining stream flows that will
“maintain or improve” important fisheries. The WGFD fulfills this function under the general
policy oversight of the Commission. Applications for instream flow water rights are signed and
held by the Wyoming Water Development Office on behalf of the state should the water right be

Grizzly WHMA Streams, 2011 59
approved by the State Engineer. The priority date for the instream flow water right is the day the
application is received by the State Engineer.
One of the critical terms associated with the present instream flow statute relates to the
concept of a “fishery.” From a natural resource perspective, a fishery includes the habitat and
associated natural processes that are required to support fish populations. The primary
components that comprise needed physical habitat include, but are not limited to, the stream
channel, riparian zone and floodplain as well as the processes of sediment flux and riparian
vegetation development that sustain those habitats (Annear et al. 2004). To maintain the existing
dynamic character of an entire fishery, instream flow regimes must maintain the stream channel
and its functional linkages to the riparian corridor and floodplain to perpetuate habitat structure
and ecological function. The State Engineer has concluded that a full range of channel
maintenance flow regimes is not consistent with the legislative intent of the instream flow
statute. Therefore, until the interpretation of state water law changes, channel maintenance flow
recommendations are not included on instream flow applications. Channel maintenance flow
requirements are presented in Appendix B of this report and may be useful should opportunities
arise in the future to secure a broader, more appropriate range of instream flow water rights for
this important fishery management purpose.
Through March 2011, the WGFD has forwarded 110 instream flow water right
applications to the WWDC for submission. Of these, the State Engineer has permitted 83 and
the Board of Control has adjudicated five.
Public Participation
The general public has several opportunities to be involved in the process of identifying
instream flow segments or commenting on instream flow applications. Individuals or groups can
inform WGFD of their interest in protecting the fisheries in specific streams or stream segments
with instream flow filings. In addition, planning and selection of future instream flow study sites
are detailed in the Water Management Unit’s annual work schedules and five-year plans, which
are available for public review and comment (either upon request or by visiting the WGFD web
site at http://gf.state.wy.us/downloads/pdf/Fish/5yearplan2006.pdf). The public is also able to
comment on instream flow water rights that have been filed with the State Engineer through
public hearings (required by statute) that are conducted by the State Engineer’s Office for each
proposed instream flow water right. The State Engineer uses these public hearings to gather
information for consideration before issuing a decision on the instream flow water right
application. To help the public better understand the details of instream flow filings and the
public hearing process, WGFD personnel typically conduct an informal information meeting a
week or two prior to each public hearing. Additional presentations to community or special
interest groups at other times of year also provide opportunity for discussion and learning more
about instream flow issues and processes.

Grizzly WHMA Streams, 2011 60
Appendix B. Channel Maintenance Flows
Background
The term “channel maintenance flows” refers to flows that maintain existing channel
morphology, riparian vegetation and floodplain function (US Forest Service 1997, Schmidt and
Potyondy 2004). The basis and approach used below for defining channel maintenance flows
applies to snowmelt-dominated gravel and cobble-bed (alluvial) streams. By definition, these are
streams whose beds are dominated by loose material with median sizes larger than 0.08 in. and
with a pavement or armor layer of coarser materials overlaying the channel bed. In these
streams, bedload transport processes determine the size and shape of the channel and the
character of habitat for aquatic organisms (Andrews 1984, Hill et al. 1991, Leopold 1994).
A flow regime that provides channel maintenance results in stream channels that are in
approximate sediment equilibrium, where sediment export equals sediment import on average
over a period of years (Leopold 1994, Carling 1995, Schmidt and Potyondy 2004). Thus, stream
channel characteristics over space and time are a function of sediment input and flow (US Forest
Service 1997). When sediment-moving flows are removed or reduced over a period of years,
some gravel-bed channels respond with reductions in width and depth, rate of lateral migration,
stream-bed elevation, stream side vegetation, water-carrying capacity, and changes in bed
material composition.
Maintenance of channel features and floodplain function cannot be obtained by a single
threshold flow (Kuhnle et al. 1999). Rather, a dynamic hydrograph within and between years is
needed (Gordon 1995, Trush and McBain 2000, Schmidt and Potyondy 2004). High flows are
needed in some years to scour the stream channel, prevent encroachment of stream banks, and
deposit sediments to maintain a dynamic alternate bar morphology and a riparian community
with diverse successional states. Low flow years are as valuable as high flow years on some
streams to allow establishment of riparian seedlings on bars deposited in immediately preceding
wet years (Trush and McBain 2000). The natural interaction of high and low flow years
maintains riparian development and aquatic habitat by preventing annual scour that might occur
from continuous high flow (allowing some riparian development) while at the same time
preventing encroachment by riparian vegetation that could occur if flows were artificially
reduced at all times.
Channel maintenance flows must be sufficient to move the entire volume and all sizes of
material supplied to the channel from the watershed over a long-term period (Carling 1995,
Schmidt and Potyondy 2004). A range of flows, under the dynamic hydrograph paradigm,
provides this function. Infrequent high flows move large bed elements while the majority of the
total volume of material is moved by more frequent but lower flows (Wolman and Miller 1960,
Leopold 1994). In streams with a wide range of sediment sizes on the channel boundary, a range
of flows may best represent the dominant discharge because different flow velocities are needed
to mobilize different sizes of bed load and sediment. Kuhnle et al. (1999) noted “A system
designed with one steady flow to transport the supplied mass of sediment would in all likelihood
become unstable as the channel aggraded and could no longer convey the sediment and water
supplied to it. A system designed with one steady flow to transport the supplied sediment size
distribution would in all likelihood become unstable as the bed degraded and caused instability
of the banks.”

Grizzly WHMA Streams, 2011 61
Bedload Transport
A bedload transport model (FIGURE A-1) shows the total amount of bedload sediment
transported over time (during which a full range of stream discharge [Q] values occur). Smaller
discharges, such as the substrate mobilization flow (Qm) occur more frequently, but not much
sediment is moved during those times. The effective discharge (Qe) mobilizes the greatest
volume of sediment and also begins to transport some of the larger sediment particles (gravels
and small cobbles). The bankfull discharge (Qbf), in which flow begins to inundate the
floodplain and which has a return interval of approximately 1.5 years on average, typically
occurs near the Qe. The discharge corresponding to the 25-year return interval (Q25) represents
the upper limit of the required channel maintenance flow regime, since the full range of mobile
sediment materials move at flows up to this value, but these higher flows are infrequent. The
more frequent discharges that occur between the Qm and the Qe move primarily smaller-sized
particles (sand and small gravel) and prevent filling in of pools and other reduction in habitat
complexity. Since these particles are deposited into the stream from the surrounding watershed
with greater frequency, it is important to maintain a flow regime that provides sufficient
conveyance properties (high frequency of moderate discharges) to move these particles through
the system. However, alluvial streams, particularly those at higher elevations, also receive
significant contributions of larger-sized particles from the surrounding watershed and restrictions
to the flow regime that prevent or reduce the occurrence flows greater than Qe (which are critical
for moving these coarser materials) would result in gradual bedload accumulation of these larger
particles. The net effect would be an alteration of existing channel forming processes and habitat
(Bohn and King 2001). For this reason, flows up to the Q25 flow are required to maintain
existing channel form and critical habitat features for local fish populations.
FIGURE A-1. Total bedload transport as a function of bedload transport rate and flow
frequency (adapted from Schmidt and Potyondy 2004).
Qm Discharge
Bedload transport
rate (tons/day)
Q25
Qe
Flow
frequency
(days)
Total bedload
transport
(tons)

Grizzly WHMA Streams, 2011 62
Channel Maintenance Flows Model
The model used to recommend flows to maintain the form and function of the stream
channel is derived from bedload transport theory presented above. Based on these principles, the
following channel maintenance flow model was developed by Dr. Luna Leopold and is used in
this report to calculate the appropriate instream flows up to the Q25:
Q Recommendation = Qf + {(Qs – Qf) * [(Qs – Qm) / (Qbf – Qm)]0.1
}
Where: Qs = actual stream flow
Qf = fish flow (required to maintain fish habitat)
Qm= sediment mobilization flow = 0.8 * Qb
Qbf = bankfull flow
The Leopold model calculations could be used to yield a continuous range of instream
flow recommendations at flows between the Qm and Qbf for each cubic foot per second increase
in discharge. However, this manner of flow regulation is complex and could prove burdensome
to water managers. To facilitate flow administration while still ensuring reasonable flows for
channel maintenance, we modified this aspect of the approach to recommend instream flows for
four quartiles between the Qm and Qbf.
Channel maintenance flow recommendations developed with the Leopold model require
that only a portion of the flow remain instream for maintenance efforts. When total discharge is
less than Qm, only fish flows are necessary; discharge between the fish habitat flows
recommended in the main body of this report and Qm is available for other uses (FIGURE A-2).
Similarly, all discharge greater than the Q25 flow is less critical for channel maintenance
purposes and available for other uses (these higher flows do allow a connection to the floodplain
and it is valuable for infrequent inundation of riparian habitat to occur, but not for the physical
maintenance of the stream channel). Between the Qm and Qbf, the model is used to determine
what proportion of flow should remain in channel for maintenance activities. For those
relatively infrequent flows that occur in the range between Qbf and the Q25, all flow is
recommended to remain in the channel for these critical channel maintenance purposes.
Using this “dynamic hydrograph” approach, the volume of water required for channel
maintenance is variable from year to year. During low-flow years, less water is recommended
for channel maintenance because flows may not reach the defined channel maintenance level. In
those years, most water in excess of fish habitat flows is available for other uses. The majority
of flow for channel maintenance occurs during wet years. One benefit of this dynamic
hydrograph approach is that the recommended flow is needed only when it is available in the
channel and does not assert a claim for water that is not there as often happens with a threshold
approach.

Grizzly WHMA Streams, 2011 63
FIGURE A-2. General function of a dynamic hydrograph instream flow for fishery
maintenance. Qm is substrate mobilization flow, Qbf is bankfull flow, and Q25 is the discharge
with a 25-year return interval.
This channel maintenance flow model is the same as the one presented in Gordon (1995)
and the Clark’s Fork instream flow water right (C112.0F) filed by the U.S. Forest Service with
the Wyoming State Engineer, with one exception. The model presented in those documents used
the average annual flow to represent Qm. More recent work by Schmidt and Potyondy (2004)
identified Qm as occurring at a discharge of 0.8 times Qbf. Initial particle transport begins at
flows somewhat greater than average annual flows but lower than Qbf (Schmidt and Potyondy
2004). Ryan (1996) and Emmett (1975) found the flows that generally initiated transport were
between 0.3 and 0.5 of Qbf. Movement of coarser particles begins at flows of about 0.5 to 0.8 of
Qbf (Leopold 1994, Carling 1995). Schmidt and Potyondy (2004) discuss phases of bedload
movement and suggest that a flow trigger of 0.8 of the Qbf “provides a good first approximation
for general application” in defining flows needed to maintain channels.
Muddy Creek
The Leopold model was used to develop channel maintenance recommendations for the
Muddy Creek instream flow segment (Table A-1). The fish flow used in the analysis was the
spawning flow (3.5 cfs). For naturally available flow levels less than the spawning flow, the
channel maintenance instream flow recommendation is equal to natural flow. The spawning
flow level is substantially less than Qm (18 cfs). For the flow range between the spawning flow
and Qm, the channel maintenance flow recommendation is equal to the spawning flow (Table A-
1). Bankful flow (Qbf) was calculated to equal 22.7 cfs and the 25-year high flow (Q25) was 89
0
500
1000
1500
2000
2500
3000
3500
4000
4500
Dis
char
ge (c
fs)
Return Interval (years)
Available Disharge
Instream Flow Recommendation
Q m Q bf Q 25
Available for other uses

Grizzly WHMA Streams, 2011 64
cfs. When naturally available flows range from Qm to Qbf, the Leopold formula is applied and
results in incrementally greater amounts of water applied toward instream flow. At flows
between Qbf, and Q25, all stream flow is retained in the channel to perform maintenance
functions. At flows greater than Q25, only the Q25 is recommended for channel maintenance
(Figure A-1).
TABLE A-1. Channel maintenance instream flow recommendations (May 1–June
30) to maintain existing channel forming processes and long-term aquatic habitat
characteristics in the Muddy Creek instream flow segment.
Flow Description Available
Flow (cfs)
Recommended
Flow (cfs)
<Spawning Flow <3.5 All available flow
Spawning Flow to Qm 3.5-18 3.5
Qm to Qbf – Quartile 1 19 17
Qm to Qbf – Quartile 2 20 19
Qm to Qbf – Quartile 3 21 21
Qm to Qbf – Quartile 4 23 23
Qbf to Q25 23-89 All available flow
> Q25 > 89 89
Figure A-3 shows example annual hydrographs (selected average and wet years) with
channel maintenance flow recommendations implemented. Dry years are not shown because
flows would not exceed the 18 cfs substrate mobilization threshold to initiate channel
maintenance flows. In the selected average year (2005) flow exceeded substrate mobilization
flow on 19 days (not all consecutive), which would trigger channel maintenance flow
recommendations. In the selected wet year (2009) these recommendations would apply for 36
days in May and June. The proportion of water that would be available for consumptive use
would be approximately 43 percent of the annual flow in an average year (1,047 ac-ft) and 19
percent in a wet year (993 ac-ft).

Grizzly WHMA Streams, 2011 65
FIGURE A-3. Channel maintenance flow recommendations and hydrographs for the
Muddy Creek instream flow segment in an average (2005) and a wet (2009) water year.
Implementing these flow recommendations would have to include moderating the abrupt
changes that occur at threshold flows with a ramping scheme that includes more gradual changes
akin to a natural hydrograph. Such sharp flow increases and decreases evident in Figure A-3
would cause habitat loss through excessive scour and potential trout mortality due to stranding.
The Index of Hydrologic Alteration (IHA; Richter et al. 1996) could provide a valuable reference
0
10
20
30
40
50
60
70
80
90
100D
isch
arge
(cfs
)
Day
Average Year (2005)
Recommended Flow
Qm
Q25 = 89 cfs
0
10
20
30
40
50
60
70
80
90
100
Dis
char
ge (c
fs)
Day
Wet Year (2009)
Recommended Flow
Qm
Q25 = 89 cfs
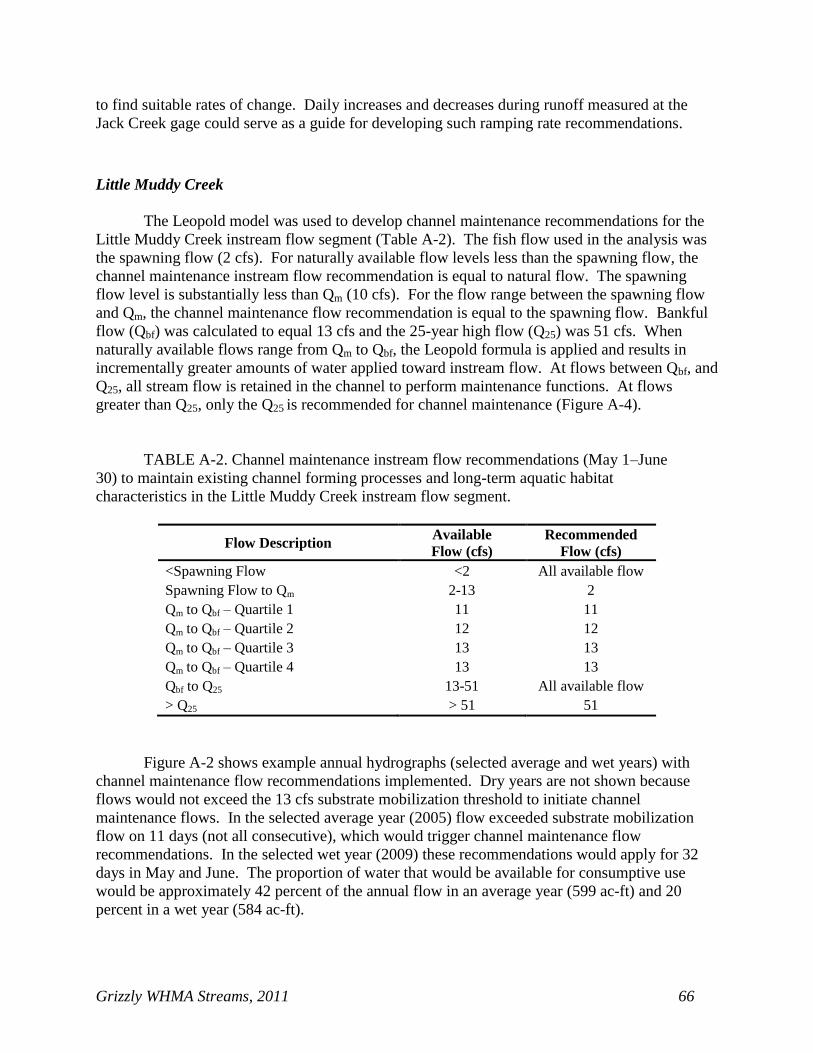
Grizzly WHMA Streams, 2011 66
to find suitable rates of change. Daily increases and decreases during runoff measured at the
Jack Creek gage could serve as a guide for developing such ramping rate recommendations.
Little Muddy Creek
The Leopold model was used to develop channel maintenance recommendations for the
Little Muddy Creek instream flow segment (Table A-2). The fish flow used in the analysis was
the spawning flow (2 cfs). For naturally available flow levels less than the spawning flow, the
channel maintenance instream flow recommendation is equal to natural flow. The spawning
flow level is substantially less than Qm (10 cfs). For the flow range between the spawning flow
and Qm, the channel maintenance flow recommendation is equal to the spawning flow. Bankful
flow (Qbf) was calculated to equal 13 cfs and the 25-year high flow (Q25) was 51 cfs. When
naturally available flows range from Qm to Qbf, the Leopold formula is applied and results in
incrementally greater amounts of water applied toward instream flow. At flows between Qbf, and
Q25, all stream flow is retained in the channel to perform maintenance functions. At flows
greater than Q25, only the Q25 is recommended for channel maintenance (Figure A-4).
TABLE A-2. Channel maintenance instream flow recommendations (May 1–June
30) to maintain existing channel forming processes and long-term aquatic habitat
characteristics in the Little Muddy Creek instream flow segment.
Flow Description Available
Flow (cfs)
Recommended
Flow (cfs)
<Spawning Flow <2 All available flow
Spawning Flow to Qm 2-13 2
Qm to Qbf – Quartile 1 11 11
Qm to Qbf – Quartile 2 12 12
Qm to Qbf – Quartile 3 13 13
Qm to Qbf – Quartile 4 13 13
Qbf to Q25 13-51 All available flow
> Q25 > 51 51
Figure A-2 shows example annual hydrographs (selected average and wet years) with
channel maintenance flow recommendations implemented. Dry years are not shown because
flows would not exceed the 13 cfs substrate mobilization threshold to initiate channel
maintenance flows. In the selected average year (2005) flow exceeded substrate mobilization
flow on 11 days (not all consecutive), which would trigger channel maintenance flow
recommendations. In the selected wet year (2009) these recommendations would apply for 32
days in May and June. The proportion of water that would be available for consumptive use
would be approximately 42 percent of the annual flow in an average year (599 ac-ft) and 20
percent in a wet year (584 ac-ft).

Grizzly WHMA Streams, 2011 67
FIGURE A-4. Channel maintenance flow recommendations and hydrographs for the
Little Muddy Creek instream flow segment in an average (2005) and a wet (2009) water year.
Implementing these flow recommendations would have to include moderating the abrupt
changes that occur at threshold flows with a ramping scheme that includes more gradual changes
akin to a natural hydrograph. Such sharp flow increases and decreases evident in Figure A-4
would cause habitat loss through excessive scour and potential trout mortality due to stranding.
0
10
20
30
40
50
60
70
80
90
100D
isch
arge
(cfs
)
Day
Average Year (2005)
Recommended Flow
Qm
Q25 = 51 cfs
0
10
20
30
40
50
60
70
80
90
100
Dis
char
ge (c
fs)
Day
Wet Year (2009)
Recommended Flow
Qm
Q25 = 51 cfs

Grizzly WHMA Streams, 2011 68
The Index of Hydrologic Alteration (IHA; Richter et al. 1996) could provide a valuable reference
to find suitable rates of change. Daily increases and decreases during runoff measured at the
Jack Creek gage could serve as a guide for developing such ramping rate recommendations.
Littlefield Creek
The Leopold model was used to develop channel maintenance recommendations for the
Littlefield Creek instream flow segment (Table A-3). The fish flow used in the analysis was the
spawning flow (3.5 cfs). For naturally available flow levels less than the spawning flow, the
channel maintenance instream flow recommendation is equal to natural flow. The spawning
flow level is substantially less than Qm (13 cfs). For the flow range between the spawning flow
and Qm, the channel maintenance flow recommendation is equal to the spawning flow. Bankful
flow (Qbf) was calculated to equal 16.4 cfs and the 25-year high flow (Q25) was 64 cfs. When
naturally available flows range from Qm to Qbf, the Leopold formula is applied and results in
incrementally greater amounts of water applied toward instream flow. At flows between Qbf, and
Q25, all stream flow is retained in the channel to perform maintenance functions. At flows
greater than Q25, only the Q25 is recommended for channel maintenance (FIGURE A-5).
TABLE A-3. Channel maintenance instream flow recommendations (May 1–June
30) to maintain existing channel forming processes and long-term aquatic habitat
characteristics in the Littlefield Creek instream flow segment.
Flow Description Available
Flow (cfs)
Recommended
Flow (cfs)
<Spawning Flow <3.5 All available flow
Spawning Flow to Qm 3.5-13 3.5
Qm to Qbf – Quartile 1 14 13
Qm to Qbf – Quartile 2 15 14
Qm to Qbf – Quartile 3 16 15
Qm to Qbf – Quartile 4 16 16
Qbf to Q25 16-64 All available flow
> Q25 > 64 64
Figure A-3 shows example annual hydrographs (selected average and wet years) with
channel maintenance flow recommendations implemented. Dry years are not shown because
flows would not exceed the 13 cfs substrate mobilization threshold to initiate channel
maintenance flows. In the selected average year (2005) flow exceeded substrate mobilization
flow on 18 days (not all consecutive), which would trigger channel maintenance flow
recommendations. In the selected wet year (2009) these recommendations would apply for 47
days in May and June. The proportion of water that would be available for consumptive use
would be approximately 35 percent of the annual flow in an average year (619 ac-ft) and 17
percent in a wet year (626 ac-ft).

Grizzly WHMA Streams, 2011 69
FIGURE A-5. Channel maintenance flow recommendations and hydrographs for the
Littlefield Creek instream flow segment in an average (2005) and a wet (2009) water year.
Implementing these flow recommendations would have to include moderating the abrupt
changes that occur at threshold flows with a ramping scheme that includes more gradual changes
akin to a natural hydrograph. Such sharp flow increases and decreases evident in Figure A-5
0
10
20
30
40
50
60
70
80
90
100
Dis
char
ge (c
fs)
Day
Average Year (2005)
Recommended Flow
Qm
Q25 = 64cfs
0
10
20
30
40
50
60
70
80
90
100
Dis
char
ge (c
fs)
Day
Wet Year (2009)
Recommended Flow
Qm
Q25 = 64cfs

Grizzly WHMA Streams, 2011 70
would cause habitat loss through excessive scour and potential trout mortality due to stranding.
The Index of Hydrologic Alteration (IHA; Richter et al. 1996) could provide a valuable reference
to find suitable rates of change. Daily increases and decreases during runoff measured at the
Jack Creek gage could serve as a guide for developing such ramping rate recommendations.
McKinney Creek
The Leopold model was used to develop channel maintenance recommendations for the
McKinney Creek instream flow segment (Table A-4). The fish flow used in the analysis was the
spawning flow (8 cfs). For naturally available flow levels less than the spawning flow, the
channel maintenance instream flow recommendation is equal to natural flow. The spawning
flow level is substantially less than Qm (21 cfs). For the flow range between the spawning flow
and Qm, the channel maintenance flow recommendation is equal to the spawning flow. Bankful
flow (Qbf) was calculated to equal 26.2 cfs and the 25-year high flow (Q25) was 103 cfs. When
naturally available flows range from Qm to Qbf, the Leopold formula is applied and results in
incrementally greater amounts of water applied toward instream flow. At flows between Qbf, and
Q25, all stream flow is retained in the channel to perform maintenance functions. At flows
greater than Q25, only the Q25 is recommended for channel maintenance (Figure A-1).
TABLE A-4. Channel maintenance instream flow recommendations (May 1–June
30) to maintain existing channel forming processes and long-term aquatic habitat
characteristics in the McKinney Creek instream flow segment.
Flow Description Available
Flow (cfs)
Recommended
Flow (cfs)
<Spawning Flow <8 All available flow
Spawning Flow to Qm 8-21 8
Qm to Qbf – Quartile 1 22 20
Qm to Qbf – Quartile 2 23-24 22
Qm to Qbf – Quartile 3 25 24
Qm to Qbf – Quartile 4 26 26
Qbf to Q25 26-103 All available flow
> Q25 > 103 103
Figure A-6 shows example annual hydrographs (selected average and wet years) with
channel maintenance flow recommendations implemented. Dry years are not shown because
flows would not exceed the 21 cfs substrate mobilization threshold to initiate channel
maintenance flows. In the selected average year (2005) flow exceeded substrate mobilization
flow on 21 days (not all consecutive), which would trigger channel maintenance flow
recommendations. In the selected wet year (2009) these recommendations would apply for 47
days in May and June. The proportion of water that would be available for consumptive use
would be approximately 25 percent of the annual flow in an average year (711 ac-ft) and 12
percent in a wet year (744 ac-ft).

Grizzly WHMA Streams, 2011 71
FIGURE A-6. Channel maintenance flow recommendations and hydrographs for the
McKinney Creek instream flow segment in an average (2005) and a wet (2009) water year.
0
10
20
30
40
50
60
70
80
90
100
Dis
char
ge (c
fs)
Day
Average Year (2005)
Recommended Flow
Qm
Q25 = 103 cfs
0
10
20
30
40
50
60
70
80
90
100
Dis
char
ge (c
fs)
Day
Wet Year (2009)
Recommended Flow
Qm
Q25 = 103 cfs

Grizzly WHMA Streams, 2011 72
Implementing these flow recommendations would have to include moderating the abrupt
changes that occur at threshold flows with a ramping scheme that includes more gradual changes
akin to a natural hydrograph. Such sharp flow increases and decreases evident in FIGURE A-6
would cause habitat loss through excessive scour and potential trout mortality due to stranding.
The Index of Hydrologic Alteration (IHA; Richter et al. 1996) could provide a valuable reference
to find suitable rates of change. Daily increases and decreases during runoff measured at the
Jack Creek gage could serve as a guide for developing such ramping rate recommendations.