institute of physics publishing …nano.iphy.ac.cn/n04/papers/no4_papers all pdf/hj_gao.0511.pdf ·...
TRANSCRIPT

INSTITUTE OF PHYSICS PUBLISHING NANOTECHNOLOGY
Nanotechnology 16 (2005) 267–272 doi:10.1088/0957-4484/16/2/015
Morphologies and microstructures ofnano-sized Cu2O particles using acetyltrimethylammonium templateHuairuo Zhang, Chengmin Shen, Shutang Chen, Zhichuan Xu,Fusheng Liu, Jianqi Li and Hongjun Gao1
Beijing National Laboratory for Condensed Matter Physics, Institute of Physics,Chinese Academy of Sciences, Beijing 100080, People’s Republic of China
E-mail: [email protected]
Received 5 November 2004, in final form 20 December 2004Published 13 January 2005Online at stacks.iop.org/Nano/16/267
AbstractHollow polyhedra and cubes of nanostructured Cu2O particles have beensynthesized by reduction of CuSO4 with ascorbate acid in the solutionphase. The nanostructures were obtained when thecetyltrimethylammonium (CTAB) concentration ranged from 0 to 0.03 M inthe presence of NaOH. Structural characterizations, by means of x-rayphotoelectron spectroscopy (XPS) for measuring Cu valence states and byelectron microscopy for microstructure and chemical analyses, suggest thatmost Cu2O nanoparticles are covered with a thin CuO shell arising possiblyfrom reaction of the adsorbed oxygen on the Cu2O particle surface. Theblue shift is observed as microstructures of Cu2O nanoparticles changedfrom cubic to hollow in ultraviolet and visible (UV–visible) absorptionspectra. Both the Cu2O hollow and cubic nanostructures show certainquantum-confined effects. A cationic CTAB template mechanism isproposed to interpret the formation of the Cu2O nanoparticles.
1. Introduction
Shape and size are important factors in determining the struc-tural, physical and chemical properties of nanoparticles [1–3]. Shape-controlled synthesis of nanoparticles has becomea focus point, as different morphologic nanoparticles couldhave different electronic, optic and magnetic properties fromthat observed in their spherical counterpart. Semiconductornanoparticles have been made in various shapes such as trian-gles, rods, cubes and tetrapods for potential application and forquantum confinement studies [4, 5]. Cu2O is a p-type semi-conductor with a direct bandgap of ∼2.17 eV, which makes it apromising material in the application of solar energy and catal-ysis [6, 7]. In recent years Cu2O nanomaterials with differentstructures have been synthesized by various methods [8–12].The notable hollow nanostructure is of current interest dueto its possible application in many areas of modern scienceand technology, such as catalysis, drug delivery systems, chro-matography, energy storage and microelectronics [13, 14]. In
1 Author to whom any correspondence should be addressed.
the present work, various nanostructured Cu2O particles weresynthesized by using CTAB as a template through a simpleone-step route. The influence of CTAB concentration on thestructure of Cu2O nanoparticles was investigated.
2. Experimental details
2.1. Materials
Cetyltrimethylammonium (CTAB, ACROS), copper sulfate(CuSO4, Beijing Chemicals), sodium hydroxide (NaOH,Beijing Chemicals) and ascorbate acid (ACROS) wereused. All aqueous solutions were prepared with high-puritydeionized water.
2.2. Synthesis of Cu2O nanoparticles
Nanostructured Cu2O nanoparticles with different structureswere synthesized using an extended solution phase methodoriginally reported to synthesize nanocubes [8]. In a typicalexperiment, a set of solutions were prepared by adding 0.25 ml
0957-4484/05/020267+06$30.00 © 2005 IOP Publishing Ltd Printed in the UK 267

H Zhang et al
Figure 1. X-ray powder diffraction data of the as-preparednanoparticles.
of 0.01 M aqueous CuSO4 to 9.0 ml of aqueous CTABsolutions with a concentration of 0–0.03 M. Next, 0.50 mlof a 0.10 M ascorbate acid solution was added into the Cu2+–CTAB mixture solutions. The solutions were heated in a waterbath from room temperature to 55 ◦C, and kept for 5 min at thistemperature. Then, 0.2 ml of a 0.5 M aqueous NaOH solutionwas added into the mixture solutions. The solutions were keptat 55 ◦C for 5 min, then were removed from heat and allowed tocool to room temperature for about 30 min. The particles wereseparated from the solutions by centrifugation and washed withdeionized water to remove the surfactant.
2.3. Characterization
X-ray diffraction (XRD) data used for structure analysis wascollected using a Rigaku D/max 2500 diffractometer withCu Kα radiation. A step scan mode was employed with a stepwidth of 0.02◦ and a sampling time of 1 s. A VG-ESCALAB-5x-ray photoelectron spectrometer with Mg Kα excitingradiation was used to perform the surface constituent analyses.An FEI XL30 SEM and an FEI Tecnai F20 TEM were usedto perform the microstructure analysis. A Cary 1E UV–visspectrometer was used to perform absorption spectroscopyanalysis.
3. Results and discussion
Figure 1 shows a set of typical XRD data collected fromthe as-prepared samples with CTAB concentration in therange 0–0.03 M. All clear diffraction peaks can be assignedto the cubic Cu2O structure with the lattice parameter of4.269 Å (standard PDF data: No. 05-0667). The averagesize of the grains comprising the nanoparticles in each samplehave been roughly estimated from the (111) reflection peaksby using the Scherrer formula; we get 11.8, 7.5, 8.2 and 9.4 nmcorresponding to CTAB concentrations of 0, 0.005, 0.01 and0.03 M, respectively. The results indicate that the grainsbecome gradually larger with increasing CTAB concentrationfrom 0.005 to 0.03 M. However, the average grain size ofnanoparticles prepared without CTAB is apparently largerthan that of nanoparticles prepared with CTAB. Figure 2(a)shows an XPS spectrum of Cu 2P3/2 core level acquired
Figure 2. Cu 2P3/2 XPS data of nanoparticles taken (a) from theinitial surface, identified as the cupric CuO phase, and (b) from thesample after 2 min 2 keV Ar+ sputtering, identified as the purecuprous Cu2O phase.
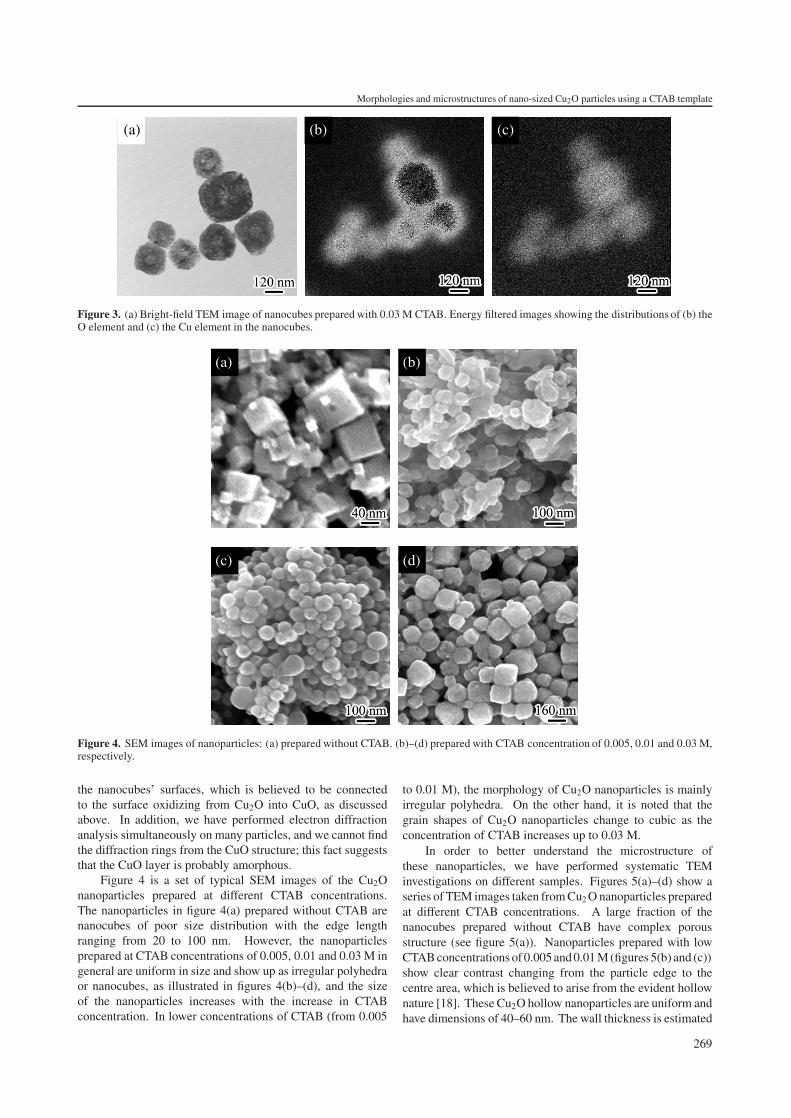
from a deposited nano-Cu2O sample prepared with CTABconcentration of 0.03 M. The 2P3/2 peak at 933.4 eV and theshake-up at 943.7 eV (∼10 eV away) are in good agreementwith the spectral feature of Cu2+ [15, 16]. Then, we milledthe sample by 2 keV Ar+ sputtering for 2 min, and got theother spectrum as shown in figure 2(b). As we can see, the2P3/2 peak shifts down to 932.8 eV with the disappearanceof shake-up, which perfectly fits with the feature of theCu+ spectrum. These facts suggest that a thin layer ofCuO possibly covers the Cu2O nanoparticles in the as-grownsamples. Further evidence supporting these microstructureproperties was obtained from element mapping observationswhich indicate that the surface layer of nanoparticles is rich inoxygen even in high vacuum. It is also noted that this structuralphenomenon shows certain similarities with the activatedreactive evaporation (ARE) nanophase which suggested thatthe stabilization of the cubic Cu2O nanophase is enhancedby the formation of a monoclinic CuO surface layer [17].The element mapping analyses of O and Cu were performedon nanocubes prepared with CTAB concentration of 0.03 M.The mapping images of Cu2O nanoparticles are shown infigures 3(a)–(c). The O element mapping image (figure 3(b))of Cu2O particles shows notable contrast changes dependingon the particle size. This phenomenon is considered to resultfrom the alternation of the fraction of the surface layers withhigh O concentration, this fraction apparently increases withthe decrease of the particle size. As a result, uniform contrast infigure 3(b) is observed on certain small particles. These resultsdemonstrate that the oxygen concentration is evidently rich on
268
Morphologies and microstructures of nano-sized Cu2O particles using a CTAB template
(a) (b) (c)
Figure 3. (a) Bright-field TEM image of nanocubes prepared with 0.03 M CTAB. Energy filtered images showing the distributions of (b) theO element and (c) the Cu element in the nanocubes.
(a) (b)
(c) (d)
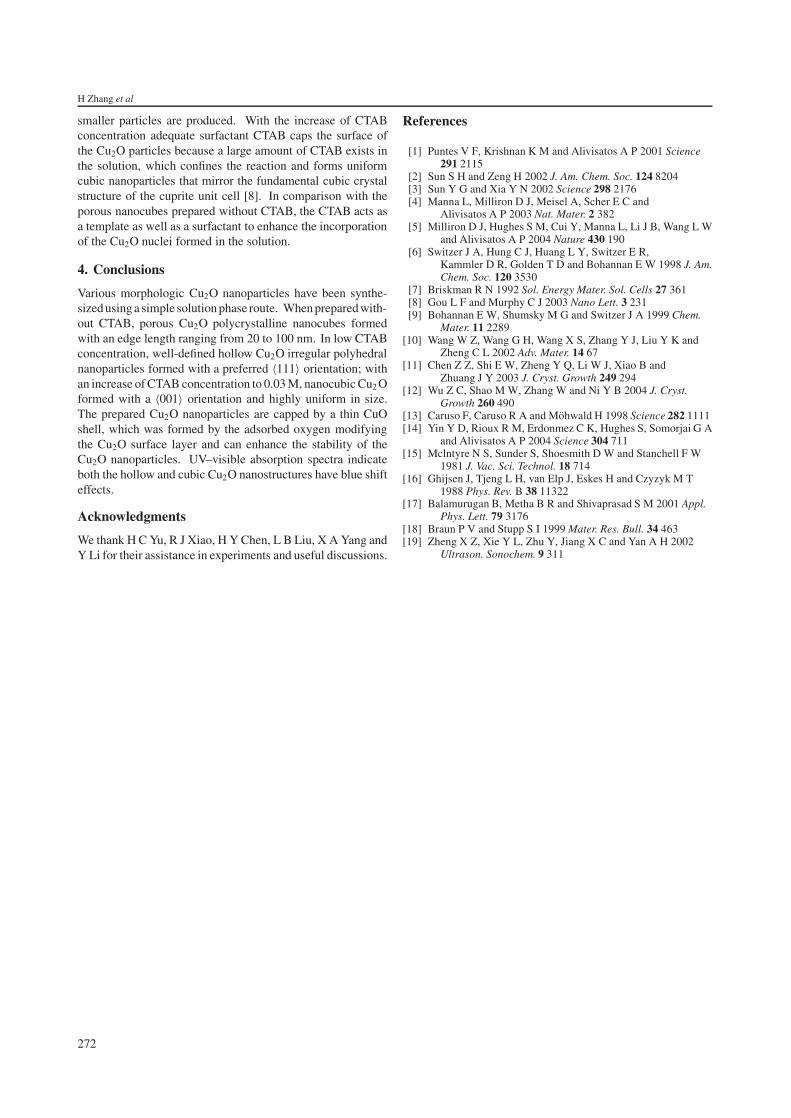
Figure 4. SEM images of nanoparticles: (a) prepared without CTAB. (b)–(d) prepared with CTAB concentration of 0.005, 0.01 and 0.03 M,respectively.
the nanocubes’ surfaces, which is believed to be connectedto the surface oxidizing from Cu2O into CuO, as discussedabove. In addition, we have performed electron diffractionanalysis simultaneously on many particles, and we cannot findthe diffraction rings from the CuO structure; this fact suggeststhat the CuO layer is probably amorphous.
Figure 4 is a set of typical SEM images of the Cu2Onanoparticles prepared at different CTAB concentrations.The nanoparticles in figure 4(a) prepared without CTAB arenanocubes of poor size distribution with the edge lengthranging from 20 to 100 nm. However, the nanoparticlesprepared at CTAB concentrations of 0.005, 0.01 and 0.03 M ingeneral are uniform in size and show up as irregular polyhedraor nanocubes, as illustrated in figures 4(b)–(d), and the sizeof the nanoparticles increases with the increase in CTABconcentration. In lower concentrations of CTAB (from 0.005
to 0.01 M), the morphology of Cu2O nanoparticles is mainlyirregular polyhedra. On the other hand, it is noted that thegrain shapes of Cu2O nanoparticles change to cubic as theconcentration of CTAB increases up to 0.03 M.
In order to better understand the microstructure ofthese nanoparticles, we have performed systematic TEMinvestigations on different samples. Figures 5(a)–(d) show aseries of TEM images taken from Cu2 O nanoparticles preparedat different CTAB concentrations. A large fraction of thenanocubes prepared without CTAB have complex porousstructure (see figure 5(a)). Nanoparticles prepared with lowCTAB concentrations of 0.005 and 0.01 M (figures 5(b) and (c))show clear contrast changing from the particle edge to thecentre area, which is believed to arise from the evident hollownature [18]. These Cu2O hollow nanoparticles are uniform andhave dimensions of 40–60 nm. The wall thickness is estimated
269

H Zhang et al
(a) (b)
(c) (d)
Figure 5. (a) Porous nanocubes prepared without CTAB. ((b), (c)) Hollow nanoparticles prepared with 0.005 and 0.01 M CTAB,respectively. (d) Porous nanocubes prepared with 0.03 M CTAB.
(a) (b)
(c) (d)
Figure 6. ((a)–(c)) Typical SAEDs of individual nanoparticles corresponding to figures 5(a)–(d), respectively. (d) A typical HRTEM imageof a nanoparticle, the moire fringes indicating the adsorbed small particles on the surface.
to be around 10 nm. Moreover, our experimental resultssuggest that the sizes and morphologies of the nanoparticlescan be controlled by CTAB concentration. Figure 5(d) shows
the TEM image of the nanoparticles prepared under CTABconcentration of 0.03 M. The particles in the present case havethe shape of nanocubes.
270

Morphologies and microstructures of nano-sized Cu2O particles using a CTAB template
Figure 7. UV–visible absorption spectra of different morphologicCu2O nanoparticles.
Selected area electron diffraction (SAED) observationshave been performed for checking the crystal structures ofthe Cu2O nanoparticles in each sample. Figure 6(a) showsa typical SAED pattern taken from a porous particle asshown in figure 5(a); it is found that these nanoparticles ingeneral are composed of grains aggregated randomly. Withthe introduction of CTAB, the crystallization of nanoparticlesbecomes gradually better. Figure 6(b) is a typical SAEDpattern of a hollow nanoparticle prepared at low CTABconcentration which indicates a highly preferred 〈111〉orientation texture structure; nanocubes prepared at highCTAB concentration (0.03 M) are found to be well crystallizedalong the 〈001〉 orientation. The broadened and streakeddiffraction spots demonstrate the presence of a high density ofstructural defects in the crystal. It is also noted that additionalweak diffraction spots (see the arrowheads in figures 6(b)and (c)) commonly appear in the electron diffraction patterns,these weak spots actually arise from small particles adsorbedon the nanoparticle’s surface, as also revealed in the HRTEMimage of figure 6(d). This image clearly exhibits the presenceof moire fringes due to the superimposed nanocrystals whichwere not incorporated into the nanoparticle completely.
Figure 8. Schematic illustration of the formation of hollow nanoparticles.
The UV–visible absorption spectra for understanding theproperties of atomic coupling within the nanoparticles havealso been measured briefly as shown in figure 7. TheseUV spectra were taken from different morphologic Cu2Oparticles dispersed in aqueous solution. A broad absorptionpeak at about 488 nm (2.54 eV) corresponds to Cu2O hollownanoparticles prepared at CTAB concentration of 0.005 M.When the CTAB concentration increased to 0.03 M, theabsorption peak shifted to 498 nm (2.49 eV), implyingthat cubic nanoparticles have relatively stronger Cu2O–Cu2Ointeraction due to the improvement of crystallization ofCu2O in the cubic nanoparticles. Comparison with bulkCu2O (Eg bulk = 2.17 eV), Cu2O hollow nanoparticles(Eg hollow = 2.54 eV) and cubic nanoparticles (Eg cube =2.49 eV) both show much larger blue shift effects in connectionwith the quantum-confined effects arising from the lowdimensional nanocrystals comprising the hollow or cubicCu2O particles [19].
Figure 8 shows a schematic illustration of a possiblemechanism for the formation of hollow nanoparticles. Thesurfactant (CTAB) molecules, within the aqueous solutionof low CTAB concentration, primarily form a monolayerstructure, then the monolayer structure changes progressivelyinto micelles as the solution is gradually heated (step (a)).The Cu2+ ions (from solution) form Cu–Br ligands (Br− fromCTAB) by electrostatic interactions and are dispersed in theoutward end of the micelles. This leads to the migrationof Cu2+ ions from the surrounding solution and enrichmentof the surface of the micelles (step (b)). The ascorbic acidreduces Cu2+ ions to form Cu2O nuclei on the surface of themicelles as NaOH solution is added into hot solution (step (c)).Then, the growth of the nuclei was continued by addition ofCu2O containing species to the surface of the Cu2O particles,which formed a compact Cu2O layer on the surface of themicelles (step (d)). On the other hand, the nucleated particlesalways evolve into polyhedral particles mirroring the crystalstructure, so hollow polyhedral nanoparticles assembled by
271
H Zhang et al
smaller particles are produced. With the increase of CTABconcentration adequate surfactant CTAB caps the surface ofthe Cu2O particles because a large amount of CTAB exists inthe solution, which confines the reaction and forms uniformcubic nanoparticles that mirror the fundamental cubic crystalstructure of the cuprite unit cell [8]. In comparison with theporous nanocubes prepared without CTAB, the CTAB acts asa template as well as a surfactant to enhance the incorporationof the Cu2O nuclei formed in the solution.
4. Conclusions
Various morphologic Cu2O nanoparticles have been synthe-sized using a simple solution phase route. When prepared with-out CTAB, porous Cu2O polycrystalline nanocubes formedwith an edge length ranging from 20 to 100 nm. In low CTABconcentration, well-defined hollow Cu2O irregular polyhedralnanoparticles formed with a preferred 〈111〉 orientation; withan increase of CTAB concentration to 0.03 M, nanocubic Cu2 Oformed with a 〈001〉 orientation and highly uniform in size.The prepared Cu2O nanoparticles are capped by a thin CuOshell, which was formed by the adsorbed oxygen modifyingthe Cu2O surface layer and can enhance the stability of theCu2O nanoparticles. UV–visible absorption spectra indicateboth the hollow and cubic Cu2O nanostructures have blue shifteffects.
Acknowledgments
We thank H C Yu, R J Xiao, H Y Chen, L B Liu, X A Yang andY Li for their assistance in experiments and useful discussions.
References
[1] Puntes V F, Krishnan K M and Alivisatos A P 2001 Science291 2115
[2] Sun S H and Zeng H 2002 J. Am. Chem. Soc. 124 8204[3] Sun Y G and Xia Y N 2002 Science 298 2176[4] Manna L, Milliron D J, Meisel A, Scher E C and
Alivisatos A P 2003 Nat. Mater. 2 382[5] Milliron D J, Hughes S M, Cui Y, Manna L, Li J B, Wang L W
and Alivisatos A P 2004 Nature 430 190[6] Switzer J A, Hung C J, Huang L Y, Switzer E R,
Kammler D R, Golden T D and Bohannan E W 1998 J. Am.Chem. Soc. 120 3530
[7] Briskman R N 1992 Sol. Energy Mater. Sol. Cells 27 361[8] Gou L F and Murphy C J 2003 Nano Lett. 3 231[9] Bohannan E W, Shumsky M G and Switzer J A 1999 Chem.
Mater. 11 2289[10] Wang W Z, Wang G H, Wang X S, Zhang Y J, Liu Y K and
Zheng C L 2002 Adv. Mater. 14 67[11] Chen Z Z, Shi E W, Zheng Y Q, Li W J, Xiao B and
Zhuang J Y 2003 J. Cryst. Growth 249 294[12] Wu Z C, Shao M W, Zhang W and Ni Y B 2004 J. Cryst.
Growth 260 490[13] Caruso F, Caruso R A and Mohwald H 1998 Science 282 1111[14] Yin Y D, Rioux R M, Erdonmez C K, Hughes S, Somorjai G A
and Alivisatos A P 2004 Science 304 711[15] Mclntyre N S, Sunder S, Shoesmith D W and Stanchell F W
1981 J. Vac. Sci. Technol. 18 714[16] Ghijsen J, Tjeng L H, van Elp J, Eskes H and Czyzyk M T
1988 Phys. Rev. B 38 11322[17] Balamurugan B, Metha B R and Shivaprasad S M 2001 Appl.
Phys. Lett. 79 3176[18] Braun P V and Stupp S I 1999 Mater. Res. Bull. 34 463[19] Zheng X Z, Xie Y L, Zhu Y, Jiang X C and Yan A H 2002
Ultrason. Sonochem. 9 311
272