installation operation & maintenance · pdf fileflow calculations 3.2 5 ... piping...
TRANSCRIPT
AdvancedDifferentialPressureFlowmeterTechnology
INSTALLATIONOPERATION &MAINTENANCE
MANUAL

Table of ContentsSection 1 - General Introduction 1.1 1Principles Of Operation 1.2 1Reshaping The Velocity Profi le 1.3 1Section 2 - FeaturesHigh Accuracy 2.1 2Repeatability 2.2 2Turndown 2.3 2Installation Requirements 2.4 3Long Term Performance 2.5 3Signal Stability 2.6 3Low Permanent Pressure Loss 2.7 3Sizing 2.8 4No Areas of Stagnation 2.9 4Mixing 2.10 4V-Cone Models 2.11 4Section 3 - The V-Cone Flow MeasurementSystemApplication Data 3.1 5Flow Calculations 3.2 5Simplifi ed Liquid Calculations 3.3 7Application Sizing 3.4 8Calibration 3.5 8Materials Of Construction 3.6 8Valve Manifolds 3.7 8Secondary And Tertiary Instrumentation 3.8 9Meter Tag 3.9 9Section 4 - InstallationScope 4.1 10Safety 4.2 10Unpacking 4.3 10Orientation 4.4 10Piping Specifi cation 4.5 10Piping Requirements 4.6 11Tap Locations 4.7 11Isolation (Block) Valves 4.8 11Valve Manifolds 4.9 12Installations 4.10 12Pressure Taps 4.11 13Remote Seals or Chemical Seals 4.12 13Impulse Line Size: Process Industries 4.14 13Impulse Line Size: Steam Applications 4.15 13Insulation 4.16 14Horizontal Piping Installations: Gas 4.17 14
Horizontal Piping Installations: Liquids 4.18 15Horizontal Piping Installations: CondensingVapors
4.19 15
Vertical Piping Installations: General 4.20 16Vertical Piping Installations: Up Flow 4.21 16Vertical Piping Installations: Gas 4.22 16Vertical Piping Installations: Liquids 4.23 17Vertical Piping Installations: Condensing Vapors
4.24 18
Calibrated Compensated Installation 4.25 18Vertical Down Flow Installations: General 4.26 18Vertical Down Flow Installations: Gas 4.27 18Vertical Down Flow Installations: Liquids 4.28 19Vertical Down Flow Installations: Condensing Vapors
4.29 20
Supporting Manifold Blocks and Dual Transmitters
4.30 21
Pressure Effects In The Impulse Lines 4.31 21Zeroing DP Pressure Transmitters Following Installation For Steam Applications
4.32 22
Zeroing DP Pressure Transmitters Following Installation For Ambient Temperature Liquid Applications
4.33 22
Zeroing DP Pressure Transmitters Following Installation For Gas Applications
4.34 23
Differential Pressure Measurement 4.35 24Temperature And Pressure Measurement 4.36 24Section 5 - DimensionsFace To Face Dimensions 5.1 25Face To Face Dimensions 5.2 25Section 6 - Model SelectionsWafer-Cone® Model Template 6.1 26Precision tube V-Cone Model Template 6.2 26Insertion Top-plate V-Cone Model Template 6.3 27V-Cone Special Models 6.4 27Section 7 - Maintenance 27Section 8 - Troubleshooting 28Section 9 - V-Cone Literature 31AppendicesV-Cone Installation Guide Upstream and Downstream Minimum Straight Pipe Run Requirements for Gas Metering at a Reynolds Number (Re) Value > 200,000
32
V-Cone Installation Guide Upstream and Downstream Minimum Straight Pipe Run Requirements for Liquid Metering and Gases at a Reynolds Number (Re) Value Less Than or Equal To 200,000
33
Warranty 34
Section Page Section Page
Copyright © 1992-2010 McCrometer, Inc. All printed material should not be changed or altered without permission of McCrometer. Any published technical data and instructions are subject to change without notice. Contact your McCrometer representative for current technical data and instructions.
www.mccrometer.com
3255 WEST STETSON AVENUE • HEMET, CALIFORNIA 92545 USATEL: 951-652-6811 • 800-220-2279 • FAX: 951-652-3078 Printed In The U.S.A. Lit. # 24509-15 Rev. 3.9/04-10
1
1.0 General
1.1 Introduction
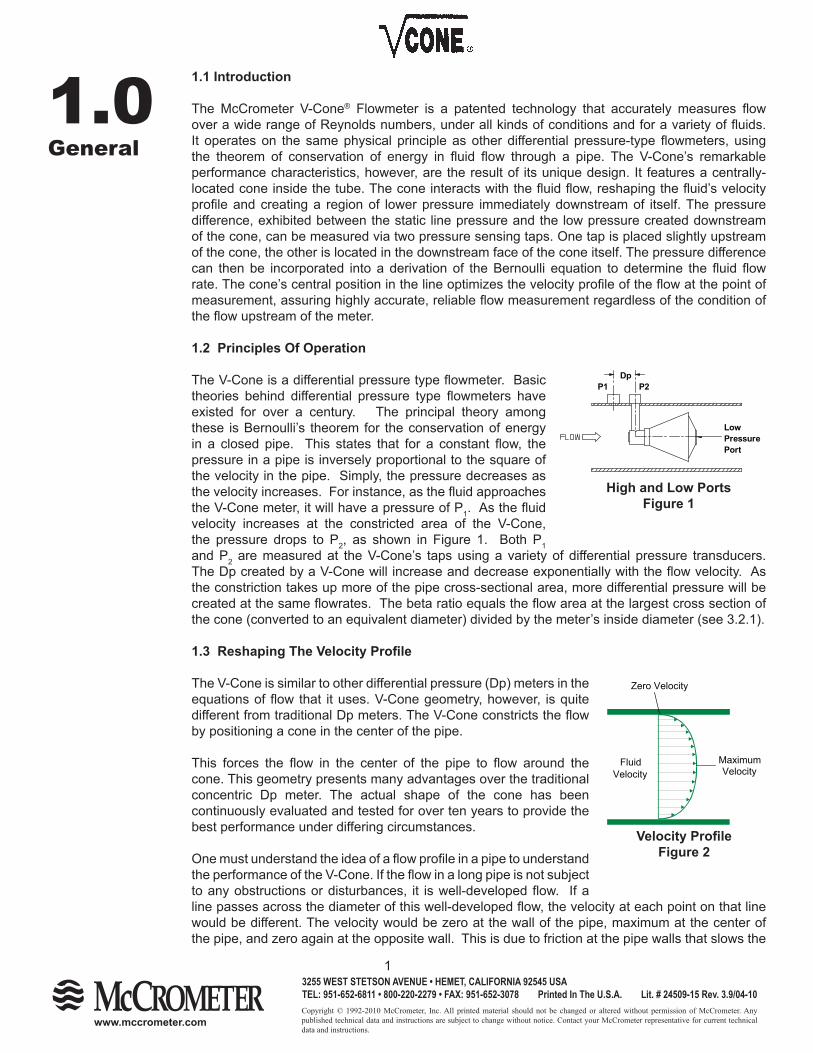
The McCrometer V-Cone® Flowmeter is a patented technology that accurately measures fl ow over a wide range of Reynolds numbers, under all kinds of conditions and for a variety of fl uids. It operates on the same physical principle as other differential pressure-type fl owmeters, using the theorem of conservation of energy in fl uid fl ow through a pipe. The V-Cone’s remarkable performance characteristics, however, are the result of its unique design. It features a centrally-located cone inside the tube. The cone interacts with the fl uid fl ow, reshaping the fl uid’s velocity profi le and creating a region of lower pressure immediately downstream of itself. The pressure difference, exhibited between the static line pressure and the low pressure created downstream of the cone, can be measured via two pressure sensing taps. One tap is placed slightly upstream of the cone, the other is located in the downstream face of the cone itself. The pressure difference can then be incorporated into a derivation of the Bernoulli equation to determine the fl uid fl ow rate. The cone’s central position in the line optimizes the velocity profi le of the fl ow at the point of measurement, assuring highly accurate, reliable fl ow measurement regardless of the condition of the fl ow upstream of the meter.
1.2 Principles Of Operation
The V-Cone is a differential pressure type fl owmeter. Basic theories behind differential pressure type fl owmeters have existed for over a century. The principal theory among these is Bernoulli’s theorem for the conservation of energy in a closed pipe. This states that for a constant fl ow, the pressure in a pipe is inversely proportional to the square of the velocity in the pipe. Simply, the pressure decreases as the velocity increases. For instance, as the fl uid approaches the V-Cone meter, it will have a pressure of P1. As the fl uid velocity increases at the constricted area of the V-Cone, the pressure drops to P2, as shown in Figure 1. Both P1 and P2 are measured at the V-Cone’s taps using a variety of differential pressure transducers. The Dp created by a V-Cone will increase and decrease exponentially with the fl ow velocity. As the constriction takes up more of the pipe cross-sectional area, more differential pressure will be created at the same fl owrates. The beta ratio equals the fl ow area at the largest cross section of the cone (converted to an equivalent diameter) divided by the meter’s inside diameter (see 3.2.1).
1.3 Reshaping The Velocity Profi le
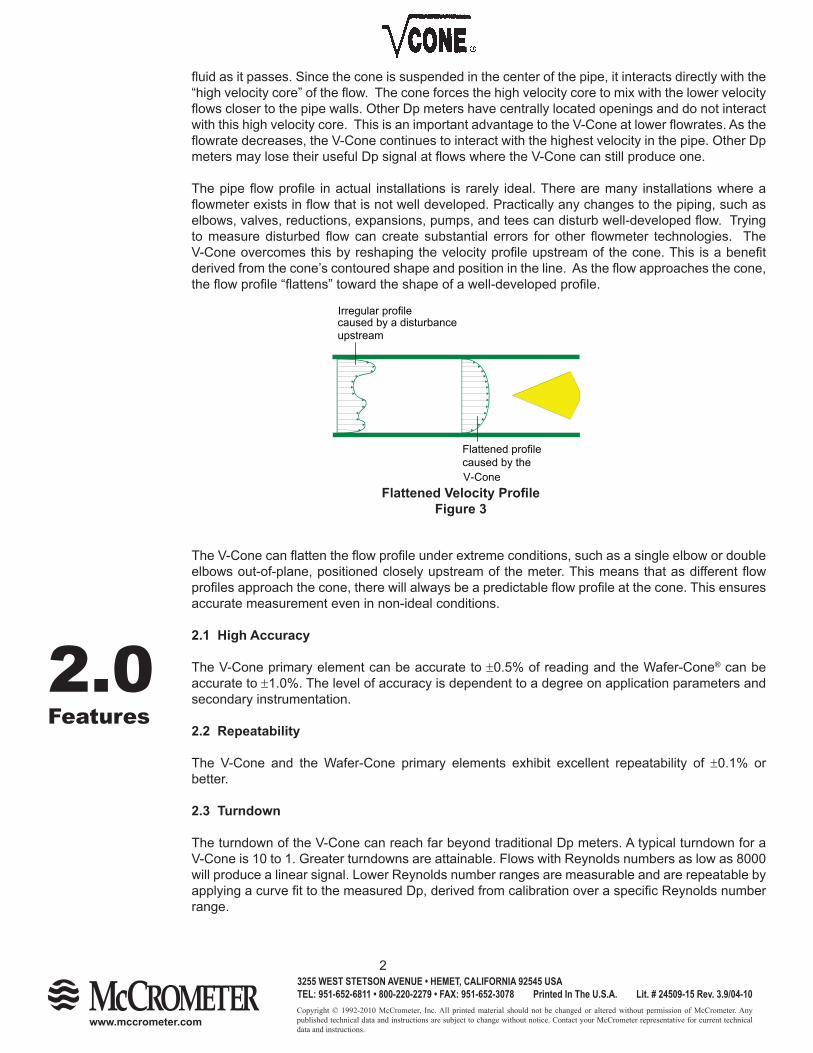
The V-Cone is similar to other differential pressure (Dp) meters in the equations of fl ow that it uses. V-Cone geometry, however, is quite different from traditional Dp meters. The V-Cone constricts the fl ow by positioning a cone in the center of the pipe.
This forces the fl ow in the center of the pipe to fl ow around the cone. This geometry presents many advantages over the traditional concentric Dp meter. The actual shape of the cone has been continuously evaluated and tested for over ten years to provide the best performance under differing circumstances.
One must understand the idea of a fl ow profi le in a pipe to understand the performance of the V-Cone. If the fl ow in a long pipe is not subject to any obstructions or disturbances, it is well-developed fl ow. If a line passes across the diameter of this well-developed fl ow, the velocity at each point on that line would be different. The velocity would be zero at the wall of the pipe, maximum at the center of the pipe, and zero again at the opposite wall. This is due to friction at the pipe walls that slows the
Dp
LowPressurePort
P1 P2
High and Low PortsFigure 1
Zero Velocity
FluidVelocity
MaximumVelocity
Velocity Profi leFigure 2
Copyright © 1992-2010 McCrometer, Inc. All printed material should not be changed or altered without permission of McCrometer. Any published technical data and instructions are subject to change without notice. Contact your McCrometer representative for current technical data and instructions.
www.mccrometer.com
3255 WEST STETSON AVENUE • HEMET, CALIFORNIA 92545 USATEL: 951-652-6811 • 800-220-2279 • FAX: 951-652-3078 Printed In The U.S.A. Lit. # 24509-15 Rev. 3.9/04-10
2
fl uid as it passes. Since the cone is suspended in the center of the pipe, it interacts directly with the “high velocity core” of the fl ow. The cone forces the high velocity core to mix with the lower velocity fl ows closer to the pipe walls. Other Dp meters have centrally located openings and do not interact with this high velocity core. This is an important advantage to the V-Cone at lower fl owrates. As the fl owrate decreases, the V-Cone continues to interact with the highest velocity in the pipe. Other Dp meters may lose their useful Dp signal at fl ows where the V-Cone can still produce one.
The pipe fl ow profi le in actual installations is rarely ideal. There are many installations where a fl owmeter exists in fl ow that is not well developed. Practically any changes to the piping, such as elbows, valves, reductions, expansions, pumps, and tees can disturb well-developed fl ow. Trying to measure disturbed fl ow can create substantial errors for other fl owmeter technologies. The V-Cone overcomes this by reshaping the velocity profi le upstream of the cone. This is a benefi t derived from the cone’s contoured shape and position in the line. As the fl ow approaches the cone, the fl ow profi le “fl attens” toward the shape of a well-developed profi le.
The V-Cone can fl atten the fl ow profi le under extreme conditions, such as a single elbow or double elbows out-of-plane, positioned closely upstream of the meter. This means that as different fl ow profi les approach the cone, there will always be a predictable fl ow profi le at the cone. This ensures accurate measurement even in non-ideal conditions.
2.1 High Accuracy
The V-Cone primary element can be accurate to ±0.5% of reading and the Wafer-Cone® can be accurate to ±1.0%. The level of accuracy is dependent to a degree on application parameters and secondary instrumentation.
2.2 Repeatability
The V-Cone and the Wafer-Cone primary elements exhibit excellent repeatability of ±0.1% or better.
2.3 Turndown
The turndown of the V-Cone can reach far beyond traditional Dp meters. A typical turndown for a V-Cone is 10 to 1. Greater turndowns are attainable. Flows with Reynolds numbers as low as 8000 will produce a linear signal. Lower Reynolds number ranges are measurable and are repeatable by applying a curve fi t to the measured Dp, derived from calibration over a specifi c Reynolds number range.
Irregular profilecaused by a disturbanceupstream
Flattened profilecaused by theV-Cone
Flattened Velocity Profi leFigure 3
2.0Features
Copyright © 1992-2010 McCrometer, Inc. All printed material should not be changed or altered without permission of McCrometer. Any published technical data and instructions are subject to change without notice. Contact your McCrometer representative for current technical data and instructions.
www.mccrometer.com
3255 WEST STETSON AVENUE • HEMET, CALIFORNIA 92545 USATEL: 951-652-6811 • 800-220-2279 • FAX: 951-652-3078 Printed In The U.S.A. Lit. # 24509-15 Rev. 3.9/04-10
3
Signal StabilityFigure 6
V-Cone
Orifi ce Plate
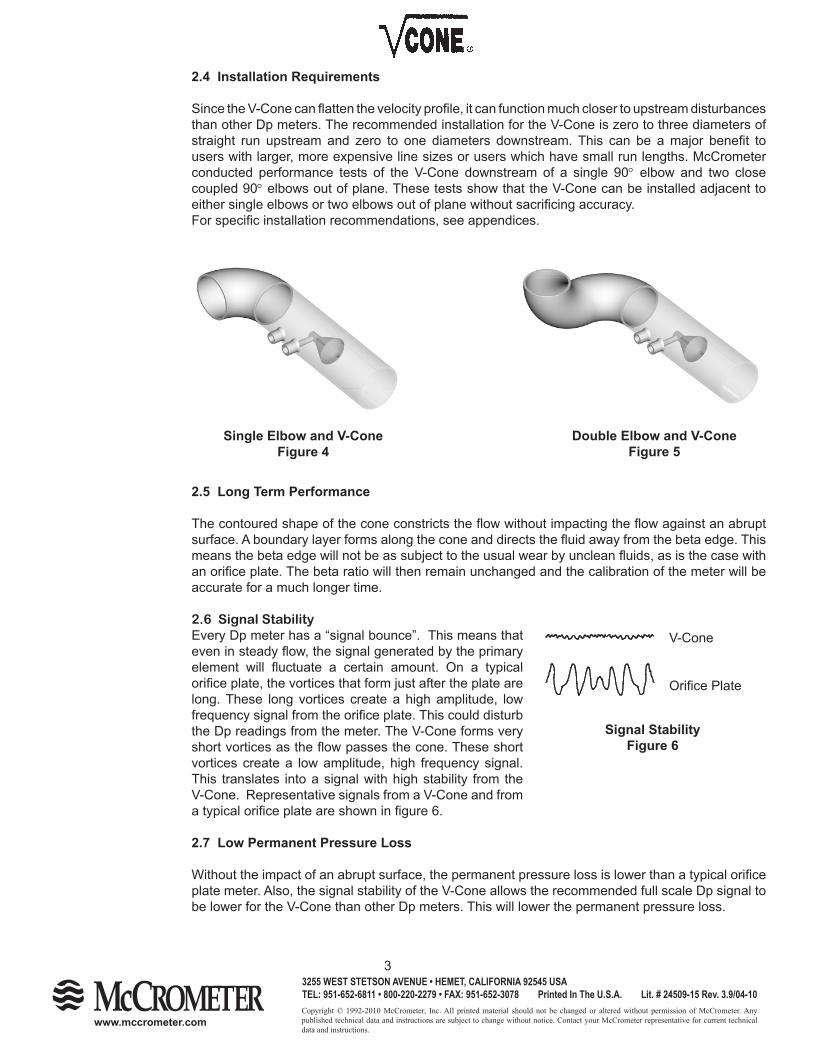
2.4 Installation Requirements
Since the V-Cone can fl atten the velocity profi le, it can function much closer to upstream disturbances than other Dp meters. The recommended installation for the V-Cone is zero to three diameters of straight run upstream and zero to one diameters downstream. This can be a major benefi t to users with larger, more expensive line sizes or users which have small run lengths. McCrometer conducted performance tests of the V-Cone downstream of a single 90° elbow and two close coupled 90° elbows out of plane. These tests show that the V-Cone can be installed adjacent to either single elbows or two elbows out of plane without sacrifi cing accuracy.For specifi c installation recommendations, see appendices.
2.5 Long Term Performance
The contoured shape of the cone constricts the fl ow without impacting the fl ow against an abrupt surface. A boundary layer forms along the cone and directs the fl uid away from the beta edge. This means the beta edge will not be as subject to the usual wear by unclean fl uids, as is the case with an orifi ce plate. The beta ratio will then remain unchanged and the calibration of the meter will be accurate for a much longer time.
2.6 Signal StabilityEvery Dp meter has a “signal bounce”. This means that even in steady fl ow, the signal generated by the primary element will fl uctuate a certain amount. On a typical orifi ce plate, the vortices that form just after the plate are long. These long vortices create a high amplitude, low frequency signal from the orifi ce plate. This could disturb the Dp readings from the meter. The V-Cone forms very short vortices as the fl ow passes the cone. These short vortices create a low amplitude, high frequency signal. This translates into a signal with high stability from the V-Cone. Representative signals from a V-Cone and from a typical orifi ce plate are shown in fi gure 6.
2.7 Low Permanent Pressure Loss
Without the impact of an abrupt surface, the permanent pressure loss is lower than a typical orifi ce plate meter. Also, the signal stability of the V-Cone allows the recommended full scale Dp signal to be lower for the V-Cone than other Dp meters. This will lower the permanent pressure loss.
Single Elbow and V-ConeFigure 4
Double Elbow and V-ConeFigure 5
Copyright © 1992-2010 McCrometer, Inc. All printed material should not be changed or altered without permission of McCrometer. Any published technical data and instructions are subject to change without notice. Contact your McCrometer representative for current technical data and instructions.
www.mccrometer.com
3255 WEST STETSON AVENUE • HEMET, CALIFORNIA 92545 USATEL: 951-652-6811 • 800-220-2279 • FAX: 951-652-3078 Printed In The U.S.A. Lit. # 24509-15 Rev. 3.9/04-10
4
2.8 Sizing
The unique geometry of the V-Cone allows for a wide range of beta ratios. Standard beta ratios range from 0.45, 0.55, 0.65, 0.75, and 0.80.
2.9 No Areas of Stagnation
The “swept through” design of the cone does not allow for areas of stagnation where debris, condensation or particles from the fl uid could accumulate.
2.10 Mixing
The short vortices described in section 2.6 mix the fl uid thoroughly just downstream of the cone. The V-Cone is currently used in many applications as a static mixer where instant and complete mixing are necessary.
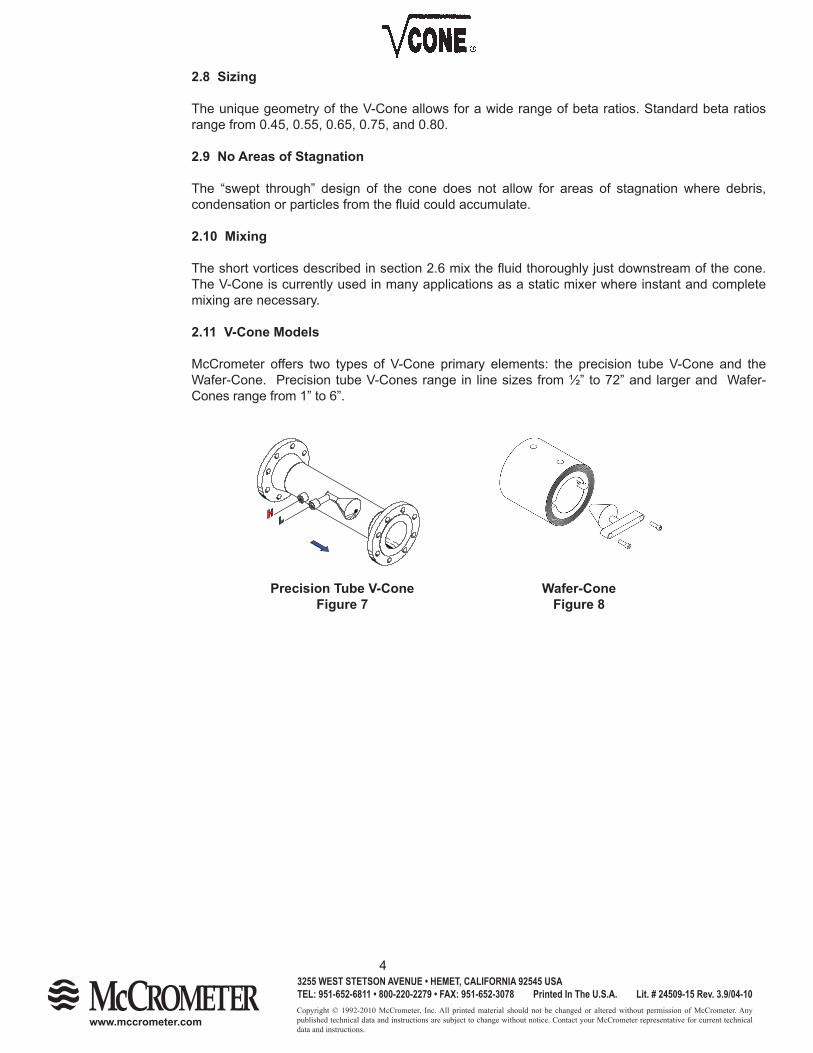
2.11 V-Cone Models
McCrometer offers two types of V-Cone primary elements: the precision tube V-Cone and the Wafer-Cone. Precision tube V-Cones range in line sizes from ½” to 72” and larger and Wafer-Cones range from 1” to 6”.
Precision Tube V-ConeFigure 7
Wafer-ConeFigure 8
Copyright © 1992-2010 McCrometer, Inc. All printed material should not be changed or altered without permission of McCrometer. Any published technical data and instructions are subject to change without notice. Contact your McCrometer representative for current technical data and instructions.
www.mccrometer.com
3255 WEST STETSON AVENUE • HEMET, CALIFORNIA 92545 USATEL: 951-652-6811 • 800-220-2279 • FAX: 951-652-3078 Printed In The U.S.A. Lit. # 24509-15 Rev. 3.9/04-10
5
3.0 The V-ConeFlow Meas. System
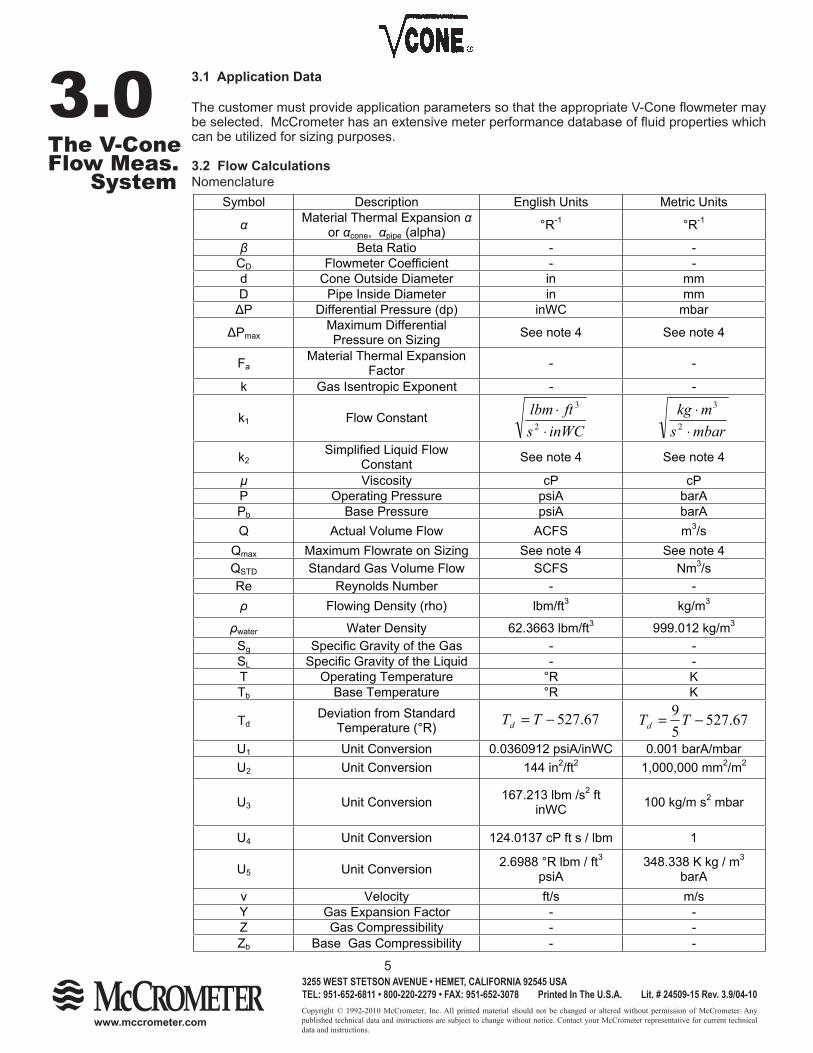
3.1 Application Data
The customer must provide application parameters so that the appropriate V-Cone fl owmeter may be selected. McCrometer has an extensive meter performance database of fl uid properties which can be utilized for sizing purposes.
3.2 Flow CalculationsNomenclature
Symbol Description English Units Metric Units Material Thermal Expansion
or cone, pipe (alpha) °R-1 °R-1
Beta Ratio - - CD Flowmeter Coefficient - - d Cone Outside Diameter in mm D Pipe Inside Diameter in mm P Differential Pressure (dp) inWC mbar
Pmax Maximum Differential Pressure on Sizing See note 4 See note 4
FaMaterial Thermal Expansion
Factor - -
k Gas Isentropic Exponent - -
k1 Flow Constant inWCsftlbm
⋅⋅
2
3
mbarsmkg
⋅⋅
2
3
k2Simplified Liquid Flow
Constant See note 4 See note 4
Viscosity cP cP P Operating Pressure psiA barA Pb Base Pressure psiA barA Q Actual Volume Flow ACFS m3/s
Qmax Maximum Flowrate on Sizing See note 4 See note 4 QSTD Standard Gas Volume Flow SCFS Nm3/s Re Reynolds Number - -
Flowing Density (rho) lbm/ft3 kg/m3
water Water Density 62.3663 lbm/ft3 999.012 kg/m3
Sg Specific Gravity of the Gas - - SL Specific Gravity of the Liquid - - T Operating Temperature °R K Tb Base Temperature °R K
TdDeviation from Standard
Temperature (°R) 67.527−= TTd 67.52759 −= TTd
U1 Unit Conversion 0.0360912 psiA/inWC 0.001 barA/mbar U2 Unit Conversion 144 in2/ft2 1,000,000 mm2/m2
U3 Unit Conversion 167.213 lbm /s2 ft inWC 100 kg/m s2 mbar
U4 Unit Conversion 124.0137 cP ft s / lbm 1
U5 Unit Conversion 2.6988 °R lbm / ft3psiA
348.338 K kg / m3
barAv Velocity ft/s m/s Y Gas Expansion Factor - - Z Gas Compressibility - - Zb Base Gas Compressibility - -
Copyright © 1992-2010 McCrometer, Inc. All printed material should not be changed or altered without permission of McCrometer. Any published technical data and instructions are subject to change without notice. Contact your McCrometer representative for current technical data and instructions.
www.mccrometer.com
3255 WEST STETSON AVENUE • HEMET, CALIFORNIA 92545 USATEL: 951-652-6811 • 800-220-2279 • FAX: 951-652-3078 Printed In The U.S.A. Lit. # 24509-15 Rev. 3.9/04-10
6
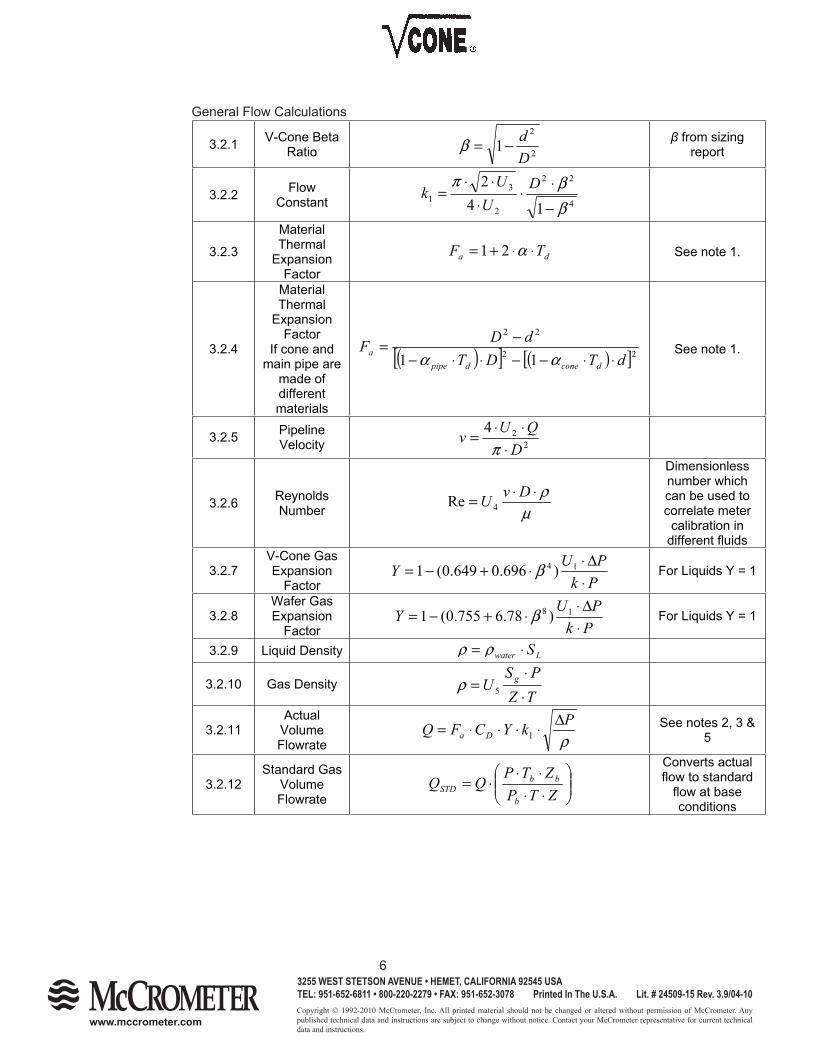
3.2.1 V-Cone Beta Ratio 2
2
1Dd−=β from sizing
report
3.2.2 FlowConstant 4
22
2
31
142
ββπ
−
⋅⋅⋅
⋅⋅= D
UU
k
3.2.3
MaterialThermal
Expansion Factor
da TF ⋅⋅+= α21 See note 1.
3.2.4
MaterialThermal
Expansion Factor
If cone and main pipe are
made of differentmaterials
( )[ ] ( )[ ]22
22
11 dTDTdDF
dconedpipea ⋅⋅−−⋅⋅−
−=αα
See note 1.
3.2.5 PipelineVelocity 2
24DQUv
⋅⋅⋅
=π
3.2.6 Reynolds Number μ
ρ⋅⋅= DvU 4Re
Dimensionless number which can be used to correlate meter
calibration in different fluids
3.2.7V-Cone Gas Expansion
Factor PkPUY
⋅Δ⋅
⋅+−= 14 )696.0649.0(1 β For Liquids Y = 1
3.2.8Wafer Gas Expansion
Factor PkPUY
⋅Δ⋅
⋅+−= 18 )78.6755.0(1 β For Liquids Y = 1
3.2.9 Liquid Density Lwater S⋅= ρρ
3.2.10 Gas Density TZPS
U g
⋅⋅
= 5ρ
3.2.11Actual
VolumeFlowrate ρ
PkYCFQ DaΔ⋅⋅⋅⋅= 1
See notes 2, 3 & 5
3.2.12Standard Gas
VolumeFlowrate ⋅⋅
⋅⋅⋅=
ZTPZTP
QQb
bbSTD
Converts actual flow to standard
flow at base conditions
General Flow Calculations
Copyright © 1992-2010 McCrometer, Inc. All printed material should not be changed or altered without permission of McCrometer. Any published technical data and instructions are subject to change without notice. Contact your McCrometer representative for current technical data and instructions.
www.mccrometer.com
3255 WEST STETSON AVENUE • HEMET, CALIFORNIA 92545 USATEL: 951-652-6811 • 800-220-2279 • FAX: 951-652-3078 Printed In The U.S.A. Lit. # 24509-15 Rev. 3.9/04-10
7
p q
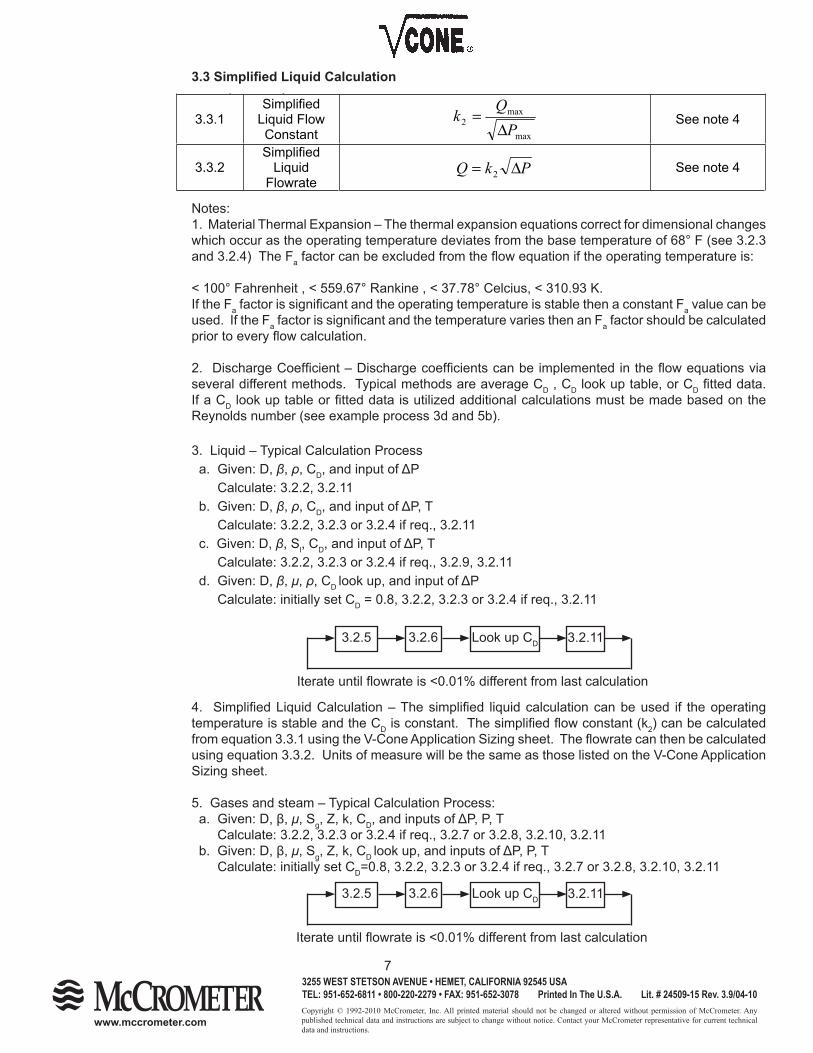
3.3.1Simplified
Liquid Flow Constant max
max2 P
Qk
Δ= See note 4
3.3.2Simplified
LiquidFlowrate
PkQ Δ= 2 See note 4
3.3 Simplifi ed Liquid Calculation
Notes:1. Material Thermal Expansion – The thermal expansion equations correct for dimensional changes which occur as the operating temperature deviates from the base temperature of 68° F (see 3.2.3 and 3.2.4) The Fa factor can be excluded from the fl ow equation if the operating temperature is:
< 100° Fahrenheit , < 559.67° Rankine , < 37.78° Celcius, < 310.93 K.If the Fa factor is signifi cant and the operating temperature is stable then a constant Fa value can be used. If the Fa factor is signifi cant and the temperature varies then an Fa factor should be calculated prior to every fl ow calculation.
2. Discharge Coeffi cient – Discharge coeffi cients can be implemented in the fl ow equations via several different methods. Typical methods are average CD , CD look up table, or CD fi tted data. If a CD look up table or fi tted data is utilized additional calculations must be made based on the Reynolds number (see example process 3d and 5b).
3. Liquid – Typical Calculation Process a. Given: D, β, ρ, CD, and input of ΔP Calculate: 3.2.2, 3.2.11 b. Given: D, β, ρ, CD, and input of ΔP, T Calculate: 3.2.2, 3.2.3 or 3.2.4 if req., 3.2.11 c. Given: D, β, Sl, CD, and input of ΔP, T Calculate: 3.2.2, 3.2.3 or 3.2.4 if req., 3.2.9, 3.2.11 d. Given: D, β, μ, ρ, CD look up, and input of ΔP Calculate: initially set CD = 0.8, 3.2.2, 3.2.3 or 3.2.4 if req., 3.2.11
Iterate until fl owrate is <0.01% different from last calculation
4. Simplifi ed Liquid Calculation – The simplifi ed liquid calculation can be used if the operating temperature is stable and the CD is constant. The simplifi ed fl ow constant (k2) can be calculated from equation 3.3.1 using the V-Cone Application Sizing sheet. The fl owrate can then be calculated using equation 3.3.2. Units of measure will be the same as those listed on the V-Cone Application Sizing sheet.
5. Gases and steam – Typical Calculation Process: a. Given: D, β, μ, Sg, Z, k, CD, and inputs of ΔP, P, T Calculate: 3.2.2, 3.2.3 or 3.2.4 if req., 3.2.7 or 3.2.8, 3.2.10, 3.2.11 b. Given: D, β, μ, Sg, Z, k, CD look up, and inputs of ΔP, P, T Calculate: initially set CD=0.8, 3.2.2, 3.2.3 or 3.2.4 if req., 3.2.7 or 3.2.8, 3.2.10, 3.2.11
3.2.5 3.2.6 Look up CD 3.2.11
3.2.5 3.2.6 Look up CD 3.2.11
Iterate until fl owrate is <0.01% different from last calculation
Copyright © 1992-2010 McCrometer, Inc. All printed material should not be changed or altered without permission of McCrometer. Any published technical data and instructions are subject to change without notice. Contact your McCrometer representative for current technical data and instructions.
www.mccrometer.com
3255 WEST STETSON AVENUE • HEMET, CALIFORNIA 92545 USATEL: 951-652-6811 • 800-220-2279 • FAX: 951-652-3078 Printed In The U.S.A. Lit. # 24509-15 Rev. 3.9/04-10
8
3.4 Application Sizing
Each V-Cone is tailored to its specifi c application. Before manufacturing, every V-Cone will have a “sizing” completed according to the physical parameters of the application. The computer gener-ated sizing uses application data as a basis to predict the V-Cone’s performance. Full scale DP, working fl ow range, expected accuracy, and predicted pressure loss are determined by the sizing process.
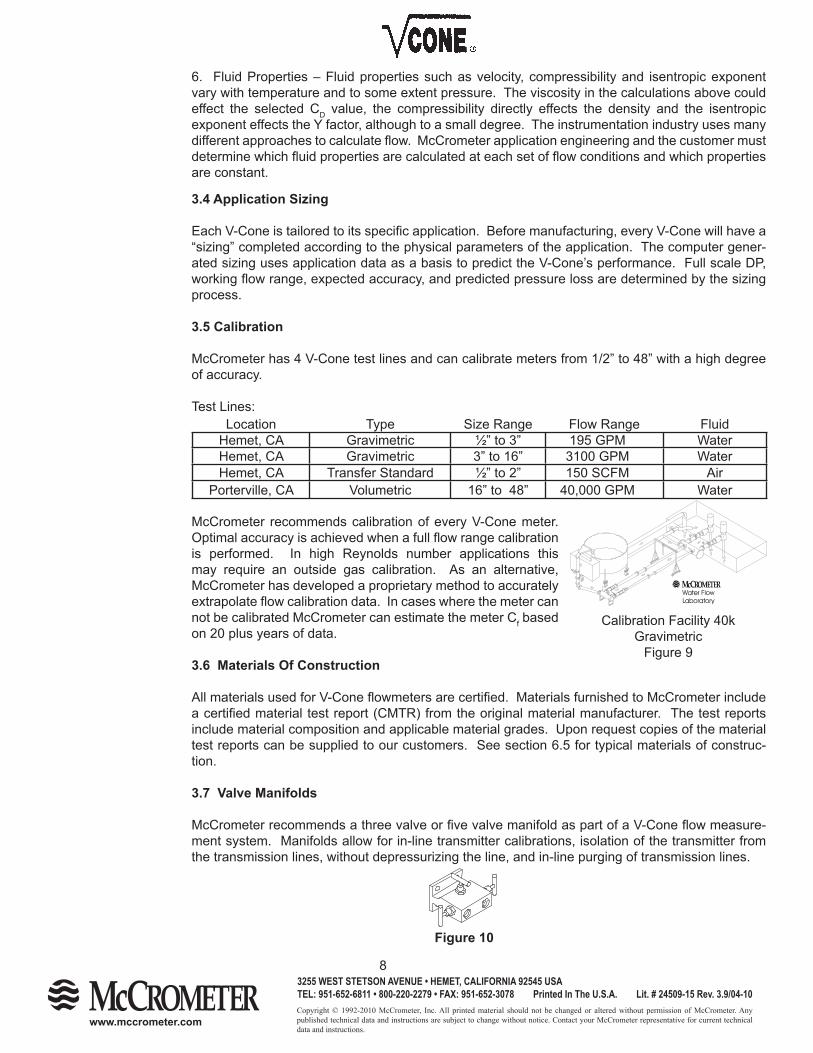
3.5 Calibration
McCrometer has 4 V-Cone test lines and can calibrate meters from 1/2” to 48” with a high degree of accuracy.
Test Lines:Location Type Size Range Flow Range Fluid
Hemet, CA Gravimetric ½” to 3” 195 GPM WaterHemet, CA Gravimetric 3” to 16” 3100 GPM WaterHemet, CA Transfer Standard ½” to 2” 150 SCFM Air
Porterville, CA Volumetric 16” to 48” 40,000 GPM Water
McCrometer recommends calibration of every V-Cone meter. Optimal accuracy is achieved when a full fl ow range calibration is performed. In high Reynolds number applications this may require an outside gas calibration. As an alternative, McCrometer has developed a proprietary method to accurately extrapolate fl ow calibration data. In cases where the meter can not be calibrated McCrometer can estimate the meter Cf based on 20 plus years of data.
3.6 Materials Of Construction
All materials used for V-Cone fl owmeters are certifi ed. Materials furnished to McCrometer include a certifi ed material test report (CMTR) from the original material manufacturer. The test reports include material composition and applicable material grades. Upon request copies of the material test reports can be supplied to our customers. See section 6.5 for typical materials of construc-tion.
3.7 Valve Manifolds
McCrometer recommends a three valve or fi ve valve manifold as part of a V-Cone fl ow measure-ment system. Manifolds allow for in-line transmitter calibrations, isolation of the transmitter from the transmission lines, without depressurizing the line, and in-line purging of transmission lines.
6. Fluid Properties – Fluid properties such as velocity, compressibility and isentropic exponent vary with temperature and to some extent pressure. The viscosity in the calculations above could effect the selected CD value, the compressibility directly effects the density and the isentropic exponent effects the Y factor, although to a small degree. The instrumentation industry uses many different approaches to calculate fl ow. McCrometer application engineering and the customer must determine which fl uid properties are calculated at each set of fl ow conditions and which properties are constant.
Figure 10
Calibration Facility 40k Gravimetric
Figure 9
Copyright © 1992-2010 McCrometer, Inc. All printed material should not be changed or altered without permission of McCrometer. Any published technical data and instructions are subject to change without notice. Contact your McCrometer representative for current technical data and instructions.
www.mccrometer.com
3255 WEST STETSON AVENUE • HEMET, CALIFORNIA 92545 USATEL: 951-652-6811 • 800-220-2279 • FAX: 951-652-3078 Printed In The U.S.A. Lit. # 24509-15 Rev. 3.9/04-10
9
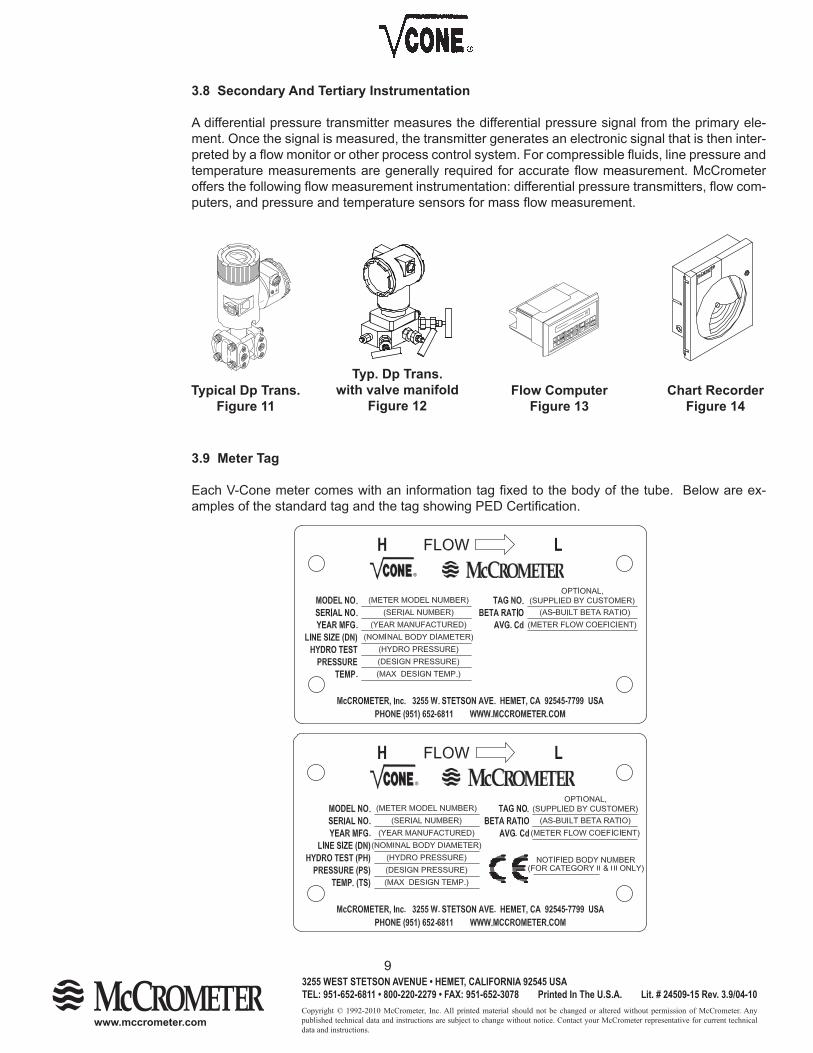
3.8 Secondary And Tertiary Instrumentation
A differential pressure transmitter measures the differential pressure signal from the primary ele-ment. Once the signal is measured, the transmitter generates an electronic signal that is then inter-preted by a fl ow monitor or other process control system. For compressible fl uids, line pressure and temperature measurements are generally required for accurate fl ow measurement. McCrometer offers the following fl ow measurement instrumentation: differential pressure transmitters, fl ow com-puters, and pressure and temperature sensors for mass fl ow measurement.
Typical Dp Trans.Figure 11
Typ. Dp Trans.with valve manifold
Figure 12Flow Computer
Figure 13Chart Recorder
Figure 14
3.9 Meter Tag
Each V-Cone meter comes with an information tag fi xed to the body of the tube. Below are ex-amples of the standard tag and the tag showing PED Certifi cation.
Copyright © 1992-2010 McCrometer, Inc. All printed material should not be changed or altered without permission of McCrometer. Any published technical data and instructions are subject to change without notice. Contact your McCrometer representative for current technical data and instructions.
www.mccrometer.com
3255 WEST STETSON AVENUE • HEMET, CALIFORNIA 92545 USATEL: 951-652-6811 • 800-220-2279 • FAX: 951-652-3078 Printed In The U.S.A. Lit. # 24509-15 Rev. 3.9/04-10
10
4.1 Scope
This section provides recommendations for impulse tubing connections allowing the differential pressure generated by the V-Cone to be transmitted to the secondary device, normally a Differen-tial Pressure Transmitter. The connection methods are designed to minimize errors in the pressure signal.
4.2 Safety
The differential pressure signal must be transmitted in a safe manner, within piping, tubing, or the manifold block, to the secondary device. The fl uid between the primary and secondary device must be safely contained. Safe containment of the fl uid requires strict adherence to the applicable standards and codes, proper materials selection, including the gaskets, and acceptable fabrication methodology.
• Any person installing, inspecting, or maintaining a McCrometer fl owmeter should have an under standing of piping confi gurations and systems under pressure.• The high and low pressure ports and/or optional instrumentation ports may be fi tted with plastic thread protector plugs. These must be removed prior to pressurizing the system. Failure to do so may result in serious injury.• Before adjusting or removing any meter, be certain the system has been depressurized completely. Never attempt to remove a meter under pressure!• Be careful when lifting meters. Meters can cause serious injury if lifted incorrectly or dropped.• Use only necessary and appropriate tools when working on a meter. • Properly secure all connections before starting a system. Keep a safe and prudent distance away from the meter during system start-up.• Meters used in oil & gas or fl ammable service require a ground wire connection to arrest any static electricity discharge.
4.3 Unpacking
McCrometer tests and inspects all products during manufacture and before shipment. However, inspect the meter and accessories at the time of unpacking to detect any damage that might have occurred during shipment. If there is a question regarding the paperwork or the fl owmeter, please contact your McCrometer representative.
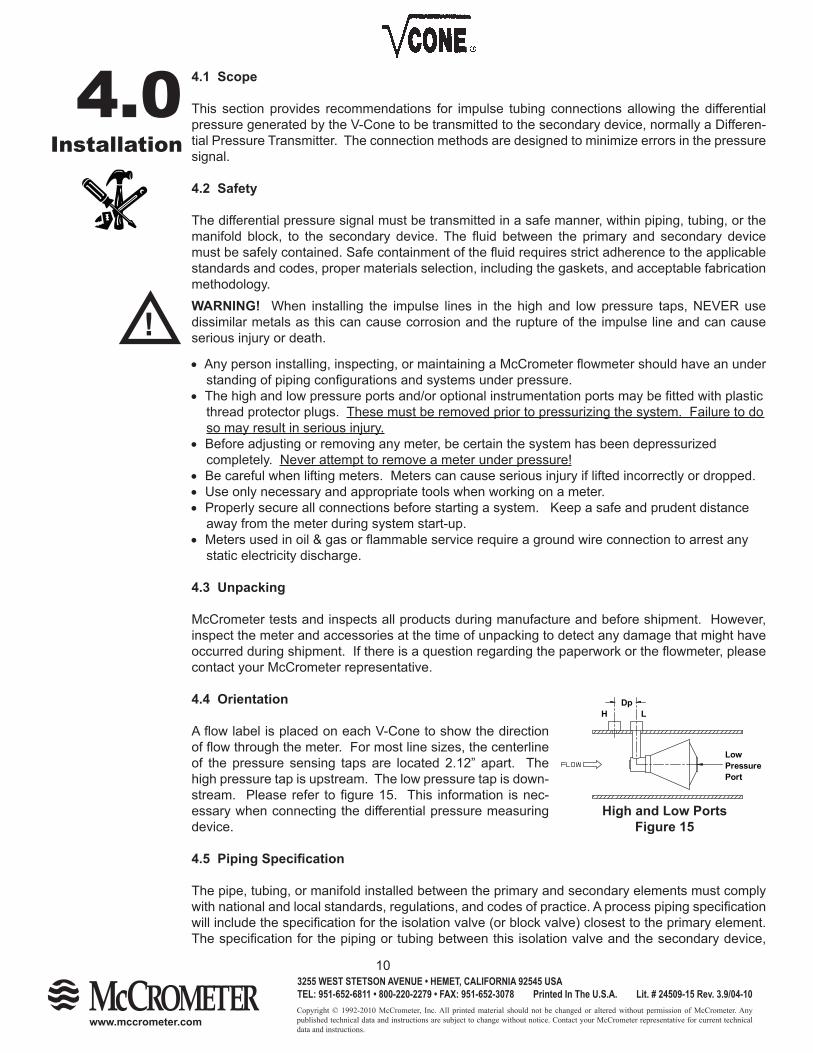
4.4 Orientation
A fl ow label is placed on each V-Cone to show the direction of fl ow through the meter. For most line sizes, the centerline of the pressure sensing taps are located 2.12” apart. The high pressure tap is upstream. The low pressure tap is down-stream. Please refer to fi gure 15. This information is nec-essary when connecting the differential pressure measuring device.
4.5 Piping Specifi cation
The pipe, tubing, or manifold installed between the primary and secondary elements must comply with national and local standards, regulations, and codes of practice. A process piping specifi cation will include the specifi cation for the isolation valve (or block valve) closest to the primary element. The specifi cation for the piping or tubing between this isolation valve and the secondary device,
Dp
LowPressurePort
H L
High and Low PortsFigure 15
4.0
Installation
!WARNING! When installing the impulse lines in the high and low pressure taps, NEVER use dissimilar metals as this can cause corrosion and the rupture of the impulse line and can cause serious injury or death.
Copyright © 1992-2010 McCrometer, Inc. All printed material should not be changed or altered without permission of McCrometer. Any published technical data and instructions are subject to change without notice. Contact your McCrometer representative for current technical data and instructions.
www.mccrometer.com
3255 WEST STETSON AVENUE • HEMET, CALIFORNIA 92545 USATEL: 951-652-6811 • 800-220-2279 • FAX: 951-652-3078 Printed In The U.S.A. Lit. # 24509-15 Rev. 3.9/04-10
11
including any additional valves, may differ from the piping specifi cation for the root (primary) isola-tion valves. The smaller size and lower temperatures in the impulse lines often justify these differ-ences.An approved hydrostatic test or pneumatic test may be required for piping systems to prove the integrity of the pressure containing parts of the system.
The break (change) in piping specifi cation between the process (primary) and the instrument ( sec-ondary) side is normally at the process isolation valve (root valve) at its secondary connection end. If fl anged, then the specifi cation break will occur at the mating face of the secondary side fl ange.
4.6 Piping Requirements
The recommended straight, unobstructed pipe run upstream of a V-Cone is zero to three diam-eters. The recommended run downstream of a V-Cone is zero to one diameter. “Diameter” here refers to the nominal pipe size of the pipe run.
McCrometer, along with several independent testing facilities, has tested the V-Cone in several common piping confi gurations. These tests have proven the V-Cone to be within accuracy speci-fi cations even when close coupled with single 90° elbows or double 90° elbows out-of-plane. The V-Cone can also be used in lines slightly larger than the meter tube.
In applications where the meter tube is larger than the adjacent line, such as with cement lined pip-ing, the user should consult the factory for additional installation requirements.
4.7 Tap Locations
For piping in a horizontal plane, McCrometer recommends the taps be placed on the sides of the pipe in either the three or the nine o’clock position. In vertical pipes, the tap locations are not sig-nifi cant.
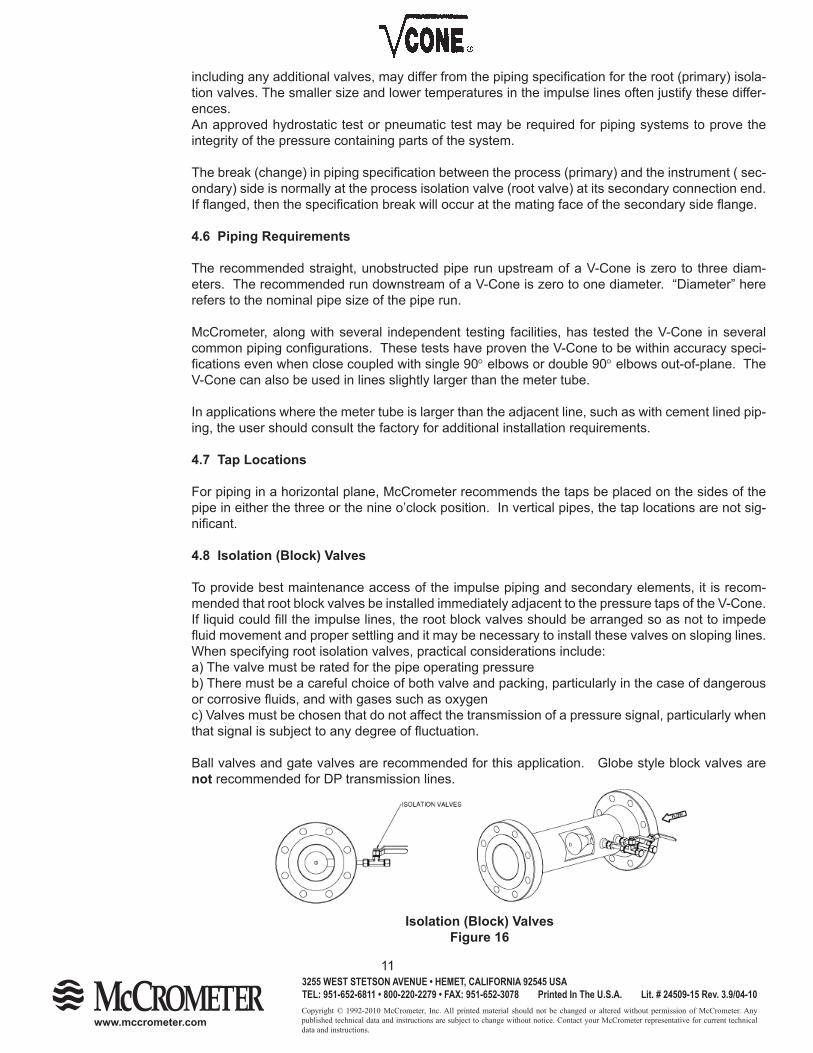
4.8 Isolation (Block) Valves
To provide best maintenance access of the impulse piping and secondary elements, it is recom-mended that root block valves be installed immediately adjacent to the pressure taps of the V-Cone. If liquid could fi ll the impulse lines, the root block valves should be arranged so as not to impede fl uid movement and proper settling and it may be necessary to install these valves on sloping lines. When specifying root isolation valves, practical considerations include:a) The valve must be rated for the pipe operating pressureb) There must be a careful choice of both valve and packing, particularly in the case of dangerous or corrosive fl uids, and with gases such as oxygenc) Valves must be chosen that do not affect the transmission of a pressure signal, particularly when that signal is subject to any degree of fl uctuation.
Ball valves and gate valves are recommended for this application. Globe style block valves are not recommended for DP transmission lines.
Isolation (Block) ValvesFigure 16
Copyright © 1992-2010 McCrometer, Inc. All printed material should not be changed or altered without permission of McCrometer. Any published technical data and instructions are subject to change without notice. Contact your McCrometer representative for current technical data and instructions.
www.mccrometer.com
3255 WEST STETSON AVENUE • HEMET, CALIFORNIA 92545 USATEL: 951-652-6811 • 800-220-2279 • FAX: 951-652-3078 Printed In The U.S.A. Lit. # 24509-15 Rev. 3.9/04-10
12
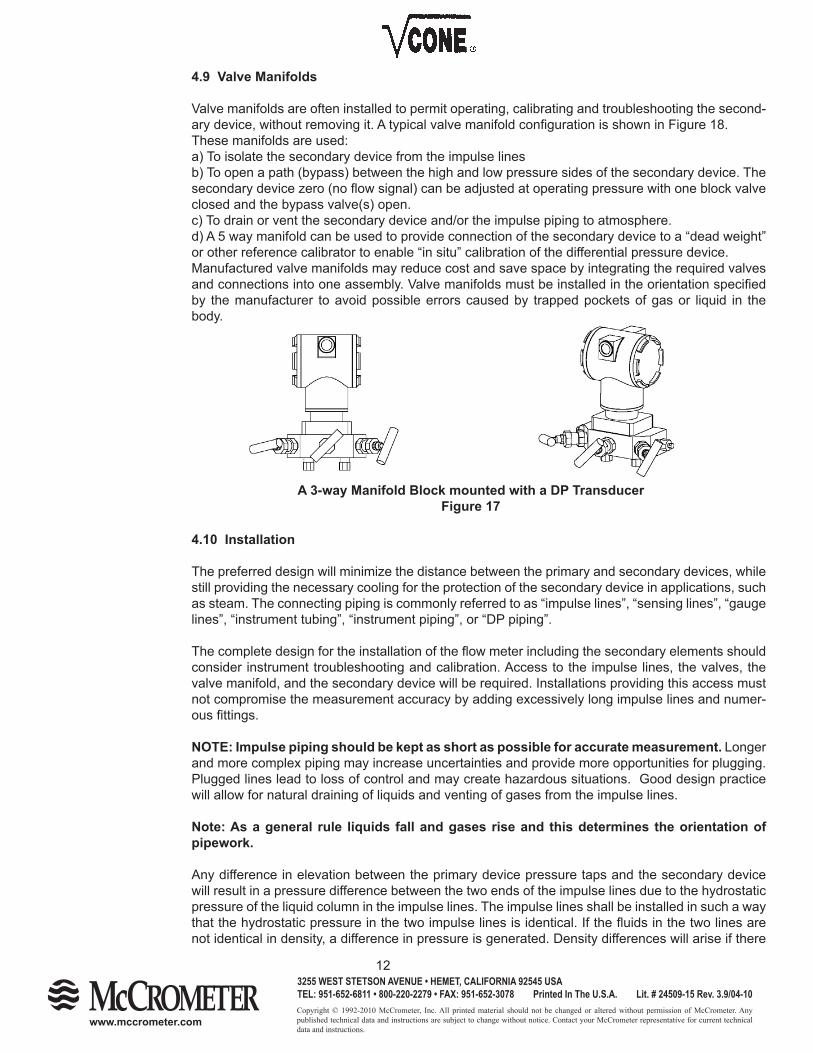
4.9 Valve Manifolds
Valve manifolds are often installed to permit operating, calibrating and troubleshooting the second-ary device, without removing it. A typical valve manifold confi guration is shown in Figure 18.These manifolds are used:a) To isolate the secondary device from the impulse linesb) To open a path (bypass) between the high and low pressure sides of the secondary device. The secondary device zero (no fl ow signal) can be adjusted at operating pressure with one block valve closed and the bypass valve(s) open.c) To drain or vent the secondary device and/or the impulse piping to atmosphere.d) A 5 way manifold can be used to provide connection of the secondary device to a “dead weight” or other reference calibrator to enable “in situ” calibration of the differential pressure device.Manufactured valve manifolds may reduce cost and save space by integrating the required valves and connections into one assembly. Valve manifolds must be installed in the orientation specifi ed by the manufacturer to avoid possible errors caused by trapped pockets of gas or liquid in the body.
4.10 Installation
The preferred design will minimize the distance between the primary and secondary devices, while still providing the necessary cooling for the protection of the secondary device in applications, such as steam. The connecting piping is commonly referred to as “impulse lines”, “sensing lines”, “gauge lines”, “instrument tubing”, “instrument piping”, or “DP piping”.
The complete design for the installation of the fl ow meter including the secondary elements should consider instrument troubleshooting and calibration. Access to the impulse lines, the valves, the valve manifold, and the secondary device will be required. Installations providing this access must not compromise the measurement accuracy by adding excessively long impulse lines and numer-ous fi ttings.
NOTE: Impulse piping should be kept as short as possible for accurate measurement. Longer and more complex piping may increase uncertainties and provide more opportunities for plugging. Plugged lines lead to loss of control and may create hazardous situations. Good design practice will allow for natural draining of liquids and venting of gases from the impulse lines.
Note: As a general rule liquids fall and gases rise and this determines the orientation of pipework.
Any difference in elevation between the primary device pressure taps and the secondary device will result in a pressure difference between the two ends of the impulse lines due to the hydrostatic pressure of the liquid column in the impulse lines. The impulse lines shall be installed in such a way that the hydrostatic pressure in the two impulse lines is identical. If the fl uids in the two lines are not identical in density, a difference in pressure is generated. Density differences will arise if there
A 3-way Manifold Block mounted with a DP TransducerFigure 17
Copyright © 1992-2010 McCrometer, Inc. All printed material should not be changed or altered without permission of McCrometer. Any published technical data and instructions are subject to change without notice. Contact your McCrometer representative for current technical data and instructions.
www.mccrometer.com
3255 WEST STETSON AVENUE • HEMET, CALIFORNIA 92545 USATEL: 951-652-6811 • 800-220-2279 • FAX: 951-652-3078 Printed In The U.S.A. Lit. # 24509-15 Rev. 3.9/04-10
13
is a temperature difference between the fl uids in the two impulse lines. It is recommended that, if possible, the two impulse lines are fastened together, and if insulated, they are insulated together. Non-identical fl uids in the two impulse lines can also give rise to density differences and should be avoided.
4.11 Pressure Taps
The pressure tap is part of the primary device. The line pressure, required for the calculation of fl ow rate, is measured from the upstream pressure tap.
4.12 Remote Seals or Chemical Seals
In very dirty services, pre-fi lled physical barrier diaphragm seals, called remote seals or chemical seals, can be used. Defl ection of the diaphragm requires some additional force that must be con-sidered in the calibration process. For most DP meters, diaphragms add signifi cant uncertainty to the meter reading.
Errors are reduced with larger diaphragms and good design. To ensure measurement sensitivity, diaphragms are typically 3” or 4” (80 or 100 mm) in diameter. It is recommended that the impulse lines or capillary tubes to remote seals be of identical length and be arranged to reduce exposure to different temperatures
4.13 Impulse Line Size: General
The required diameter of impulse lines depends on service conditions. The bore should not be smaller than ¼” (6 mm) and should preferably be at least 3/8” (10 mm). The internal diameter shall preferably not exceed 1” (25 mm). For steam applications 3/8” (10mm) to 1” (25mm) should be used. Most instrument tubing is 316 SS but for offshore applications Duplex Steel may well be the preferred material to avoid salt spray corrosion of the piping. Note: In all cases, chemical compatibility with the environment and process medium is para-mount.
4.14 Impulse Line Size: Process IndustriesIn most process control applications, the primary concern is reliability. If the pressure taps or the impulse lines plug, then the DP signal is lost. This may result in a dangerous or expensive loss of control. High reliability is required for fl ow signals used in process safety management. A mini-mum I.D. of 5/8” (16 mm) is recommended in industrial applications. Some users even specify ¾” (18 mm) as the minimum I.D. For high temperatures in condensing vapor service, 1” (25 mm) is specifi ed to allow for unimpeded fl ow of condensate. In small piping and with clean fl uids, appropri-ate smaller sizes may be used.
4.15 Impulse Line Size: Steam Applications
Steam temperatures could be as high as 1500o F (815 o C), which is much higher than can be toler-ated by a standard DP transmitter. The standard differential pressure transducer can only tolerate a temperature of approximately 200o F (93 o C). To isolate the transducer from the very high tem-peratures the common techniques are to install a condensate pot in the line or to have a suffi ciently long DP leg to allow for sensing leg cooling prior to the transmitter. To ensure that the DP transmitter is not exposed to excessive temperatures the impulse line length needs to have a length such that the temperature is below 200o F (93o C) at the trans-ducer. A guideline to achieve that is to work on the basis of a temperature drop of 100o F (38o C) per foot (305mm) of impulse piping. However, the operator must ensure that for the particular local set of conditions the required temperature at the transmitter is achieved.
Copyright © 1992-2010 McCrometer, Inc. All printed material should not be changed or altered without permission of McCrometer. Any published technical data and instructions are subject to change without notice. Contact your McCrometer representative for current technical data and instructions.
www.mccrometer.com
3255 WEST STETSON AVENUE • HEMET, CALIFORNIA 92545 USATEL: 951-652-6811 • 800-220-2279 • FAX: 951-652-3078 Printed In The U.S.A. Lit. # 24509-15 Rev. 3.9/04-10
14
4.16 Insulation
Some hot or very cold lines require thermal insulation for personnel protection. It may also be necessary to insulate and “heat trace” the impulse lines to avoid freezing or unintended condensa-tion. The amount of heat used must avoid the undesired vaporizing of liquids in liquid fi lled lines, or the prevention of condensation with condensable vapors. Bundling the impulse lines together so that the impulse lines will be at approximately the same temperature is preferred. Having the DP transmitter in a temperature controlled Instrument Housing is good practice for accurate metering in an environment exposed to large temperature variations such as an offshore platform or a desert site.
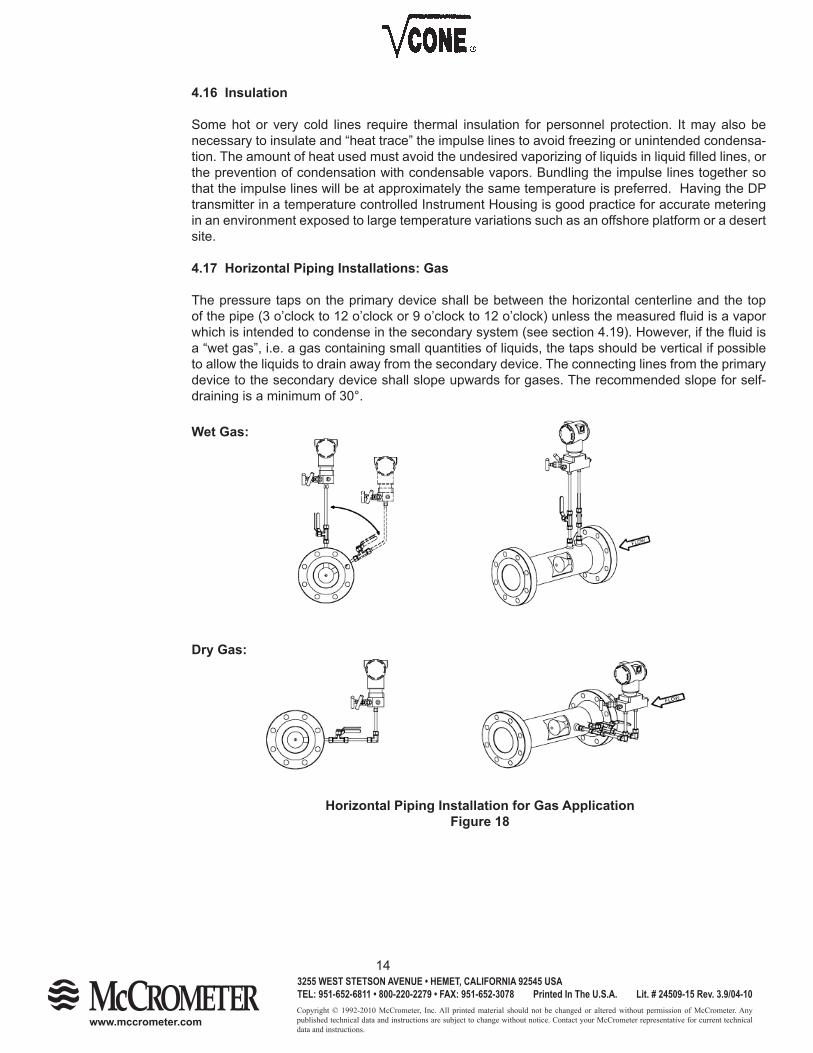
4.17 Horizontal Piping Installations: Gas
The pressure taps on the primary device shall be between the horizontal centerline and the top of the pipe (3 o’clock to 12 o’clock or 9 o’clock to 12 o’clock) unless the measured fl uid is a vapor which is intended to condense in the secondary system (see section 4.19). However, if the fl uid is a “wet gas”, i.e. a gas containing small quantities of liquids, the taps should be vertical if possible to allow the liquids to drain away from the secondary device. The connecting lines from the primary device to the secondary device shall slope upwards for gases. The recommended slope for self-draining is a minimum of 30°.
Wet Gas:
Dry Gas:
Horizontal Piping Installation for Gas ApplicationFigure 18
Copyright © 1992-2010 McCrometer, Inc. All printed material should not be changed or altered without permission of McCrometer. Any published technical data and instructions are subject to change without notice. Contact your McCrometer representative for current technical data and instructions.
www.mccrometer.com
3255 WEST STETSON AVENUE • HEMET, CALIFORNIA 92545 USATEL: 951-652-6811 • 800-220-2279 • FAX: 951-652-3078 Printed In The U.S.A. Lit. # 24509-15 Rev. 3.9/04-10
15
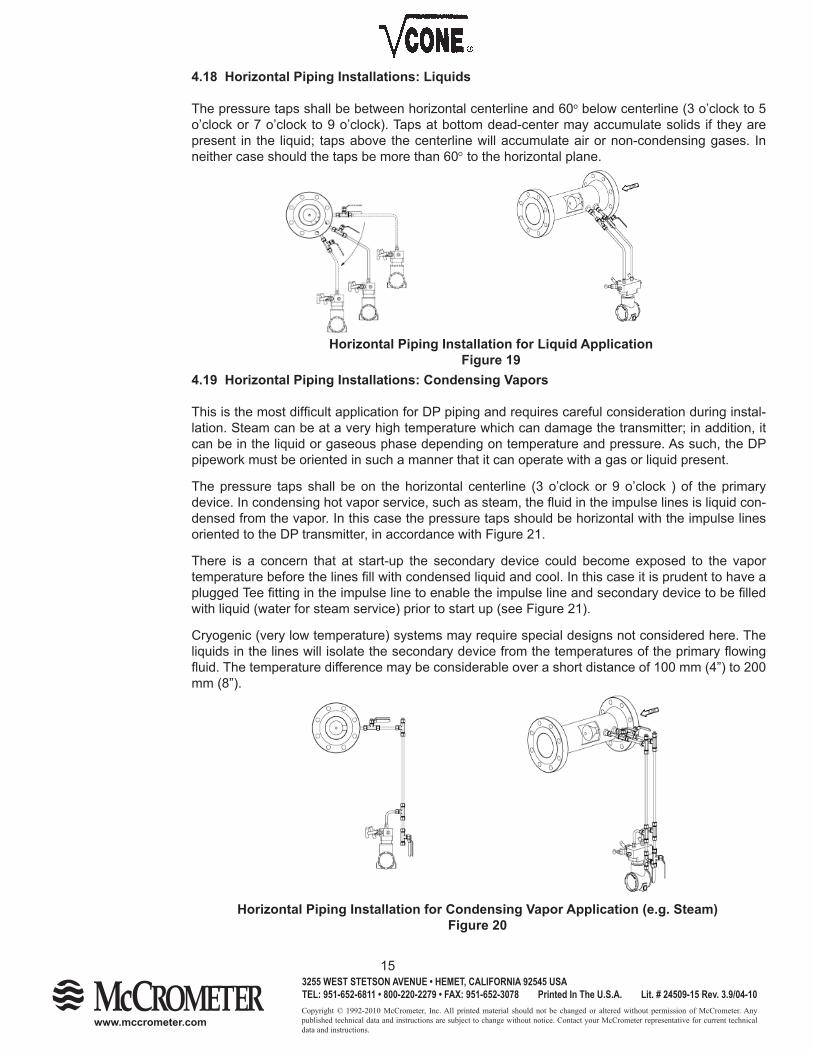
4.18 Horizontal Piping Installations: Liquids
The pressure taps shall be between horizontal centerline and 60o below centerline (3 o’clock to 5 o’clock or 7 o’clock to 9 o’clock). Taps at bottom dead-center may accumulate solids if they are present in the liquid; taps above the centerline will accumulate air or non-condensing gases. In neither case should the taps be more than 60° to the horizontal plane.
4.19 Horizontal Piping Installations: Condensing Vapors
This is the most diffi cult application for DP piping and requires careful consideration during instal-lation. Steam can be at a very high temperature which can damage the transmitter; in addition, it can be in the liquid or gaseous phase depending on temperature and pressure. As such, the DP pipework must be oriented in such a manner that it can operate with a gas or liquid present.
The pressure taps shall be on the horizontal centerline (3 o’clock or 9 o’clock ) of the primary device. In condensing hot vapor service, such as steam, the fl uid in the impulse lines is liquid con-densed from the vapor. In this case the pressure taps should be horizontal with the impulse lines oriented to the DP transmitter, in accordance with Figure 21.
There is a concern that at start-up the secondary device could become exposed to the vapor temperature before the lines fi ll with condensed liquid and cool. In this case it is prudent to have a plugged Tee fi tting in the impulse line to enable the impulse line and secondary device to be fi lled with liquid (water for steam service) prior to start up (see Figure 21).
Cryogenic (very low temperature) systems may require special designs not considered here. The liquids in the lines will isolate the secondary device from the temperatures of the primary fl owing fl uid. The temperature difference may be considerable over a short distance of 100 mm (4”) to 200 mm (8”).
Horizontal Piping Installation for Liquid ApplicationFigure 19
Horizontal Piping Installation for Condensing Vapor Application (e.g. Steam)Figure 20
Copyright © 1992-2010 McCrometer, Inc. All printed material should not be changed or altered without permission of McCrometer. Any published technical data and instructions are subject to change without notice. Contact your McCrometer representative for current technical data and instructions.
www.mccrometer.com
3255 WEST STETSON AVENUE • HEMET, CALIFORNIA 92545 USATEL: 951-652-6811 • 800-220-2279 • FAX: 951-652-3078 Printed In The U.S.A. Lit. # 24509-15 Rev. 3.9/04-10
16
4.20 Vertical Piping Installations: General
In the case of vertical pipes there are generally no problems regarding the radial position of pres-sure taps. With the V-Cone care must be taken in the piping arrangement for vertical up fl ow and for vertical down fl ow. In this section vertical down fl ow and vertical up fl ow will be separated. Note: It is generally more diffi cult to arrange the impulse piping in Vertical piping systems to avoid gas trapped in liquid DP lines or liquid trapped in gas DP lines.
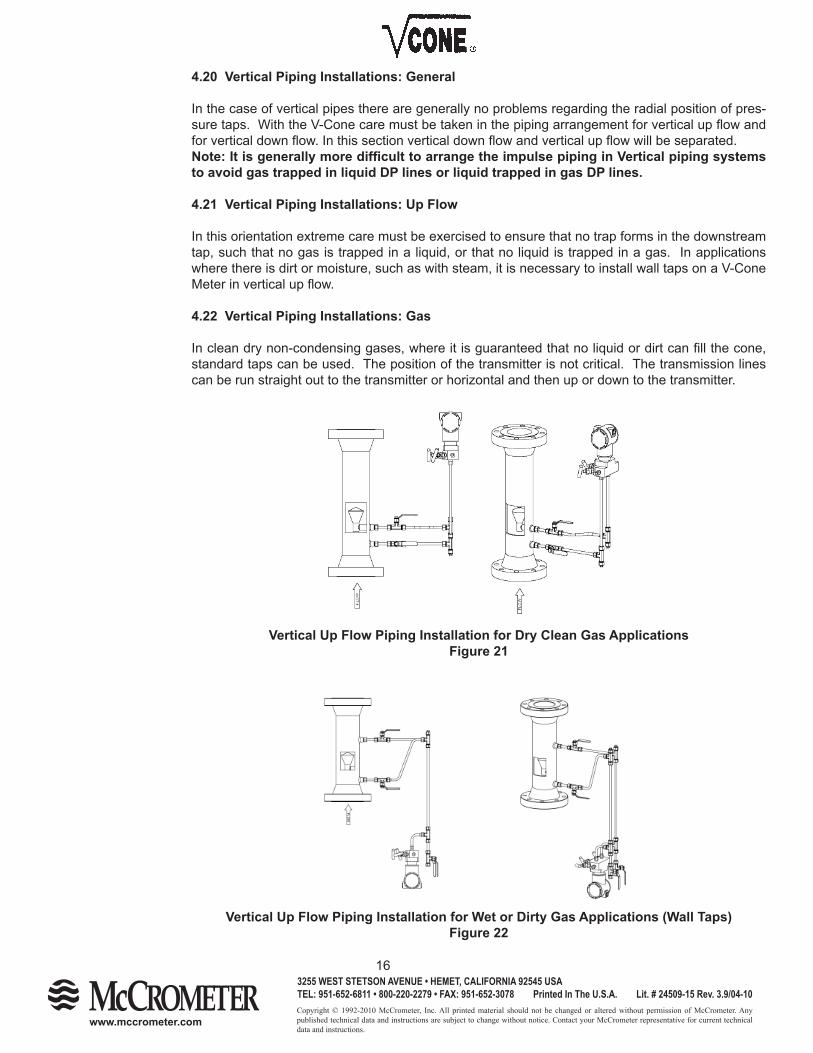
4.21 Vertical Piping Installations: Up Flow
In this orientation extreme care must be exercised to ensure that no trap forms in the downstream tap, such that no gas is trapped in a liquid, or that no liquid is trapped in a gas. In applications where there is dirt or moisture, such as with steam, it is necessary to install wall taps on a V-Cone Meter in vertical up fl ow.
4.22 Vertical Piping Installations: Gas
In clean dry non-condensing gases, where it is guaranteed that no liquid or dirt can fi ll the cone, standard taps can be used. The position of the transmitter is not critical. The transmission lines can be run straight out to the transmitter or horizontal and then up or down to the transmitter.
Vertical Up Flow Piping Installation for Dry Clean Gas ApplicationsFigure 21
Vertical Up Flow Piping Installation for Wet or Dirty Gas Applications (Wall Taps)Figure 22
Copyright © 1992-2010 McCrometer, Inc. All printed material should not be changed or altered without permission of McCrometer. Any published technical data and instructions are subject to change without notice. Contact your McCrometer representative for current technical data and instructions.
www.mccrometer.com
3255 WEST STETSON AVENUE • HEMET, CALIFORNIA 92545 USATEL: 951-652-6811 • 800-220-2279 • FAX: 951-652-3078 Printed In The U.S.A. Lit. # 24509-15 Rev. 3.9/04-10
17
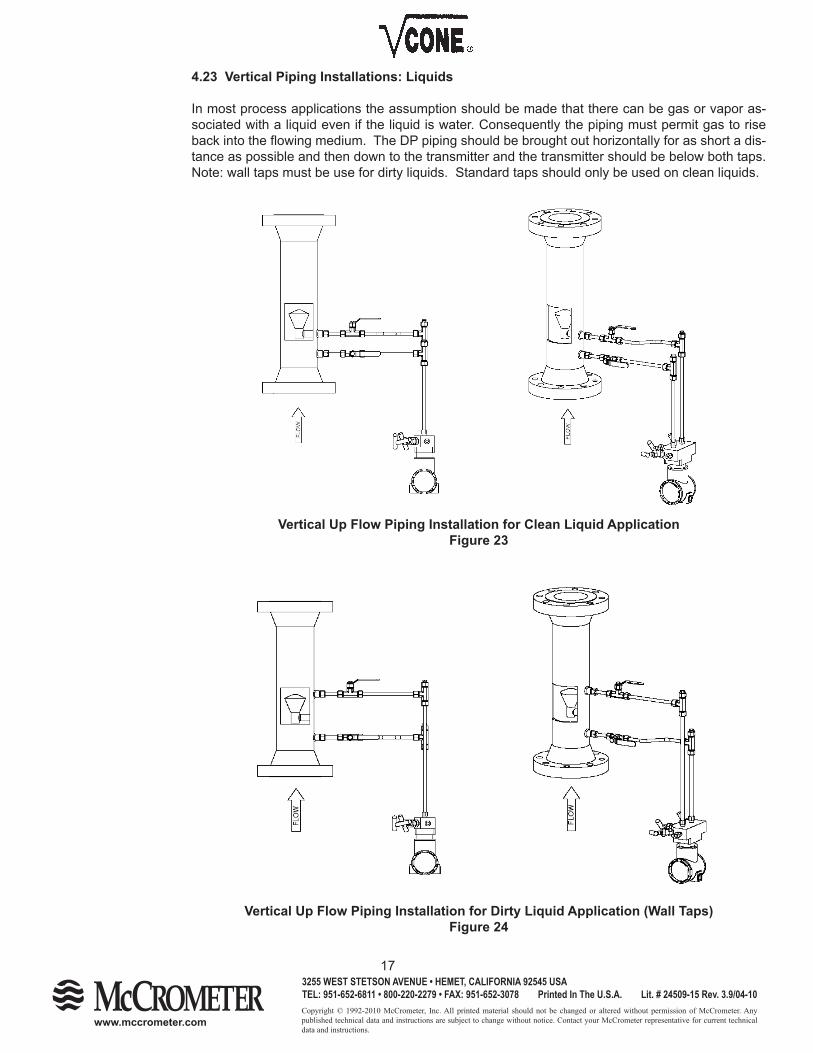
4.23 Vertical Piping Installations: Liquids
In most process applications the assumption should be made that there can be gas or vapor as-sociated with a liquid even if the liquid is water. Consequently the piping must permit gas to rise back into the fl owing medium. The DP piping should be brought out horizontally for as short a dis-tance as possible and then down to the transmitter and the transmitter should be below both taps. Note: wall taps must be use for dirty liquids. Standard taps should only be used on clean liquids.
Vertical Up Flow Piping Installation for Clean Liquid ApplicationFigure 23
Vertical Up Flow Piping Installation for Dirty Liquid Application (Wall Taps)Figure 24
Copyright © 1992-2010 McCrometer, Inc. All printed material should not be changed or altered without permission of McCrometer. Any published technical data and instructions are subject to change without notice. Contact your McCrometer representative for current technical data and instructions.
www.mccrometer.com
3255 WEST STETSON AVENUE • HEMET, CALIFORNIA 92545 USATEL: 951-652-6811 • 800-220-2279 • FAX: 951-652-3078 Printed In The U.S.A. Lit. # 24509-15 Rev. 3.9/04-10
18
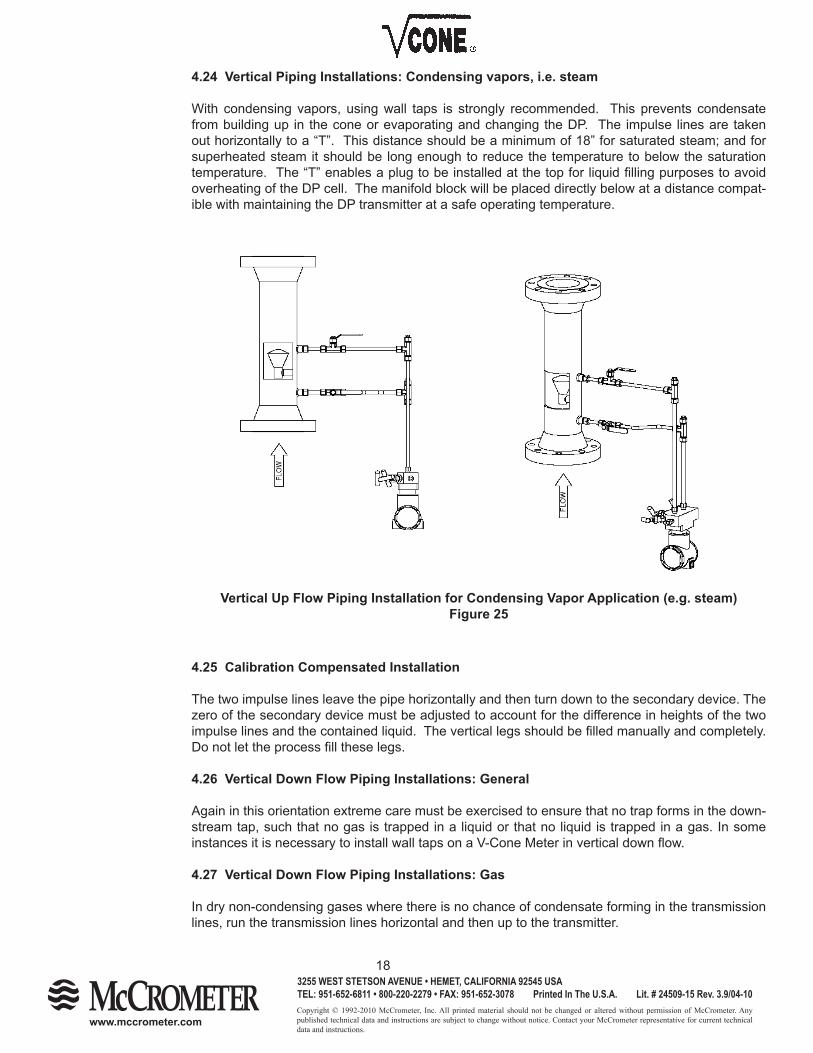
4.24 Vertical Piping Installations: Condensing vapors, i.e. steam
With condensing vapors, using wall taps is strongly recommended. This prevents condensate from building up in the cone or evaporating and changing the DP. The impulse lines are taken out horizontally to a “T”. This distance should be a minimum of 18” for saturated steam; and for superheated steam it should be long enough to reduce the temperature to below the saturation temperature. The “T” enables a plug to be installed at the top for liquid fi lling purposes to avoid overheating of the DP cell. The manifold block will be placed directly below at a distance compat-ible with maintaining the DP transmitter at a safe operating temperature.
4.25 Calibration Compensated Installation
The two impulse lines leave the pipe horizontally and then turn down to the secondary device. The zero of the secondary device must be adjusted to account for the difference in heights of the two impulse lines and the contained liquid. The vertical legs should be fi lled manually and completely. Do not let the process fi ll these legs.
4.26 Vertical Down Flow Piping Installations: General
Again in this orientation extreme care must be exercised to ensure that no trap forms in the down-stream tap, such that no gas is trapped in a liquid or that no liquid is trapped in a gas. In some instances it is necessary to install wall taps on a V-Cone Meter in vertical down fl ow.
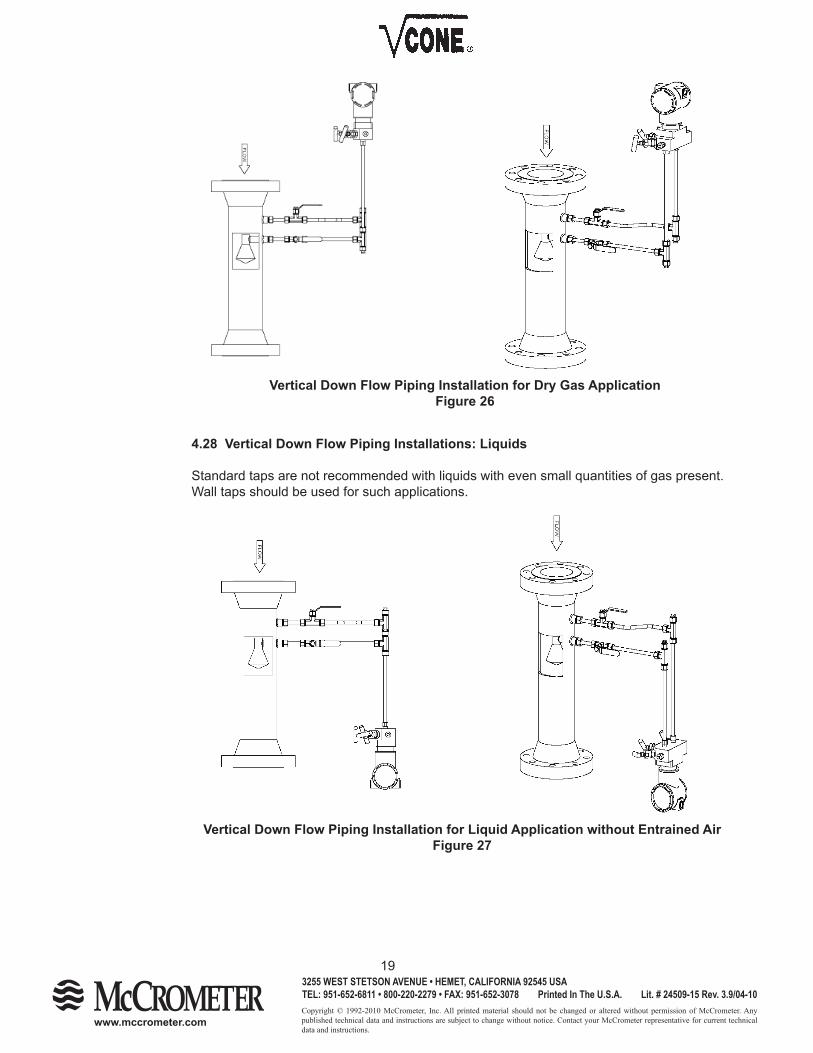
4.27 Vertical Down Flow Piping Installations: Gas
In dry non-condensing gases where there is no chance of condensate forming in the transmission lines, run the transmission lines horizontal and then up to the transmitter.
Vertical Up Flow Piping Installation for Condensing Vapor Application (e.g. steam)Figure 25
Copyright © 1992-2010 McCrometer, Inc. All printed material should not be changed or altered without permission of McCrometer. Any published technical data and instructions are subject to change without notice. Contact your McCrometer representative for current technical data and instructions.
www.mccrometer.com
3255 WEST STETSON AVENUE • HEMET, CALIFORNIA 92545 USATEL: 951-652-6811 • 800-220-2279 • FAX: 951-652-3078 Printed In The U.S.A. Lit. # 24509-15 Rev. 3.9/04-10
19
Vertical Down Flow Piping Installation for Dry Gas ApplicationFigure 26
4.28 Vertical Down Flow Piping Installations: Liquids
Standard taps are not recommended with liquids with even small quantities of gas present. Wall taps should be used for such applications.
Vertical Down Flow Piping Installation for Liquid Application without Entrained AirFigure 27
Copyright © 1992-2010 McCrometer, Inc. All printed material should not be changed or altered without permission of McCrometer. Any published technical data and instructions are subject to change without notice. Contact your McCrometer representative for current technical data and instructions.
www.mccrometer.com
3255 WEST STETSON AVENUE • HEMET, CALIFORNIA 92545 USATEL: 951-652-6811 • 800-220-2279 • FAX: 951-652-3078 Printed In The U.S.A. Lit. # 24509-15 Rev. 3.9/04-10
20
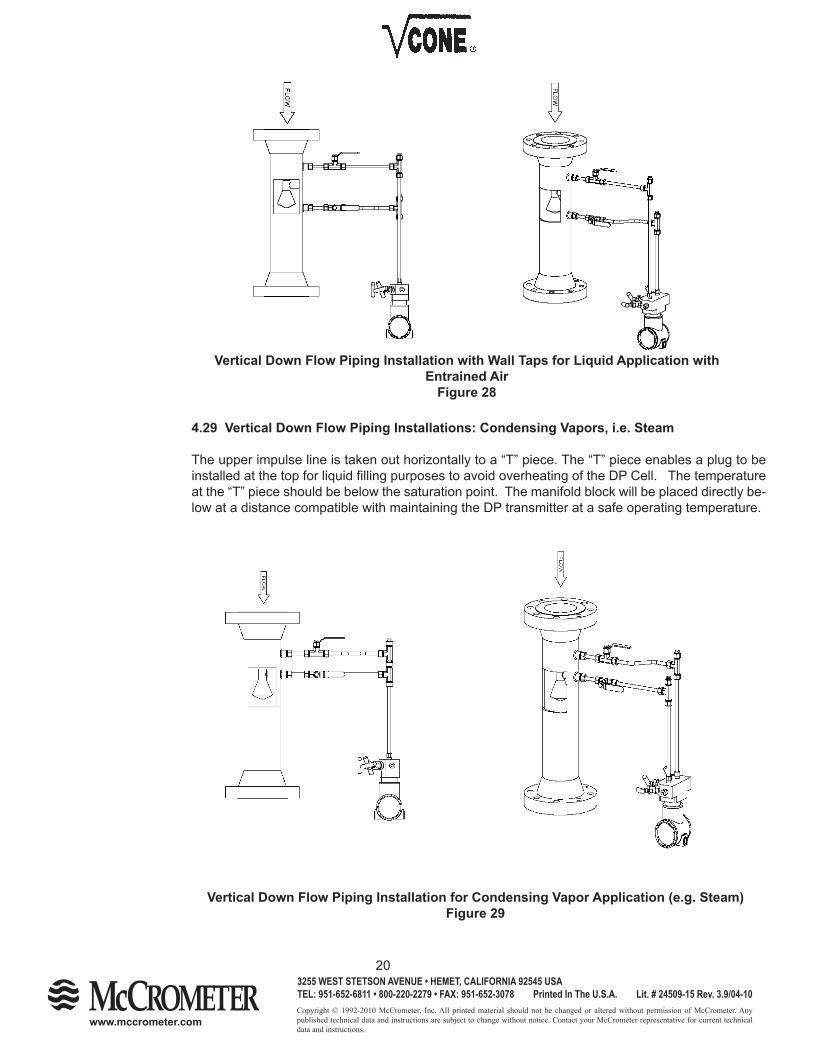
4.29 Vertical Down Flow Piping Installations: Condensing Vapors, i.e. Steam
The upper impulse line is taken out horizontally to a “T” piece. The “T” piece enables a plug to be installed at the top for liquid fi lling purposes to avoid overheating of the DP Cell. The temperature at the “T” piece should be below the saturation point. The manifold block will be placed directly be-low at a distance compatible with maintaining the DP transmitter at a safe operating temperature.
Vertical Down Flow Piping Installation with Wall Taps for Liquid Application with Entrained Air
Figure 28
Vertical Down Flow Piping Installation for Condensing Vapor Application (e.g. Steam)Figure 29
Copyright © 1992-2010 McCrometer, Inc. All printed material should not be changed or altered without permission of McCrometer. Any published technical data and instructions are subject to change without notice. Contact your McCrometer representative for current technical data and instructions.
www.mccrometer.com
3255 WEST STETSON AVENUE • HEMET, CALIFORNIA 92545 USATEL: 951-652-6811 • 800-220-2279 • FAX: 951-652-3078 Printed In The U.S.A. Lit. # 24509-15 Rev. 3.9/04-10
21
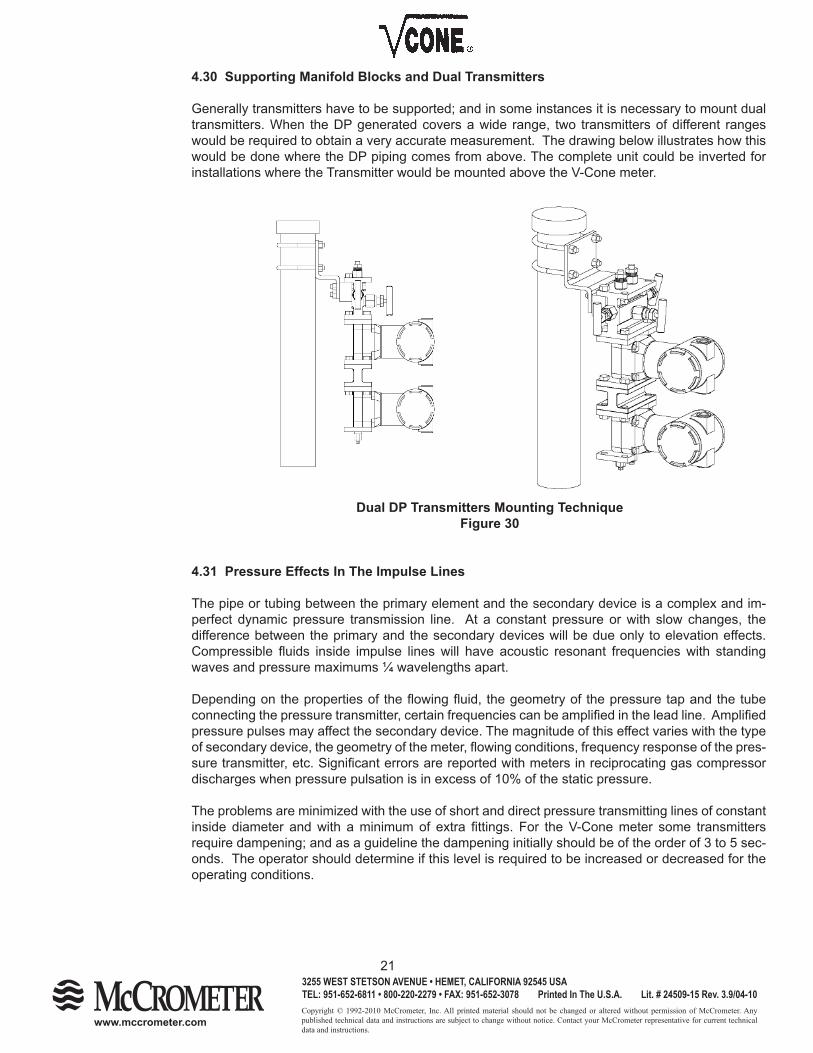
4.30 Supporting Manifold Blocks and Dual Transmitters
Generally transmitters have to be supported; and in some instances it is necessary to mount dual transmitters. When the DP generated covers a wide range, two transmitters of different ranges would be required to obtain a very accurate measurement. The drawing below illustrates how this would be done where the DP piping comes from above. The complete unit could be inverted for installations where the Transmitter would be mounted above the V-Cone meter.
4.31 Pressure Effects In The Impulse Lines
The pipe or tubing between the primary element and the secondary device is a complex and im-perfect dynamic pressure transmission line. At a constant pressure or with slow changes, the difference between the primary and the secondary devices will be due only to elevation effects. Compressible fl uids inside impulse lines will have acoustic resonant frequencies with standing waves and pressure maximums ¼ wavelengths apart.
Depending on the properties of the fl owing fl uid, the geometry of the pressure tap and the tube connecting the pressure transmitter, certain frequencies can be amplifi ed in the lead line. Amplifi ed pressure pulses may affect the secondary device. The magnitude of this effect varies with the type of secondary device, the geometry of the meter, fl owing conditions, frequency response of the pres-sure transmitter, etc. Signifi cant errors are reported with meters in reciprocating gas compressor discharges when pressure pulsation is in excess of 10% of the static pressure.
The problems are minimized with the use of short and direct pressure transmitting lines of constant inside diameter and with a minimum of extra fi ttings. For the V-Cone meter some transmitters require dampening; and as a guideline the dampening initially should be of the order of 3 to 5 sec-onds. The operator should determine if this level is required to be increased or decreased for the operating conditions.
Dual DP Transmitters Mounting TechniqueFigure 30
Copyright © 1992-2010 McCrometer, Inc. All printed material should not be changed or altered without permission of McCrometer. Any published technical data and instructions are subject to change without notice. Contact your McCrometer representative for current technical data and instructions.
www.mccrometer.com
3255 WEST STETSON AVENUE • HEMET, CALIFORNIA 92545 USATEL: 951-652-6811 • 800-220-2279 • FAX: 951-652-3078 Printed In The U.S.A. Lit. # 24509-15 Rev. 3.9/04-10
22
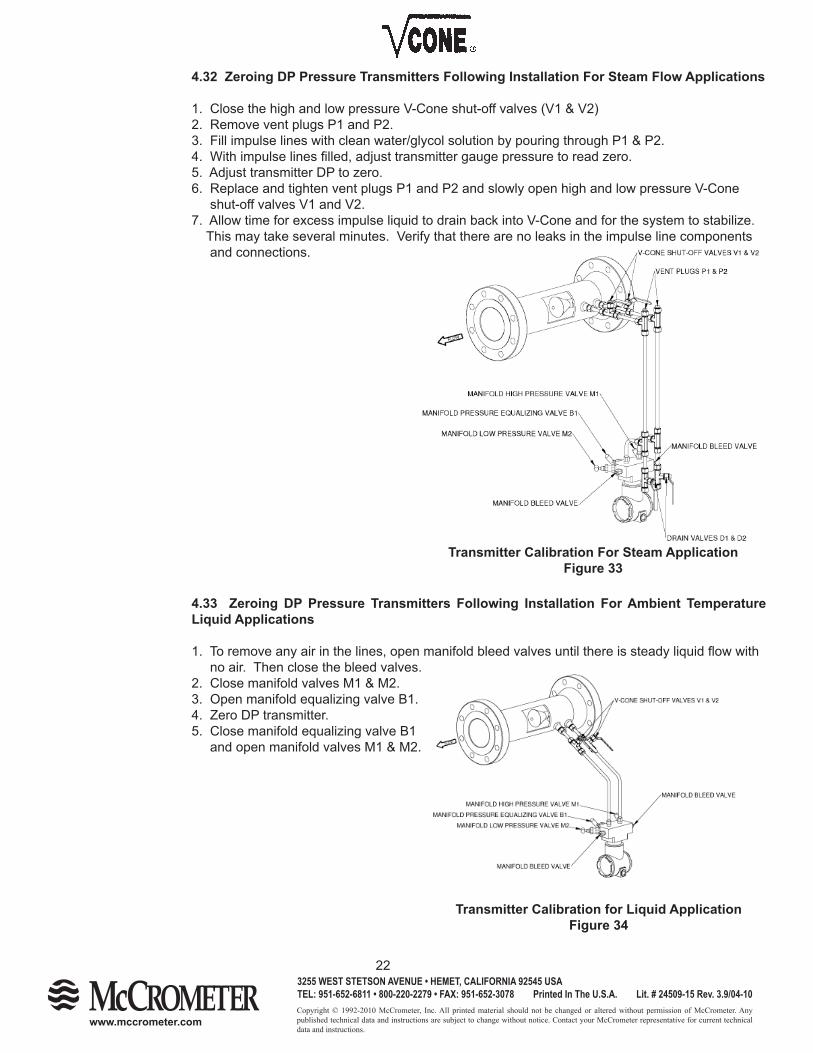
4.32 Zeroing DP Pressure Transmitters Following Installation For Steam Flow Applications
1. Close the high and low pressure V-Cone shut-off valves (V1 & V2) 2. Remove vent plugs P1 and P2.3. Fill impulse lines with clean water/glycol solution by pouring through P1 & P2. 4. With impulse lines fi lled, adjust transmitter gauge pressure to read zero.5. Adjust transmitter DP to zero.6. Replace and tighten vent plugs P1 and P2 and slowly open high and low pressure V-Cone shut-off valves V1 and V2.7. Allow time for excess impulse liquid to drain back into V-Cone and for the system to stabilize. This may take several minutes. Verify that there are no leaks in the impulse line components and connections.
4.33 Zeroing DP Pressure Transmitters Following Installation For Ambient Temperature Liquid Applications
1. To remove any air in the lines, open manifold bleed valves until there is steady liquid fl ow with no air. Then close the bleed valves. 2. Close manifold valves M1 & M2. 3. Open manifold equalizing valve B1.4. Zero DP transmitter.5. Close manifold equalizing valve B1 and open manifold valves M1 & M2.
Transmitter Calibration For Steam ApplicationFigure 33
Transmitter Calibration for Liquid ApplicationFigure 34
Copyright © 1992-2010 McCrometer, Inc. All printed material should not be changed or altered without permission of McCrometer. Any published technical data and instructions are subject to change without notice. Contact your McCrometer representative for current technical data and instructions.
www.mccrometer.com
3255 WEST STETSON AVENUE • HEMET, CALIFORNIA 92545 USATEL: 951-652-6811 • 800-220-2279 • FAX: 951-652-3078 Printed In The U.S.A. Lit. # 24509-15 Rev. 3.9/04-10
23
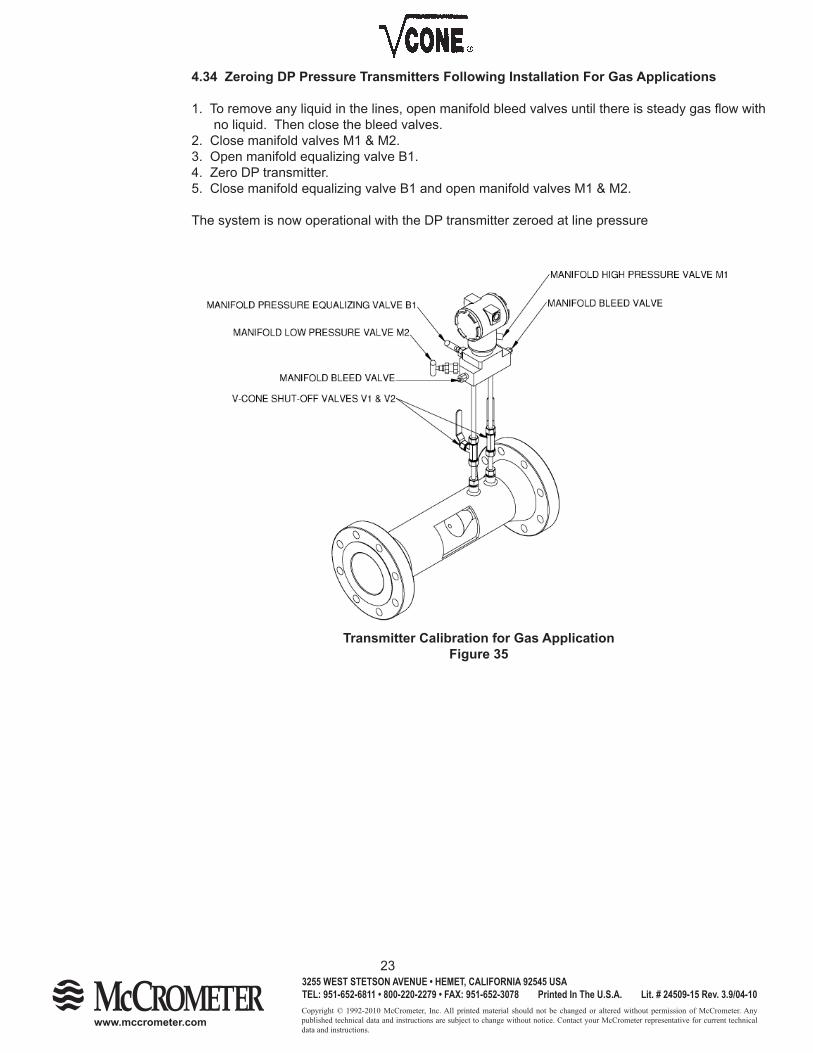
4.34 Zeroing DP Pressure Transmitters Following Installation For Gas Applications
1. To remove any liquid in the lines, open manifold bleed valves until there is steady gas fl ow with no liquid. Then close the bleed valves. 2. Close manifold valves M1 & M2. 3. Open manifold equalizing valve B1.4. Zero DP transmitter.5. Close manifold equalizing valve B1 and open manifold valves M1 & M2.
The system is now operational with the DP transmitter zeroed at line pressure
Transmitter Calibration for Gas ApplicationFigure 35
Copyright © 1992-2010 McCrometer, Inc. All printed material should not be changed or altered without permission of McCrometer. Any published technical data and instructions are subject to change without notice. Contact your McCrometer representative for current technical data and instructions.
www.mccrometer.com
3255 WEST STETSON AVENUE • HEMET, CALIFORNIA 92545 USATEL: 951-652-6811 • 800-220-2279 • FAX: 951-652-3078 Printed In The U.S.A. Lit. # 24509-15 Rev. 3.9/04-10
24
4.35 Differential Pressure Measurement
With current technology the differential pressure is normally measured with a differential pressure transmitter. These transmitters may simply record the differential pressure and provide a 4-20mA signal to a fl ow computer or to DCS system.
McCrometer does not show any preference to the differential pressure transducer manufacturer. However, McCrometer has worked with the transducer suppliers which produce intelligent devices which require the V-Cone algorithms to generate a fl ow rate rather than a differential pressure output. Such cooperation has taken place with Foxboro and Rosemount.
Note: It is absolutely essential that the DP transducer is ranged for the specifi c V-Cone meter. Each meter will produce a range of differential pressure and the transducer must cover that range e.g. a V-cone with a max. fl ow producing 230 inch water column would use a 250 inch or 300 inch DP transducer and would be spanned for 230 inches. The DP transducer must also be selected for the operating pressure and temperature of the metering application. It is also necessary that the DP transducer will cover the lower range of the DP produced accurately. DP transducers are notoriously inaccurate at the bottom end of the range. For fl ow ranges over 10:1, stacking transmitters is recommended. Stacking transmitters is a system with two transmitters where one measures the low DPs and the other measures the high DPs.
4.36 Temperature And Pressure Measurement
In the fl ow measurement calculation for all DP devices it is necessary to included the temperature and pressure measured upstream of the meter. For accurate temperature measurement for orifi ce metering, (which are very susceptible to upstream disturbances from items such as thermo wells), it has been necessary to install the thermo well downstream and make a correction to the upstream condition. In the case of V-Cone meters, which are always calibrated and have very little infl uence by upstream disturbances, the thermo well can be located upstream of the cone and the meter calibrated with the thermo well in position. Not all users measure the temperature via a thermo well, and for stable temperature conditions there has been an increasing tendency to install a thermocouple or temperature probe on the outside of the upstream piping and cover it with insulation.
Copyright © 1992-2010 McCrometer, Inc. All printed material should not be changed or altered without permission of McCrometer. Any published technical data and instructions are subject to change without notice. Contact your McCrometer representative for current technical data and instructions.
www.mccrometer.com
3255 WEST STETSON AVENUE • HEMET, CALIFORNIA 92545 USATEL: 951-652-6811 • 800-220-2279 • FAX: 951-652-3078 Printed In The U.S.A. Lit. # 24509-15 Rev. 3.9/04-10
25
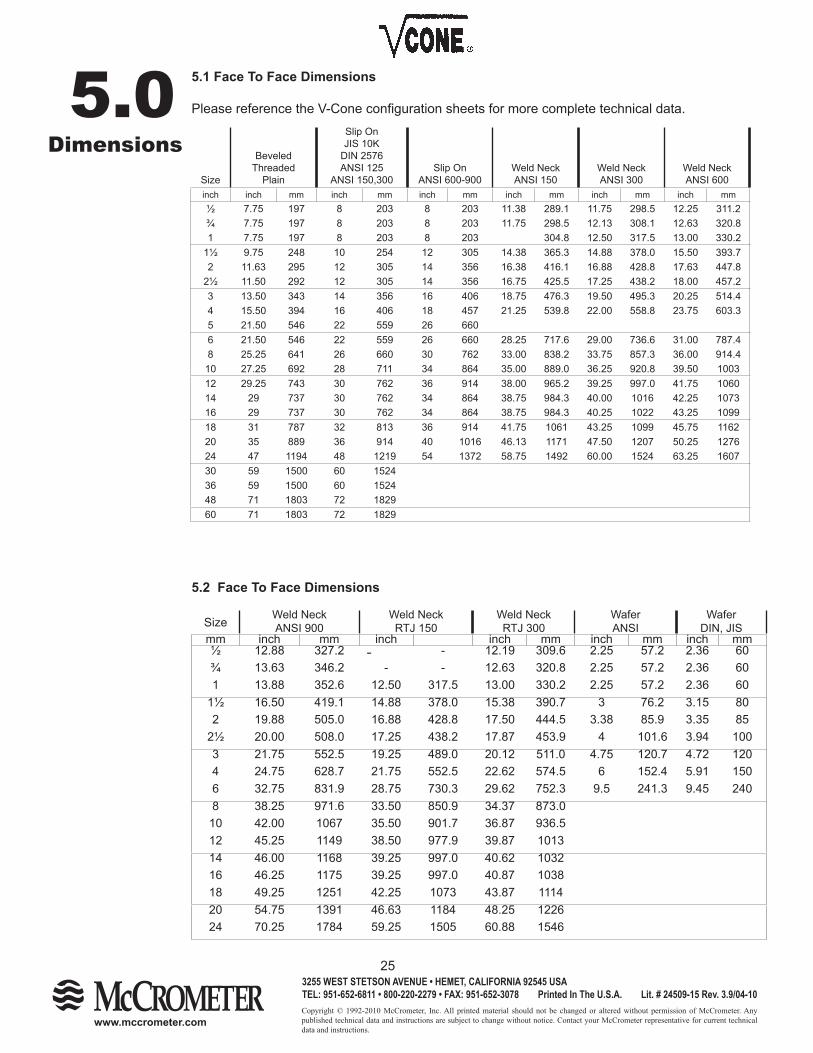
5.1 Face To Face Dimensions
Please reference the V-Cone confi guration sheets for more complete technical data.
5.2 Face To Face Dimensions
Size
BeveledThreaded
Plain
Slip OnJIS 10K
DIN 2576ANSI 125
ANSI 150,300Slip On
ANSI 600-900Weld NeckANSI 150
Weld NeckANSI 300
Weld NeckANSI 600
inch inch mm inch mm inch mm inch mm inch mm inch mm½ 7.75 197 8 203 8 203 11.38 289.1 11.75 298.5 12.25 311.2 ¾ 7.75 197 8 203 8 203 11.75 298.5 12.13 308.1 12.63 320.8 1 7.75 197 8 203 8 203 304.8 12.50 317.5 13.00 330.2
1½ 9.75 248 10 254 12 305 14.38 365.3 14.88 378.0 15.50 393.7 2 11.63 295 12 305 14 356 16.38 416.1 16.88 428.8 17.63 447.8
2½ 11.50 292 12 305 14 356 16.75 425.5 17.25 438.2 18.00 457.2 3 13.50 343 14 356 16 406 18.75 476.3 19.50 495.3 20.25 514.4 4 15.50 394 16 406 18 457 21.25 539.8 22.00 558.8 23.75 603.3 5 21.50 546 22 559 26 660 6 21.50 546 22 559 26 660 28.25 717.6 29.00 736.6 31.00 787.4 8 25.25 641 26 660 30 762 33.00 838.2 33.75 857.3 36.00 914.4
10 27.25 692 28 711 34 864 35.00 889.0 36.25 920.8 39.50 1003 12 29.25 743 30 762 36 914 38.00 965.2 39.25 997.0 41.75 1060 14 29 737 30 762 34 864 38.75 984.3 40.00 1016 42.25 1073 16 29 737 30 762 34 864 38.75 984.3 40.25 1022 43.25 1099 18 31 787 32 813 36 914 41.75 1061 43.25 1099 45.75 1162 20 35 889 36 914 40 1016 46.13 1171 47.50 1207 50.25 1276 24 47 1194 48 1219 54 1372 58.75 1492 60.00 1524 63.25 1607 30 59 1500 60 152436 59 1500 60 152448 71 1803 72 182960 71 1803 72 1829
5.0 Dimensions
Size Weld NeckANSI 900
Weld NeckRTJ 150
Weld NeckRTJ 300
WaferANSI
WaferDIN, JIS
mm inch mm inch inch mm inch mm inch mm½ 12.88 327.2 - - 12.19 309.6 2.25 57.2 2.36 60¾ 13.63 346.2 - - 12.63 320.8 2.25 57.2 2.36 601 13.88 352.6 12.50 317.5 13.00 330.2 2.25 57.2 2.36 60
1½ 16.50 419.1 14.88 378.0 15.38 390.7 3 76.2 3.15 802 19.88 505.0 16.88 428.8 17.50 444.5 3.38 85.9 3.35 85
2½ 20.00 508.0 17.25 438.2 17.87 453.9 4 101.6 3.94 1003 21.75 552.5 19.25 489.0 20.12 511.0 4.75 120.7 4.72 1204 24.75 628.7 21.75 552.5 22.62 574.5 6 152.4 5.91 1506 32.75 831.9 28.75 730.3 29.62 752.3 9.5 241.3 9.45 2408 38.25 971.6 33.50 850.9 34.37 873.0 10 42.00 1067 35.50 901.7 36.87 936.5 12 45.25 1149 38.50 977.9 39.87 1013 14 46.00 1168 39.25 997.0 40.62 1032 16 46.25 1175 39.25 997.0 40.87 1038 18 49.25 1251 42.25 1073 43.87 1114 20 54.75 1391 46.63 1184 48.25 1226 24 70.25 1784 59.25 1505 60.88 1546
Copyright © 1992-2010 McCrometer, Inc. All printed material should not be changed or altered without permission of McCrometer. Any published technical data and instructions are subject to change without notice. Contact your McCrometer representative for current technical data and instructions.
www.mccrometer.com
3255 WEST STETSON AVENUE • HEMET, CALIFORNIA 92545 USATEL: 951-652-6811 • 800-220-2279 • FAX: 951-652-3078 Printed In The U.S.A. Lit. # 24509-15 Rev. 3.9/04-10
26
6.0
ModelSelections Size - Materials Body Style Bore Ports Face Style
VH 01 1” P CPVC 1 ANSI CL 150 to 2500 S Standard N NPT 10C 1½” Q S304 2 DIN 2633 X Other J RC 2 O-Ring02 2” L S304L 3 DIN 2635 X Other 3 Serrated0D 2½” A S316L 4 JIS 10k X Other03 3” T PTFE X Other Style04 4” B Brass05 5” R CPVC Body
S316 Cone06 6” X Other Mat. ‡
NOTES:1. Bold items in table above are standard construction.2. Combinations of two different materials can also be specifi ed.3. Plastic materials limited to sizes 1” to 3”. For other sizes please consult factory.
NOTES:1. Bold items in table above are standard construction.2. Combinations of two different materials can also be specifi ed.3. Plastic materials limited to sizes 1” to 3”. For other sizes please consult factory.
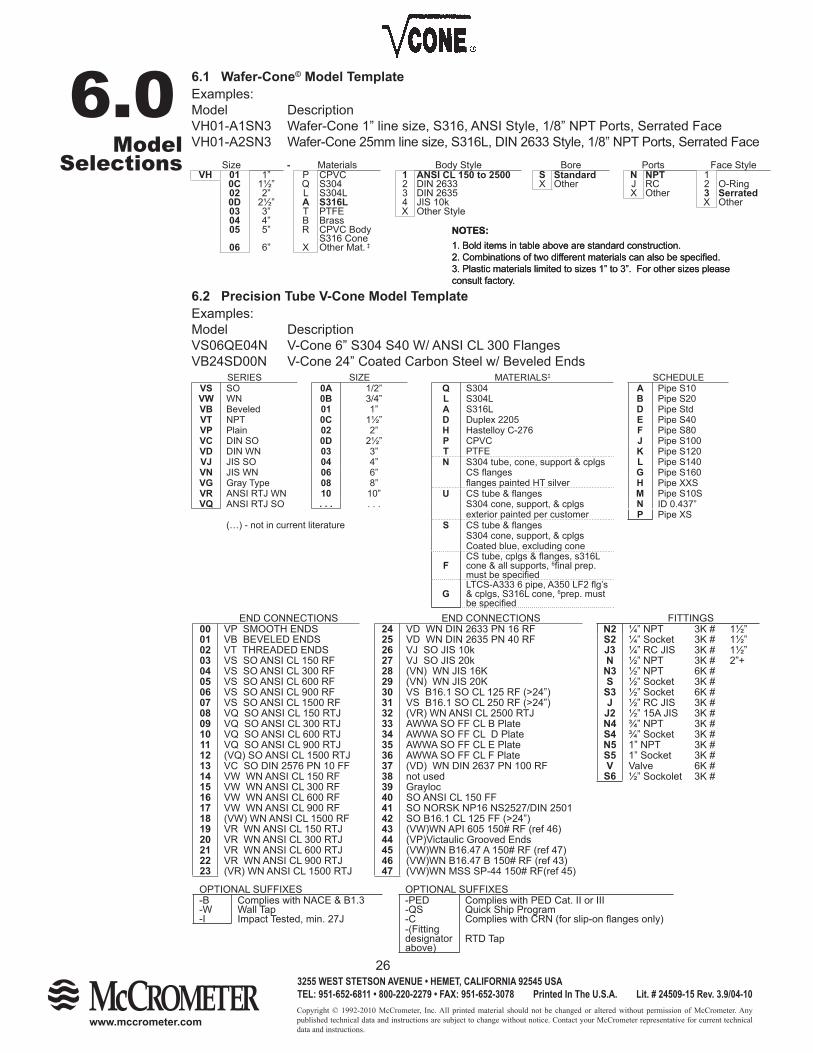
6.1 Wafer-Cone© Model TemplateExamples:Model Description VH01-A1SN3 Wafer-Cone 1” line size, S316, ANSI Style, 1/8” NPT Ports, Serrated FaceVH01-A2SN3 Wafer-Cone 25mm line size, S316L, DIN 2633 Style, 1/8” NPT Ports, Serrated Face
6.2 Precision Tube V-Cone Model TemplateExamples:Model Description VS06QE04N V-Cone 6” S304 S40 W/ ANSI CL 300 FlangesVB24SD00N V-Cone 24” Coated Carbon Steel w/ Beveled Ends
SERIES SIZE MATERIALS‡ SCHEDULEVS SO 0A 1/2” Q S304 A Pipe S10VW WN 0B 3/4” L S304L B Pipe S20VB Beveled 01 1” A S316L D Pipe StdVT NPT 0C 1½” D Duplex 2205 E Pipe S40VP Plain 02 2” H Hastelloy C-276 F Pipe S80VC DIN SO 0D 2½” P CPVC J Pipe S100VD DIN WN 03 3” T PTFE K Pipe S120VJ JIS SO 04 4” N S304 tube, cone, support & cplgs L Pipe S140VN JIS WN 06 6” CS fl anges G Pipe S160VG Gray Type 08 8” fl anges painted HT silver H Pipe XXSVR ANSI RTJ WN 10 10” U CS tube & fl anges M Pipe S10SVQ ANSI RTJ SO . . . . . . S304 cone, support, & cplgs N ID 0.437”
exterior painted per customer P Pipe XS(…) - not in current literature S CS tube & fl anges
S304 cone, support, & cplgsCoated blue, excluding cone
FCS tube, cplgs & fl anges, s316L cone & all supports, 6fi nal prep. must be specifi ed
GLTCS-A333 6 pipe, A350 LF2 fl g’s & cplgs, S316L cone, 6prep. must be specifi ed
END CONNECTIONS END CONNECTIONS FITTINGS00 VP SMOOTH ENDS 24 VD WN DIN 2633 PN 16 RF N2 ¼” NPT 3K # 1½”01 VB BEVELED ENDS 25 VD WN DIN 2635 PN 40 RF S2 ¼” Socket 3K # 1½”02 VT THREADED ENDS 26 VJ SO JIS 10k J3 ¼” RC JIS 3K # 1½”03 VS SO ANSI CL 150 RF 27 VJ SO JIS 20k N ½” NPT 3K # 2”+04 VS SO ANSI CL 300 RF 28 (VN) WN JIS 16K N3 ½” NPT 6K # 05 VS SO ANSI CL 600 RF 29 (VN) WN JIS 20K S ½” Socket 3K #06 VS SO ANSI CL 900 RF 30 VS B16.1 SO CL 125 RF (>24”) S3 ½” Socket 6K #07 VS SO ANSI CL 1500 RF 31 VS B16.1 SO CL 250 RF (>24”) J ½” RC JIS 3K #08 VQ SO ANSI CL 150 RTJ 32 (VR) WN ANSI CL 2500 RTJ J2 ½” 15A JIS 3K #09 VQ SO ANSI CL 300 RTJ 33 AWWA SO FF CL B Plate N4 ¾” NPT 3K #10 VQ SO ANSI CL 600 RTJ 34 AWWA SO FF CL D Plate S4 ¾” Socket 3K #11 VQ SO ANSI CL 900 RTJ 35 AWWA SO FF CL E Plate N5 1” NPT 3K #12 (VQ) SO ANSI CL 1500 RTJ 36 AWWA SO FF CL F Plate S5 1” Socket 3K #13 VC SO DIN 2576 PN 10 FF 37 (VD) WN DIN 2637 PN 100 RF V Valve 6K #14 VW WN ANSI CL 150 RF 38 not used S6 ½” Sockolet 3K #15 VW WN ANSI CL 300 RF 39 Grayloc16 VW WN ANSI CL 600 RF 40 SO ANSI CL 150 FF17 VW WN ANSI CL 900 RF 41 SO NORSK NP16 NS2527/DIN 250118 (VW) WN ANSI CL 1500 RF 42 SO B16.1 CL 125 FF (>24”)19 VR WN ANSI CL 150 RTJ 43 (VW)WN API 605 150# RF (ref 46)20 VR WN ANSI CL 300 RTJ 44 (VP)Victaulic Grooved Ends21 VR WN ANSI CL 600 RTJ 45 (VW)WN B16.47 A 150# RF (ref 47)22 VR WN ANSI CL 900 RTJ 46 (VW)WN B16.47 B 150# RF (ref 43)23 (VR) WN ANSI CL 1500 RTJ 47 (VW)WN MSS SP-44 150# RF(ref 45)
OPTIONAL SUFFIXES OPTIONAL SUFFIXES-B Complies with NACE & B1.3 -PED Complies with PED Cat. II or III-W Wall Tap -QS Quick Ship Program-I Impact Tested, min. 27J -C Complies with CRN (for slip-on fl anges only)
-(Fitting designator above)
RTD Tap
Copyright © 1992-2010 McCrometer, Inc. All printed material should not be changed or altered without permission of McCrometer. Any published technical data and instructions are subject to change without notice. Contact your McCrometer representative for current technical data and instructions.
www.mccrometer.com
3255 WEST STETSON AVENUE • HEMET, CALIFORNIA 92545 USATEL: 951-652-6811 • 800-220-2279 • FAX: 951-652-3078 Printed In The U.S.A. Lit. # 24509-15 Rev. 3.9/04-10
27
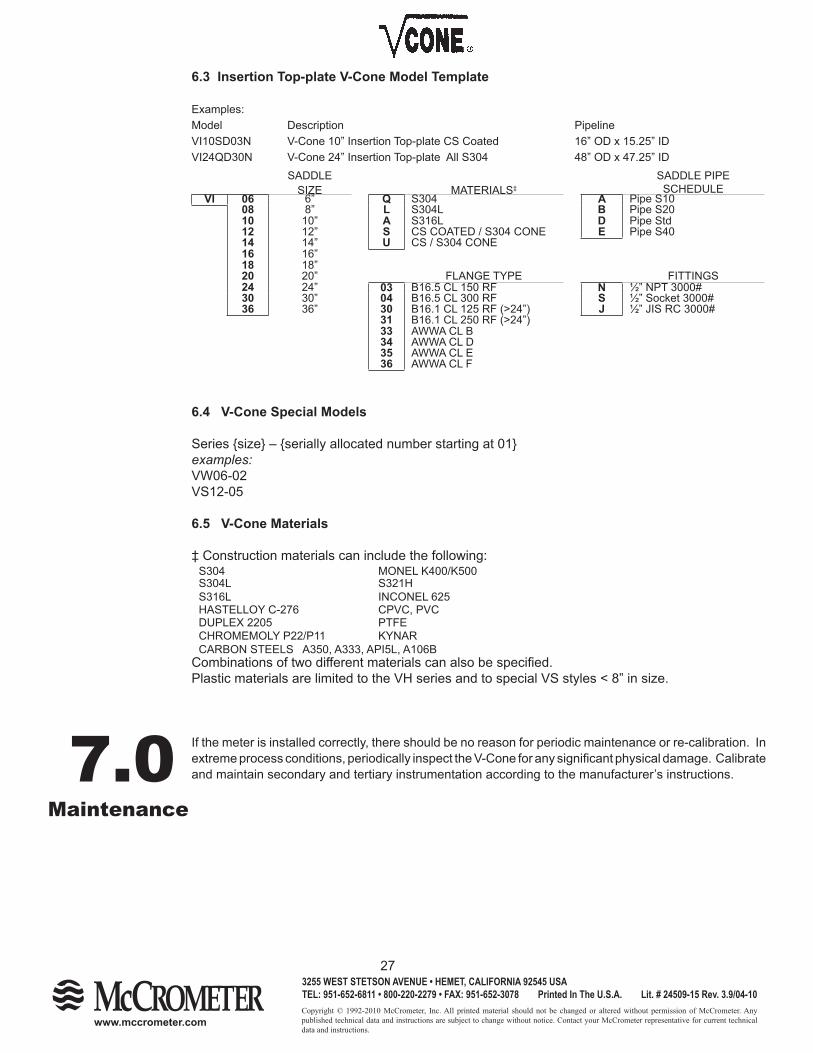
6.3 Insertion Top-plate V-Cone Model Template
Examples:Model Description PipelineVI10SD03N V-Cone 10” Insertion Top-plate CS Coated 16” OD x 15.25” IDVI24QD30N V-Cone 24” Insertion Top-plate All S304 48” OD x 47.25” ID
6.4 V-Cone Special Models
Series {size} – {serially allocated number starting at 01}examples:VW06-02VS12-05
6.5 V-Cone Materials
‡ Construction materials can include the following:S304 MONEL K400/K500S304L S321HS316L INCONEL 625HASTELLOY C-276 CPVC, PVCDUPLEX 2205 PTFECHROMEMOLY P22/P11 KYNARCARBON STEELS A350, A333, API5L, A106B
Combinations of two different materials can also be specifi ed.Plastic materials are limited to the VH series and to special VS styles < 8” in size.
If the meter is installed correctly, there should be no reason for periodic maintenance or re-calibration. In extreme process conditions, periodically inspect the V-Cone for any signifi cant physical damage. Calibrate and maintain secondary and tertiary instrumentation according to the manufacturer’s instructions.
SADDLESIZE MATERIALS‡
SADDLE PIPE SCHEDULE
VI 06 6” Q S304 A Pipe S1008 8” L S304L B Pipe S2010 10” A S316L D Pipe Std12 12” S CS COATED / S304 CONE E Pipe S4014 14” U CS / S304 CONE16 16”18 18”20 20” FLANGE TYPE FITTINGS24 24” 03 B16.5 CL 150 RF N ½” NPT 3000#30 30” 04 B16.5 CL 300 RF S ½” Socket 3000#36 36” 30 B16.1 CL 125 RF (>24”) J ½” JIS RC 3000#
31 B16.1 CL 250 RF (>24”)33 AWWA CL B34 AWWA CL D35 AWWA CL E36 AWWA CL F
7.0 Maintenance
Copyright © 1992-2010 McCrometer, Inc. All printed material should not be changed or altered without permission of McCrometer. Any published technical data and instructions are subject to change without notice. Contact your McCrometer representative for current technical data and instructions.
www.mccrometer.com
3255 WEST STETSON AVENUE • HEMET, CALIFORNIA 92545 USATEL: 951-652-6811 • 800-220-2279 • FAX: 951-652-3078 Printed In The U.S.A. Lit. # 24509-15 Rev. 3.9/04-10
28
8.0
Trouble-shooting
Troubleshooting A V-Cone System On-Site
This guide is intended to help you troubleshoot a V-Cone system. Keep several points in mind as you proceed:
1. Most V-Cones are calibrated devices. The meter has already had fl ow through it. If a cone is missing or a leak exists inside the meter, this would be discovered during the calibration. 2. A fl ow measurement requires a system. Do not assume a problem exists with the primary ele-ment just because it is called a V-Cone system. Most problems occur in the DP transmitter or the fl ow computer.3. This guide assumes a simple system of meter, manifold, DP transmitter, and fl ow computer. Systems can be much more complex with pressure and temperature transmitters, as well as full scale digital control systems. Do not limit your evaluation to just these suggestions.4. If you discover a problem / solution not listed in this guide, please contact a V-Cone Application Engineer at McCrometer: 1-951-652-6811.
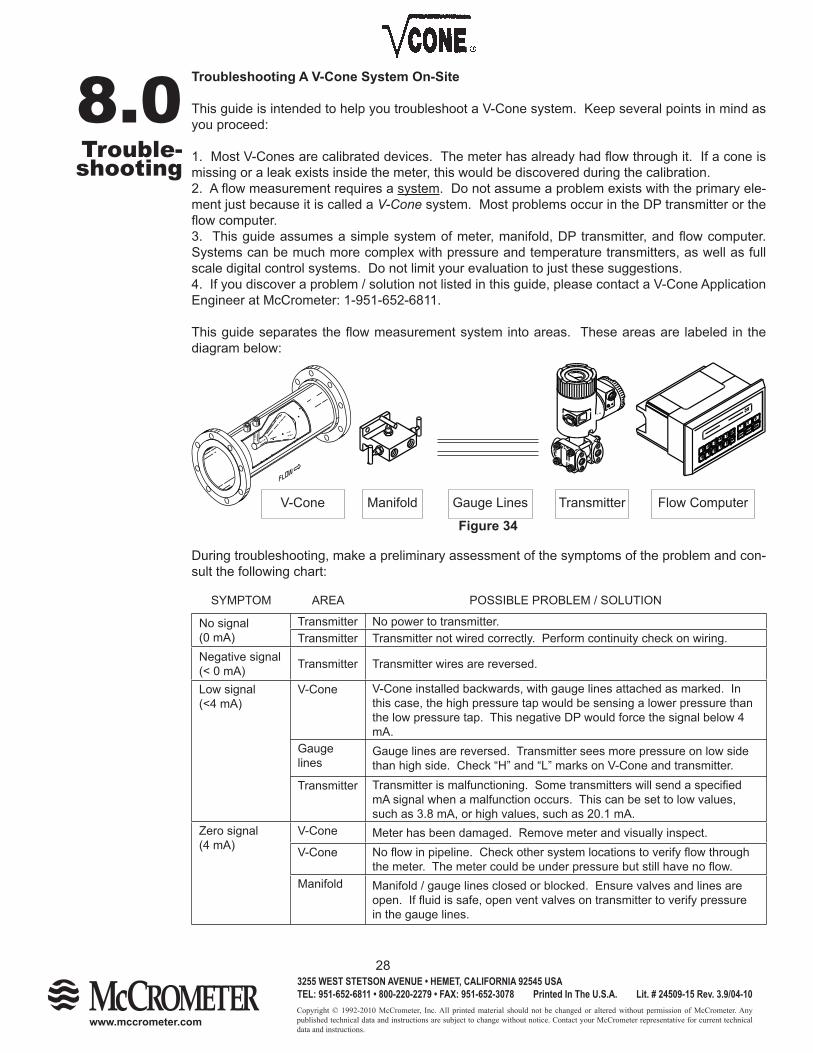
This guide separates the fl ow measurement system into areas. These areas are labeled in the diagram below:
During troubleshooting, make a preliminary assessment of the symptoms of the problem and con-sult the following chart:
SYMPTOM AREA POSSIBLE PROBLEM / SOLUTION
No signal (0 mA)
Transmitter No power to transmitter.Transmitter Transmitter not wired correctly. Perform continuity check on wiring.
Negative signal(< 0 mA) Transmitter Transmitter wires are reversed.
Low signal (<4 mA)
V-Cone V-Cone installed backwards, with gauge lines attached as marked. In this case, the high pressure tap would be sensing a lower pressure than the low pressure tap. This negative DP would force the signal below 4 mA.
Gauge lines
Gauge lines are reversed. Transmitter sees more pressure on low side than high side. Check “H” and “L” marks on V-Cone and transmitter.
Transmitter Transmitter is malfunctioning. Some transmitters will send a specifi ed mA signal when a malfunction occurs. This can be set to low values, such as 3.8 mA, or high values, such as 20.1 mA.
Zero signal (4 mA)
V-Cone Meter has been damaged. Remove meter and visually inspect.V-Cone No fl ow in pipeline. Check other system locations to verify fl ow through
the meter. The meter could be under pressure but still have no fl ow.Manifold Manifold / gauge lines closed or blocked. Ensure valves and lines are
open. If fl uid is safe, open vent valves on transmitter to verify pressure in the gauge lines.
V-Cone Manifold Gauge Lines Transmitter Flow Computer
Figure 34
Copyright © 1992-2010 McCrometer, Inc. All printed material should not be changed or altered without permission of McCrometer. Any published technical data and instructions are subject to change without notice. Contact your McCrometer representative for current technical data and instructions.
www.mccrometer.com
3255 WEST STETSON AVENUE • HEMET, CALIFORNIA 92545 USATEL: 951-652-6811 • 800-220-2279 • FAX: 951-652-3078 Printed In The U.S.A. Lit. # 24509-15 Rev. 3.9/04-10
29
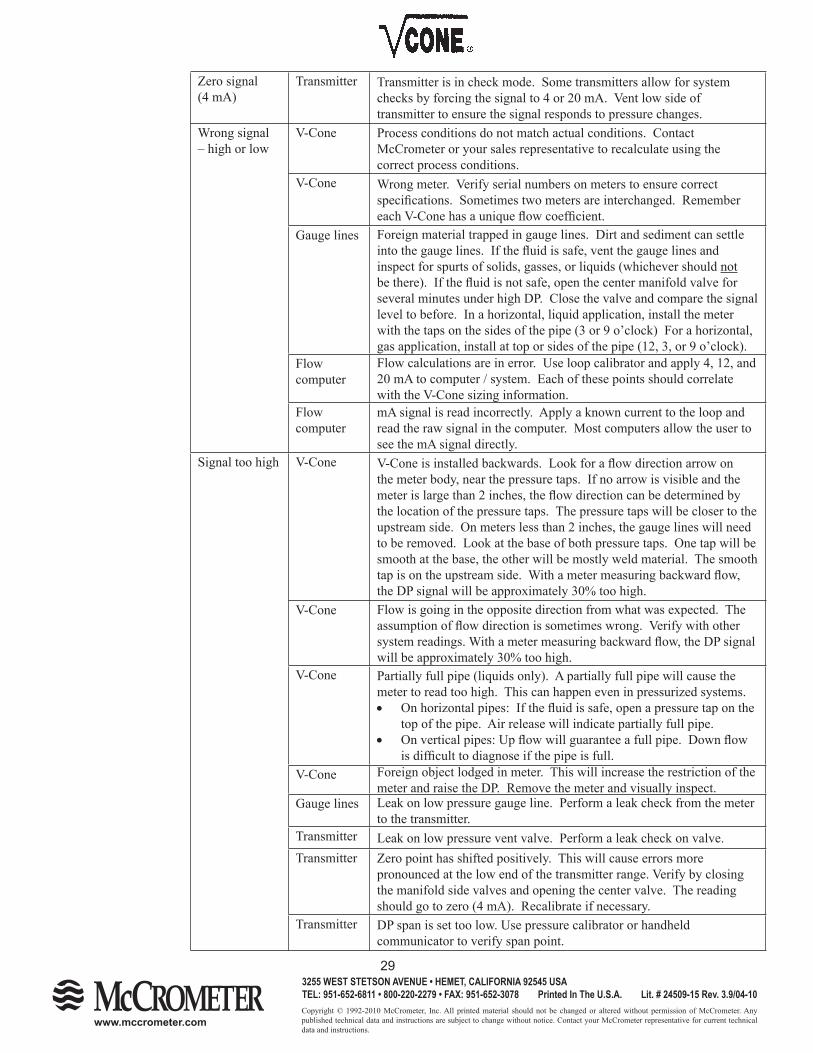
Zero signal (4 mA)
Transmitter Transmitter is in check mode. Some transmitters allow for system checks by forcing the signal to 4 or 20 mA. Vent low side of transmitter to ensure the signal responds to pressure changes.
Wrong signal – high or low
V-Cone Process conditions do not match actual conditions. Contact McCrometer or your sales representative to recalculate using the correct process conditions.
V-Cone Wrong meter. Verify serial numbers on meters to ensure correct specifi cations. Sometimes two meters are interchanged. Remember each V-Cone has a unique fl ow coeffi cient.
Gauge lines Foreign material trapped in gauge lines. Dirt and sediment can settle into the gauge lines. If the fl uid is safe, vent the gauge lines and inspect for spurts of solids, gasses, or liquids (whichever should not be there). If the fl uid is not safe, open the center manifold valve for several minutes under high DP. Close the valve and compare the signal level to before. In a horizontal, liquid application, install the meter with the taps on the sides of the pipe (3 or 9 o’clock) For a horizontal, gas application, install at top or sides of the pipe (12, 3, or 9 o’clock).
Flow computer
Flow calculations are in error. Use loop calibrator and apply 4, 12, and 20 mA to computer / system. Each of these points should correlate with the V-Cone sizing information.
Flow computer
mA signal is read incorrectly. Apply a known current to the loop and read the raw signal in the computer. Most computers allow the user to see the mA signal directly.
Signal too high V-Cone V-Cone is installed backwards. Look for a fl ow direction arrow on the meter body, near the pressure taps. If no arrow is visible and the meter is large than 2 inches, the fl ow direction can be determined by the location of the pressure taps. The pressure taps will be closer to the upstream side. On meters less than 2 inches, the gauge lines will need to be removed. Look at the base of both pressure taps. One tap will be smooth at the base, the other will be mostly weld material. The smooth tap is on the upstream side. With a meter measuring backward fl ow, the DP signal will be approximately 30% too high.
V-Cone Flow is going in the opposite direction from what was expected. The assumption of fl ow direction is sometimes wrong. Verify with other system readings. With a meter measuring backward fl ow, the DP signal will be approximately 30% too high.
V-Cone Partially full pipe (liquids only). A partially full pipe will cause the meter to read too high. This can happen even in pressurized systems. • On horizontal pipes: If the fl uid is safe, open a pressure tap on the
top of the pipe. Air release will indicate partially full pipe. • On vertical pipes: Up fl ow will guarantee a full pipe. Down fl ow
is diffi cult to diagnose if the pipe is full.V-Cone Foreign object lodged in meter. This will increase the restriction of the
meter and raise the DP. Remove the meter and visually inspect.Gauge lines Leak on low pressure gauge line. Perform a leak check from the meter
to the transmitter.Transmitter Leak on low pressure vent valve. Perform a leak check on valve.Transmitter Zero point has shifted positively. This will cause errors more
pronounced at the low end of the transmitter range. Verify by closing the manifold side valves and opening the center valve. The reading should go to zero (4 mA). Recalibrate if necessary.
Transmitter DP span is set too low. Use pressure calibrator or handheld communicator to verify span point.
Copyright © 1992-2010 McCrometer, Inc. All printed material should not be changed or altered without permission of McCrometer. Any published technical data and instructions are subject to change without notice. Contact your McCrometer representative for current technical data and instructions.
www.mccrometer.com
3255 WEST STETSON AVENUE • HEMET, CALIFORNIA 92545 USATEL: 951-652-6811 • 800-220-2279 • FAX: 951-652-3078 Printed In The U.S.A. Lit. # 24509-15 Rev. 3.9/04-10
30
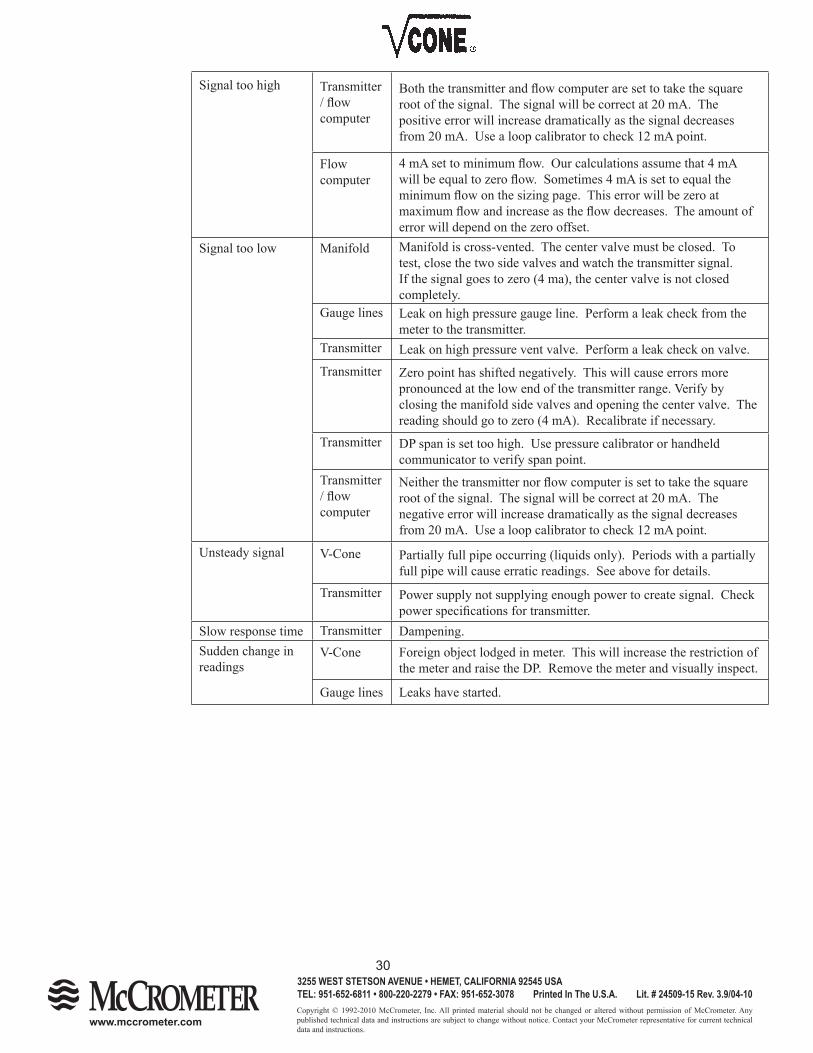
Signal too high Transmitter / fl ow computer
Both the transmitter and fl ow computer are set to take the square root of the signal. The signal will be correct at 20 mA. The positive error will increase dramatically as the signal decreases from 20 mA. Use a loop calibrator to check 12 mA point.
Flow computer
4 mA set to minimum fl ow. Our calculations assume that 4 mA will be equal to zero fl ow. Sometimes 4 mA is set to equal the minimum fl ow on the sizing page. This error will be zero at maximum fl ow and increase as the fl ow decreases. The amount of error will depend on the zero offset.
Signal too low Manifold Manifold is cross-vented. The center valve must be closed. To test, close the two side valves and watch the transmitter signal. If the signal goes to zero (4 ma), the center valve is not closed completely.
Gauge lines Leak on high pressure gauge line. Perform a leak check from the meter to the transmitter.
Transmitter Leak on high pressure vent valve. Perform a leak check on valve.
Transmitter Zero point has shifted negatively. This will cause errors more pronounced at the low end of the transmitter range. Verify by closing the manifold side valves and opening the center valve. The reading should go to zero (4 mA). Recalibrate if necessary.
Transmitter DP span is set too high. Use pressure calibrator or handheld communicator to verify span point.
Transmitter / fl ow computer
Neither the transmitter nor fl ow computer is set to take the square root of the signal. The signal will be correct at 20 mA. The negative error will increase dramatically as the signal decreases from 20 mA. Use a loop calibrator to check 12 mA point.
Unsteady signal V-Cone Partially full pipe occurring (liquids only). Periods with a partially full pipe will cause erratic readings. See above for details.
Transmitter Power supply not supplying enough power to create signal. Check power specifi cations for transmitter.
Slow response time Transmitter Dampening.Sudden change in readings
V-Cone Foreign object lodged in meter. This will increase the restriction of the meter and raise the DP. Remove the meter and visually inspect.
Gauge lines Leaks have started.
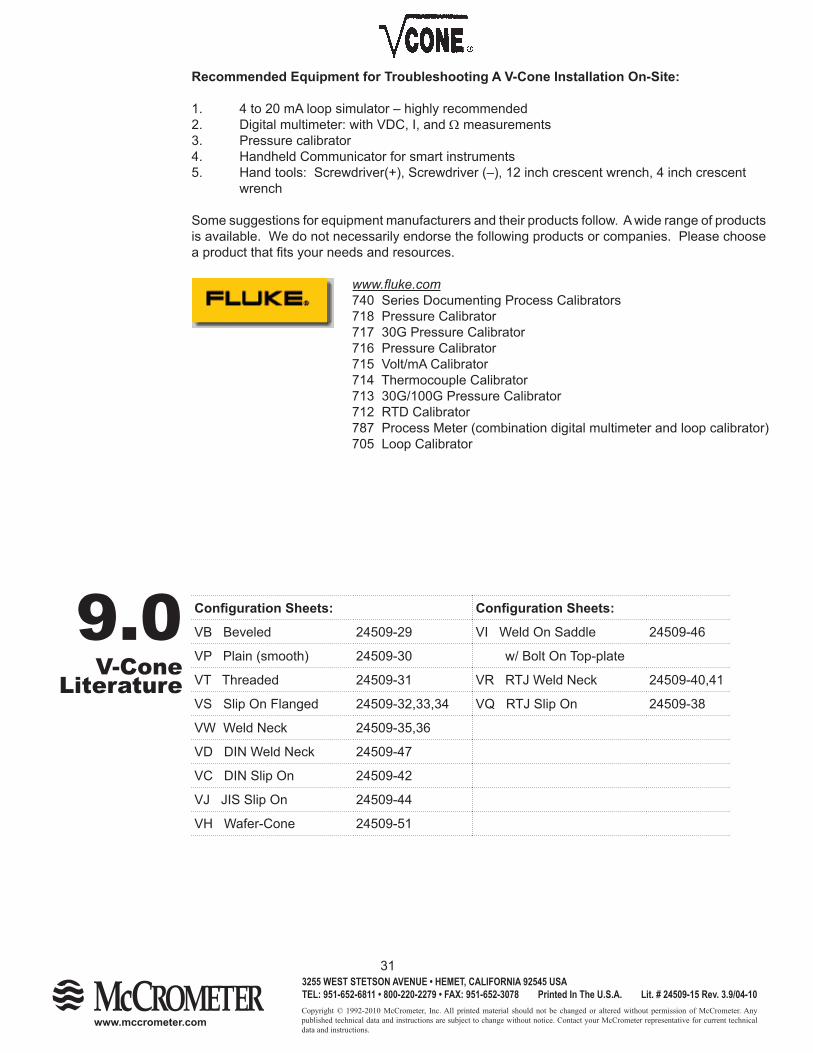
Copyright © 1992-2010 McCrometer, Inc. All printed material should not be changed or altered without permission of McCrometer. Any published technical data and instructions are subject to change without notice. Contact your McCrometer representative for current technical data and instructions.
www.mccrometer.com
3255 WEST STETSON AVENUE • HEMET, CALIFORNIA 92545 USATEL: 951-652-6811 • 800-220-2279 • FAX: 951-652-3078 Printed In The U.S.A. Lit. # 24509-15 Rev. 3.9/04-10
31
Recommended Equipment for Troubleshooting A V-Cone Installation On-Site:
1. 4 to 20 mA loop simulator – highly recommended2. Digital multimeter: with VDC, I, and Ω measurements3. Pressure calibrator4. Handheld Communicator for smart instruments5. Hand tools: Screwdriver(+), Screwdriver (–), 12 inch crescent wrench, 4 inch crescent wrench
Some suggestions for equipment manufacturers and their products follow. A wide range of products is available. We do not necessarily endorse the following products or companies. Please choose a product that fi ts your needs and resources.
www.fl uke.com740 Series Documenting Process Calibrators 718 Pressure Calibrator 717 30G Pressure Calibrator 716 Pressure Calibrator 715 Volt/mA Calibrator 714 Thermocouple Calibrator 713 30G/100G Pressure Calibrator 712 RTD Calibrator 787 Process Meter (combination digital multimeter and loop calibrator)705 Loop Calibrator
Confi guration Sheets: Confi guration Sheets:
VB Beveled 24509-29 VI Weld On Saddle 24509-46
VP Plain (smooth) 24509-30 w/ Bolt On Top-plate
VT Threaded 24509-31 VR RTJ Weld Neck 24509-40,41
VS Slip On Flanged 24509-32,33,34 VQ RTJ Slip On 24509-38
VW Weld Neck 24509-35,36
VD DIN Weld Neck 24509-47
VC DIN Slip On 24509-42
VJ JIS Slip On 24509-44
VH Wafer-Cone 24509-51
9.0
V-ConeLiterature
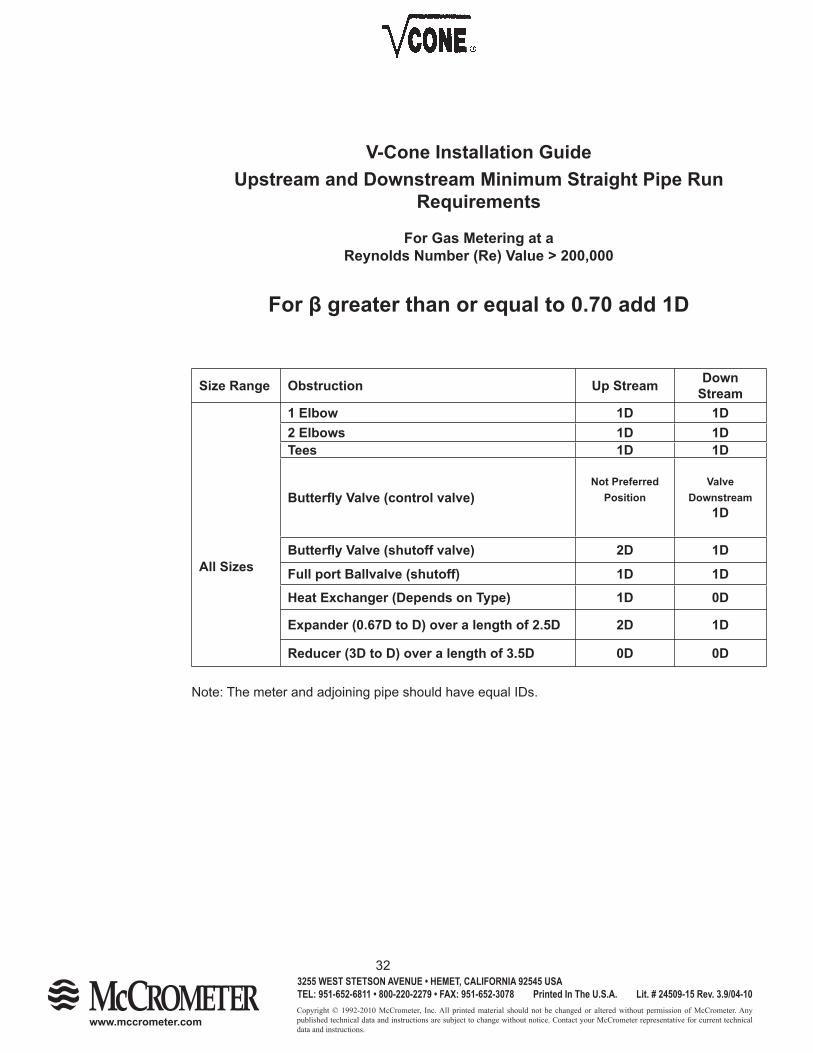
Copyright © 1992-2010 McCrometer, Inc. All printed material should not be changed or altered without permission of McCrometer. Any published technical data and instructions are subject to change without notice. Contact your McCrometer representative for current technical data and instructions.
www.mccrometer.com
3255 WEST STETSON AVENUE • HEMET, CALIFORNIA 92545 USATEL: 951-652-6811 • 800-220-2279 • FAX: 951-652-3078 Printed In The U.S.A. Lit. # 24509-15 Rev. 3.9/04-10
32
V-Cone Installation GuideUpstream and Downstream Minimum Straight Pipe Run
Requirements
For Gas Metering at aReynolds Number (Re) Value > 200,000
For β greater than or equal to 0.70 add 1D
Size Range Obstruction Up Stream Down Stream
All Sizes
1 Elbow 1D 1D2 Elbows 1D 1DTees 1D 1D
Butterfl y Valve (control valve)Not Preferred
Position
Valve Downstream
1D
Butterfl y Valve (shutoff valve) 2D 1D
Full port Ballvalve (shutoff) 1D 1DHeat Exchanger (Depends on Type) 1D 0D
Expander (0.67D to D) over a length of 2.5D 2D 1D
Reducer (3D to D) over a length of 3.5D 0D 0D
Note: The meter and adjoining pipe should have equal IDs.
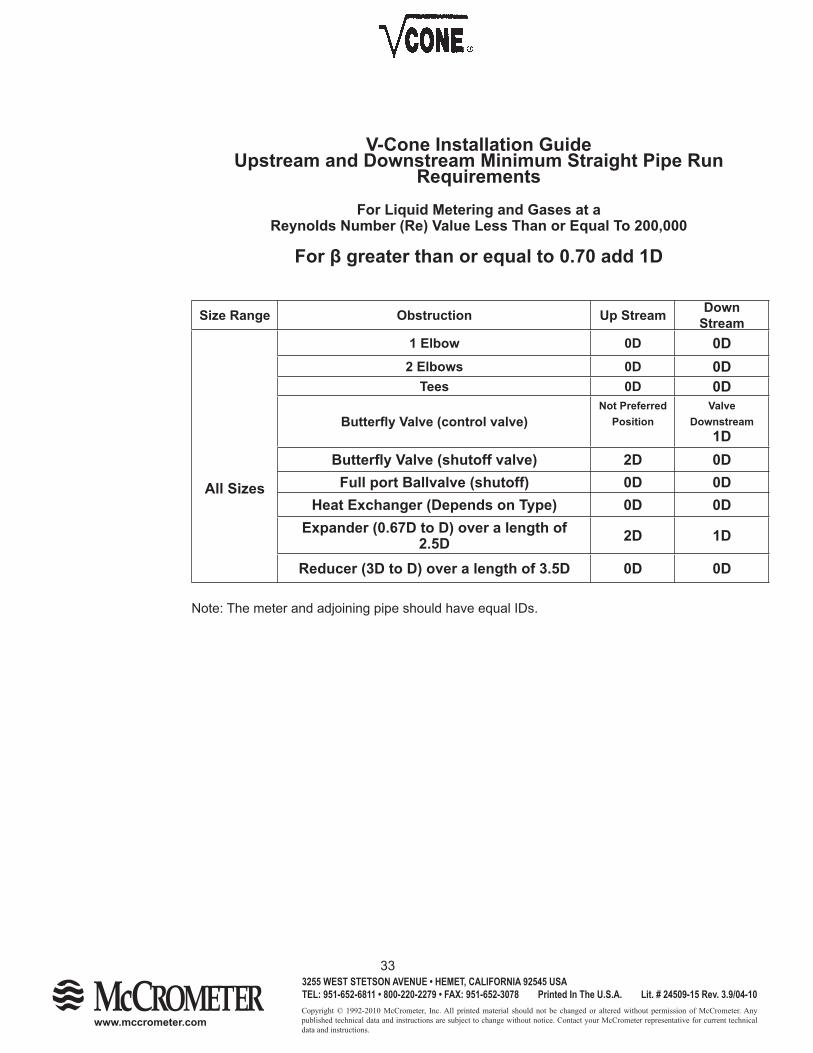
Copyright © 1992-2010 McCrometer, Inc. All printed material should not be changed or altered without permission of McCrometer. Any published technical data and instructions are subject to change without notice. Contact your McCrometer representative for current technical data and instructions.
www.mccrometer.com
3255 WEST STETSON AVENUE • HEMET, CALIFORNIA 92545 USATEL: 951-652-6811 • 800-220-2279 • FAX: 951-652-3078 Printed In The U.S.A. Lit. # 24509-15 Rev. 3.9/04-10
33
V-Cone Installation GuideUpstream and Downstream Minimum Straight Pipe Run
Requirements For Liquid Metering and Gases at a
Reynolds Number (Re) Value Less Than or Equal To 200,000
For β greater than or equal to 0.70 add 1D
Size Range Obstruction Up Stream Down Stream
All Sizes
1 Elbow 0D 0D2 Elbows 0D 0D
Tees 0D 0D
Butterfl y Valve (control valve)Not Preferred
PositionValve
Downstream1D
Butterfl y Valve (shutoff valve) 2D 0DFull port Ballvalve (shutoff) 0D 0D
Heat Exchanger (Depends on Type) 0D 0DExpander (0.67D to D) over a length of
2.5D 2D 1D
Reducer (3D to D) over a length of 3.5D 0D 0D
Note: The meter and adjoining pipe should have equal IDs.
Copyright © 1992-2010 McCrometer, Inc. All printed material should not be changed or altered without permission of McCrometer. Any published technical data and instructions are subject to change without notice. Contact your McCrometer representative for current technical data and instructions.
www.mccrometer.com
3255 WEST STETSON AVENUE • HEMET, CALIFORNIA 92545 USATEL: 951-652-6811 • 800-220-2279 • FAX: 951-652-3078 Printed In The U.S.A. Lit. # 24509-15 Rev. 3.9/04-10
34
MANUFACTURER’S WARRANTY
This Warranty shall apply to and be limited to the original purchaser consumer of any McCrometer product. Meters or instruments defective because of faulty material or workmanship will be repaired or replaced, at the option of McCrometer, Inc., free of charge, FOB the factory in Hemet, California, within a period of one (1) year from the date of delivery.
Repairs or modifi cations by others than McCrometer, Inc. or their authorized representatives shall render this Warranty null and void in the event that factory examination reveals that such repair or modifi cation was detrimental to the meter or instrument. Any deviations from the factory calibration require notifi cation in writing to McCrometer, Inc. of such recalibrations or this warranty shall be voided.
In case of a claim under this Warranty, the claimant is instructed to contact McCrometer, Inc. 3255 West Stetson Ave., Hemet, California 92545, and to provide an identifi cation or description of the meter or instrument, the date of delivery, and the nature of the problem.
The Warranty provided above is the only warranty made by McCrometer, Inc. with respect to its products or any parts thereof and is made expressly in lieu of any other warranties, by course of dealing, usages of trade or otherwise, expressed or implied, including but not limited to any implied warranties of fi tness for any particular purpose or of merchantability under the uniform commercial code. It is agreed this warranty is in lieu of and buyer hereby waives all other warranties, guarantees or liabilities arising by law or otherwise. Seller shall not incur any other obligations or liabilities or be liable to buyer, or any customer of buyer for any anticipated or lost profi ts, incidental or consequential damages, or any other losses or expenses incurred by reason of the purchase, installation, repair, use or misuse by buyer or third parties of its products (including any parts repaired or replaced); and seller does not authorize any person to assume for seller any other liability in connection with the products or parts thereof. This Warranty cannot be extended, altered or varied except by a written instruction signed by seller and buyer.
This Warranty gives you specifi c legal rights, and you may also have other rights which vary from state to state.
McCrometer, Inc. reserves the right to make improvements and repairs on product components which are beyond the warranty period at the manufacturer’s option and expense, without obligation to renew the expired warranty on the components or on the entire unit. Due to the rapid advancement of meter design technology, McCrometer, Inc. reserves the right to make improvements in design and material without prior notice to the trade.
All sales and all agreements in relation to sales shall be deemed made at the manufacturer’s place of business in Hemet, California and any dispute arising from any sale or agreement shall be interpreted under the laws of the State of California.
OTHER McCROMETER PRODUCTS INCLUDE:
Magnetic Flowmeters
Magnetic Flowmeters
Magnetic Flowmeters
Propeller Flowmeters
Flowmeters And Flow Straighteners
For Propeller Flowmeters
Propeller Flowmeters
Differential Pressure Flowmeters
Differential Pressure Flowmeters
Differential Pressure Flowmeters
Electronic Instrumentation for Remote Display and Control
FOR MORE INFORMATION CONTACT: Represented by:
U.S. Patents 4812049, 5363699 and 5,814,738; Including Patents Applicable Outside The U.S.; Other U.S. and Foreign patents pending
Copyright © 1992-2010 McCrometer, Inc. All printed material should not be changed or altered without permission of McCrometer. Any published technical data and instructions are subject to change without notice. Contact your McCrometer representative for current technical data and instructions.
www.mccrometer.com
3255 WEST STETSON AVENUE • HEMET, CALIFORNIA 92545 USATEL: 951-652-6811 • 800-220-2279 • FAX: 951-652-3078 Printed In The U.S.A. Lit. # 24509-15 Rev. 3.9/04-10