instability of pt/c electrocatalysts in proton exchange membrane...
TRANSCRIPT

Journal of The Electrochemical Society, 152 �11� A2256-A2271 �2005�A2256
Instability of Pt/C Electrocatalysts in Proton ExchangeMembrane Fuel CellsA Mechanistic InvestigationP. J. Ferreira,a,d G. J. la O’,a,* Y. Shao-Horn,a,**,z D. Morgan,b R. Makharia,c
S. Kocha,c,** and H. A. Gasteigerc,**aMassachusetts Institute of Technology, Cambridge, Massachusetts 02139, USAbUniversity of Wisconsin–Madison, Madison, Wisconsin 53706, USAcGeneral Motors Fuel Cell Activities, Honeoye Falls, New York 14472, USA
Equilibrium concentrations of dissolved platinum species from a Pt/C electrocatalyst sample in 0.5 M H2SO4 at 80°C were foundto increase with applied potential from 0.9 to 1.1 V vs reversible hydrogen electrode. In addition, platinum surface area loss fora short-stack of proton exchange membrane fuel cells �PEMFCs� operated at open-circuit voltage ��0.95 V� was shown to behigher than another operated under load ��0.75 V�. Both findings suggest that the formation of soluble platinum species �such asPt2+� plays an important role in platinum surface loss in PEMFC electrodes. As accelerated platinum surface area loss in thecathode �from 63 to 23 m2/gPt in �100 h� was observed upon potential cycling, a cycled membrane electrode assembly �MEA�cathode was examined in detail by incidence angle X-ray diffraction and transmission electron microscopy �TEM� to revealprocesses responsible for observed platinum loss. In this study, TEM data and analyses of Pt/C catalyst and cross-sectional MEAcathode samples unambiguously confirmed that coarsening of platinum particles occurred via two different processes: �i� Ostwaldripening on carbon at the nanometer scale, which is responsible for platinum particle coarsening from �3 to �6 nm on carbon,and �ii� migration of soluble platinum species in the ionomer phase at the micrometer scale, chemical reduction of these speciesby crossover H2 molecules, and precipitation of platinum particles in the cathode ionomer phase, which reduces the weight ofplatinum on carbon. It was estimated that each process contributed to �50% of the overall platinum area loss of the potentialcycled electrode.© 2005 The Electrochemical Society. �DOI: 10.1149/1.2050347� All rights reserved.
Manuscript submitted May 10, 2005; revised manuscript received June 24, 2005. Available electronically October 7, 2005.
0013-4651/2005/152�11�/A2256/16/$7.00 © The Electrochemical Society, Inc.
One of the major cost drivers in polymer electrolyte membranefuel cells �PEMFCs�, particularly for automotive applications, is theuse of platinum-based electrodes to catalyze both the anodic oxida-tion of hydrogen �anode reaction� and the cathodic reduction ofoxygen �cathode reaction�. Consequently, much of the past researchhas been focused on determining whether automotive platinum load-ing targets ��0.2 gPt/kW�, driven by cost and platinum supply con-siderations, could be met with currently known catalyst technology.Recent studies have reached an important milestone toward automo-tive PEMFC applications by envisioning a feasible technical road-map toward meeting the stringent automotive target,1,2 which con-sist of membrane electrode assembly �MEA� and diffusion media�DM� optimization in parallel with engineering of Pt-alloy cathodecatalysts. Catalyst durability during PEMFC operation remains akey challenge to developing PEMFCs with acceptable lifetime intransportation and stationary sectors. Current research and develop-ment efforts are focused primarily on elucidating and quantifyingcatalyst degradation mechanisms in order to determine whether cur-rently known carbon-supported platinum �Pt/C� and platinum-alloy�Pt-alloy/C� catalysts will meet long-term performance degradationrequirements �automotive applications �10 �V/h�.
The fuel cell voltage at any given current density depends largelyon the available platinum surface area �particularly in the cathode�which is the product of the specific surface area of platinum �i.e., theplatinum dispersion, generally described in mPt
2 /gPt or m2/gPt�, SPt,and the platinum loading of the MEA �usually in units ofmgPt/cmMEA
2 �.3 For the state-of-the-art Pt/C catalysts, values2 of SPt
range from 60 to 120 m2/gPt, generally determined by either cyclicvoltammetry,2,3 CO stripping voltammetry,4 or CO gas-phasechemisorption,5 which typically correspond to an average platinumparticle size of �3 nm on the carbon support.5 Any sintering/
* Electrochemical Society Student Member.** Electrochemical Society Active Member.
d Present Address: The University of Texas at Austin, Austin, TX 78712.z E-mail: [email protected]
agglomeration of these platinum �or Pt-alloy� particles leads to plati-num surface area loss in the electrode and results in a loss of fuelcell performance.
Platinum area loss in phosphoric acid fuel cells (PAFCs).—Much of our knowledge in Pt/C and Pt-alloy/C durability stemsfrom past experience with PAFCs, which have achieved lifetimesexceeding 40,000 h 6 at an operating temperature of �200°C. Cata-lyst degradation in PAFCs is witnessed as an apparent loss of plati-num surface area over time,7-13 associated with platinum crystalgrowth, which is ascribed to fundamentally different processes:�i� platinum dissolution and redeposition �an Ostwald ripeningprocess�, �ii� coalescence of platinum nanoparticles via platinumnanocrystallite migration on the carbon support, and �iii� platinumparticle agglomeration triggered by corrosion of carbon support �i.e.,detachment of platinum nanoparticles from the carbon support�. Thethird process, which is accelerated by high cathode potentials viaelectrochemical oxidation of carbon, has been largely circumventedby using more corrosion-resistant graphitized carbon supports7 andby avoiding high cathode potentials greater than 0.80-0.85 V vsreversible hydrogen electrode �RHE�.14 In the absence of carbon-support corrosion, however, no agreement is found as to whether theobserved platinum area loss is dominated by platinum dissolutionand redeposition or platinum nanocrystallite migration.
A potential-dependent solubility of platinum species in the elec-trolyte is essential for the platinum dissolution and redepositionmechanism. Several articles have reported substantial platinum solu-bility in hot concentrated phosphoric acid �176-196°C� in the rangeof 0.80-0.95 V15 and a potential-dependent platinum area loss overtime in PAFCs.12,16 In addition, Aragane et al.8,17 have analyzedplatinum particle size distributions in the cathode near the electro-lyte matrix at the center of the cathode and close to backing paper�equivalent to DM� using transmission electron microscopy �TEM�,which reveal that the nanometer-scale Ostwald ripening occurred tothe same degree throughout the thickness of the cathode. The protonconducting electrode separator in PAFCs is generally referred to asthe “matrix,” which has the equivalent function of the membrane inPEMFCs. Moreover, Aragane et al.17 report the presence of platinumparticles in the matrix and platinum migration to the anode, wherethe possibility of platinum precipitation via chemical reduction of
A2257Journal of The Electrochemical Society, 152 �11� A2256-A2271 �2005� A2257
platinum ions with crossover hydrogen from the anode is discussed.This observation provides unambiguous support for the presenceand migration of soluble platinum species in the electrolyte. Basedon these experimental observations, Ross18 conceptualizes platinumcoarsening and area loss at two different length scales, viz. �i� ananometer-scale Ostwald-ripening process, where smaller platinumparticles dissolve in the ionomer phase and redeposit on larger plati-num particles that are separated by a few nanometers; and �ii� amicrometer-scale diffusion process, where dissolved platinum ionsdiffuse toward the matrix and get reduced on the anode side at lowpotentials.
In contrast to these above studies, there have been a number ofreports that suggest platinum area loss in PAFCs governed by crys-tallite migration and coalescence. Crystallite migration and coales-cence in the absence of electrolyte is observed clearly in gas-phasesintering studies of Pt/C catalysts but is insignificant at temperaturesbelow 500°C in the gas phase.13 Nevertheless, many authors fail toobserve a significant potential dependence of the platinum area lossover time in PAFC studies, from which it is concluded that simpleplatinum dissolution and redeposition cannot be the dominatingmechanism and the crystallite migration mechanism is favored.9,10
The latter predicts that Pt/C catalysts with a lower wt % of platinumon carbon would lead to lower platinum area losses than high wt %Pt/C catalysts.19 It is interesting to note that Bett et al.11 have foundthat neither the effect of platinum loading �5 wt % Pt/C vs a 20 wt% Pt/C, suggesting crystallite migration� nor the potential depen-dence �suggesting platinum dissolution and redeposition� on theplatinum area loss is significant. Based on the seemingly contradict-ing observations, they propose an Ostwald ripening process in whichplatinum transport would occur via transport of molecular platinumspecies on the carbon support, referred to as “2D Ostwald ripening.”This concept is in contrast to the Ostwald ripening process associ-ated with platinum dissolution and redeposition �typically referred toas “3D Ostwald ripening” via transport of soluble platinum speciesin the electrolyte�. It is apparent that it would be difficult to ratio-nalize the observed migration of platinum from the cathode to thecathode/matrix interface8,17 and the anode with crystallite migrationand coalescence alone �without stipulating a platinum dissolutionand redeposition mechanism�.
Attempts have also been made to distinguish these two mecha-nisms by comparing measured platinum area loss rate laws13 withtheoretically derived rate laws19 but have failed as a result of theclose similarity in the rate laws. Other approaches are based oncomparing experimental data with theoretically predicted particlesize distributions of aged catalysts, i.e., log-normal particle size dis-tributions with tailing toward small �Ostwald ripening� or towardlarge �crystallite migration and coalescence� particle sizes.20 In allcases, platinum particle size distributions of aged PAFC cathodes dodisplay tailing toward large particles,8,9,11 pointing toward platinumnanoparticle migration and coalescence. However, several possibleartifacts/complications prevent a conclusive confirmation of thismechanism: �i� the resolution of TEM measurements used in theprevious studies suppresses the counting of small particles and �ii�an additional growth mechanism involving chemical reduction ofsoluble Pt ions by hydrogen molecules permeated across the matrixleads to superposition of two particle size distributions, which re-sults in an apparent tailing toward large particle sizes. The existenceof two superimposed growth modes has been suggested by Araganeet al.8,17 in PAFCs and is presented for PEMFCs in this study.
In summary, the question of whether Ostwald ripening �via plati-num dissolution and redeposition� or crystallite migration governsplatinum coarsening and platinum area loss in PAFCs is not resolvedin the literature. The observation of platinum particles in the matrixand platinum movement from the cathode to the anode in PAFCsprovides unambiguous support for the presence of soluble platinumspecies.
Platinum area loss in PEMFCs under steady-state condi-tions.— Although PEMFCs operate at �80°C considerably lowerthan the operating temperature of PAFCs at �200°C, substantialplatinum area loss over time under steady-state operation has beenshown5,21,22 to occur in PEMFCs. Similar to PAFCs,8,18 the follow-ing observations have been made: �i� platinum area loss of PEMFCcathodes is much larger than that of anodes5,22; �ii� platinum hasbeen detected in the polymer membrane23 after extended life testing�analogous to the findings in PAFCs8,17�; �iii� soluble platinum spe-cies have been found in the water collected from the reactant gasesexiting the cell21 �presumably complexed by a molar excess of fluo-ride and sulfate ions produced by membrane degradation�. Both thepotential dependence of platinum area loss �small at the low poten-tial of the anode and large at the high cathode potential� and thepresence of platinum in the stack effluent and membrane suggestthat platinum dissolution and precipitation plays an important role inthe platinum area loss of PEMFCs. Indication of platinum dissolu-tion in strong acids can be found in the Pourbaix diagram of plati-num, where a small potential region of soluble platinum species issuggested.24 In addition, significant platinum dissolution in 0.5 MH2SO4 at room temperature has been reported by Woods,25 where aweak potential dependence of the dissolution rate between 1.1 and1.5 V is noted.
Voltage cycling induced platinum area loss.— It is known thatvoltage cycling of polycrystalline and Pt/C in aqueous acids at roomtemperature leads to accelerated platinum dissolution rates com-pared to extended holds at constant potentials.25,26 This phenomenonhas been reported for the first time in PEMFCs by Patterson,23
where accelerated platinum area loss of a H2-air PEM cathode isobserved when subjected to square-wave voltage cycles between0.87 and 1.20 V �65°C and 60 s/cycle�. Post-mortem analysis of theMEA after �100 h reveals the presence of platinum in the mem-brane, which implies that platinum diffusion occurs on the microme-ter scale �i.e., �10 �m from the cathode into the membrane in com-parison to �10 nm from a platinum nanoparticle to a neighboringnanoparticle�.
Darling and Meyers27 have recently developed an initial numeri-cal model for the platinum area loss induced by voltage cycling,which includes a potential-dependent dissolution of platinum�Pt ↔ Pt+2 + 2e−, i.e., a 2.303 RT/2F potential dependence�, chemi-cal dissolution of platinum oxide �PtO + 2H+ ↔ Pt2+ + H2O�, andsurface tension driven growth of platinum nanoparticles. This analy-sis has been subsequently refined28 and used to reasonably modeland reproduce Patterson’s voltage cycling data.23 Although thismodel considers diffusion of Pt2+ from the cathode to the anode andelectrochemical reduction into platinum �Pt2+ + 2e− → Pt�, it failsto account for the fact that platinum particles have been detectedinside the membrane reported by Patterson.23
In this study, we first examine the effect of potential on platinumdissolution in 0.5 M H2SO4 and platinum surface losses in two shortstacks, where platinum surface area losses over the life of the stackswere monitored using cyclic voltammetry. The effect of potentialcycling of an MEA on platinum surface area loss in the cathode isthen examined in detail by cyclic voltammetry, glancing angle X-raydiffraction of MEA anode and cathode, and TEM of Pt/C electro-catalyst powder and cross-sectioned cathode samples. Of particularsignificance is the fact that cross-sectional TEM data through thecathode thickness �in the direction perpendicular to membrane sur-face� from the DM/cathode interface to the cathode/membrane in-terface show different platinum particle size distributions across thecathode thickness and reveal two very distinct growth modes. Fi-nally, two processes responsible for platinum coarsening, namelyOstwald ripening on the nanometer-scale and diffusion of oxidizedplatinum species on the micrometer-scale with precipitation of plati-num particles in the ionomer, are identified, and their contributionsto platinum surface loss during voltage cycling are quantified anddiscussed in detail.

A2258 Journal of The Electrochemical Society, 152 �11� A2256-A2271 �2005�A2258
Experimental
Three different Pt/C catalysts were used to study the mechanismsof platinum instability in this study: �i� a commercial platinum cata-lyst �46 wt % Pt/C from Tanaka� on a proprietary high surface areacarbon support was used in the platinum solubility experiments inaqueous sulfuric acid; �ii� in situ fuel cell short-stack tests wereconducted on commercially available Gore Series-5510 Pt/Ccatalyst-coated membranes �CCMs�, having 0.4/0.4 mgPt/cm2 forboth anode and cathode and a �25 �m membrane �although the wt% of Pt/C and the exact nature of the carbon are proprietary, the wt% of Pt/C was estimated to be 40-60 wt % from catalyst layerthicknesses and catalyst loading�; and �iii� a commercial catalystsupported on Vulcan carbon �46 wt % Pt/Vulcan from Tanaka� wasused in potential cycling experiments and in subsequent detailedX-ray powder diffraction and TEM analyses. The initial Pt-specificsurface areas �on the carbon support� from these three electrocata-lysts measured in CCMs are quite comparable: 72 m2/gPt for the 46wt % Pt/C catalyst from Tanaka �see Table 2 of Ref. 2�,70-75 m2/gPt for the Pt/C catalyst in the commercial Gore CCMs�Fig. 2b in this study�, and 63 m2/gPt for the 46 wt % Pt/Vulcancatalyst �Fig. 4 and Table II in this study�. Therefore, despite the factthat different Pt/C catalysts were used in our study, we believe thatthe comparison among electrochemical measurements of these dif-ferent electrocatalysts is valid.
Platinum equilibrium solubility measurements.— Platinum dis-solution rates for platinum supported on carbon were measured in0.5 M H2SO4 at 80°C as a function of applied potential from 0.9 to1.1 V vs RHE. The working electrode consisted of 46 wt % Pt/C�from Tanaka� coated on one side of a 12.5 cm2 carbon-fiber papersubstrate �Toray Inc., Japan� at a loading of 0.67 mgPt/cm2. It wasimmersed into 120 mL 0.5 M H2SO4 in a three-compartment elec-trochemical cell maintained at 80°C. The working electrode com-partment was separated from the counter electrode �gold gauze�through a thick glass frit to minimize migration of soluble platinumspecies to the counter electrode. A saturated calomel electrode�SCE� served as the reference electrode, separated by a closed elec-trolyte bridge from the working electrode compartment in order tocircumvent chloride contamination. The potential of the referenceelectrodes was carefully calibrated using a RHE before and aftereach experiment.
Prior to and during the experiments, the working electrode com-partment was purged with nitrogen �20 mL/min� and stirred with aTeflon coated magnetic stirrer at 1000 rpm to assure uniform mix-ing. Prior to immersion of the working electrode, acid samples weredrawn and analyzed by ICP in order to confirm that no platinum waspresent at the start of the experiments. The platinum concentrationsin the acid were monitored by collecting 20 mL samples that wereanalyzed using an ICP method �10 ppb quantification limit at IMRTest Labs, Ithaca, NY�. The withdrawn acid volume was replenishedwith fresh electrolyte each time a sample was taken. Althoughsteady-state platinum concentrations in the acid were usuallyreached within the first 24 h, each potential hold was applied for50-100 h in this study.
Steady-state potential–Platinum surface area loss.— Two 15-cell short stacks �800 cm2 active area� were operated for 2000 h atsteady state with H2-air �stoichiometric reactant flows of s = 2/2� at80°C �fully humidified� and 150 kPaabs. Gore Series-5510 CCMswith 0.4 mgPt/cm2 Pt/C loadings were sandwiched between carbon-fiber paper based diffusion media �Toray Inc., Japan� with propri-etary hydrophobic treatments and microporous layers.3 To examinethe effect of potential on platinum dissolution, one stack was oper-ated without applied load having an open-circuit voltage �OCV� of�0.95 V and the other stack was operated 0.2 A/cm2 ��0.75 Vcathode potential vs RHE�. In situ cyclic voltammetry measure-ments were carried out intermittently at 25°C to determine theelectrochemical platinum surface area in the cathode �evaluated interms of m2/g �.3
PtElectrochemical potential cycling–Accelerated platinum surfacearea loss.— CCMs were prepared by coating an ink made of 46 wt% Pt/Vulcan and Nafion ionomer solution onto a decal and subse-quently hot-pressing onto a 50-�m-thick Nafion membrane.3 Bothanode and cathode loadings were 0.4 mgPt/cm2, resulting in ap-proximately 13-�m-thick electrodes. CCMs were assembled into50 cm2 cells,3 which were fed with fully humidified H2 �anode� andN2 �cathode� at 80°C at ambient pressure. The cathode was cycledbetween 0.6 and 1.0 V �referenced to the anode, i.e., the RHE po-tential scale� at a sweep rate of 20 mV/s. Such a potential rangerepresents cycling a fuel cell stack between OCV and peak power.Gamry potentiostat boards with in-house LabView software wereused for potential cycling and data acquisition. In situ cyclicvoltammetry measurements were carried out at different times at25°C 3 to determine hydrogen adsorption and the electrochemicallyactive, specific area of platinum in the cathode. CCMs cycled withthis procedure were used in the subsequent X-ray powder diffractionand TEM measurements in this study.
X-ray powder diffraction analysis.— X-ray diffraction patternsof the pristine powder and cycled 46 wt % Pt/Vulcan MEA sampleswere collected using a Rigaku Rotaflex X-ray diffractometer withcopper rotating anode �Cu K��. Normal incidence X-ray diffractionmode was used for the pristine Pt/Vulcan sample while glancingangle mode X-ray diffraction with 1° angle of incidence was em-ployed for the cycled Pt/Vulcan samples. An in-house glancingangle mode sample holder was used to secure the cycled Pt/Vulcansamples in the diffractometer. A continuous scan rate of 1° perminute from 35° to 90° of 2� was used for all samples.
The depth of X-ray penetration in the PEMFC electrode samplescan be estimated by computing the X-ray intensity I�x� at depth xfrom the following relationship29
I�x� = Ioe�−�� /��electrode�electrodex� �1�
where ��/��electrode is the mass attenuation coefficient of porouselectrodes and �electrode is the density of porous electrodes.
As the fabrication procedure of anode and cathode is identicaland both electrodes �having 46 wt % Pt/Vulcan, a Nafion:C weightratio of 0.8:1, and Nafion with an approximate net composition ofCF2� consist of 32 wt % Pt, 23 wt % F, and 45 wt % C, we have
��
��
electrode= 0.32��
��
Pt+ 0.23��
��
F+ 0.45��
��
C= 48.9 cm2/g
�2�By considering that the electrodes are 67% porous,3 the density
of Pt/Vulcan porous structure and electrode densities can be calcu-lated from the following equations, respectively
�Pt/C = 0.33� �Pt�C
0.46 �C + 0.54 �Pt� = 1.23 g/cm3 �3�
�electrode =�Pt/C�CF2
0.35 �Pt/C + 0.65 �CF2
= 1.46 g/cm3 �4�
The characteristic depth of X-ray penetration, I�x� = Ioe−1, in theanode and cathode was found to be 140 �m from Eq. 1. As thischaracteristic depth is greater than the thickness of MEA samples,X-ray diffraction experiments of the MEA sample at normal inci-dence would lead to collection of diffracted intensities of both anodeand cathode. Therefore, X-ray diffraction data collection at low in-cident angles is required to obtain diffracted intensities from onlythe cathode �or the anode� alone. As less than 0.5% of X-ray inten-sity passes though these electrodes at an incident angle of 1°�13 �m/sin1° = 745 �m for X-ray beam path�, X-ray powder dif-fraction patterns of anode and cathode in the cycled Pt/Vulcan MEAsample were collected at this incident angle.

A2259Journal of The Electrochemical Society, 152 �11� A2256-A2271 �2005� A2259
TEM analysis.— The pristine Pt/Vulcan electrocatalyst powdersample and a sample of powders scraped away and collected with arazor blade from the cathode surface �adjacent to DM� of the cycledMEA sample were examined and compared using TEM. Powderswere first immersed in toluene and subsequently ultrasonicated for10 s under high frequency to disperse the powder particles. Thesuspensions were then deposited on a carbon/copper grid for TEMobservation.
Cross-sectional TEM samples were prepared from the cycledMEA sample. A small strip was first cut from the cycled MEA. Thestrip was next mounted on an epoxy and cured at approximately60°C for 12 h. In order to track the cathode side, a small paper stripwas placed on the top of the cathode side. Since the epoxy wastransparent after curing, identification of the cathode side wasreadily made. 100-nm-thick slices of these strips were then cut bymicrotoming with a diamond knife such that a width-wise cross-sectional area was transparent to the electron beam. The cross-sectional thin slices were subsequently deposited on a carbon/coppergrid for TEM observation. Both the powder and the cross-sectionalsamples were observed in a JEOL 2010 FX operated at 200 keV.
Results and Discussion
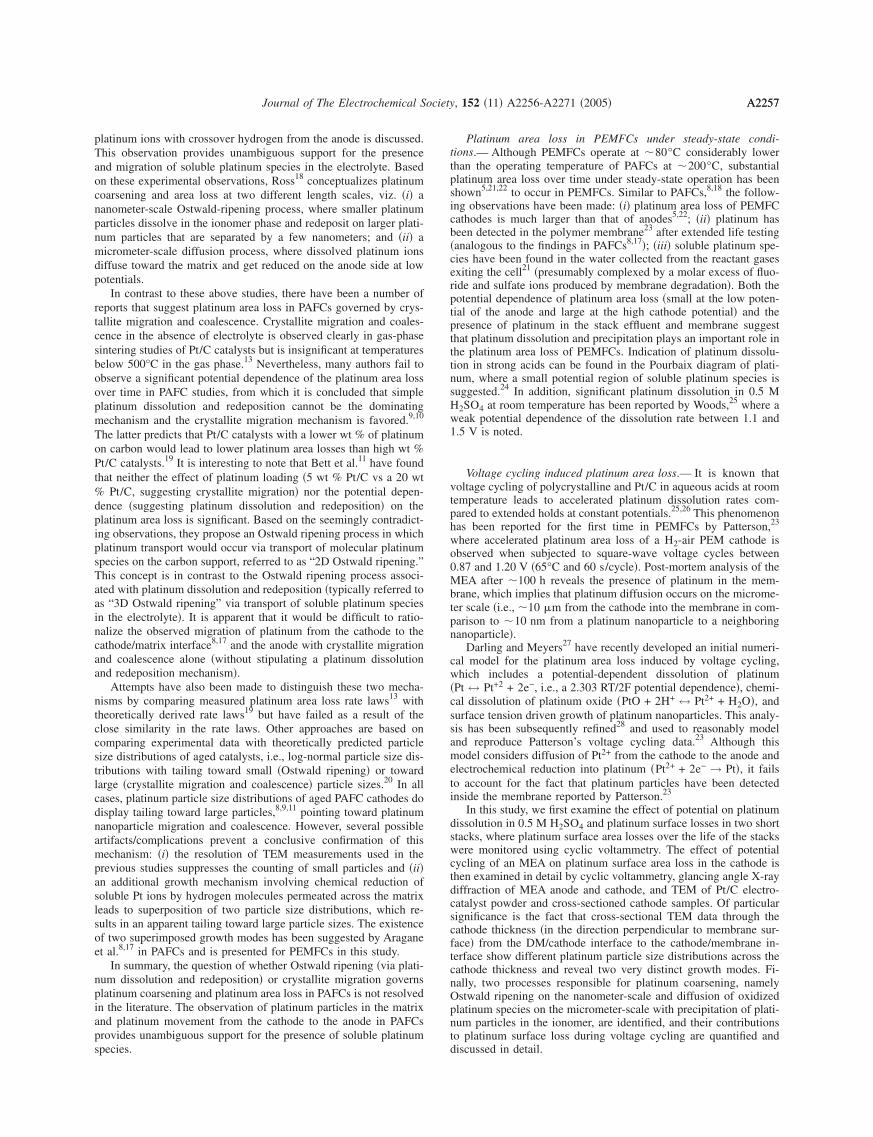
Platinum solubility in aqueous acids as a function of poten-tial.— The measured concentration of soluble platinum species forthe 46 wt % Pt/C catalyst in 0.5 M H2SO4 at 80°C is shown as afunction of applied voltage in Fig. 1 �solid circles�. Substantial plati-num dissolution is noted, which will be used subsequently to predictplatinum surface area loss for a stack operated under identical tem-perature and voltage conditions. The observed platinum equilibriumconcentration increases with rising electrode potential in the mea-sured range from 0.9 to 1.1 V vs RHE. This potential dependence,however, is much weaker than the Nernstian behavior for a Pt/Pt+2
dissolution equilibrium of a platinum foil at 25°C shown in theplatinum Pourbaix diagram24 �see long-dashed line in Fig. 1� and in96% H3PO4 at 196°C reported by Bindra et al.15 �see thin solid linein Fig. 1�. The Nernstian principle predicts a ten-fold increase of thePt+2 concentration for every 2.303 RT/�2F� increase in potential,which translates to 29.5 mV at 25°C and 46.5 mV at 196°C. Usingthe data of Pourbaix and Bindra et al., the reversible potentials of theplatinum dissolution reaction were calculated at both temperatures,from which the standard Gibbs free energies of the reaction,�Gr
o�T�, were computed according to �Gro�T� = −ET
o /�2F�. Thetemperature dependence of �Go�T� was then estimated assuming a
Figure 1. Equilibrium soluble platinum concentration as a function of tem-perature and voltage. Solid line, 196°C, platinum foil �from Bindra et al.15�;dashed line, 25°C, platinum foil �from Pourbaix24�; short-dashed line, 80°C,platinum foil �interpolated�; solid circles, 80°C, 2-3 nm platinum particlesof a 46 wt % Pt/C electrocatalyst powder �Tanaka� sample measured in0.5 M H2SO4.
r
temperature-independent heat capacity change ��cPr � and a
temperature-independent entropy change ��Sro� of the reaction ac-
cording to
�Gro�T� − �Gr
o�To� = �cPr �T − T0� − �Sr
o�T − T0� − �cPr T ln�T/T0�
�5a�
Assuming the value of �cPr T ln�T/T0� is small in the temperature
range from 25 to 196°C and can be neglected, Eq. 5a can be sim-plified to the following expression
�Gro�T� − �Gr
o�To� = �cPr �T − To� − �Sr
o�T − To� = C�T − To��5b�
where C is a temperature-independent parameter. Knowing the stan-dard Gibbs free energies of the platinum dissolution reaction at196°C �T� and 25°C �To�, the values of C were calculated from Eq.5b, from which �Gr
o�T = 80°C� and the reversible potential of thereaction at 80°C were obtained. The resulting interpolated solubilityof platinum vs potential equilibrium at 80°C is shown as the short-dashed line in Fig. 1.
Although our experimental data of the Pt/C sample and the in-terpolated prediction are in good quantitative agreement at 0.95 Vand 80°C, the experimental potential dependence of dissolved plati-num species from the 46 wt % Pt/C electrocatalyst is much weakerthan the Nernstian behavior for a Pt/Pt+2 dissolution equilibrium.Experimentally, we believe that impurity effects and analytical mea-surement errors can be excluded from our experiments. At present,this discrepancy is not understood, which could be attributed in partto the facts that �i� the experiments reported by Pourbaix24 and byBindra et al.15 were conducted with polycrystalline platinum foilswhile our experiments were conducted on carbon supported plati-num nanoparticles, and �ii� soluble platinum species include oxi-dized platinum species other than Pt2+, which will be examined infuture studies.
Platinum area loss in steady-state short-stack experiments.—Although the potential dependence of the platinum solubility is notclearly understood, it is apparent that platinum solubility increaseswith cathode potential, which suggests faster platinum area lossrates in stacks operated at higher potentials. Figure 2a shows thevoltages of two different short stacks operated over 2000 h at OCV�upper line, �0.95 V vs RHE� and at a constant current of0.2 A/cm2 �lower line, �0.75 V vs RHE�. A linear approximationof the voltage decay rates for those two stacks yields 20 and25 �V/h for stack operation at OCV and 0.2 A/cm2, respectively.These rather similar voltage decay rates are surprising as the poten-tial dependence of platinum solubility suggests lower decay rates forlower cathode potentials as reported for PAFC stacks.17 Evaluationof the measured platinum surface area, SPt, over time �see Fig. 2b�,however, resolves this apparent inconsistency and demonstrates thatthe platinum area loss of the stack operated at OCV is much morepronounced than that for operation at 0.2 A/cm2.
In order to determine the origin of the similar voltage decay ratesof the two stacks, we examine the kinetically predicted voltage de-cay rate for the stack operated at OCV. At OCV, the cell voltage iscontrolled by the hydrogen permeation rate through the membrane,which is often referred to as crossover current, ix, typically in therange of 1–5 mA/cm2.23 The crossover current depends on the hy-drogen partial pressure, the type of the membrane, and the mem-brane thickness, all of which may be considered constant over time.As mass transport induced voltage losses are negligible at OCV andthe hydrogen overpotential is essentially zero due to facile electrodekinetics1 of hydrogen oxidation, the OCV voltage �Ecell� is con-trolled primarily by the cathode potential �Ecathode� for a given H2permeation rate. Consequently, the OCV voltage decay can be cal-culated from the known cathode kinetics by relating cathode poten-tial to the time-varying platinum electrochemical surface area,S �t�3
Pt

A2260 Journal of The Electrochemical Society, 152 �11� A2256-A2271 �2005�A2260
EcellOCV = Erev�PH2
,PO2,T� + �b log�10SPtio��cathode �6a�
� � EcellOCV
� t�
i,i0,T,pi
� � Ecathode
� t�
i,i0,T,pi
=b log� SPt�t�
SPt�t = 0���cathode
t
�6b�
where Erev is the reversible cell potential at a given PH2,PO2
,and temperature, i0 is the specific activity of the cathodeelectrocatalyst,2,3 b is the Tafel slope of the oxygen reduction reac-tion with a value of 0.070 V at 80°C �i.e., a value of 2.303RT/F2,3�,and t is the duration of the experiment. It is assumed in Eq. 6a and6b that the activation overpotential for hydrogen oxidation and masstransport overpotential is negligible. Moreover, it should be men-tioned that Eq. 6b is only valid if the specific activity of the cathodecatalyst does not vary significantly with the platinum area, SPt. Thisassumption was confirmed in a recent study by Yu et al.,30 in whichless than a 25% variation of i0 was found for largely varying specificsurface areas during fuel cell durability tests of both Pt/C andPtCo/C catalysts. Using the OCV data shown in Fig. 2b �squaresymbols� and Eq. 6b, a voltage decay rate of 22 �V/h was found, inexcellent agreement with the experimentally observed voltage deg-radation of 20 �V/h for the stack in Fig. 2a �square symbols�.
Figure 2. Cell voltage �a� and platinum surface area �b� as a function ofshort-stack runtime. Dashed line in �b� corresponds to platinum surface arealoss calculated from Eq. 7 and 8 and using Pt2+ equilibrium concentrationmeasured at 80°C, 0.95 V in 0.5 M H2SO4 �solid symbols in Fig. 1�. Shortstacks were operated with H2 air �stoichiometric flows of 2/2� under 80°C,150 kPaabs, and 100% RH.
For the stack operated at 0.2 A/cm2, a kinetic voltage decay rate�resulting from reduction of platinum surface area only� of 10 �V/hwas found, which was calculated from the data in Fig. 2b �triangularsymbols� using a relationship analogous to Eq. 6b. This kinetic volt-age decay rate is significantly lower than the experimentally ob-served value of 25 �V/h in Fig. 2a �triangular symbols�. As thekinetic decay rate calculated from Eq. 6b represents the minimumvalue, we speculate that additional mass transport losses lead to adecay rate of 15 �V/h, which exceeds the kinetically predictedvalue.
Hypothesis of platinum surface area loss mechanisms.— Inaddition to potential dependence of platinum dissolution in 0.5 MH2SO4 and platinum surface area losses in two short stacks shownin the previous sections, post-mortem scanning electron microscopy�SEM� analysis of the CCMs from the two short-stack experimentsrevealed that platinum particles were present in the membrane closeto the cathode/membrane interface. An SEM image of a cross-sectional MEA from the stack operated at OCV is shown in Fig. 3bfor example, where a band of platinum in the membrane �close tothe cathode/membrane interface� can be noted. A similar phenom-enon was reported by Yu et al.30 in a cathode cycled between 0.87and 1.2 V vs RHE. The presence of platinum particles in the mem-brane provides unambiguous evidence for migration of soluble plati-num species in the ionomer on the micrometer scale in PEMFCsduring voltage cycling. The location of platinum precipitation in themembrane depends upon the relative partial pressures of hydrogenand oxygen of the reactants for a given membrane. The Pt band isexpected to be well within the membrane for H2-air operation �seeFig. 3b� but moves to the membrane/cathode interface as the oxygenpartial pressure in the membrane approaches zero �in the case ofH –N potential cycling experiments�.
Figure 3. �a� Schematic representing platinum surface area loss on �i� thenanometer scale, where platinum particles grow on carbon support viaOstwald ripening, and �ii� the micrometer scale, where dissolved platinumspecies diffuse toward the membrane, become reduced, and precipitate asplatinum particles in the ionomer phase by crossover hydrogen moleculesfrom the anode. �b� SEM cross section of a short-stack MEA operating atOCV for 2000 h, where the bright band in the image indicates platinumdeposited in the membrane close to the membrane/cathode interface.
2 2

A2261Journal of The Electrochemical Society, 152 �11� A2256-A2271 �2005� A2261
Here we propose and discuss two processes similar to those in-troduced by Ross18 for platinum surface loss in PEMFCs, as illus-trated in Fig. 3a:
1. Ostwald ripening of platinum particles on the carbon supporton the nanometer scale via transport of platinum species mobile inthe ionomer phase or on the carbon support.
2. Diffusion of soluble, oxidized platinum species �such as Pt2+�in the ionomer phase on the micrometer-scale process toward themembrane and the anode driven by a concentration gradient ofsoluble platinum species, chemical reduction of oxidized platinumspecies by crossover H2 molecules near the cathode/membrane in-terface, and precipitation of platinum particles in the ionomer phasenear the cathode/membrane interface. Platinum particles precipitatedin the membrane have no electrical contact and, therefore, are nolonger electrochemically active.31
The concentration of soluble platinum species in the cathodedecreases from the DM/cathode interface to the cathode/membraneinterface as crossover H2 molecules permeated from the membraneinto the cathode chemically reduce these soluble species to platinumparticles in the ionomer phase of the cathode. The flux of solubleplatinum species �such as Pt2+� from the DM/cathode interface �e.g.,cPt2+� toward the cathode/membrane interface �by assumingcPt2+ = 0� on the micrometer scale was estimated using a similaranalytical method to that of Ross18 to predict platinum loss associ-ated with the migration and precipitation process on the micrometerscale. The Pt2+ flux �NPt� dissolved from the platinum particles wasestimated by means of a simple Fickian semi-infinite 1D diffusion18
NPt DeffcPt2+
L�7�
where Deff is the effective diffusion coefficient of Pt2+ in the iono-mer phase of the electrode, cPt2+ is the equilibrium Pt2+ concentra-tion at a given potential, and L is the thickness of the cathode. Theeffective diffusion coefficient of Pt2+ in the ionomer phase can beestimated to be �8 � 10−7 cm2/s from the following equation
Deff DPt2+,H2OionomerxH2O �8�
where DPt2+,H2O is the diffusion coefficient of Pt2+ ions in water�10−5 cm2/s according to Newman32�, ionomer is the volume fractionof the ionomer in the electrode with a value of �0.23, and xH2O isthe volume fraction of water in the ionomer phase having a value of�0.4 ��20 H2O/SO3H+�.33
We computed Pt2+ flux and platinum loss for the stack operatedat OCV ��0.95 V� by incorporating the measured Pt2+ equilibriumconcentration at 0.95 V �cPt2+ = 10−6 mol/L in Fig. 1� and an aver-age electrode thickness3 �L = 10 �m� in Eq. 7. This simplifiedmodel predicted a linear relationship of platinum surface area losswith time, as shown in Fig. 2 �dashed line�. This simple analysisdoes not take into account the nanometer-scale Ostwald ripeningmechanism that occurs in parallel to the micrometer-scale diffusion/precipitation mechanism nor changes in Pt2+ equilibrium concentra-tion as a function of increasing particle size. Calculated platinumsurface area loss using the Fickian diffusion model in the microme-ter scale agrees fairly well with the loss observed in the stack oper-ated under OCV �Fig. 2b�, which suggests that the migration ofplatinum species and precipitation of platinum particles in the iono-mer phase are a significant mechanism of cathode surface area loss.
Effect of potential cycling on platinum dissolution.— Theplatinum surface area in the cathode cycled between 0.6 and1.0 V and performed under H2–N2 at 80°C and 100% RH decreasedconsiderably, as shown in Fig. 4. It was found that theelectrochemical surface area of platinum was reduced considerablyupon potential cycling, from 63 m2/gPt in the pristine cathodeto 23 m2/gPt in the cycled cathode after 10,000 cycles. Thisreduction in platinum specific area �63% of the initial area was
lost� would amount to a minimum cathode kinetic voltage lossof 31 mV using Eq. 6b on the cathode when tested in H2-airfuel cells. The voltage loss in turn translates to an unacceptablyhigh voltage degradation rate of �300 �V/h in �100 h �10,000cycles� as compared to targeted automotive degradation rates of�10 �V/h. Pristine and cycled MEAs �after 10,000 cycles� werecompared in the following X-ray diffraction and TEM studiesto further examine the two mechanisms described in Fig. 3a.
X-ray diffraction analysis.— The X-ray powder diffraction pat-tern of the pristine Pt/Vulcan powder sample collected at normalincidence is compared to those of the anode and cathode in thecycled Pt/Vulcan MEA sample collected at 1° incidence in Fig. 5.The sharpening of the platinum diffraction peaks is evident for thecycled cathode, which indicates a considerable increase in thevolume-averaged crystal size of platinum in the cycled MEA cath-ode. The average platinum crystal sizes �volume averaged� of pris-tine and cycled Pt/Vulcan samples were estimated using the Scher-
Figure 4. Platinum surface area of the cathode with TKK 46 wt % Pt/Vulcancatalysts over 10,000 potential cycles at 20 mV/s in the voltage range0.6-1.0 V at 80°C under humidified H2–N2 �anode-cathode�.
Figure 5. �a� X-ray powder diffraction pattern of the pristine Pt/Vulcanpowder sample collected at normal incidence was compared to those ofanode �b� and cathode �c� in the cycled Pt/Vulcan MEA sample collected at1° incidence.

A2262 Journal of The Electrochemical Society, 152 �11� A2256-A2271 �2005�A2262
rer equation,29 by measuring the full width half maximum of the�111 Pt,�200 Pt, and the �220 Pt X-ray powder diffraction peaks inFig. 5. As shown in Table I, the pristine Pt/Vulcan sample wasfound to have a crystal size of 2.3 nm averaged over these threecrystallographic planes. Upon cycling between 0.6 and 1.0 V, thevolume averaged platinum crystal size in the cycled MEA cathodeincreased significantly to 10.5 nm. Therefore, significant coarseningand surface loss of platinum crystals occurred in the MEA cathodeduring potential cycling, which is consistent with previous studies ofpotential-dependent platinum instability in the PAFCs.12 In contrast,the average platinum crystal size in the cycled MEA anode grewonly slightly to 3.9 nm, and the significantly lower surface area lossof anodes vs cathodes is consistent with the findings of Tada et al.5
and Wilson et al.22 In the following sections, we report TEM obser-
Table I. The average size of platinum crystals in pristine andcycled Pt/Vulcan samples estimated from the ˆ111‰Pt, ˆ200‰Pt,and the ˆ220‰Pt peaks using the Scherrer equation.
Sampledescription
Pt crystalsize �nm��111 Pt
Pt crystalsize �nm��200 Pt
Pt crystalsize �nm��220 Pt
Average Ptcrystal size
�nm�
Pt/Vulcanpristine powder
2.3 2.3 2.3 2.3
Pt/Vulcancycled anode
MEA
4.2 3.6 4.0 3.9
Pt/Vulcancycled cathode
MEA
10.5 10.6 10.3 10.5
vations and analyses of morphological changes of platinum crystals�or particles� in the cycled MEA cathode relative to the pristinePt/Vulcan sample.
TEM analysis of the pristine Pt/Vulcan powder sample.— TEMimages collected from the pristine Pt/Vulcan powder sample at fourdifferent magnifications are shown in Fig. 6a-d. High-resolution lat-tice imaging revealed that most spherically shaped platinum par-ticles were platinum single crystals. Although a relatively uniformdispersion of platinum nanoparticles with sizes on the order of 2-4nm was observed on the carbon support, some agglomeration ofindividual platinum crystals was noted, as highlighted in Fig. 6c andd. It is believed that the interface among these individual platinumcrystals in the agglomerates is not electrochemically active, whichleads to a lower electrochemical surface area of platinum electro-catalysts than the apparent, specific surface area of platinum crystalsderived from the TEM and X-ray diffraction data.
The histogram of platinum particles measured from a randomselection of 200 spherically shaped platinum particles in the TEMimages of the pristine Pt/Vulcan sample revealed a mean particlediameter �number averaged�, � = 2.8 nm, and variance 2 = 0.27,as shown in Fig. 7 �data bars in solid shade�. It should be mentionedthat agglomerates of platinum particles and overlapped platinumparticles were not included in any of the measurements. A Gaussiandistribution having a mean particle diameter � = 3.0 nm and a vari-ance of 2 = 0.22 can be fitted to the experimental data of the pris-tine sample with a correlation factor of R2 = 0.95 �Fig. 7�. As ex-pected, the Gaussian fitted mean of platinum particles is in goodagreement with the mean calculated from individual TEM measure-ments.
Figure 6. �a�-�d� Sequence of TEM im-ages from the pristine Pt/Vulcan sample,taken at different magnifications, showingthe distribution of platinum nanoparticleson the carbon support. As shown in image�d�, particle agglomeration is noted insome cases.

A2263Journal of The Electrochemical Society, 152 �11� A2256-A2271 �2005� A2263
TEM analysis of powder scraped from the cycled MEA cathodesurface.— Typical TEM micrographs of the pristine Pt/Vulcan pow-der sample and a sample of powders scraped from the cycled MEAcathode are compared and shown in Fig. 8a and b, respectively. Asexpected from the X-ray diffraction results �Fig. 5 and Table I�,substantial platinum particle growth was noted in the cycled MEAcathode �Fig. 8b�. In contrast to the narrow particle size distributionfound for the pristine Pt/Vulcan powder sample, the sample of pow-ders retrieved from the cycled MEA cathode surface exhibited aconsiderably larger mean platinum diameter and a broader particlesize distribution having a mean diameter, � = 5.9 nm, and a vari-ance of 2 = 2.8, as shown in Fig. 7. A Gaussian distribution with amean platinum diameter � = 6.1 nm and a variance of 2 = 2.8 wasfitted to the experimental data, but the fit having a correlation factorof R2 = 0.89 is not as good as that of the pristine platinum particlehistogram �Fig. 7�.
Analysis of platinum specific area in the pristine Pt/Vulcan andcycled MEA cathode samples.— The values of platinum particlemean diameter in Fig. 7 are the number averaged diameters of the
Figure 7. Size distributions of platinum nanoparticles in the pristinePt/Vulcan sample and powders scraped from the cycled MEA cathodesurface �near the DM/cathode interface�. Measurements of 200 randomlyselected spherically shaped particles were made for each distribution.
platinum particles in the pristine and cycled samples, which can becomputed from TEM measurements of individual particle diameters,di, using the following equation
d̄n =
�i=1
n
di
n�9�
where d̄n is the number averaged diameter of platinum particles innm. As shown in Table II, the number averaged diameters of plati-num particles in the pristine Pt/Vulcan powder and cycled MEAcathode samples can be considerably different from the volume/areaaveraged diameters of TEM measurements, which can be calculatedfrom the following equation34
Figure 8. Typical TEM micrographs from�a� the pristine Pt/Vulcan samples powdersample and �b� powders scraped awayfrom the cathode surface of the cycledMEA sample. Considerable coarsening ofspherically shaped platinum nanoparticleswas found after potential cycling.
Table II. The number and volume/area averaged diameter ofplatinum particles from TEM measurements, specific surfacearea values of platinum particles computed from TEM and X-raydiffraction data, and the electrochemically active specific surfacearea of platinum particles from cyclic voltammetry experimentsin pristine and cycled Pt/V samples.
Sampledescription
d̄nTEM a
in nmd̄v/a
TEM b
in nmSv/a
TEM c
in m2/gPt
SvXRD d
in m2/gPt
SEC e
in m2/gPt
Pt/Vulcanpristinepowder
2.8 3.0 93 122 63
Pt/Vulcancycled
cathode MEA
5.9 6.9 41 27 23
S�cycled�
S�fresh�f — — 0.44 0.22 0.37
a Number averged diameter of Pt particles from TEM data according toEq. 9.
b Volume/area averaged diameter of Pt particles from TEM data ac-cording to Eq. 10.
c Specific, apparent surface area of Pt particles based on the volume/area averaged diameter and �Pt = 21.45 g/cm3.
d Specific, apparent surface area of Pt particles based on the volumeaveraged diameter of Pt particles from the X-ray diffraction data inTable I �see Eq. 11�.
e Electrochemically active surface area of Pt based on experimentalvoltagram data, a Pt loading of 0.4 mgPt/cm2, and the average surfacearea of one Pt atom of 0.076 nm2 �equivalent to 210 �C/cmPt
2 �.f The ratio between the specific surface area of Pt particles in thecycled MEA cathode and pristine samples.

A2264 Journal of The Electrochemical Society, 152 �11� A2256-A2271 �2005�A2264
d̄v/a = ��i=1
n
di3
�i=1
n
di2� �10�
where d̄v/a is the volume/area averaged diameter of platinum par-ticles in nm. This diameter better represents specific surface area ofplatinum �in m2/gPt� than the number averaged diameter. X-ray
powder diffraction measures the volume averaged diameter, d̄v,which is different from this volume/area averaged value for a givenparticle size distribution with finite peak width. It can be estimatedfrom summarizing the products of individual platinum crystal diam-eters and their volume fractions, as shown in the following simpli-fied expression
d̄v = �i=1
n
vidi = ��i=1
n
di4
�i=1
n
di3� �11�
where vi is the volume fraction of platinum crystal di.For the pristine sample, the volume averaged diameter �2.3 nm�
determined from X-ray powder diffraction �Table I� is slightly dif-ferent from the volume/area averaged one �3.0 nm� from TEM mea-surement �Table II�. It is believed that this difference results fromthe fact that platinum particles smaller than 1 nm were poorly rep-resented in the TEM measurements, therefore the volume/area aver-aged diameter from TEM would be slightly larger than that of X-raydiffraction. For the cycled MEA cathode, the volume averaged di-ameter �10.5 nm� determined from X-ray powder diffraction �TableI� is significantly different from the volume/area averaged one �6.9nm� from TEM data �Table II� collected from powder scrapped fromthe cycled MEA cathode surface. As X-ray powder diffraction de-termines the volume averaged crystal size, it preferentially detectslarge crystal sizes to small crystals in powder samples. The largedifference between the volume averaged and volume/area averageddiameters is attributed to a comparatively wide distribution of plati-num crystal sizes in the cycled MEA cathode relative to that of thepristine sample �Fig. 7�.
Apparent, specific surface area of Pt/C electrocatalysts can becomputed from the volume/area averaged �TEM data� or volumeaveraged diameter �X-ray diffraction data� of platinum crystals fromTEM and X-ray diffraction data according to the following relation-ship
Sv = 6�1000
�Ptd̄� �12�
where Sv is the specific surface area in m2/gPt, d̄ can be d̄v/a or d̄v,and �Pt is the density of platinum �21.45 g/cm3�. Apparent, specificsurface areas of platinum particles calculated from the volume/areaand volume averaged diameters using Eq. 1 are compared with thosecomputed from electrochemical measurements in Table II. For thepristine sample, comparison between the specific surface area fromthe TEM data �93 m2/g� and electrochemical measurements�63 m2/g� suggests that roughly 70% of the apparent area of plati-num particles is electrochemically active. We believe that the pro-portion is appropriate considering that �i� the platinum particles arenot perfectly spherical and �ii� platinum particles have moderatecontact areas with the carbon support, which reduces the electro-chemical surface area of platinum particles. In contrast, comparisonbetween the X-ray diffraction results and electrochemical measure-ments translates to 52% of the apparent, specific area that is elec-trochemically active. In addition to the platinum particle shape fac-tor and platinum particle contact area with carbon supportmentioned above, it is speculated that the large difference could
result from the fact that agglomeration of platinum particles on thecarbon support �Fig. 6c and d� excluded in the TEM analysis wouldfurther reduce the electrochemically measured, specific area of thesample relative to the apparent, specific area computed from thevolume averaged diameter �X-ray diffraction data�.
TEM, X-ray diffraction, and electrochemical measurements re-vealed significant surface loss of platinum particles in the cycledcathode, as shown in Table II. As expected from the wide platinumparticle size distribution of the cycled MEA cathode powder relativeto the pristine sample in Fig. 7, the apparent, specific surface area�41 m2/gPt� computed from the volume/area averaged diameter isgreater than that obtained from the volume averaged diameter�27 m2/gPt� obtained from X-ray diffraction analyses. The ratio�0.37� of the electrochemically active area between the fresh andcycled MEA samples is in good agreement with that �0.44� com-puted from the TEM-based, volume/area averaged diameter but inpoor agreement with that �0.22� of the specific surface area obtainedfrom the volume averaged diameter. Therefore, the increase in thevolume/area averaged diameter of platinum particles correspondswell with the reduction in the active area of Pt/C electrocatalysts inthe cycled MEA cathode.
The apparent, specific surface area �41 m2/gPt� of platinum par-ticles computed from the volume/area averaged diameter based onTEM data is considerably larger than the electrochemically activesurface area �23 m2/gPt�. As the powder sample used for data col-lection in Fig. 7 was obtained from the cycled MEA cathode surfaceadjacent to the DM layer, this substantial difference between theapparent specific surface area of powder near the DM/cathode inter-face and the electrochemical surface area of the entire cycled cath-ode suggests variation in the platinum particle size distribution as afunction of the cathode thickness �from the DM/cathode interface tothe cathode/membrane interface� in the cycled MEA cathode. Inorder to examine if coarsening of platinum nanoparticles is indeednonuniform across the cathode thickness, TEM cross section studiesof the cycled MEA cathode were performed.
TEM analysis of cycled MEA cross-sectional samples.— Visualinspection of cross-sectional TEM data.— Cross-sectional cycledMEA cathode samples were examined and TEM micrographs wererecorded across the thickness of the cathode. Four micrographstaken from four different locations in the schematic of Fig. 9 areshown in Fig. 10a-d, respectively. These micrographs clearly dem-onstrate that the sizes and morphologies of the platinum particlesvary greatly from the DM/cathode interface to the cathode/membrane interface. Near the DM/cathode interface �Fig. 10a�, mostplatinum particles remain spherical and have a fairly uniform sizedistribution. Moving away from the DM/cathode surface toward thecathode/membrane interface, the number of nonspherical platinumagglomerates on carbon and nonspherical platinum particles off car-bon increases considerably at the expense of spherical platinum par-ticles on carbon, as shown in Fig. 10b-d. Two distinct morphologies�spherically shaped platinum particles on carbon and nonsphericalplatinum particles off carbon� are shown clearly and compared in
Figure 9. Schematic of the cycled cross-sectional MEA cathode and TEMimages were obtained sequentially in the direction perpendicular to themembrane surface from the DM/cathode interface to the cathode/membraneinterface. Four images collected from locations a-d are shown in Fig. 10.

A2265Journal of The Electrochemical Society, 152 �11� A2256-A2271 �2005� A2265
Fig. 11a and b, respectively. The presence of these two platinumparticle morphologies is consistent with two parallel platinumgrowth mechanisms on the nanometer and micrometer scale as de-picted in Fig. 3a, and the growth mechanisms of these particles inthe cycled MEA cathode will be discussed in detail.
Histograms of platinum particle sizes from cross-sectional TEMdata.— The histograms of platinum particles obtained from 100measurements in the TEM micrographs of Fig. 10a-d are shown inFig. 12a-d, respectively. In these histograms, only spherical plati-num particles on carbon and nonspherical platinum particles off car-bon were considered while large nonspherical platinum agglomer-ates on carbon were excluded. The Gaussian distribution of platinumparticles in the pristine Pt/Vulcan sample from Fig. 7 is overlaid inFig. 12a-d for comparison. It is evident that substantial platinumparticle growth was found throughout the MEA cathode after poten-tial cycling and the number of platinum particles on the order of 2-3nm, predominant in the pristine Pt/Vulcan sample, was reduced sig-nificantly in the cycled MEA cathode. Of significance is that thenumber of large platinum particles off carbon increases from theDM/cathode interface to the cathode/membrane interface. Variationin the platinum particle size distribution in the cycled MEA cathodefound in this study is consistent with the findings of Aragane etal.,8,17 where a similar trend in the variation of platinum particle sizedistributions across the cathode thickness was found in a PAFCcathode operated for 1500 h.
The histograms obtained from TEM images of the cycled MEAcathode shown in Fig. 12a-d exhibit a tail at large platinum particlesizes and this tail is particularly pronounced toward the cathode/membrane interface. Nonspherical platinum particles off carbon cor-respond to most of the particles with sizes greater than 10 nm andtheir presence gives rise to the tail in these histograms. Such particlesize distributions were used to support the mechanism of crystalmigration and coalescence in many previous studies.22,35 However,
the rationale is only valid if all platinum particles coarsen by onesingle process and they are still attached to the carbon. The obser-vation of these large platinum particles off carbon in the cycledMEA cathode supports the formation and diffusion of mobile plati-num species and precipitation of platinum particles in the ionomerphase as these platinum particles off carbon could not be formed bycrystal migration and coalescence. This result supports themicrometer-scale growth mechanism assisted by crossover H2 mol-ecules in the cathode permeated through the membrane as proposedin Fig. 3a.
A more careful examination of these cross-sectional micrographs�Fig. 10a-d� and histogram data revealed that the size distributionsof spherical platinum particles on carbon, as indicated by the peakbetween 5 and 6 nm in the histograms �Fig. 12a-d�, were compa-rable across the cathode thickness. This observation suggests thatthe platinum growth mode on the carbon particles is independent ofcathode thickness even though the total amount of platinum particleson the carbon support decreases toward the membrane/cathode in-terface. This finding is consistent with previous studies of Araganeet al.8,17 in TEM cross sections of aged PAFC electrodes, where thelow particle size peak remains at the same position while its heightnear the matrix/cathode interface is much lower than at the DM/cathode interface. This result supports the idea that the coarsening ofspherical platinum particles on carbon across the cycled MEA cath-ode thickness proceeds in one single process, namely, Ostwald rip-ening on the nanometer scale as proposed in Fig. 3a. As Ostwaldripening is driven by reduction of the surface energy of platinumparticles, very small platinum particles should disappear and thesmall particle size end of the distribution should shift to larger val-ues in the cycled MEA cathode relative to the pristine sample. Thisis consistent with our observation that the number of platinum par-ticles equal to and smaller than 5 nm is reduced significantly in thecycled MEA cathode in Fig. 12a-d. This mechanism would lead to a
Figure 10. �a�-�d� TEM micrographs ob-tained from locations a, b, c, and d in thecross-sectional MEA cathode shown inFig. 9.

A2266 Journal of The Electrochemical Society, 152 �11� A2256-A2271 �2005�A2266
constant specific surface area in m2/gPt of platinum particles oncarbon across the cathode thickness in the cycled MEA cathode eventhough the total weight of platinum on carbon decreases from theDM/cathode interface to the cathode/membrane interface.
Specific surface area of platinum particles (on carbon) throughthe cathode thickness.— We analyze the histogram in Fig. 12a toquantify the specific surface area of platinum particles on the carbonsupport at 1 �m from the DM/cathode interface. The histogram inFig. 12a collected from the platinum particles located at 1 �m fromthe DM/cathode surface can be fitted to a Gaussian distribution witha mean of 5.5 nm and a variance of 2.3 having a correlation factor ofR2 = 0.91. The mean is in good agreement with the values obtainedfor powder scrapped off the cycled MEA cathode surface in Fig. 7.The surface/area averaged diameter of platinum particles on carbon1 �m from the DM/cathode interface calculated from the histogramin Fig. 12a from Eq. 1 is equal to 7.0 nm, considerably higher thanthat of the pristine Pt/Vulcan sample �3.0 nm in Table II�. Thisincrease �7 nm/3 nm = 2.3� in the volume/area averaged diameterleads to reduction �1/2.3 = 0.43; 43% of original platinum surfacearea remaining in the region� of the platinum specific surface area inthis region according to Eq. 1. As the ratio of the apparent, specificarea of platinum between the fresh and cycled MEA cathode com-puted from the TEM-based, volume/area averaged diameters ofplatinum particles corresponds well to the change in the electro-chemically active area �Table II�, the specific surface area of plati-
Figure 11. �a� Spherically shaped Pt nanoparticles on carbon predominatenear the DM/cathode interface and �b� nonspherical particles off carbonsupport are increasingly more abundant toward the cathode/membraneinterface.
num particles at 1 �m away from the DM/cathode interface in thecycled MEA cathode was estimated as the product of thisratio and the electrochemically measured, specific surface area�63 m2/gPt� of platinum particles in the fresh MEA cathode �i.e.,0.43 � 63 m2/gPt = 27 m2/gPt�.
Weight percentage of platinum particles lost in the ionomerphase.— We further analyze the histograms in Fig. 12a-d and pro-ceed to quantify the relative weight percentages of platinum par-ticles on the carbon support as a function of cathode thickness.Having the mean and variance fixed to those of the Gaussian distri-bution �� = 5.5 nm; 2 = 2.3� in Fig. 12a, the peak observed atparticle sizes equal to and smaller than 10 nm in the histograms ofFig. 12b-d was fitted to Gaussian profiles with only the height of theprofile allowed to change. The fit �at equal to and smaller than 10nm� is reasonably good as evidenced in the differential plots �Fig.13a-c� obtained by subtracting fitted Gaussian distributions�� = 5.5 nm; 2 = 2.3� from the histograms in Fig. 12b-d, respec-tively. The scatter of particle counts at platinum particle sizes �equalto and smaller than 10 nm� in the differential plots would improveby increasing the number of measurements within individual histo-grams �100 measurements each in Fig. 12a-d�. This analysis furtherconfirms that the coarsening of spherical platinum particles on car-bon can be described by an Ostwald-ripening process on the nanom-eter scale across the cathode thickness as depicted in Fig. 3a. Thesedifferential plots �Fig. 13a-c� also reveal that the number of platinumparticles with sizes greater than 10 nm �corresponding to nonspheri-cal platinum particles off carbon� increases from the DM/cathodeinterface to the cathode/membrane interface, which is in good agree-ment with the micrometer-scale platinum growth mechanism as-sisted by H2 molecules.
In order to quantify the change in the weight of platinum remain-ing on the carbon support, the area underneath the Gaussian profilefitted to the peak around 5-6 nm in Fig. 12a-d, which represents theweight of platinum particles on carbon across the cathode thickness,was computed. By assuming that no platinum particles were foundin the ionomer phase at 1 �m from the DM/cathode interface �assuggested by Fig. 12a�, the weight of platinum particles on carbon atthis position would be the same as that in the fresh MEA cathode�,which was set as 100%. The result of this analysis �the relativeweight percentage of platinum particles as a function of cathodethickness� is plotted in Fig. 14. The area under the line representsthe percentage in weight of platinum remaining on carbon and theshaded area above the line corresponds to that of platinum particlespresent in the ionomer phase. As expected from visual examinationof TEM micrographs in Fig. 12a-d, the weight percentage of plati-num remaining on carbon decreases while the weight percentage ofplatinum deposited in the ionomer phase increases, reaching 35 wt% remaining on carbon and 65 wt % in the ionomer phase near themembrane/cathode interface in Fig. 14. The increasing weight per-centage of platinum in the ionomer phase toward the cathode/membrane interface can be explained by the fact that the flux ofcrossover H2 required for platinum precipitation in the ionomerphase �for example, H2 + Pt2+ → 2H+ + Pt� is the highest at thecathode/membrane interface in the cathode and it decreases consid-erably with increasing distance from the cathode/membrane inter-face upon fast electro-oxidation and depletion of H2 in the cathodeduring cathode potential cycling between 0.6 and 1.0 V vs RHE.
Relative contributions of the nanometer and micrometer-scalecoarsening processes.— The electrochemically active surface areaof platinum across the cathode thickness depends on the weight andsize distribution of platinum particles remaining on the carbon sup-port as the platinum particles in the ionomer phase are not active �noelectrical contact�. As the mean platinum particle size on carbonremains unchanged across the cathode thickness �Fig. 12a-d� and thepercentage in weight of platinum on carbon decreases �Fig. 14�, theelectrochemically active area of platinum in the cycled cathode �i.e.,the platinum surface area on carbon� can be estimated as the product

A2267Journal of The Electrochemical Society, 152 �11� A2256-A2271 �2005� A2267
of the specific platinum area in m2/gPt of platinum particles on car-bon and the weight percentage of platinum on carbon �Fig. 14�relative to the fresh MEA cathode. As discussed previously, the spe-cific area of platinum particles on carbon is 27 m2/gPt at 1 �m fromthe DM/cathode interface �Fig. 10a and 12a in the cycled cathode incomparison to 63 m2/gPt �Table II� in the fresh cathode. The per-centage of the electrochemically active surface area of platinum par-ticles �solid circles� relative to the fresh MEA cathode as a functionof cathode thickness is shown in Fig. 15. The averaged percentageof the electrochemically active surface area relative to the freshMEA cathode across the cathode thickness �the average of the lowershaded region in Fig. 15� should correspond to the ratio of the spe-cific surface area of platinum between the fresh and cycled MEAcathodes. A total of 37% of the original platinum specific surfacearea in the fresh MEA cathode �Table II� is retained in the cycledMEA cathode, which is in fairly reasonable agreement with the av-eraged proportion �29%� of the active area across the entire cycledcathode relative to the refresh cathode in Fig. 15.
Relative contributions to the overall platinum surface area lossfrom the two different processes, namely the nanometer-scale Ost-wald ripening on the carbon support and the micrometer-scale pro-duction and migration of mobile platinum species and precipitationof platinum particles in the ionomer phase, are compared in Fig. 15and discussed here. The platinum surface area loss associated withplatinum precipitation in the ionomer phase is highlighted by theupper shaded region in Fig. 14 �triangular symbols� and Fig. 15 �theupper line and triangular symbols�. The additional loss in platinum
Figure 12. �a�-�d� Pt particle size histograms measured from TEM microdistribution �� = 3.0 nm; 2 = 0.22� fitted to the histogram of Pt nanopartihistogram of Pt particles one micrometer below the cathode surface was fittehistograms were obtained from a measurement of 100 particles.
surface area induced by the Ostwald ripening process of platinumparticles on the carbon support corresponds to the white region inFig. 15 in between the upper and lower shaded regions. Althoughthe micrometer-scale platinum precipitation mechanism dominatesnear the cathode/membrane interface, the contributions of these twoparallel mechanisms to the overall platinum surface area loss aver-aged over the entire cathode are similar: each mechanism is respon-sible for platinum area loss roughly one-third of the original plati-num area in the fresh MEA cathode, as shown in Fig. 15. One couldfurther pose the question: what would the platinum area loss in thevoltage cycling experiment have been in the absence of crossoverH2 molecules in the cathode, �i.e., in the absence of the micrometer-scale dissolution/precipitation process�? In this case, the Ostwaldripening process would have been homogeneous across the entirecathode, which would result in an overall loss of �57% in platinumsurface area or 43% for the remaining platinum area as indicated bythe dashed line in Fig. 15 at the DM/cathode interface. Our cyclingexperiments result in the overall loss of 63% for the platinum sur-face area �Table II�, where both mechanisms were active. Therefore,we speculate that reducing crossover H2 in the cathode would havea minor impact on the overall platinum area loss in these voltagecycling experiments.
Caution should be exercised in interpreting the absolute values ofsuch percentages computed from a small number of measurements�100 measurements per histogram� in the TEM images of the cycledMEA cathode. Our TEM analyses preclude any Pt particle aggre-gates on the carbon support, and the number and the size of these
in Fig. 10a-d of the cross-sectional cycled MEA cathode. The Gaussianthe pristine Pt/Vulcan sample �in Fig. 7� is overlaid to all four plots. Thesecond Gaussian distribution �� = 5.5 nm; 2 = 2.3� in Fig. 12a. All four
graphscles ind to a

A2268 Journal of The Electrochemical Society, 152 �11� A2256-A2271 �2005�A2268
aggregates increase toward the cathode/membrane interface. There-fore, the electrochemically active surface area quantified from theTEM measurements for the entire cycled cathode is expected to bemoderately smaller than the electrochemically measured value,which is consistent with the results in Fig. 15 �TEM quantification�and Table II �electrochemical measurements�.
Figure 13. �a�-�c� The resulting histograms from subtracting the fittedGaussian distributions �with � = 5.5 nm and 2 = 2.3 fixed to that ofFig. 12a and only the height allowed varying� from the histograms inFig. 12b-d, respectively.
TEM studies of platinum particles in the ionomerphase.— Bright-field TEM images and the selected area electrondiffraction pattern collected from one nonspherical platinum particleoff carbon support are shown in Fig 16a-c, respectively. The diffrac-
tion pattern corresponds to the �01̄1̄� zone axis of the platinumcrystal structure, which indicates that the nonspherical particle is, infact, a single crystal. This result is further confirmed by high-resolution TEM imaging shown in Fig. 16d, which shows that thelattice fringes are continuous from one branch to the other. In addi-tion, a considerable number of equiaxed platinum particles werefound off carbon support near the cathode/membrane interface in thecycled MEA sample, as shown in Fig. 17a. Selected area electrondiffraction analysis confirmed that these equiaxed platinum particleswere single crystals �Fig. 17b�. These crystals were in the range
Figure 14. The percentages of spherical Pt particles on carbon as a functionof the distance from the cathode surface adjacent to the gas diffusion layer, x,computed from the Gaussian distributions fitted to the histograms inFig. 12a-d. The shaded area estimates the total mass of Pt particles lost fromthe carbon support across the entire electrode thickness.
Figure 15. Relative platinum surface area loss �solid triangles� on thenanometer-scale �Ostwald ripening on the carbon support� and themicrometer-scale �diffusion of oxidized platinum species and precipitation ofplatinum particles in the ionomer phase� mechanisms across the cathode after10,000 voltage cycles �shown in Fig. 4�. The lower line depicts the percent-ages �solid circles� of the remaining electrochemically active platinum sur-face area �on the carbon support� across the electrode �lower gray region�.The upper gray region corresponds to the platinum surface area lost byplatinum precipitation in the ionomer phase. The white region depicts therelative platinum surface area lost associated with Ostwald ripening ofplatinum on the carbon support.

A2269Journal of The Electrochemical Society, 152 �11� A2256-A2271 �2005� A2269
from �10 to �50 nm and the presence of these crystals is reflectedin the histogram of platinum particles near the cathode/membraneinterface in Fig. 12d. It is believed the crossover H2 molecules playan important role in the shapes of these equiaxed crystals, similar tothe observation of square and rectangular platinum crystals grown inH2 at 600°C reported by Schmidt et al.36 The formation mechanismof these crystals will be explored further and reported in a separatepaper.
General Discussion and Conclusions
Measurements of a Pt/C electrocatalyst sample in 0.5 M H2SO4at 80°C showed that the equilibrium concentration of dissolvedplatinum species increased with rising voltage �Fig. 1�. However, themeasured voltage dependence did not follow the Nernstian behaviorfor Pt/Pt2+ dissolution equilibrium. This discrepancy with the pub-lished literature15,23 is not fully understood at this time. Voltagedependence of platinum surface area loss in the cathode was ob-served in situ in two steady-state short stacks of PEMFCs at OCV��0.95 V� and load ��0.75 V�. As expected from increasing equi-librium concentrations of dissolved platinum species at high volt-ages, platinum surface area loss was significantly higher for theshort-stack operated at OCV than the other operated at �0.75 V.
It has been known for some time that voltage cycling acceleratesplatinum surface area loss.22,25,26 Although the exact nature of thisphenomenon is unknown, it is hypothesized that the interruption orreduction of relatively corrosion-resistant, steady-state oxide or hy-droxide coverage of platinum during voltage transient to low poten-
tials leads to accelerated production of oxidized platinum species�such as Pt2+� mobile in the ionomer phase upon subsequent voltagecycling to high potentials. In this study, cross-sectional TEM dataand analyses unambiguously confirmed that coarsening of platinumparticles occurred via two different processes: Ostwald ripening onthe carbon support at the nanometer scale, and migration of soluble�oxidized� platinum species on the micrometer scale and chemicalprecipitation of platinum particles in the cathode ionomer phase, asdepicted in Fig. 3a.
At the DM/cathode interface in the absence of hydrogen mol-ecules, oxidized platinum species �such as Pt2+� produced at highpotentials are mobile in the ionomer phase, and they preferentiallybecome reduced on relatively large platinum particles upon subse-quent potential cycling to low potentials. Such a process driven byreduction in the surface energy of platinum particles is referred to asOstwald ripening.37-39 This coarsening mechanism would result in aparticle size distribution on the carbon support that has a largermean particle size and wider distribution as compared to the start ofthe experiment. These particles are electrically connected and takepart in the electrochemical reaction. Cross-sectional TEM analysesof this study revealed that the coarsening of platinum particles oncarbon governed by the Ostwald ripening was uniform across thecathode thickness, which contributed to roughly 50% of the overallplatinum area loss �white area in Fig. 15� in the cycled MEAcathode.
At the membrane/cathode interface, sufficient hydrogen fluxchemically reduces oxidized platinum species �such as Pt2+� in the
Figure 16. �a� A low magnificationbright-field and �b� a high magnificationbright-field TEM image, �c� the zone axisdiffraction pattern, and �d� a high-resolution TEM image collected from anonspherical platinum particle found offcarbon support in the cycled MEA cath-ode.

A2270 Journal of The Electrochemical Society, 152 �11� A2256-A2271 �2005�A2270
ionomer phase, which leads to nucleation and growth of platinumparticles in the cathode ionomer phase �for example, Pt2+ + H2→ Pt + 2H+�. Our TEM analyses of the cycled cathode �with flow-ing N2 on the cathode� showed the presence of platinum singlecrystals in the cathode ionomer phase close to the membrane/cathode interface. Although Ross18 first conceptualized the coarsen-ing mechanism on the micrometer scale and Darling and Meyers27,28
provided the most comprehensive model of the mechanism to date,they failed to consider chemical reduction of dissolved platinumspecies with crossover hydrogen. They relied on electrochemicalreduction of the dissolved platinum on the anode side of the MEAonly, which cannot account for the presence of platinum particles inthe membrane nor in the cathode ionomer phase. Platinum particlesprecipitating in the cathode ionomer phase are electronically discon-nected and do not take part in the electrochemical reaction. In thisstudy, we showed that the micrometer-scale platinum coarseningmechanism was dominant near the cathode/membrane interfacewhere the crossover H2 flux in the cathode is the highest �Fig. 15�,which contributed to roughly 50% of total platinum area loss overthe entire cycled cathode.
The location of platinum precipitation �in the cathode or in themembrane� is primarily controlled by the availability of hydrogenthat permeates from the anode to the cathode. In the case of fuel celloperation with the presence of air �oxygen�, the hydrogen concen-tration is reduced significantly by chemical reduction of oxidizedplatinum species �such as Pt2+� and precipitation of platinum par-ticles in the membrane close to �but away from� the cathode/membrane interface. This position in the membrane depends uponrelative partial pressures of hydrogen and oxygen and their relativepermeability through the membrane. In the absence of air �in ourpotential cycling experiments with flowing N2 at the cathode�, thecrossover hydrogen concentration decreases sharply at themembrane/cathode interface as a result of fast H2 electro-oxidationat the cathode potential �0.6-1.0 V vs RHE�. In both cases, hydrogenflux diminishes to zero as it moves toward the DM/cathodeinterface.
Figure 17. �a� A typical TEM micrograph of equiaxed platinum nanopar-
ticles present near the cathode/membrane interface and �b� the � 1̄11� zoneaxis pattern of equiaxed platinum crystal A.
These two processes occurring in parallel result in an overallparticle size distribution tailing toward large particle sizes. In gen-eral, the distribution toward small particle sizes representsnanometer-scale Ostwald ripening, whereas the distribution withplatinum particle sizes greater than 10 nm is caused by themicrometer-scale platinum diffusion/precipitation mechanism. Theoverall particle size distributions can easily be misinterpreted if thesimultaneous presence of the two platinum area loss mechanisms isnot considered. Because X-ray diffraction analysis of particle sizegrowth includes platinum particles both on the carbon support and inthe ionomer phase, with the latter not being electrochemically ac-tive, it cannot be used to determine the electrochemically activeplatinum surface area for the aged cathode, where a significant frac-tion of platinum is precipitated in the ionomer phase �in the case ofvoltage cycled electrodes�.
Acknowledgments
This work made use of the Shared Experimental Facilities sup-ported by the MRSEC Program of the National Science Foundationunder award no. DMR 02-13282. Y.S.H. acknowledges GM FuelCell Activities for financial support.
The Massachusetts Institute of Technology assisted in meeting thepublication costs of this article.
References1. H. A. Gasteiger, J. E. Panels, and S. G. Yan, J. Power Sources 127, 162 �2004�.2. H. A. Gasteiger, S. S. Kocha, B. Sompalli, and F. T. Wagner, Appl. Catal., B, 56,
9 �2005�.3. H. Gasteiger, W. Gu, R. Makharia, M. F. Mathias, and B. Sompalli, in Handbook of
Fuel Cells-Fundamentals, Technology and Applications, W. Vielstich, A. Lamm,and H. Gasteiger, Editors, Vol. 3, pp. 593-610, John Wiley & Sons, Chichester,U.K. �2003�.
4. D. Thompsett, in Handbook of Fuel Cells-Fundamentals, Technology and Applica-tions, H. Gasteiger, Editor, Vol. 3, pp. 467-480, John Wiley & Sons, Chichester,U.K. �2003�.
5. T. Tada and T. Kikinzoku, in Handbook of Fuel Cells-Fundamentals, Technologyand Applications, W. Vielstich, H. Gasteiger, and A. Lamm, Editors, Vol. 3, pp.481-488, John Wiley & Sons, New York �2003�.
6. J. M. King and B. McDonald, in Handbook of Fuel Cells-Fundamentals, Technol-ogy and Applications, W. Vielstich, A. Lamm, and H. Gasteiger, Editors, Vol. 4, pp.832-843, John Wiley & Sons, Chichester, U.K. �2003�.
7. D. A. Landsman and F. J. Luczak, in Handbook of Fuel Cells-Fundamentals, Tech-nology and Applications, W. Vielstich, A. Lamm, and H. Gasteiger, Editors, Vol. 4,pp. 811-831, John Wiley & Sons, Chichester, U.K. �2003�.
8. J. Aragane, T. Murahashi, and T. Odaka, J. Electrochem. Soc. 135, 844 �1988�.9. K. F. Blurton, H. R. Kunz, and D. R. Rutt, Electrochim. Acta 23, 183 �1978�.
10. G. A. Gruver, R. F. Pascoe, and H. R. Kunz, J. Electrochem. Soc. 127, 1219�1980�.
11. J. A. S. Bett, K. Kinoshita, and P. Stonehart, J. Catal. 41, 124 �1976�.12. A. Honji, T. Mori, K. Tamura, and Y. Hishinuma, J. Electrochem. Soc. 135, 355
�1988�.13. J. A. Bett, K. Kinoshita, and P. Stonehart, J. Catal. 35, 307 �1974�.14. R. D. Breault, in Handbook of Fuel Cells-Fundamentals, Technology and Applica-
tions, W. Vielstich, A. Lamm, and H. Gasteiger, Editors, Vol. 4, pp. 797-810, JohnWiley & Sons, Chichester, U.K. �2003�.
15. P. Bindra, S. J. Clouser, and E. Yeager, J. Electrochem. Soc. 126, 1631 �1979�.16. E. Passalacqua, P. L. Antonucci, M. Vivaldi, A. Patti, V. Antonucci, N. Giordano,
and K. Kinoshita, Electrochim. Acta 37, 2725 �1992�.17. J. Aragane, H. Urushibata, and T. Murahashi, J. Appl. Electrochem. 26, 147
�1996�.18. P. N. Ross, Jr, in Catalyst Deactivation, E. E. Petersen, and A. T. Bell, Editors, pp.
165-178, Marcel Dekker, New York �1987�.19. P. Ehrburger, Adv. Colloid Interface Sci. 21, 275 �1984�.20. C. C. Granqvist and R. A. Buhrman, J. Catal. 42, 477 �1976�.21. J. Xie, D. L. Wood, D. M. Wayne, T. A. Zawodzinski, P. Atanassov, and
R. L. Borup, J. Electrochem. Soc. 152, A104 �2005�.22. M. S. Wilson, F. H. Garzon, K. E. Sickafus, and S. Gottesfeld, J. Electrochem. Soc.
140, 2872 �1993�.23. T. Patterson, in Fuel Cell Technology Topical Conference Proceedings, G. J. Igwe
and D. Mah, Editors, p. 313, AIChE Spring National Meeting, New York �2002�.24. M. Pourbaix. Atlas of Electrochemical Equilibria in Aqueous Solutions, Pergamon
Press, Oxford �1966�.25. R. Woods, in Electroanalytical Chemistry, A. J. Bard, Editor, Vol. 9, p. 1, Marcel
Dekker, New York �1976�.26. K. Kinoshita, J. T. Lundquis, and P. Stonehar, J. Electroanal. Chem. Interfacial
Electrochem. 48, 157 �1973�.27. R. M. Darling and J. P. Meyers, J. Electrochem. Soc. 150, A1523 �2003�.

A2271Journal of The Electrochemical Society, 152 �11� A2256-A2271 �2005� A2271
28. R. M. Darling and J. P. Meyers, J. Electrochem. Soc. 152, A242 �2005�.29. B. Fultz and J. M. Howe. Transmission Electron Microscopy and Diffractometry of
Materials, Springer, Berlin �2002�.30. P. Yu, M. Pemberton, and P. Plasse, J. Power Sources 144, 11 �2005�.31. K. Kinoshita, J. Electrochem. Soc., 137, 845 �1990�.32. J. Newman and K. E. Thomas-Alyea. Electrochemical Systems, John Wiley &
Sons, New York �2004�.33. S. Gottesfeld and T. Zawodzinski, in Advances in Electrochemical Science and
Engineering, R. C. Alkire, H. Gerischer, D. M. Kolb, and C. W. Tobias, Editors,
Vol. 5, pp. 195-301, John Wiley & Sons-VCH, Weinheim, Germany �1997�.34. U. A. Paulus, A. Wokaun, G. G. Scherer, T. J. Schmidt, V. Stamenkovic,
N. M. Markovic, and P. N. Ross, Electrochim. Acta 47, 3787 �2002�.35. K. F. Blurton, H. R. Kunz, and D. R. Rutt, Electrochim. Acta 23, 183 �1978�.36. T. Wang, C. Lee, and L. D. Schmidt, Surf. Sci. 163, 181 �1985�.37. I. M. Lifshitz and V. V. Slyozov, J. Phys. Chem. Solids 19, 35 �1961�.38. C. Wagner, Z. Elektrochem. 65, 581 �1961�.39. P. W. Voorhees, J. Stat. Phys. 38, 231 �1985�.