insights into the metabolic regulation of growth and
TRANSCRIPT

INSIGHTS INTO THE METABOLIC REGULATION OF GROWTH AND
PROLIFERATION IN SACCHAROMYCES CEREVISIAE
APPROVED BY SUPERVISORY COMMITTEE
Benjamin Tu, Ph.D.
Yi Liu, Ph.D.
Ralph DeBerardinis, M.D., Ph.D.
Bing Li, Ph.D.
Elliott Ross, Ph.D.

DEDICATION
To my parents, husband and baby for their love and support
To my mentor and committee members for their guidance

INSIGHTS INTO THE METABOLIC REGULATION OF GROWTH AND
PROLIFERATION IN SACCHAROMYCES CEREVISIAE
by
LING CAI
DISSERTATION
Presented to the Faculty of the Graduate School of Biomedical Sciences
The University of Texas Southwestern Medical Center at Dallas
In Partial Fulfillment of the Requirements
For the Degree of
DOCTOR OF PHILOSOPHY
The University of Texas Southwestern Medical Center at Dallas
Dallas, Texas
December, 2013

Copyright
by
Ling Cai, 2013
All Rights Reserved

v
INSIGHTS INTO THE METABOLIC REGULATION OF GROWTH AND
PROLIFERATION IN SACCHAROMYCES CEREVISIAE
Ling Cai
The University of Texas Southwestern Medical Center at Dallas, 2013
Supervising Professor: Benjamin P. Tu, Ph.D.
Cells needs to gauge their capacity to grow based on nutrient availability, and adopt
different metabolic strategies for optimal growth and survival. We have investigated the
molecular mechanism of how growth decisions are made based on metabolic status and how
metabolic enzymes are regulated by nutrient availability.
In the first part of this study, we report that acetyl-CoA is the downstream metabolite
of carbon sources that represents a critical metabolic signal for growth and proliferation.
Upon entry into growth, intracellular acetyl-CoA levels increase substantially and
consequently induce the Gcn5p/SAGA-catalyzed acetylation of histones at genes important

vi
for growth, thereby enabling their rapid transcription and commitment to growth. Acetyl-
CoA functions as a carbon-source rheostat that signals the initiation of the cellular growth
program by promoting the acetylation of histones specifically at growth genes.
In the second part of the study, we report the dynamic modification of ribosome
biogenesis transcription factor Ifh1p regulated by different metabolic cues. Ribosome
biogenesis requires an enormous commitment of energy and resources in growing cells. We
show that Ifh1p is dynamically acetylated and phosphorylated as a function of the growth
state of cells. Ifh1p is acetylated at numerous sites in its N-terminal region by Gcn5p and
deacetylated by NAD+-dependent deacetylases of the sirtuin family. Acetylation of Ifh1p is
responsive to intracellular acetyl-CoA levels and serves to regulate the stability of Ifh1p. The
phosphorylation of Ifh1p is mediated by Protein Kinase A and is dependent on TORC1
signaling. Instead of modulating overall rates of RP gene transcription or growth, these
nutrient-responsive modifications of Ifh1p play a more prominent role in the regulation of
cellular replicative lifespan.
Finally, we report the different roles of acetyl-CoA synthetases Acs1p and Acs2p in
yeast metabolism. While Acs2p is important for rapid growth in glucose medium, Acs1p has
unique roles in more challenging growth conditions. It is important for yeast metabolic
cycling and is recruited to foci structure near mitochondria that might be involved in
shuttling acetyl-CoA into the mitochondria during hypoxia.

vii
TABLE OF CONTENTS
DEDICATION ....................................................................................................................... ii
ABSTRACT ........................................................................................................................... v
TABLE OF CONTENTS...................................................................................................... vii
PRIOR PUBLICATIONS ..................................................................................................... ix
LIST OF FIGURES ............................................................................................................... x
LIST OF TABLES .............................................................................................................. xiv
LIST OF DEFINITIONS ...................................................................................................... xv
CHAPTER 1 - Introduction
The Yeast Metabolic Cycle .............................................................................................. 1
Central Carbon Metabolism in Yeast................................................................................ 2
Growth Program in Yeast ................................................................................................. 4
CHAPTER 2 – Dynamic Histone Acetylation by SAGA during Rapid Cell Growth
Acetyl-CoA Is a Metabolite of Carbon Sources that Induces Entry into Growth ........... 8
SAGA Components Are Acetylated by Gcn5p upon Entry into Growth ...................... 10
Induction of Histone Acetylation upon Entry into Growth ........................................... 11
SAGA and Acetylated Histones at Growth Genes upon Entry into Growth ................. 12
Acetyl-CoA Drives Cell Growth through Gcn5p and SAGA......................................... 14
Gcn5p is Important for Acetyl-CoA Driven Growth Gene Expression.......................... 17
Hight Resolution ChIP-seq and RNA-seq Across YMC ................................................ 19

viii
Summary ......................................................................................................................... 20
CHAPTER 3 – Dynamic Modification of Ifh1p in Response to Nutrient Cues
Ifh1p is a Key Transcription Factor for Ribosome Biogenesis....................................... 59
Ifh1p Binds to Promoters of RP Genes and Non-RP Genes........................................... 59
Ifh1p is Dynamically Acetylated and Phosphorylated during Growth........................... 60
Acetylation by Gcn5p and Deacetylation by Sirtuins Regulates Stability of Ifh1p ....... 51
PKA Phosphorylates Ifh1p and Regulates Replicative Lifespan..................................... 66
Summary ......................................................................................................................... 68
CHAPTER 4 – Acetyl-CoA Synthetases in Yeast Metabolism
ACS1 and ACS2 are Differentially Regulated................................................................. 97
Different Roles of Acs1p and Acs2p in Yeast Metabolism............................................ 98
Acs1p Can Form Foci under Hypoxia ............................................................................ 99
Acs1p Foci Formation Can Also be Triggered by Blocking Electron Transport Chain 101
Summary ....................................................................................................................... 104
CHAPTER 5 – Material and Methods ................................................................................ 126
BIBLIOGRAPHY............................................................................................................... 134

ix
PRIOR PUBLICATIONS
1: Marin-Valencia I, Yang C, Mashimo T, Cho S, Baek H, Yang XL, Rajagopalan KN,
Maddie M, Vemireddy V, Zhao Z, Cai L, Good L, Tu BP, Hatanpaa KJ, Mickey BE, Matés
JM, Pascual JM, Maher EA, Malloy CR, Deberardinis RJ, Bachoo RM. Analysis of tumor
metabolism reveals mitochondrial glucose oxidation in genetically diverse human
glioblastomas in the mouse brain in vivo. Cell Metabolism. 2012 Jun 6; 15(6):827-37
2: Cai L, Tu BP. Driving the cell cycle through metabolism. Annual Review of Cell and
Developmental Biology. 2012; 28:59-87
3: Zhang L, Das P, Schmolke M, Manicassamy B, Wang Y, Deng X, Cai L, Tu BP, Forst
CV, Roth MG, Levy DE, García-Sastre A, de Brabander J, Phillips MA, Fontoura BM.
Inhibition of pyrimidine synthesis reverses viral virulence factor-mediated block of mRNA
nuclear export. Journal of Cell Biology. 2012 Feb 6; 196(3):315-26.
4: Cai L, Tu BP. Acetyl-CoA drives the transcriptional growth program in yeast. Cell Cycle.
2011 Sep 15; 10(18):3045-6
5: Cai L, Sutter BM, Li B, Tu BP. Acetyl-CoA induces cell growth and proliferation by
promoting the acetylation of histones at growth genes. Molecular Cell. 2011 May 20;
42(4):426-37
x
LIST OF FIGURES
CHAPTER 1-INTRODUCTIONS
FIGURE 1.1 ...................................................................................................................... 5
FIGURE 1.2 ...................................................................................................................... 6
FIGURE 1.3 ...................................................................................................................... 7
CHAPTER 2-HISTONE ACETYLATION CATALYZED BY SAGA DURING RAPID
CELL GROWTH
FIGURE 2.1 .................................................................................................................... 21
FIGURE 2.2 .................................................................................................................... 22
FIGURE 2.3 .................................................................................................................... 23
FIGURE 2.4 .................................................................................................................... 24
FIGURE 2.5 .................................................................................................................... 25
FIGURE 2.6 .................................................................................................................... 26
FIGURE 2.7 .................................................................................................................... 27
FIGURE 2.8 .................................................................................................................... 28
FIGURE 2.9 .................................................................................................................... 29
FIGURE 2.10 .................................................................................................................. 29
FIGURE 2.11 .................................................................................................................. 30
FIGURE 2.12 .................................................................................................................. 31
FIGURE 2.13 .................................................................................................................. 32
FIGURE 2.14 .................................................................................................................. 33
FIGURE 2.15 .................................................................................................................. 35

xi
FIGURE 2.16 .................................................................................................................. 36
FIGURE 2.17 .................................................................................................................. 37
FIGURE 2.18 .................................................................................................................. 38
FIGURE 2.19 .................................................................................................................. 39
FIGURE 2.20 .................................................................................................................. 40
FIGURE 2.21 .................................................................................................................. 41
FIGURE 2.22 .................................................................................................................. 42
FIGURE 2.23 .................................................................................................................. 43
FIGURE 2.24 .................................................................................................................. 44
FIGURE 2.25 .................................................................................................................. 45
FIGURE 2.26 .................................................................................................................. 46
FIGURE 2.27 .................................................................................................................. 47
FIGURE 2.28 .................................................................................................................. 48
FIGURE 2.29 .................................................................................................................. 49
CHAPTER 3-DYNAMIC MODIFICATION OF IFH1P IN RESPONSE TO NUTRIENT
CUES
FIGURE 3.1 .................................................................................................................... 63
FIGURE 3.2 .................................................................................................................... 64
FIGURE 3.3 .................................................................................................................... 65
FIGURE 3.4 .................................................................................................................... 76
FIGURE 3.5 .................................................................................................................... 77
FIGURE 3.6 .................................................................................................................... 78

xii
FIGURE 3.7 .................................................................................................................... 79
FIGURE 3.8 .................................................................................................................... 80
FIGURE 3.9 .................................................................................................................... 81
FIGURE 3.10 .................................................................................................................. 82
FIGURE 3.11 .................................................................................................................. 84
FIGURE 3.12 .................................................................................................................. 84
FIGURE 3.13 .................................................................................................................. 85
FIGURE 3.14 .................................................................................................................. 86
FIGURE 3.15 .................................................................................................................. 87
FIGURE 3.16 .................................................................................................................. 87
FIGURE 3.17 .................................................................................................................. 88
FIGURE 3.18 .................................................................................................................. 89
FIGURE 3.19 .................................................................................................................. 90
FIGURE 3.20 .................................................................................................................. 91
FIGURE 3.21 .................................................................................................................. 91
FIGURE 3.22 .................................................................................................................. 92
FIGURE 3.23 .................................................................................................................. 93
CHAPTER 4- Acetyl-CoA Synthetases in Yeast Metabolism
FIGURE 4.1 .................................................................................................................. 105
FIGURE 4.2 .................................................................................................................. 106
FIGURE 4.3 .................................................................................................................. 107
FIGURE 4.4 .................................................................................................................. 108

xiii
FIGURE 4.5 .................................................................................................................. 109
FIGURE 4.6 .................................................................................................................. 110
FIGURE 4.7 .................................................................................................................. 110
FIGURE 4.8 .................................................................................................................. 111
FIGURE 4.9 .................................................................................................................. 112
FIGURE 4.10 ................................................................................................................ 113
FIGURE 4.11 ................................................................................................................ 114
FIGURE 4.12 ................................................................................................................ 115
FIGURE 4.13 ................................................................................................................ 115
FIGURE 4.14 ................................................................................................................. 116
FIGURE 4.15 ................................................................................................................ 117
FIGURE 4.16 ................................................................................................................ 118
FIGURE 4.17 ................................................................................................................ 119
FIGURE 4.18 ................................................................................................................ 120
FIGURE 4.19 ................................................................................................................ 121
FIGURE 4.20 ................................................................................................................ 122
FIGURE 4.21 ................................................................................................................ 123
FIGURE 4.22 ................................................................................................................ 124
FIGURE 4.23 ................................................................................................................ 125

xiv
LIST OF TABLES
CHAPTER 2-HISTONE ACETYLATION BY SAGA DURING RAPID CELL GROWTH
TABLE 2.1...................................................................................................................... 50
TABLE 2.2...................................................................................................................... 52
TABLE 2.3...................................................................................................................... 54
TABLE 2.4...................................................................................................................... 56
TABLE 2.5...................................................................................................................... 58
CHAPTER 3-DYNAMIC MODIFICATION OF IFH1P IN RESPONSE TO NUTRIENT
CUES
TABLE 3.1...................................................................................................................... 95
TABLE 3.2...................................................................................................................... 97

xv
LIST OF DEFINITIONS
Abbreviation Definition
2PG 2-phosphoglycerate
3PG 3-phosphoglycerate
ACS Acetyl-CoA Synthetase
ADH Alcoholdehydrogenase
ALD Aldehydehydrogenase
AMPK AMP-activated protein kinase
ATP adenosine triphosphate
BPG 1,3-bisphosphoglycerate
CCCP Carbonyl cyanide m-chlorophenyl hydrazone
ChIP chromatin immunoprecipitation
CHX Cycloheximide
DHAP dihydroxyacetone phosphate
dO2 Dissolved Oxygen
DOC deoxycholic acid
EDTA ethylenediaminetetraacetic acid
EGTA ethylene glycol tetraacetic acid
ER endoplasmic reticulum
F6P fructose-6-phosphate
FADH2 reduced flavin adenine dinucleotide
FBP fructose-1,6-bisphosphate

xvi
FDR false discovery rate
G3P glyceraldehyde-3-phosphate
G6P glucose-6-phosphate
GFP green fluorescent protein
HST Homologue of Sir Two
IP immunoprecipitation
Kd dissociation constant
LC-MS/MS Liquid chromatography-tandem mass spectrometry
NAD Nicotinamide Adenine Dinucleotide
NADH reduced nicotinamide adenine dinucleotide
NADP Nicotinamide Adenine Dinucleotide Phosphate
NADPH reduced nicotinamide adenine dinucleotide phosphate
OX Oxidative
PCR polymerase chain reaction
PEP phosphoenolpyruvate
PKA Protein Kinase A
PMSF phenylmethanesulfonylfluoride
PPase Phosphatase
qPCR real-time PCR
RB Reductive Building
RC Reductive Charging
ribi genes ribosome biogenesis genes

xvii
RLS replicative lifespan
RP genes Ribosomal Protein
SAGA Spt-Ada-Gcn5-acetyltransferase
SAM S-Adenosyl Methionine
SD Synthethic medium with D-glucose
TCA TriChloroacetic Acid
TCA Tricarboxylic Acid Cycle (citric acid cycle)
TOR Target of Rapamycin
ts temperature sensitive
UDP-glucose Uridine DiPhosphate glucose.
WT Wild Type
YMC Yeast Metabolic Cycle
YPD Yeast extract Peptone medium with D-glucose
YPGE Yeast extract Peptone medium with Glycerol and Ethanol

1
CHAPTER ONE – Introduction
The Yeast Metabolic Cycle
When prototrophic budding yeast cells are cultured in a chemostat under continuous
glucose limited growth, they become highly synchronized and exhibit oscillations in oxygen
consumption coupled to their cell cycle (Figure 1.1). The gene expression and metabolic
profiles have been previously characterized and revealed that different transcription program
and metabolic activities are temporally compartmentalized into different phases of these
cycles (Tu et al., 2005; Tu et al., 2007) (Figure 1.1). Thus these cycles have been termed as
the Yeast Metabolic Cycle (YMC).
The growth pattern in a YMC is different from a traditional batch culture used in the
laboratory. Cells grown in YPD batch culture experience several phases of growth as the cell
density increases. After inoculation, there is a lag phase when cells adapt to the nutrient
abundant environment. Then during the first exponential growth phase, yeast cells
preferentially use glucose fermentation to support rapid cell growth while accumulating
ethanol and acetate as glycolytic products. When glucose is exhausted, yeast cells undergo a
diauxic shift to switch their metabolism to using the fermentation products in the second
exponential growth phase. However, the speed of proliferation slows down after diauxic shift
and cells also turn on their stress resistance program. Finally, when nutrients are depleted,
cells exit from cell cycle and enter quiescent phase.
In contrast, the chemostat provides a constant growth environment with fixed pH,
oxygen supply, cell density, and constant rate for nutrient addition as well as waste removal
(Novick and Szilard, 1950). The highly synchronized cells under steady state growth

2continuously transition between three phases, OX (oxidative), RB (reductive, building) and
RC (reductive, charging) (Tu et al., 2005) .
Based on the transcription profiles, the OX phase can be likened to growth phase or
G1 phase of the cell cycle. During this time the cells experience a sharp increase in
mitochondrial respiration and this is accompanied by rapid induction of genes involved in
ribosomal biogenesis and amino acid biosynthesis, particularly sulfur metabolism. Then as
the cells slow down their oxygen consumption, they enter RB phase during which cell
division takes place. Cell cycle genes including those that encode cyclins, histones and
spindle poles are turned on while at the same time, mitochondrial gene transcripts are also
abundantly detected. After RB phase, the cells enter RC phase which can be likened to G0
phase. The oxygen consumption rate is relatively low in RC phase and the transcription
program in this phase are composed of stress response genes including heat shock proteins
genes, autophagy genes, vacuolar genes and ubiquitin/proteasome genes (Tu et al., 2005).
From the metabolic profiling study we also learned that different metabolites
fluctuate across the cycle too. In the OX growth phase with robust mitochondrial respiration,
acetyl-CoA and NADP(H) levels peak as a result of active carbon metabolism. During RB
phase, cells engage in nucleotide production to meet the need in DNA replication and S-
adenosylmethionine (SAM) levels are also increase. And during the quiescent like RC phase,
cells stock up glucose in the form of trehalose and glycogen to increase stress resistance and
prepare for the next burst of growth in the following OX phase (Tu et al., 2007).
Central Carbon Metabolism in Yeast

3When cells exit from the quiescent like RC phase, a sharp increase in oxygen consumption
marks the onset of OX growth phase of the YMC. During this transition, glucose transporters
are highly expressed and cells also break down their carbon reserve in the form of trehalose
and glycogen to supply a big bolus of glucose that supports rapid cell growth during this
phase. Glucose is central to carbon metabolism. Glucose not only fuels glycolysis and the
tricarboxylic acid (TCA) cycle for the production of ATP but also enters the pentose
phosphate pathway to produce ribose sugars that are needed for DNA and RNA synthesis
(Figure1.2). The pentose phosphate pathway also produces reduced Nicotinamide Adenine
Dinucleotide Phosphate (NADPH), which is required for fatty acid and sterol biosynthesis as
well as other biosynthetic processes. Metabolic intermediates from glycolysis and the TCA
cycle also branch into many other biosynthetic and metabolic pathways (DeBerardinis et al.,
2008). Glucose is also the precursor for many sugars involved in numerous glycosylation
modifications that function along the secretory pathway or at the cell surface (Helenius and
Aebi, 2001) (Figure 1.2). However, when glucose is depleted, the previous accumulated
glycolytic product ethanol and acetate become the main carbon source for the cell. Ethanol
will first be converted into acetaldehyde through the reaction of alcohol dehydrogenase
(ADH), and acetaldehyde will be converted into acetate through aldehyde dehydrogenase
(ALD). Acetate is used to produce acetyl-CoA in the cytosol through acetyl-CoA synthetase
using energy from ATP hydrolysis. Cytosolic acetyl-CoA can be transported into
mitochondria or feed into glyoxylate cycle for anabolic reactions, or act as an acetyl donor to
acetylate proteins such as histones.

4Growth Program in Yeast
Observations from a wide spectrum of organisms suggest that attainment of a critical
cell size is a prerequisite for the onset of the cell cycle (Hartwell and Unger, 1977) . In yeast,
entry into the cell cycle typically depends on a period of growth and expansion to increase
cell size, in preparation for the division process (Jorgensen and Tyers, 2004). While
metabolism provides fuel and building blocks, ribosomes are the main builder for
constructing new proteins for the growing cell. Ribosome biogenesis, the generation of
ribosome, is a monumental task that is dependent on hundreds of proteins and an enormous
commitment of energy and resources.
The synthesis of new ribosomes involves transcription of rDNA, ribosomal protein
(RP) genes and genes encoding accessory factors for rRNA processing and ribosome
assembly, collectively called ribosome biogenesis (ribi) genes (Zaman et al., 2008). In
rapidly growing cells, the majority of cellular transcriptional activity is devoted to ribosome
biogenesis (Warner, 1999). 60% of total transcription is devoted to ribosomal RNA, and 50%
of RNA polymerase II transcription and 90% of mRNA splicing are devoted to ribosomal
proteins (RPs) (Warner, 1999). Thus, a yeast cell must be able to assess that it is
metabolically competent to meet the budget of ribosome biogenesis before making such a
commitment (Figure 1.3). Although ribosome biogenesis is known to be regulated by
nutrient-sensing signal transduction pathways such as the TORC1 (Target of Rapamycin) and
PKA (Protein Kinase A) pathways, the precise manner by which key nutritional cues are
relayed to the ribosome biogenesis machinery has not been fully elucidated (Zaman et al.,
2008).

5
Figure 1.1. The Yeast Metabolic Cycle Snapshot of the changes in metabolism that occur as a function of the cell cycle in budding yeast. Depiction of when key gene expression programs, metabolites, cell cycle events, and metabolic events are thought to be active or upregulated with respect to cell cycle stage (G0, G1, S, and M) and metabolic cycle phase OX (growth), RB (division), and RC (survival/quiescence). The YMC trace represents absolute dissolved oxygen concentrations in the growth medium—a drop in dO2 is indicative of oxygen consumption.

6
Figure 1.2 Major metabolic pathways of glucose and carbon utilization in yeast. Glucose is transported into the cell from external sources or released from storage carbohydrates such as trehalose and glycogen. Glucose can be used for glycosylation of lipids and proteins and can be turned into components of the cell wall. Catabolism of glucose through the pentose phosphate pathway, glycolysis, and tricarboxylic acid (TCA) cycle provides essential metabolites that are building blocks of lipids and nucleic acids. Glucose catabolism also provides reducing power for biosynthetic reactions and production of ATP through oxidative phosphorylation. Abbreviations: 2PG, 2-phosphoglycerate; 3PG, 3-phosphoglycerate; BPG, 1,3-bisphosphoglycerate; DHAP, dihydroxyacetone phosphate; F6P, fructose-6-phosphate; FADH2, reduced flavin adenine dinucleotide; FBP, fructose-1,6-bisphosphate; G3P, glyceraldehyde-3-phosphate; G6P, glucose-6-phosphate; NADH, reduced nicotinamide adenine dinucleotide; NADPH, reduced nicotinamide adenine dinucleotide phosphate; PEP, phosphoenolpyruvate; UDP-glucose, uridine diphosphate glucose.

7
Figure 1.3 Ribosome biogenesis is critical for cell growth and proliferation. Ribosome biogenesis is controlled by the target of rapamycin (TOR) and protein kinase A (PKA) nutrient-sensing pathways. Transcription of cohorts of ribosomal protein (RP) genes and ribosome biogenesis (ribi) genes, as well as rRNA, are concurrently regulated by specific transcription factors downstream of TORC1 and PKA signaling. As a result of the increase in translation capacity, the cell increases in mass and size until it is ready to go through division. The transcription factor Ifh1p is an essential regulator of ribosomal protein (RP) genes.

8
CHAPTER TWO
Histone Acetylation by SAGA during Rapid Cell Growth
Acetyl-CoA Is a Metabolite of Carbon Sources that Induces Entry into Growth
What are the metabolic and nutritional cues that induce yeast cells to enter growth?
To address this question using the YMC, we observed that the addition of select carbon
sources can induce metabolically cycling cells to prematurely exit the RC quiescent-like
phase and immediately enter the OX growth phase. Such “phase advancement” into growth is
accompanied by a burst of mitochondrial respiration and the induction of growth genes that
are typical of a normal OX phase (Chen et al., 2007; Tu and McKnight, 2009). Soon
afterwards, cells begin the division process and normal metabolic cycles resume. Not only
can addition of glucose, galactose and fatty acid induce such phase advancement, the end
products of glycolysis, including lactate, ethanol and acetate can also trigger cells to enter
growth (Figure 2.1A).
Since ethanol and acetate must be converted to acetyl-CoA during the course of their
metabolism (Figure 2.1B). And it is generally recognized in the field that glucose represents
the key metabolic signal for various nutrient sensing pathways involving Ras, PKA, Snf1
(the yeast AMPK) and TORC1 (Glucose-sensing and -signaling mechanisms in yeast). To
test whether the conversion of acetate to glucose via the glyoxylate cycle was important for
the growth induction, we blocked the glyoxylate cycle by deleting the key enzyme isocitrate
lyase (Icl1p). Interestingly, this mutant can still undergo yeast metabolic cycle without a
9
functional glyoxylate cycle and premature entry into OX growth phase from RC quiescent-
like phase can still be induced by addition of acetate (Figure 2.2).
We suspected that acetyl-CoA itself might represent a metabolic signal to enter
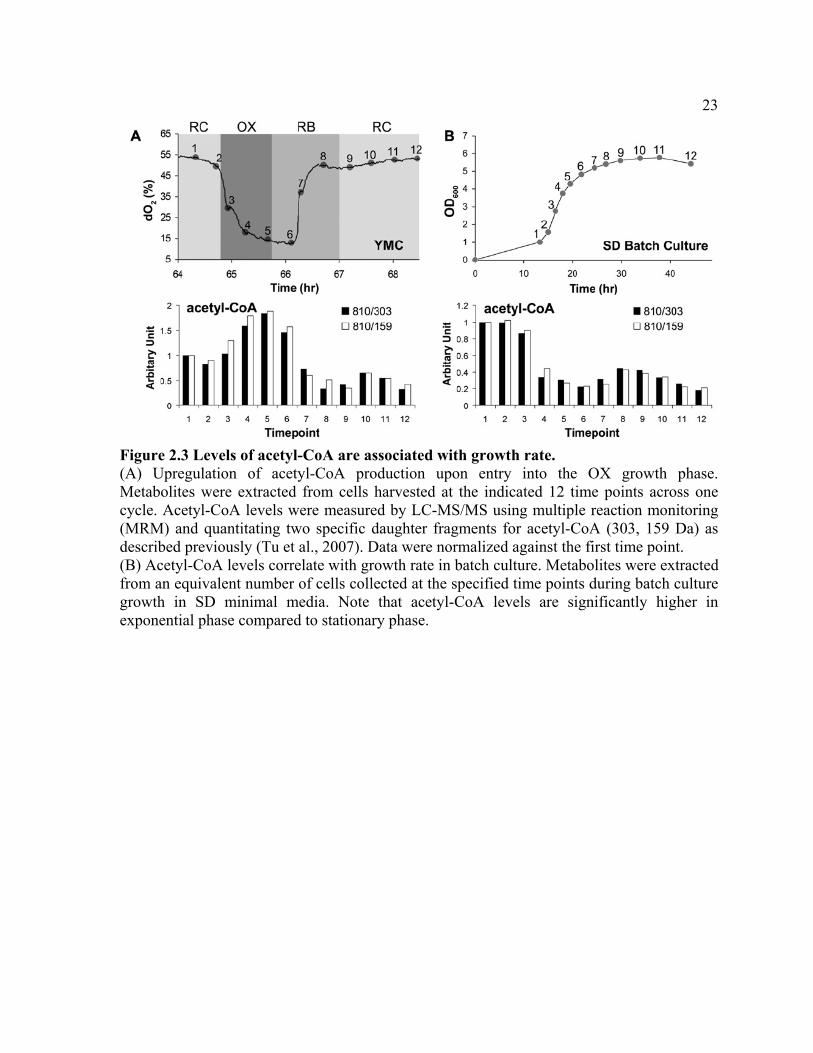
growth. We confirmed the previous metabolite investigations of YMC, which revealed that
acetyl-CoA is one of the most dynamically oscillating metabolites that peak during the OX
growth phase (Figure 2.3A). Moreover, in cells from batch culture, we found the levels of
acetyl-CoA are higher in rapidly growing exponential phase cells compared to slow-growing
cells entering stationary phase (Figure 2.3B). These data revealed that a substantial increase
in intracellular acetyl-CoA is associated with and may be required for, entry into growth.
How may acetyl-CoA function as a signal for growth? It is not only a central
intermediate in carbon metabolism for energy production through TCA cycle or for
biosynthetic reactions that generate lipid and sterols, it is also an acetyl donor for acetylation
reactions. We hypothesized that certain protein acetylation events might be sensitive to
intracellular levels of acetyl-CoA and these events may function in growth regulation so that
the metabolic status of the cell could be conveyed in the form of post-translational
modification to regulate cellular activities. To test this hypothesis, we performed an unbiased
proteomic approach in search of proteins that might become acetylated only upon entry into
the OX growth phase of YMC in tune with the increase in intracellular acetyl-CoA levels
(Figure 2.4A). In the middle of quiescent-like RC phase we spiked in 13C acetate and this
induced rapid entry into growth as revealed by the immediate drop in dissolved oxygen
levels. Metabolites were extracted from cells collected at 1.5min interval during this process
and acetyl-CoA levels were measured by LC-MS/MS. We were able to detect robust acetyl-

10
CoA production from the exogenous 13C acetate at just 0.5min after it was added to the cells.
Interestingly, from the 12C acetate measurement, we found that the production of acetyl-CoA
from endogenous 12C was also stimulated in this phase advance event, suggesting there may
be some positive feedback mechanism to produce more acetyl-CoA (Figure 2.4B). Cells were
collected during the phase advancement and used for proteomic screen for newly acetylated
proteins during entry into growth (Figure 2.4A)
SAGA Components Are Acetylated by Gcn5p upon Entry into Growth
One of the proteins identified in the proteomic screen was Spt7p, a component of the
SAGA (Spt-Ada-Gcn5-Acetyltransferase) transcriptional coactivator complex (Grant et al.,
1997). To test if the acetylation of Spt7p was dynamic and correlated with the fluctuation in
acetyl-CoA levels across the YMC, we epitope tagged Spt7p and immunoprecipitated SAGA
across the YMC to assess its acetylation state (Figure 2.5). We confirmed that Spt7p was
acetylated and discovered that two other proteins (Ada3p, Sgf73p) within the SAGA
complex were dynamically acetylated during the OX phase precisely when intracellular
acetyl-CoA levels increased (Figure 2.5). The cyclic acetylation of Ada3p and Sgf73p (the
yeast homolog of Ataxin-7) was more dynamic than that of Spt7p (Figure 2.5), and the
steady-state abundance of SAGA remained largely unchanged as a function of the YMC
(Figure 2.6). In support of these data, previous studies also detected acetylation of yeast
Spt7p and Sgf73p and human Ada3p within SAGA (Gamper et al., 2009; Mischerikow et al.,
2009).

11
The Gcn5p acetyltransferase is a component of SAGA (Brownell et al., 1996; Grant
et al., 1997), suggesting it might be responsible for acetylation of proteins within the
complex. Indeed, we confirmed that Spt7p, Sgf73p, and Ada3p were no longer acetylated in
a gcn5Δ mutant (Figure 2.7), despite still being present within a SAGA complex lacking
Gcn5p (Wu and Winston, 2002) (Figure 2.8). Moreover, incubation of purified SAGA with
acetyl-CoA resulted in hyperacetylation of Sgf73p (Figure 2.9), while the acetylation state of
other proteins within SAGA remained largely unchanged (Figure 2.9). These data suggest
that Sgf73p in particular can be acetylated at many sites and that its acetylation might be
particularly sensitive to acetyl-CoA fluctuations.
To find out the function of these acetylation marks, we tried to make acetylation
defective mutants for each of these SAGA components. We performed our acetylation site
mapping experiment by mass spectrometry and referenced a proteomic paper which also
identified acetylation of the same SAGA components (Mischerikow et al., 2009). Multiple
lysines within these proteins were confirmed to be sites of acetylation by mutation to arginine
(Figure 2.10). Interestingly, although the six lysine to alanine mutations in Sgf73p almost
eliminated acetylation on Sgf73p in YPD batch culture, when cells were collected from
YMC, there is little change in the acetylation of Sgf73p in this mutant (Figure 2.10).
Induction of Histone Acetylation upon Entry into Growth
Since SAGA functions as a histone acetyltransferase (Grant et al., 1997; Lee and
Workman, 2007; Suka et al., 2001), we next tested whether the acetylation of particular sites
on histones might occur in tune with the increase in acetyl-CoA concentration upon entry

12
into the OX growth phase. Strikingly, we observed that the acetylation of many sites on
histone H3 (K9, K14, K18, K23, K27, K56) and histone H4 (K5, K8, K12) was highly
periodic over the YMC. All of these sites, with the exception of H3K56 and H4K16, were
acetylated beginning in the OX growth phase, which is precisely when acetyl-CoA levels
within the cell increase substantially (Figure 2.11). H3K56 acetylation takes place at later
timepoints during the temporal window of the YMC when cell division occurs (Figure 2.11)
(Tu et al., 2005). These data confirmed that H3K56 acetylation occurs during S phase and
function in cell cycle (Masumoto et al., 2005; Xu et al., 2005). Interestingly, H3K4
trimethylation, which is a mark associated with active transcription (Pokholok et al., 2005),
did not fluctuate significantly at the bulk level during YMC (Figure 2.11). As SAGA has
been implicated in the acetylation of many of these sites on H3 that increase in OX phase
(Grant et al., 1997; Grant et al., 1999), these data reveal that Gcn5p-containing SAGA might
specifically acetylates H3 only following the burst of acetyl-CoA production that is
concomitant with entry into growth.
SAGA and Acetylated Histones at Growth Genes upon Entry into Growth
Since growth genes such as ribosomal protein genes are highly expressed during
growth. High levels of histone acetylation could be occurring at these growth genes.
Therefore we next looked at whether SAGA might be recruited to acetylate H3 at growth
genes during OX phase of the YMC. It has been previously reported in the literature that
many growth genes expressed in OX phase as well as stress genes expressed in RC phase are
identified as SAGA/Gcn5p targets (Huisinga and Pugh, 2004; Robert et al., 2004). We chose

13
several SAGA target genes that are induced during the RC phase (STI1, ARO9) and several
targets that are induced during the OX phase of the YMC (RPS11B, RPL33B, SHM2) to
determine whether they might be regulated by SAGA-catalyzed histone acetylation during
the YMC (Huisinga and Pugh, 2004; Robert et al., 2004). We performed chromatin
immunoprecipitation (ChIP) analysis to quantitate SAGA binding and histone acetylation at
these target genes in either OX or RC phase (Figure 2.12). We confirmed that SAGA
preferentially bound OX phase targets during OX phase and RC phase targets during RC
phase (Figure 2.12A). H3K9, H3K14, H3K18, H3K23, and H3K27 were significantly
acetylated at the OX phase SAGA targets specifically during OX phase, perhaps as expected.
In striking contrast, for RC phase SAGA targets, there was no significant increase in H3
acetylation in either RC phase or OX phase (Figure 2.12A). These data suggest that acetyl-
CoA enables SAGA to acetylate histones specifically at OX phase growth genes to facilitate
enhanced transcription. In support of this idea, the transcripts of OX phase genes peak very
sharply in the midst of the respiratory burst, and H3 acetylation has been shown to correlate
with transcription rate (Figure 2.12B) (Kurdistani et al., 2004; Pokholok et al., 2005; Tu et
al., 2005). It is worth noting that several acetylated sites on H4 were also present at
ribosomal genes during OX phase (Figure 2.13). And these H4 sites are acetylated by
acetyltransferase NuA4. We will discuss later how NuA4 might be downstream of SAGA.
Having established that induction of histone acetylation occurs at several growth
genes upon entry into growth, we next performed ChIP-seq analysis to assess the genome-
wide locations of H3K9 acetylation, a highly cyclic OX phase histone modification catalyzed
by SAGA (Grant et al., 1999; Zhang et al., 1998) (Figure 2.14). Substantially more genomic

14
regions containing acetylated-H3K9 were observed in OX phase compared to RC phase
(Figures 2.14A and 2.14B), in agreement with western analysis (Figure 2.11). Strikingly,
H3K9 acetylation was present almost exclusively at growth genes (e.g., ribosome biogenesis,
translation, amino acid metabolism), specifically during OX phase (Figures 2.14A and 2.14B
and Figure 2.15). Many chromosomal locations containing H3K9 acetylation correlated well
with SAGA binding, especially at ribosomal genes (Figures 2.14A and 2.14C). In contrast,
many fewer genomic regions containing H3K9 acetylation were detected in RC phase
(Figure 2.14B), despite the fact that >43% of all periodic YMC genes are expressed in RC
phase (Tu et al., 2005). Moreover, the majority of regions bound by SAGA in the RC phase
were not associated with a corresponding increase in H3K9 acetylation (Figure 2.14A).
Collectively, these data strongly suggest that histone acetylation induced by acetyl-CoA is
rate limiting primarily for the transcription of OX phase growth genes, whereas RC phase
genes are much less dependent on histone acetylation for activation.
Acetyl-CoA Drives Cell Growth through Gcn5p and SAGA
Multiple lines of genetic evidence substantiate our findings that acetyl-CoA sets in
motion a series of acetylation events to enable cellular commitment to growth. Bulk histone
acetylation was previously found to be compromised in yeast containing mutations in acetyl-
CoA synthetase enzymes that control acetyl-CoA flux (Takahashi et al., 2006). Furthermore,
a synthetic genetic interaction between a temperature-sensitive mutation in acetyl-CoA
synthetase (acs2-ts) and gcn5Δ has been reported (Takahashi et al., 2006). Notably, we
observed that a gcn5Δ mutant exhibited slow growth and did not undergo the synchronized

15
bursts of respiratory growth that are a hallmark of metabolic cycles, in contrast to mutants
lacking other acetyltransferases (Figures 2.16). A catalytically inactive Gcn5p point mutant
(E173Q) also exhibited a severe cycling phenotype (Figures 2.17) (Trievel et al., 1999).
Moreover, an acs1Δ mutant, which lacks the acetyl-CoA synthetase expressed under glucose-
poor conditions (van den Berg et al., 1996), did not undergo metabolic cycles (Figure 2.16B).
How might the acetylation of Sgf73p, Ada3p, and Spt7p by Gcn5p affect the SAGA complex
and its ability to acetylate histones at growth genes? We have already shown that the
composition of SAGA remains unchanged across the YMC (Figure 2.6). We also attempted
to test whether the acetylation of SAGA enhances its activity as a histone acetyltransferase
but we did not detect differences in its ability to acetylate free histones or core nucleosomes
in vitro. This could be due to the robust auto acetylation of SAGA in vitro (Figure 2.9). We
wanted to use acetylation defective mutants to study the mechanism but the mutations we
introduced to SAGA components were unable to eliminate the acetylation on SAGA detected
by western blot, such mutants are still substantially acetylated in the suboptimal growth
condition in YMC and the residual acetylation might be sufficient for regulating SAGA
(Figure 2.10).
Therefore, we took some alternative approaches. First, we made deletion mutants of
the acetylated SAGA components and observed a growth defect (Figure 2.18A). spt7Δ is
very sick because without this scaffolding protein the SAGA complex falls apart. However,
the composition of SAGA was not affected in ada3Δ and sgf73Δ mutants (Figure 2.18B).
Interestingly, sgf73Δ mutant exhibited slow defects in H3 acetylation, and abnormal
metabolic cycles (Figures 2.18C and 2.18D). Although Sgf73p is also required for histone

16
deubiquitylation catalyzed by SAGA (Kohler et al., 2008), this activity does not appear
critical for entry into growth, as the ubp8Δ mutant exhibited normal growth and more normal
metabolic cycles (Figure 2.19). In addition, the ada3Δ mutant, which completely eliminates
acetylation of Spt7p and Sgf73p (Figure 2.20), also exhibited slow growth, defects in H3
acetylation, and abnormal cycles (Figures 2.18C and 2.18D).
The second alternative approach we have taken is by constructing a diploid strain
expressing one copy of wild-type (WT) Gcn5p and one copy of a catalytically inactive
Gcn5p (E173Q) mutant, each marked with its own epitope tag. Interestingly, we observed
that the catalytically inactive Gcn5p was present within a SAGA complex that did not appear
to be acetylated, while as expected WT Gcn5p was present within a SAGA complex that is
acetylated (Figure 2.21). This diploid strain expressing two different alleles of Gcn5p was
able to undergo normal metabolic cycles, and so we tested whether the acetylation of SAGA
might influence its ability to be recruited to particular genes. We observed that while both
acetylated and deacetylated SAGA were present at an RC phase gene during RC phase, the
acetylated form of SAGA (as pulled down using WT Gcn5p) exhibited increased binding to a
ribosomal gene during the OX growth phase (Figure 2.21). These data suggest that the
Gcn5p-catalyzed acetylation of SAGA components might function to aid its recruitment to
certain classes of genes, in particular the OX phase growth genes. In this experiment, we
cannot exclude the possibility that Gcn5p-dependent acetylation of a chromosome-bound
target might be required for the stabilization of SAGA on chromatin. Moreover, it is possible
that some of the acetylation sites within SAGA could be a coincidental consequence of
having an acetyltransferase enzyme situated within a complex of proteins that is activated in

17
response to a burst of acetyl-CoA production. Nonetheless, previous studies on the role of
Ada3p and the observation that the acetylation of SAGA components Spt7p and Sgf73p is
dependent on Ada3p (Figure 2.20) suggest the possibility that acetylation of SAGA could
function to stimulate its nucleosomal acetyltransferase activity and perhaps its activation or
recruitment to growth genes (Balasubramanian et al., 2002; Wu et al., 1999).
Gcn5p is Important for Acetyl-CoA Driven Growth Gene Expression
To test whether Gcn5p is important for inducing growth gene expression during
growth induction, we added 13C acetate to WT and gcn5Δ cells from the chemostat and
measured acetyl-CoA production, histone acetylation and expression of selected OX phase
growth genes as well as quiescent RC phase genes during a 22 minute time course (Figure
2.22A). Although no difference of 13C acetyl-CoA production from exogenous acetate or 12C
acetyl-CoA production from endogenous carbon sources was detected (Figure 2.22C), acetate
induced increase in H3 acetylation was impaired (Figure 2.22B) and growth gene induction
was compromised (Figure 2.22D), while the expression pattern quiescent phase gene ARO9
remains unchanged (Figure 2.22D). Moreover, the increase in bulk levels of H4 acetylation
in response to acetyl-CoA is also dependent on Gcn5p (Figure 2.22B), suggesting the activity
of the NuA4 acetyltranferase complex can be influenced by SAGA in some instances.
In addition to the three components within SAGA complex, we have found a few
more Gcn5p targets dynamically acetylated across the YMC in tune with acetyl-CoA levels
such as Snf2p (Figure 2.23) and Ifh1p (discussed in the next chapter). However, it needs to
be pointed out that such dynamic acetylation property is not found for all the acetylated

18
proteins (Figure 2.23). As we have shown that H4 acetylation by NuA4 acetyltransferase
complex is dynamic in the YMC but is dependent on Gcn5p, we have also found Yng2p, a
component of NuA4 is also acetylated by the levels remain constant across YMC. So how
and why could the Gcn5p containing SAGA complex acetylate its substrates in response to
increase in acetyl-CoA concentration? Based on previous in vitro Kd (~8.5 mM) and Km
(~2.5 mM) measurements for Gcn5p (Berndsen and Denu, 2008; Langer et al., 2002), our
estimates of intracellular acetyl-CoA concentration across the YMC (~3–30 mM) indicate it
is conceivable that the activity of SAGA could be regulated in vivo by physiological
fluctuations of acetyl-CoA (Figure 2.24). Accordingly, the observation that a catalytically
inactive point mutant of Gcn5p fails to undergo the bursts of growth that are a hallmark of
the YMC is consistent with a critical role for Gcn5p in driving cell growth (Figure
2.17).Moreover, we observed that the A190T mutant, which increases its affinity for acetyl-
CoA by ~10-fold from 8.5 to 0.56 mM (Langer et al., 2002), exhibits a temperature-sensitive
growth defect on acetate as the carbon source, suggesting that Gcn5p might be finely tuned to
sense and respond to a higher threshold of acetyl-CoA levels in vivo (Figure 2.25). However,
the kinetic parameters for Gcn5p are comparable to those measured for other
acetyltransferases such as Esa1p (Berndsen and Denu, 2008). In contrast to this observation,
the increase in H4 acetylation catalyzed by the Esa1p-containing NuA4 complex in response
to acetyl-CoA is dependent on Gcn5p (Figure 2.22B), indicating the in vivo behavior of
acetyltransferases in relation to changes in acetyl-CoA substrate levels might not be
immediately predictable from estimates of their kinetic parameters alone. Regardless,
multiple lines of evidence strongly indicate that Gcn5p-containing SAGA distinctively

19
acetylates substrates in vivo in response to the burst of acetyl-CoA production that
accompanies entry into growth. As such, acetyl-CoA triggers a series of acetylation events
within SAGA and at histone tail surrounding growth genes, thereby enabling rapid gene
activation and consequent commitment to growth. Future studies will be required to resolve
the molecular changes to the SAGA complex following acetylation and how they affect its
function and recruitment to particular classes of genes, as well as the basis for its ability to
acetylate substrates in tune with increases in intracellular acetyl-CoA levels.
Hight Resolution ChIP-seq and RNA-seq Across YMC
We have also conducted high temporal resolution RNA-seq and ChIP-seq for
H3K9ac across 16 timepoints from the yeast metabolic cycle (Figure 2.26). The results
revealed that the epigenetic profile over the YMC is highly dynamic (Figure 2.27). These
high resolution data have led us to intriguing observations on how gene expression is
precisely orchestrated temporally. For example, we found that the distinct sub-steps of the
ribosome biogenesis process are efficiently regulated in the OX growth phase of the YMC.
The ribi genes that encode accessory factors for ribosome assembly and rRNA processing are
turned on just about 5 mins before the ribosomal protein (RP) genes are expressed (Figure
2.28). Such data support a “just in time supply chain” model in which yeast cells prepare the
ribosomal assembly factors and ribosomal RNA just ahead of the ribosome structural
proteins and amino acid biosynthetic pathways to maximize efficiency of ribosome
biogenesis and translation. In agreement with the RNA-seq data, our H3K9ac ChIP-seq data
also revealed robust regulation of ribi and RP genes (Figure 2.29). Interestingly, H3K9ac

20
marks on the promoter of ribi genes appear to be more transient compared to the RP genes. In
collaboration with Zheng Kuang in Jef Boeke's lab at Johns Hopkins University, we have
interrogated the genome-wide occupancy profiles for many more different epigenetic marks
on histones as well as for chromatin modifiers.
Summary
Our data have revealed one of the elusive mechanisms by which carbon sources
trigger growth and raise the possibility that the products of glycolytic metabolism (e.g.,
ethanol, acetate, lactate) may be important activators of growth within microbial
communities and cancerous tumors (Sonveaux et al., 2008). In addition, genetic alterations
that cause a net accumulation of intracellular acetyl-CoA may enhance cellular proliferative
capacity. As protein acetylation has also been linked to metabolism in several previous
studies (Choudhary et al., 2009; Friis et al., 2009; Takahashi et al., 2006; Wang et al., 2010;
Wellen et al., 2009; Zhao et al., 2010), we predict that a similar control of gene expression
and protein activities with respect to intracellular acetyl-CoA levels might represent a widely
conserved mechanism by which cell growth and proliferation are coordinated with metabolic
state.

21
Figure 2.1 Entry into the OX, growth phase of the YMC can be induced by addition of various carbon sources. To our knowledge, sugars like glucose and galactose as well as fatty acid can readily trigger cells in the RC quiescent-like phase to prematurely enter growth phase. Interestingly, metabolites downstream of glycolysis or fatty acid catabolism such as ethanol, acetaldehyde, acetate and lactate can also induce such phase advancement. (A) Phase advancement induced by addition of acetate (1mM). The transition of RC phase to OX phase is characterized by a burst of mitochondrial respiration which rapidly consumes dissolved oxygen in the medium. (B) Yeast pathways that synthesize and consume acetyl-CoA. Acetyl-CoA is a central metabolite that connects carbon catabolism to anabolism.

22
Figure 2.2 Acetate can still induce entry into growth in icl1Δ YMC. Isocitrate lyase (Icl1p) catalyzes the formation of succinate and glyoxylate from isocitrate, a key reaction of the glyoxylate cycle. Products of glyoxylate cycle can be used in gluconeogenesis for the generation of glucose. icl1Δ mutant that lacks a functional glyoxylate cycle can still be induced into OX growth phase by acetate, suggesting that acetyl-CoA itself and not its conversion to glucose, can act as a growth signal.
23
Figure 2.3 Levels of acetyl-CoA are associated with growth rate. (A) Upregulation of acetyl-CoA production upon entry into the OX growth phase. Metabolites were extracted from cells harvested at the indicated 12 time points across one cycle. Acetyl-CoA levels were measured by LC-MS/MS using multiple reaction monitoring (MRM) and quantitating two specific daughter fragments for acetyl-CoA (303, 159 Da) as described previously (Tu et al., 2007). Data were normalized against the first time point. (B) Acetyl-CoA levels correlate with growth rate in batch culture. Metabolites were extracted from an equivalent number of cells collected at the specified time points during batch culture growth in SD minimal media. Note that acetyl-CoA levels are significantly higher in exponential phase compared to stationary phase.

24
Figure 2.4 Screen for protein acetylation events when cells enter growth (A) Schematic flowchart of screen process. (B) Acetate-induced entry into growth is accompanied by a significant increase in intracellular acetyl-CoA. Metabolites were extracted from cells collected at 1.5 min intervals following addition of 13C-labeled acetate to cells in RC phase. 12C and 13C acetyl-CoA were quantitated by LC-MS/MS. 13C acetate was quickly converted to 13C acetyl-CoA, and 12C acetyl-CoA from endogenous, unlabeled carbon sources also increased in response to the stimulus.

25
Figure 2.5 Dynamic acetylation of SAGA components across YMC. SAGA was immunoprecipitated from a SPT7-FLAG strain across 12 time points of the YMC, and protein acetylation was detected by western blot using an anti-acetyllysine antibody. Spt7p, Ada3p, and Sgf73p were found to be dynamically acetylated over theYMC with the highest levels in the OX growth phase, when acetyl-CoA levels increase substantially (Figure 2.3A). Data from two independent metabolic cycle experiments are shown.

26
Figure 2.6 SAGA composition remained unchanged across the YMC. SAGA was immunoprecipitated from a SPT7-FLAG strain at the indicated 12 time points across one metabolic cycle. Proteins associated with the beads were separated by SDS-PAGE and silver-stained. An untagged, WT strain was used as a negative control. Note the lack of significant changes in the proteins co-immunoprecipitating with Spt7p across the YMC.

27
Figure 2.7 Acetylation of SAGA components is dependent on Gcn5p. Strains expressing C-terminally FLAG-tagged versions of either SPT7, ADA3, or SGF73 in a haploid gcn5Δ background were constructed. Proteins were immunoprecipitated from cells grown to log phase using a FLAG antibody, and then acetylation state was detected by western blot. After mating to a WT GCN5 haploid, acetylation of each of the three proteins was restored in the resulting diploid.

28
Figure 2.8 SAGA composition remained largely unchanged in gcn5Δ SAGA was immunoprecipitated from either a WT or gcn5∆ strain expressing Spt7-FLAG, from cells grown to log phase in YPD. Note that the SAGA complex remains intact in a gcn5∆ mutant, in agreement with previous studies (Wu and Winston, 2002). The band that corresponds to Gcn5p partially overlaps with the ~50 kDa heavy chain.

29
Figure 2.9 Sgf73p is hyperacetylated upon incubation of SAGA with acetyl-CoA in vitro. Immunopurified SAGA complex from the OX or RC phase of the YMC was incubated with the indicated concentrations of acetyl-CoA for 30 min at 30ºC. The acetylation state of SAGA components was monitored by western blot. Note that Sgf73p within SAGA becomes hyperacetylated, suggesting there are many lysine residues that can be acetylated in response to acetyl-CoA.
Figure 2.10 SAGA components are acetylated at many lysine residues. Mutants were constructed in a SPT7-FLAG, SGF73-HA strain, according to sites identified by LC-MS/MS and by a previous study (Mischerikow et al., 2009). K603 and 607 on Spt7p; K183 on Ada3p; and K171, 199, 211, 224, 288, and 300 on Sgf73p were mutated to arginine separately or in combination as indicated. The resulting consequences on acetylation of SAGA were determined by immunoprecipitating SAGA from either a log phase YPD batch culture (left) or OX or RC phase of the YMC (right), followed by western analysis.

30
Figure 2.11 Induction of Histone Acetylation upon Entry into Growth. Protein extracts were prepared across 12 time points of one metabolic cycle for bulk analysis of histone modifications. Western blots were performed using highly specific antibodies recognizing the indicated modifications on histone H3 or H4. Acetylation of H3K9, H3K14, H3K18, H3K23, H3K27, and H4K5, H4K8, H4K12 increased substantially in tune with the increase in acetyl-CoA that accompanies entry into the OX growth phase. Acetylation of H3K56 increased at later time points in RB phase during the time of cell division. H3K4 trimethylation remained largely unchanged as a function of the YMC as assayed at the bulk level.

31
Figure 2.12 SAGA and Acetylated Histones Are Present at Growth Genes upon Entry into Growth (A) ChIP was performed to quantitate SAGA binding and histone acetylation at previously identified SAGA target genes that peak during either RC phase (STI1, ARO9) or OX phase (RPS11B, RPL33B, SHM2). SPT7-FLAG cells were crosslinked for ChIP analysis in early OX phase corresponding to time point 3 and in early RC phase corresponding to time point 9 (Figure 2.11). Histones at these OX phase genes are significantly acetylated upon gene activation, in contrast to RC phase genes. (B) YMC expression profiles of SAGA target genes from RC and OX Phase used for ChIP analysis. Expression data are from 36 time points over three consecutive metabolic cycles as reported previously (Tu et al., 2005).

32
Figure 2.13 Several sites on H4 at Ribosomal Genes are also Acetylated upon Entry into Growth (A) ChIP analysis surveying abundance of SAGA and the indicated acetylated sites on H3 or H4 at RPS1B (another SAGA target highly expressed in OX phase of the YMC) during OX and RC phase. (B) YMC expression profile of RPS1B taken from (Tu et al., 2005). Note that acetylation of both H3 and H4 was observed at this ribosomal gene during OX phase.

33
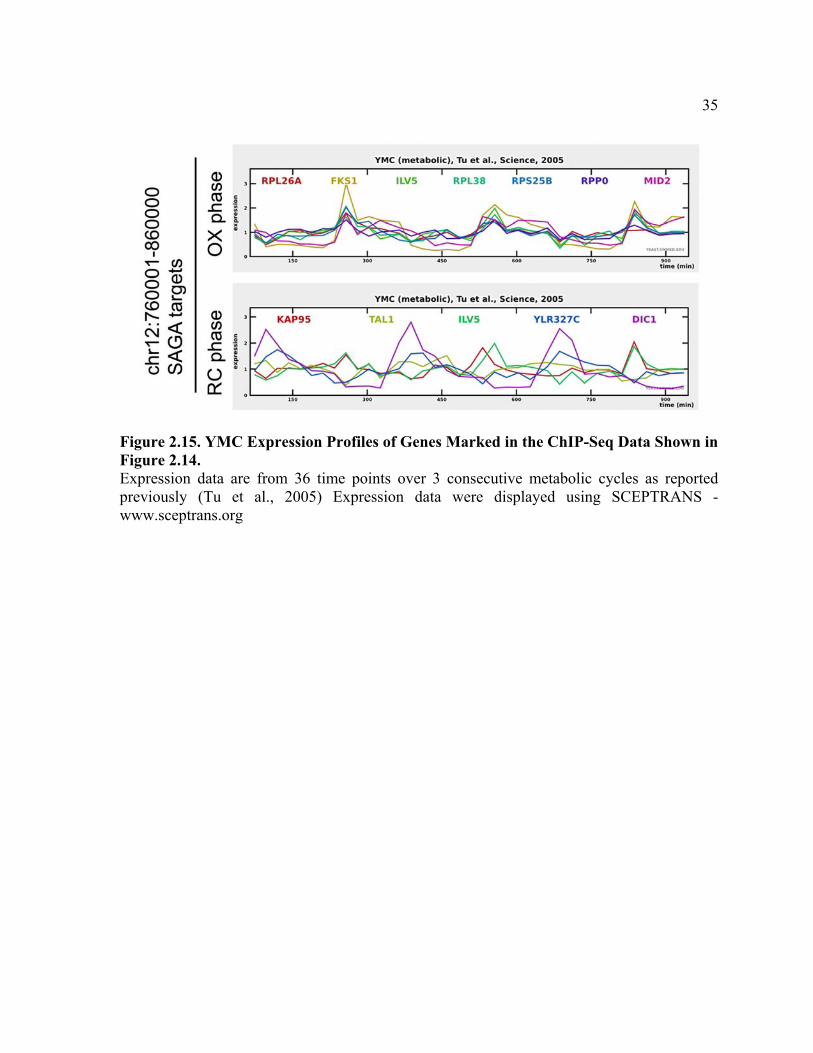
Figure 2.14 Genome-wide Analysis reveals that Histone H3 at Growth Genes Becomes Acetylated upon Entry into Growth. (A) ChIP-seq analysis was performed to reveal genomic regions occupied by H3K9ac and SAGA at a time point in either early OX or early RC phase, as in Figure 2.11. Sequencing data were analyzed and displayed using CisGenome (Ji et al., 2008). The arrows mark peaks associated with the following genes (maximal YMC phase of expression in parentheses): SAGA OX phase, RPL38 (OX), MID2 (OX), RPS25B (OX), RPP0 (OX), FKS1 (OX),

34
RPL26A (OX), and ILV5 (OX); SAGA RC phase, TMA10 (RC), KAP95 (OX), DIC1 (RC), TAL1 (N/A), and ILV5 (OX). The temporal expression profiles of these genes across the YMC were highly consistent with these ChIP-seq data (Figure 2.14). Note that H3K9ac peaks are much more frequent and significant in OX phase compared to RC phase. Many SAGA binding sites in OX phase corresponded directly to significant regions of H3K9 acetylation, while many SAGA binding sites in RC phase did not. (B) YMC phase distribution of genes occupied by H3K9 acetylation or SAGA in either early OX or RC phase. Many more genomic regions of H3K9 acetylation were present in OX phase (n = 942) compared to RC phase (n = 161) at the same level of statistical significance. H3K9 acetylation was present almost exclusively at OX phase growth genes, specifically during OX phase (p value < 9.8 x10140). As determined previously by microarray analysis, there are 1016 OX, 975 RB, and 1508 RC phase genes in the YMC (Tu et al., 2005). (C) Functional categories of genes occupied by H3K9 acetylation or SAGA as determined by MIPS (Munich Information Center for Protein Sequences) functional classification. The genes called by each ChIP-seq experiment were used to identify overrepresented gene functions (the top 100 genes are listed in tables 2.1 -2.4). Note that genes involved in ribosome biogenesis were found to be the most significant group of H3K9ac and SAGA targets. Genes involved in translation, amino acid metabolism, and rRNA processing which are also critical for growth are also highly overrepresented.
35
Figure 2.15. YMC Expression Profiles of Genes Marked in the ChIP-Seq Data Shown in Figure 2.14. Expression data are from 36 time points over 3 consecutive metabolic cycles as reported previously (Tu et al., 2005) Expression data were displayed using SCEPTRANS - www.sceptrans.org
36
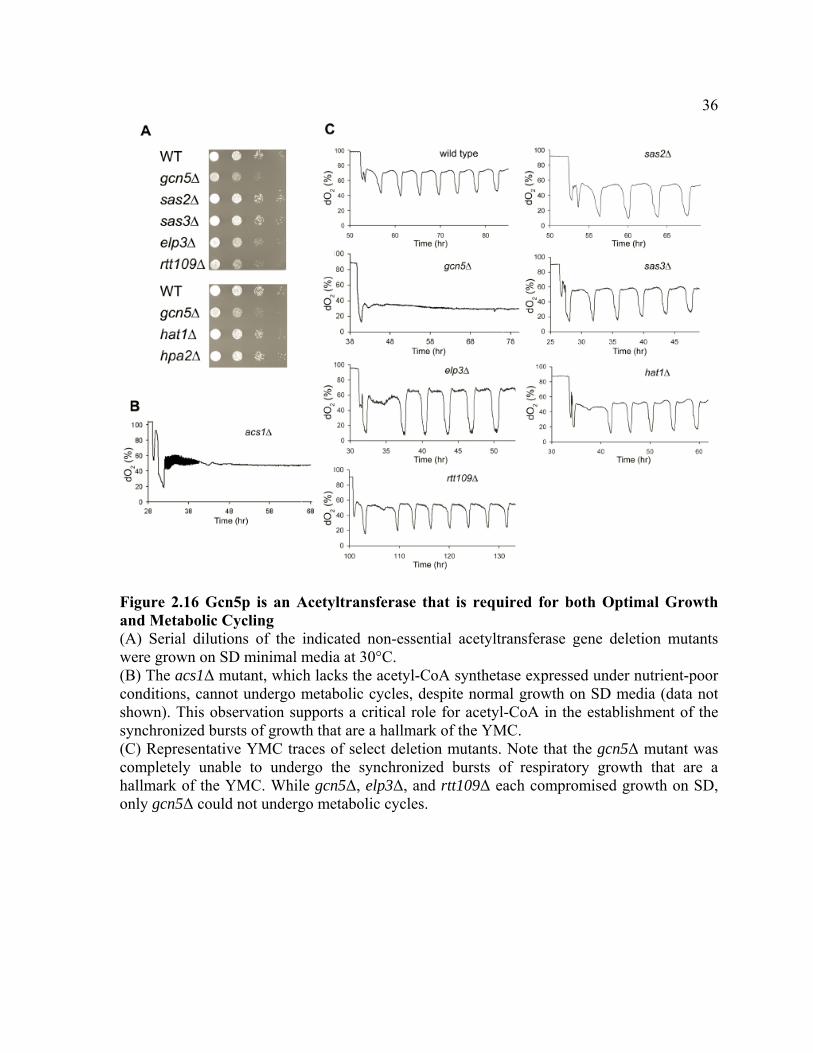
Figure 2.16 Gcn5p is an Acetyltransferase that is required for both Optimal Growth and Metabolic Cycling (A) Serial dilutions of the indicated non-essential acetyltransferase gene deletion mutants were grown on SD minimal media at 30°C. (B) The acs1Δ mutant, which lacks the acetyl-CoA synthetase expressed under nutrient-poor conditions, cannot undergo metabolic cycles, despite normal growth on SD media (data not shown). This observation supports a critical role for acetyl-CoA in the establishment of the synchronized bursts of growth that are a hallmark of the YMC. (C) Representative YMC traces of select deletion mutants. Note that the gcn5Δ mutant was completely unable to undergo the synchronized bursts of respiratory growth that are a hallmark of the YMC. While gcn5Δ, elp3Δ, and rtt109Δ each compromised growth on SD, only gcn5Δ could not undergo metabolic cycles.

37
Figure 2.17. Both gcn5Δ and a Catalytically Inactive E173Q Mutant Exhibit Growth Defects and Severe Metabolic Cycling Phenotypes (A) Serial dilutions of wild-type, gcn5Δ and GCN5 E173Q strains grown on SD minimal media. (B) YMC traces for the gcn5Δ and GCN5 E173Q mutants.
38
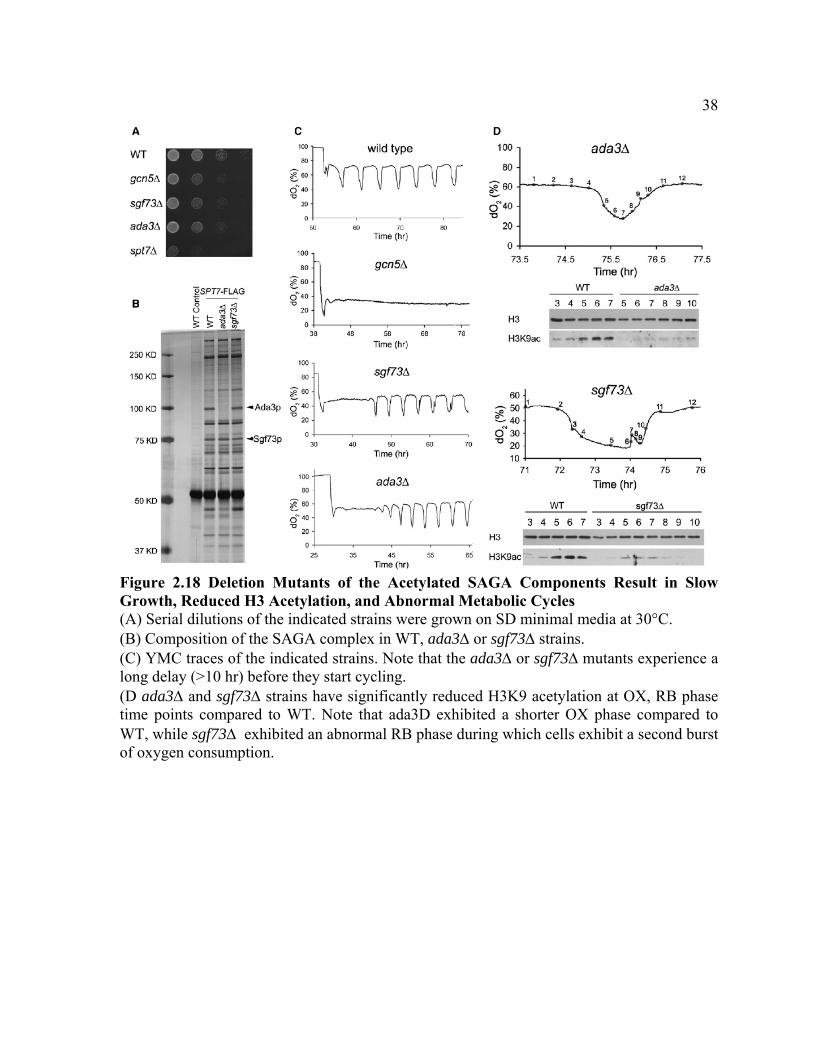
Figure 2.18 Deletion Mutants of the Acetylated SAGA Components Result in Slow Growth, Reduced H3 Acetylation, and Abnormal Metabolic Cycles (A) Serial dilutions of the indicated strains were grown on SD minimal media at 30°C. (B) Composition of the SAGA complex in WT, ada3Δ or sgf73Δ strains. (C) YMC traces of the indicated strains. Note that the ada3Δ or sgf73Δ mutants experience a long delay (>10 hr) before they start cycling. (D ada3Δ and sgf73Δ strains have significantly reduced H3K9 acetylation at OX, RB phase time points compared to WT. Note that ada3D exhibited a shorter OX phase compared to WT, while sgf73Δ exhibited an abnormal RB phase during which cells exhibit a second burst of oxygen consumption.

39
Figure 2.19 Growth and YMC Profiles for the sgf73Δ and ubp8Δ Mutants For the sgf73Δ mutant, there were reproducible delays (>10 h) in the onset of cycling followed by short, abnormal bursts of oxygen consumption in the midst of the RB phases. In contrast, a ubp8Δ mutant which lacks the SAGA deubiquitination component (Henry et al., 2003) exhibited more normal metabolic cycles as well as normal growth on SD, suggesting that the histone deubiquitylase activity of SAGA is not critical for entry into growth.

40
Figure 2.20 The acetylation of SAGA components is dependent on Ada3p. The acetylation status of SAGA components are determined as described in the indicated strains

41
Figure 2.21. The Acetylation of SAGA Enables Recruitment to Growth Genes (A) In the presence of a catalytically inactive Gcn5p (E173Q), the SAGA complex is not acetylated. Diploid strains expressing the indicated tagged versions of either a WT or a catalytically inactive Gcn5p were constructed and used to immunoprecipitate the SAGA complex during either the OX or RC phase. Note that Gcn5p E173Q pulls down a SAGA that is not acetylated. The integrity of the SAGA complex is not dependent on Gcn5p (Figure 2.8), in agreement with previous studies (Wu and Winston, 2002). (B) The deacetylated form of SAGA can be recruited to an RC phase gene, but not to an OX phase growth gene. ChIP experiments were performed as described in Figure 2.12 to assess whether acetylated or deacetylated SAGA can bind to a representative RC phase gene (ARO9) or OX phase gene (RPS11B) during either OX or RC phase. Note that deacetylated SAGA is present at the RC phase gene during RC phase, but not at the OX phase gene during OX phase.

42
Figure 2.22. Acetyl-CoA-Induced Histone Acetylation and Growth Gene Expression Are Driven by Gcn5p and SAGA (A) Acetate was added to WT or gcn5Δ cells during continuous growth to provide a burst of acetyl-CoA. Samples were harvested at the five indicated time points (2 min before, and 2, 5, 10, and 20 min after acetate dosing). (B) H3K9 acetylation and H4 acetylation increase in response to acetate addition in WT cells but not in gcn5D cells. (C) 13C acetate is converted to 13C acetyl-CoA and stimulates 12C acetyl-CoA production in both WT and gcn5Δ cells. (D) gcn5Δ cells exhibit much slower induction of growth genes in response to acetate addition. Transcript levels of representative genes highly expressed in the OX growth phase (RPS1B, RPL33B, SHM2) or RC quiescent-like phase (ARO9) were measured by real-time PCR and normalized against actin (ACT1) transcript levels. Note that despite the defect in growth gene induction, transcript levels of the RC phase gene ARO9 still decreased with similar kinetics in the gcn5Δ mutant. Error bars denote standard deviation for triplicate experiments.

43
Figure 2.23 Not all Acetylated Proteins are Dynamically Acetylated across the YMC The indicated proteins were tagged and then immunoprecipitated across the YMC to assess acetylation status as described in Figure 2A. Note that Snf2p, another Gcn5p substrate (Kim et al., 2010), is also dynamically acetylated across the YMC. In contrast, Acs1p, Acs2p, Fun12p, and Nat1p are acetylated but their acetylation is not dynamic across the YMC. Moreover, the NuA4 complex was immunoprecipitated across the YMC using a YNG2-FLAG strain. A coimmunoprecipitating protein of ~100 kDa is acetylated but its acetylation state did not change significantly as a function of the YMC.

44
Figure 2.24. Estimates of In vivo Acetyl-CoA Concentrations in Yeast The in vivo intracellular concentration of acetyl-CoA (average of the cell population, across the YMC and during batch culture growth) was calculated based on LC-MS/MS standard curves constructed using pure acetyl-CoA (Sigma). Values deduced from two daughter fragments of acetyl-CoA (303, 159 Da) were averaged. The estimation of acetyl-CoA concentration assumes 100% extraction of acetyl-CoA and a haploid cell volume of ~42 fl (Jorgensen et al., 2002). As only ~40-50% of the cell population enters cell division in each permissive window of the YMC under these continuous growth conditions (Tu et al., 2005), we estimate that acetyl-CoA may fluctuate between a low of ~3 μM in RC phase to over ~30 μM in OX phase cells that commit to growth. The Kd of acetyl-CoA binding to Gcn5p was previously measured to be ~8.5 μM (Langer et al., 2002), suggesting it is highly probable that Gcn5p activity is regulated by physiological fluctuations in acetyl-CoA.

45
Figure 2.25 Temperature sensitive growth phenotype of Kd mutant GCN5 A190T on minimal medium with 60mM acetate (SA). This mutant has a lower Kd for acetyl-CoA (0.56μM compared to 8.5μM for wild type, (Langer et al., 2002), thus increasing the affinity of the enzyme for acetyl-CoA by ~10), and exhibits a growth defect on acetate (SA) at 37°C but not 30°C. However, GCN5 A190T cells exhibited normal growth on minimal medium with 2% glucose at 30°C and 37°C. Pictures of each plate were taken at different times due to different growth rates. In addition, GCN5 A190T cells exhibited normal metabolic cycles at 30°C (data not shown).

46
Figure 2.26 Timepoint collections over theYMC for RNA-seq and H3K9ac ChIP-seq 16 timepoints were collected over a YMC from CEN.PK alpha strain. The OX, RB and RC phases of the YMC was marked on top of the trace. Specific times of collection are listed in Table 2.5. Note that the intervals between timepoints were spaced differently in order to capture more dynamic changes in the OX and RB phase.

47
Figure 2.27 Snapshot of H3K9ac ChIP-seq over 16 timepoints from the YMC H3K9ac occupancy was viewed in the integrated genome viewer (IGV). Note that most of the peaks were dynamically changing over the 16 timepoints. In agreement with the previous observation that histone acetylation is regulated by acetyl-CoA levels, the overall magnitude of the peaks from OX phase (t2-t7) is higher than in the RC phase (t1, t14-t16).

48
Figure 2.28 “just in time” regulation of ribi and RP gene expression Expression profiles of ~240 ribi genes and ~140 RP genes were retrieved from the RNA-seq data and clustered to generate heatmaps. Expression of ribi genes started to increase from timepoint 3 and peak at timepoint 4 while expression of RP genes increase from timepoint 4 and peak at timepoint 5. The time difference between t3 and t4 is less than 5 min.

49
Figure 2.29 H3K9ac ChIP-seq profiles of representative RP and ribi genes H3K9ac occupancy on promoters of representative RP and ribi genes were viewed from the Integrated Genome Viewer (IGV). H3K9ac marks on RP and ribi genes increase robustly during OX phase (t2-t7) in tune with the increasing acetyl-CoA levels. H3K9ac marks on ribi genes however, seems to be more transient than on RP genes.

50Table 2.1. The top 100 peaks in OX phase for H3K9ac/H3 ranked by p-value/number of reads, as called by CLC Genomics Workbench. Note the abundance of ribosomal genes and other genes important for growth.
Chr start end Standard Name
Systematic Name
YMC phase Description
1 chr5 269972 270061 RPL34A YER056C-A OX Protein component of the large (60S) ribosomal subunit, nearly identical to Rpl34Bp and has similarity to rat L34 ribosomal protein 2 chr2 168421 168509 RPL19B YBL027W OX Protein component of the large (60S) ribosomal subunit, nearly identical to Rpl19Ap and has similarity to rat L19 ribosomal protein 3 chr10 75001 75046 RPS22A YJL190C OX Protein component of the small (40S) ribosomal subunit 4 chr7 439039 439105 RPL30 YGL030W OX Protein component of the large (60S) ribosomal subunit, has similarity to rat L30 ribosomal protein 5 chr6 223881 223972 YFR032C-B YFR032C-B N/A Putative protein of unknown function 6 chr12 282219 282342 BUD20 YLR074C OX Protein involved in bud-site selection 7 chr5 101216 101278 CUP5 YEL027W OX Proteolipid subunit of the vacuolar H(+)-ATPase V0 sector (subunit c; dicyclohexylcarbodiimide binding subunit) 8 chr4 308505 308569 RPL13A YDL082W OX Protein component of the large (60S) ribosomal subunit, nearly identical to Rpl13Bp 9 chr16 75714 75811 RPL36B YPL249C-A OX Protein component of the large (60S) ribosomal subunit, nearly identical to Rpl36Ap and has similarity to rat L36 ribosomal protein
10 chr3 178098 178181 RPS14A YCR031C OX Ribosomal protein 59 of the small subunit, required for ribosome assembly and 20S pre-rRNA processing 11 chr12 722060 722182 ATP14 YLR295C RB Subunit h of the F0 sector of mitochondrial F1F0 ATP synthase, which is a large, evolutionarily conserved enzyme complex required for ATP synthesis 12 chr12 796046 796119 RPS25B YLR333C OX Protein component of the small (40S) ribosomal subunit 13 chr15 960073 960182 RPA43 YOR340C OX RNA polymerase I subunit A43 14 chr2 606220 606308 RPL21A YBR191W OX Protein component of the large (60S) ribosomal subunit, nearly identical to Rpl21Bp and has similarity to rat L21 ribosomal protein 15 chr15 254273 254355 RPP2A YOL039W OX Ribosomal protein P2 alpha, a component of the ribosomal stalk, which is involved in the interaction between translational elongation factors and the ribosome 16 chr16 588122 588206 YPR013C YPR013C OX Putative zinc finger protein 17 chr3 124898 125000 YCR007C YCR007C N/A Putative integral membrane protein, member of DUP240 gene family 18 chr7 558474 558595 CAX4 YGR036C OX Dolichyl pyrophosphate (Dol-P-P) phosphatase with a luminally oriented active site in the ER, cleaves the anhydride linkage in Dol-P-P 19 chr2 89312 89413 YBL071C-B YBL071C-B N/A Putative protein of unknown function 20 chr4 1301663 1301754 RPL12B YDR418W OX Protein component of the large (60S) ribosomal subunit, nearly identical to Rpl12Ap 21 chr15 968482 968539 YOR342C YOR342C OX Putative protein of unknown function 22 chr7 1065783 1065888 BIO2 YGR286C N/A Biotin synthase, catalyzes the conversion of dethiobiotin to biotin, which is the last step of the biotin biosynthesis pathway 23 chr11 431290 431470 RPL14A YKL006W OX N-terminally acetylated protein component of the large (60S) ribosomal subunit, nearly identical to Rpl14Bp and has similarity to rat L14 ribosomal protein 24 chr15 867786 867844 YOR293C-A YOR293C-A N/A Putative protein of unknown function 25 chr12 260308 260406 REX2 YLR059C OX 3'-5' RNA exonuclease 26 chr9 98846 98861 RPL16A YIL133C OX N-terminally acetylated protein component of the large (60S) ribosomal subunit, binds to 5.8 S rRNA 27 chr11 556940 557207 KTR2 YKR061W OX Mannosyltransferase involved in N-linked protein glycosylation 28 chr8 75422 75498 RPS20 YHL015W OX Protein component of the small (40S) ribosomal subunit 29 chr12 499138 499211 RPS31 YLR167W OX Fusion protein that is cleaved to yield a ribosomal protein of the small (40S) subunit and ubiquitin 30 chr5 15404 15464 DLD3 YEL071W RB D-lactate dehydrogenase, part of the retrograde regulon which consists of genes whose expression is stimulated by damage to mitochondria 31 chr15 93863 93877 RPL18A YOL120C OX Protein component of the large (60S) ribosomal subunit, identical to Rpl18Bp and has similarity to rat L18 ribosomal protein 32 chr15 79819 80326 RPL25 YOL127W OX Primary rRNA-binding ribosomal protein component of the large (60S) ribosomal subunit, has similarity to E. coli L23 and rat L23a ribosomal proteins 33 chr14 331270 331329 RPL42A YNL162W OX Protein component of the large (60S) ribosomal subunit, identical to Rpl42Bp and has similarity to rat L44 ribosomal protein 34 chr5 53030 53114 RPL12A YEL054C OX Protein component of the large (60S) ribosomal subunit, nearly identical to Rpl12Bp 35 chr12 1028905 1028982 RPL6B YLR448W OX Protein component of the large (60S) ribosomal subunit, has similarity to Rpl6Ap and to rat L6 ribosomal protein 36 chr15 1043733 1043766 GDH1 YOR375C OX NADP(+)-dependent glutamate dehydrogenase, synthesizes glutamate from ammonia and alpha-ketoglutarate 37 chr5 423773 423832 RPS26B YER131W OX Protein component of the small (40S) ribosomal subunit 38 chr12 781947 782109 YLR326W YLR326W OX Putative protein of unknown function, predicted to be palmitoylated 39 chr13 551172 551266 RPL13B YMR142C OX Protein component of the large (60S) ribosomal subunit, nearly identical to Rpl13Ap 40 chr13 651304 651385 RPL36A YMR194W OX N-terminally acetylated protein component of the large (60S) ribosomal subunit, nearly identical to Rpl36Bp and has similarity to rat L36 ribosomal protein 41 chr16 481477 481566 EGD1 YPL037C OX Subunit beta1 of the nascent polypeptide-associated complex (NAC) involved in protein targeting, associated with cytoplasmic ribosomes 42 chr7 325256 325409 TOS8 YGL096W RC Homeodomain-containing protein and putative transcription factor found associated with chromatin 43 chr2 549300 549380 RPB5 YBR154C OX RNA polymerase subunit ABC27, common to RNA polymerases I, II, and III 44 chr4 364754 364780 LHP1 YDL051W OX RNA binding protein required for maturation of tRNA and U6 snRNA precursors
45 chr11 383070 383182 MAE1 YKL029C OX Mitochondrial malic enzyme, catalyzes the oxidative decarboxylation of malate to pyruvate, which is a key intermediate in sugar metabolism and a precursor for synthesis of several amino acids
46 chr14 663046 663097 TIM23 YNR017W RB Essential component of the Translocase of the Inner Mitochondrial membrane (TIM23 complex) 47 chr15 779430 779472 RPL33B YOR234C OX Ribosomal protein L37 of the large (60S) ribosomal subunit, nearly identical to Rpl33Ap and has similarity to rat L35a 48 chr14 302684 302765 RPS3 YNL178W OX Protein component of the small (40S) ribosomal subunit, has apurinic/apyrimidinic (AP) endonuclease activity 49 chr13 753176 753705 RPL20A YMR242C OX Protein component of the large (60S) ribosomal subunit, nearly identical to Rpl20Bp and has similarity to rat L18a ribosomal protein 50 chr16 405898 406017 RPL21B YPL079W OX Protein component of the large (60S) ribosomal subunit, nearly identical to Rpl21Ap and has similarity to rat L21 ribosomal protein 51 chr12 855207 855374 RPS22B YLR367W OX Protein component of the small (40S) ribosomal subunit 52 chr12 931797 931872 RPL31B YLR406C OX Protein component of the large (60S) ribosomal subunit, nearly identical to Rpl31Ap and has similarity to rat L31 ribosomal protein 53 chr4 1490617 1490679 SNA2 YDR525W-A RC Protein of unknown function, has similarity to Pmp3p, which is involved in cation transport 54 chr14 499639 499724 RPL9B YNL067W OX Protein component of the large (60S) ribosomal subunit, nearly identical to Rpl9Ap and has similarity to E. coli L6 and rat L9 ribosomal proteins 55 chr11 335022 335102 TMA19 YKL056C OX Protein that associates with ribosomes 56 chr7 677325 677435 TPC1 YGR096W OX Mitochondrial membrane transporter that mediates uptake of the essential cofactor thiamine pyrophosphate (ThPP) into mitochondria 57 chr2 785494 785654 CTP1 YBR291C OX Mitochondrial inner membrane citrate transporter, member of the mitochondrial carrier family

51
58 chr12 522855 522947 RPL37A YLR185W OX Protein component of the large (60S) ribosomal subunit, has similarity to Rpl37Bp and to rat L37 ribosomal protein 59 chr13 226023 226097 RPS17A YML024W OX Ribosomal protein 51 (rp51) of the small (40s) subunit 60 chr4 341062 341135 RPS29B YDL061C OX Protein component of the small (40S) ribosomal subunit 61 chr12 673265 673312 RPS28B YLR264W OX Protein component of the small (40S) ribosomal subunit 62 chr8 382551 382624 RPL42B YHR141C OX Protein component of the large (60S) ribosomal subunit, identical to Rpl42Ap and has similarity to rat L44 63 chr4 117655 117743 RPL35A YDL191W OX Protein component of the large (60S) ribosomal subunit, identical to Rpl35Bp and has similarity to rat L35 ribosomal protein 64 chr13 535007 535085 RRB1 YMR131C OX Essential nuclear protein involved in early steps of ribosome biogenesis 65 chr2 45693 45774 RPL32 YBL092W OX Protein component of the large (60S) ribosomal subunit, has similarity to rat L32 ribosomal protein 66 chr7 738588 738709 PPT1 YGR123C OX Protein serine/threonine phosphatase with similarity to human phosphatase PP5 67 chr16 576476 576575 SUT2 YPR009W OX Putative transcription factor 68 chr13 732332 732416 RPS10B YMR230W OX Protein component of the small (40S) ribosomal subunit 69 chr13 123891 123953 RPL6A YML073C OX N-terminally acetylated protein component of the large (60S) ribosomal subunit, has similarity to Rpl6Bp and to rat L6 ribosomal protein 70 chr7 879770 879865 HIP1 YGR191W OX High-affinity histidine permease, also involved in the transport of manganese ions 71 chr10 703043 703101 RPS4A YJR145C OX Protein component of the small (40S) ribosomal subunit 72 chr8 505488 505562 RPS4B YHR203C OX Protein component of the small (40S) ribosomal subunit 73 chr15 1010737 1010829 VTS1 YOR359W OX Post-transcriptional gene regulator, flap-structured DNA-binding and RNA-binding protein 74 chr4 1239533 1239623 RPP2B YDR382W OX Ribosomal protein P2 beta, a component of the ribosomal stalk, which is involved in the interaction between translational elongation factors and the ribosome 75 chr12 819321 819396 RPL26A YLR344W OX Protein component of the large (60S) ribosomal subunit, nearly identical to Rpl26Bp and has similarity to E. coli L24 and rat L26 ribosomal proteins 76 chr12 264240 264293 YLR063W YLR063W OX Putative S-adenosylmethionine-dependent methyltransferase 77 chr7 148850 148888 YGL188C-A YGL188C-A N/A Putative protein of unknown function 78 chr5 306382 306475 RPS24A YER074W OX Protein component of the small (40S) ribosomal subunit 79 chr13 558442 558527 TIF34 YMR146C OX eIF3i subunit of the core complex of translation initiation factor 3 (eIF3), which is essential for translation
80 chr9 188142 188236 LYS12 YIL094C OX Homo-isocitrate dehydrogenase, an NAD-linked mitochondrial enzyme required for the fourth step in the biosynthesis of lysine, in which homo-isocitrate is oxidatively decarboxylated to alpha-ketoadipate
81 chr11 109327 109413 RPL17A YKL180W OX Protein component of the large (60S) ribosomal subunit, nearly identical to Rpl17Bp and has similarity to E. coli L22 and rat L17 ribosomal proteins 82 chr7 534686 534736 RPS25A YGR027C OX Protein component of the small (40S) ribosomal subunit 83 chr4 1402016 1402089 RPL27B YDR471W OX Protein component of the large (60S) ribosomal subunit, nearly identical to Rpl27Ap and has similarity to rat L27 ribosomal protein 84 chr4 1359897 1359982 RPS18A YDR450W OX Protein component of the small (40S) ribosomal subunit
85 chr5 237628 237728 ERG28 YER044C RC Endoplasmic reticulum membrane protein, may facilitate protein-protein interactions between the Erg26p dehydrogenase and the Erg27p 3-ketoreductase and/or tether these enzymes to the ER
86 chr15 444785 444867 RPL3 YOR063W OX Protein component of the large (60S) ribosomal subunit, has similarity to E. coli L3 and rat L3 ribosomal proteins 87 chr7 311135 311225 RPL28 YGL103W OX Ribosomal protein of the large (60S) ribosomal subunit, has similarity to E. coli L15 and rat L27a ribosomal proteins 88 chr13 13655 13747 ERO1 YML130C OX Thiol oxidase required for oxidative protein folding in the endoplasmic reticulum 89 chr12 898283 898404 RPS29A YLR388W OX Protein component of the small (40S) ribosomal subunit 90 chr10 119426 119462 YJL160C YJL160C RC Putative protein of unknown function 91 chr10 608451 608530 RPL43B YJR094W-A OX Protein component of the large (60S) ribosomal subunit, identical to Rpl43Ap and has similarity to rat L37a ribosomal protein 92 chr14 252030 252116 SSB2 YNL209W OX Cytoplasmic ATPase that is a ribosome-associated molecular chaperone, functions with J-protein partner Zuo1p 93 chr7 56023 56086 MTO1 YGL236C RB Mitochondrial protein, forms a heterodimer complex with Mss1p that performs the 5-carboxymethylaminomethyl modification of the wobble uridine base in mitochondrial tRNAs 94 chr10 180915 181028 YJL127C-B YJL127C-B N/A Putative protein of unknown function 95 chr2 306865 306922 PDX3 YBR035C N/A Pyridoxine (pyridoxamine) phosphate oxidase, has homologs in E. coli and Myxococcus xanthus 96 chr12 1002017 1002101 ATG23 YLR431C RC Peripheral membrane protein required for the cytoplasm-to-vacuole targeting (Cvt) pathway and efficient macroautophagy 97 chr10 466544 466620 ESS1 YJR017C N/A Peptidylprolyl-cis/trans-isomerase (PPIase) specific for phosphorylated serine and threonine residues N-terminal to proline 98 chr4 322408 322521 RPL31A YDL075W OX Protein component of the large (60S) ribosomal subunit, nearly identical to Rpl31Bp and has similarity to rat L31 ribosomal protein 99 chr7 920694 920779 RPS0A YGR214W OX Protein component of the small (40S) ribosomal subunit, nearly identical to Rps0Bp
100 chr11 229526 229611 KTI12 YKL110C OX Protein that plays a role, with Elongator complex, in modification of wobble nucleosides in tRNA

52
Table2.2. The top 100 peaks in RC phase for H3K9ac/H3 ranked by p-value/number of reads, as called by CLC Genomics Workbench.
Chr start end Standard Name
Systematic Name
YMC phase Description
1 chr4 915156 915211 HTA1 YDR225W N/A Histone H2A, core histone protein required for chromatin assembly and chromosome function 2 chr11 92619 92832 MTR2 YKL186C RC mRNA transport regulator, essential nuclear protein 3 chr4 599269 599336 RAD55 YDR076W N/A Protein that stimulates strand exchange by stabilizing the binding of Rad51p to single-stranded DNA 4 chr8 17297 17439 YHL042W YHL042W N/A Putative protein of unknown function 5 chr4 135102 135148 INH1 YDL181W RC Protein that inhibits ATP hydrolysis by the F1F0-ATP synthase 6 chr3 123107 123229 CIT2 YCR005C RB Citrate synthase, catalyzes the condensation of acetyl coenzyme A and oxaloacetate to form citrate, peroxisomal isozyme involved in glyoxylate cycle 7 chr5 265045 265135 HIS1 YER055C OX ATP phosphoribosyltransferase, a hexameric enzyme, catalyzes the first step in histidine biosynthesis 8 chr4 679947 679987 ALT2 YDR111C RC Putative alanine transaminase (glutamic pyruvic transaminase) 9 chr10 181742 181974 YJL127C-B YJL127C-B N/A Putative protein of unknown function
10 chr5 69506 69589 IES6 YEL044W RC Protein that associates with the INO80 chromatin remodeling complex under low-salt conditions 11 chr15 1044045 1044129 GDH1 YOR375C OX NADP(+)-dependent glutamate dehydrogenase, synthesizes glutamate from ammonia and alpha-ketoglutarate 12 chr13 759389 759483 FAA4 YMR246W RC Long chain fatty acyl-CoA synthetase, activates imported fatty acids with a preference for C12:0-C16:0 chain lengths 13 chr10 468553 468627 TES1 YJR019C RC Peroxisomal acyl-CoA thioesterase likely to be involved in fatty acid oxidation rather than fatty acid synthesis 14 chr4 1490569 1490644 SNA2 YDR525W-A RC Protein of unknown function, has similarity to Pmp3p, which is involved in cation transport 15 chr12 874722 874793 FBP1 YLR377C RC Fructose-1,6-bisphosphatase, key regulatory enzyme in the gluconeogenesis pathway, required for glucose metabolism 16 chr7 785414 785496 YGR146C-A YGR146C-A N/A Putative protein of unknown function 17 chr8 297173 297190 HXT5 YHR096C RC Hexose transporter with moderate affinity for glucose, induced in the presence of non-fermentable carbon sources, induced by a decrease in growth rate 18 chr15 109020 109099 SHR5 YOL110W RC Subunit of a palmitoyltransferase, composed of Shr5p and Erf2p, that adds a palmitoyl lipid moiety to heterolipidated substrates such as Ras1p and Ras2p through a thioester linkage
19 chr11 389896 389959 GPX1 YKL026C RC Phospholipid hydroperoxide glutathione peroxidase induced by glucose starvation that protects cells from phospholipid hydroperoxides and nonphospholipid peroxides during oxidative stress
20 chr13 610945 611027 SIP18 YMR175W RC Phospholipid-binding protein 21 chr7 433711 433823 MIG1 YGL035C RC Transcription factor involved in glucose repression 22 chr16 195833 195905 UIP4 YPL186C RC Protein that interacts with Ulp1p, a Ubl (ubiquitin-like protein)-specific protease for Smt3p protein conjugates 23 chr2 741831 742010 FMP21 YBR269C RC Putative protein of unknown function 24 chr7 989463 989550 MGA1 YGR249W RC Protein similar to heat shock transcription factor 25 chr15 232041 232431 DDR2 YOL052C-A N/A Multistress response protein, expression is activated by a variety of xenobiotic agents and environmental or physiological stresses 26 chr4 977010 977095 SWM1 YDR260C RC Subunit of the anaphase-promoting complex, which is an E3 ubiquitin ligase that regulates the metaphase-anaphase transition and exit from mitosis 27 chr12 1011681 1011767 YLR437C YLR437C RC Protein that regulates the nuclear localization of ribonucleotide reductase Rnr2p and Rnr4p subunits 28 chr7 849134 849206 ERG1 YGR175C OX Squalene epoxidase, catalyzes the epoxidation of squalene to 2,3-oxidosqualene 29 chr7 979743 979829 LSC2 YGR244C RC Beta subunit of succinyl-CoA ligase, which is a mitochondrial enzyme of the TCA cycle that catalyzes the nucleotide-dependent conversion of succinyl-CoA to succinate
30 chr15 216717 216784 GPD2 YOL059W OX NAD-dependent glycerol 3-phosphate dehydrogenase, homolog of Gpd1p, expression is controlled by an oxygen-independent signaling pathway required to regulate metabolism under anoxic conditions
31 chr16 900076 900168 SMX3 YPR182W RC Core Sm protein Sm F 32 chr14 198306 198374 ZWF1 YNL241C N/A Glucose-6-phosphate dehydrogenase (G6PD), catalyzes the first step of the pentose phosphate pathway 33 chr10 337585 337673 YJL052C-A YJL052C-A N/A Putative protein of unknown function, identified based on comparison to related yeast species 34 chr12 322845 322922 YLR091W YLR091W RC Protein of unknown function, required for mitochondrial genome maintenance 35 chr7 144462 144534 COX13 YGL191W RB Subunit VIa of cytochrome c oxidase, which is the terminal member of the mitochondrial inner membrane electron transport chain 36 chr12 341371 341466 YLR099W-A YLR099W-A N/A Putative protein of unknown function 37 chr8 107811 107880 QCR10 YHR001W-A RC Subunit of the ubiqunol-cytochrome c oxidoreductase complex which includes Cobp, Rip1p, Cyt1p, Cor1p, Qcr2p, Qcr6p, Qcr7p, Qcr8p, Qcr9p, and Qcr10p 38 chr10 236902 236990 LSB6 YJL100W RC Type II phosphatidylinositol 4-kinase that binds Las17p, which is a homolog of human Wiskott-Aldrich Syndrome protein involved in actin patch assembly and actin polymerization 39 chr7 398319 398382 OLE1 YGL055W RC Delta(9) fatty acid desaturase, required for monounsaturated fatty acid synthesis and for normal distribution of mitochondria 40 chr16 615053 615157 ATH1 YPR026W RC Acid trehalase required for utilization of extracellular trehalose 41 chr13 167895 167957 YML054C-A YML054C-A N/A Putative protein of unknown function 42 chr16 46809 46882 KEL3 YPL263C OX Cytoplasmic protein of unknown function 43 chr15 1039051 1039122 ALD4 YOR374W RC Mitochondrial aldehyde dehydrogenase, required for growth on ethanol and conversion of acetaldehyde to acetate 44 chr15 389242 389315 CRS5 YOR031W RC Copper-binding metallothionein, required for wild-type copper resistance 45 chr4 1496545 1496657 QCR7 YDR529C RB Subunit 7 of the ubiquinol cytochrome-c reductase complex, which is a component of the mitochondrial inner membrane electron transport chain 46 chr16 552061 552128 ULA1 YPL003W RC Protein that acts together with Uba3p to activate Rub1p before its conjugation to proteins (neddylation), which may play a role in protein degradation
47 chr13 625897 625983 YMR182W-A YMR182W-A N/A Putative protein of unknown function
48 chr16 373531 373605 SSU1 YPL092W RC Plasma membrane sulfite pump involved in sulfite metabolism and required for efficient sulfite efflux 49 chr16 132599 132684 FLC1 YPL221W OX Putative FAD transporter 50 chr7 525438 525537 UGA1 YGR019W RC Gamma-aminobutyrate (GABA) transaminase (4-aminobutyrate aminotransferase) involved in the 4-aminobutyrate and glutamate degradation pathways 51 chr4 1459670 1459775 PSP1 YDR505C RC Asn and gln rich protein of unknown function 52 chr4 892349 892419 AHA1 YDR214W RC Co-chaperone that binds to Hsp82p and activates its ATPase activity
53 chr13 478127 478211 YMR105W-A YMR105W-A N/A Putative protein of unknown function
54 chr16 198782 198871 YPL183W-A YPL183W-A RB Protein involved translation

53
55 chr4 1233471 1233532 YDR379C-A YDR379C-A N/A Protein involved in the assembly of the mitochondrial succinate dehydrogenase complex 56 chr15 154687 154773 MPD2 YOL088C RC Member of the protein disulfide isomerase (PDI) family, exhibits chaperone activity 57 chr10 452222 452232 YJR008W YJR008W RC Putative protein of unknown function 58 chr7 909192 909311 YGR205W YGR205W RC ATP-binding protein of unknown function 59 chr10 291362 291470 PRY1 YJL079C RB Protein of unknown function 60 chr16 822353 822464 ASN1 YPR145W OX Asparagine synthetase, isozyme of Asn2p 61 chr4 1166619 1166703 SVF1 YDR346C N/A Protein with a potential role in cell survival pathways, required for the diauxic growth shift 62 chr6 90549 90621 EPL1 YFL024C RC Component of NuA4, which is an essential histone H4/H2A acetyltransferase complex 63 chr16 30082 30155 ATP15 YPL271W N/A Epsilon subunit of the F1 sector of mitochondrial F1F0 ATP synthase, which is a large, evolutionarily conserved enzyme complex required for ATP synthesis 64 chr16 296762 296904 GIP3 YPL137C OX Glc7-interacting protein whose overexpression relocalizes Glc7p from the nucleus and prevents chromosome segregation 65 chr13 30163 30230 NDI1 YML120C RB NADH:ubiquinone oxidoreductase, transfers electrons from NADH to ubiquinone in the respiratory chain but does not pump protons 66 chr2 294070 294201 ETR1 YBR026C RC 2-enoyl thioester reductase, member of the medium chain dehydrogenase/reductase family 67 chr13 253186 253265 YML007C-A YML007C-A N/A Putative protein of unknown function 68 chr15 742093 742168 MGM1 YOR211C OX Mitochondrial GTPase, present in complex with Ugo1p and Fzo1p 69 chr8 370064 370127 IGO2 YHR132W-A N/A Protein required for initiation of G0 program 70 chr4 1059132 1059243 ATP5 YDR298C RB Subunit 5 of the stator stalk of mitochondrial F1F0 ATP synthase, which is an evolutionarily conserved enzyme complex required for ATP synthesis 71 chr11 143535 143628 PIR1 YKL164C RC O-glycosylated protein required for cell wall stability 72 chr4 699900 699990 YDR124W YDR124W OX Putative protein of unknown function 73 chr13 391648 391858 SEN15 YMR059W OX Subunit of the tRNA splicing endonuclease, which is composed of Sen2p, Sen15p, Sen34p, and Sen54p 74 chr11 171466 171572 AVT3 YKL146W N/A Vacuolar transporter, exports large neutral amino acids from the vacuole 75 chr15 931023 931099 SNC2 YOR327C RC Vesicle membrane receptor protein (v-SNARE) involved in the fusion between Golgi-derived secretory vesicles with the plasma membrane 76 chr4 316624 316696 MDH3 YDL078C RC Peroxisomal malate dehydrogenase, catalyzes interconversion of malate and oxaloacetate 77 chr15 380933 381002 STI1 YOR027W RC Hsp90 cochaperone, interacts with the Ssa group of the cytosolic Hsp70 chaperones and activates Ssa1p ATPase activity 78 chr13 343847 343939 MIH1 YMR036C RC Protein tyrosine phosphatase involved in cell cycle control 79 chr4 1189492 1189591 YDR357C YDR357C RC Protein of unknown function 80 chr4 1445904 1445989 ITR1 YDR497C RC Myo-inositol transporter with strong similarity to the minor myo-inositol transporter Itr2p, member of the sugar transporter superfamily 81 chr16 17250 17306 YPL277C YPL277C RC Putative protein of unknown function 82 chr15 675526 675592 LAS17 YOR181W RC Actin assembly factor, activates the Arp2/3 protein complex that nucleates branched actin filaments 83 chr11 567414 567483 GPT2 YKR067W RC Glycerol-3-phosphate/dihydroxyacetone phosphate dual substrate-specific sn-1 acyltransferase located in lipid particles and the ER 84 chr7 554965 555078 TIM21 YGR033C RC Nonessential subunit of the Translocase of the Inner Mitochondrial membrane (TIM23 complex) 85 chr7 108087 108141 POX1 YGL205W RC Fatty-acyl coenzyme A oxidase, involved in the fatty acid beta-oxidation pathway 86 chr13 262863 262997 GLO1 YML004C RC Monomeric glyoxalase I, catalyzes the detoxification of methylglyoxal (a by-product of glycolysis) via condensation with glutathione to produce S-D-lactoylglutathione 87 chr13 649825 650066 MRPL24 YMR193W RB Mitochondrial ribosomal protein of the large subunit
88 chr4 1184417 1184562 TRP4 YDR354W RC Anthranilate phosphoribosyl transferase of the tryptophan biosynthetic pathway, catalyzes the phosphoribosylation of anthranilate, subject to the general control system of amino acid biosynthesis
89 chr10 204965 205016 MDV1 YJL112W RB Peripheral protein of the cytosolic face of the mitochondrial outer membrane, required for mitochondrial fission 90 chr7 581472 581570 NQM1 YGR043C RC Transaldolase of unknown function
91 chr16 299737 299844 ODC1 YPL134C RB Mitochondrial inner membrane transporter, exports 2-oxoadipate and 2-oxoglutarate from the mitochondrial matrix to the cytosol for lysine and glutamate biosynthesis and lysine catabolism
92 chr4 894407 894503 ADR1 YDR216W RC Carbon source-responsive zinc-finger transcription factor, required for transcription of the glucose-repressed gene ADH2, of peroxisomal protein genes 93 chr4 755186 755298 KGD2 YDR148C RB Dihydrolipoyl transsuccinylase, component of the mitochondrial alpha-ketoglutarate dehydrogenase complex 94 chr13 558849 558958 YMR147W YMR147W RC Putative protein of unknown function 95 chr12 758840 758922 QNQ1 YLR312C RC Putative protein of unknown function 96 chr4 188509 188808 NOP14 YDL148C OX Nucleolar protein, forms a complex with Noc4p that mediates maturation and nuclear export of 40S ribosomal subunits 97 chr9 126193 126251 AYR1 YIL124W RC NADPH-dependent 1-acyl dihydroxyacetone phosphate reductase found in lipid particles, ER, and mitochondrial outer membrane 98 chr4 1443846 1443929 PUF6 YDR496C OX Pumilio-homology domain protein that binds the 3' UTR of ASH1 mRNA and represses its translation, resulting in proper asymmetric localization of ASH1 mRNA
99 chr13 192774 192854 CAT2 YML042W RC Carnitine acetyl-CoA transferase present in both mitochondria and peroxisomes, transfers activated acetyl groups to carnitine to form acetylcarnitine which can be shuttled across membranes
100 chr15 340110 340216 SGT2 YOR007C RC Glutamine-rich cytoplasmic protein that serves as a scaffold for binding Get4/5p and other proteins required to mediate posttranslational insertion of tail-anchored proteins into the ER membrane

54
Table 2.3. The top 100 peaks in OX phase for SAGA/Input ranked by max|FC|, as called by CisGenome (Ji et al., 2008). Note the abundance of ribosomal genes and other genes important for growth.
Chr start end Standard Name
Systematic Name
YMC phase Description
1 chr7 398033 398061 SDS23 YGL056C RC One of two S. cerevisiae homologs (Sds23p and Sds24p) of the S. pombe Sds23 protein, which is implicated in APC/cyclosome regulation 2 chr11 666196 666524 YKR106W YKR106W N/A Protein of unconfirmed function 3 chr12 1061443 1061547 YLR460C YLR460C N/A Member of the quinone oxidoreductase family, up-regulated in response to the fungicide mancozeb 4 chr2 813136 813164 COS2 YBR302C RC Protein of unknown function, member of the DUP380 subfamily of conserved, often subtelomerically-encoded proteins 5 chr16 645534 645606 YPR036W-A YPR036W-A N/A Protein of unknown function 6 chr5 69100 69180 GLY1 YEL046C OX Threonine aldolase, catalyzes the cleavage of L-allo-threonine and L-threonine to glycine 7 chr4 368976 369053 SIT4 YDL047W N/A Type 2A-related serine-threonine phosphatase that functions in the G1/S transition of the mitotic cycle 8 chr1 230037 230265 YAR075W YAR075W OX Non-functional protein with homology IMP dehydrogenase 9 chr4 465291 465399 SNQ2 YDR011W RC Plasma membrane ATP-binding cassette (ABC) transporter, multidrug transporter involved in multidrug resistance and resistance to singlet oxygen species
10 chr8 562450 562612 YHR219W YHR219W N/A Putative protein of unknown function with similarity to helicases 11 chr7 766247 766370 TPO2 YGR138C OX Polyamine transport protein specific for spermine 12 chr7 598982 599010 MUP1 YGR055W OX High affinity methionine permease, integral membrane protein with 13 putative membrane-spanning regions 13 chr4 132836 132932 LYS20 YDL182W OX Homocitrate synthase isozyme, catalyzes the condensation of acetyl-CoA and alpha-ketoglutarate to form homocitrate, which is the first step in the lysine biosynthesis pathway 14 chr7 483128 484428 YGL007C-A YGL007C-A N/A Putative protein of unknown function, identified by gene-trapping, microarray-based expression analysis, and genome-wide homology searching 15 chr5 545299 545378 BMH1 YER177W N/A 14-3-3 protein, major isoform 16 chr9 249154 249358 VHR1 YIL056W RB Transcriptional activator, required for the vitamin H-responsive element mediated induction of VHT1 and BIO5 in response to low biotin concentrations 17 chr5 85222 85431 UTR5 YEL035C RC Protein of unknown function 18 chr5 462003 462032 FTR1 YER145C RB High affinity iron permease involved in the transport of iron across the plasma membrane
19 chr11 630195 630284 PCK1 YKR097W RB Phosphoenolpyruvate carboxykinase, key enzyme in gluconeogenesis, catalyzes early reaction in carbohydrate biosynthesis, glucose represses transcription and accelerates mRNA degradation
20 chr4 1490021 1490494 SNA2 YDR525W-A RC Protein of unknown function, has similarity to Pmp3p, which is involved in cation transport 21 chr8 122389 122441 YHR007C-A YHR007C-A N/A Putative protein of unknown function 22 chr10 236430 236475 GSH1 YJL101C OX Gamma glutamylcysteine synthetase catalyzes the first step in glutathione (GSH) biosynthesis 23 chr8 462156 462251 OYE2 YHR179W OX Conserved NADPH oxidoreductase containing flavin mononucleotide (FMN), homologous to Oye3p with different ligand binding and catalytic properties 24 chr12 370546 370617 CCW12 YLR110C RC Cell wall mannoprotein, mutants are defective in mating and agglutination, expression is downregulated by alpha-factor 25 chr11 230914 230959 HAP4 YKL109W RB Subunit of the heme-activated, glucose-repressed Hap2p/3p/4p/5p CCAAT-binding complex, a transcriptional activator and global regulator of respiratory gene expression 26 chr2 140475 140602 FUI1 YBL042C OX High affinity uridine permease, localizes to the plasma membrane 27 chr16 679061 679089 ROX1 YPR065W OX Heme-dependent repressor of hypoxic genes 28 chr7 271842 271885 MET13 YGL125W RB Major isozyme of methylenetetrahydrofolate reductase, catalyzes the reduction of 5,10-methylenetetrahydrofolate to 5-methyltetrahydrofolate in the methionine biosynthesis pathway 29 chr9 0 134 YIL177C YIL177C N/A Putative protein of unknown function 30 chr15 968041 968168 YOR342C YOR342C OX Putative protein of unknown function 31 chr8 98207 98267 STE20 YHL007C OX Cdc42p-activated signal transducing kinase of the PAK (p21-activated kinase) family 32 chr4 0 160 COS7 YDL248W N/A Protein of unknown function, member of the DUP380 subfamily of conserved, often subtelomerically-encoded proteins 33 chr12 29512 29658 YCT1 YLL055W OX High-affinity cysteine-specific transporter with similarity to the Dal5p family of transporters 34 chr5 141235 141263 YEL007W YEL007W N/A Putative protein with sequence similarity to S. pombe gti1+ (gluconate transport inducer 1) 35 chr7 156340 156369 STR3 YGL184C OX Cystathionine beta-lyase, converts cystathionine into homocysteine 36 chr15 1043347 1043434 GDH1 YOR375C OX NADP(+)-dependent glutamate dehydrogenase, synthesizes glutamate from ammonia and alpha-ketoglutarate 37 chr2 392532 392583 SLM4 YBR077C RC Component of the EGO complex, which is involved in the regulation of microautophagy, and of the GSE complex, which is required for proper sorting of amino acid permease Gap1p 38 chr4 591761 591797 IPT1 YDR072C RC Inositolphosphotransferase, involved in synthesis of mannose-(inositol-P)2-ceramide (M(IP)2C), the most abundant sphingolipid 39 chr4 117447 117515 RPL35A YDL191W OX Protein component of the large (60S) ribosomal subunit, identical to Rpl35Bp and has similarity to rat L35 ribosomal protein 40 chr12 809395 809506 FKS1 YLR342W OX Catalytic subunit of 1,3-beta-D-glucan synthase, functionally redundant with alternate catalytic subunit Gsc2p 41 chr3 0 349 YCL073C YCL073C N/A Protein of unconfirmed function 42 chr13 306182 306229 SOK2 YMR016C OX Nuclear protein that plays a regulatory role in the cyclic AMP (cAMP)-dependent protein kinase (PKA) signal transduction pathway 43 chr15 254028 254112 RPP2A YOL039W OX Ribosomal protein P2 alpha, a component of the ribosomal stalk, which is involved in the interaction between translational elongation factors and the ribosome 44 chr11 258456 258485 YKL096C-B YKL096C-B N/A Putative protein of unknown function 45 chr7 323397 323484 SRM1 YGL097W OX Nucleotide exchange factor for Gsp1p, localizes to the nucleus, required for nucleocytoplasmic trafficking of macromolecules 46 chr7 609969 609997 ERG25 YGR060W RC C-4 methyl sterol oxidase, catalyzes the first of three steps required to remove two C-4 methyl groups from an intermediate in ergosterol biosynthesis 47 chr16 502775 502865 SKS1 YPL026C OX Putative serine/threonine protein kinase 48 chr16 76425 76454 RPL36B YPL249C-A OX Protein component of the large (60S) ribosomal subunit, nearly identical to Rpl36Ap and has similarity to rat L36 ribosomal protein 49 chr12 84252 84347 TPO1 YLL028W RC Polyamine transporter that recognizes spermine, putrescine, and spermidine 50 chr9 439765 439879 YIR042C YIR042C RB Putative protein of unknown function 51 chr13 226584 226612 RPS17A YML024W OX Ribosomal protein 51 (rp51) of the small (40s) subunit 52 chr4 628787 628889 RLI1 YDR091C OX Essential iron-sulfur protein required for ribosome biogenesis and translation initiation and termination 53 chr15 27821 27916 YOL155W-A YOL155W-A N/A Putative protein of unknown function 54 chr9 21786 21814 YIL172C YIL172C N/A Alpha-glucosidase with broad substrate specificity for alpha-1,4- and alpha-1,6-glucosides 55 chr4 523168 523196 ARO3 YDR035W RC 3-deoxy-D-arabino-heptulosonate-7-phosphate (DAHP) synthase, catalyzes the first step in aromatic amino acid biosynthesis and is feedback-inhibited by phenylalanine 56 chr13 924312 924474 PAU19 YMR325W RC Protein of unknown function, member of the seripauperin multigene family encoded mainly in subtelomeric regions 57 chr6 270128 270160 YFR057W YFR057W N/A Putative protein of unknown function

55
58 chr12 449576 449644 RNH203 YLR154C N/A Ribonuclease H2 subunit, required for RNase H2 activity 59 chr15 978727 978800 TYE7 YOR344C OX Serine-rich protein that contains a basic-helix-loop-helix (bHLH) DNA binding motif 60 chr13 551677 551790 RPS16A YMR143W OX Protein component of the small (40S) ribosomal subunit 61 chr7 310774 310864 RPL28 YGL103W OX Ribosomal protein of the large (60S) ribosomal subunit, has similarity to E. coli L15 and rat L27a ribosomal proteins 62 chr12 253446 253545 ERG3 YLR056W OX C-5 sterol desaturase, catalyzes the introduction of a C-5(6) double bond into episterol, a precursor in ergosterol biosynthesis 63 chr13 91204 91269 RPM2 YML091C RB Protein subunit of mitochondrial RNase P, has roles in nuclear transcription, cytoplasmic and mitochondrial RNA processing, and mitochondrial translation 64 chr13 408599 408660 MOT3 YMR070W N/A Nuclear transcription factor with two Cys2-His2 zinc fingers 65 chr11 518656 518791 UTH1 YKR042W OX Mitochondrial outer membrane and cell wall localized SUN family member involved in cell wall biogenesis and required for mitochondrial autophagy 66 chr8 36061 36158 RPL8A YHL033C OX Ribosomal protein L4 of the large (60S) ribosomal subunit, nearly identical to Rpl8Bp and has similarity to rat L7a ribosomal protein 67 chr11 68350 68409 MNN4 YKL201C RC Putative positive regulator of mannosylphosphate transferase (Mnn6p), involved in mannosylphosphorylation of N-linked oligosaccharides 68 chr10 646925 646954 YJR120W YJR120W N/A Protein of unknown function 69 chr3 78356 78431 AGP1 YCL025C OX Low-affinity amino acid permease with broad substrate range, involved in uptake of asparagine, glutamine, and other amino acids 70 chr15 520678 520745 RGS2 YOR107W RC Negative regulator of glucose-induced cAMP signaling 71 chr12 65531 65585 UBI4 YLL039C RC Ubiquitin, becomes conjugated to proteins, marking them for selective degradation via the ubiquitin-26S proteasome system 72 chr14 356739 357161 MEP2 YNL142W OX Ammonium permease involved in regulation of pseudohyphal growth 73 chr6 95666 95737 GAT1 YFL021W OX Transcriptional activator of genes involved in nitrogen catabolite repression
74 chr11 381766 381872 IXR1 YKL032C RC Protein that binds DNA containing intrastrand cross-links formed by cisplatin, contains two HMG (high mobility group box) domains, which confer the ability to bend cisplatin-modified DNA
75 chr14 217438 217467 PDR16 YNL231C OX Phosphatidylinositol transfer protein (PITP) controlled by the multiple drug resistance regulator Pdr1p, localizes to lipid particles and microsomes, controls levels of various lipids 76 chr16 641311 641733 GLN1 YPR035W N/A Glutamine synthetase (GS), synthesizes glutamine from glutamate and ammonia 77 chr4 366141 366530 KNH1 YDL049C RC Protein with similarity to Kre9p, which is involved in cell wall beta 1,6-glucan synthesis 78 chr2 415461 415489 RPL19A YBR084C-A OX Protein component of the large (60S) ribosomal subunit, nearly identical to Rpl19Bp and has similarity to rat L19 ribosomal protein 79 chr8 18073 18135 YHL042W YHL042W N/A Putative protein of unknown function 80 chr15 216493 216532 MAM3 YOL060C RC Protein required for normal mitochondrial morphology, has similarity to hemolysins 81 chr16 653994 654068 RPL43A YPR043W OX Protein component of the large (60S) ribosomal subunit, identical to Rpl43Bp and has similarity to rat L37a ribosomal protein 82 chr4 1080593 1080621 GIC2 YDR309C OX Redundant rho-like GTPase Cdc42p effector 83 chr16 328954 329040 IDI1 YPL117C RC Isopentenyl diphosphate:dimethylallyl diphosphate isomerase (IPP isomerase), catalyzes an essential activation step in the isoprenoid biosynthetic pathway 84 chr16 302914 303035 RPL5 YPL131W OX Protein component of the large (60S) ribosomal subunit with similarity to E. coli L18 and rat L5 ribosomal proteins 85 chr14 661956 662283 ACC1 YNR016C N/A Acetyl-CoA carboxylase, biotin containing enzyme that catalyzes the carboxylation of acetyl-CoA to form malonyl-CoA 86 chr2 376112 376145 BAP2 YBR068C RC High-affinity leucine permease, functions as a branched-chain amino acid permease involved in the uptake of leucine, isoleucine and valine 87 chr13 774418 774446 HOR7 YMR251W-A RC Protein of unknown function 88 chr16 822270 822298 ASN1 YPR145W OX Asparagine synthetase, isozyme of Asn2p 89 chr3 163644 163762 PMP1 YCR024C-A RC Small single-membrane span proteolipid that functions as a regulatory subunit of the plasma membrane H(+)-ATPase Pma1p 90 chr1 68400 68429 CLN3 YAL040C OX G1 cyclin involved in cell cycle progression 91 chr4 386967 387061 BSC1 YDL037C OX Protein of unconfirmed function, similar to cell surface flocculin Muc1p 92 chr12 645989 646018 HAP1 YLR256W RC Zinc finger transcription factor involved in the complex regulation of gene expression in response to levels of heme and oxygen
93 chr9 187812 187870 LYS12 YIL094C OX Homo-isocitrate dehydrogenase, an NAD-linked mitochondrial enzyme required for the fourth step in the biosynthesis of lysine, in which homo-isocitrate is oxidatively decarboxylated to alpha-ketoadipate
94 chr16 576288 576381 SUT2 YPR009W OX Putative transcription factor 95 chr12 950341 950384 YLR412C-A YLR412C-A N/A Putative protein of unknown function 96 chr15 94517 94562 RPL18A YOL120C OX Protein component of the large (60S) ribosomal subunit, identical to Rpl18Bp and has similarity to rat L18 ribosomal protein 97 chr1 141755 141825 SSA1 YAL005C RC ATPase involved in protein folding and nuclear localization signal (NLS)-directed nuclear transport 98 chr11 99953 99985 FAS1 YKL182W RC Beta subunit of fatty acid synthetase, which catalyzes the synthesis of long-chain saturated fatty acids 99 chr5 140542 140610 GCN4 YEL009C RC Basic leucine zipper (bZIP) transcriptional activator of amino acid biosynthetic genes in response to amino acid starvation
100 chr12 187603 187765 IZH3 YLR023C RB Membrane protein involved in zinc ion homeostasis, member of the four-protein IZH family, expression induced by zinc deficiency

56
Table 2.4. The top 100 peaks in RC phase for SAGA/Input ranked by max|FC|, as called by CisGenome (Ji et al., 2008).
Chr start end Standard Name
Systematic Name
YMC phase Description
1 chr16 644954 645925 YPR036W-A YPR036W-A N/A Protein of unknown function 2 chr11 21592 21620 JEN1 YKL217W RC Lactate transporter, required for uptake of lactate and pyruvate 3 chr7 398038 398066 SDS23 YGL056C RC One of two S. cerevisiae homologs (Sds23p and Sds24p) of the S. pombe Sds23 protein, which is implicated in APC/cyclosome regulation 4 chr1 230027 230272 YAR075W YAR075W OX Non-functional protein with homology IMP dehydrogenase 5 chr4 894075 894176 ADR1 YDR216W RC Carbon source-responsive zinc-finger transcription factor, required for transcription of the glucose-repressed gene ADH2, of peroxisomal protein genes 6 chr4 465328 465398 SNQ2 YDR011W RC Plasma membrane ATP-binding cassette (ABC) transporter, multidrug transporter involved in multidrug resistance and resistance to singlet oxygen species 7 chr7 772085 772218 BTN2 YGR142W RC v-SNARE binding protein that facilitates specific protein retrieval from a late endosome to the Golgi 8 chr4 1242506 1242535 ATO3 YDR384C RC Plasma membrane protein, regulation pattern suggests a possible role in export of ammonia from the cell 9 chr9 249235 249282 VHR1 YIL056W RB Transcriptional activator, required for the vitamin H-responsive element mediated induction of VHT1 and BIO5 in response to low biotin concentrations
10 chr4 368363 369552 STP4 YDL048C OX Protein containing a Kruppel-type zinc-finger domain 11 chr16 75105 75153 ICY2 YPL250C RC Protein of unknown function 12 chr12 875195 875261 FBP1 YLR377C RC Fructose-1,6-bisphosphatase, key regulatory enzyme in the gluconeogenesis pathway, required for glucose metabolism 13 chr11 231113 231213 HAP4 YKL109W RB Subunit of the heme-activated, glucose-repressed Hap2p/3p/4p/5p CCAAT-binding complex, a transcriptional activator and global regulator of respiratory gene expression 14 chr4 892528 892585 AHA1 YDR214W RC Co-chaperone that binds to Hsp82p and activates its ATPase activity 15 chr13 774387 774459 HOR7 YMR251W-A RC Protein of unknown function 16 chr4 806354 806457 HSP42 YDR171W RC Small heat shock protein (sHSP) with chaperone activity 17 chr15 1039529 1039634 ALD4 YOR374W RC Mitochondrial aldehyde dehydrogenase, required for growth on ethanol and conversion of acetaldehyde to acetate 18 chr12 783627 783710 TMA10 YLR327C RC Protein of unknown function that associates with ribosomes 19 chr5 264047 265114 GIP2 YER054C RC Putative regulatory subunit of the protein phosphatase Glc7p, involved in glycogen metabolism 20 chr5 545328 545383 BMH1 YER177W N/A 14-3-3 protein, major isoform 21 chr7 994128 994219 YGR250C YGR250C RC Putative RNA binding protein 22 chr2 372892 373039 TIP1 YBR067C RC Major cell wall mannoprotein with possible lipase activity 23 chr1 141644 141794 SSA1 YAL005C RC ATPase involved in protein folding and nuclear localization signal (NLS)-directed nuclear transport 24 chr7 809793 809848 RTS3 YGR161C RC Putative component of the protein phosphatase type 2A complex 25 chr7 625216 625330 YGR067C YGR067C RC Putative protein of unknown function 26 chr4 76809 76904 PRR2 YDL214C RC Serine/threonine protein kinase that inhibits pheromone induced signalling downstream of MAPK, possibly at the level of the Ste12p transcription factor 27 chr16 432008 432077 ALD6 YPL061W RC Cytosolic aldehyde dehydrogenase, activated by Mg2+ and utilizes NADP+ as the preferred coenzyme 28 chr11 516854 516934 YKR041W YKR041W OX Putative protein of unknown function 29 chr5 85180 85300 UTR5 YEL035C RC Protein of unknown function 30 chr15 968104 968149 YOR342C YOR342C OX Putative protein of unknown function 31 chr5 141164 141273 YEL007W YEL007W N/A Putative protein with sequence similarity to S. pombe gti1+ (gluconate transport inducer 1) 32 chr13 874601 874656 ADH2 YMR303C RC Glucose-repressible alcohol dehydrogenase II, catalyzes the conversion of ethanol to acetaldehyde 33 chr12 88310 88411 HSP104 YLL026W RC Heat shock protein that cooperates with Ydj1p (Hsp40) and Ssa1p (Hsp70) to refold and reactivate previously denatured, aggregated proteins 34 chr1 45189 45285 ACS1 YAL054C RC Acetyl-coA synthetase isoform which, along with Acs2p, is the nuclear source of acetyl-coA for histone acetlyation 35 chr12 65509 65598 UBI4 YLL039C RC Ubiquitin, becomes conjugated to proteins, marking them for selective degradation via the ubiquitin-26S proteasome system 36 chr3 137339 137400 PGK1 YCR012W RC 3-phosphoglycerate kinase, catalyzes transfer of high-energy phosphoryl groups from the acyl phosphate of 1,3-bisphosphoglycerate to ADP to produce ATP 37 chr12 83747 84580 TPO1 YLL028W RC Polyamine transporter that recognizes spermine, putrescine, and spermidine
38 chr11 381820 381862 IXR1 YKL032C RC Protein that binds DNA containing intrastrand cross-links formed by cisplatin, contains two HMG (high mobility group box) domains, which confer the ability to bend cisplatin-modified DNA
39 chr10 608801 608908 SFC1 YJR095W RC Mitochondrial succinate-fumarate transporter, transports succinate into and fumarate out of the mitochondrion 40 chr15 109367 109395 SHR5 YOL110W RC Subunit of a palmitoyltransferase, composed of Shr5p and Erf2p, that adds a palmitoyl lipid moiety to heterolipidated substrates such as Ras1p and Ras2p through a thioester linkage 41 chr7 484044 484072 YGL007C-A YGL007C-A N/A Putative protein of unknown function, identified by gene-trapping, microarray-based expression analysis, and genome-wide homology searching 42 chr11 68366 68440 MNN4 YKL201C RC Putative positive regulator of mannosylphosphate transferase (Mnn6p), involved in mannosylphosphorylation of N-linked oligosaccharides 43 chr4 636272 636317 GIS1 YDR096W RC JmjC domain-containing histone demethylase 44 chr7 977001 977042 FMP43 YGR243W RC Putative protein of unknown function 45 chr2 477389 477438 TEF2 YBR118W N/A Translational elongation factor EF-1 alpha 46 chr4 591690 591854 IPT1 YDR072C RC Inositolphosphotransferase, involved in synthesis of mannose-(inositol-P)2-ceramide (M(IP)2C), the most abundant sphingolipid 47 chr15 83202 83326 MDH2 YOL126C RC Cytoplasmic malate dehydrogenase, one of three isozymes that catalyze interconversion of malate and oxaloacetate 48 chr2 381633 381692 HSP26 YBR072W RC Small heat shock protein (sHSP) with chaperone activity 49 chr14 197988 198075 ZWF1 YNL241C N/A Glucose-6-phosphate dehydrogenase (G6PD), catalyzes the first step of the pentose phosphate pathway 50 chr7 914969 915069 ZPR1 YGR211W OX Essential protein with two zinc fingers, present in the nucleus of growing cells but relocates to the cytoplasm in starved cells via a process mediated by Cpr1p 51 chr7 323397 323536 SRM1 YGL097W OX Nucleotide exchange factor for Gsp1p, localizes to the nucleus, required for nucleocytoplasmic trafficking of macromolecules 52 chr12 449565 449640 RNH203 YLR154C N/A Ribonuclease H2 subunit, required for RNase H2 activity 53 chr7 883839 884427 TDH3 YGR192C N/A Glyceraldehyde-3-phosphate dehydrogenase, isozyme 3, involved in glycolysis and gluconeogenesis 54 chr5 461984 462015 FTR1 YER145C RB High affinity iron permease involved in the transport of iron across the plasma membrane 55 chr4 769210 769268 CPR1 YDR155C RC Cytoplasmic peptidyl-prolyl cis-trans isomerase (cyclophilin), catalyzes the cis-trans isomerization of peptide bonds N-terminal to proline residues 56 chr15 161774 161850 PHM7 YOL084W RC Protein of unknown function, expression is regulated by phosphate levels 57 chr13 557059 557088 NDE1 YMR145C RB Mitochondrial external NADH dehydrogenase, a type II NAD(P)H:quinone oxidoreductase that catalyzes the oxidation of cytosolic NADH

57
58 chr4 1490342 1490427 SNA2 YDR525W-A RC Protein of unknown function, has similarity to Pmp3p, which is involved in cation transport 59 chr9 382471 382541 YIR016W YIR016W RC Putative protein of unknown function 60 chr15 978686 978749 TYE7 YOR344C OX Serine-rich protein that contains a basic-helix-loop-helix (bHLH) DNA binding motif 61 chr10 525675 525751 CYC1 YJR048W RB Cytochrome c, isoform 1 62 chr5 69080 69176 GLY1 YEL046C OX Threonine aldolase, catalyzes the cleavage of L-allo-threonine and L-threonine to glycine 63 chr15 877818 877903 MBF1 YOR298C-A RC Transcriptional coactivator that bridges the DNA-binding region of Gcn4p and TATA-binding protein Spt15p 64 chr2 444774 444823 FES1 YBR101C RC Hsp70 (Ssa1p) nucleotide exchange factor, cytosolic homolog of Sil1p, which is the nucleotide exchange factor for BiP (Kar2p) in the endoplasmic reticulum 65 chr7 428216 428279 PNC1 YGL037C RC Nicotinamidase that converts nicotinamide to nicotinic acid as part of the NAD(+) salvage pathway, required for life span extension by calorie restriction 66 chr10 348700 348798 YJL047C-A YJL047C-A N/A Putative protein of unknown function 67 chr2 292026 292075 OLA1 YBR025C OX P-loop ATPase with similarity to human OLA1 and bacterial YchF 68 chr4 416941 417082 RPN4 YDL020C RC Transcription factor that stimulates expression of proteasome genes 69 chr7 650822 651008 PIL1 YGR086C RC Primary component of eisosomes, which are large immobile cell cortex structures associated with endocytosis 70 chr14 301385 301946 RPS3 YNL178W OX Protein component of the small (40S) ribosomal subunit, has apurinic/apyrimidinic (AP) endonuclease activity 71 chr14 405831 405938 DCP2 YNL118C RC Catalytic subunit of the Dcp1p-Dcp2p decapping enzyme complex, which removes the 5' cap structure from mRNAs prior to their degradation 72 chr6 106305 106394 MDJ1 YFL016C N/A Co-chaperone that stimulates the ATPase activity of the HSP70 protein Ssc1p 73 chr2 193686 193784 ACH1 YBL015W RB Protein with CoA transferase activity, particularly for CoASH transfer from succinyl-CoA to acetate 74 chr11 91983 92021 YKL187C YKL187C RC Putative protein of unknown function 75 chr13 334939 335007 YMR031C YMR031C RC Protein of unknown function with similarity to Ykl050cp and Uso1p
76 chr13 192492 192563 CAT2 YML042W RC Carnitine acetyl-CoA transferase present in both mitochondria and peroxisomes, transfers activated acetyl groups to carnitine to form acetylcarnitine which can be shuttled across membranes
77 chr16 17534 17593 YPL277C YPL277C RC Putative protein of unknown function 78 chr4 599809 599852 SED1 YDR077W RC Major stress-induced structural GPI-cell wall glycoprotein in stationary-phase cells, associates with translating ribosomes, possible role in mitochondrial genome maintenance 79 chr16 843033 843069 YPR158W YPR158W RC Protein of unknown function involved in destabilization of [URE3] prions 80 chr10 521510 521572 TAH11 YJR046W OX DNA replication licensing factor, required for pre-replication complex assembly 81 chr4 974408 974507 HSP78 YDR258C RC Oligomeric mitochondrial matrix chaperone that cooperates with Ssc1p in mitochondrial thermotolerance after heat shock 82 chr13 408593 408739 MOT3 YMR070W N/A Nuclear transcription factor with two Cys2-His2 zinc fingers 83 chr5 222448 222505 EDC2 YER035W RC RNA-binding protein, activates mRNA decapping directly by binding to the mRNA substrate and enhancing the activity of the decapping proteins Dcp1p and Dcp2p 84 chr16 832035 832136 SUE1 YPR151C RC Mitochondrial protein required for degradation of unstable forms of cytochrome c
85 chr11 630235 630291 PCK1 YKR097W RB Phosphoenolpyruvate carboxykinase, key enzyme in gluconeogenesis, catalyzes early reaction in carbohydrate biosynthesis, glucose represses transcription and accelerates mRNA degradation
86 chr2 809650 809860 DAN3 YBR301W N/A Cell wall mannoprotein with similarity to Tir1p, Tir2p, Tir3p, and Tir4p 87 chr6 180993 181021 YFR016C YFR016C RB Putative protein of unknown function 88 chr13 91214 91338 RPM2 YML091C RB Protein subunit of mitochondrial RNase P, has roles in nuclear transcription, cytoplasmic and mitochondrial RNA processing, and mitochondrial translation 89 chr3 133225 133776 ADY2 YCR010C RC Acetate transporter required for normal sporulation 90 chr6 224939 225008 QCR6 YFR033C RB Subunit 6 of the ubiquinol cytochrome-c reductase complex, which is a component of the mitochondrial inner membrane electron transport chain 91 chr12 1012183 1012300 YLR437C YLR437C RC Protein that regulates the nuclear localization of ribonucleotide reductase Rnr2p and Rnr4p subunits 92 chr7 384835 384970 PYC1 YGL062W RB Pyruvate carboxylase isoform, cytoplasmic enzyme that converts pyruvate to oxaloacetate 93 chr16 679123 679294 ROX1 YPR065W OX Heme-dependent repressor of hypoxic genes 94 chr11 258433 258462 YKL096C-B YKL096C-B N/A Putative protein of unknown function 95 chr7 609975 610028 ERG25 YGR060W RC C-4 methyl sterol oxidase, catalyzes the first of three steps required to remove two C-4 methyl groups from an intermediate in ergosterol biosynthesis 96 chr10 646900 646990 YJR120W YJR120W N/A Protein of unknown function 97 chr10 622827 622938 SOD1 YJR104C RC Cytosolic copper-zinc superoxide dismutase
98 chr4 1161701 1161812 HXT6 YDR343C RC High-affinity glucose transporter of the major facilitator superfamily, nearly identical to Hxt7p, expressed at high basal levels relative to other HXTs, repression of expression by high glucose requires SNF3
99 chr13 119388 119417 HMG1 YML075C RC One of two isozymes of HMG-CoA reductase that catalyzes the conversion of HMG-CoA to mevalonate, which is a rate-limiting step in sterol biosynthesis 100 chr14 662049 662172 ACC1 YNR016C N/A Acetyl-CoA carboxylase, biotin containing enzyme that catalyzes the carboxylation of acetyl-CoA to form malonyl-CoA

58Timepoint Relative collection time (min) t1 0t2 19t3 26t4 30.5t5 40t6 50t7 60t8 70t9 80t10 90t11 100t12 110.5t13 120.75t14 153t15 185t16 218
Table 2.5 Timepoint collection over theYMC for RNA-seq and H3K9ac ChIP-seq t1 was setted as 0 and the relative collection time for the 16 timepoints were given in the table. Note that the interval between timepoints collected from OX and RB phases (t2-t13) is shorter than that from the RC phase.

59
CHAPTER THREE
Dynamic Modification of Ifh1p in Response to Nutrient Cues
Ifh1p is a Key Transcription Factor for Ribosome Biogenesis
Although ribosome biogenesis is known to be regulated by nutrient-sensing signal
transduction pathways such as the TOR (Target of Rapamycin) and PKA (Protein Kinase A)
pathways, the precise manner by which key nutritional cues are relayed to the ribosome
biogenesis machinery has not been fully elucidated (Zaman et al., 2008). The transcription
factor Ifh1p is an essential regulator of ribosomal protein (RP) genes. This coactivator can be
dynamically recruited to RP gene promoters in response to nutrient availability and interacts
with other transcription factors including Fhl1p and Rap1p (Martineau et al., 2004; Rudra et
al., 2005; Schawalder et al., 2004; Wade et al., 2004). Ifh1p also forms a complex with rRNA
processing factors Rrp7p, Utp22p, and casein kinases, which has been termed the CURI
complex (Rudra et al., 2007). Hence, Ifh1p might also regulate rRNA processing.
Ifh1p Binds to Promoters of RP Genes and Non-RP Genes
As previously characterized in the YMC, RP gene expression is induced robustly in
the OX growth phase (Tu et al., 2005). And we have confirmed this robust and transient
induction of RP genes by RNA-seq across 16 timepoints of a YMC (Figure 3.1). The
association of Ifh1p at the promoters of RP genes is sensitive to growth conditions in batch
culture (Schawalder et al., 2004; Wade et al., 2004). We tested whether Ifh1p binding at RP
gene promoters is dynamic as a function of changes in the metabolic state experienced by

60
cells during the YMC. Chromatin immunoprecipitation (ChIP) analysis confirmed that Ifh1p
exhibited increased binding to a RP gene promoter (RPS11B) in the OX growth phase when
massive RP gene transcription takes place (Figure 3.2A, 3.2B). To investigate how Ifh1p
occupancy changes on a genome-wide scale, we conducted ChIP-Seq experiments with cells
collected from the OX, growth phase and the RC, quiescent-like phase.
Peaks called by CisGenome from OX phase data are listed (Table 3.1). The majority
of Ifh1p targets are RP genes, in agreement with previous findings (Wade et al., 2004).
Moreover, Ifh1p binding to RP genes was more apparent in OX than RC phase (Figure 3.2C),
consistent with the ChIP-PCR data (Figure 3.2B). We also manually inspected the ChIP-Seq
data to identify putative targets that might have eluded peak-calling algorithms. Examination
of all 137 RP genes revealed Ifh1p binding to proximal genomic regions of every RP gene
except RPS28A, RPL4A, RPL4B, RPL1A and RPL18B. Interestingly, Ifh1p also displayed
binding to several non-RP genes, including metabolic genes (Figure 3.3A), translation factors
(Figure 3.3B) and others such as GCN4, a transcription factor regulating amino acid
biosynthetic genes (Figure 3.3C). Some additional peaks with weak signals are shown
(Figure 3.4). Unlike peaks at RP genes which are always at intergenic regions, some of the
peaks at non-RP genes span the entire open reading frame. The gene expression pattern
across YMC and H3K9ac occupancy were shown in Figure 3.5. Note that unlike RP genes,
these non-RP targets of Ifh1p have different expression pattern and H3K9ac occupancy in the
YMC. These data indicate that in addition to RP genes, Ifh1p regulates additional targets
important for cell growth and metabolism.
Ifh1p is Dynamically Acetylated and Phosphorylated during Growth

61
In the previous chapter, we reported that acetyl-CoA, a central metabolite of carbon
sources, drives the cellular transcriptional growth program by inducing the acetylation of
histones present at growth genes (Cai et al., 2011). This regulatory mechanism was
discovered through a proteomic screen that identified dynamically acetylated components of
the acetyltransferase complex SAGA (Spt-Ada-Gcn-Acetyltransferase) (Cai et al., 2011).
This finding then led to the observation that its substrate histone H3 was also dynamically
acetylated in tune with acetyl-CoA levels. In subsequent validation of candidates, this screen
also revealed Ifh1p to be a dynamically acetylated, non-histone protein. Ifh1p is acetylated
precisely in tune with the increase in acetyl-CoA levels that accompanies entry into the OX
growth phase (Figure 3.6A). This acetylation of Ifh1p mirrors that of SAGA and histones,
occurring during the same temporal window of the YMC (Cai et al., 2011). Besides dynamic
acetylation, we also observed a mobility shift of the full-length Ifh1-FLAG protein as well as
its degradation products at a single time point in the midst of OX phase (Figure 3.6A). This
single time point is precisely when RP genes are heavily induced (Figure 3.1). The upshifted
band in OX phase was reduced to the same size as the band in RC phase after treatment with
phosphatase, indicating the band shift was due to phosphorylation (Figure 3.6B). Since the
TORC1 effector Sch9p and PKA have been linked to the ribosome biogenesis program
(Zaman et al., 2008), we tested whether the phosphorylation of Ifh1p could be detected by a
phospho-PKA substrate-specific antibody that recognizes the phosphorylate serine or
threonine in RRXS/T motifs (Figure 3.6C). This antibody recognized the phosphorylated
form of Ifh1p but not following phosphatase treatment, confirming that it is a likely substrate
of this family of kinases. We then verified that Ifh1p is dynamically phosphorylated in the

62
YMC specifically during the OX growth phase when ribosomal genes are activated (Figure
3.6D). Thus, using the YMC, we observed that Ifh1p is subjected to both acetylation and
phosphorylation modifications which occur during growth phase.
We then investigated these dynamic modifications on Ifh1p under typical batch
culture conditions. In synthetic dextrose minimal medium (SD), as cells grew to a higher
density and entered stationary phase, protein levels of Ifh1p decreased substantially (Figure
3.7A). However, the acetylation of Ifh1p began to decrease prior to the decrease in Ifh1p
protein levels, consistent with the idea that this modification is sensitive to nutrient state
(Figure 3.7A). Since TORC1 signaling has been shown to play key roles in nutrient sensing
and ribosome biogenesis (Martineau et al., 2004; Zaman et al., 2008), we tested whether
post-translational modifications of Ifh1p might be regulated by TORC1 (Target of
Rapamycin Complex 1). To modulate TORC1 signaling, we used either rapamycin to inhibit
TORC1 activity, or cycloheximide, a translation elongation inhibitor that has been reported
to stimulate TORC1 signaling (Huber et al., 2009). We observed that both acetylation and
phosphorylation of Ifh1p were strongly inhibited by rapamycin treatment. In contrast, these
modifications were stimulated by cycloheximide (Figure 3.7B). The translation stress
induced by cycloheximide treatment might signal the need for an increase in translational
capacity and RP gene transcription. Taken together, these data indicate that TORC1 can
regulate the dynamic acetylation and phosphorylation of Ifh1p.
Acetylation by Gcn5p and Deacetylation by Sirtuins Regulates Stability of Ifh1p

63
As we previously reported, only substrates of SAGA appear to be dynamically acetylated in
tune with intracellular acetyl-CoA fluctuations (Cai et al., 2011). Therefore, we suspected
that SAGA might also catalyze the acetylation of Ifh1p. We confirmed that Ifh1p was no
longer acetylated in strains lacking Gcn5p, the acetyltransferase present within SAGA
(Figure 3.8A). We then deleted several candidate deacetylases to determine which of them
might regulate Ifh1p acetylation. Surprisingly, Rpd3p, the histone deacetylase known to
regulate transcription of RP and ribi genes (Huber et al., 2011) and opening of rDNA repeats
(Sandmeier et al., 2002), was not responsible for Ifh1p deacetylation. Instead, deletion of the
NAD+-dependent deacetylase SIR2 resulted in significantly increased acetylation of Ifh1p
(Figure 3.8A). Deletion of HST1 (Homolog of SIR TWO), the closest SIR2 homolog in
combination with sir2Δ further increased Ifh1p acetylation, suggesting these deacetylases are
primarily responsible for Ifh1p deacetylation (Figure 3.8A). To further clarify the
contribution of SIR2 as well as the HST genes, we compared single deletion mutants as well
as double deletion mutants combining SIR2 deletion with different HST gene deletions.
These data indicate that Sir2p is the primary deacetylase for Ifh1p. However, in the absence
of Sir2p, Hst1p and Hst2p can also contribute to the deacetylation of Ifh1p (Figure 3.8B,
3.8C). Thus, Ifh1p is a significant non-histone substrate of sirtuins in budding yeast.
Next, we mapped the acetylation sites on Ifh1p. The amino acid sequence
composition of Ifh1p contains many clusters of basic and acidic residues which impose
significant difficulty for proteomic analysis (Figure 3.9). Therefore, we sought an alternative
approach by inducing peptide cleavage at cysteine residues following cyanylation (Tu and
Wang, 1999). Fortuitously, Ifh1p contains only two endogenous cysteine residues (Figure
64
3.10A) and mutation of both these cysteines to serine did not affect cell growth (data not
shown). We performed the mapping experiments using C-terminally FLAG-tagged Ifh1p
immunoprecipitated from cells grown to log phase, conditions under which the protein is
heavily acetylated. When the wild type protein was cleaved at C580 and C665, peptide
fragments C-terminal to the cleavage sites were recognized by a FLAG antibody. However,
they ran at different sizes compared to the peptides recognized by an acetyl-lysine (acK)
antibody, suggesting the acetylated sites are N-terminal to C580 (Figure 3.10B) In a
C580S/C665S Ifh1p mutant strain background, serine to cysteine mutations were introduced
at various sites before residue 580 to induce peptide cleavage. The pattern of peptides
recognized by FLAG antibody was compared with those recognized by acK antibody to
deduce the acetylated region within Ifh1p. To map additional sites possibly acetylated upon
cycloheximide treatment (Figure 3.10C), we also included a set of cycloheximide-treated
cells in the experiment. The peptides generated by cleavage at aa 189 were the same size in
both blots, whereas peptides generated by cleavage at aa 297 were different sizes. Thus, the
acetylated sites were likely present between aa 189 and aa 297 (Figure 3.10). However,
mutating the 18 lysines within this region to arginines decreased but did not abolish
acetylation of Ifh1p, indicating there are additional lysines that can be modified (Figure
3.10D). Due to a limitation of the method, the light chain of the antibody used for
immunoprecipitation was also detected by the acK antibody. It is possible that the cleavage
fragment N-terminal to aa 189 was also acetylated, but masked by the light chain following
SDSPAGE and Western analysis. We then mutated 21 additional lysine residues to arginine
between aa 1-189. This new mutant exhibited no detectable acetylation signal with or without

65
cycloheximide treatment (Figure 3.10E). The K/Q acetylated mimic mutant was also made
(Figure 3.10E). Although 39 lysines in this essential protein were mutated, no obvious
growth phenotypes were observed when either the 39K/R or 39K/Q mutants were tested
under a variety of conditions.
Surprisingly, we failed to observe any growth difference between WT and mutant
IFH1 strains under various carbon sources (Figure 3.11). There is also no difference in
chronological life span (Figure 3.12). Ifh1p in the mutants are localized the nucleus and the
cytoplasm, same as in WT (Figure 3.13). Since Ifh1p can interact with Fhl1p and this
interaction is essential for RP gene transcription activation, we also tested whether Ifh1p-
Fhl1p interaction is affected in the mutants (Figure 3.14). Again, we did not detect any
difference in the interaction. We also found that the mutants can still bind to the promoters of
RP genes similar to the WT Ifh1p (Figure 3.15). And the mutants do not experience any
delay when cells were switched from stationary phase to nutrient abundant environment for
growth recovery (Figure 3.16). When we put these mutants into the chemostat, they all can
undergo YMC and RP gene induction during a normal OX phase or acetate induced growth
phase entry in the mutants were all similar to those of the WT (Figure 3.17).
We observed that the acetylation of Ifh1p decreased prior to a decrease in its protein
levels as cells entered stationary phase (Figure 3.7A), suggesting that acetylation regulates its
protein stability and half-life. To measure the stability of Ifh1p, we avoided using protein
synthesis inhibitors such as cycloheximide because it can induce TORC1 signaling and
acetylation of Ifh1p (Figure 3.7B), thereby confounding interpretation of the results. Instead,
we measured Ifh1p levels in cells growing from a low to high density in SD media. Lower

66
levels of Ifh1p were detected in the acetylation defective 39K/R mutant, while higher levels
of Ifh1p were detected in the acetylated mimic 39K/Q mutant, despite no differences in
growth rate (Figure 3.18A). Consistent with these findings, sirtuin deletion mutants that
harbor increased acetylated Ifh1p also exhibited increased protein levels of Ifh1p, supporting
the idea that Ifh1p stability is regulated by nutrient responsive acetylation in its N-terminal
region (Figure 3.18B).
PKA Phosphorylates Ifh1p and Regulates Replicative Lifespan
To map the phosphorylation sites on Ifh1p, we used the same set of cysteine substitution
mutants to deduce the general region of phosphorylation following peptide cleavage. The
pattern of peptides recognized by both the FLAG antibody and phospho-PKA substrate
antibody matched very well, suggesting the phosphorylation site(s) lie C-terminal to C580
(Figure 3.19A). We then searched the C-terminal sequence of Ifh1p for PKA phosphorylation
motifs (RRXS/T) and constructed single S/A or T/A mutants for each of the 5 sites that were
identified. One single mutation at S969 was sufficient to eliminate the signal recognized by
the phoshpo-PKA substrate antibody (Figure 3.19B). We next tested whether S969 was
phosphorylated by PKA using a tpk1as tpk2as tpk3as strain which expresses modified PKA
alleles that are sensitive to the ATP analog 1NM-PP1 (Zaman et al., 2009). Upon treatment
with 1NM-PP1, Ifh1p phosphorylation disappeared within 10 min, confirming that it is a
PKA substrate (Figure 3.19C). Since Sch9p substrates share the same motif as PKA
substrates, we also tested Ifh1p phosphorylation in a sch9Δ strain, however, no alteration of
Ifh1p phosphorylation was observed (Figure 3.20). These data show that PKA

67
phosphorylates Ifh1p on S969 as cells enter growth. To test the functional role of Ifh1p
phosphorylation, we constructed S969A and S969D mutants and observed that they did not
exhibit any obvious growth defects under a variety of nutrient conditions (Figure 3.11). We
also did not observe any significant phenotypes when subjecting these mutants to the same
series of assays as the acetylation site mutants (Figure 3.11-3.17). Furthermore, mutation of
acetylated sites in combination with the phosphorylated site also did not result in any
substantial phenotype under the conditions tested. Interestingly, although both acetylation
and phosphorylation of Ifh1p are correlated with the onset of RP gene transcription in the
YMC, the modifications seem to be independent of each other (Figure 3.21).
Interestingly, the post-translational modifiers of Ifh1p – PKA, TORC1, and Sir2p,
have each been implicated in the regulation of replicative lifespan (RLS) in budding yeast
(Longo et al., 2012). Moreover, downstream targets of Ifh1p, such as RP subunits and GCN4,
have also been linked to lifespan regulation (Steffen et al., 2008). We therefore tested
whether mutations in the acetylated or phosphorylated sites of Ifh1p might also impact RLS.
While the acetylation site mutants of Ifh1p exhibited a modestly shorter RLS compared to the
WT control, notably the single S969A mutant that cannot be phosphorylated exhibited a
significantly increased RLS (30- 40%) (Figure 2.22). However, the RLS of the S969D
phosphomimetic mutant remained comparable to WT. Deletion of GCN4, which has been
shown to be required for RLS extension triggered by 60S ribosomal subunit depletion
(Steffen et al., 2008), did not affect RLS extension by the Ifh1p S/A mutant (Figure 2.22).
This modification of Ifh1p also did not affect GCN4 expression levels (Figure 2.23).
Moreover, the S/A mutant was still able to extend RLS in a strain lacking TOR1 (Figure
68
2,22). However, the substantial RLS extension observed in the S/A mutant was entirely
dependent on Sir2p (Figure 2.22). The dependency on Sir2p is not surprising as deletion of
SIR2 was observed to prevent lifespan extension in many long-lived yeast mutants (Delaney
et al., 2011). Taken together, these data indicate that inhibiting the PKA-regulated
phosphorylation of Ifh1p via mutation of a single site is sufficient to significantly increase
RLS to an extent comparable to calorie-restriction mimetic mutants (Kaeberlein et al., 2005).
As reducing PKA activity is often sufficient to increase RLS (Fabrizio et al., 2004;
Kaeberlein et al., 2005; Lin et al., 2000), our results suggest these effects may be mediated in
part through reducing phosphorylation of Ifh1p. Thus, this nutrient-responsive
phosphorylation modification on Ifh1p is involved in the regulation of cellular replicative
potential, as opposed to the regulation of rates of RP gene transcription.
Summary
Although ribosome biogenesis is recognized as a key component of the cellular
growth program, much remains unclear regarding how this fundamental process is
coordinated with nutrient availability and metabolic state. In this study, we sampled highly
synchronized cells across different growth states in the YMC to discover that an essential
transcription factor Ifh1p involved in ribosomal gene transcription is subject to regulation by
multiple nutrient-responsive, post-translational modifications. Since ribosome biogenesis is
such an energetically demanding task, such regulation may enable Ifh1p to integrate multiple
nutrient signals to adjust rates of ribosomal gene transcription appropriately.

69
We also characterized the genome-wide occupancy of Ifh1p using the YMC. These
ChIP-Seq experiments provide a higher resolution profile of Ifh1p occupancy in the genome
and revealed additional important targets besides RP genes. Several translation elongation
factors were bound by Ifh1p suggesting their transcription may be regulated by Ifh1p.
Moreover, GCN4, a transcriptional activator of amino acid biosynthetic genes (Hinnebusch,
2005), is also a target, suggesting Ifh1p regulates the supply of amino acids for protein
translation. Ifh1p is dynamically acetylated by the Gcn5p-containing SAGA complex
specifically during growth. Gcn5p has the unique ability to acetylate its substrates in tune
with acetyl-CoA levels (Cai et al., 2011). This property enables Gcn5p to coordinate the
acetylation of its targets in tune with the metabolic state of a cell. Upon entry into growth,
acetyl-CoA drives the acetylation of histones present at a set of over 1,000 growth genes
which include virtually all RP and ribi genes (Cai et al., 2011). The dynamic acetylation of
Ifh1p coincides with the acetylation of histones and subunits within SAGA, suggesting these
substrates are all subjected to the same acetyl-CoA regulated acetylation mechanism used to
coordinate cell growth with this important intermediate in energy metabolism that is also a
key biosynthetic substrate.
Ifh1p is rapidly deacetylated as cells transition out of growth phase. Interestingly, the
deacetylation of Ifh1p is catalyzed by NAD+-dependent sirtuins instead of non-NAD+-
dependent deacetylases such as Rpd3p. When carbon sources become limiting, acetyl-CoA
levels decrease along with Gcn5p activity, and the activity of NAD+-dependent deacetylases
may then predominate. Therefore, this transcriptional coactivator is subjected to a
competition between acetyl-CoA-regulated acetylation and NAD+-dependent deacetylation

70
that can be tipped in either direction by changes in metabolic state. Our studies further
establish Ifh1p as a significant nonhistone substrate of Sir2p in yeast, with up to 39 lysine
residues in its N-terminal region that can be deacetylated. As acetylation appears to stabilize
Ifh1p, this may also help recruit sirtuins to the vicinity of RP genes and the rDNA, which
may function to increase replicative potential. Ifh1p is also dynamically phosphorylated by
PKA. Both the phosphorylation and acetylation of Ifh1p are inhibited by rapamycin,
suggesting TORC1 is also a key regulator of Ifh1p. Previous studies implicated TORC1 and
PKA signaling in the regulation of Crf1p, a repressor of RP gene transcription ((Martineau et
al., 2004). TORC1 and PKA activation result in the dephosphorylation of Crf1p and its
confinement to the cytosol. Upon inactivation of TORC1, Crf1p becomes phosphorylated
and nuclear, leading to the repression of RP genes. Furthermore, TORC1 and PKA inactivate
repressors of ribi genes such as Dot6p and Tod6p (Huber et al., 2011; Lippman and Broach,
2009). Stb3p, a repressor of rRNA processing genes, is also inactivated by TORC1 and
glucose (Huber et al., 2011; Liko et al., 2010). We show that Ifh1p is yet another ribosomal
transcription factor that is exposed to phosphorylation by TORC1 and PKA signaling.
The consequence of mutations in the acetylated or phosphorylated sites in Ifh1p
appears extremely modest despite the fact that the protein is essential. We did not observe
significant growth defects for the 39K/R, 39K/Q, S969A, S969D mutants, nor find any
differences in their ability to bind RP gene promoters or activate RP genes. Although the
39K/R mutant decreased the overall Ifh1p levels in the cell, there is apparently still sufficient
Ifh1p to achieve normal levels of RP gene transcription. Ifh1p has a very peculiar protein
sequence that contains many clusters of acidic and basic residues while lacking any defined

71
domains. We predict it acts as a scaffold to bring together numerous other factors to enable
activation of RP genes. The dynamic modifications within Ifh1p might also be a consequence
of its proximity to other macromolecules that are subjected to nutrient-responsive regulation
(e.g., the acetyl-CoA driven acetylation of histones at RP genes catalyzed by SAGA, and the
phosphorylation-dependent regulation of Crf1p localization by TORC1/PKA). Nonetheless,
we did observe significant RLS phenotypes in mutants of Ifh1p that disrupt these
modifications, suggesting that the resulting consequences might only be manifested after
many generations. Moreover, cycloheximide treatment significantly increased both
phosphorylation and acetylation of Ifh1p, suggesting these modifications stimulate Ifh1p and
possibly other RP transcription factors under conditions of translation stress that could be
frequently encountered in the wild, in the face of unpredictable nutrient availability.
Finally, while the activation of RP and ribi genes can be induced by glucose, their
repression is mediated by recruitment of histone deacetylase complexes (Huber et al., 2011;
Liko et al., 2010; Zaman et al., 2009). We recently showed that the activation of these and
other growth genes is induced by acetyl-CoA through its ability to promote histone
acetylation. Acetate addition is sufficient to trigger activation of these genes and entry into
growth (Cai et al., 2011). Since the glucose-induced PKA pathway activates carbohydrate
mobilization and metabolism (Rolland et al., 2002), a key output of the PKA and TORC1
signaling pathways may be the upregulated production of acetyl-CoA. Upon stress or nutrient
starvation, production of acetyl-CoA is compromised, resulting in deacetylation of histones
and gene repression. Thus, despite numerous post-translational modifications of transcription

72
factors, the metabolite acetyl-CoA may represent the key trigger that sets in motion the
cascade of events leading to activation of RP, ribi, and other growth genes.

73
Figure 3.1 Heat map of RP gene expression levels across YMC Normalized FPKM values of al the RP genes were used to generate this heat map following hierarchical clustering. Almost all the RP genes have the maximum expression at timepoint 5 in the OX growth phase of the YMC.

74
Figure 3.2 Ifh1p dynamically binds to ribosomal subunit genes during growth (A) Ribosomal protein (RP) subunit genes are robustly induced during OX, growth phase of the YMC. Expression profile of a representative RP gene RPS11B over three consecutive metabolic cycles is shown (Tu et al., 2005). (B) Ifh1p preferentially binds to RP genes during OX phase. Cells from representative time points at OX, RB and RC phases were collected and fixed for ChIP-PCR. Three primer sets spanning the promoter region of RPS11B were used in the analysis of Ifh1p binding. (C) ChIP-Seq reveals increased binding of Ifh1p to RP genes during growth. Genome-wide occupancy profile of Ifh1-FLAG was obtained for cells collected from OX (growth) and RC (G0/quiescent-like) phase of the YMC. Ifh1p binds to regulatory regions of nearly all RP genes. Data visualized using the CisGenome browser for two representative RP genes are shown.

75
Figure 3.3 Ifh1p is Dynamically Acetylated by Gcn5p and Deacetylated by Sirtuins (A) Ifh1p binds to non-RP genes including genes involved in metabolism. The ChIP-Seq data were scrutinized visually to identify all putative targets. Non-RP genes, including several involved in metabolism, are also targets of Ifh1p. Many of these genes have Ifh1p bound across the open reading frame instead of at the promoter. (B) Ifh1p binds to genes encoding translation elongation factors. (C) Ifh1p binds to other non-RP genes, including GCN4.

76
Figure 3.4 Potential additional targets of Ifh1p Genomic regions bound by Ifh1p were visually identified from the ChIP-Seq data. Peaks with relatively weak signals are listed here. Genes whose promoters are closest to the peak are shown. Ifh1p binding occasionally spans the entire open reading frame. Note that Ifh1p binding near SEC59 and ASC1 might also function to regulate some small nucleolar (SNR) genes, as they are also very close to the peak.

77
Figure 3.5 Expression and H3K9ac occupancy of Ifh1p non-RP target genes The three phases OX, RB and RC are indicated. Representative time points collected for the experiments that use OX and RC YMC samples are marked on the cycle. The time windows of Ifh1p phosphorylation and acetylation have also been marked. Ifh1p phosphorylation peaks at around time point 3-4. RP gene transcription peaks at time point 5. Ifh1p acetylation occurs from time points 3-11. Expression data was retrieved from 16 timepoint RNA-seq from YMC while H3K9ac occupancy data was retrieved from 12 timepoint ChIP-seq from YMC. For non-RP genes, the expression profiles vary across the YMC. H3K9ac ChIP-seq peaks closest to the promoter of the selected genes have been pointed out by red arrows.

78
Figure 3.6 Ifh1p is dynamically acetylated and phosphorylated during growth (A) Ifh1p is dynamically acetylated and possibly phosphorylated. Ifh1-FLAG was immunoprecipitated from cells collected across 12 time points of the YMC. Ifh1p is acetylated during the OX, growth phase precisely when acetyl-CoA levels increase. A mobility shift of both the full length Ifh1-FLAG protein (arrow) and its cleavage products was observed at time point 6, which is suggestive of phosphorylation. (B) Ifh1p is phosphorylated. Lysates were prepared from OX and RC phase and treated with or without phosphatase (PPase). A cleavage product of Ifh1p at ~50 KDa is shown. The upshifted band in the OX phase sample was reduced after PPase treatment indicating the shift was due to phosphorylation. (C) Phosphorylated Ifh1p is recognized by a PKA substrate-specific antibody. An antibody that recognizes the phospho-PKA substrate motif RRXS*/T* (* denotes phosphorylation) was used for immunoblotting against Ifh1p. The signal was eliminated after PPase treatment. (D) Dynamic phosphorylation of Ifh1p. Ifh1-FLAG immunoprecipitated from indicated time points of YMC was blotted with acK and RRXS*/T* antibody. Both acetylation and phosphorylation of Ifh1p are upregulated during the OX, growth phase.

79
Figure 3.7 Post-Translational Modifications of Ifh1p are Sensitive to Nutrient Cues and Regulated by TORC1 (A) Acetylation of Ifh1p is sensitive to growth stage. IFH1-FLAG cells were cultured in SD medium to log phase and time points were collected as the cells were grown to a higher OD approaching stationary phase. Note Ifh1p becomes deacetylated prior to the decrease in its protein level. (B) Acetylation and phosphorylation of Ifh1p are regulated by TORC1. Cells were grown in YPD to log phase and treated as indicated for 15min. Both phosphorylation and acetylation were inhibited by rapamycin and stimulated by cycloheximide.
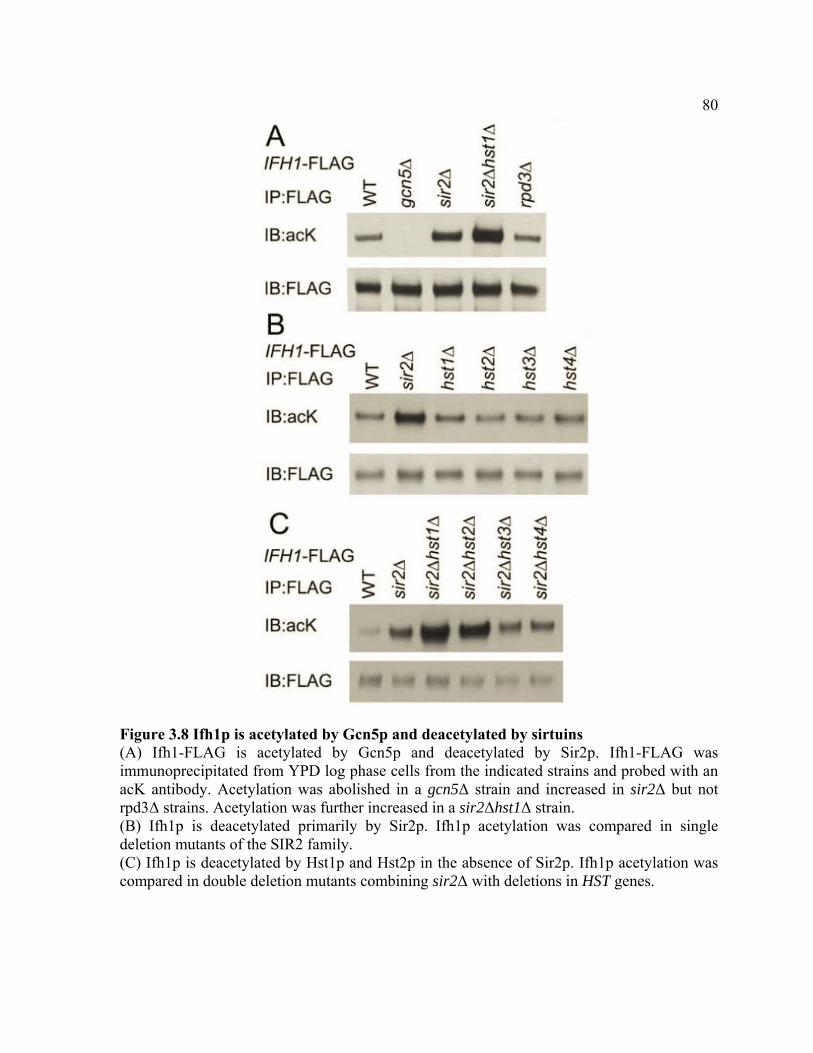
80
Figure 3.8 Ifh1p is acetylated by Gcn5p and deacetylated by sirtuins (A) Ifh1-FLAG is acetylated by Gcn5p and deacetylated by Sir2p. Ifh1-FLAG was immunoprecipitated from YPD log phase cells from the indicated strains and probed with an acK antibody. Acetylation was abolished in a gcn5Δ strain and increased in sir2Δ but not rpd3Δ strains. Acetylation was further increased in a sir2Δhst1Δ strain. (B) Ifh1p is deacetylated primarily by Sir2p. Ifh1p acetylation was compared in single deletion mutants of the SIR2 family. (C) Ifh1p is deacetylated by Hst1p and Hst2p in the absence of Sir2p. Ifh1p acetylation was compared in double deletion mutants combining sir2Δ with deletions in HST genes.

81
Figure 3.9 Protein sequence of Ifh1p The Ifh1p amino acid sequence (1,085 residues) was retrieved from the yeast genome database. The basic residues, lysine and arginine, are colored in blue and green. The acidic residue, aspartate and glutamate, are colored in red. Serines and threonines are colored in yellow. The 39 lysines in the N-terminal region that were mutated are underlined.

82
Figure 3.10 Mapping of Ifh1p acetylation sites (A) Schematic diagram for cysteine substitution mutants of Ifh1p used for mapping modification sites. Wild type Ifh1p contains two cysteines. Mutations of C580 and C665 to serine were introduced. New serine to cysteine mutations were introduced at the indicated positions. (B) Cleavage of the native form of Ifh1p suggests acetylation sites are N-terminal to C580. Wild type Ifh1p was immunoprecipitated from YPD log phase cultures and subjected to cleavage at cyanylated cysteines. The bands recognized by acK antibody and FLAG antibody

83
are different sizes, suggesting acetylation sites are not at fragments C-terminal to the cleavage sites, which are recognized by the FLAG antibody. (C) The 189-297 region of Ifh1p contains acetylation sites. Based on a similar logic, it can be deduced that Ifh1p is acetylated between residues 189 - 297. Cycloheximide (CHX) which stimulates TORC1 signaling generates the same pattern as the non-treated group. (D) Mutation of 18 lysines in the 189-297 region only slightly decreased acetylation of Ifh1p. K to R mutations were introduced to eliminate the lysines that can be acetylated in the above mapped region. Although acetylation was decreased, Ifh1p is still significantly acetylated. (E) Mutation of 39 lysines in the 1-297 region eliminates acetylation of Ifh1p. An additional 21 lysines before S189 were mutated, eliminating the residual acetylation on Ifh1p. CHX treatment did not result in any observable acetylation of this Ifh1p 39K/R mutant.

84
Figure 3.11 Growth on medium with different carbon sources. WT and the indicated mutant strains in the CEN.PK background were tested for growth on different carbon sources. Synthetic minimal medium without or with amino acids (S or SC) were tested. Nitrogen starvation was also tested (SD-N). No significant growth difference for any mutant has been observed. Growth was also tested at 37°C. Mutant strains constructed in S288C background were also tested with SC based medium under 30°C or 37°C. Again, no differences in growth were observed (data not shown).
Figure 3.12 Chronological life span test The indicated strains were grown to log phase in SD medium. Cells were pelleted, washed twice with H2O and resuspend in H2O to 1OD/ml. Cells were serial diluted and spotted onto YPD once a day for 7 days. No difference has been observed in the mutants.
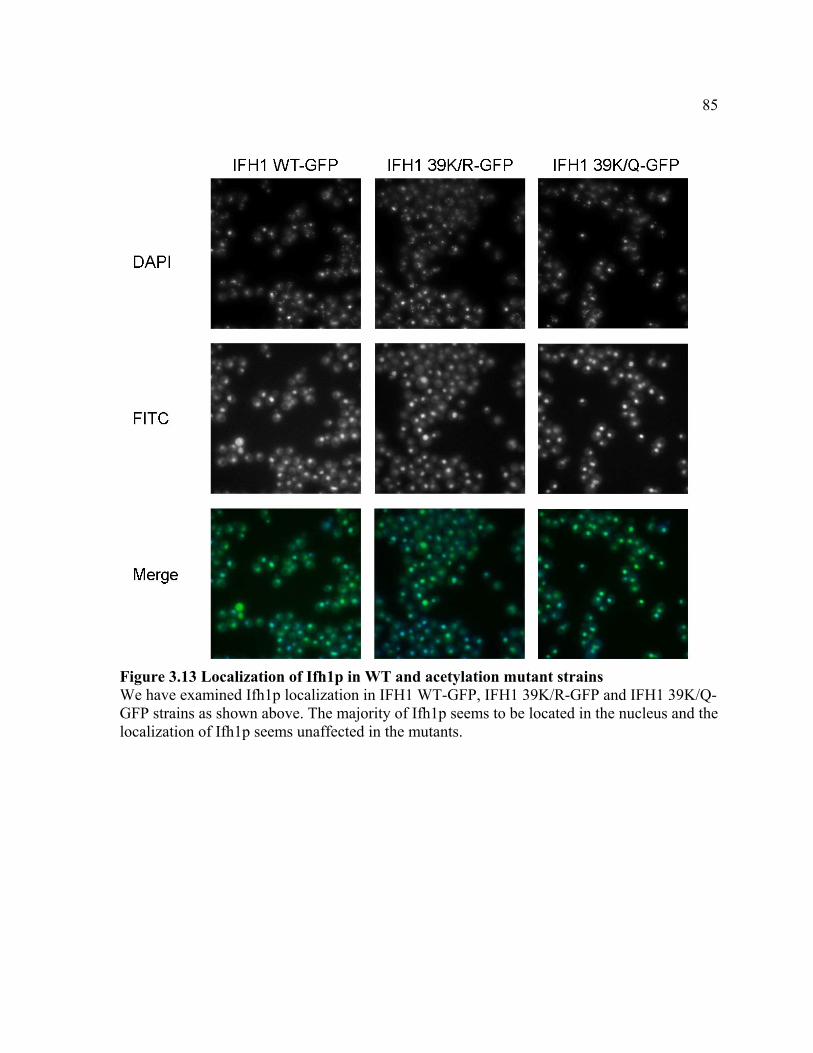
85
Figure 3.13 Localization of Ifh1p in WT and acetylation mutant strains We have examined Ifh1p localization in IFH1 WT-GFP, IFH1 39K/R-GFP and IFH1 39K/Q-GFP strains as shown above. The majority of Ifh1p seems to be located in the nucleus and the localization of Ifh1p seems unaffected in the mutants.
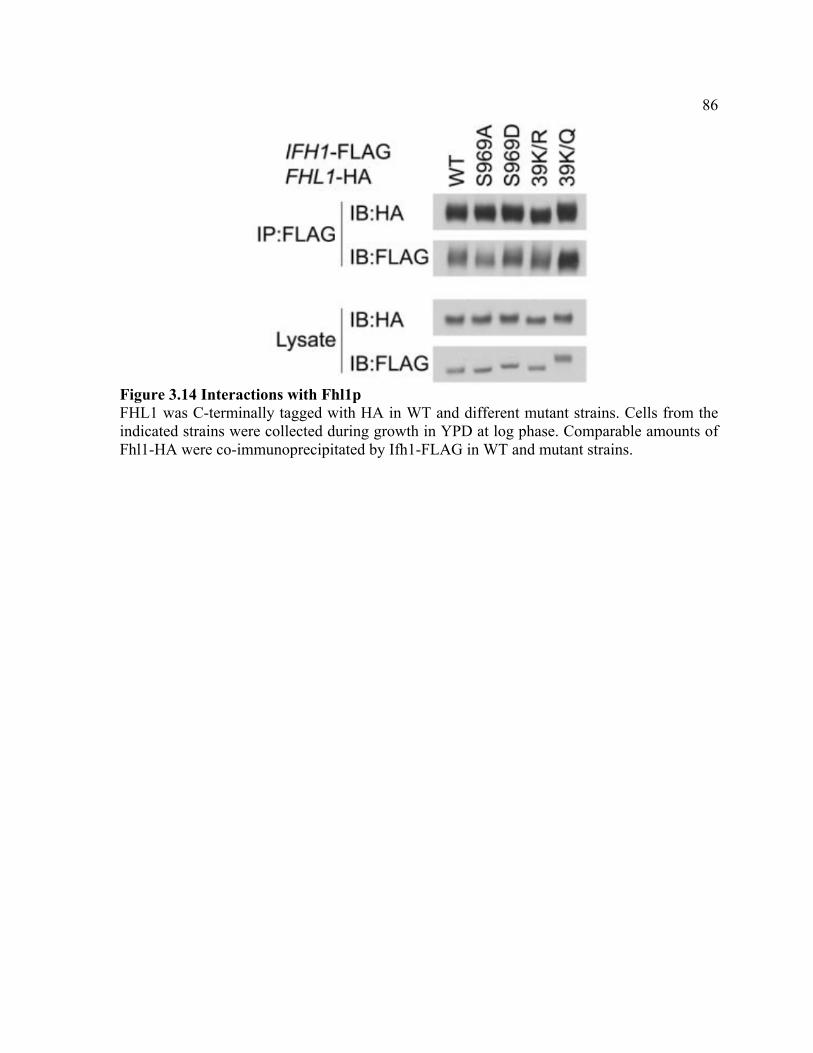
86
Figure 3.14 Interactions with Fhl1p FHL1 was C-terminally tagged with HA in WT and different mutant strains. Cells from the indicated strains were collected during growth in YPD at log phase. Comparable amounts of Fhl1-HA were co-immunoprecipitated by Ifh1-FLAG in WT and mutant strains.
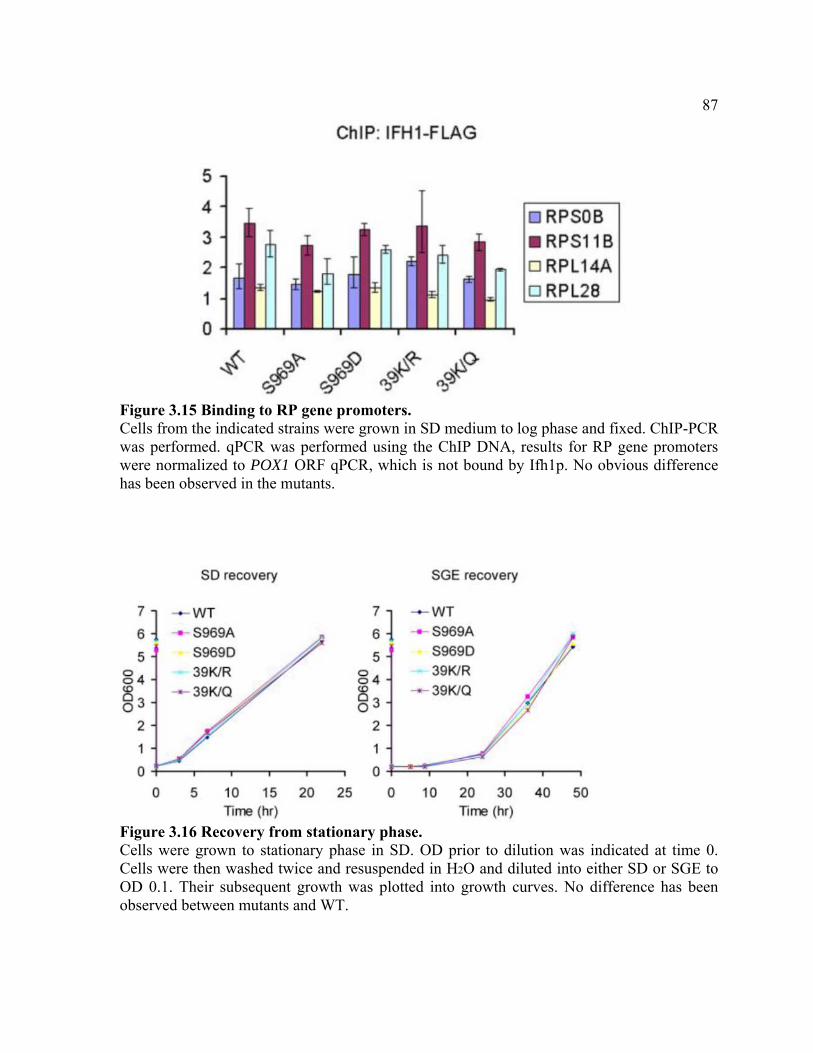
87
Figure 3.15 Binding to RP gene promoters. Cells from the indicated strains were grown in SD medium to log phase and fixed. ChIP-PCR was performed. qPCR was performed using the ChIP DNA, results for RP gene promoters were normalized to POX1 ORF qPCR, which is not bound by Ifh1p. No obvious difference has been observed in the mutants.
Figure 3.16 Recovery from stationary phase. Cells were grown to stationary phase in SD. OD prior to dilution was indicated at time 0. Cells were then washed twice and resuspended in H2O and diluted into either SD or SGE to OD 0.1. Their subsequent growth was plotted into growth curves. No difference has been observed between mutants and WT.

88
Figure 3.17 RP gene transcription during transition to growth in YMC. During the YMC for WT, S/A, K/R and K/Q mutants, cells were collected during acetate-induced growth entry from RC phase. Time points were taken 2 min prior to addition of acetate, then 2, 5, 10 and 20min after acetate addition. RNA was extracted from these samples and cDNA was made. qPCR was performed for two representative RP genes. Both of them are induced robustly during entry into OX phase. These results suggest there is no difference in the downstream RP gene transcription activation response in the S/A, K/R and K/Q mutants compared to WT.

89
Figure 3.18 Acetylation regulates protein stability of Ifh1p (A) The Ifh1p 39K/Q acetylated mimic mutant is more stable during nutrient depletion. Lysates were prepared from the indicated strains at the indicated time points on the growth curve. Ifh1p levels decrease as cells grow to a higher density approaching stationary phase. Levels of Ifh1p are lower in K/R mutant and higher in K/Q mutant. The membrane was stained by Ponceau S and shown as a loading control. Two different exposures of the same blot are shown. (B) sir2Δ and sir2Δhst1Δ mutants exhibit increased Ifh1p stability. Experiments were performed as described above with sir2Δ and sir2Δhst1Δ strains. Ifh1p seems to be more stable in the mutants where it is highly acetylated. Two different exposures of the same blot are shown.

90
Figure 3.19 Ifh1p is phosphorylated at S969 by PKA and modifications of Ifh1p may regulate replicative lifespan (A) Ifh1p is phosphorylated at site(s) C-terminal of C580. Based on the mapping method described above, the exact match of FLAG and RRXS*/T* blotting patterns indicates the phosphorylated sites are after residue 580. (B) Ifh1p is phosphorylated at S969. Candidate sites that match the motif RXXS*/T* were mutated to alanine. Mutation at S969 eliminated the signal recognized by the phospho-specific antibody. (C) Ifh1p is phosphorylated by PKA. In an engineered strain (tpk1astpk2astpk3as) where PKA is rendered specifically sensitive to the inhibitor 1NM-PP1, phosphorylation of Ifh1p is eliminated within 10min treatment of 1NM-PP1.

91
Figure 2.20. Ifh1p is not phosphorylated by Sch9p. Ifh1p phosphorylation detected by an antibody specific to Sch9p and PKA phosphorylated substrates remained unchanged in sch9Δ cells. Two sch9Δ mutant clones were selected for analysis.
Figure 3.21 Ifh1p acetylation and phosphorylation are independent of each other Levels of phosphorylation remain unchanged in the acetylation mutant while levels of acetylation remained unchanged in the phosphorylation mutant. Note that there is more Ifh1p from the K/Q mutant IP as seen in the IB:FLAG loading control. This is due to a more stable Ifh1p K/Q protein.

92
Figure 3.22. Nutrient-responsive post-translational modifications of Ifh1p may regulate replicative lifespan (RLS). Nutrient-responsive phosphorylation of Ifh1p impacts replicative lifespan (RLS). Mutant strains were constructed in the BY4741 background. The ~30-40% increase in RLS of the S969A mutant was dependent on Sir2p, but not Gcn4p or Tor1p. Numbers in parentheses denote average lifespan, number of cells tested. Table 3.2 contains statistical analysis of the RLS data.

93
Figure 3.23 Transcription of Ifh1p target genes is unaffected in phosphorylation and acetylation mutants. Strains (WT: IFH1-WT-FLAG::Nat, S/A: IFH1-S969A-FLAG::Nat, S/D: IFH1-S969D-FLAG:: Nat, WT: Hygro::IFH1-WT-FLAG::Nat, 39K/R: Hygro::IFH1-39K/R-FLAG::Nat, 39K/Q: Hygro::IFH1-39K/Q-FLAG::Nat) were grown in SD medium to log phase and expression profiles of selected Ifh1p targets including two representative RP genes and some of the non-RP gene targets were obtained by qPCR.

94
Table 3.1. Peaks from IFH1-FLAG ChIP-seq at OX phase annotated by CisGenome The peaks were assigned to genes whose promoters were closest to the peak. Except for GCN4 and TEF2, many of the non-RP genes are actually next to an RP gene and might be mis-annotated. The order is based on ascending false discovery rate (FDR).
#seq_id Chromosome Start End Standard Name Systematic Name 1 chr16 76447 76491 RPL36B YPL249C-A 2 chr10 75676 75705 RPL39 YJL189W 3 chr4 221983 222074 RPL41B YDL133C-A 4 chr12 932090 932216 YLR406C-A YLR406C-A 5 chr6 223917 223973 YFR032C-B YFR032C-B 6 chr15 254037 254126 RPP2A YOL039W 7 chr13 551681 551769 RPS16A YMR143W 8 chr4 1359659 1359715 RPS18A YDR450W 9 chr15 94517 94545 RPL18A YOL120C
10 chr4 117457 117518 RPL35A YDL191W 11 chr16 794711 794767 RPS23B YPR132W 12 chr16 378706 378773 RPS6A YPL090C 13 chr7 228484 228530 RPL9A YGL147C 14 chr7 310777 310816 RPL28 YGL103W 15 chr16 731959 732031 RPL11A YPR102C 16 chr4 321855 322045 RPL31A YDL075W 17 chr15 80078 80106 RPL25 YOL127W 18 chr16 654021 654091 RPL43A YPR043W 19 chr12 241907 241975 RPS0B YLR048W 20 chr12 1028474 1028572 RPL6B YLR448W 21 chr7 788415 788480 YGR149W YGR149W 22 chr7 726669 726709 YGR117C YGR117C 23 chr10 157150 157222 RPS21B YJL136C 24 chr12 1019014 1019081 RPS1A YLR441C 25 chr14 444480 444548 RPS7B YNL096C 26 chr2 605960 606057 RPL21A YBR191W 27 chr14 63109 63137 RPS19B YNL302C 28 chr7 555588 555635 RPL26B YGR034W 29 chr14 331007 331235 RPL42A YNL162W 30 chr13 146138 146344 RPS1B YML063W 31 chr13 754459 754488 YMR242W-A YMR242W-A 32 chr8 382957 383060 RPL42B YHR141C 33 chr12 522394 522424 RPL37A YLR185W 34 chr3 178356 178421 RPS14A YCR031C 35 chr2 415351 415635 RPL19A YBR084C-A 36 chr7 149148 149229 YGL188C-A YGL188C-A 37 chr12 897936 898008 REH1 YLR387C 38 chr14 302479 302556 RPS3 YNL178W 39 chr5 306060 306110 RPS24A YER074W 40 chr7 254444 254498 RPL1B YGL135W 41 chr6 221779 221872 RPL2A YFR031C-A 42 chr11 431320 431359 RPL14A YKL006W 43 chr2 332587 332648 RPS11B YBR048W 44 chr10 651282 651310 RPS5 YJR123W 45 chr13 551376 551489 RPL13B YMR142C 46 chr4 307926 307974 RPS16B YDL083C 47 chr5 53468 53496 RPL12A YEL054C 48 chr14 495215 495380 RPL16B YNL069C 49 chr15 678913 679038 RPS30B YOR182C

95
50 chr5 270340 270426 RPL34A YER056C-A 51 chr10 703030 703091 RPS4A YJR145C 52 chr4 1355692 1355792 RPS17B YDR447C 53 chr7 920200 920289 RPS0A YGR214W 54 chr15 866861 866991 RPS10A YOR293W 55 chr16 406479 406507 RPL21B YPL079W 56 chr13 225650 225678 RPS17A YML024W 57 chr13 124352 124403 RPL6A YML073C 58 chr7 366137 366181 RPL7A YGL076C 59 chr16 302917 302946 RPL5 YPL131W 60 chr8 36123 36191 RPL8A YHL033C 61 chr5 423346 423415 RPS26B YER131W 62 chr7 438568 438625 RPL30 YGL030W 63 chr5 362449 362629 RPS8B YER102W 64 chr2 604290 604345 RPS9B YBR189W 65 chr2 592882 592985 RPS6B YBR181C 66 chr2 45281 45350 ROX3 YBL093C 67 chr12 796495 796530 RPS25B YLR333C 68 chr15 779697 779749 RPL33B YOR234C 69 chr2 168106 168145 RPL19B YBL027W 70 chr8 505908 505937 MNL1 YHR204W 71 chr9 257319 257489 RPL34B YIL052C 72 chr5 140548 140637 GCN4 YEL009C 73 chr12 263032 263063 RPL22A YLR061W 74 chr2 89648 89685 YBL071C-B YBL071C-B 75 chr8 75233 75262 RPS20 YHL015W 76 chr7 649006 649065 RPL11B YGR085C 77 chr9 232620 232686 RPS24B YIL069C 78 chr2 477238 477267 TEF2 YBR118W 79 chr4 491181 491333 RPS11A YDR025W 80 chr9 99743 99771 RPL16A YIL133C 81 chr15 901379 901492 RPL20B YOR312C 82 chr5 396516 396549 RPL23B YER117W 83 chr8 148897 148925 RPS27B YHR021C 84 chr7 277294 277322 RPS2 YGL123W 85 chr13 224057 224098 RPS18B YML026C 86 chr9 68456 68484 RPL40A YIL148W

96Table 3.2 Replicative lifespan analysis of mutant strains
Pairwise Comparison Mutant
meanMutant
N WT
meanWT
N%
EffectChi
square P valueHygro::IFH1 WT-FLAG::Nat vs. Hygro::IFH1-K/R-FLAG::Nat 22.7 40 27.1 40 -16.24% 4.049 0.0442Hygro::IFH1 WT-FLAG::Nat vs. Hygro::IFH1-K/Q-FLAG::Nat 22.6 40 27.1 40 -16.61% 5.162 0.0231IFH1-WT-FLAG vs. IFH1-S969A-FLAG 29.2 80 22.3 80 30.94% 40.37 < 0.0001IFH1-WT-FLAG vs. IFH1-S969D-FLAG 20.6 80 22.3 80 -7.62% 2.018 0.1555IFH1-WT-FLAG sir2Δ::Hygro vs. IFH1-S969A-FLAG sir2Δ::Hygro 11.2 40 13.4 40 -16.42% 4.917 0.0266IFH1-WT-FLAG sir2Δ::Hygro vs. IFH1-S969D-FLAG sir2Δ::Hygro 13.1 40 13.4 40 -2.24% 0.3221 0.5703IFH1-WT-FLAG gcn4Δ::Hygro vs. IFH1-S969A-FLAG gcn4Δ::Hygro 32.9 40 22.8 40 44.30% 17.78 < 0.0001IFH1-WT-FLAG gcn4Δ:: Hygro vs. IFH1-S969D-FLAG gcn4Δ:: Hygro 23.4 40 22.8 40 2.63% 0.001233 0.972IFH1-WT-FLAG tor1Δ:: Hygro vs. IFH1-S969A-FLAG tor1Δ:: Hygro 34.6 40 24.2 40 42.98% 26.55 < 0.0001IFH1-WT-FLAG tor1Δ:: Hygro vs. IFH1-S969D-FLAG tor1Δ:: Hygro 26.9 40 24.2 40 11.16% 2.727 0.0987

97
CHAPTER FOUR
Acetyl-CoA Synthetases in Yeast Metabolism
ACS1 and ACS2 are Differentially Regulated
In yeast metabolism, the last step of glycolysis produces pyruvate and pyruvate can
enter the mitochondria to be further metabolized through the TCA cycle or get converted into
fermentation product such as acetate and ethanol (Figure 2.1B). When pyruvate is
metabolized in the mitochondria, it is first converted to acetyl-CoA through the action of
pyruvate dehydrogenase. This acetyl-CoA then joins the oxaloacetate to start the TCA cycle
which generates energy through oxidative phosphorylation. However, acetyl-CoA cannot
freely diffuse through membrane and the mitochondrial and nucleocytosolic acetyl-CoA
pools are biochemically isolated. Therefore yeast cells require a substantial source of
nucleocytosolic acetyl-CoA for lipid biosynthesis and protein acetylation, especially histone
acetylation.
The main source of nucleocytosolic pool of acetyl-CoA in yeast comes from acetate.
In Saccharomyces cerevisiae, there are two isoforms of acetyl-CoA synthetase (ACS),
namely ACS1 and ACS2. ACS catalyzes the reaction that converts acetate and CoA to acetyl-
CoA using energy from ATP hydrolysis to pyrophosphate and AMP. This is crucial to the
production of nuclear cytosolic pool of acetyl-CoA in yeast and deletion of both ACS1 and
ACS2 results in inviability.
Despite the high similarity between Acs1p and Acs2p (Figure 4.1), the two enzymes
are differentially regulated under different nutrient conditions. In the YMC, ACS1 is

98
expressed in the RC quiescent like phase along with the other stress gene and glucose
repressed genes such as ADH2 for ethanol utilization. While ACS2 is expressed in the RB
phase during which cells start to divide (Figure 4.2). It has been previous determined that
fermentation products ethanol and acetate peaks at the end of OX phase and beginning of RB
phase (Tu 2005). Therefore the timing of ACS2 expression at RB and ACS1 expression at RC
might indicate different utilization of acetate and ethanol after OX phase. In the batch culture
condition, ACS2 is abundantly expressed in glucose medium, while ACS1, having Adr1p and
Cat8p binding site at its promoter, is repressed by glucose and only expressed after cells have
gone through the diauxic shift.
Different Roles of Acs1p and Acs2p in Yeast Metabolism
The other evidence that ACS1 and ACS2 have different roles in yeast metabolism
comes from the phenotype of the deletion mutants acs1Δ and acs2Δ.. Since ACS1 is not
expressed in glucose medium, deletion of ACS2 renders the cell unable to grow on glucose
medium. Although both Acs1p and Acs2p can convert acetate to acetyl-CoA, acs1Δ grows
slower in ethanol containing medium while acs2Δ grows slower in acetate containing
medium (Figure 4.3). The more surprising phenotype comes from culture in chemostat, while
acs2Δ is still capable of undergoing YMC, acs1Δ is unable to enter YMC, indicating Acs1p
has an important role in establishing YMC (Figure 4.4).
The localization of Acs1p and Acs2p are also quite differentially regulated. Acs2p is
predominantly localized to the nucleus (Figure 4.5). Since histone acetylation relies on the
nuclear cytosolic pool of acetyl-CoA which comes from acetate (Takahashi et al., 2006).

99
Nuclear localization of Acs2p could serve to provide a local supply of acetyl-CoA for histone
acetylation.
Acs1p Can Form Foci Under Hypoxia
While the localization of Acs1-GFP looks less nuclear, we found Acs1-GFP can
translocate into foci. This observation was first made when Acs1-GFP cells were put on a
slide under the coverslip and imaged while being alive. The foci formation took place within
a few minutes. We also found that cells near a bubble form foci later than those that are
further away from the bubble (Figure 4.6). To find out what caused the translocation, we
tested various conditions and determined that hypoxia was the trigger. We grew ACS1-GFP
ACS2-Cherry cells to saturation and bubbled with nitrogen. Cells were fixed immediately
when they were collected and foci formation was examined by fluorescent microscopy. We
started to see foci forming cells at around 165min after switching from air to nitrogen, and by
225min, the majority of the cells have Acs1-GFP translocated into foci. Upon switching back
to air, Acs1-GFP foci quickly dissipated within a few minutes (Figure 4.7).
To find out where these foci are localized, we constructed strains with different
organelle markers tagged with red fluorescent protein. We confirmed that Acs1-GFP foci do
not localize to the Golgi or peroxisome (Figure 4.8). We also tried to test whether Acs1-GFP
foci are close to the lipid droplets since Acs1p might be important for supplying acetyl-CoA
for lipid biogenesis. However, lipid droplets marked by Erg6-Cherry are only formed when
cells were grown in glucose medium in which ACS1 is repressed, Erg6-Cherry localize to ER
instead when cells were grown in YPGE (Figure 4.9). We also checked Acs1-GFP foci in a

100
strain that has ER marked by Sec62-Cherry. However, it is not clear from the figure whether
Acs1-GFP foci are close to the ER or not (Figure 4.10). We also examined the Acs1-GFP
foci in a mitochondria marker strain (mitoRFP) in which RFP is fused to a mitochondrial
targeting sequence. Although Acs1-GFP foci are not colocalized with the mitoRFP signal,
they seem to be quite close to each other (Figure 4.11). It has been reported that N-terminally
GFP tagged acetyl-CoA carboxylase Acc1p can form foci under hypoxia and nutrient
limiting conditions and these foci localize to close vicinity of mitochondria (Figure 4.12).
Acc1p is the enzyme that catalyzes the first step in fatty acid synthesis using acetyl-CoA and
bicarbonate to generate malonyl-CoA. It is possible that Acs1p and Acc1p work closely
together to generate acetyl-CoA and use it for lipid biogenesis. To see whether Acs1 and
Acc1 foci colocalize, we generated a diploid strain Acs1-Cherry GFP-Acc1. However, in this
strain, the cherry tagged Acs1 exhibited a different localization pattern under hypoxia. It
adopts a filamentous rather than dot-like structure (Figure 4.13). Nevertheless, it can still
change from cytosolic localization to filamentous structure under hypoxia and dissipate 1
minute upon switching back to air. In contrast, although GFP-Acc1 forms foci, it is not
responsive to the switch back to air (Figure 4.13).
To find out what is contained in the foci, we tried to immunoprecipitate Acs1-GFP
and identify the proteins that coimmunoprecipitated. However, since Acs1-GFP foci dissipate
quickly once oxygen is available, we decided to crosslink to preserve the hypoxia specific
protein-proteins interaction before the immunoprecipitation. We tested several crosslinkers
and found that paraformaldehyde seems to work best in both preserving the foci and protein
detection by western blot (Figure 4.14). We also looked into interaction data from SGD for
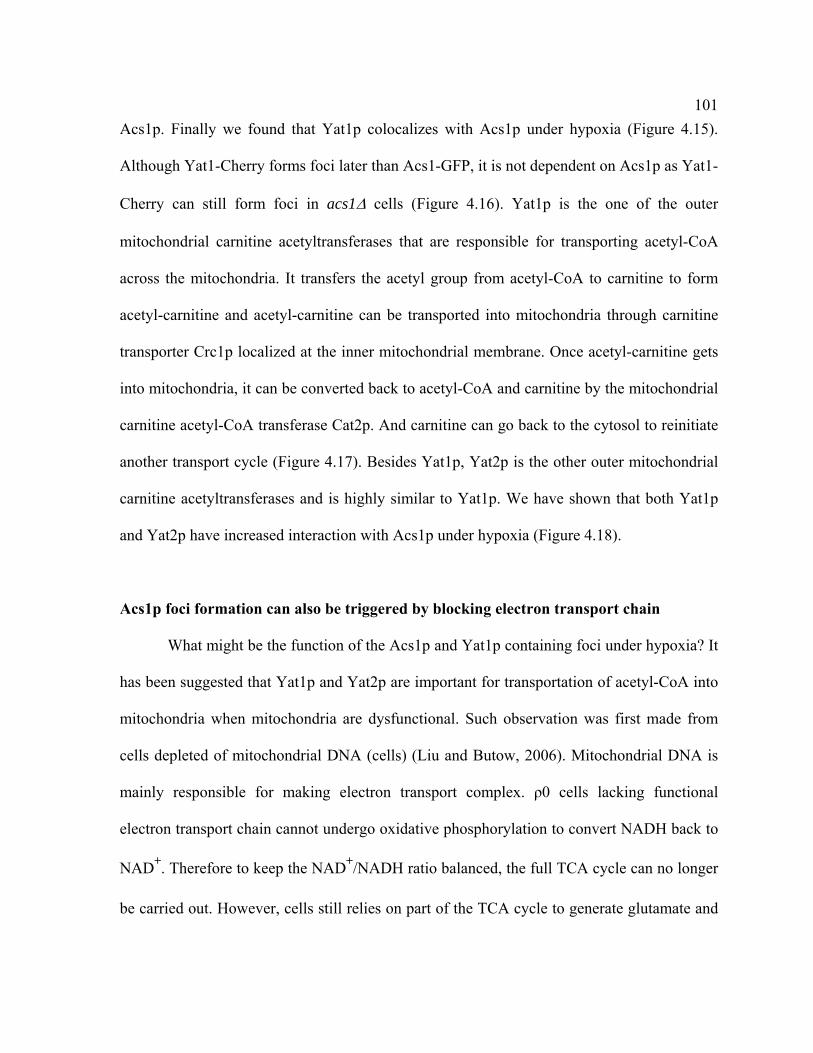
101
Acs1p. Finally we found that Yat1p colocalizes with Acs1p under hypoxia (Figure 4.15).
Although Yat1-Cherry forms foci later than Acs1-GFP, it is not dependent on Acs1p as Yat1-
Cherry can still form foci in acs1Δ cells (Figure 4.16). Yat1p is the one of the outer
mitochondrial carnitine acetyltransferases that are responsible for transporting acetyl-CoA
across the mitochondria. It transfers the acetyl group from acetyl-CoA to carnitine to form
acetyl-carnitine and acetyl-carnitine can be transported into mitochondria through carnitine
transporter Crc1p localized at the inner mitochondrial membrane. Once acetyl-carnitine gets
into mitochondria, it can be converted back to acetyl-CoA and carnitine by the mitochondrial
carnitine acetyl-CoA transferase Cat2p. And carnitine can go back to the cytosol to reinitiate
another transport cycle (Figure 4.17). Besides Yat1p, Yat2p is the other outer mitochondrial
carnitine acetyltransferases and is highly similar to Yat1p. We have shown that both Yat1p
and Yat2p have increased interaction with Acs1p under hypoxia (Figure 4.18).
Acs1p foci formation can also be triggered by blocking electron transport chain
What might be the function of the Acs1p and Yat1p containing foci under hypoxia? It
has been suggested that Yat1p and Yat2p are important for transportation of acetyl-CoA into
mitochondria when mitochondria are dysfunctional. Such observation was first made from
cells depleted of mitochondrial DNA (cells) (Liu and Butow, 2006). Mitochondrial DNA is
mainly responsible for making electron transport complex. ρ0 cells lacking functional
electron transport chain cannot undergo oxidative phosphorylation to convert NADH back to
NAD+. Therefore to keep the NAD+/NADH ratio balanced, the full TCA cycle can no longer
be carried out. However, cells still relies on part of the TCA cycle to generate glutamate and

102
glutamine from α-ketoglutarate. Glutamine and glutamate are essential nitrogen donors for
anabolic processes such as synthesis of amino acids, purines and pyrimdines (Cai and Tu,
2012). In TCA cycle, mitochondrial acetyl-CoA is produced from pyruvate using pyruvate
dehydrogenase which generates NADH from NAD+. In these ρ0 cells, an alternative route is
used. That is to generate oxaloacetate from pyruvate using pyruvate carboxylase, and acetyl-
CoA from acetate. Having cytosolic acetyl-CoA transported into the mitochondria through
carnitine shuttle, it can then join oxaloacetate to produce citrate. After citrate is isomerized to
isocitrate, isocitrate is converted to α-ketoglutarate by isocitrate dehydrogenase. Although
this reaction generates NADH, it can be consumed in the next step when α-ketoglutarate is
converted to glutamate by the reverse reaction of glutamate dehydrogenase. This way there is
no net changes in NAD+/NADH (Figure 4.19).
There is some similarity between ρ0 cells and cells under hypoxia. In both cases the
mitochondrial electron transport chain is not active. However, there are also important
differences. As pointed out in Figure 4.19, ρ0 cells have another alternative way to generate
glutamate and glutamine besides using acetyl-CoA from acetate as described above. They
can use acetyl-CoA generated in the peroxisome from fatty acid oxidation. The peroxisomal
acetyl-CoA can be converted to citrate through citrate synthase encoded by CIT2. And the
peroxisomal citrate can be transported into the mitochondria (Figure 4.19). In fact, increased
peroxisome proliferation and increased expression of genes involved in β-oxidation have
been observed in ρ0 cells (Epstein et al., 2001). However, this route would not be possible
under hypoxia because β-oxidation requires the participation of molecular oxygen. Hence,

103
the first route that involves acetyl-CoA into mitochondria might be the key to glutamate
biosynthesis for cells grown under hypoxia.
To see whether the acetyl-carnitine transporter Crc1p and mitochondrial acetyl-
carnitine transferase that releases carnitine and acetyl-CoA also form foci under hypoxia, we
constructed CRC1-Cherry ACS1-GFP and CAT2-Cherry ACS1-GFP strains. However, we
found that Crc1-Cherry and Cat2-Cherry do not form foci as Acs1-GFP does (Figure 4.20).
To test whether Acs1-GFP foci can also form in ρ0 cells with deficient mitochondria,
we generated ρ0 cells from ACS1-GFP strain. We indeed observed foci using fluorescent
microscopy under GFP channel. However, it turned out to be an artifact due to auto-
fluorescence, since such foci were also observed in WT cells and acs1Δ cells (Figure 4.21).
We then tested whether Acs1-GFP can form foci in cells treated with electron transport chain
inhibitor antimycin (inhibitor of mitochondrial electron transport by blocking the reoxidation
of reduced cytochrome b) and CCCP (uncoupler of ATP synthesis by dissipating the proton
gradient across the inner mitochondrial membrane). To also compare the antimycin or CCCP
treated cells with cells under hypoxia or normoxia, we grew cells under hypoxia overnight
and collected the hypoxia sample, then switched to normoxia for 30 minutes before adding
antimycin or CCCP. After another 30min, the antimycin or CCCP treated samples as well as
untreated samples (normoxia) were collected. Cells were fixed and imaged or lysed for
immunoprecipitation and western blot. Upon antimycin and CCCP treatment, Acs1-GFP
relocalized to foci just as in hypoxia (Figure 4.22) and immunoprecipitation of crosslinked
Acs1-GFP have pulled down more associated proteins with a similar pattern to samples from

104
hypoxia (Figure 4.23) suggesting these inactivating electron transport chain by depriving
oxygen or using specific inhibitor treatment can both trigger Acs1-GFP foci formation.
Summary
The two acetyl-CoA synthetase enzymes Acs1p and Acs2p in yeast play distinct roles
in metabolism and are differentially regulated by nutrient availability. While Acs2p is the key
for growth in glucose rich medium, Asc1p is important for growth on ethanol and
establishing yeast metabolic cycle. Intriguingly, Acs1p and acetyl-carnitine transferase Yat1p
can localize to foci structure under hypoxia. Such foci are in the proximity of mitochondria.
Asc1p foci can also form when electron transport chain is blocked by inhibitors, suggesting it
is triggered by inactive mitochondria electron transport chain. Previous studies have revealed
that acetyl-CoA generated from acetate could be imported into mitochondria through
carnitine shuttling and serve as an alternative source for glutamate synthesis in cells with
deficient mitochondria. It remains to be tested whether Acs1p foci is important for glutamate
synthesis under hypoxia.

105
Figure 4.1 Alignment of ACS1 and ACS2 protein sequence ACS1 and ACS2 are highly similar but with major difference in the N-terminus and last few residues in the C-terminus.

106
Figure 4.2 Different expression pattern of ACS1 and ACS2 across YMC ACS1 and ACS2 expression was retrieved from previous microarray data from cells collected from three consecutive cycles (Tu 2005). ACS1 has the highest expression level during the RC quiescent phase while ACS2 has the highest expression level during RB phase when cells start to divide.

107
Figure 4.3 acs1Δ has slow growth on ethanol while acs2Δ has slow growth on acetate After 10 fold serial dilution, yeast cells with indicated genotype were spotted onto synthetic medium plates with indicated carbon sources. acs2Δ is inviable on SD and has slower growth on SA, acs1Δ has slower growth on SE. SD (synthetic medium with D-glucose), SG (synthetic medium with glycerol), SE (synthetic medium with ethanol), SA (synthetic medium with acetate).

108
Figure 4.4 YMC phenotype of acs1Δ and acs2Δ acs1Δ is unable to undergo YMC while acs2Δ have close to normal YMC. Since acs2Δ is inviable in glucose medium, ethanol and glycerol was used instead of glucose for the batch culture phase after cells were inoculated into the chemostat. After cells have reached saturation and starved, the original 1% glucose medium was used for continuous feeding mode.

109
Figure 4.5 Expression and Localization of Acs1-GFP and Acs2-GFP in YPD and YPGE Acs1-GFP and Acs2-GFP cells were grown to log phase in YPD or YPGE medium and fixed. ACS1 is repressed in the glucose medium while Acs2-GFP is the only ACS enzyme expressed in glucose and it is localized exclusively to the nucleus. In YPGE, both ACS1 and ACS2 are expressed and are localized to the nucleus and cytosol.
YPD
YPGE
ACS1-GFP ACS2-GFP

110
Figure 4.6 Acs1-GFP translocation into foci Acs1-GFP live cells were put on a slide under the coverslip and imaged. A bubble was found at the upper right corner of the field. Translocation of Acs1-GFP into foci took place within a few minutes and spread from cells distant from the bubble to cells near the bubble.
Figure 4.7 Acs1-GFP foci forms under hypoxia and dissipates under normoxia. ACS1-GFP ACS2-Cherry cells were grown in the chemostat and bubbled with nitrogen for 4 hours, cells were fixed immediately at collection. ACS1-GFP already forms foci but ACS2-Cherry remained nuclear. After switching from nitrogen to oxygen for just 5 minutes, cells were collected and fixed immediately. ACS1-GFP has already dissipated back to the nucleus and cytosol.

111
Figure 4.8 ACS1-GFP foci do not localize to Golgi or peroxisome ACS1-GFP foci were studied in different organelle marker strains. Cells were grown in YPGE medium and checked alive on a glass slide under a coverslip. Sec7-Cherry marks the Golgi and Pex14-Cherry marks the peroxisome. ACS1-GFP foci do not overlap with these structure indicating ACS1-GFP foci are outside the Golgi or peroxisome.
ACS1-GFP
ACS1-GFP
Sec7-Cherry
Pex14-Cherry

112
Figure 4.9 Acs1-GFP does no localize to lipid droplets Lipid droplet marked by Erg6-Cherry is only found when cells were cultured in YPD, in YPGE culture, Erg6 localizes to the ER.
Bright Field Erg6-Cherry ACS1-GFP
YP
GE
YPD

113
Figure 4.10 Acs1-GFP foci and ER markers Erg6-Cherry and Sec62-Cherry marks the endosplasmic reticulum (ER) when grown in YPGE medium. Although Acs1-GFP foci do no colocalize to these ER markers, it is not clear how close they are.

114
Figure 4.11 Acs1-GFP foci and mitochonrdia Mitochondria are marked by mitoRFP which is RFP protein fused with a mitochondria targeting sequence. Acs1-GFP foci do not colocalize with mitochondria but they may be very close to each other.

115
Figure 4.12 GFP-Acc1 foci Figure was adapted from 16950653, Confocal micrograph of a live yeast cell stained for mitochondria (MitoTracker® Red CMXRos (Molecular Probes™, Invitrogen), in red) and acetyl-CoA carboxylase (GFP-fusion, in green). Note the pronounced aggregate formation of (cytosolic) Acc1, and the appearance of Acc1-foci in close vicinity to the mitochondria. Scale bar = 2 μm.
Figure 4.13 Acs1-Cherry GFP-Acc1 diploid Acs1-Cherry forms filamentous structure rather than foci formed by Acs1-GFP. It does not colocalize with GFP-Acc1 foci. Acs1-Cherry filamentous structure dissipates back to cytosol upon switching back to air. However GFP-Acc1 remains in foci.

116
Figure 4.14 Immunoprecipitation of Acs1-GFP crosslinked by different crosslinkers Different crosslinkers were tested and Acs1-GFP could only be detected in sample immunoprecipitated from paraformaldehyde crosslinked cells. Note that under the same fixing condition, several more bands are detected in the hypoxia versus normoxia sample.
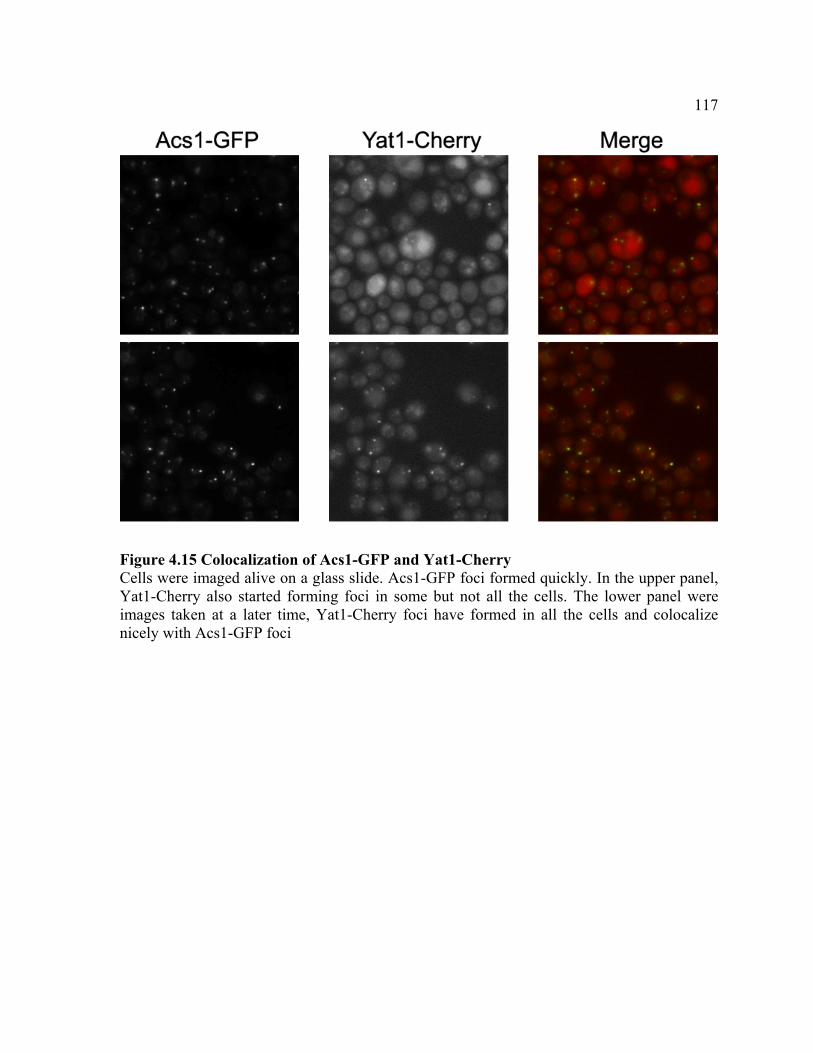
117
Figure 4.15 Colocalization of Acs1-GFP and Yat1-Cherry Cells were imaged alive on a glass slide. Acs1-GFP foci formed quickly. In the upper panel, Yat1-Cherry also started forming foci in some but not all the cells. The lower panel were images taken at a later time, Yat1-Cherry foci have formed in all the cells and colocalize nicely with Acs1-GFP foci

118
Figure 4.16 Yat1-Cherry can localize to foci under hypoxia in the absence of Acs1p Images were taken for Yat1-Cherry acs1Δ cells, despite the absence of Acs1p, Yat1-Cherry can still localize to foci under hypoxia.

119
Figure 4.17 Schematic diagram showing carnitine-dependent acetyl-CoA transport from cytosol to mitochondria Acetyl-CoA can not freely diffuse through membrane structure. Transportation of acetyl-CoA between cytosol and mitochondira is carnitine-dependent. Carnitine acetyl-transferase Yat1p and Yat2p on the mitochondrial outer membrane generates acetyl-carnitine from acetyl-CoA and carnitine, acetyl-carnitine can be transported into the mitochondria through the translocase Crc1p. Once in the mitochondria, acetyl-carnitine can be converted back to acetyl-CoA and carnitine by the mitochondrial acetyl-carnitine transferase Cat2p.

120
Figure 4.18 Increased interactions between Yat1p, Yat2p and Acs1p. Cells from indicated strains under normoxia or hypoxia were fixed by paraformaldehyde and lysed for immunoprecipitation. The upper panel shows the immunoprecipitated Acs1-GFP as well as the co-immunoprecipitated Yat1-FLAG or Yat2-FLAG. Two different exposures were shown for the FLAG western blot. More Yat1-FLAG and Yat2-FLAG associate with Acs1-GFP under hypoxia than normoxia. The lower panel shows there are similar amount of protein in the lysate.

121
Figure 4.19 Metabolic reconfiguration in respiration-deficient cells Only genes involved in glutamate biosynthesis and anaplerotic pathways are shown. The broken line in the TCA cycle indicates the block from succinate to oxaloacetic acid (OAA) in respiration-deficient cells. Genes whose expression is elevated in ρ0 cells are indicated in red. A metabolic reconfiguration of the retrograde pathway ensures a sufficient level of α-ketoglutarate for glutamate synthesis to meet the demand of nitrogen supply for biosynthetic reactions (Adapted from Liu Z, Butow RA. 2006).

122
Figure 4.20 Crc1p and Cat2p do not localize to Acs1-GFP foci Acs1-GFP foci were examined in Crc1-Cherry and Cat2-Cherry strains to check for potential colocalization. However, Crc1-Cherry and Cat2-Cherry do not form foci under the same condition.

123
Figure 4.21 ρ0 cells have autofluoresence, foci at GFP channel is an artifact Mitochondria deficient ρ0 cells were made for Acs1-GFP, Cen.PKa WT and acs1Δ strains. Foci could be detected in all these cells under FITC channel, but not other channels (DAPI, RFP, etc). Since Cen.PKa WT and acs1Δ cells still have foci, they are considered as autofluoresence artifact that is different from the Acs1-GFP foci seen previously. We have also found that Acs1p is no longer present in these ρ0 cells by western blot (data not shown).

124
Figure 4.22 Electron transport chain inhibitor can also induce Acs1-GFP foci formation Mitochondria were marked by mito-RFP in red and Acs1-GFP is in green. Cells were grown to saturation in a chemostat and bubbled with nitrogen overnight and the hypoxia sample was cross-linked and collected. At the same time, hypoxic culture was drawn out from the chemostat and placed into three flasks and continued culture in a shaker. After 30 minutes, 10μM antimycin or 10μg/ml CCCP was added to two of the three cultures. Another 30 minutes later, cells from all three flasks were fixed and collected as normoxia, and antimycin or CCCP treated cells. While Acs1-GFP dissipated to cytosol in the normoxia sample, antimycin and CCCP triggered Acs1-GFP foci formation again.
125
Figure 4.23 Acs1-GFP interacts with additional proteins under hypoxia as well as with antimycin or CCCP treatment The same samples described in Figure 4.19 were used for immunoprecipitation experiments. Acs1-GFP was immunoprecipiated by anti-GFP antibody and western blot by anti-GFP was shown. The paraformaldehyde crosslinking resulted in multiple extra bands above 100KD (where Acs1-GFP is). Note that antimycin and CCCP treatment resulted in an increased intensity of the multiple bands, especially those found only under hypoxia.

126
CHAPTER FIVE
Material and Methods
Antibodies
FLAG(M2): 200472-21 (Sigma)
HA(12CA5): 11583816001 (Roche)
GFP: 11814460001(Roche)
Acetyl-lysine: 9681S(Cell Signaling), ICP0380(ImmuneChem), ST1027(Calbiochem)
RXXS*/T*(100G7E): 9624S(Cell Signaling)
H3: 05-928 (Millipore)
H3K9ac: 06-942 (Millipore)
H3K14ac: 07-353 (Millipore)
H3K18ac: 07-354 (Millipore)
H3K23ac: 07-355 (Millipore)
H3K27ac: 07-360 (Millipore)
H3K56ac: 07-677 (Millipore)
H3K4triMe: ab8580 (Abcam)
H4K5ac: 07-327 (Millipore)
H4K8ac: 07-328 (Millipore)
H4K12ac: 07-595 (Millipore)
H4K16ac: 07-329 (Millipore)

127
Yeast Strains and Methods
All yeast strains were constructed in the CEN.PK background (van Dijken et al., 2000). Gene
deletion strains were constructed by replacing the target gene with a drug cassette by
homologous recombination (Longtine et al., 1998). C-terminal tagging of genes was also
performed by homologous recombination followed by drug selection. Site-directed
mutagenesis was performed by PCR in which primers containing the mutation were used to
generate two PCR fragments that contain ~45 bp overlapping regions containing the
mutation. Fusion PCR or isothermal assembly (Gibson et al., 2009) was then performed to
fuse the fragments together and the product was used for transformation. The introduced
mutations and the full-length gene sequences were verified by DNA sequencing.
Yeast Cell Lysis and Immunoprecipitation
Typically ~100 OD yeast cells were lysed in 1 ml lysis buffer (100 mM Tris-Cl pH 7.5, 100
mM NaCl, 50 mM NaF, 1 mM EDTA, 1 mM EGTA, 0.1% Tween-20, 10% glycerol, 50 mM
sodium butyrate, 50 mM nicotinamide, 5 µM trichostatin A, 1 mM PMSF, 10 µM leupeptin,
5 µM pepstatin A, Roche protease inhibitor cocktail, 14 mM β-mercaptoethanol) by bead
beating and immunoprecipitation was performed by incubating the lysate with 15 µl
magnetic beads (Invitrogen) conjugated to 2 µg antibody for 3 hours. After washing 3 times
in the same buffer, the beads were boiled. Alternatively, for FLAG IP, proteins could be
eluted off the beads by 3xFLAG peptide.
Screening for newly acetylated protein in YMC

128
Identification of acetylated proteins by affinity purification of the acetylated peptides was
performed largely according to a previously published protocol (Kim et al., 2006). Briefly,
cycling cells were harvested at both 1 and 3.5 minutes following acetate addition. Lysates
were prepared as described previously and ~10 mg total protein was precipitated and washed
with acetone. The pellet was sonicated and then resuspended in NH4HCO3 buffer. Trypsin
(Promega) was added at a ratio of 1:50 (w/w) to digest the peptides overnight at 37°C with
gentle shaking. Reduction and alkylation of digested peptides was performed followed by an
additional trypsin digestion for 3 hours. Antibodies against acetyl-lysine (Cell Signaling
#9681 and Immunechem #ICP0380) were added to the peptide mixture and incubated
overnight at 4°C. Beads were added to harvest the antibody-bound acetylated peptides. After
five washes, peptides were eluted using 0.1% TFA and filtered through a Microcon YM-10
column and the eluate was dried down. The digests were then dissolved in a 5% formic acid
aqueous solution. Two independent LC-MS/MS runs were performed to identify putative
acetylated peptides. The LC-MS/MS data of two runs were combined and searched against
NCBI nr-Saccharomyces cerevisiae database. Modifications included in the database
searching were: Acetyl (K), Acetyl (+44) (K), Carbamidomethyl (C), Deamidation (NQ),
Oxidation (M). To verify acetylated targets, candidate genes were FLAG-tagged at the C-
terminus. Immunoprecipitation of the tagged protein from cells grown to log phase in YPGE
(YP + glycerol, ethanol) culture was performed followed by Western blot using an antibody
against acetyl-lysine (Immunechem #ICP0380) to confirm acetylation of the candidate
protein. To determine whether the candidate protein was dynamically acetylated, cells were
collected over 12 time points of the YMC and analyzed similarly.

129
Histone Western Blots
Western blots to detect histone modifications at the bulk level were performed using a
protocol adapted from previously published studies (Keogh et al., 2006). Briefly, 1 ml of
cycling cells were quickly spun down, washed with 20% TCA, and then flash frozen. The
frozen pellet was resuspended in 20% TCA and lysed by bead beating. Lysate and
precipitate/debris was mixed with 1 ml 5% TCA and pelleted. The pellet was washed with
0.75 ml 100% cold ethanol and resuspended in 150 µl loading buffer (50 µl 1 M Tris-Cl pH
8.0, 92.5 µl 3X SDS sample buffer and 7.5 µl 100% β-mercaptoethanol) and boiled for 5
min. The supernatant was collected and then proteins were separated using 15% SDS-PAGE.
Western blots were performed using the following commercially available antibodies that are
highly specific for the indicated modifications (Suka et al., 2001).
Silverstaining
Silverstaining was performed using SilverQuest from Invitrogen.
Chromatin Immunoprecipitation (ChIP)
Chromatin immunoprecipitation was performed according to a well-established protocol with
minor modifications (Ezhkova and Tansey, 2006). Briefly, ~50 OD cycling cells collected
from the appropriate time point were rapidly fixed in 1% formaldehyde for 15 min in 50 ml
total volume and then quenched using 3 ml 2.5 M glycine for 10 min. The fixed cells were
pelleted and washed twice with buffer containing 100 mM NaCl, 10 mM Tris-Cl pH 8.0, 1

130
mM EDTA, 1 mM PMSF, 1 mM benzamidine•HCl before freezing. The frozen pellet was
resuspended in 0.45 ml ChIP lysis buffer (50 mM HEPES•KOH pH 7.5, 500 mM NaCl, 1
mM EDTA, 1% Triton X-100, 0.1% deoxycholate (DOC), 0.1% SDS, 1 mM PMSF, 10 µM
leupeptin, 5 µM pepstatin A, Roche protease inhibitor cocktail) and lysed by bead beating.
Lysate from 50 OD cells were split into two tubes each containing 280 µl lysate and
sonicated for 16 cycles (30 sec on, 1 min off, high output) using a Bioruptor (Diagenode).
The supernatant of the sonicated lysate was pre-cleared. 50 µl lysate was saved as input. For
ChIP with histone antibodies, 50 µl whole cell extract (WCE) was diluted 1:10 and used for
each ChIP. For SAGA ChIP, 500 µl WCE and 2 µg Flag M2 antibody was used. After
incubation overnight, 20 µl magnetic beads resuspended in ChIP lysis buffer was added and
incubated for 1.5 h. Beads were washed twice with ChIP lysis buffer, once with DOC buffer
(10 mM Tris•Cl pH 8.0, 0.25 M LiCl, 0.5% DOC, 1 mM EDTA) and once with TE. 60 µl of
TES buffer (50 mM Tris-Cl pH 8.0, 10 mM EDTA, 1% SDS) was added to resuspend the
beads. Supernatant was collected after incubation at 65°C for 10 min. A second round of
elution was performed and the eluates were combined. 150 µl TES was added to the input
sample. Reverse crosslinking was performed for the ChIP and input sample by incubating for
6 hours at 65°C. An equal volume of TE containing 1.25 mg/ml proteinase K was added to
the samples after reverse crosslinking and samples were incubated for 2 hours at 37°C. DNA
was then purified with a QIAquick PCR purification kit. Real-time PCR was performed in
triplicate using SYBR green reagents from Applied Biosystems. PCR primers were designed
by Primer Express software from Applied Biosystems to target every ~250 bp region from -
750 bp before to 750 bp after the start codon of the selected gene.

131
ChIP-Seq
Library construction was performed using a protocol from the following
website:http://bioinfo.mbb.yale.edu/array/Solexa_LibraryPrep_20080229ge.pdf
ChIP-Seq libraries of H3K9ac and H3 were constructed using barcoded adaptors and four
samples were multiplexed to run in a single lane. Libraries of SAGA and input were not
multiplexed and each was run in a single lane. End repair was performed followed by adding
‘A’ base to 3’ ends. Adaptors were ligated to DNA fragments. Barcoded adaptors were used
to generate samples for multiplexing while non-barcode adaptors were used for samples run
on single lanes. After ligation, DNA fragments about 200 bp were excised from the agarose
gel and used for PCR. PCR products ~250 bp in size were gel-extracted and quantified using
PicoGreen (Invitrogen). Samples were run on an Agilent Bioanalyzer to obtain precise size
information for appropriate dilution of the DNA. Sequencing was performed on an Illumina
GA IIX supervised by the UTSW Microarray Core Facility. More than 5 million mapped
reads were obtained for each of the multiplexed samples and more than 20 million for the
samples run on a single lane. H3K9ac/H3 data was analyzed using CLC Genomics
Workbench software. Peaks were called with a maximum FDR = 1% and maximum p-value
for Wilcoxon test = 1.0E-4. SAGA/Input data was assembled to the reference genome by
Bowtie and analyzed by CisGenome as described in its online tutorial (Ji et al., 2008). Peaks
with a fold-enrichment value max|FC| above 2 (>4-fold change) were selected. Peaks were
annotated with the gene whose transcription start site (TSS) is closest to the peak region. The
CisGenome browser was used to visualize ChIP-Seq peaks (Ji et al., 2008).

132
In vitro HAT Assay
SAGA was immunoprecipitated from OX and RC phase of the YMC as described above.
Beads were washed twice with HAT buffer (50 mM Tris•Cl pH 8.0, 1 mM DTT, 5%
glycerol, 1 mM PMSF, 0.03% NP-40) and incubated with HeLa core histones or long
oligonucleosomes in the presence of 3H-acetyl-CoA in HAT buffer at 30°C for 1 hr. The
reaction was spotted onto phosphocellulose filter paper, dried and washed twice with 50 mM
NaHCO3-Na2CO3 buffer (pH 9.2), and rinsed with acetone. The dried filter paper was
placed into vials for liquid scintillation counting to quantitate 3H signal.
Metabolic Cycles and Metabolite Analysis
Chemostat growth, metabolite extraction, and LC-MS/MS analysis of cellular metabolites
were performed as described previously (Tu et al., 2005; Tu et al., 2007).
Real-Time PCR Analysis of mRNA Expression
RNA preparation was performed as described previously (Tu et al., 2005). 1 μg RNA was
reverse transcribed into cDNA in 50 �l volume using Superscript II from Invitrogen and the
final product was diluted 1:25. Real-time PCR was performed in triplicate. Transcript levels
of selected genes were normalized against actin (ACT1).
Mapping by Cleavage at Cyanylated Cysteines
Immunoprecipitated Ifh1p bound to magnetic beads was resuspended in reaction buffer
(0.1M Tris Acetate, pH 8.0 and 8M GnCl). 2-nitro-5-thiocyanobenzoic acid (NTCB) was

133
added to 1mM and the reaction was incubated at room temperature for 30min. NaOH was
added to adjust pH to 9.0 and the reaction was incubated at 37°C overnight. The reaction was
boiled and run on a 3-8% Tris-Acetate precast gel.
Lifespan assays
Replicative lifespan (RLS) assays were carried out as described previously (Steffen et al.,
2009). Unless otherwise noted, all lifespan experiments were performed on YPD plates with
2% glucose. The BY strain background was used for RLS assays.
Crosslinking
16% freshly opened paraformaldehyde was added to culture to a final concentration of 2%.
Cells were incubated for 10 minutes and spinned down. Supernatant was discarded. The cell
pellet was washed with potassium phosphate buffer (0.1M pH 6.6) and pelleted again. For
imaging, the pellet was resuspended in the same potassium phosphate buffer and kept in 4°C
till used. For immunoprecipitation, the pellet was flash frozen and kept at -80°C till used.
Generation of ρ0 cells
Cells were cultured in YPD to log phase and ethidium bromide was added to a final
concentration of 25µg/ml. After overnight incubation, cells were streaked on to a new YPD
plate. A single colony was inoculated into YPD and after overnight growth, cells were
pelleted and washed and resuspended in YPGE medium. After 5-6 hours, cells were fixed for
imaging.

134
BIBLIOGRAPHY
Balasubramanian, R., Pray-Grant, M.G., Selleck, W., Grant, P.A., and Tan, S. (2002). Role of the Ada2 and Ada3 transcriptional coactivators in histone acetylation. J Biol Chem 277, 7989-7995.
Berndsen, C.E., and Denu, J.M. (2008). Catalysis and substrate selection by histone/protein lysine acetyltransferases. Curr Opin Struct Biol 18, 682-689.
Brownell, J.E., Zhou, J., Ranalli, T., Kobayashi, R., Edmondson, D.G., Roth, S.Y., and Allis, C.D. (1996). Tetrahymena histone acetyltransferase A: a homolog to yeast Gcn5p linking histone acetylation to gene activation. Cell 84, 843-851.
Cai, L., Sutter, B.M., Li, B., and Tu, B.P. (2011). Acetyl-CoA induces cell growth and proliferation by promoting the acetylation of histones at growth genes. Mol Cell 42, 426-437.
Cai, L., and Tu, B.P. (2012). Driving the cell cycle through metabolism. Annu Rev Cell Dev Biol 28, 59-87.
Chen, Z., Odstrcil, E.A., Tu, B.P., and McKnight, S.L. (2007). Restriction of DNA replication to the reductive phase of the metabolic cycle protects genome integrity. Science 316, 1916-1919.
Choudhary, C., Kumar, C., Gnad, F., Nielsen, M.L., Rehman, M., Walther, T.C., Olsen, J.V., and Mann, M. (2009). Lysine acetylation targets protein complexes and co-regulates major cellular functions. Science 325, 834-840.
DeBerardinis, R.J., Lum, J.J., Hatzivassiliou, G., and Thompson, C.B. (2008). The biology of cancer: metabolic reprogramming fuels cell growth and proliferation. Cell metabolism 7, 11-20.
Delaney, J.R., Sutphin, G.L., Dulken, B., Sim, S., Kim, J.R., Robison, B., Schleit, J., Murakami, C.J., Carr, D., An, E.H., et al. (2011). Sir2 deletion prevents lifespan extension in 32 long-lived mutants. Aging Cell 10, 1089-1091.
Epstein, C.B., Waddle, J.A., Hale, W.t., Dave, V., Thornton, J., Macatee, T.L., Garner, H.R., and Butow, R.A. (2001). Genome-wide responses to mitochondrial dysfunction. Mol Biol Cell 12, 297-308.
Fabrizio, P., Pletcher, S.D., Minois, N., Vaupel, J.W., and Longo, V.D. (2004). Chronological aging-independent replicative life span regulation by Msn2/Msn4 and Sod2 in Saccharomyces cerevisiae. FEBS Lett 557, 136-142.
Friis, R.M., Wu, B.P., Reinke, S.N., Hockman, D.J., Sykes, B.D., and Schultz, M.C. (2009). A glycolytic burst drives glucose induction of global histone acetylation by picNuA4 and SAGA. Nucleic Acids Res 37, 3969-3980.
Gamper, A.M., Kim, J., and Roeder, R.G. (2009). The STAGA subunit ADA2b is an important regulator of human GCN5 catalysis. Mol Cell Biol 29, 266-280.
Grant, P.A., Duggan, L., Cote, J., Roberts, S.M., Brownell, J.E., Candau, R., Ohba, R., Owen-Hughes, T., Allis, C.D., Winston, F., et al. (1997). Yeast Gcn5 functions in two multisubunit complexes to acetylate nucleosomal histones: characterization of an Ada complex and the SAGA (Spt/Ada) complex. Genes Dev 11, 1640-1650.

135
Grant, P.A., Eberharter, A., John, S., Cook, R.G., Turner, B.M., and Workman, J.L. (1999). Expanded lysine acetylation specificity of Gcn5 in native complexes. J Biol Chem 274, 5895-5900.
Hartwell, L.H., and Unger, M.W. (1977). Unequal division in Saccharomyces cerevisiae and its implications for the control of cell division. J Cell Biol 75, 422-435.
Helenius, A., and Aebi, M. (2001). Intracellular functions of N-linked glycans. Science 291, 2364-2369.
Henry, K.W., Wyce, A., Lo, W.S., Duggan, L.J., Emre, N.C., Kao, C.F., Pillus, L., Shilatifard, A., Osley, M.A., and Berger, S.L. (2003). Transcriptional activation via sequential histone H2B ubiquitylation and deubiquitylation, mediated by SAGA-associated Ubp8. Genes Dev 17, 2648-2663.
Hinnebusch, A.G. (2005). Translational regulation of GCN4 and the general amino acid control of yeast. Annu Rev Microbiol 59, 407-450.
Huber, A., Bodenmiller, B., Uotila, A., Stahl, M., Wanka, S., Gerrits, B., Aebersold, R., and Loewith, R. (2009). Characterization of the rapamycin-sensitive phosphoproteome reveals that Sch9 is a central coordinator of protein synthesis. Genes Dev 23, 1929-1943.
Huber, A., French, S.L., Tekotte, H., Yerlikaya, S., Stahl, M., Perepelkina, M.P., Tyers, M., Rougemont, J., Beyer, A.L., and Loewith, R. (2011). Sch9 regulates ribosome biogenesis via Stb3, Dot6 and Tod6 and the histone deacetylase complex RPD3L. EMBO J 30, 3052-3064.
Huisinga, K.L., and Pugh, B.F. (2004). A genome-wide housekeeping role for TFIID and a highly regulated stress-related role for SAGA in Saccharomyces cerevisiae. Mol Cell 13, 573-585.
Ji, H., Jiang, H., Ma, W., Johnson, D.S., Myers, R.M., and Wong, W.H. (2008). An integrated software system for analyzing ChIP-chip and ChIP-seq data. Nat Biotechnol 26, 1293-1300.
Jorgensen, P., Nishikawa, J.L., Breitkreutz, B.J., and Tyers, M. (2002). Systematic identification of pathways that couple cell growth and division in yeast. Science 297, 395-400.
Jorgensen, P., and Tyers, M. (2004). How cells coordinate growth and division. Curr Biol 14, R1014-1027.
Kaeberlein, M., Powers, R.W., 3rd, Steffen, K.K., Westman, E.A., Hu, D., Dang, N., Kerr, E.O., Kirkland, K.T., Fields, S., and Kennedy, B.K. (2005). Regulation of yeast replicative life span by TOR and Sch9 in response to nutrients. Science 310, 1193-1196.
Kim, J.H., Saraf, A., Florens, L., Washburn, M., and Workman, J.L. (2010). Gcn5 regulates the dissociation of SWI/SNF from chromatin by acetylation of Swi2/Snf2. Genes Dev 24, 2766-2771.
Kohler, A., Schneider, M., Cabal, G.G., Nehrbass, U., and Hurt, E. (2008). Yeast Ataxin-7 links histone deubiquitination with gene gating and mRNA export. Nat Cell Biol 10, 707-715.
Kurdistani, S.K., Tavazoie, S., and Grunstein, M. (2004). Mapping global histone acetylation patterns to gene expression. Cell 117, 721-733.

136
Langer, M.R., Fry, C.J., Peterson, C.L., and Denu, J.M. (2002). Modulating acetyl-CoA binding in the GCN5 family of histone acetyltransferases. J Biol Chem 277, 27337-27344.
Lee, K.K., and Workman, J.L. (2007). Histone acetyltransferase complexes: one size doesn't fit all. Nat Rev Mol Cell Biol 8, 284-295.
Liko, D., Conway, M.K., Grunwald, D.S., and Heideman, W. (2010). Stb3 plays a role in the glucose-induced transition from quiescence to growth in Saccharomyces cerevisiae. Genetics 185, 797-810.
Lin, S.J., Defossez, P.A., and Guarente, L. (2000). Requirement of NAD and SIR2 for life-span extension by calorie restriction in Saccharomyces cerevisiae. Science 289, 2126-2128.
Lippman, S.I., and Broach, J.R. (2009). Protein kinase A and TOR activate genes for ribosomal biogenesis by inactivating repressors encoded by Dot6 and its homolog Tod6. Proc Natl Acad Sci U S A 106, 19928-19933.
Liu, Z., and Butow, R.A. (2006). Mitochondrial retrograde signaling. Annu Rev Genet 40, 159-185.
Longo, V.D., Shadel, G.S., Kaeberlein, M., and Kennedy, B. (2012). Replicative and chronological aging in Saccharomyces cerevisiae. Cell Metab 16, 18-31.
Martineau, Y., Le Bec, C., Monbrun, L., Allo, V., Chiu, I.M., Danos, O., Moine, H., Prats, H., and Prats, A.C. (2004). Internal ribosome entry site structural motifs conserved among mammalian fibroblast growth factor 1 alternatively spliced mRNAs. Mol Cell Biol 24, 7622-7635.
Masumoto, H., Hawke, D., Kobayashi, R., and Verreault, A. (2005). A role for cell-cycle-regulated histone H3 lysine 56 acetylation in the DNA damage response. Nature 436, 294-298.
Mischerikow, N., Spedale, G., Altelaar, A.F., Timmers, H.T., Pijnappel, W.W., and Heck, A.J. (2009). In-depth profiling of post-translational modifications on the related transcription factor complexes TFIID and SAGA. J Proteome Res 8, 5020-5030.
Novick, A., and Szilard, L. (1950). Description of the chemostat. Science 112, 715-716. Pokholok, D.K., Harbison, C.T., Levine, S., Cole, M., Hannett, N.M., Lee, T.I., Bell,
G.W., Walker, K., Rolfe, P.A., Herbolsheimer, E., et al. (2005). Genome-wide map of nucleosome acetylation and methylation in yeast. Cell 122, 517-527.
Robert, F., Pokholok, D.K., Hannett, N.M., Rinaldi, N.J., Chandy, M., Rolfe, A., Workman, J.L., Gifford, D.K., and Young, R.A. (2004). Global position and recruitment of HATs and HDACs in the yeast genome. Mol Cell 16, 199-209.
Rolland, F., Winderickx, J., and Thevelein, J.M. (2002). Glucose-sensing and -signalling mechanisms in yeast. FEMS Yeast Res 2, 183-201.
Rudra, D., Mallick, J., Zhao, Y., and Warner, J.R. (2007). Potential interface between ribosomal protein production and pre-rRNA processing. Mol Cell Biol 27, 4815-4824.
Rudra, D., Zhao, Y., and Warner, J.R. (2005). Central role of Ifh1p-Fhl1p interaction in the synthesis of yeast ribosomal proteins. EMBO J 24, 533-542.

137
Sandmeier, J.J., French, S., Osheim, Y., Cheung, W.L., Gallo, C.M., Beyer, A.L., and Smith, J.S. (2002). RPD3 is required for the inactivation of yeast ribosomal DNA genes in stationary phase. EMBO J 21, 4959-4968.
Schawalder, S.B., Kabani, M., Howald, I., Choudhury, U., Werner, M., and Shore, D. (2004). Growth-regulated recruitment of the essential yeast ribosomal protein gene activator Ifh1. Nature 432, 1058-1061.
Sonveaux, P., Vegran, F., Schroeder, T., Wergin, M.C., Verrax, J., Rabbani, Z.N., De Saedeleer, C.J., Kennedy, K.M., Diepart, C., Jordan, B.F., et al. (2008). Targeting lactate-fueled respiration selectively kills hypoxic tumor cells in mice. J Clin Invest 118, 3930-3942.
Steffen, K.K., MacKay, V.L., Kerr, E.O., Tsuchiya, M., Hu, D., Fox, L.A., Dang, N., Johnston, E.D., Oakes, J.A., Tchao, B.N., et al. (2008). Yeast life span extension by depletion of 60s ribosomal subunits is mediated by Gcn4. Cell 133, 292-302.
Suka, N., Suka, Y., Carmen, A.A., Wu, J., and Grunstein, M. (2001). Highly specific antibodies determine histone acetylation site usage in yeast heterochromatin and euchromatin. Mol Cell 8, 473-479.
Takahashi, H., McCaffery, J.M., Irizarry, R.A., and Boeke, J.D. (2006). Nucleocytosolic acetyl-coenzyme a synthetase is required for histone acetylation and global transcription. Mol Cell 23, 207-217.
Trievel, R.C., Rojas, J.R., Sterner, D.E., Venkataramani, R.N., Wang, L., Zhou, J., Allis, C.D., Berger, S.L., and Marmorstein, R. (1999). Crystal structure and mechanism of histone acetylation of the yeast GCN5 transcriptional coactivator. Proc Natl Acad Sci U S A 96, 8931-8936.
Tu, B.P., Kudlicki, A., Rowicka, M., and McKnight, S.L. (2005). Logic of the yeast metabolic cycle: temporal compartmentalization of cellular processes. Science 310, 1152-1158.
Tu, B.P., and McKnight, S.L. (2009). Evidence of carbon monoxide-mediated phase advancement of the yeast metabolic cycle. Proc Natl Acad Sci U S A 106, 14293-14296.
Tu, B.P., Mohler, R.E., Liu, J.C., Dombek, K.M., Young, E.T., Synovec, R.E., and McKnight, S.L. (2007). Cyclic changes in metabolic state during the life of a yeast cell. Proc Natl Acad Sci U S A 104, 16886-16891.
Tu, B.P., and Wang, J.C. (1999). Protein footprinting at cysteines: probing ATP-modulated contacts in cysteine-substitution mutants of yeast DNA topoisomerase II. Proc Natl Acad Sci U S A 96, 4862-4867.
van den Berg, M.A., de Jong-Gubbels, P., Kortland, C.J., van Dijken, J.P., Pronk, J.T., and Steensma, H.Y. (1996). The two acetyl-coenzyme A synthetases of Saccharomyces cerevisiae differ with respect to kinetic properties and transcriptional regulation. J Biol Chem 271, 28953-28959.
Wade, J.T., Hall, D.B., and Struhl, K. (2004). The transcription factor Ifh1 is a key regulator of yeast ribosomal protein genes. Nature 432, 1054-1058.
Wang, Q., Zhang, Y., Yang, C., Xiong, H., Lin, Y., Yao, J., Li, H., Xie, L., Zhao, W., Yao, Y., et al. (2010). Acetylation of metabolic enzymes coordinates carbon source utilization and metabolic flux. Science 327, 1004-1007.

138
Warner, J.R. (1999). The economics of ribosome biosynthesis in yeast. Trends Biochem Sci 24, 437-440.
Wellen, K.E., Hatzivassiliou, G., Sachdeva, U.M., Bui, T.V., Cross, J.R., and Thompson, C.B. (2009). ATP-citrate lyase links cellular metabolism to histone acetylation. Science 324, 1076-1080.
Wu, M., Newcomb, L., and Heideman, W. (1999). Regulation of gene expression by glucose in Saccharomyces cerevisiae: a role for ADA2 and ADA3/NGG1. J Bacteriol 181, 4755-4760.
Wu, P.Y., and Winston, F. (2002). Analysis of Spt7 function in the Saccharomyces cerevisiae SAGA coactivator complex. Mol Cell Biol 22, 5367-5379.
Xu, F., Zhang, K., and Grunstein, M. (2005). Acetylation in histone H3 globular domain regulates gene expression in yeast. Cell 121, 375-385.
Zaman, S., Lippman, S.I., Schneper, L., Slonim, N., and Broach, J.R. (2009). Glucose regulates transcription in yeast through a network of signaling pathways. Mol Syst Biol 5, 245.
Zaman, S., Lippman, S.I., Zhao, X., and Broach, J.R. (2008). How Saccharomyces responds to nutrients. Annu Rev Genet 42, 27-81.
Zhang, W., Bone, J.R., Edmondson, D.G., Turner, B.M., and Roth, S.Y. (1998). Essential and redundant functions of histone acetylation revealed by mutation of target lysines and loss of the Gcn5p acetyltransferase. EMBO J 17, 3155-3167.
Zhao, S., Xu, W., Jiang, W., Yu, W., Lin, Y., Zhang, T., Yao, J., Zhou, L., Zeng, Y., Li, H., et al. (2010). Regulation of cellular metabolism by protein lysine acetylation. Science 327, 1000-1004.