insights into the competitive adsorption of pollutants on
TRANSCRIPT

RSC Advances
PAPER
Ope
n A
cces
s A
rtic
le. P
ublis
hed
on 2
0 A
pril
2020
. Dow
nloa
ded
on 3
/16/
2022
10:
31:5
0 A
M.
Thi
s ar
ticle
is li
cens
ed u
nder
a C
reat
ive
Com
mon
s A
ttrib
utio
n-N
onC
omm
erci
al 3
.0 U
npor
ted
Lic
ence
.
View Article OnlineView Journal | View Issue
Insights into the
Department of Chemical Engineering, Ind
India–721302. E-mail: [email protected]
† Electronic supplementary informa10.1039/d0ra01397h
Cite this: RSC Adv., 2020, 10, 15514
Received 13th February 2020Accepted 26th March 2020
DOI: 10.1039/d0ra01397h
rsc.li/rsc-advances
15514 | RSC Adv., 2020, 10, 15514–15
competitive adsorption ofpollutants on a mesoporous alumina–silica nano-sorbent synthesized from coal fly ash and a wastealuminium foil†
Aditi Chatterjee, Shahnawaz Shamim, Amiya Kumar Janaand Jayanta Kumar Basu *
A highly efficient and low-cost alumina–silica nano-sorbent was fabricated and characterized to
understand the key factors responsible for its superiority over the existing adsorbents in treating the
industry-discharged wastewater for the removal of dyes and heavy metals. As compared to the
properties of raw fly ash, the following fundamental improvements were observed for the alumina–silica
nano-sorbent: (a) transformation of throttled mesopores into slit-type pores, (b) increment in the surface
area by 65-fold, (c) change in the morphology from spherical particles to a flake-type structure with
sharp edges, (d) reduction in the average crystal size from 61.143 to 27.176 nm, and (e) increase in the
pore volume from 0.005 to 0.50 cm3 g�1. These desired properties of the nano-sorbent were obtained
by blending a waste aluminium foil with fly ash. This process increased the ratio of alumina to silica from
0.59 : 1 to an optimum ratio of 1.9 : 1, beyond which the particles agglomerated and the pore volume
reduced. Eventually, the precipitated hydroxides were calcined at 700 �C that favoured the formation of
g-alumina. Moreover, this heat treatment changed its crystallinity and morphology of g-alumina, which
abruptly enhanced its activity towards the pollutants. The obtained product (nano-sorbent) was tested
for the removal of lead and malachite green from a model wastewater solution over a wide range of
initial pollutant concentrations and adsorbent dosages. After observing almost complete removal
capacity and reusability for the pollutants, we propose this synthesized adsorbent as a universal material
for treating industrial wastewater.
1. Introduction
Water pollution originating from several anthropogenic indus-trial sources is a global concern. The toxic and harmful pollut-ants such as dyes and heavy metals are the major componentsin the discharge of dye, leather, textile, paper, food and elec-troplating processing industries.1 Usually, dyes are difficult todecompose and their presence reduces the penetration ofsunlight in water, which affects the intensity of photosynthesisin aquatic plants and subsequently damages the aquaticecosystems. Moreover, dyes and heavy metals there are provento have strong carcinogenic, mutagenic and toxic effectstowards aquatic organisms, human beings and ecologicalenvironments.2,3 In this light, lead (Pb(II)) is an extremely toxicheavy metal, which causes encephalopathy, anaemia and liverdamage, and affects the central nervous system.4–6 On the other
ian Institute of Technology–Kharagpur,
.in
tion (ESI) available. See DOI:
522
hand, malachite green (MG) is a synthetic dye of basic nature,which is extensively used in the textile industry and in curingbacterial or fungal infections and parasites in sh. Malachitegreen has the potential to cause cancer, respiratory diseases andteratogenicity.7,8 Typically, the textile industries disposea sizable amount of Pb(II) and malachite green through theireffluents.9 Therefore, the development of an effective method toeliminate malachite green and Pb(II) from industrial effluents isa crucial task for preserving the environment. The present workis carried out with this intention.
There are several methods available to eliminate the pollut-ants from wastewater; however, most of these methods involvehigh installation and operating costs, complicated operations,partial separations and the production of huge sludge. Inaddition, the proper separation of pollutants from a multicom-ponent mixture is an arduous and expensive task using tradi-tional techniques. Howbeit, adsorption is attested as aneconomical and robust technique with a modest operationalprocedure, which is effectually applicable for a wide variety ofpollutants.10,11 The industrial wastewater naturally comprisesmulticomponent pollutants with a wide range of concentration.
This journal is © The Royal Society of Chemistry 2020

Paper RSC Advances
Ope
n A
cces
s A
rtic
le. P
ublis
hed
on 2
0 A
pril
2020
. Dow
nloa
ded
on 3
/16/
2022
10:
31:5
0 A
M.
Thi
s ar
ticle
is li
cens
ed u
nder
a C
reat
ive
Com
mon
s A
ttrib
utio
n-N
onC
omm
erci
al 3
.0 U
npor
ted
Lic
ence
.View Article Online
Till date, research on adsorption processes is more concen-trated on the mono-component system that either containsheavy metals or dyes.12,13 The application of adsorption to dealwith a multicomponent mixture of pollutants is still at anpreliminary level due to the limited research emphasis on thesame. Therefore, there is an urgent need to understand andevaluate the nature of the multicomponent adsorption in theview of formulating an industry scale unit to treat thewastewater.
In search of efficient and low-cost adsorbents, bio-adsorbentsfrom agricultural wastes (such as lotus seedpod,14 orange peel,15
barley straw,16 leaf powder17 and other agricultural waste-basedadsorbents18) have already shown an appreciable efficiency inremoving dyes and heavy metals, but they have the drawbacks ofenhancing chemical oxygen demand (COD), biological oxygendemand (BOD) and total organic carbon (TOC) in water.19
Concurrently, activated carbon offers huge production and reac-tivation cost.17,20 The inorganic adsorbents from industrial solidwastes have claimedhuge research attention due to their economic-nature and successful applications. Steel slag was used efficientlyfor the removal of Cd and Mn ions from industrial wastewater.21
Fertilizers and steel plant wastes were successfully used forremoving dyes,22 Pb(II)23 and bromophenols24 by adsorption. Redmud was used to prepare porous adsorbents for the adsorptionphosphorus and diclofenac.25Besides, the growth and developmentof an industrial sector is greatly dependent on the extent of powergeneration and consumption. Majority of the industries rely on thethermal power plants for the generation of energy. However, thesepower plants mostly utilize relatively inefficient carbon-based fuels,such as coal, which are further responsible for emitting an enor-mous amount of y ash in the environment. The y ash createssignicant environmental risk and serious disposal problems.Moreover, the inappropriate disposal of y ash causes soil degra-dation and groundwater contamination. The y ash particles aresmall enough to cause severe air pollution that leads to eye irrita-tion, skin and respiratory diseases.26 Therefore, the recycling of coaly ash is a vital aspect for safe and efficient solid waste manage-ment. Simultaneously, this offers signicant economic and envi-ronmental benets. Fly ash is used in concrete production, ceramicindustry,27 soil amelioration,28 valuable metal recovery,29 zeolitesyntheses,30 catalyst supports,31 and adsorbents for water treat-ment.32 Moreover, y ash is a potential adsorbent for dyes andheavy metals because it is composed of signicant amounts ofalumina and silica.33
Therefore, considering the aforementioned couple of issues,an attempt is made to fabricate an adsorbent from coal y ashthat can purify wastewater from the industry. Through thisapproach, we are utilizing the waste (i.e., coal y ash) to treatanother waste (i.e., wastewater containing dyes and heavymetals). Till date, the adsorption capacity of plant y ash isincreased either by a base–acid treatment or through theimpregnation method.32 The present research proposes a novelapproach to synthesize mesoporous alumina–silica nano-sorbents from the precipitates of the alkali extraction froma mixture of coal y ash and a waste aluminium foil. Acomprehensive characterization of the as-prepared material isperformed to examine their crystallinity, morphology and
This journal is © The Royal Society of Chemistry 2020
porosity. The as-synthesised nano-sorbent is employed toremove a multicomponent mixture of Pb(II) and malachitegreen from wastewater. Here, the effective parameters ofadsorption are optimized through response surface method-ology (RSM) with central composite design (CCD). The experi-mental results have proved that the adsorption process involvesmonolayer formation and is endothermic in nature, which iscontrolled by both physical and chemisorption phenomena.Besides, the nano-sorbent has a pretty high adsorption capacityfor both malachite green (1655.2 mg g�1) and lead (326.2 mgg�1), with reasonable reusability. Therefore, the present exper-imental investigation along with modelling can provideimportant contributions towards the effluent treatment at anindustrial scale.
2. Experimental2.1 Materials
The raw coal y ash was collected from Durgapur ProjectLimited, India. The coal y ash has an alumina to silica ratio of0.517 : 1. The waste aluminium foil was collected from the localmarket. The detailed specications of all chemicals used in theexperiments are presented in Table S1.†
2.2 Synthesis of adsorbents
The raw coal y ash was rst washed with Millipore water anddried at 403 K for 8 h. The dried y ash was then mixed with thedesired quantity of the scrap aluminium foil and soaked ina 2 M NaOH solution at ambient condition for 24 h. Thisprocess was repeated three times. Subsequently, the liquid wasseparated via vacuum ltration. A 1 NH2SO4 solution was addedto the ltrate to get a white precipitate of silicon hydroxide andaluminium hydroxide. The slurry was washed with doubledistilled water. Aerwards, the material was calcined at 973 Kfor 4 h to obtain the alumina–silica nano-sorbents. The aluminato silica ratio in the as-prepared adsorbents was varied bychanging the weight ratio of y ash and aluminium foil.34
Different adsorbents were designated as SiA-1, SiA-2, SiA-3 andSiA-4, according to their alumina to silica weight ratios as0.56 : 1, 1.9 : 1, 3.81 : 1 and 6.03 : 1, respectively.
2.3 Characterization
The details of the adsorbent characterization are documentedin the ESI.†
2.4 Adsorption experiment
2.4.1 Adsorption isotherm and kinetics. The adsorptionisotherms were studied at three different temperatures (283 K,303 K and 313 K) and the initial concentration for the singlecomponent was varied from 10 to 500 mg L�1 for binarycomponents, and from 10 to 350 mg L�1 for Pb(II) and MG. Theadsorption kinetics for Pb(II) and MG solutions was also studiedat different initial concentrations of single and binary compo-nent solutions.
2.4.2 Experimental design. The adsorption uptake wasoptimized via central composite design (CCD) by varying the
RSC Adv., 2020, 10, 15514–15522 | 15515

RSC Advances Paper
Ope
n A
cces
s A
rtic
le. P
ublis
hed
on 2
0 A
pril
2020
. Dow
nloa
ded
on 3
/16/
2022
10:
31:5
0 A
M.
Thi
s ar
ticle
is li
cens
ed u
nder
a C
reat
ive
Com
mon
s A
ttrib
utio
n-N
onC
omm
erci
al 3
.0 U
npor
ted
Lic
ence
.View Article Online
parameters such as pH (2 to 8), temperature (283 to 313 K),initial concentration of adsorbate (10 to 100 mg L�1), andadsorbent dosage (0.25 to 2.5 g L�1). The Design Expert sowareversion 11 was used for the optimization of the process bystatistical analysis. A second-degree polynomial was tted tocorrelate the independent parameters to the response as:
Y ¼ b0 þXn
i¼1
bixi þXn
i¼1
biixii2 þ
Xn�1
i¼1
Xn
j¼iþ1
bijxixj þ 3 (1)
where Y represents the responses (adsorption uptake); b0, bi, bijand bii are the coefficients for constant, linear, interaction andthe quadratic contributions, respectively, in eqn (1). The termsxi, xj are the coded values of the independent variables and 3 isthe error between predicted and experimental values. Bysimultaneously varying multiple factors, it is possible to locatethe region of optimum responses. The values of the coefficientsof the model for different responses were evaluated by utilizingthe multiple regression analysis technique.35–38
3. Results and discussion3.1 Selection of adsorbent
The best adsorbent was selected by comparing the adsorptioncapacities of raw y ash, SiA-1, SiA-2, SiA-3 and SiA-4. It is observedthat the adsorbent SiA-2 with an alumina to silica weight ratio of1.9 : 1 shows the maximum removal capacity for both Pb(II) andMG (Fig. 1). Beyond this alumina–silica weight ratio, particleagglomeration reduces the pore volume, which leads to a decreasein the adsorption capacity. Thus, the successive experiments wereperformed using SiA-2. The effects of pH and adsorbent dosageare shown in Fig. S7 and S8,† respectively.
3.2 Adsorption equilibrium isotherm
The equilibrium adsorption isotherms for MG and Pb(II) insingle and binary solutions are shown in Fig. 2(a–d). The higherinitial concentration facilitates the driving force to overcomethe resistance between liquid and solid phases by increasing the
Fig. 1 Comparison of the adsorption capacity of different adsorbentsfor Pb(II) and MG (initial concentration of Pb(II) and MG: 100 mg L�1
each; adsorbent dosage: 1 g L�1; pH: 6, temperature: 303 K).
15516 | RSC Adv., 2020, 10, 15514–15522
collision between the adsorbate molecules and the adsor-bent.39,40 The equilibrium adsorption isotherms obtained forsingle and binary component solutions for three differenttemperatures show that the adsorption capacity of SiA-2increases at higher temperatures.
The Langmuir, Freundlich and Temkin adsorptionmodels41,42 were utilized to t the adsorption data for a singlecomponent. The extended Langmuir isotherm was used forbinary component system.43
It is observed that the Langmuir isotherm tted well witha good correlation coefficient for the single-componentadsorption. However, the extended Langmuir isotherm hasa good correlation coefficient when it is tted with binarycomponent adsorption data. The results are shown in Tables S3and S4† for single and binary component systems, respectively.
In a single component, the MG adsorption shows maximumadsorption capacities of 478.9, 584.3 and 1655.2 mg g�1 at 283,303 and 313 K, respectively. However, the maximum adsorptioncapacities for MG in the binary mixture are found to be as 103.7,391 and 445 mg g�1 at 283, 303 and 313 K, respectively. Theseexperimental results prove that theMG adsorption capacity of SiA-2 is signicantly lower for the binary as compared to the singlecomponent. However, the Pb(II) adsorption capacity of SiA-2 wassignicantly higher in the case of binary as compared to that inthe single-component solution. In a single component, theadsorption capacities for Pb(II) are found to be 193.6, 291.5 and326.2mg g�1 at 283, 303 and 313 K, respectively, and in the case ofbinary adsorption, these capacities are 231.27, 521.87 and615.86 mg g�1 at 283, 303 and 313 K, respectively. It is observedthat Pb(II) adsorption considerably increases for binary adsorp-tion. This phenomenon conrms the synergetic effect of thepresence of MG on the adsorption of Pb(II), while there is anantagonistic effect of the presence of Pb(II) onMG adsorption. Thepossible reasons behind this observation may be the larger size ofMG molecules that causes difficulty in its adsorbtion into thepores. The adsorption process is largely inuenced by the chargedensity of cations. Therefore, Pb(II) with a higher charge densityshow a higher rate of ion exchange.44,45
3.3 Adsorption kinetics
The adsorption uptake as a function of time for MG and Pb(II) insingle and binary components is shown in Fig. 3a–d. Theexperimental data shows a good agreement with pseudo-rst-order, pseudo-second-order and Elovich adsorption kineticmodels.41 The correlation coefficients and other adsorptionkinetic parameters are presented in Tables S5–S7.†
It is observed that, for an intra-particle diffusion model, theqe vs. t1/2 has multiple linearities (Fig. S9a–d†). At the initialstep, the linear plot represents the external lm diffusion; thesecond step represents pore diffusion from the adsorbentsurface to the interior of the pores, and the third step revealsadsorption on the active sites.46
3.4 Molecular insight to adsorption mechanism
Fig. 4a and b show the optimized structure of SiA-2 and MG,respectively, via universal force eld (UFF). The desorption
This journal is © The Royal Society of Chemistry 2020

Fig. 2 Adsorption isotherms of (a) MG in single, (b) Pb(II) in single, (c) MG in binary and (d) Pb(II) in binary component solutions (pH: 6; adsorptiondosage: 1 g L�1).
Paper RSC Advances
Ope
n A
cces
s A
rtic
le. P
ublis
hed
on 2
0 A
pril
2020
. Dow
nloa
ded
on 3
/16/
2022
10:
31:5
0 A
M.
Thi
s ar
ticle
is li
cens
ed u
nder
a C
reat
ive
Com
mon
s A
ttrib
utio
n-N
onC
omm
erci
al 3
.0 U
npor
ted
Lic
ence
.View Article Online
process was initiated by the Na+ ion-exchange method. Pb(II) isattached with SiA-2 at a minimum distance of 3.69 A and thecontact angle was 74.5�, as shown in Fig. 4c. However, MG isattached to SiA-2 having aminimum bond length of 3.571 A andthe contact angle is 84.3�, as shown in Fig. 4d. The highadsorption energy for Pb(II) (306.35 kJ mol�1) and MG(586.228 kJ mol�1) indicates chemisorption.47–49 The higheradsorption energy for MG indicates a higher capacity for MG insingle-component adsorption. In the case of the binaryadsorption of Pb(II) and MG on SiA-2 (Fig. 4e), the adsorptionenergy was 791.8 kJ mol�1.
3.5 Design of experiment
The CCD consists of 2n factorial runs with 2n axial runs and nccentre (8 replicates) runs. The complete range of experimentsand independent variables are presented in Table S8.† The totalnumber of experimental runs are expressed as N and thenumber of factors as n.36,50 The total number of experiments arerepresented by eqn (2):
N ¼ 2n + 2 � n + nc ¼ 25 + 2 � 5 + 8 ¼ 50 (2)
Consequently, 50 sets of experimental runs were performed.The results are tabulated in Table S9.† The independent vari-ables are coded with (�1, 1), where�1 shows the low level and 1
This journal is © The Royal Society of Chemistry 2020
shows the high level. Both the responses, i.e. the adsorptionuptake of Pb(II) and MG are recorded for all preformed experi-mental runs. The ANOVA from the statistical analysis for thePb(II) and MG uptakes are given in Tables S10 and S11,†respectively.
3.5.1 Regression models. The adsorption uptake of Pb(II)(Y1) and MG (Y2) can be represented by the second-degreepolynomials as follows:
Y1¼ 38.68� 21.03A+ 12.73B� 1.77C+ 7.65D+ 2.53E� 3.44AB
� 2.31AC + 4.99AD + 2.15AE� 1.91BC + 3.64BD + 2.27BE
� 0.6743CD � 2.06CE + 0.2357DE + 8.25A2 + 2.00B2
� 0.9295C2 � 4.77D2 � 1.57E2 (3)
Y2 ¼ 34.47 � 7.00A � 4.66B + 13.74C + 2.32D + 0.6621E
+ 7.38AB � 2.06AC � 3.39AD + 0.5244AE � 4.40BC
+ 1.77BD � 2.33BE + 0.1300CD + 0.5258CE � 1.27DE (4)
where the adsorption parameters: adsorbent dosage, initialPb(II) concentration, initial MG concentration, pH, andtemperature are represented by A, B, C, D and E, respectively.
The analysis of variance (ANOVA) for the model analysis ofPb(II) and MG are described in Tables S10 and S11,† respec-tively. A Quadratic model for the Pb(II) uptake and a two-factorinteraction (2FI) model for the MG uptake are suggested. The
RSC Adv., 2020, 10, 15514–15522 | 15517

Fig. 3 Adsorption kinetics of (a) MG in single, (b) MG in binary, (c) Pb(II) in single and (d) Pb(II) in binary component solutions (pH: 6; adsorptiondosage 1 g L�1; temperature: 303 K).
RSC Advances Paper
Ope
n A
cces
s A
rtic
le. P
ublis
hed
on 2
0 A
pril
2020
. Dow
nloa
ded
on 3
/16/
2022
10:
31:5
0 A
M.
Thi
s ar
ticle
is li
cens
ed u
nder
a C
reat
ive
Com
mon
s A
ttrib
utio
n-N
onC
omm
erci
al 3
.0 U
npor
ted
Lic
ence
.View Article Online
positive term in the model signies synergistic effects, while thenegative sign indicates antagonistic effects on the adsorptionprocess. The R2 values for eqn (3) and (4) are 0.930 and 0.923,respectively. It shows a reasonably good agreement between thepredicted and experimental values from themodel. The differencebetween adjusted and predicted R2 values is less than 0.2 for boththe responses, which indicates that both the equations areappropriate. Adeq precision measures the signal to noise ratio as21.80 for the Pb(II) uptake and 22.89 for the MG uptake. Thisimplies sufficient adequate signals. The P value of less than 0.05indicates that the model terms are signicant and the P valuegreater than 0.10 indicates that model terms are not signicant.The F values for the developed model for the Pb(II) and MGuptakes are 18.68 and 27.20, respectively, and the P values for bothof the cases are less than 0.05, which indicates that the modelterms are signicant. Table S10† conrms that the signicantterms of the model for the Pb(II) uptake (Y1) are A, B, D, AD, BD, A
2,D2. Simultaneously, Table S11† indicates that for the MG uptake(Y2) the signicant model terms are A, B, C, D, AB, AD, BC, BE.
The plots of experimental versus predicted values for theadsorption uptake of Pb(II) and MG are shown in Fig. S10a andb,† respectively. It is observed that the predicted values are closeenough to the experimental values, which conrm the
15518 | RSC Adv., 2020, 10, 15514–15522
satisfactory correlation between the adsorption operatingparameters and the adsorption uptake of Pb(II) and MG.50,51
3.5.2 Interaction effects of different parameters on thePb(II) and MG uptake. The variation of response with twoselected parameters is represented by response surfaces 3Dplots in Fig. 5a, b and 6a–d, for Pb(II) and MG, respectively. Themaximum predicted response lies in the surface-conned in thesmallest curve of the 3D contour diagram.
3.5.3 Optimization of adsorption parameters. Themaximum adsorption of Pb(II) andMGwith the optimum valuesof operating parameters were calculated by the point predictionmethod. The adsorption experiments were further conductedwith the optimized process parameters and the comparisonbetween the predicted and experimental values are shown inTable 1. It is found that the experimental results are in quitegood agreement with the predicted results.
3.6 Thermodynamic analysis
The in-depth analysis of inherent energy changes associatedwith adsorption processes was determined by the thermody-namic analysis. The changes in the Gibbs free energy (DG0),enthalpy (DH0) and entropy (DS0) are calculated and reported inTable S12† (the equations are described in ESI Section S4†). The
This journal is © The Royal Society of Chemistry 2020
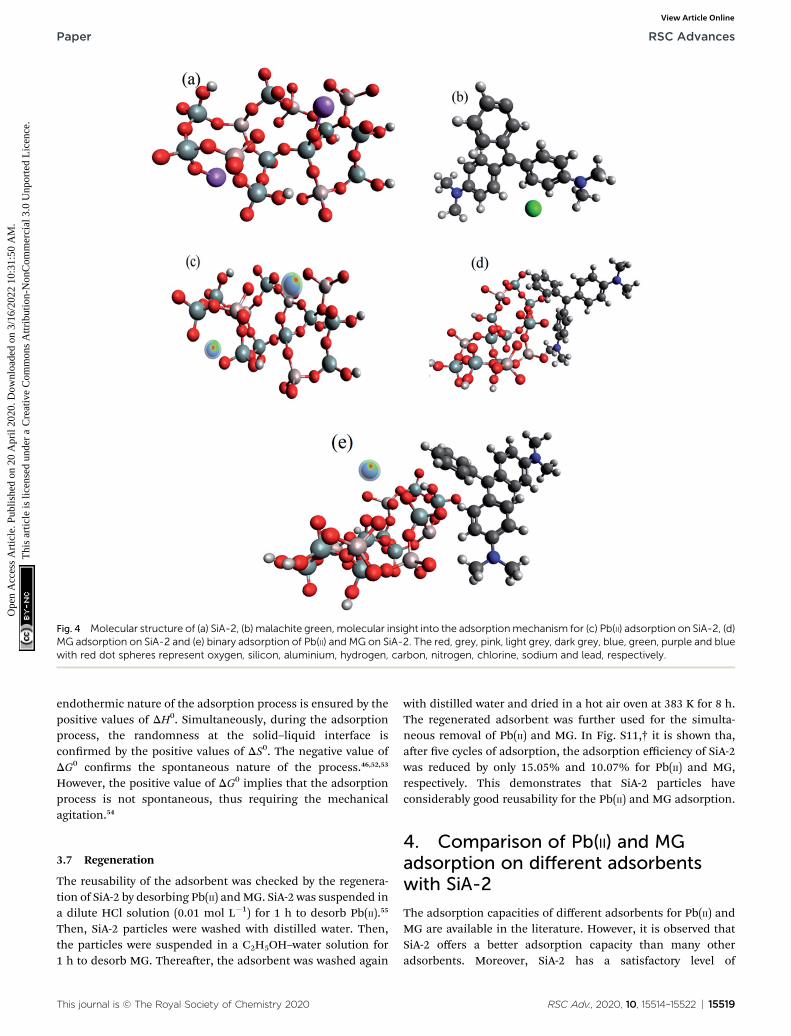
Fig. 4 Molecular structure of (a) SiA-2, (b) malachite green, molecular insight into the adsorptionmechanism for (c) Pb(II) adsorption on SiA-2, (d)MG adsorption on SiA-2 and (e) binary adsorption of Pb(II) and MG on SiA-2. The red, grey, pink, light grey, dark grey, blue, green, purple and bluewith red dot spheres represent oxygen, silicon, aluminium, hydrogen, carbon, nitrogen, chlorine, sodium and lead, respectively.
Paper RSC Advances
Ope
n A
cces
s A
rtic
le. P
ublis
hed
on 2
0 A
pril
2020
. Dow
nloa
ded
on 3
/16/
2022
10:
31:5
0 A
M.
Thi
s ar
ticle
is li
cens
ed u
nder
a C
reat
ive
Com
mon
s A
ttrib
utio
n-N
onC
omm
erci
al 3
.0 U
npor
ted
Lic
ence
.View Article Online
endothermic nature of the adsorption process is ensured by thepositive values of DH0. Simultaneously, during the adsorptionprocess, the randomness at the solid–liquid interface isconrmed by the positive values of DS0. The negative value ofDG0 conrms the spontaneous nature of the process.46,52,53
However, the positive value of DG0 implies that the adsorptionprocess is not spontaneous, thus requiring the mechanicalagitation.54
3.7 Regeneration
The reusability of the adsorbent was checked by the regenera-tion of SiA-2 by desorbing Pb(II) andMG. SiA-2 was suspended ina dilute HCl solution (0.01 mol L�1) for 1 h to desorb Pb(II).55
Then, SiA-2 particles were washed with distilled water. Then,the particles were suspended in a C2H5OH–water solution for1 h to desorb MG. Thereaer, the adsorbent was washed again
This journal is © The Royal Society of Chemistry 2020
with distilled water and dried in a hot air oven at 383 K for 8 h.The regenerated adsorbent was further used for the simulta-neous removal of Pb(II) and MG. In Fig. S11,† it is shown tha,aer ve cycles of adsorption, the adsorption efficiency of SiA-2was reduced by only 15.05% and 10.07% for Pb(II) and MG,respectively. This demonstrates that SiA-2 particles haveconsiderably good reusability for the Pb(II) and MG adsorption.
4. Comparison of Pb(II) and MGadsorption on different adsorbentswith SiA-2
The adsorption capacities of different adsorbents for Pb(II) andMG are available in the literature. However, it is observed thatSiA-2 offers a better adsorption capacity than many otheradsorbents. Moreover, SiA-2 has a satisfactory level of
RSC Adv., 2020, 10, 15514–15522 | 15519

Fig. 5 3D response plots for interaction effect of (a) the adsorbent dosage–pH (initial Pb(II) concentration: 55 mg L�1; initial MG concentration:55 mg L�1; temperature: 298 K) and (b) initial Pb(II) concentration–pH (adsorbent dosage: 1.375 g L�1; initial MG concentration 55 mg L�1;temperature: 298 K) on Pb(II) uptake.
Fig. 6 3D response plot for the interaction effect of (a) adsorbent dosage–initial Pb(II) concentration, (initial MG concentration: 55mg L�1; pH: 5;temperature: 298 K) (b) adsorbent dosage–pH (initial Pb(II) concentration: 55 mg L�1; initial MG concentration: 55 mg L�1; temperature: 298 K),(c) initial Pb(II) concentration–initial MG concentration (adsorbent dosage: 1.375 g L�1; pH: 5; temperature: 298 K) and (d) initial Pb(II) concen-tration–temperature (adsorbent dosage: 1.375 g L�1; pH: 5; initial MG concentration: 55 mg L�1) on the MG uptake.
15520 | RSC Adv., 2020, 10, 15514–15522 This journal is © The Royal Society of Chemistry 2020
RSC Advances Paper
Ope
n A
cces
s A
rtic
le. P
ublis
hed
on 2
0 A
pril
2020
. Dow
nloa
ded
on 3
/16/
2022
10:
31:5
0 A
M.
Thi
s ar
ticle
is li
cens
ed u
nder
a C
reat
ive
Com
mon
s A
ttrib
utio
n-N
onC
omm
erci
al 3
.0 U
npor
ted
Lic
ence
.View Article Online

Table 1 Optimum process variables for adsorption of Pb(II) and MG
Ada (g L�1) C0 Pb(II)b (mg L�1) C0 MG
c (mg L�1) pH Temp.d (K)
Pb(II) uptake(mg g�1)
MG uptake(mg g�1)
Pred.e Exp.f Pred.e Exp.f
1.375 55 55 5 298 38.68 38.45 34.47 34.26
a Adsorbent dosage. b Initial Pb(II) concentration. c Initial MG concentration. d Temperature. e Predicted. f Experimental.
Table 2 Comparison of the Pb(II) and MG adsorption capacity withdifferent adsorbents
Pollutant Adsorbents
Adsorptionuptake(mg g�1) Reference
Pb(II) SiA-2 326.2 Presentresearch
g-Alumina 65.67 56Al(OH)3/(PAA-co-PAM) 106.2 57HCl-treated Egyptiankaolin
34.5 58
Acid activated red mud 6.0273 59Cu-MOFs/Fe3O4 219.00 60
MG SiA-2 1655.2 Presentresearch
Cu-MOFs/Fe3O4 113.67 60Bentonite 178.6 61Copper sulde nanorodsloaded on activated carbon
47.892 62
Boron-doped mesoporouscarbon nitride
310 63
Melamine-MOF 122.0 64Magnetic graphene oxidedecorated with persimmon
560.58 65
Paper RSC Advances
Ope
n A
cces
s A
rtic
le. P
ublis
hed
on 2
0 A
pril
2020
. Dow
nloa
ded
on 3
/16/
2022
10:
31:5
0 A
M.
Thi
s ar
ticle
is li
cens
ed u
nder
a C
reat
ive
Com
mon
s A
ttrib
utio
n-N
onC
omm
erci
al 3
.0 U
npor
ted
Lic
ence
.View Article Online
reusability. The comparative study is documented in Table 2 forPb(II) and MG adsorption.
5. Conclusion
In this study, a novel methodology is proposed for the synthesis ofa mesoporous alumina–silica nano-sorbent from coal y ash anda waste aluminium foil. The in-depth characterizations of the nano-sorbent conrm the drastic changes in surface area, pore structure,pore volume, morphology and crystalline structure, which facilitateits adsorption capacity. The nano-adsorbent is successfully utilizedto remove the toxic pollutants, namely Pb(II) andMG, from single tomulti-component solutions. The as-synthesized nano-adsorbenthas an excellent adsorption capacity and reusability. The natureof adsorption is investigated by analysing the equilibrium adsorp-tion isotherms and adsorption kinetics. The resemblance to theLangmuir isotherm model enlightens the monolayer adsorptionmechanism; however, the nature of adsorption kinetics suggeststhat the process is affected by both the chemisorption and physicaladsorption. Simultaneously, the applicability of the intra-particlediffusion model conrms the multiple steps of adsorption.Besides, the endothermic nature of the adsorption process is
This journal is © The Royal Society of Chemistry 2020
conrmed by the negative values of enthalpy change via a detailedthermodynamic analysis. Moreover, RSM is employed to decide theoptimumoperating parameters for the adsorption of noxious heavymetal and dye from the binary solutions. The as-synthesized nano-sorbent has exhibited high adsorption capacities for both lead andmalachite green as (1) for single component 326.2 and 1655.2 mgg�1, respectively, and (2) for binary components 615.86 and445.03 mg g�1, respectively. More importantly, the observedadsorption capacities of the as-synthesized adsorbent for the con-cerned pollutants are reasonably higher than those reported in theliterature. This apart, the as-synthesized adsorbent shows 15.05%and 10.07% reduction in adsorption capacity aer ve cycles ofreuse for Pb(II) and MG, respectively. These observations haveattested the effective and economical nature of the adsorbent,which has a potential application in treating industrial wastewater.
Conflicts of interest
There are no conicts to declare.
References
1 D. Shen, J. Fan, W. Zhou, B. Gao, Q. Yue and Q. Kang, J.Hazard. Mater., 2009, 172, 99–107.
2 L. Zou, P. Shao, K. Zhang, L. Yang, D. You, H. Shi,S. G. Pavlostathis, W. Lai, D. Liang and X. Luo, Chem. Eng.J., 2019, 364, 160–166.
3 F. Ding, M. Gao, T. Shen, H. Zeng and Y. Xiang, Chem. Eng. J.,2018, 349, 388–396.
4 T. Brudey, L. Largitte, C. Jean-Marius, T. Tant,P. C. Dumesnil and P. Lodewyckx, J. Anal. Appl. Pyrolysis,2016, 120, 450–463.
5 M. J. Pirouz, M. H. Beyki and F. Shemirani, Food Chem., 2015,170, 131–137.
6 P. S. De Velasco Maldonado, V. Hernandez-Montoya,A. Concheso and M. A. Montes-Moran, Appl. Surf. Sci.,2016, 386, 381–388.
7 H. Zhang, F. Zhang and Q. Huang, RSC Adv., 2017, 7, 5790–5799.
8 B. Ekka, S. R. Nayak, P. Dash and R. K. Patel, AIP Conf. Proc.,2016, 1724, 020011.
9 M. Guner and O. Yucel, J. Appl. Sci., 2005, 5, 1843–1849.10 P. Asse, M. Ghaedi, A. Ansari, M. H. Habibi and
M. S. Momeni, J. Ind. Eng. Chem., 2014, 20, 2905–2913.11 J. R. De Andrade, M. F. Oliveira, M. G. C. Da Silva and
M. G. A. Vieira, Ind. Eng. Chem. Res., 2018, 57, 3103–3127.12 P. Saha, S. Chowdhury, S. Gupta and I. Kumar, Chem. Eng. J.,
2010, 165, 874–882.
RSC Adv., 2020, 10, 15514–15522 | 15521

RSC Advances Paper
Ope
n A
cces
s A
rtic
le. P
ublis
hed
on 2
0 A
pril
2020
. Dow
nloa
ded
on 3
/16/
2022
10:
31:5
0 A
M.
Thi
s ar
ticle
is li
cens
ed u
nder
a C
reat
ive
Com
mon
s A
ttrib
utio
n-N
onC
omm
erci
al 3
.0 U
npor
ted
Lic
ence
.View Article Online
13 J. Ma, F. Li, T. Qian, H. Liu, W. Liu and D. Zhao, Chem. Eng.J., 2017, 315, 191–200.
14 Y. Liu, Q. Gao, S. Pu, H. Wang, K. Xia, B. Han and C. Zhou,Colloids Surf., A, 2019, 568, 391–401.
15 J. Liu, Y. Wang, Y. Fang, T. Mwamulima, S. Song andC. Peng, J. Mol. Liq., 2018, 250, 468–476.
16 E. Pehlivan, T. Altun and S. Parlayici, Food Chem., 2012, 135,2229–2234.
17 K. G. Bhattacharyya, J. Sarma and A. Sarma, J. Hazard.Mater., 2009, 165, 271–278.
18 I. Anastopoulos, I. Pashalidis, A. Hosseini-Bandegharaei,D. A. Giannakoudakis, A. Robalds, M. Usman,L. B. Escudero, Y. Zhou, J. C. Colmenares, A. Nunez-Delgado and E. C. Lima, J. Mol. Liq., 2019, 295, 1–17.
19 C. L. Chen, X. K. Wang and M. Nagatsu, Environ. Sci.Technol., 2009, 43, 2362–2367.
20 A. E. Rider, K. Ostrikov and S. A. Furman, Aust. Phys., 2013,50, 162–165.
21 H. Abd El-Azim, M. M. El-Sayed Seleman and E. M. Saad, J.Environ. Chem. Eng., 2019, 7, 102915.
22 A. Bhatnagar and A. K. Jain, J. Colloid Interface Sci., 2005, 281,49–55.
23 A. Bhatnagar, A. K. Jain, A. K. Minocha and S. Singh, Sep. Sci.Technol., 2006, 41, 1881–1892.
24 A. Bhatnagar, J. Hazard. Mater., 2007, 139, 93–102.25 X. Li, M. Ji, L. D. Nghiem, Y. Zhao, D. Liu, Y. Yang, Q. Wang,
Q. T. Trinh, D.-V. N. Vo, V. Q. Pham and N. H. Tran, J. Mol.Liq., 2019, 112286.
26 Z. T. Yao, M. S. Xia, P. K. Sarker and T. Chen, Fuel, 2014, 120,74–85.
27 M. Erol, S. Kuçukbayrak and A. Ersoy-Meriçboyu, J. Hazard.Mater., 2008, 153, 418–425.
28 H. Lee, H. S. Ha, C. H. Lee, Y. B. Lee and P. J. Kim, Bioresour.Technol., 2006, 97, 1490–1497.
29 F. Arroyo, N. Perez Camacho, P. Coca and C. Fernandez-Pereira III, World Coal Ash, Conf. Proc., 2009, 1–13.
30 W. Feng, Z. Wan, J. Daniels, Z. Li, G. Xiao, J. Yu, D. Xu,H. Guo, D. Zhang, E. F. May and G. Li, J. Cleaner Prod.,2018, 202, 390–400.
31 D. Jain, C. Khatri and A. Rani, Fuel Process. Technol., 2010,91, 1015–1021.
32 M. Karanac, M. Đolic, Đ. Veljovic, V. Rajakovic-Ognjanovic,Z. Velickovic, V. Pavicevic and A. Marinkovic, WasteManag., 2018, 78, 366–378.
33 G. H. Bai, W. Teng, X. G. Wang, J. G. Qin, P. Xu and P. C. Li,Trans. Nonferrous Met. Soc. China, 2010, 20, s169–s175.
34 A. Chatterjee, J. K. Basu and A. K. Jana, Powder Technol.,2019, 354, 792–803.
35 M. Roosta, M. Ghaedi and M. Mohammadi, Powder Technol.,2014, 267, 134–144.
36 M. Roosta, M. Ghaedi, N. Shokri, A. Daneshfar, R. Sahraeiand A. Asghari, Spectrochim. Acta, Part A, 2014, 118, 55–65.
37 N. Zainudin, K. Lee, A. Kamaruddin, S. Bhatia andA. Mohamed, Sep. Purif. Technol., 2005, 45, 50–60.
38 A. V. Palodkar, K. Anupam, S. Banerjee and G. Halder,Environ. Prog. Sustainable Energy, 2017, 36, 1597–1611.
15522 | RSC Adv., 2020, 10, 15514–15522
39 L. Zhang, H. Zhang, W. Guo and Y. Tian, Appl. Clay Sci.,2014, 93–94, 85–93.
40 A. Ozer, G. Akkaya and M. Turabik, Dyes Pigm., 2006, 71, 83–89.
41 H. Mazaheri, M. Ghaedi, A. Asfaram and S. Hajati, J. Mol.Liq., 2016, 219, 667–676.
42 S. Deng and Y. P. Ting, Langmuir, 2005, 21, 5940–5948.43 N. M. Mahmoodi, B. Hayati and M. Arami, J. Chem. Eng.
Data, 2010, 55, 4638–4649.44 S. Wang and E. Ariyanto, J. Colloid Interface Sci., 2007, 314,
25–31.45 E. Erdem, N. Karapinar and R. Donat, J. Colloid Interface Sci.,
2004, 280, 309–314.46 Q. Song, Y. Fang, Z. Liu, L. Li, Y. Wang, J. Liang, Y. Huang,
J. Lin and L. Hu, Chem. Eng. J., 2017, 325, 71–79.47 Y. Sun, S. Yang, Y. Chen, C. Ding, W. Cheng and X. Wang,
Environ. Sci. Technol., 2015, 49, 4255–4262.48 J. Lan, D. Cao, W. Wang and B. Smit, ACS Nano, 2010, 4,
4225–4237.49 S. Kerisit and C. Liu, Environ. Sci. Technol., 2014, 48, 3899–
3907.50 J. N. Sahu, J. Acharya and B. C. Meikap, J. Hazard. Mater.,
2009, 172, 818–825.51 K. Mahalik, J. N. Sahu, A. V. Patwardhan and B. C. Meikap, J.
Hazard. Mater., 2010, 182, 603–610.52 Y. Liu, C. Yan, Z. Zhang, H. Wang, S. Zhou, W. Zhou,
H. Wang, Y. Liu, W. Zhou, Z. Zhang, C. Yan, Z. Zhang,H. Wang, S. Zhou and W. Zhou, Fuel, 2016, 185, 181–189.
53 Y. Liu, J. Chem. Eng. Data, 2009, 54, 1981–1985.54 R. M. Ali, H. A. Hamad, M. M. Hussein and G. F. Malash,
Ecol. Eng., 2016, 91, 317–332.55 M. A. Khan, M. Otero, M. Kazi, A. A. Alqadami,
S. M. Wabaidur, M. R. Siddiqui, Z. A. Alothman andS. Sumbul, J. Hazard. Mater., 2019, 365, 759–770.
56 A. Bhat, G. B. Megeri, C. Thomas, H. Bhargava, C. Jeevitha,S. Chandrashekar and G. M. M. Madhu, J. Environ. Chem.Eng., 2015, 3, 30–39.
57 Q. Zhao, L. Ren, H. Zhou, T. Cao and P. Chen, Chem. Emg. J.,2014, 250, 6–13.
58 S. A. Drweesh, N. A. Fathy, M. A. Wahba, A. A. Hanna,A. I. M. Akarish, E. A. M. Elzahany, I. Y. El-sherif andK. S. Abou-el-sherbini, Biochem. Pharmacol., 2016, 4, 1674–1684.
59 M. K. Sahu, S. Mandal, S. S. Dash, P. Badhai and R. K. Patel,J. Environ. Chem. Eng., 2013, 1, 1315–1324.
60 Z. Shi, C. Xu, H. Guan, L. Li, L. Fan, Y. Wang and L. Liu,Colloids Surf., A, 2018, 539, 382–390.
61 S. Ayhan, E. Bulut, M. Ozacar and I. A. Sengil, MicroporousMesoporous Mater., 2008, 115, 234–246.
62 E. Sharifpour, H. Zare, M. Ghaedi and A. Asfaram, Ultrason.Sonochem., 2018, 40, 373–382.
63 E. B. Azimi, A. Badiei and J. B. Ghasemi, Appl. Surf. Sci., 2019,469, 236–245.
64 N. Yin, K. Wang, Y. Xia and Z. Li, Desalination, 2018, 430,120–127.
65 M. Gao, Z. Wang, C. Yang, J. Ning, Z. Zhou and G. Li, ColloidsSurf., A, 2019, 566, 48–57.
This journal is © The Royal Society of Chemistry 2020