insights from givenow data analysis 2001– · pdf fileinsights . from givenow data...
TRANSCRIPT

INSIGHTS FROM GIVENOW DATA ANALYSIS 2001–2016By Joost Van Der Linden | Data Scientist, Our Community


List of figures 4List of tables 6Definitions 7Introduction 9At a glance: GiveNow insights 10 Background 17Donations 20Causes 36Interest areas 38Gender 42Location 48About the author 59Acknowledgments 59About GiveNow 60About Our Community 61

Figure 1: Individual donations over time 20
Figure 2: Number of donations per amount (up to $100) 21
Figure 3: One-off versus regular donations over time 25
Figure 4: Changes in preferred suggested amount over time 26
Figure 5: Number of recurrences of every regular donation amount 27
Figure 6: Lifetime value per regular donation 28
Figure 7: Average donation per month and per year, for donations $1,000 and under 29
Figure 8: Average donation per month 30
Figure 9: Average value of one-off donations by days of the week 32
Figure 10: Number of one-off donations per day of the week, as percentage 33
Figure 11: One-off donations of $1,000 and under, per hour 34
Figure 12: Percentage of one-off donations made in every hour of the week 35
Figure 13: Total amount raised per cause and number of donations to that cause 36
Figure 14: Donations by interest area 394

Figure 15: Annual donations to the five most popular interest areas, as a percentage of all donations to those areas 40
Figure 16: Number and average value of donations, by gender 42
Figure 17: Total donations by gender and donation type 43
Figure 18: Annual donations by gender and donation type, as a percentage of all donations 44
Figure 19: Percentage of donations per interest area, divided by gender 46
Figure 20: Average donation versus median taxable income by postcode 48
Figure 21: “Heatmap” of GiveNow donations by donor postcode 51
Figure 22: Melbourne heatmap: number of donations as a percentage of state total 52
Figure 23: Sydney heatmap: number of donations as a percentage of state total 53
Figure 24: Brisbane heatmap: number of donations as a percentage of state total 54
Figure 25: Adelaide heatmap: number of donations as a percentage of state total 55
Figure 26: Perth heatmap: number of donations as a percentage of state total 56
Figure 27: Canberra heatmap: number of donations as a percentage of state total 57
Figure 28: Hobart heatmap: number of donations as a percentage of state total 58
5

Table 1: Top five most popular donation amounts 22
Table 2: Average donation value for one-off and regular donations 23
Table 3: Average donation per month 30
Table 4: Mean and median donations per cause 37
Table 5: Most generous postcodes on GiveNow 49
Table 6: Top 10 suburbs by per-capita average donation value 50
Table 7: Top five Vic suburbs by percentage of donations in the state 52
Table 8: Top five NSW suburbs by percentage of donations in the state 53
Table 9: Top five Qld suburbs and cities by percentage of donations in the state 54
Table 10: Top five SA suburbs and cities by percentage of donations in the state 55
Table 11: Top five WA suburbs and towns by percentage of donations in the state 56
Table 12: Top five ACT suburbs by percentage of donations in the territory 57
Table 13: Top five Tas suburbs by percentage of donations in the state 58
6

DEFINITIONSTerm DefinitionGIVENOW An online donations platform, www.givenow.com.au
OUR COMMUNITY The organisation behind GiveNow, www.ourcommunity.com.au
USER A person who makes a donation through GiveNow, i.e. a donor
ORGANISATION A not-for-profit organisation that has listed one or more causes on GiveNow (e.g. Springfield Animal Welfare Coalition)
CAUSE A specific cause, program or campaign, listed by an organisation, that users can donate to (e.g. Springfield Home for Lost Dogs)
INTEREST AREA The subject or focus of a cause (e.g. animal welfare)
ONE-OFF DONATION
A single, one-off donation
REGULAR DONATION
A periodic donation, repeated each month for a duration set by the user (can be indefinite)
MYGIVING A facility available to registered users whereby they can see their donation history and manage their regular donations
PARAMETERSThis report is a study of the behaviour of GiveNow users. To extrapolate the findings to all donors in Australia would require first identifying a core sample representative of the entire Australian donor population in terms of age and other variables. GiveNow doesn’t currently collect data on the age of users.
PRIVACYGiveNow respects the privacy of donors and organisations and does not share data except for the purposes outlined in its privacy policy. This report and analysis do not identify any individual organisations or donors. To read GiveNow’s privacy policy, go to www.ourcommunity.com.au/general/general_article.jsp?articleId=2161.
7

8 Who Gives? Insights from GiveNow Data Analysis 2001–2016
Introduction
GiveNow is Australia’s first online donations platform and its only commission-free service. Since its establishment in 2001, GiveNow has raised almost $70 million from over 600,000 donors for more than 3,500 causes across the country.Consequently, GiveNow holds a trove of data about donors, donations and causes. Now, for the first time, Our Community has undertaken a groundbreaking analysis of this data and is uniquely placed to share insights into donor behaviour that have never before been understood. This study represents the Australian community sector’s first ever access to such extensive, rigorous data analysis.
We set out to examine five key areas of donor behaviour and characteristics:
DonationsDo donors prefer to give one-off donations or regular donations? What donation amounts are the most popular? In what months, days and hours do users donate the most?
CausesThe number and value of donations to any particular cause is a product of that cause’s general popularity, visibility and geographical location. What can we learn from examining causes?
Interest areasAnimal welfare, disaster relief, health and wellness – do certain interest areas attract more donations? How has this changed over time?
GenderWhat are the donation habits of men and women? Who donates the most, and to what interest areas?
LocationWhere do the most generous donors come from? What’s the relationship between donor behaviour and donor income?
MORE INFORMATIONIf you have any queries about the data used in this report, please get in touch with the author, Joost Van Der Linden: [email protected].
For general queries about GiveNow, please contact us by email ([email protected]) or telephone (03 9320 6848).
9Who Gives? Insights from GiveNow Data Analysis 2001–2016

at a glanceWith this report we aim to shine a light on the trends shaping online fundraising in Australia.
We want not-for-profit organisations to apply our key findings to shape their fundraising strategy, to strengthen their financial position, and ultimately to help them to fulfil their mission.
Regular giving
popular formdonations as the most
In
20
12
regular monthly donations overtook one-off
of giving on GiveNow.
is growing in popularity.
The most popular
popular form
regular monthly donations type of donation
is the
$25 donation.monthlyregular
10 Who Gives? Insights from GiveNow Data Analysis 2001–2016

type of donationA one-off donation IS WORTHMORE THAN A REGULAR DONATION
That is, on average, the value of a ($205)
$25 donation.monthly is higher than the value of
a single transactionthat is part of a($43) REGULAR Monthly
one-off donation
donation.
they maintain the($205)When donors sign up
to make regular
1monthly donations,
commitment on average
5ye
arfor just
mo
nt
hs
&over11Who Gives? Insights from GiveNow Data Analysis 2001–2016

JUL AUG SEP OCT NOV DECJUNMAY$789The number and value of one-off
see huge spikes in donor activitYJUNE and December
This is true for big gifts
donations peak at the end of the financial yearand during the Christmas season.
($1,000-plus)as well as small ones (under $100)
over its lifespan IS
the average5
The average total value of a regular donation
$789
donation $205one-off
This is far more VALUABLE THAN
12 Who Gives? Insights from GiveNow Data Analysis 2001–2016

The busiest time for GiveNow
is 11am–4pm
Monday is the most
Monday to Thursday
this is when thelucrative day:
of donationsis highest.
average value
10YEARS
is 11am–4pm Giving is not keeping
The annual averagepace with inflation.
significantly IN
value of donationshas not changed
13Who Gives? Insights from GiveNow Data Analysis 2001–2016

men donate roughlyARTS & CULTURE
Women make more donations than men.
However, men donate
larger amounts.
equalamounts.
As a result, women and
has not changed
The typical donation varies a lot from one interest area to the next.
For example,
Whilecauses small donations.
receive many
but they tend to be
few donations,receive RELATIVELY
much higher in value.
animal welfare
ARTS & CULTURE
14 Who Gives? Insights from GiveNow Data Analysis 2001–2016

we find that women
If we look atone-off donations,
we find that men donatemore in total than women.
If we look at regular donations,
donate morein totalthan men.Of our 22 interest areas, most are
More men than women donate to:The reverse is true for only a few interest areas.
far more popular with women than with men.
scholarshipsEducation&Emergency
& safety
Gay & lesbian causes recreation
Sport &technology
Science &
Youth
15Who Gives? Insights from GiveNow Data Analysis 2001–2016

On the whole, people from wealthy areas don’t necessarily give more than people from poor areas.
High-income postcodes do not
That is, there is a wide spread in the
relationship betweenmedian income andaverage donation.
necessarily show a high average donation,
and low-income areas do notnecessarily show alow average donation.
16 Who Gives? Insights from GiveNow Data Analysis 2001–2016

BackgroundGiveNow is an online giving platform that connects donors with causes. Organisations list causes that users can view and donate to. After choosing a cause, a user is given the following donation options:
Donation data User data Cause data Organisation data
Time and date Suburb Name Name
Amount Postcode Interest area ABN
Cause State Description Postcode
One-off or regular Country Status (open or closed)
Suburb
Name prefix Postcode Country
Suburb URL
Country
Date listed
Furthermore, users choose between making a one-off donation, and making a regular monthly donation for a duration of their choice. Users are then forwarded to a page that asks for payment details.
Users with a GiveNow account can manage regular donations and view their donation history via the MyGiving facility.
DATA SUMMARYEvery donation made and cause listed on GiveNow is recorded in a database. The database contains the following information:
17Who Gives? Insights from GiveNow Data Analysis 2001–2016

MARCH 7, 2001Earliest recorded donation
582,851Total number of donations
3,919Total number of causes
Most recent donation used in this analysis
August 22, 2016
Total number of unique users
187,634$66,904,602.58Total amount donated
Highest recorded donation$200,000
Most common one-off donation
$50Most common regular donation
$25of a one-off
$205donation
Averageamount
QUICK STATISTICS
18 Who Gives? Insights from GiveNow Data Analysis 2001–2016

Suburb with the
Month with the most donationsJUNE
Average recurrence ofregular monthly donations
17.5 times
Most popular day for one-off donationsThursdayMost popular hourfor donating
11AM
Interest areawith the largest amount raisedHealth& wellbeing
Interest area with the highestaverage donation
Arts
averagedonation
& culture
highest per-capita
Sydney,NSW
19Who Gives? Insights from GiveNow Data Analysis 2001–2016

DonationsDONATIONS OVER TIMEWe wanted to obtain an overview of GiveNow donations over time. GiveNow processed a total of 582,851 donations between March 7, 2001 and August 22, 2016. In Figure 1 the value of every donation is plotted against time. Note that the vertical axis follows a logarithmic scale, in order to capture the full range of observations.
The density of the dots increases over time. This indicates increasing user activity, particularly in the $10–100 range.
The horizontal lines reflect donation amounts that are particularly popular, such as $10, $100 and $1,000.
The vertical lines coincide with periods of increased donation activity, such as the Indian Ocean earthquake and tsunami appeal (late 2004 and early 2005) and the repeated occurrence of the end of the tax year in June.
Figure 1: Individual donations over time
2001 2003 2005 2007 2009 2011 2013 2015 2017
$10
$100Don
atio
n in
AU
D
$1,000
$10,000
$100,000
$1
20 Who Gives? Insights from GiveNow Data Analysis 2001–2016

WHAT ARE THE MOST POPULAR DONATION AMOUNTS?Nearly 90% of all donations are of $100 or less. Not surprisingly, the suggested amounts of $25, $50 and $100 are most frequently chosen in this range, as shown in Figure 2.
Less than 4% of all donations are in the range $51–99, and the most popular manually entered “other” amounts do not fall into this range either. Rather, they are $10, $20, $30 and $40.
Figure 2: Number of donations per amount (up to $100)
$0 $10 $20 $30 $40 $50 $60 $70 $80 $90 $100
120,000 –
100,000 –
80,000 –
60,000 –
40,000 –
20,000 –
0
Freq
uenc
y
Amount in AUD
Suggested amounts matter! Ongoing research at Our Community is aimed at optimising these suggested amounts. If the suggestions are too high, users may be turned off. If the suggestions are too low, money may be left on the table. What we do see is an opportunity to suggest donation amounts between $50 and $100.
insight
21Who Gives? Insights from GiveNow Data Analysis 2001–2016

REGULAR VERSUS ONE-OFF DONATIONSTable 1 shows the top five most popular donations, distinguishing between one-off and regular donations, as well as between suggested and ‘other’ amounts.
The most popular one-off donation is $50, closely followed by $100. Other amounts for one-off donations include both above-average ($200, $250) and below-average ($10, $20, $30) donations.
By far the most popular regular donation is $25. The top 5 for regular donations shows that the larger the suggested amount, the less frequently this amount is chosen. All top five “other amounts” chosen for regular donations are below $50.
One
-off
don
atio
nsRe
gula
r don
atio
ns
Suggested amounts Other amounts
Top 5 donations Frequency Top 5 donations Frequency
$50 56,627 $200 14,122
$100 54,480 $20 10,629
$25 33,272 $10 10,621
$500 12,122 $250 6,920
$1,000 6,528 $30 5,488
Total for top 5: 163,029 Total for top 5: 47,780
Top 5 donations Frequency Top 5 donations Frequency
$25 86,025 $10 37,467
$50 58,482 $20 35,557
$100 21,638 $30 18,798
$500 466 $15 12,813
$1,000 437 $40 11,500
Total for top 5: 167,048 Total for top 5: 116,135
Total
% all donations
330,077
56.6%
Total
% all donations
163,915
28.1%
Table 1: Top five most popular donation amounts
22 Who Gives? Insights from GiveNow Data Analysis 2001–2016

Table 1 shows us that regular donations are more popular than one-off donations. The amounts donated as regular donations, however, are generally lower than the amounts donated as one-off. This leads to the question: how do the four categories compare in terms of average donation and total amount donated? Table 2 provides the data.
No. of donations
Average donation
Total amount
One-off donations
Suggested amounts 163,029 $133 $21,700,150
Other amounts 95,711 $326 $31,243,763
Sub-total 258,740 $205 $52,943,912
Regular donations
Suggested amounts 167,048 $47 $7,908,525
Other amounts 157,063 $39 $6,052,165
Sub-total 324,111 $43 $13,960,690
Total 582,851 $115 $66,904,602
Table 2: Average donation value for one-off and regular donations
For one-off donations, suggested amounts heavily influence the donor’s decision on how much to donate. The influence is slightly less for regular donations.
insight
23Who Gives? Insights from GiveNow Data Analysis 2001–2016

Considering the differences between one-off and regular donations, the total number of regular donations is larger than the total number of one-off donations (324,11 versus 258,740, respectively). The average regular donation, on the other hand, is much smaller than the average one-off donation. As a result, even though regular donations are more frequent, the total value of one-off donations is much higher than the total value of regular donations: $53 million versus $14 million, respectively.
SUGGESTED AMOUNTS VERSUS OTHER AMOUNTS Table 2 shows that overall, “suggested amounts” are more popular with users than “other amount”, and they are particularly popular with one-off donors.
For regular donations, users choose “other amount” to enter small amounts under $50, resulting in a low average donation ($39). One-off donations of “other amount”, on the other hand, include higher amounts ($200 and $250) as popular choices. Moreover, high-end donors use “other amount” for donations over $1,000, further skewing the average upwards.
THE EFFECT OF LARGE DONATIONSTable 2 may give the impression that one-off donations are much more lucrative for causes than regular donations. However, this result is shaped by the fact that large donations are more likely to be one-off than regular. Only 2% of all donations are $1,000 or higher, yet, taken together, these donations make up almost 40% of the total amount donated on GiveNow. The vast majority of $1,000-plus donations (96%) are one-off donations. The total amount donated via one-off donations ($53 million) ends up much higher than the total amount donated via regular donations ($14 million).
On average, one-off donations are higher in value but less numerous than regular donations. Regular donations are lower in value but more numerous. Only 2% of donations are $1,000 or higher, but they are highly lucrative for the organisations that manage to attract them.
It’s also instructive to compare the value of the average one-off donation ($205) to the average lifetime value of a regular donation ($789). For more on this, see page 28.
insight
24 Who Gives? Insights from GiveNow Data Analysis 2001–2016

Regular donations are more numerous than one-off donations for most months, with two exceptions. At the end of the tax year (in June) one-off donations spike and overtake regular donations. The holiday season in December sees another spike in one-off donations. Overall, the proportion of regular donations has trended slightly upwards year to year since 2012.
ONE-OFF VERSUS REGULAR DONATIONS OVER TIME The popularity of one-off and regular donations varies from month to month, as shown in Figure 3 for the period 2012–2015.
Figure 3: One-off versus regular donations over time
One-off donations spike in June and December. Organisations can use this knowledge to their advantage by specifically soliciting one-off donations during these months.
insight
Jan2012
Jan2013
Jan2014
Jan2015
Jul Jul Jul Jul
100%
80%
60%
40%
20%
0%
Perc
enta
ge %
One-off donations Regular donations
25Who Gives? Insights from GiveNow Data Analysis 2001–2016

2006 2008 2010 2012 2014 2016
60%
50%
40%
30%
20%
10%
0%
Perc
enta
ge %
Suggested amount
$500$100$50$25 $1,000
CHANGES IN PREFERRED SUGGESTED AMOUNT OVER TIME In line with the increased popularity of regular donations over the past four years, the most popular suggested donation has gone down from $50 to $25 in the same period.
Further investigation reveals that most of the increase in the proportion of $25 donations stems from regular donations. The share of $50, $500 and $1,000 donations has remained approximately constant, while the share of $100 donations has decreased since 2009.
Figure 4: Changes in preferred suggested amount over time
Over the past four years, the small, regular donation of $25 has become more popular than any other donation type.
insight
26 Who Gives? Insights from GiveNow Data Analysis 2001–2016

$10,000
$1,000
$100
$10
$1Recu
rrin
g do
nati
on in
AU
D
Number of recurrences
1 25 50 75 100 125
Med
ian
Mea
n
–1 The vertical axis in Figure 5 is logarithmic to incorporate all observations. Darker dots indicate a higher frequency.
FOR HOW LONG DO REGULAR DONORS DONATE? Regular donations have the benefit of providing a steady income stream for organisations. So just how steady is “steady”? For how long do regular donors remain committed?
“Finished” regular donations on GiveNow are repeated, on average, 17.5 times. In other words, the average lifespan of a “finished” donation is just over one year and five months. (We regard a regular donation as “finished” if it is no longer being made.)
For organisations looking for donors willing to make a long-term regular commitment, one year and five months might seem like a fairly short time. However, it is important to note that of all the regular donations that have ever been started on GiveNow, only 38% of them have finished. In other words, 62% of them are ongoing. What’s more, regular giving on GiveNow is increasing in popularity, and a lot of these ongoing donations were started relatively recently.
The length and total value of the 9,922 ongoing regular donations cannot (yet) be determined. Among these ongoing regular donations there are many long-running donations that would increase the average lifespan and value of regular donations if they finished today and were included in the calculations.
Figure 5 provides an overview of all “finished” regular donations.
Note that some users who make regular donations adjust the amount of their donation from time to time. The data in Figure 5 assumes that adjusting the amount of the regular donation (which happened 1,717 times) “resets” the counter for the number of recurrences.
As shown, 91% of unadjusted regular donations are repeated 50 times or less and have a value between $10 and $100 per month.
Figure 5: Number of recurrences of every regular donation amount
27Who Gives? Insights from GiveNow Data Analysis 2001–2016
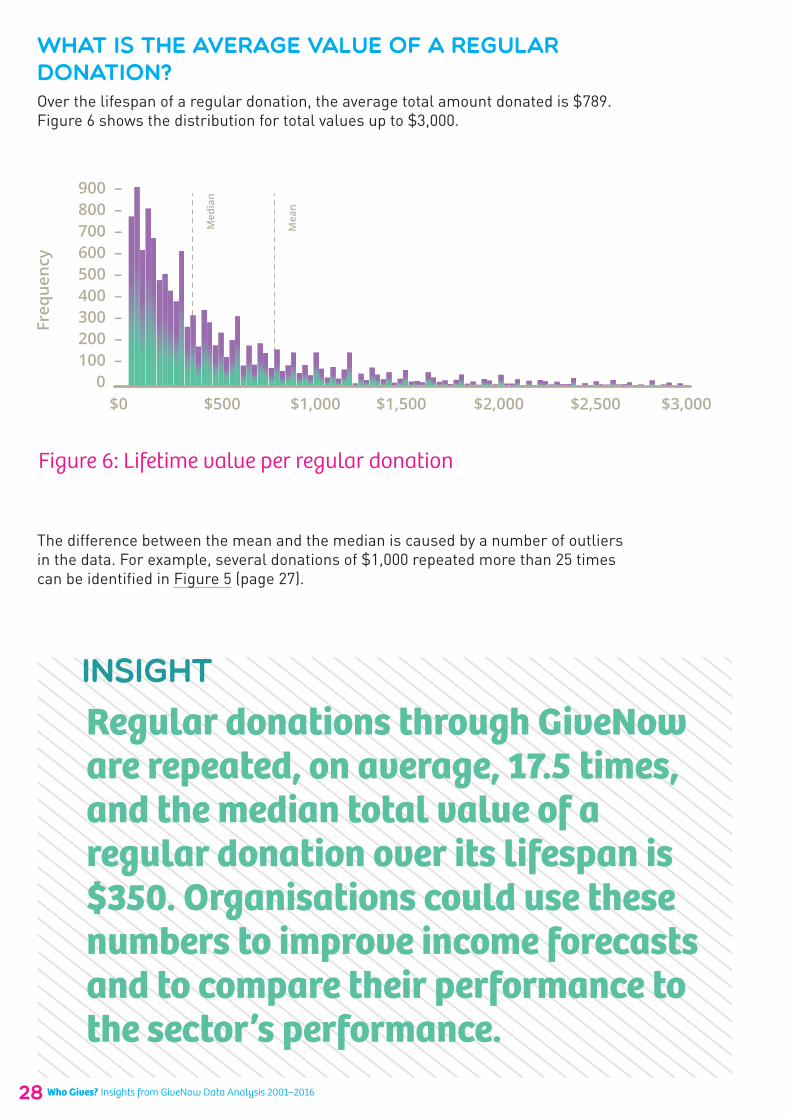
WHAT IS THE AVERAGE VALUE OF A REGULAR DONATION? Over the lifespan of a regular donation, the average total amount donated is $789. Figure 6 shows the distribution for total values up to $3,000.
The difference between the mean and the median is caused by a number of outliers in the data. For example, several donations of $1,000 repeated more than 25 times can be identified in Figure 5 (page 27).
$0 $500 $1,000 $1,500 $2,000 $2,500 $3,000
900 –800 –700 –600 –500 –400 –300 –200 –100 –
0
Freq
uenc
y
Total value in AUD
Med
ian
Mea
n
2006 2007 2008 2009 2010 2011 2012 2013 2014 2015 2016
$150
$125
$100
$75
$50Aver
age
dona
tion
in A
UD
Monthly average Yearly average
Figure 6: Lifetime value per regular donation
Regular donations through GiveNow are repeated, on average, 17.5 times, and the median total value of a regular donation over its lifespan is $350. Organisations could use these numbers to improve income forecasts and to compare their performance to the sector’s performance.
insight
28 Who Gives? Insights from GiveNow Data Analysis 2001–2016

HOW HAS THE AVERAGE DONATION CHANGED OVER TIME? The short answer: it hasn’t, much.
Since 2006, GiveNow has processed enough donations to calculate a fairly accurate estimate of the average donation. The yearly trend is shown in Figure 7. Only donations of $1,000 and under (98% of all donations) are considered, to reduce the impact of outliers. The yearly averages, up to 2015, are plotted on January 1 and connected by the dashed green line.
The monthly average donation is subject to strong seasonality, with a large peak in June and a small peak in December. The end of the financial year and the holiday season, respectively, tend to attract higher donations (and more one-off donations, as shown in Figure 3 on page 25).
The yearly average shows little to no trend, indicating that the average donation on GiveNow is not changing over the long term. The 2009 increase can be attributed to the 2009 Victorian bushfire appeal, which received the highest average donation of all causes (with at least 100 donations) in the last 15 years.
2006 2007 2008 2009 2010 2011 2012 2013 2014 2015 2016
$150
$125
$100
$75
$50Aver
age
dona
tion
in A
UD
Monthly average Yearly average
Figure 7: Average donation per month and per year, for donations $1,000 and under
29Who Gives? Insights from GiveNow Data Analysis 2001–2016

HOW DO DONATIONS VARY BY MONTH? Any organisation that doesn’t spruik hard for end-of-financial-year donations is doing itself a disservice, because June is the most lucrative month on GiveNow.
In Figure 8, donations are averaged over the years 2006–2015 for every month, to obtain an average donation per month.
The June and December peaks first shown in Figure 7 (page 25) are clearly visible. July sees the lowest average donation, following the end of the tax year. The same conclusions hold true for small donations considered in isolation, as shown in Figure 8, above, and in Table 3, below.
Donations $1,000 and under
Donations $100 and under
All donations
Jan Feb Mar Apr May Jun Jul Aug Sep Oct Nov Dec
$250 –
$200 –
$150 –
$100 –
$50 –
$0 Aver
age
dona
tion
in A
UD
Figure 8: Average donation per month
Overall average for 2006 - 2015
June average
July average
All donations $111 $217 $83
Donations $1,000 and under $81 $133 $65
Donations $100 and under $42 $50 $40
Table 3: Average donation per month
30 Who Gives? Insights from GiveNow Data Analysis 2001–2016

Overall average for 2006 - 2015
June average
July average
All donations $111 $217 $83
Donations $1,000 and under $81 $133 $65
Donations $100 and under $42 $50 $40
For all donations, the June average is more than double the overall monthly average. For donations of $1,000 and under the June average is 70% higher than the overall average, and for donations of $100 and under, the difference is a small but significant 18%. In all donation size-brackets, July sees the lowest average donations.
The average number of donations per month, not shown here, follows the same trend as the average donation value per month, with the largest donation volume occurring in June and December, and the lowest volume in July.
June sees the highest average donation, not just because this month traditionally sees more $1,000-plus donations, but also because the average of all small donations ($100 and under) is slightly higher. In other words, even donors who give small amounts tend to give a little more in June. This highlights the need for organisations to ensure they have an end of financial year campaign in place.
insight
31Who Gives? Insights from GiveNow Data Analysis 2001–2016

WHICH DAY OF THE WEEK IS THE MOST LUCRATIVE FOR ORGANISATIONS?What is it about Sundays? For most people it’s not payday or pension day, yet it’s a good day for GiveNow causes.
We aggregated one-off donations made since 2001 by days of the week and averaged them to arrive at the results shown in Figure 9.
Mondays see the highest average donation overall ($224), and Saturdays see the lowest ($179). However, GiveNow’s biggest ever recorded donation of $200,000 was made on a Monday, and this skews the numbers. To reduce the effect of this and other outliers, the bottom two graphs in Figure 9 consider only sub-$100 and sub-$1,000 donations.
When we look at donations $1,000 and under, the most lucrative day switches to Sunday (average donation $143), and Saturday retains its bottom spot; it’s the least lucrative day (average $130).
Interestingly, for small donations ($100 and under), the pattern changes and both Saturday and Sunday have a high average, although the difference with weekdays is only about $1.
One-off donations $1,000 and under
All one-off donations
One-off donations $100 and under
Mon Tue Wed Thu Fri SunSat
$58 –
$56 –
$55 –
$54
$144 –
$138 –
$133 –
$128
$230 –
$210 –
$190 –
$170
Aver
age
dona
tion
in A
UD
Figure 9: Average value of one-off donations by days of the week
32 Who Gives? Insights from GiveNow Data Analysis 2001–2016

WHAT IS THE MOST POPULAR DAY OF THE WEEK FOR GIVING?Is this the payday effect? Thursday sees more one-off donations (17%) than any other day of the week.
Figure 10 shows the percentage of all one-off donations per day of the week for the period March 10, 2001 to August 22, 2016.
We’ve considered only one-off donations, not regular donations, because regular donations are charged automatically and therefore tell us less about user behavior.
Saturday sees the fewest donations. The overall trend seems to suggest a slight increase in the average number of donations from Monday to Thursday, followed by a large decrease going into the weekend.
Mon Tue Wed Thu Fri SunSat
18% –
16% –
14% –
12%
10%
8% Perc
enta
ge o
f don
atio
ns
Figure 10: Number of one-off donations per day of the week, as percentage
GiveNow donors use the platform most often throughout the week and least often on Saturdays. Thursday sees the most donations, but Monday sees the highest average value donations ($224). If we consider only small donations ($100 and under), then weekends attract the highest average value gifts.
insight
33Who Gives? Insights from GiveNow Data Analysis 2001–2016

DONATIONS HOUR BY HOUR: VOLUME AND VALUEIn terms of volume, the highest percentage of donations occurs at 11am and the average stays relatively high until a decrease sets in at 4pm. The percentage picks up again at 9pm, but the overall number of donations after dinner is lower than during the day. As you’d expect, very few people make donations between midnight and 7am. As a result, the average donation during these hours is statistically unreliable.
In terms of value, the sweet spot is 3pm. The trend line shows a build throughout most of the morning, and a slight decrease after lunch, but then mid-afternoon is when the big-spenders come out: the average value peaks at 3pm at $142. The trend shows a strong decrease between 3pm and 7pm.
Figure 11 shows the per-hour percentage of donations and the averaged value of all one-off donations of $1,000 and under between January 1, 2006 and August 22, 2016. The blue line corresponds to the vertical axis on the left and the green line corresponds to the vertical axis on the right.
0 1 2 3 4 5 6 7 8 9 10 11 12 13 14 15 16 17 18 19 20 21 22 23
Hour (0-23)
8% –
6% –
4% –
2% –
0%
– $145
– $140
– $135
– $130
– $125
– $120
$115Perc
enta
ge o
f don
atio
ns
Aver
age
dona
tion
in A
UD
Figure 11: One-off donations of $1,000 and under, per hour
The highest volume of donations through GiveNow occurs during the day, between 11am and 4pm, with the highest average value donation occuring at 3pm. So if your organisation is planning an online campaign, consider launching it at lunchtime early in the week.
insight
0 1 2 3 4 5 6 7 8 9 10 11 12 13 14 15 16 17 18 19 20 21 22 23
Hour of the day
1.4% –
1.2% –
1.0% –
0.8% –
0.6% –
0.4% –
0.2% –
0 Perc
enta
ge o
f don
atio
ns
Monday
Tuesday
Wednesday
Thursday
Friday
Saturday
Sunday
34 Who Gives? Insights from GiveNow Data Analysis 2001–2016

DONATIONS PER HOUR FOR EACH HOUR OF THE WEEKWe’ve already seen from Figure 10 (page 33) that there are clear differences in the volume of donations depending on the day of the week. To display how these differences are reflected in the hourly averages, Figure 12 shows the percentage of one-off donations of $1,000 and under, per hour of the day, split out by the day of the week. Every dot in the graph represents the percentage of the total number of donations received for the corresponding hour and day of the week.
The lower number of donations on the weekend is clearly visible. The average picks up slightly on Sunday night, while Friday night and Saturday night are below average compared to the rest of the day. Monday to Thursday all follow the same trend as each other, with a small dip after lunch and a decrease between 4pm and 7pm.
0 1 2 3 4 5 6 7 8 9 10 11 12 13 14 15 16 17 18 19 20 21 22 23
Hour of the day
1.4% –
1.2% –
1.0% –
0.8% –
0.6% –
0.4% –
0.2% –
0 Perc
enta
ge o
f don
atio
ns
Monday
Tuesday
Wednesday
Thursday
Friday
Saturday
Sunday
Figure 12: Percentage of one-off donations made in every hour of the week
As you might expect, Friday and Saturday evenings are very quiet at GiveNow – but Sunday evening is busier than any other time of the weekend.
insight
35Who Gives? Insights from GiveNow Data Analysis 2001–2016

CausesOVERVIEWHow many donations does it take to change a lightbulb into a chandelier?
We wanted to know how many donations a cause might expect to attract, on average, and how much it might expect to raise in total, on average.
We looked at all the causes that attracted at least one donation, and plotted the total amount raised for each cause against the number of donations to that cause.
In Figure 13, the total amount raised is plotted against the number of donations, for each cause with at least one donation. The axes follow a logarithmic scale, in order to capture the full range of observations in a single figure.
Number of donations
0 1 10 100 1,000 10,000 100,000
$100
$1,000
Tota
l am
ount
rai
sed
in A
UD
$10,000
$100,000
$10,000,000
$1,000,000
$10
$1
Mean
Mea
n
Median
Med
ian
Figure 13: Total amount raised per cause and number of donations to that cause
36 Who Gives? Insights from GiveNow Data Analysis 2001–2016

The “average” cause attracted almost 150 donations and raised just over $17,000.
However, the graphs shows a very wide range of observations, ranging from causes with a single donation of a few dollars each, to one cause that attracted 25,573 donations and raised $2,836,167.
This wide range of observations means there is a large difference between the mean and the median:
In other words, there’s really no such thing as “average” when it comes to how much money an organisation can expect to raise, or how many donations it can expect to attract. The best answer to “What’s average?” is “It depends.” Interest areas, discussed in the next section, provide some insights into distinguishing between different types of causes and the donors they attract.
Mean Median
Total number of donations 149 16
Total amount raised $17,072 $2,045
The number of donations and the total value of donations a cause attracts is highly dependent on the type of organisation, the sector and geographical area in which it operates, and the demographics of the donors attracted to that particular cause. You can use the numbers shown in Figure 13 to compare your cause’s performance to the performance of the sector overall, but you shouldn’t use them to set budgets or fundraising targets.
insight
Table 4: Mean and median donations per cause
37Who Gives? Insights from GiveNow Data Analysis 2001–2016

Interest areasOVERVIEWEvery organisation that lists a cause on GiveNow selects an “interest area” for their cause from a pre-defined list. Figure 14 displays all these interest areas and shows the total amount donated, the number of donations and the average donation for each interest area.
One of the interest areas organisations can select is “unknown”; about 14% of causes are categorised in this way.
To minimise the impact of outliers, only donations of $1,000 and under are considered in the comparison of average donations on the right-hand side.
Different interest areas attract different donor demographics. For example, animal welfare causes receive many, but low-value, donations, while arts and culture causes receive relatively few donations, but they’re big ones.
insight
38 Who Gives? Insights from GiveNow Data Analysis 2001–2016

Health & Wellbeing
International
Unknown
Multicultural
Environment & Heritage
Emergency & Safety
Animal Welfare
Arts & Culture
Faith & Spirituality
Women
Children & Families
Homeless
Education & Scholarships
Indigenous
Disability
Advocacy
Youth
Gay & Lesbian
Science & Technology
Older People
Sport & Recreation
Rural & RegionalNumber of donations
Total amount donated
Average donation
Figure 14: Donations by interest area
39Who Gives? Insights from GiveNow Data Analysis 2001–2016
WHICH INTEREST AREAS ATTRACT THE MOST MONEY?Health and wellbeing causes attracted the highest total donations: $9,465,332 all up for a range of physical and mental health purposes. “International” is another popular interest area, drawing in $8,122,539 for various aid and development causes overseas, such as the 2015 earthquake in Nepal and the 2010 earthquake in Haiti.
Comparing total donations for each interest area with the number of donations and the average donation highlights a number of differences.
Animal welfare causes receive a lot of donations, yet the average donation is the smallest of any category ($53). In contrast, emergency and safety causes receive relatively few donations, but they’re high-value: the donation average ($151) is the second highest in the list. Arts and culture causes follow the same pattern as emergency and safety causes, receiving not many donations, but the most generous ones of all, on average ($155).
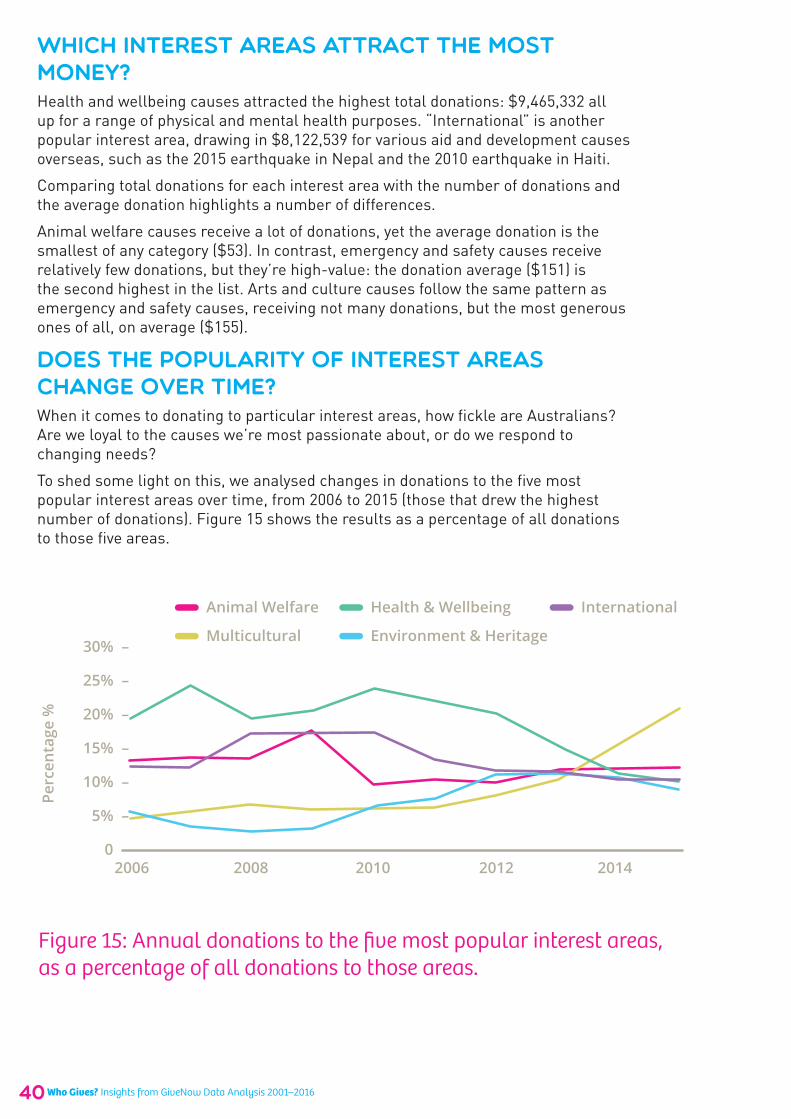
DOES THE POPULARITY OF INTEREST AREAS CHANGE OVER TIME?When it comes to donating to particular interest areas, how fickle are Australians? Are we loyal to the causes we’re most passionate about, or do we respond to changing needs?
To shed some light on this, we analysed changes in donations to the five most popular interest areas over time, from 2006 to 2015 (those that drew the highest number of donations). Figure 15 shows the results as a percentage of all donations to those five areas.
Multicultural
Animal Welfare
Environment & Heritage
Health & Wellbeing International
2006 2008 2010 2012 2014
30% –
25% –
20% –
15% –
10% –
5% –
0
Perc
enta
ge %
Figure 15: Annual donations to the five most popular interest areas, as a percentage of all donations to those areas.
40Who Gives? Insights from GiveNow Data Analysis 2001–2016

Health and wellbeing causes attracted the most donations until 2013, but in recent years multicultural causes have overtaken them to become the leading interest area, with donations increasing from 6.4% in 2011 to 21.1% in 2015. This can be attributed to the increasing popularity of causes related to asylum seekers and refugees.
The 2009 spike in donations to animal welfare causes is connected to the Black Saturday bushfires, in which several wildlife shelters were destroyed and it was estimated that more than one million animals perished.
Environment and heritage causes have become slightly more popular, while the share of donations going to international causes has decreased since 2010.
Whether these changes represent changing societal attitudes, changing circumstances, fluctuations in the popularity of GiveNow with organisations working in corresponding interest areas, or a combination of all these factors requires further investigation.
–2 These conclusions may be extrapolated to Australia as a whole only if it is assumed that GiveNow represents Australian causes in microcosm.
The popularity of particular interest areas is subject to change, often reflecting the broader social commentary. Build your fundraising strategy in light of your understanding of your particular donor base, and in light of what’s going on in society more broadly.
insight
41Who Gives? Insights from GiveNow Data Analysis 2001–2016

genderWe analysed GiveNow data in gender terms in search of insights that organisations could apply to their marketing efforts. When users donate through GiveNow, they select from a drop-down list a prefix (e.g. Ms, Mr) that can be used to identify them as male or female. (GiveNow has only recently added Mx as a non-binary gender option.)
Of the 582,851 donations, we identified 315,497 (54.1%) as coming from female donors, and 213,656 (36.7%) as coming from male donors. The donor gender for the remaining 53,698 donations (9.2%) was not specified. The following analysis excludes those 9.2% of donations.
OVERVIEWFigure 16 shows the number of donations by female and male donors, and the average value of those donations. The left vertical axis and blue bars correspond to the number of donations, and the right vertical axis and green bars correspond to the average donation.
Female Male
300,000 –
200,000 –
100,000 –
0
– $150
– $100
– $50
$0
Num
ber
of d
onat
ions
Aver
age
dona
tion
Figure 16: Number and average value of donations, by gender
Women clearly make more donations through GiveNow, but men donate slightly higher amounts on average, as indicated by the green bars. Men donate $96 on average, compared to $70 for women. As a result, the total amount donated by men is slightly higher: $29.6 million from men compared to $28.1 million from women.
Men are more likely than women to donate an amount greater than $1,000. If we consider only donations of $1,000 and under, then total donations by women ($21.9 million) are higher than total donations by men ($20.2 million).
42 Who Gives? Insights from GiveNow Data Analysis 2001–2016

Female
$21.4m$23.9m
$6.7m $5.7m
Male
$30m –
$20m –
$10m –
$0
Tota
l am
ount
in A
UD
One-off
Regular
Figure 17: Total donations by gender and donation type
Women make more donations, while men donate higher amounts. As a result, the total amounts donated by women and by men are approximately equal.
insight
ONE-OFF VERSUS REGULAR DONATIONS: IS THERE A GENDER DIFFERENCE?If we look at one-off donations, we find that men donate more in total than women, but if we look at regular donations, we find that women donate more in total than men. Figure 17 shows the details.
43Who Gives? Insights from GiveNow Data Analysis 2001–2016

If we look at one-off donations, we find that men donate more in total than women. If we look at regular donations, we find that women donate more than men. If your organisation seeks a more predictable income stream, and therefore seeks more regular donations, consider targeting women.
insight
IS THE WAY MEN AND WOMEN DONATE CHANGING OVER TIME?We wanted to find out whether there were gender differences in the popularity of one-off donations versus regular donations, and, if so, whether they were changing over time.
Figure 18 groups donations by gender and donation type, and shows the percentage of the total annual number of donations for each of the four combinations.
2006 2008 2010 2012 2014
45%
40%
35%
30%
25%
20%
15%
10%
Perc
enta
ge %
Regular donations by men
Regular donations by women
One-off donations by men
One-off donations by women
Figure 18: Annual donations by gender and donation type, as a percentage of all donations
44 Who Gives? Insights from GiveNow Data Analysis 2001–2016

For both men and women, regular giving is becoming more popular, and one-off donations are apparently losing their appeal.
For women, regular giving became more popular than one-off in 2010. For men, the change occurred three years later, in 2012. For both men and women, the gap between one-off and regular donations continues to widen.
Interestingly, the 2009 spike in donations that accompanied the Black Saturday bushfires is visible only in one-off donations by women (see Figure 18).
Since 2012, regular giving has been more popular than one-off donations with both men and women. The gap between one-off and regular donations is widening, and there is little reason to believe that this trend will change. If you’re campaigning to convert one-off donors into regular donors because you want a more predictable income stream, you’re running with the tide. Women make more one-off donations than men on GiveNow, especially during disasters. They also make more regular donations than men.
insight
45Who Gives? Insights from GiveNow Data Analysis 2001–2016

WHAT CAUSES APPEAL MOST STRONGLY TO WOMEN? TO MEN?We wanted to find out which causes tend to attract women’s donations, and which ones appeal the most to men. Figure 19 shows donations per interest area as percentages, divided according to gender.
Male
Undetermined
Female
Animal Welfare
Health & Wellbeing
International
Multicultural
Unknown
Environment & Heritage
Women
Homeless
Children & Families
Emergency & Safety
Faith & Spirituality
Arts & Culture
Indigenous
Disability
Advocacy
Education & Scholarships
Youth
Gay & Lesbian
Rural & Regional
Older People
Science & Technology
Sport & Recreation
0% 1% 1% 3% 4%
Percentage of donations
5% 6% 7% 8% 9%
Figure 19: Percentage of donations per interest area, divided by gender
46 Who Gives? Insights from GiveNow Data Analysis 2001–2016

Animal welfare causes attracted more than three times as many donations from women as from men. The 2009 Black Saturday bushfires gave rise to a number of very popular wildlife causes on GiveNow, and this explains the 2009 spike in women’s donations shown in Figure 18 (page 44).
Multicultural, international and women’s causes are clearly more popular among women than men.
Men’s donations equaled or exceeded women’s in a minority of interest areas: health and wellbeing, environment and heritage, emergency and safety, faith and spirituality, education and scholarships, youth, and gay and lesbian causes.
All these observations can be seen clearly in Figure 19. However, the difference between women’s and men’s support for particular causes is even more acute. Recall from Figure 16 that women make more donations than men. The ratio of women’s donations to men’s donations is approximately 3:2. If every interest area received a share of women’s and men’s donations in the corresponding proportions, then every purple bar would be 1.5 times larger than the corresponding green bar.
In short, women’s support for certain causes (e.g. animal welfare, multicultural, international) is disproportionately strong, and men’s support for certain causes (health and wellbeing, environment and heritage, emergency and safety) is disproportionately strong – even more so than Figure 19 suggests.
Most causes are much more popular with women than with men, or vice versa. Organisations can use this knowledge to their advantage when tailoring campaigns.
insight
47Who Gives? Insights from GiveNow Data Analysis 2001–2016

LocationWe wanted to find out about where GiveNow donors are concentrated, geographically; we wanted to look for correlations between where people live and how much they donate; and we were also interested in correlations between median incomes and amounts donated.
To do this, we drew not only on GiveNow data (postcodes and suburbs), but also on corresponding government data:
Australian Taxation Office (ATO) statistics: Mean and median taxable income per postcode, for tax years 2003–04 and 2013–14. Source.
PSMA administrative boundaries. Latitudes and longitudes for administrative boundaries (suburbs) in Australia. Source.
OVERVIEWWe analysed the average GiveNow donation per postcode for the tax year 2013–14 and compared it to the median taxable income for each of those postcodes in 2013–14. To obtain reliable averages from GiveNow data, we considered only donations of $1,000 and under, and only postcodes from which at least 50 donations were made. 484 postcodes satisfied these data requirements. Figure 20 shows the results. Every dot corresponds to a postcode.
$90,000
$70,000
$50,000
$30,000
$10,000Med
ian
taxa
ble
inco
me
Average donation
$0 $50 $100 $150 $250$200
Figure 20: Average donation versus median taxable income by postcode
48 Who Gives? Insights from GiveNow Data Analysis 2001–2016

Table 5: Most generous postcodes on GiveNow
Perhaps surprisingly, the positive correlation between median income and average donation is barely visible, and there is a wide spread in median taxable income for all values of the average donation. In other words, while we might have assumed that people from wealthy postcodes would give more on average on GiveNow, and people from poorer postcodes would give less on average, this is not necessarily the case.
Postcodes on the bottom right of the plot could be considered the “most generous” on GiveNow and include:
Postcode State IncludesMedian
taxable income 2013–14
Average donation
No. of donations
4113 Qld Eight Mile Plains, Runcorn $37,426 $225 50
4067 Qld St Lucia $40,250 $177 76
4208 Qld Ormea, Kingsholme $45,230 $160 52
2126 NSW Cherrybrook $46,932 $168 116
2097 NSW Collaroy $48,077 $160 53
2125 NSW West Pennant Hills $49,837 $217 90
Rich people don’t necessarily give more, and poor people don’t necessarily give less. There is no strong correlation between the likely income of donors and the average amount they donate via GiveNow.
insight
49Who Gives? Insights from GiveNow Data Analysis 2001–2016

WHAT ABOUT PER-CAPITA AVERAGES?In Table 5 (page 49), we calculated the average donation by dividing the total amount donated by the number of donations. This tells us something about the activity of the “average GiveNow user” in a particular area.
But another way to think about “average” donations is to divide the total amount donated by the population size. This sheds some light on the GiveNow activity of the “average resident” of a particular area.
To calculate the per-capita average donation amount, we used data from the 2011 Census suburb population count. We considered only donations of $1,000 and under made during 2011, and we considered only suburbs that made 50 or more donations. Table 6 shows the top 10 suburbs sorted by the per-capita average donation value:
Table 6: Top 10 suburbs by per-capita average donation value
Total donation
value
Total number of donations
2011 Population
Per capita average
number of donations
Per capita average value of
donations
Sydney NSW
$44,588 437 14,307 0.031 $3.12
East Melbourne, Vic
$14,350 65 4,714 0.014 $3.04
Albert Park, Vic
$11,856 108 5,954 0.018 $1.99
North Sydney, NSW
$11,140 80 6,529 0.013 $1.78
Fitzroy, Vic
$15,822 139 9,433 0.015 $1.68
Melbourne, Vic
$47,408 337 28,372 0.012 $1.67
Caulfield, Vic
$8,463 71 5,160 0.014 $1.64
Broome, WA
$6,840 69 4,291 0.016 $1.59
South Melbourne, Vic
$14,662 91 9,318 0.010 $1.57
Middle Park, Vic
$6,159 83 4,057 0.020 $1.52
50 Who Gives? Insights from GiveNow Data Analysis 2001–2016

Sydney (NSW) and East Melbourne (Vic) have the highest per-capita average donation value, donating just over $3 per inhabitant. Sydney also ranks highest for the average number of donations per capita. One possible explanation for Sydney’s place at the top of the table is that GiveNow users might be registering their workplace address, rather than their home address, among their contact details. A similar scenario could apply to Melbourne.
East Melbourne, Albert Park (Vic) and Middle Park (Vic) are high-income areas, with median 2013–14 incomes of $59,384 for East Melbourne and $61,289 for Albert Park and Middle Park.
The residents of Fitzroy (Vic), Caulfield (Vic) and Broome (WA) have lower median incomes but appear high in the ranking and could therefore be considered as “more generous” GiveNow donors.
WHERE IN AUSTRALIA IS GIVENOW USED THE MOST?Figure 21 shows a heatmap of donor activity on GiveNow in Australia.
Figure 21: “Heatmap” of GiveNow donations by donor postcode
51Who Gives? Insights from GiveNow Data Analysis 2001–2016

Donor activity levels are highest in the population-dense regions of the east coast, as expected.
To make the analysis more interactive, we plotted the number of donations per suburb as a percentage of all donations in the relevant state or territory. Red areas correspond to “busy” suburbs (a high proportion of donations for that state or territory), while blue areas represent low levels of donor activity.
For an interactive map with more detail for each city, click on the figures below.
Figure 22: Melbourne heatmap: number of donations as a percentage of state total
Table 7: Top five Vic suburbs by percentage of donations in the state
Percentage of the total number of donations
statewide
Average donation for donations $1,000 and
under
Melbourne 2.67 % $115
Northcote 2.24 % $73
Brunswick 2.16 % $72
Richmond 1.50 % $89
Hawthorn 1.37 % $96
52 Who Gives? Insights from GiveNow Data Analysis 2001–2016

Figure 23: Sydney heatmap: number of donations as a percentage of state total
Table 8: Top five NSW suburbs by percentage of donations in the state
Percentage of the total number of donations
statewide
Average donation for donations $1,000 and
under
Sydney 2.79 % $118
Randwick 1.56 % $80
Newtown 1.39 % $78
Marrickville 1.16 % $77
Mosman 1.14 % $137
53Who Gives? Insights from GiveNow Data Analysis 2001–2016
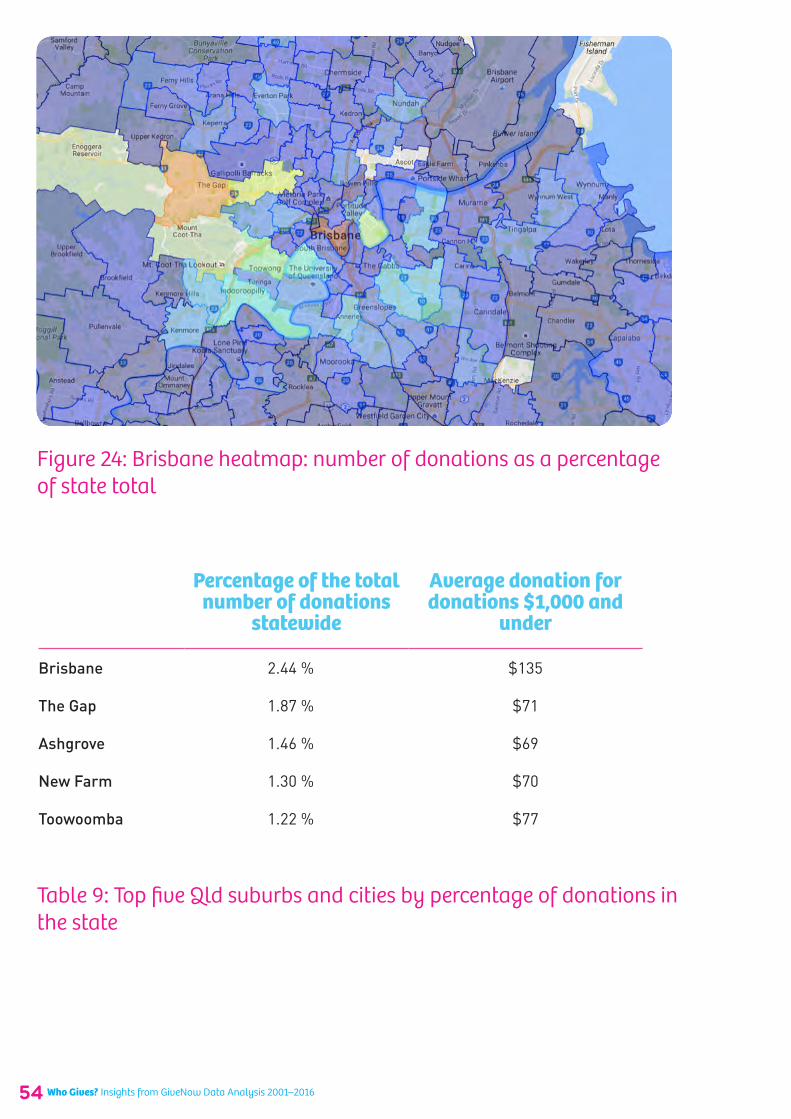
Figure 24: Brisbane heatmap: number of donations as a percentage of state total
Table 9: Top five Qld suburbs and cities by percentage of donations in the state
Percentage of the total number of donations
statewide
Average donation for donations $1,000 and
under
Brisbane 2.44 % $135
The Gap 1.87 % $71
Ashgrove 1.46 % $69
New Farm 1.30 % $70
Toowoomba 1.22 % $77
54 Who Gives? Insights from GiveNow Data Analysis 2001–2016

Figure 25: Adelaide heatmap: number of donations as a percentage of state total
Table 10: Top five SA suburbs and cities by percentage of donations in the state
Percentage of the total number of donations
statewide
Average donation for donations $1,000 and
under
Adelaide 5.48 % $92
North Adelaide 1.72 % $85
Mount Gambier 1.33 % $65
Eden Hills 1.30 % $51
Hallett Cove 1.21 % $41
55Who Gives? Insights from GiveNow Data Analysis 2001–2016

Figure 26: Perth heatmap: number of donations as a percentage of state total
Table 11: Top five WA suburbs and towns by percentage of donations in the state
Percentage of the total number of donations
statewide
Average donation for donations $1,000 and
under
Perth 3.19 % $109
Fremantle 2.02 % $77
Nedlands 1.49 % $113
Broome 1.41 % $132
Claremont 1.32 % $98
56 Who Gives? Insights from GiveNow Data Analysis 2001–2016
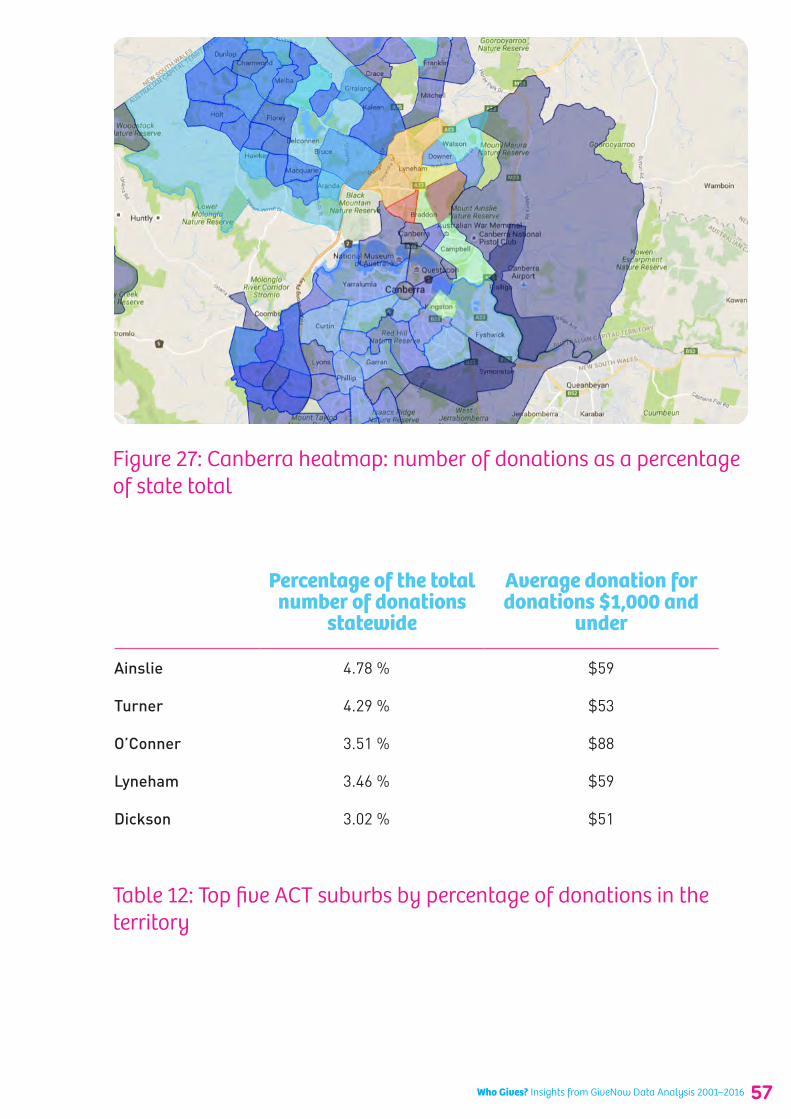
Figure 27: Canberra heatmap: number of donations as a percentage of state total
Table 12: Top five ACT suburbs by percentage of donations in the territory
Percentage of the total number of donations
statewide
Average donation for donations $1,000 and
under
Ainslie 4.78 % $59
Turner 4.29 % $53
O’Conner 3.51 % $88
Lyneham 3.46 % $59
Dickson 3.02 % $51
57Who Gives? Insights from GiveNow Data Analysis 2001–2016

Figure 28: Hobart heatmap: number of donations as a percentage of state total
Northern Territory has been left out due to insufficient data.
Table 13: Top five Tas suburbs by percentage of donations in the state
Percentage of the total number of donations
statewide
Average donation for donations $1,000 and
under
South Hobart 6.12 % $63
Hobart 5.78 % $82
West Hobart 5.03 % $67
Sandy Bay 4.23 % $96
Glenorchy 3.74 % $52
58 Who Gives? Insights from GiveNow Data Analysis 2001–2016

About the authorJOOST VAN DER LINDENData ScientistJoost joined Our Community in 2016 as the company’s first data scientist. He holds Bachelor of Science and Master of Science degrees in Applied Mathematics from the Delft University of Technology in The Netherlands and is currently working towards a PhD in Engineering at the University of Melbourne. An active and passionate member of the data science community in Melbourne, Joost leads the organisation of the yearly Melbourne Datathon. He has a keen interest in applying his data science skills to solving real world problems and contributing to society in a meaningful way.
ACKNOWLEDGMENTSThe help of the following Our Community staff in the preparation of this report is gratefully acknowledged:
Jarred Slomoi, GiveNow Manager, Our Community
Mark Mehzad, GiveNow Principal Developer, Our Community
Cathy Truong, GiveNow Executive Director, Our Community
Kathy Richardson, Executive Director, Our Community
Kerryn Burgess, Editor, Our Community
59Who Gives? Insights from GiveNow Data Analysis 2001–2016

About GiveNowGiveNow is a commission-free online donations platform for not-for-profits. GiveNow is an initiative of the Our Community Foundation, a not-for-profit established through the financial support of the Our Community group.
60Who Gives? Insights from GiveNow Data Analysis 2001–2016

About Our CommunityThe Our Community group provides advice, connections, training and easy-to-use tech tools for people and organisations working to build stronger communities.
Our partners in that work are not-for-profit organisations and social enterprises; government, philanthropic and corporate grantmakers; donors and volunteers; enlightened businesses; and other community builders.
A Certified B Corporation and multi-award-winning social enterprise, Our Community’s offerings include: OurCommunity.com.au – Australia’s centre for excellence for the nation’s 600,000 not-for-profits and schools: where not-for-profits go for help
Institute of Community Directors Australia – the best-practice governance network for the members of Australian not-for-profit boards, committees and councils, and the senior staff who work alongside them
FundingCentre.com.au – the best place to go to get information on grants and fundraising in Australia
Good Jobs – Connecting good people with social sector jobs, board vacancies and internships
Communities in Control – Australia’s most inspiring annual community sector gathering: thought leadership for the not-for-profit sector
Australian Institute of Grants Management – information, inspiration and education for government, philanthropic and corporate grantmakers
SmartyGrants – software and data science for revolutionary grantmakers
For more information about Our Community, visit www.ourcommunity.com.au/aboutus.
Our Community
51 Stanley Street West Melbourne, Vic 3003 Australia
Tel (03) 9320 6800
www.ourcommunity.com.au
www.givenow.com.au
61Who Gives? Insights from GiveNow Data Analysis 2001–2016

NOTES. . . . . . . . . . . . . . . . . . . . . . . . . . . . . . . . . . . . . . . . . . . . . . . . . . . . . . . . . . . . . . . . . . . . . . . . . . . . . . . . . . . . . . . . . . . . . . . . .
. . . . . . . . . . . . . . . . . . . . . . . . . . . . . . . . . . . . . . . . . . . . . . . . . . . . . . . . . . . . . . . . . . . . . . . . . . . . . . . . . . . . . . . . . . . . . . . . .
. . . . . . . . . . . . . . . . . . . . . . . . . . . . . . . . . . . . . . . . . . . . . . . . . . . . . . . . . . . . . . . . . . . . . . . . . . . . . . . . . . . . . . . . . . . . . . . . .
. . . . . . . . . . . . . . . . . . . . . . . . . . . . . . . . . . . . . . . . . . . . . . . . . . . . . . . . . . . . . . . . . . . . . . . . . . . . . . . . . . . . . . . . . . . . . . . . .
. . . . . . . . . . . . . . . . . . . . . . . . . . . . . . . . . . . . . . . . . . . . . . . . . . . . . . . . . . . . . . . . . . . . . . . . . . . . . . . . . . . . . . . . . . . . . . . . .
. . . . . . . . . . . . . . . . . . . . . . . . . . . . . . . . . . . . . . . . . . . . . . . . . . . . . . . . . . . . . . . . . . . . . . . . . . . . . . . . . . . . . . . . . . . . . . . . .
. . . . . . . . . . . . . . . . . . . . . . . . . . . . . . . . . . . . . . . . . . . . . . . . . . . . . . . . . . . . . . . . . . . . . . . . . . . . . . . . . . . . . . . . . . . . . . . . .
. . . . . . . . . . . . . . . . . . . . . . . . . . . . . . . . . . . . . . . . . . . . . . . . . . . . . . . . . . . . . . . . . . . . . . . . . . . . . . . . . . . . . . . . . . . . . . . . .
. . . . . . . . . . . . . . . . . . . . . . . . . . . . . . . . . . . . . . . . . . . . . . . . . . . . . . . . . . . . . . . . . . . . . . . . . . . . . . . . . . . . . . . . . . . . . . . . .
. . . . . . . . . . . . . . . . . . . . . . . . . . . . . . . . . . . . . . . . . . . . . . . . . . . . . . . . . . . . . . . . . . . . . . . . . . . . . . . . . . . . . . . . . . . . . . . . .
. . . . . . . . . . . . . . . . . . . . . . . . . . . . . . . . . . . . . . . . . . . . . . . . . . . . . . . . . . . . . . . . . . . . . . . . . . . . . . . . . . . . . . . . . . . . . . . . .
. . . . . . . . . . . . . . . . . . . . . . . . . . . . . . . . . . . . . . . . . . . . . . . . . . . . . . . . . . . . . . . . . . . . . . . . . . . . . . . . . . . . . . . . . . . . . . . . .
. . . . . . . . . . . . . . . . . . . . . . . . . . . . . . . . . . . . . . . . . . . . . . . . . . . . . . . . . . . . . . . . . . . . . . . . . . . . . . . . . . . . . . . . . . . . . . . . .
. . . . . . . . . . . . . . . . . . . . . . . . . . . . . . . . . . . . . . . . . . . . . . . . . . . . . . . . . . . . . . . . . . . . . . . . . . . . . . . . . . . . . . . . . . . . . . . . .
. . . . . . . . . . . . . . . . . . . . . . . . . . . . . . . . . . . . . . . . . . . . . . . . . . . . . . . . . . . . . . . . . . . . . . . . . . . . . . . . . . . . . . . . . . . . . . . . .
. . . . . . . . . . . . . . . . . . . . . . . . . . . . . . . . . . . . . . . . . . . . . . . . . . . . . . . . . . . . . . . . . . . . . . . . . . . . . . . . . . . . . . . . . . . . . . . . .
. . . . . . . . . . . . . . . . . . . . . . . . . . . . . . . . . . . . . . . . . . . . . . . . . . . . . . . . . . . . . . . . . . . . . . . . . . . . . . . . . . . . . . . . . . . . . . . . .
. . . . . . . . . . . . . . . . . . . . . . . . . . . . . . . . . . . . . . . . . . . . . . . . . . . . . . . . . . . . . . . . . . . . . . . . . . . . . . . . . . . . . . . . . . . . . . . . .
. . . . . . . . . . . . . . . . . . . . . . . . . . . . . . . . . . . . . . . . . . . . . . . . . . . . . . . . . . . . . . . . . . . . . . . . . . . . . . . . . . . . . . . . . . . . . . . . .
. . . . . . . . . . . . . . . . . . . . . . . . . . . . . . . . . . . . . . . . . . . . . . . . . . . . . . . . . . . . . . . . . . . . . . . . . . . . . . . . . . . . . . . . . . . . . . . . .
. . . . . . . . . . . . . . . . . . . . . . . . . . . . . . . . . . . . . . . . . . . . . . . . . . . . . . . . . . . . . . . . . . . . . . . . . . . . . . . . . . . . . . . . . . . . . . . . .
. . . . . . . . . . . . . . . . . . . . . . . . . . . . . . . . . . . . . . . . . . . . . . . . . . . . . . . . . . . . . . . . . . . . . . . . . . . . . . . . . . . . . . . . . . . . . . . . .
. . . . . . . . . . . . . . . . . . . . . . . . . . . . . . . . . . . . . . . . . . . . . . . . . . . . . . . . . . . . . . . . . . . . . . . . . . . . . . . . . . . . . . . . . . . . . . . . .
. . . . . . . . . . . . . . . . . . . . . . . . . . . . . . . . . . . . . . . . . . . . . . . . . . . . . . . . . . . . . . . . . . . . . . . . . . . . . . . . . . . . . . . . . . . . . . . . .
. . . . . . . . . . . . . . . . . . . . . . . . . . . . . . . . . . . . . . . . . . . . . . . . . . . . . . . . . . . . . . . . . . . . . . . . . . . . . . . . . . . . . . . . . . . . . . . . .
. . . . . . . . . . . . . . . . . . . . . . . . . . . . . . . . . . . . . . . . . . . . . . . . . . . . . . . . . . . . . . . . . . . . . . . . . . . . . . . . . . . . . . . . . . . . . . . . .
. . . . . . . . . . . . . . . . . . . . . . . . . . . . . . . . . . . . . . . . . . . . . . . . . . . . . . . . . . . . . . . . . . . . . . . . . . . . . . . . . . . . . . . . . . . . . . . . .
62 Who Gives? Insights from GiveNow Data Analysis 2001–2016


51 Stanley Street West Melbourne, Vic 3003, Australia
(03) 9320 6848
www.ourcommunity.com.au www.givenow.com.au
[email protected] [email protected]
www.twitter.com/OurCommunityAU www.twitter.com/GiveNowNews
www.facebook.com/OurCommunity.com.au www.facebook.com/GiveNow.com.au