insights from a shallow foundation load-settlement...
TRANSCRIPT
Computers and Geotechnics 93 (2018) 269–279
Contents lists available at ScienceDirect
Computers and Geotechnics
journal homepage: www.elsevier .com/locate /compgeo
Research Paper
Insights from a shallow foundation load-settlement prediction exercise
http://dx.doi.org/10.1016/j.compgeo.2017.05.0090266-352X/� 2017 Elsevier Ltd. All rights reserved.
⇑ Corresponding author.E-mail address: [email protected] (J.P. Doherty).
J.P. Doherty a,⇑, S. Gourvenec b, F.M. Gaone b
a School of Civil, Environmental and Mining Engineering, The University of Western Australia, 35 Stirling Hwy, Crawley, WA 6009, AustraliabCentre for Offshore Foundation Systems and the ARC Centre of Excellence for Geotechnical Science and Engineering, The University of Western Australia, Crawley, WA, Australia
a r t i c l e i n f o a b s t r a c t
Keywords:Shallow foundation
Soft clayField testsPrediction exerciseThis paper describes an international exercise aimed at assessing the geotechnical engineering profes-sion’s ability to predict the response of shallow foundations on soft clay subjected to undrained loading.Predictions of bearing capacity varied by more than an order of magnitude and settlement by more thantwo orders of magnitude. Average and median predicted values deviated significantly from measuredvalues. The results of this exercise highlight the need to develop tools to assist engineers to process siteinvestigation data. The development of predictive models that connect directly to site investigation datais discussed.
� 2017 Elsevier Ltd. All rights reserved.
1. Introduction
The design of shallow foundations on soft clay subject toundrained centric vertical loading is a routine task for the geotech-nical engineering profession. To satisfy the ultimate limit state, thedesigner is required to ensure that applied loads remain remotefrom the ultimate bearing capacity of the foundation. Design forthe serviceability limit state requires that settlement of the foun-dation under working loads will be small enough to ensure satis-factory performance of the structure it supports. Foundationdesign therefore requires an ability to predict both the ultimatebearing capacity and settlements under working loads.
As part of the activities of the Australian Research Council (ARC)Centre of Excellence for Geotechnical Science and Engineering(CGSE), an international shallow foundation prediction exercisewas conducted with the aim of assessing the predictive capabilitiesof the geotechnical engineering profession. This paper describesthe exercise and compares predictions received from 50 submis-sions with measured foundation performance of field tests carriedout at the Australian National Field Testing Facility (NFTF). It wasfound that participants significantly overestimated the bearingcapacity of the foundation, with the average predicted bearingcapacity exceeding the measured value by around 100%. On aver-age, predicted settlement values exceed measured values by morethan 600%. To examine reasons for the poor prediction results, areview of strength and stiffness data from the site is presented. Itis shown that the site data provides a good indicator of foundationperformance via simple foundation models. This suggests that poor
predictions cannot be attributed to inaccurate or insufficient infor-mation. An assessment of the sources of over prediction of bearingcapacity and settlement is presented and the use of technology toautomate the processing of soil data interpretation or developmentof predictive models that connect directly to soil data are discussedas possible solutions.
2. Description of foundation tests
2.1. Site description
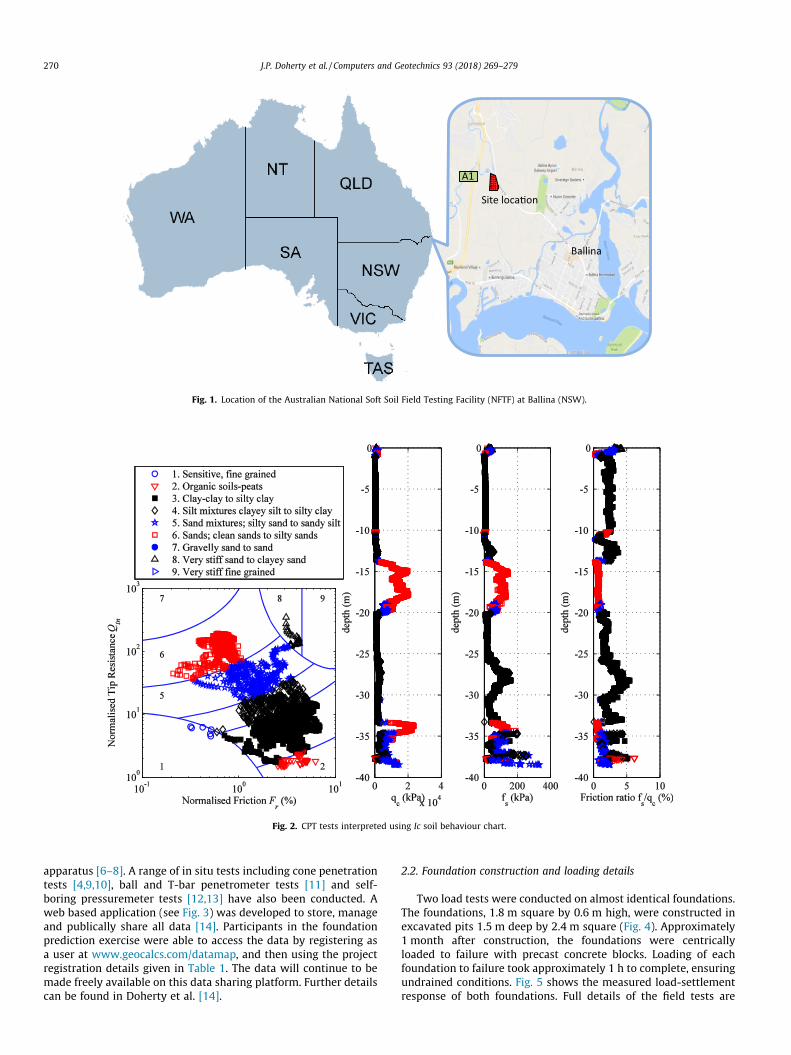
Supported by the Australian Research Council (ARC), the Centreof Excellence for Geotechnical Science and Engineering (CGSE)established the Australian National Field Testing Facility (NFTF)in Ballina, Northern New South Wales (see Fig. 1). The site isapproximatley 6.5 Ha and lies on the Richmond River floodplain,located south of Emigrant Creek and west of Fishery Creek.
The ground conditions comprise a crust of alluvial clayey siltysand to a depth of about 1.0–1.5 m, underlain by soft estuarineclay, underlain by a transition zone of clay, silt and sand, then sandof varying thickness [1]. The thickness of the soft estuarine clayincreases from approximately 12–22 m from west to east. Theengineering geology at the site is described in detail by Bishop[2], Bishop and Fityus [3], Kelly et al. [4]. Fig. 2 shows results fromcone penetration tests (CPT) from the site classified using theRobertson [5] soil behaviour index (Ic).
2.1.1. Geotechnical dataA comprehensive site investigation has been conducted at the
NFTF involving drilling and logging over 15 boreholes with highquality soil samples collected and tested in a range of laboratory
Ballina
Site loca�on
A1
Fig. 1. Location of the Australian National Soft Soil Field Testing Facility (NFTF) at Ballina (NSW).
Fig. 2. CPT tests interpreted using Ic soil behaviour chart.
270 J.P. Doherty et al. / Computers and Geotechnics 93 (2018) 269–279
apparatus [6–8]. A range of in situ tests including cone penetrationtests [4,9,10], ball and T-bar penetrometer tests [11] and self-boring pressuremeter tests [12,13] have also been conducted. Aweb based application (see Fig. 3) was developed to store, manageand publically share all data [14]. Participants in the foundationprediction exercise were able to access the data by registering asa user at www.geocalcs.com/datamap, and then using the projectregistration details given in Table 1. The data will continue to bemade freely available on this data sharing platform. Further detailscan be found in Doherty et al. [14].
2.2. Foundation construction and loading details
Two load tests were conducted on almost identical foundations.The foundations, 1.8 m square by 0.6 m high, were constructed inexcavated pits 1.5 m deep by 2.4 m square (Fig. 4). Approximately1 month after construction, the foundations were centricallyloaded to failure with precast concrete blocks. Loading of eachfoundation to failure took approximately 1 h to complete, ensuringundrained conditions. Fig. 5 shows the measured load-settlementresponse of both foundations. Full details of the field tests are

Fig. 3. Screen shot of datamap web application made available to participants in the foundation prediction exercise.
Table 1Project details to access NFTF project data.
Project name NFTFProject code Ballina
J.P. Doherty et al. / Computers and Geotechnics 93 (2018) 269–279 271
provided by Gaone et al. [15], where Test 1 is referred to as UU1and Test 2 as UU2.
2.3. Prediction exercise and review of observed and predicted values
The prediction exercise was advertised on the CGSE web site(http://cgse.edu.au/sfpe2016) and promoted through social media(LinkedIn and Twitter), the Australia Geomechanics Society andthe United States Universities Council on Geotechnical Education
Fig. 4. Foundatio
and Research’s (USUCGER) email lists and advertised at a numberof conferences. A total of 50 written predictions were receivedfrom 88 engineers. Thirteen countries were represented, includingAustralia, Austria, Belgium, Canada, China, France, Germany,Netherlands, Norway, Japan, Singapore, the UK and the US. Of the50 predictions, 23 were from industry practitioners, 16 from aca-demics and 11 from undergraduate students.
Participants were invited to make four predictions associatedwith the foundation performance. These quantities and their mea-sured values are summarised in Table 2 and illustrated in Fig. 5. Anability to accurately predict the ultimate bearing capacity (Qu) isclearly important for ultimate limit state design. For serviceabilitylimit state design, an ability to predict settlements under workingloads, which are typically in the range of 25–50% of the ultimatecapacity (i.e. u25 and u50), is critical. Predicting settlements at100% of the ultimate load (u100) is of less practical importance,
n geometry.

Fig. 5. Measured load-settlement response.
Table 2Foundation performance values.
Quantity Measured value
Ultimate failure load Qu (kN) 205Settlement at 25% of ultimate failure load u25 (mm) 3Settlement at 50% of ultimate failure load u50 (mm) 6Settlement at 100% of ultimate failure load u100 (mm) 22
272 J.P. Doherty et al. / Computers and Geotechnics 93 (2018) 269–279
and clearly more difficult given settlements change significantlywith small changes in load. Therefore, less emphasis is placed oninterpreting predictions for the u100.
The predicted values are presented in Table 3 for each perfor-mance measure. The error in the predicted values was calculated as
% error ¼ 100p�mm
ð1Þ
where p is the predicted value and m is the measured value.Fig. 6 plots the predicted values for each of the four quantities.
For each case, predictions have been sorted from smallest to largestand the numbers on the horizontal axis do not correspond to theID# in Table 3. For each case, the measured and the average pre-dicted values are shown. For the ultimate load (Fig. 6a), the predic-tions ranged from 130 kN to 2240 kN for a measured foundationcapacity of 205 kN. The overall average predicted capacity was404 kN, which is around 100% greater than the measured capacity.The median prediction was 331 kN, which is 61% greater than themeasured value. Fig. 7 presents the cumulative distribution oferror for each of the predicted quantities. For the ultimate bearingcapacity (Qu) it can be seen that around 10% of participantsachieved an error of 20% or less, while 45% achieved an error of50% or less.
Predictions of the settlement at 25% of the ultimate load (u25)are presented in Fig. 6b. The predictions ranged from 0.1 mm to877 mm for a measured settlement of 3 mm. The overall averagepredicted u25 was 42 mm and the median value was 8.5 mm.Fig. 7 shows that less than 2% of participants were within 20%,and around 15% were within 50% of the measured value.
Settlement predictions at 50% of the ultimate load (u50) are pre-sented in Fig. 6c, which ranged from 0.1 mm to over 1200 mm for ameasured settlement of 6 mm. The overall average value was84 mm, with a median value of 25 mm. Fig. 7 shows that only22% of predictions were within 100% of the measured value.
Fig. 6d presents the predicted settlements at 100% (u100) of theultimate load, which ranged from 0.8 mm to over 2280 mm for ameasured settlement of 22 mm. The overall average value was275 mm, with a median value of 125 mm. Fig. 7 shows that lessthan 20% of predictions were within 100% of the measured value.
Fig. 7 shows that the ultimate bearing capacity was more accu-rately predicted than the settlement. It is noted that if participantsmade a significant error predicting the bearing capacity, the mag-nitude of load at which settlement values were predicted are dif-ferent to the loads at which settlements were measured. Thismay have contributed to the lower accuracy in the settlementpredictions.
Fig. 8 presents the cumulative distribution of absolute error foreach of the predicted settlements, since absolute settlement is alsosignificant in geotechnical engineering and the percentage errormeasure can distort the engineering relevance of the predictedvalue, particularly for small values of settlement. The cumulativedistribution of absolute error indicates that around 65% of partici-pants predicted a settlement that was within 10 mm of the mea-sured u25 and 38% were within 10 mm of the u50.
Overall, the prediction exercise suggests, at least in the presentcase, that engineers tend to perceive the bearing capacity of shal-low foundations in soft clay to be higher than it actually is, with82% over predicting the bearing capacity, 55% over predicting bymore than 50% and 34% over predicting by more than 100%. Therange in values of predicted bearing capacity was more than anorder of magnitude (130 kN to more than 2000 kN). Even neglect-ing the worst 20% of predictions, the range in values of predictedbearing capacity was 130 kN to 480 kN, compared to the measuredvalue of 205 kN.
The prediction exercise also indicates, for the present case, thatengineers perceive soil to be less stiff than it actually is, with 88%over predicting the u50, 76% over predicting by more than 100% and36% over predicting by more than 500%. It is noted that partici-pants who over predicted the ultimate load were then computingsettlements at higher loads.
3. A review of undrained shear strength data and its link tomeasured foundation capacity
Given the participants in the foundation prediction exercise sig-nificantly over estimated the foundation capacity - on average byaround 100% - this section reviews undrained shear strength datafrom the site. This data is then used in simple bearing capacity cal-culations in order to determine if there is a clear and consistentlink between the available site investigation data and the mea-sured foundation capacity. Following this, an assessment of theparameter selection and prediction methods for the best and worstpredictions is presented.
Using data available to predictors, undrained shear strengthprofiles may be estimated using a range of in situ and laboratorytests including triaxial compression, triaxial extension [7], shearvane, self-boring pressuremeter [12,13] and cone penetrationtests (CPT) [16]. Undrained shear strength profiles derived fromeach of these data types are plotted against depth below groundlevel in Fig. 9. For the CPT profile, a ratio of cone tip resistant toundrained shear strength (Nkt) of 12.2 based on Kelly et al. [1]was used. Ball penetrometer data that was made available afterthe prediction exercise [11] has also been included in Fig. 9 forcompleteness. The undrained shear strength was estimated using

Table 3Predictions for Qu, u25, u50, u100.
ID# Predicted values % error
Qu (kN) u25 (mm) u50 (mm) u100 (mm) Qu (%) u25 (%) u50 (%) u100 (%)
1 690 10 30 500 237 233 400 21732 480 8 30 300 134 167 400 12643 425 105 145 325 107 3400 2317 13774 301 20 38 122 47 567 533 4555 412 9 18 180 101 200 200 7186 334 9.5 37.3 382.5 63 217 522 16397 280 4 12 120 37 33 100 4458 437 151 308 371 113 4933 5033 15869 300 3 14 50 46 0 133 12710 1750 13.5 93 1850 754 350 1450 830911 286.5 47 94 188 40 1467 1467 75512 360 8.5 28 206 76 183 367 83613 513 62 86.8 136.3 150 1967 1347 52014 222 8.5 21 155 8 183 250 60515 300 6 12 100 46 100 100 35516 162 2 7 70 �21 �33 17 21817 350 10 36 524 71 233 500 228218 175 1 3 19 15 �67 �50 �1419 275 34.5 70.7 203 34 1050 1078 82320 321 4 12 60 57 33 100 17321 270 7 15 120 32 133 150 44522 385 10 19 38 88 233 217 7323 280 11.5 28 1000 37 283 367 444524 162 25 75 180 �21 733 1150 71825 129.8 7.7 21 176 �37 157 250 70026 243.5 2 22 60 19 �33 267 17327 162 380 940 2280 �21 12567 15567 1026428 373 1.6 1.9 2.4 82 �47 �68 �8929 580 40 125 300 183 1233 1983 126430 412 0.4 0.8 1.4 101 �87 �87 �9431 2239 877 1256 1742 992 29133 20833 781832 200 1.5 6.5 35 �2 �50 8 5933 600 50 145 375 193 1567 2317 160534 600 20 60 300 193 567 900 126435 284 5 9 41 39 67 50 8636 440 5 15 270 115 67 150 112737 448 14 27 54 119 367 350 14538 338 5 11 44 65 67 83 10039 331 1 4 37 61 �67 �33 6840 295 27 61 146 44 800 917 56441 295 31 58 107 44 933 867 38642 337 5 18 170 64 67 200 67343 130 6 14 120 �37 100 133 44544 137 13 26 51 �33 333 333 13245 427 5.2 40.4 20.9 108 73 573 �546 378 3.8 7.6 15.3 84 27 27 �3047 181.8 0.1 0.1 0.8 �11 �97 �98 �9648 424 5.2 10.4 20.8 107 73 73 �549 413.5 12.6 25.2 50.3 102 320 320 12950 310 25 51 128 51 733 750 482Average 404 42 84 275 97 1309 1296 1150Median 333 9 26 125 62 192 327 468Standard dev 355 134 218 467 173 4454 3632 2125
J.P. Doherty et al. / Computers and Geotechnics 93 (2018) 269–279 273
a ratio of ball resistance to undrained shear strength (Nb) of 14[17].
The best-fit linear undrained strength profiles were estimatedfor each test type, as shown in Fig. 9. These profiles were used asinput into a Tresca constitutive model in a finite element analysisusing the Plaxis finite element software (see Fig. 10). An axisym-metric model was used to simulate the square footing using 15-noded triangular elements. The radius of the foundation and theradius of the excavation were set to give equivalent circular foun-dation and excavation areas to the field case. The linearundrained shear strength profiles, defined by an undrained shearstrength at the foundation base, 1.5 m below ground surface, anda gradient of strength increase with depth, are given in Table 4for each data type. The computed bearing capacities for eachstrength profile are also given in Table 4, along with the percent-age error compared with the measured capacity. The error ranges
from �26% for triaxial extension to +33% for the vane shear pro-files. The triaxial compression, self-boring pressuremeter and ballpenetrometer strength profiles gave bearing capacities within 5%of the measured capacity. The CPT strength profile over predictedthe capacity by 7%. A parametric study showed that the strengthof the crust (see Fig. 10) had negligible impact on the capacitycalculations.
Bjerrum [18] derived an empirical factor to correct shear vanestrength data to improve predictions of embankment stability insoft clay. Based on a plasticity index for material at the site [7] ofaround 0.6, the Bjerrum [18] factor would have reduced the vaneshear strength profile by around 20%, resulting in a 20% lower bear-ing capacity calculation and a much better match to the measuredbearing capacity. Triaxial extension strengths would typically beexpected to result in an under estimate of foundation bearingcapacity, as is the case here.

0 10 20 30 40 50#
0
10
20
30
40
50
60
70
pred
icte
d se
ttlem
ent (
mm
)
b) measured u25
= 3 mm
0 10 20 30 40 50#
0
50
100
150
pred
icte
d se
ttlem
ent (
mm
)
c) measured u50
= 6 mm
0 10 20 30 40 50#
0
50
100
150
200
250
300pr
edic
ted
settl
emen
t (m
m)
d) measured u100
= 22 mm
0 10 20 30 40 50#
0
100
200
300
400
500pr
edic
ted
capc
aity
(kN
)
a) measured Qu = 205 kN
measuredvalue
measuredvalue
measuredvalue
measuredvalue
average ofpredicted
valuesaverage ofpredicted
values
average ofpredicted
values average ofpredicted
values
Fig. 6. Comparison of prediction and measured foundation performance for (a) Qu; (b) u25; (c) u50 and (d) u100.
274 J.P. Doherty et al. / Computers and Geotechnics 93 (2018) 269–279
It is noted that changes in undrained shear strength due toexcavation of the foundation pit and construction of the foundationwere not considered in this analysis. In reality, excavation of the pitto 1.5 m involved a reduction in effective stress of approximately20 kPa at the foundation base while subsequent construction ofthe 0.6 m high 1.8 m square foundation involved a re-loading ofapproximately 10 kPa (assuming a unit weight for concrete of24 kN/m3 and noting the position of the water table in Fig. 4).
The analysis outlined here indicates that very reasonable pre-dictions of capacity can be achieved using a simple Tresca soilmodel with a linear strength profile derived from the data pro-vided. A possible source of error in some predictions may stemfrom the boundary conditions assumed in the numerical analysis.One issue in particular was that some participants did not modelthe 300 mm gap between the foundation and the excavation wall(see Figs. 4 and 10), and instead assumed that the excavation wallwas immediately adjacent to the foundation (i.e. g = 0 in Fig. 10).To investigate the impact of neglecting the gap, the model wasre-run varying the gap dimension g between 0 and 125 % the valuein the axisymmetric model g = 0.34 m. The computed capacity nor-
malised by the capacity with g = 0.34 m is plotted in Fig. 11. It canbe seen that in an axisymmetric model, ignoring the gap can influ-ence the bearing capacity by up to around 50%. While the effect ofthe gap is a potential source for some of the error in predictedcapacities, it does not account for the range of error observed, withover half the capacity predictions exceeding the measured value bymore than 50%.
It was found that 13 of the 17 participants who over predictedthe bearing capacity by more than 100% used simple hand calcula-tions. Out of these 13 predictions, 11 indicated that they had used abearing capacity calculation of the form
Qu ¼ AðNcsu þ qNqÞ ð2Þ
where A is the area of the foundation, Nc is the bearing capacity fac-tor, su is the undrained shear strength, q is surcharge adjacent to thefoundation and Nq is the surcharge factor. By adopting Nc = 6, Nq = 0(due to the gap between the foundation and the excavation wall)and undrained shearing strength values at the foundation levelfrom Table 4, this equation gives very similar bearing capacity esti-

Fig. 7. Cumulative distribution of percentage error for predicted ultimate capacityand settlements.
Fig. 8. Cumulative distribution of absolute error for settlement predictions.
J.P. Doherty et al. / Computers and Geotechnics 93 (2018) 269–279 275
mates to those presented in Table 4 from the finite element analy-sis. It is interesting to note that both the most accurate (ID# 32 inTable 3) and the least accurate (ID# 31 in Table 3) bearing capacitypredictions used this equation. The most accurate used Nc = 6 andNq = 0 along with su = 10 kPa in Eq. (2) (and rounded the result upto 200 kN). It was not clear from the submission what factors orundrained shear strength was chosen for the least accurateprediction.
It was found that 4 of the 17 participants who over predicted thebearing capacity by more than 100% used either two or threedimensional finite element analysis, with one using an effectivestress method to model undrained behaviour and three using totalstress (Tresca) models. Several of the more accurate predictions
also used finite element simulations, with one (ID# 18 in Table 3)using an effective stress approach to simulate undrained behaviour.
Overall, there is no clear trend in terms of which methodsworked and which did not. The accuracy appears to be entirely afunction of the assumptions made regarding the boundary condi-tions, soil strength and how model results were interpreted.Clearly, these factors are highly subjective, even for this simpleproblem.
4. A review of soil stiffness data and its link to measuredfoundation settlements
This section of the paper focuses on the application ofundrained triaxial compression and self-boring pressuremeterdata, both of which were available to participants in the foundationprediction exercise, to estimate soil stiffness profiles at the NFTFsite and examine how these stiffness profiles relate to measuredfoundation performance.
Stiffness values were estimated from triaxial compression datain three different ways. Using deviatoric stress (q) versus axialstrain (ea) data, a point on the curve at 10% of the total change indeviatoric stress mobilised during the compression test was usedto compute a secant shear modulus G10, as shown in Fig. 12a(where the shear modulus is one third of the slope of the secantshown). Similarly, a point on the curve at 50% of the total changein deviatoric stress was used to compute a G50 secant shear mod-ulus (see Fig. 12a). Profiles of G10 and G50 for the site are plottedin Fig. 13a and b, respectively. The third method to derive stiffnessvalues made use of the high quality triaxial compression data byemploying a numerical optimisation technique described by Doh-erty et al. [19] to determine an optimal set of modified Cam clayparameters. The optimised Cam clay parameters were then usedto define an elastic shear modulus (inside the Cam clay yield sur-face). This stiffness value is denoted as GMCCtx. Fig. 12a shows anexample of stress-strain response generated using the modifiedCam clay model with optimised parameters. The shear modulusprofile obtained using this approach is shown in Fig. 13c.
A shear modulus profile was also derived using a numericaloptimisation technique to match the modified Cam clay model toundrained self-boring pressuremeter data. Full details of this pro-cess are presented by Gaone et al. [13]. The resulting match ofthe optimised modified Cam clay model to the pressuremeter datais shown in Fig. 12b. The shear modulus profile GMCCpm is presentedin Fig. 13d.
To estimate foundation settlements using these stiffness pro-files, elastic solutions by Doherty and Deeks [20] for circular shal-low foundations were used, where the shear modulus varies withdepth (z) according to
GðzÞ ¼ GRzR
� �að3Þ
In this equation, GR is the shear modulus at a depth equal to theradius of the foundation (R) and a is the non- homogeneity param-eter which varies between zero and one, encompassing homoge-nous and Gibson soil profiles. Doherty and Deeks [20] presentedsolutions for circular shallow foundations embedded at the baseof an excavation. The solutions were applied by approximatingthe square foundations as circles with an equivalent area (i.e.R = 1.015 m). Eq. (3) was fitted to each stiffness profile in Fig. 13.The GR and a values for each profile are given in Table 5.
Adopting a Poisson’s ratio of 0.5 (for undrained constant volumebehaviour), vertical stiffness coefficients (KV) were interpolatedfrom charts presented by Doherty and Deeks [20]. Values for thesedimensionless coefficients are presented in Table 5. The foundationsettlement (u) was then estimated at any load Q using the follow-ing equation

Fig. 9. Undrained shear strength profiles derived from in situ and laboratory tests at the NFTF (a) Triaxial compression; (b) Triaxial extension; (c) Shear vane; (d) Self-boringpressuremeter; (e) Cone penetrometer; (f) Ball penetrometer.
276 J.P. Doherty et al. / Computers and Geotechnics 93 (2018) 269–279
u ¼ QGRRKV
ð4Þ
Settlement estimates computed at 25%, 50% and 100% of thetotal failure load, Q = 205 kN, are presented in Table 5.
The elastic load-settlement response for each stiffness profile ispresented in Fig. 14 and compared with the foundation perfor-mance data. It can be seen that the G10 and GMCCpm stiffness profilesprovide a remarkably good fit to the u25 and u50 settlement values.

Fig. 10. Axisymmetric finite element model.
Fig. 11. Impact of the gap, g, between foundation and excavation wall on calculatedbearing capacity.
J.P. Doherty et al. / Computers and Geotechnics 93 (2018) 269–279 277
The GMCCtx profile also provides a reasonable estimate. Stiffness val-ues derived in this way would therefore be suitable for design offoundations subject to typical working loads. The G50 over predictsfoundation settlement at working loads, but provides a reasonablematch to the settlements at the onset of failure.
Using the same finite element model described above, a simula-tion was conducted using a linear-elastic perfectly-plastic Trescasoil model with the G10 elastic shear modulus profile (Fig. 13aand Table 5), a Poisson’s ratio of 0.49 and the triaxial compressionundrained shear strength profile (see Fig. 9a and Table 4). Theresulting non-linear load-displacement response is presented inFig. 14. It can be seen that this model provides a reasonable matchto the measured response, although over predicts the settlement atthe onset of failure by around 50%.
Participants in the prediction exercise used a range of methodsto predict foundation settlement, including elastic solutions andnon-linear finite element analysis. As observed for the bearingcapacity predictions, there was no clear trend in terms of methodaccuracy. This suggests that accuracy was highly dependent onthe assumptions made regarding soil stiffness, which is highly sub-jective. It is interesting to note, that of the 5 predictions that werewithin 50% of the measured u50, two based stiffness values on self-boring pressuremeter data. However, some of the poorer predic-tions also used self-boring pressuremeter data.
5. Concluding remarks
The results from the prediction exercise presented in this paperindicate that engineers with the same data and calculation taskjudge the data in different ways and ultimately produce very dif-ferent results. Similar findings have previously been presentedfor prediction exercises involving shallow foundations on soft clay[21] and for the drained response of shallow foundations on sand[22,23]. This suggests that predictive capabilities have notimproved, despite significant progress in modelling and testingtechniques in recent years.
Table 4Undrained shear strength profiles and computed bearing capacities using various laborato
Triaxialcomp
Triaxialext
Sv
Shear strength, su at foundation level, z = 1.5 m (kPa) 10.5 8 1Shear strength gradient, ksu (kPa/m) 1.95 1.2 0FEA computed capacity (kN) 207 152 2% error +1.2 �25.8 +
It was demonstrated that reasonably accurate foundation per-formance predictions can be achieved using simple foundationmodels with parameters derived from the in situ and laboratorydata provided. Therefore, the poor predictions cannot be attributedto insufficient or inaccurate information. No clear trends could beidentified between methods used and the accuracy of predictionsfor either bearing capacity or settlement. The accuracy appearedto be entirely a function of the assumptions made regarding theboundary conditions, how model results were interpreted and, inparticular, how soil parameters were selected. The accuracy of pre-dictions was not strongly correlated to the sector of the predictor(i.e. practioner, academic or student). The range in the predictedvalues for both settlement and bearing capacity is undeniablyalarming, with settlements varying by more than two orders ofmagnitude and the bearing capacity by more than one order ofmagnitude.
A key source of variability in predicted performance stems fromthe fact that our predictive models (i.e. numerical or analyticalmethods) remain disconnected from the data that informs them.As a result, significant manual intervention is required to convertin situ or laboratory data into input parameters for use in a predic-tive model. ‘‘Engineering judgement” is applied in this process,which introduces subjectivity and uncertainty in the outcome ofdesign calculations. Automated optimisation tools have beendeveloped to assist engineers in converting measured data fromconventional site investigation tests into commonly used constitu-tive model parameters (e.g. [15,19]), with the aim of reducing thisuncertainty. A further step forward involves developing predictivemodels that connect directly to measured site investigation data.This does not necessarily require machine learning or artificial
ry and in situ test data.
hearane
Self-boringpressuremeter
Conepenetrometer
Ballpenetrometer
4 10 11.2 10.8 1.3 2.4 0.874 194 221 19533 �5.2 + 7.2 �4.8

0 1000 2000 3000 4000 5000Shear modulus (kPa)
0
2
4
6
8
10
Dep
th (
m)
a) Triaxial compression G10
0 1000 2000 3000 4000 5000Shear modulus (kPa)
0
2
4
6
8
10
Dep
th (
m)
b) Triaxial compression G50
0 1000 2000 3000 4000 5000Shear modulus (kPa)
0
2
4
6
8
10
Dep
th (
m)
c) Triaxial compression GMCCtx
0 1000 2000 3000 4000 5000Shear modulus (kPa)
0
2
4
6
8
10
Dep
th (
m)
d) Self-boring pressuremeter GMCCpm
Fig. 13. Shear modulus profiles from triaxial tests and in situ pressuremeter tests at the NFTF (a) G10 secant modulus from TXC data; (b) G50 secant modulus from TXC data;(c) GMCCtx from numerical optimisation of TXC data and (d) GMCCpm from numerical optimisation of self-boring pressuremeter data.
Fig. 12. Stiffness data (a) example stress-strain response from a triaxial compression test with secants at 10% and 50% of the change in deviator stress and optimised Cam clayresponse; (b) pressuremeter data and optimised modified Cam clay response.
278 J.P. Doherty et al. / Computers and Geotechnics 93 (2018) 269–279
neural networks, although these methods are options. Doherty andLehane [24] present an example of this type of integrated analysisthat uses CPT or CPTu data directly as an input to perform analysis
of a laterally loaded pile foundation. The application interprets theCPT data and automatically assigns appropriate p-y curves forsands, silts or clays. In principle, the application requires no
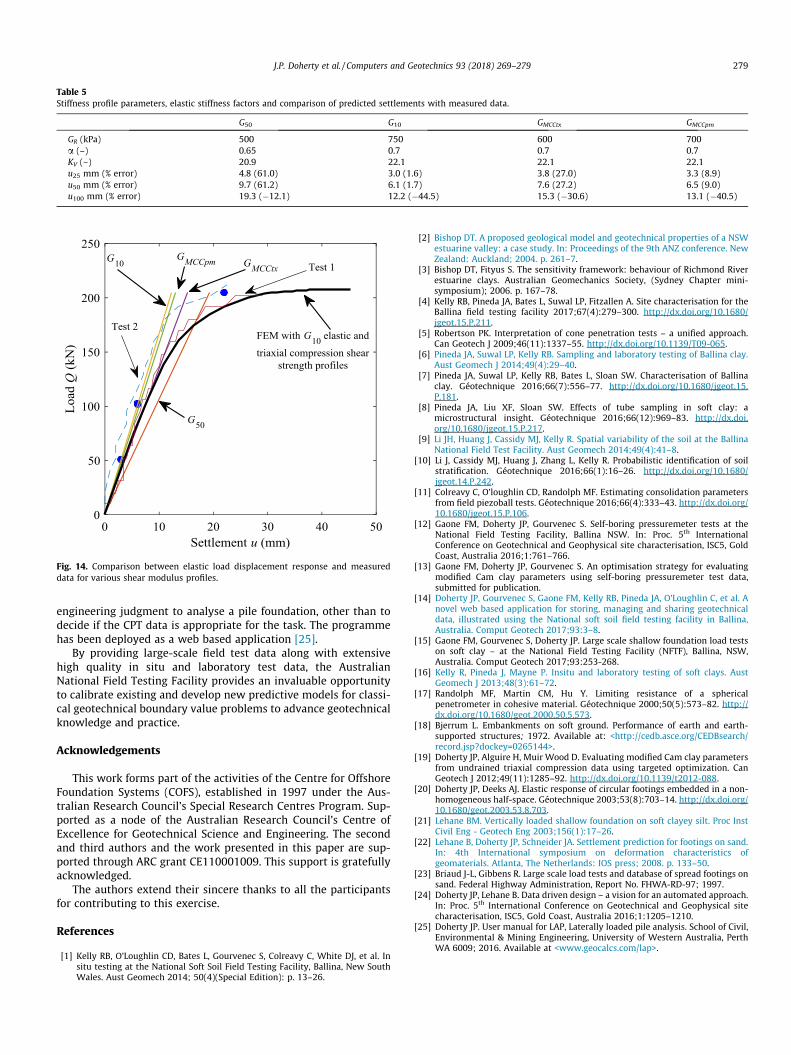
Fig. 14. Comparison between elastic load displacement response and measureddata for various shear modulus profiles.
Table 5Stiffness profile parameters, elastic stiffness factors and comparison of predicted settlements with measured data.
G50 G10 GMCCtx GMCCpm
GR (kPa) 500 750 600 700a (–) 0.65 0.7 0.7 0.7KV (–) 20.9 22.1 22.1 22.1u25 mm (% error) 4.8 (61.0) 3.0 (1.6) 3.8 (27.0) 3.3 (8.9)u50 mm (% error) 9.7 (61.2) 6.1 (1.7) 7.6 (27.2) 6.5 (9.0)u100 mm (% error) 19.3 (�12.1) 12.2 (�44.5) 15.3 (�30.6) 13.1 (�40.5)
J.P. Doherty et al. / Computers and Geotechnics 93 (2018) 269–279 279
engineering judgment to analyse a pile foundation, other than todecide if the CPT data is appropriate for the task. The programmehas been deployed as a web based application [25].
By providing large-scale field test data along with extensivehigh quality in situ and laboratory test data, the AustralianNational Field Testing Facility provides an invaluable opportunityto calibrate existing and develop new predictive models for classi-cal geotechnical boundary value problems to advance geotechnicalknowledge and practice.
Acknowledgements
This work forms part of the activities of the Centre for OffshoreFoundation Systems (COFS), established in 1997 under the Aus-tralian Research Council’s Special Research Centres Program. Sup-ported as a node of the Australian Research Council’s Centre ofExcellence for Geotechnical Science and Engineering. The secondand third authors and the work presented in this paper are sup-ported through ARC grant CE110001009. This support is gratefullyacknowledged.
The authors extend their sincere thanks to all the participantsfor contributing to this exercise.
References
[1] Kelly RB, O’Loughlin CD, Bates L, Gourvenec S, Colreavy C, White DJ, et al. Insitu testing at the National Soft Soil Field Testing Facility, Ballina, New SouthWales. Aust Geomech 2014; 50(4)(Special Edition): p. 13–26.
[2] Bishop DT. A proposed geological model and geotechnical properties of a NSWestuarine valley: a case study. In: Proceedings of the 9th ANZ conference. NewZealand: Auckland; 2004. p. 261–7.
[3] Bishop DT, Fityus S. The sensitivity framework: behaviour of Richmond Riverestuarine clays. Australian Geomechanics Society, (Sydney Chapter mini-symposium); 2006. p. 167–78.
[4] Kelly RB, Pineda JA, Bates L, Suwal LP, Fitzallen A. Site characterisation for theBallina field testing facility 2017;67(4):279–300. http://dx.doi.org/10.1680/jgeot.15.P.211.
[5] Robertson PK. Interpretation of cone penetration tests – a unified approach.Can Geotech J 2009;46(11):1337–55. http://dx.doi.org/10.1139/T09-065.
[6] Pineda JA, Suwal LP, Kelly RB. Sampling and laboratory testing of Ballina clay.Aust Geomech J 2014;49(4):29–40.
[7] Pineda JA, Suwal LP, Kelly RB, Bates L, Sloan SW. Characterisation of Ballinaclay. Géotechnique 2016;66(7):556–77. http://dx.doi.org/10.1680/jgeot.15.P.181.
[8] Pineda JA, Liu XF, Sloan SW. Effects of tube sampling in soft clay: amicrostructural insight. Géotechnique 2016;66(12):969–83. http://dx.doi.org/10.1680/jgeot.15.P.217.
[9] Li JH, Huang J, Cassidy MJ, Kelly R. Spatial variability of the soil at the BallinaNational Field Test Facility. Aust Geomech 2014;49(4):41–8.
[10] Li J, Cassidy MJ, Huang J, Zhang L, Kelly R. Probabilistic identification of soilstratification. Géotechnique 2016;66(1):16–26. http://dx.doi.org/10.1680/jgeot.14.P.242.
[11] Colreavy C, O’loughlin CD, Randolph MF. Estimating consolidation parametersfrom field piezoball tests. Géotechnique 2016;66(4):333–43. http://dx.doi.org/10.1680/jgeot.15.P.106.
[12] Gaone FM, Doherty JP, Gourvenec S. Self-boring pressuremeter tests at theNational Field Testing Facility, Ballina NSW. In: Proc. 5th InternationalConference on Geotechnical and Geophysical site characterisation, ISC5, GoldCoast, Australia 2016;1:761–766.
[13] Gaone FM, Doherty JP, Gourvenec S. An optimisation strategy for evaluatingmodified Cam clay parameters using self-boring pressuremeter test data,submitted for publication.
[14] Doherty JP, Gourvenec S, Gaone FM, Kelly RB, Pineda JA, O’Loughlin C, et al. Anovel web based application for storing, managing and sharing geotechnicaldata, illustrated using the National soft soil field testing facility in Ballina,Australia. Comput Geotech 2017;93:3–8.
[15] Gaone FM, Gourvenec S, Doherty JP. Large scale shallow foundation load testson soft clay – at the National Field Testing Facility (NFTF), Ballina, NSW,Australia. Comput Geotech 2017;93:253-268.
[16] Kelly R, Pineda J, Mayne P. Insitu and laboratory testing of soft clays. AustGeomech J 2013;48(3):61–72.
[17] Randolph MF, Martin CM, Hu Y. Limiting resistance of a sphericalpenetrometer in cohesive material. Géotechnique 2000;50(5):573–82. http://dx.doi.org/10.1680/geot.2000.50.5.573.
[18] Bjerrum L. Embankments on soft ground. Performance of earth and earth-supported structures; 1972. Available at: <http://cedb.asce.org/CEDBsearch/record.jsp?dockey=0265144>.
[19] Doherty JP, Alguire H, Muir Wood D. Evaluating modified Cam clay parametersfrom undrained triaxial compression data using targeted optimization. CanGeotech J 2012;49(11):1285–92. http://dx.doi.org/10.1139/t2012-088.
[20] Doherty JP, Deeks AJ. Elastic response of circular footings embedded in a non-homogeneous half-space. Géotechnique 2003;53(8):703–14. http://dx.doi.org/10.1680/geot.2003.53.8.703.
[21] Lehane BM. Vertically loaded shallow foundation on soft clayey silt. Proc InstCivil Eng - Geotech Eng 2003;156(1):17–26.
[22] Lehane B, Doherty JP, Schneider JA. Settlement prediction for footings on sand.In: 4th International symposium on deformation characteristics ofgeomaterials. Atlanta, The Netherlands: IOS press; 2008. p. 133–50.
[23] Briaud J-L, Gibbens R. Large scale load tests and database of spread footings onsand. Federal Highway Administration, Report No. FHWA-RD-97; 1997.
[24] Doherty JP, Lehane B. Data driven design – a vision for an automated approach.In: Proc. 5th International Conference on Geotechnical and Geophysical sitecharacterisation, ISC5, Gold Coast, Australia 2016;1:1205–1210.
[25] Doherty JP. User manual for LAP, Laterally loaded pile analysis. School of Civil,Environmental & Mining Engineering, University of Western Australia, PerthWA 6009; 2016. Available at <www.geocalcs.com/lap>.