insight report the global enabling trade report 2014
TRANSCRIPT

The Global Enabling Trade Report 2014
Margareta Drzeniek Hanouz, Thierry Geiger, Sean Doherty, Editors
Insight Report


Insight Report
The Global Enabling Trade Report 2014
Margareta Drzeniek Hanouz
Thierry Geiger
Sean Doherty
Editors
© 2014 World Economic Forum

The Global Enabling Trade Report 2014 is published by the World Economic Forum within the framework of the Global Competitiveness and Benchmarking Network and the Supply Chain and Transportation Industry Partnership.
The terms country, economy and nation as used in the Report do not in all cases refer to a territorial entity that is a state as understood by international law and practice. The terms cover well-defined, geographically self-contained economic areas that may not be states but for which statistical data are maintained on a separate and independent basis.
World Economic ForumGeneva
Copyright © 2014 by the World Economic Forum
Published by the World Economic Forumwww.weforum.org
Al rights reserved. No part of this publication may be reproduced, storied in a retrieval system, or transmitted, in any form or by any means, electronic, mechanical, photocopying, or otherwise without the prior permission of the World Economic Forum.
ISBN-10: 92-95044-53-3 ISBN-13: 978-92-95044-53-1
This publication is printed on paper suitable for recycling and made from fully managed and sustained forest sources.
© 2014 World Economic Forum
The Global Enabling Trade Report 2014 | iii
Contributors v
Preface vii
by Espen Barth Eide (World Economic Forum)
Chapter 1: The Enabling Trade Index 2014 1
by Attilio Di Battista, Sean Doherty, Margareta Drzeniek Hanouz and Thierry Geiger
(World Economic Forum)
Chapter 2: Latin America and the Caribbean in South-South Trade: 27
Trade Performance and Main Obstacles to Developing Trade
by Margareta Drzeniek Hanouz (World Economic Forum) and Antoni Estevadeordal,
Paolo Giordano and Mauricio Mesquita Moreira (Inter-American Development Bank)
How to Read the Country/Economy Profiles 45
Index of Countries/Economies 49
Country/Economy Profiles 50
Appendix A: Composition and Computation of the Enabling Trade Index 329
Appendix B: Technical Notes and Sources 331
About the Authors 337
Acknowledgments 339
Contents
© 2014 World Economic Forum

© 2014 World Economic Forum

The Global Enabling Trade Report 2014 | v
PARTNER INSTITUTES OF THE GLOBAL COMPETITIVENESS AND BENCHMARKING NETWORK
The World Economic Forum would like to acknowledge and thank its network of over 160 Partner Institutes, which help administer the Executive Opinion Survey around the world. The Survey provides invaluable data for the production of this Report. The full list of Partner Institutes is available at http://wef.ch/partnerinstitutes2013.
DATA PROVIDERS
The World Economic Forum would like to thank the following experts and their respective organizations for providing privileged access to their data and for their guidance, without which the production of this Report would not have been possible:
At the Global Express Association
Carlos Grau Tanner, Director General
At the International Trade Centre (ITC)
Jean-François Bourque, Senior Legal Advisor, Business Environment Section, Division of Business and Institutional Support
Mondher Mimouni, Chief, Market Analysis and Research
Xavier Pichot, Market Analyst, Market Analysis and Research
Alexander Riveros, Trade Law Associate Expert, Business Environment Section, Division of Business and Institutional Support
At the United Nations Conference on Trade and Development (UNCTAD)
Bismark Sitorus, Economic Affairs Officer, Trade Facilitation Section, Trade Logistics Branch, Division on Technology and Logistics
Jan Hoffmann, Chief, Trade Facilitation Section, Trade Logistics Branch, Division on Technology and Logistics
At the World Bank
Christina Busch, Trade Logistics & Facilitation, International Trade Unit
We thank Michael Fisher for his excellent editing work and Neil Weinberg for his superb graphic design and layout.
AT THE WORLD ECONOMIC FORUM
Professor Klaus Schwab, Executive Chairman
Espen Barth Eide, Managing Director
Jennifer Blanke, Senior Director, Chief Economist
John Moavenzadeh, Senior Director, Mobility Industries
Editors
Sean Doherty, Director, Head of Supply Chain and Transport Industries
Margareta Drzeniek Hanouz, Lead Economist, Director, Global Competitiveness and Benchmarking Network
Thierry Geiger, Economist, Associate Director, Global Competitiveness and Benchmarking Network
Global Competitiveness and Benchmarking Network
Beñat Bilbao-Osorio, Senior Economist, Associate Director
Ciara Browne, Associate Director
Gemma Corrigan, Project Associate
Roberto Crotti, Quantitative Economist, Manager
Attilio Di Battista, Junior Quantitative Economist, Senior Associate
Gaëlle Dreyer, Project Associate
Caroline Galvan, Economist, Manager
Tania Gutknecht, Community Manager, Manager
Cecilia Serin, Team Coordinator, Senior Associate
Mobility Industries
Francesca Bianchi, Coordinator, Mobility Industries
Jieun Chung, Senior Manager, Supply Chain & Transport Industries
OTHER KEY CONTRIBUTORS
At the Inter-American Development Bank
Antoni Estevadeordal, Manager, Integration and Trade Sector
Paolo Giordano, Principal Economist, Trade and Integration Sector
Mauricio Mesquita Moreira, Principal Economic Advisor and Research Coordinator, Integration and Trade Sector
At the World Bank
Jean-François Arvis, Senior Transport Economist, Trade Logistics & Facilitation, International Trade Unit
Cecilia Briceño-Garmendia, Lead Economist, Sustainable Development Department, Latin America and the Caribbean Region
Harry Moroz, Infrastructure Specialist, Sustainable Development Department, Latin America and the Caribbean Region
Anasuya Raj, Consultant, International Trade Unit
At Developing Trade Consultants Ltd.
Ben Shepherd, Principal
Contributors
© 2014 World Economic Forum

© 2014 World Economic Forum

The Global Enabling Trade Report 2014 | vii
The Global Enabling Trade Report 2014 is launched at a time of restored hope for global trade. After several difficult years trying to advance the Doha Round, the Bali package, which was agreed to just a few months ago, and which has the Trade Facilitation Agreement at its centre, has the potential to enable progress on many of the practical obstacles faced by businesses. This is good news as the alternative to progress via a global trade regime is a proliferation of regional or inter-regional trade agreements, which could lead to compartmentalization of norms and rules in the international trade system.
However, real-world impact will come only with implementation of the negotiated measures. The 2014 Enabling Trade Index presented in this Report therefore sets a benchmark to assess trade facilitation reforms agreed to in Bali. We hope to see significant advances by the time we launch the 2016 edition of this Report. The World Economic Forum will continue to support public-private co-operation and dialogue towards this goal, focusing on practical steps to overcome trade barriers of many forms.
National trade policy has become more complex; it is no longer largely about tariff reduction. Decision-making is less straightforward, requiring collaboration among stakeholders as well as coalitions of government departments, outsourced providers, infrastructure investors and digital expertise. At the same time, the rise of global value chains makes the prize bigger. The success of many countries that punch above their weight in the Enabling Trade Index shows what can be done.
Since the 2012 edition of the Global Enabling Trade Report, the Forum and its partner companies, together with selected governments, have sought to better understand the value of trade facilitation and how to make it happen. The Valuing Growth Opportunities study reported that reducing even a restricted set of trade barriers halfway to the level of global best practices would yield close to a five percent increase in global GDP. Developing regions and smaller enterprises would see the largest gains. To achieve these gains, governments would need to take a more supply-chain focused approach to trade reform, both in international coordination and domestic action.
From Valuation to Action, another output from the Forum’s Enabling Trade programme, points specifically to broader benefits of reducing supply-chain barriers to society at large. These include a minimization of food waste, a major challenge to sustainably feed the world’s growing population. Reciprocally, gaining the support of a cohesive industrial sector, such as automotive manufacturers, can be an effective tool in securing trade facilitation reforms.
Our experience from working with business and governments to foster change is that trade in goods has indeed become intricately intertwined with cross-border investment, trade in services and the international movement of workers. During the lifetime of this Report series, we have seen the global trade reform narrative shift strongly to addressing border management concerns. A newly emerging emphasis is on behind-the-border issues, with modularity and replicability as key criteria for companies seeking to trade and invest. The world is now faced with both the implementation challenge stemming from Bali and, for more advanced economies, the question of “what’s next for twenty-first century trade facilitation?”
The Enabling Trade index provides a reminder of the fundamental attributes that govern a nation’s ability to benefit from trade. Since its introduction in 2008 it has become a widely used reference, forming part of the toolbox of many countries in their efforts to benefit from trade and helping companies with their investment decisions.
The Enabling Trade programme is supported by the World Economic Forum’s Supply Chain & Transport Industry Partnership community. We are grateful to: A.P. Møller-Maersk, AB Volvo, Agility, Brambles Limited, Brightstar Corp., Deutsche Post DHL, DNB ASA, Emirates Group, International Container Terminal Services Inc., Royal Vopak, Stena AB, Swiss International Airlines Ltd, Transnet SOC Ltd, UPS and Volkswagen AG.
We also thank our Data Partners for making data available: the Global Express Association, the International Air Transport Association, the International Trade Centre, the United Nations Conference on Trade and Development, The World Bank, the World Customs Organization and the World Trade Organization.
Appreciation goes also to World Economic Forum team members Francesca Bianchi, Jennifer Blanke, Jieun Chung, Attilio Di Battista, Sean Doherty, Margareta Drzeniek Hanouz, Thierry Geiger and John Moavenzadeh.
Finally, this Report would not have been possible without the support of our network of over 160 Partner Institutes worldwide that carry out the Executive Opinion Survey, which is a critical input into this work.
PrefaceESPEN BARTH EIDE
Managing Director and Member of the Managing Board
World Economic Forum
© 2014 World Economic Forum

© 2014 World Economic Forum
The Global Enabling Trade Report 2014 | 1
CHAPTER 1
The Enabling Trade Index 2014ATTILIO DI BATTISTA
SEAN DOHERTY
MARGARETA DRZENIEK HANOUZ
THIERRY GEIGER
World Economic Forum
In December 2013, the 159 members of the World Trade Organisation (WTO) adopted the so-called “Bali Package” during the Ninth WTO Ministerial Conference. The culmination of nine years of negotiations, the package contains a series of measures to streamline trade, allow developing countries more options for providing food security, boost least-developed countries’ trade and help development more generally. The adoption of the package has instilled new momentum into the troubled multilateral trading system (MTS), at a time when international governance in general continues to struggle.
As part of the Bali Package, WTO members adopted the Trade Facilitation Agreement, which contains provisions for faster and more efficient customs procedures through effective cooperation between customs and other appropriate authorities on trade facilitation and customs compliance issues. It also contains provisions for technical assistance and capacity building (see Box 1).
Since the success in Bali, trade facilitation has been high on the agenda of governments, businesses and development partners. The heightened interest represents a window of opportunity for policymakers, especially in developing countries, to push through trade-enabling measures. As the conclusion of the full Doha Development Agenda remains a distant prospect and in absence of real progress in market access negotiations, these measures represent a way of reaping important benefits of trade. In this context, The Global Enabling Trade Report provides a tool for the international trade community to monitor progress on implementing these measures.
The measures include not only those related to market access, such as tariffs and nontariff barriers, but also those that facilitate trade at the more practical level, with more efficient border administration, better infrastructure and telecommunications and improved regulatory and security regimes that secure property rights and reduce transactions costs. The empirical literature offers ample evidence of the importance of these factors (see Box 2). For instance, research suggests that the quality of logistics, connectivity and border administration plays an equally, if not more important role than tariffs in determining bilateral trade costs (see Box 6).
Reducing trade barriers enables trade and thereby contributes to prosperity and welfare through various channels (see Box 2). It is one of the objectives of this Report to convey this important message. After much debate, the nexus between trade and growth, and in turn between growth and poverty reduction, is now widely accepted (Bhagwati, 2013). For the United Nations’ Open Working Group tasked with formulating the post-2015 sustainable development agenda, trade represents an important means of eradicating extreme poverty and achieving sustainability (United Nations,
© 2014 World Economic Forum

Chapter 1: The Enabling Trade Index 2014
2 | The Global Enabling Trade Report 2014
GLOBAL AGENDA COUNCIL ON TRADE AND FOREIGN DIRECT INVESTMENT1
Following the founding of the General Agreement on Tariffs and Trade (GATT) in 1947, tariff and quota barriers to mer-chandise trade were slashed, while advances in transportation and communications eroded the real costs of moving goods across borders. These successes have turned the spotlight to less obvious impediments, especially administrative and logistical hassles. The crowning achievement of the Ninth WTO Ministerial Conference, held in Bali in December 2013, was the Trade Facilitation Agreement, aimed at reducing such hassles.
The agreement has two sections. Section I includes pro-visions for expediting the movement, release and clearance of goods. It clarifies and improves articles V, VIII and X of the GATT 1994 and is composed of thirteen articles that cover the following issues:
1. Publication and availability of information2. Opportunity to comment, information before entry
into force and consultation3. Advance rulings4. Appeal or review procedures5. Other measures to enhance impartiality,
non-discrimination and transparency6. Disciplines on fees and charges imposed or on
in connection with importation and exportation7. Release and clearance of goods8. Border agency cooperation9. Movements of goods under customs control
intended for import10. Formalities connected with the importation and
exportation and transit11. Freedom of transit12. Customs cooperation13. Institutional arrangements
Section 2 includes special and differential treatment for developing and least-developed countries to implement the agreement. The extent and timing of implementation of each of the provisions is related to a country’s implementation capac-ity. Accordingly, each country will decide which provisions to implement immediately after entry into force (Category A), after a transitional period (Category B) or after a transitional period and implementation capacity has been acquired through the provision of assistance and support to build capacity.
Based on calculations published by Hufbauer and Schott (2013), the agreement could deliver $1 trillion of GDP gains to the world economy.
How does this claim stand up? Zaki (2014) offers the lat-est estimates, using a computable general equilibrium (CGE) framework to calculate the potential gains from trade facilita-tion.2 The author’s first step was to convert a country’s admin-istrative barriers, measured by the time required for imports and exports to clear the border, into an ad valorem tariff equivalent (AVE) figure. Unsurprisingly, crossing times weigh more heavily on the landed cost of imports (a simple average of 27.5% AVE) than on exports (14.4%). In terms of regions, the United States and some advanced Asian economies have the least red tape (less than 3% AVE), with the European Union not far behind (just over 5%). However, red tape costs exceed 25% in Sub-Saharan Africa and 30% in the Middle East.
According to Zaki’s estimates, administrative AVEs exceed tariffs in nine of thirteen regions. Moreover, administrative costs are “iceberg costs”; that is, all the resources spent on overcoming administrative barriers are simply lost, rather than gathered in government coffers like a tariff. In light of these
two observations, it is not surprising that the author finds that halving trade facilitation costs could deliver nearly ten times the benefit as halving tariffs. In Table 1, we report Zaki’s percent-age gains and convert those gains into 2005 US$.
Based on Zaki’s estimates, ambitious improvements in trade facilitation could add nearly 1.8% to global GDP in the long run—some US$ 1.2 trillion by 2020. Sub-Saharan African countries could see their exports rise by 22.3%, while Latin American and Asian exports grow by 16.2%. EU exports could increase by 10.6%, largely because many Eastern European countries are buried in red tape. Exports from the rest of the developed world increase modestly, with US and Japanese exports increasing by 3.9% and 2.1%, respectively.
Notes1 See the About the Authors section at the end of the Report for the
list of Council Members.
2 Earlier efforts at quantification are reported in Hufbauer and Schott (2013) and the World Bank and World Economic Forum (2013).
ReferencesFouré, J., A. Bénassy-Quéré and L. Fontagné. 2010. “The World
Economy in 2050: A Tentative Picture”. CEPII Working paper 2010-27. Paris: CEPII.
Hufbauer, G., Clyde and J. J. Schott. 2013. “Payoff from the World Trade Agenda”. Peter G. Peterson Institute for International Economics. Washington, DC.
World Bank. 2013. World Development Indicators database. Washington, DC.
World Economic Forum. 2013. “Enabling Trade Valuing Growth Opportunities”. Geneva.
Zaki, C. “An empirical assessment of the trade facilitation initiative: econometric evidence and global economic effects”. In World Trade Review, 2014, 13: 103–130.
Box 1: The Bali Package and Potential Gains from Trade Facilitation
Table 1: Estimates of the gains by 2020 brought about by improved trade facilitation
GDP gains* Export gains†
Country/Region Percent US$ billions Percent US$ billions
Australia and New Zealand 1.29 7 8.00 8
Brazil 0.37 5 4.38 7
Canada 1.41 22 5.00 20
China 1.45 124 8.83 187
Egypt 2.24 5 8.83 2
European Union 2.04 348 10.60 629
India 0.91 21 9.56 35
Japan –0.12 –6 2.10 15
Korea, Rep. 2.18 29 8.18 52
Mexico 2.47 33 11.79 49
Middle East 5.66 30 13.66 22
North Africa 4.44 15 11.21 14
Other Africa 7.28 47 22.28 46
Other Asia 7.97 283 16.18 211
Other Europe and Turkey 3.75 36 15.04 49Other Latin America
and the Caribbean 3.07 40 16.20 40
Russian Federation 2.83 35 7.88 25
South Africa 3.36 13 17.93 16
United States 0.55 90 3.90 61
Total 1.78 1,177 8.23 1,488
Sources: Zaki (2014), CEPII (2010) and World Bank (2013).Note: All US$ amounts expressed in 2005 prices.*Zaki (2014) reports welfare gains, which include net income transfers, rather than GDP
gains. The two are close for most countries. † Dollar export gains are calculated based on 2012 merchandise exports to GDP ratios
from the World Development Indicators. The figures include intra–regional exports, where applicable.
© 2014 World Economic Forum

The Global Enabling Trade Report 2014 | 3
Chapter 1: The Enabling Trade Index 2014
Box 2: The Gains of Trade-Enabling Measures
As countries and international negotiations increasingly focus on trade facilitation, researchers have turned their attention to assessing the impact of such trade-enabling measures on trade and welfare, generally finding a significant positive relationship.
The OECD’s Moïsé and Sorescu (2013) use sixteen Trade Facilitation Indicators (TFIs) to assess how improvements in different aspects of trade facilitation could lower trade costs and increase trade volumes. Their study is particularly useful as the TFIs largely mirror the articles of the Trade Facilitation Agreement adopted in Bali in December 2013 (still under negotiation at the time the paper was written). The authors find the following specific measures to have the largest overall impact on trade: improving information availability; expediting border formalities in terms of necessary documents, process automation and simplification of procedures; enhancing the transparency and the governance of customs authorities.
Hoekman and Shepherd (2013) focus on the distributional effects of trade facilitation, assessing whether large “lead” firms capture most of the benefits accruing to the actors operating along global value chains (GVC). This has important implications in terms of efficiency and equality, both within and across countries, since most “lead” firms are directly or indirectly controlled by large corporations based in developed countries. Using firm-level data from the World Bank Enterprise Surveys, the authors explore whether, in the presence of increased trade facilitation, the percentage of sales generated by direct exports increases more among larger firms (average time to export as indicated by firms has been used as a proxy for trade facilitation). According to their findings, trade facilitation benefits all actors within the global value chain, and there is no evidence of significant differences according to firm size.
The ongoing negotiation of the Transatlantic Trade and Investment Partnership (TTIP) and of the Trans-Pacific Partnership Agreement (TPPA) has also spurred further research on the potential impact of trade facilitation.
The Centre for Economic Policy Research (CEPR, 2013) estimated the potential economic gains given by the TTIP under different scenarios. The most comprehensive and ambitious version of the agreement, corresponding to a full elimination of tariffs, a 25% decrease of non-tariff barriers (NTBs) on both goods and services and a 50% reduction of NTBs on procurement, would result in a permanent increase of annual GDP of about US$ 95 billion for the United States, US$ 119 billion for the European Union and US$ 99 billion for the rest of the world. The reduction of NTBs could account for as much as 80% of these economic gains.
Petri et al. (2011) have estimated that annual global GDP could increase by as much as US$ 104 billion thanks to the implementation of the TPPA. This figure would increase
to US$ 862 billion if trade liberalization went as far as establishing a Free Trade Area in Asia-Pacific. Vietnam, Hong Kong SAR, Russia and Malaysia would benefit the most from this scenario.
The gains of trade-enabling measures are multiple and far reaching, extending beyond trade and contributing to broader development objectives. These include:
• Export competitiveness. Reducing trade costs and lead times make local firms more competitive in international markets. This increases the likelihood that existing exporting firms will survive and that new firms will start exporting.
• Private sector development and foreign direct investment. Lower trade costs and entry barriers attract foreign direct investors, thus creating jobs and providing local producers and consumers with more and better products.
• Market integration. As trade costs fall, it is easier for economies to integrate regionally. And, unlike preferential trade agreements (PTA), which may under certain circumstances lead to trade diversion, most aspects of trade facilitation benefit every actor along the supply chain, be it domestic or foreign, within or outside the PTA.
• Economic growth and employment. Trade facilitation represents an opportunity to stimulate growth and employment through additional investment in transport and trade-related infrastructure.
• Finally, most trade-enabling measures have positive spillover effects. Improvements in one area can lead to improvement in others. For instance, reducing the number of documents required to trade goods is likely to reduce processing times and to limit room for corruption and discretionary measures. Automation of certain procedures or publishing on the Internet customs regulations will yield similar effects.
ReferencesCentre for Economic Policy Research. 2013. “Reducing Transatlantic
Barriers to Trade and Investment. An Economic Assessment.” London.
Hoekman, B. and Shepherd B. 2013. “Who Profits from Trade Facilitation Initiatives”. ARTNet Working Paper No. 129.
Moïsé, E. and S. Sorescu. 2013. “Trade Facilitation Indicators: The Potential Impact of Trade Facilitation on Developing Countries’ Trade”. OECD Trade Policy Papers, No. 144. Paris: OECD.
Petri, P. A., M. G. Plummer, and F. Zhai. 2011. “The Trans-Pacific Partnership and Asia-Pacific Integration: A Quantitative Assessment”. East-West Center Working Papers – Economic Series, No. 119. Honolulu: East-West Center.
2014). Since 2008, throughout the Great Recession and in its aftermath, trade has contributed to averting a deeper crisis, as countries around the world have resisted protectionism. Today, as the world is grappling with economic uncertainty, geopolitical upheaval, social tensions and humanitarian crises, trade remains a vector of peace, development, prosperity and opportunity.
THE ENABLING TRADE INDEXThe Global Enabling Trade Report (GETR) series has been published by the World Economic Forum since 2008, initially on an annual basis, and biennially since 2010. From the beginning, the assessment has been based on the Enabling Trade Index (ETI). The index was developed within the context of the World Economic Forum’s Enabling Trade program, with the help of leading academia and partner organizations and companies,
© 2014 World Economic Forum

Chapter 1: The Enabling Trade Index 2014
4 | The Global Enabling Trade Report 2014
including A.P. Möller Maersk, AB Volvo, Agility, Brightstar Corp., Deutsche Post DHL, DNB ASA, Emirates Group, International Container Terminal Services Inc., Royal Vopak, Stena AB, Swiss International Airlines Ltd, Transnet SOC Ltd, UPS and Volkswagen AG.
The ETI assesses the extent to which economies have in place institutions, policies, infrastructures and services facilitating the free flow of goods over borders and to their destination. This set of trade-enabling factors are organized in four main categories (or subindexes): market access, border administration, infrastructure and operating environment. Thus, the scope of the ETI is much broader than trade facilitation as conceived by most international organizations (see Box 3).
The ETI FrameworkAs a composite indicator, the ETI is a compilation of individual indicators into a single index, on the basis of the underlying ETI framework. The framework has evolved since its inception. This evolution has been driven by the availability of new indicators, feedback collected over the years, and evidence from theoretical and empirical literature.
The ETI framework captures the various dimensions of enabling trade, breaking them into four overall issue areas, called subindexes:
A. Market access. This subindex measures the extent and complexity of a country’s tariff regime, as well as tariff barriers faced and preferences enjoyed by a country’s exporters in foreign markets.
B. Border administration. This subindex assesses the quality, transparency and efficiency of border administration of a country.
C. Infrastructure. This subindex assesses the availability and quality of transport infrastructure of a country, associated services, and communication infrastructure, necessary to facilitate the movement of goods within the country and across the border.
D. Operating environment. This subindex measures the quality of key institutional factors impacting the business of importers and exporters active in a country.
These four areas are in turn subdivided into components, called pillars, that capture more specific aspects within their respective broad issue areas. Each of them is composed of a number of indicators. Figure 1 describes the ETI framework, while Appendix A at the end of this Report details the composition and computation of the ETI. The seven pillars each measure critical aspects of enabling trade.
The Market access subindex is composed of two pillars:
• Pillar 1: Domestic market access (6 indicators). The pillar assesses the level and complexity of a
country’s tariff protection as a result of its trade policy. This component includes the effective trade-weighted average tariff applied by a country, the share of goods imported duty free and the complexity of the tariff regime, measured through tariff variance, the prevalence of tariff peaks and specific tariffs, and the number of distinct tariffs.
• Pillar 2: Foreign market access (2 indicators). The pillar assesses tariff barriers faced by a country’s exporters in destination markets. It includes the average tariffs faced by the country as well as the margin of preference in destination markets negotiated through bilateral or regional trade agreements or granted in the form of trade preferences.
The Border administration subindex is composed of a single pillar:
• Pillar 3: Efficiency and transparency of border administration (11 indicators). The pillar assesses the efficiency and transparency of border administration. More specifically, it captures efficiency, transparency and costs associated with importing and exporting goods. It includes an assessment of the range and quality and comprehensiveness of key services offered by customs and related agencies, the average time, costs and number of documents required to, respectively, import and export goods. The pillar also assesses the time predictability of border procedures, as well as the transparency of the process, as measured by the availability and quality of information provided by border agencies and the prevalence of corruption.
The Infrastructure subindex is composed of three pillars:
• Pillar 4: Availability and quality of transport infrastructure (7 indicators). This pillar measures the availability and quality of domestic infrastructure for each of the four main modes of transport: road, air, railroad and sea port infrastructures. Air connectivity and sea line connectivity are also assessed.
• Pillar 5: Availability and quality of transport services (6 indicators). A necessary complement to the previous one, this pillar assesses the availability and quality of transport services, including the presence and competencies of shipping and logistics companies in the country, and the ease, cost and timeliness of shipment. In addition, this pillar includes a measure of postal efficiency.
• Pillar 6: Availability and use of ICTs (7 indicators). This pillar evaluates the availability and quality of information and communication technologies
© 2014 World Economic Forum

The Global Enabling Trade Report 2014 | 5
Chapter 1: The Enabling Trade Index 2014
(ICTs) in a country, as proxied by the use of mobile telephony and Internet by the population at large, by companies for business transactions, and by the government for interacting with citizens. It also takes into account the quality of Internet access, as broadband access has become the norm to fully leverage the potential of the Internet.
Finally, the Operating environment subindex is composed of a single pillar:
• Pillar 7: Operating environment (17 indicators). This pillar assesses the quality of a country’s operating environment, which significantly impacts the capacity of companies that export, import, trade and/or transport merchandise to do business. It
assesses a country’s level of protection of property rights; the quality and impartiality of its public institutions, including of the judiciary in commercial disputes; the availability of finance, including trade finance; its openness to foreign participation in terms of foreign investment and labour; as well as the level of physical security approximated by the incidence of crime and terrorism.
Pillar scores are computed as the arithmetic mean of the composing individual indicators, which are first transformed on a common scale ranging from 1 to 7, with 7 indicating the best possible outcome. Subindex scores correspond to the arithmetic means of the respective comprising pillars. Consequently, subindex and overall scores always range from 1 to 7.
Box 3: Various Definitions of Trade Facilitation
All international organizations recognize that trade performance depends on many more factors than trade policy alone. This set of additional factors is often regrouped under the heading of trade facilitation. The scope of trade facilitation differs across organizations active in this field. The ETI takes a more holistic approach by considering all trade-enabling measures. For the sake of comparison, we summarize the approach of various international organisations to trade facilitation:
• World Trade Organization. The WTO defines trade facilitation as “the simplification and harmonisation of international trade procedures” covering the “activities, practices and formalities involved in collecting, presenting, communicating and processing data required for the movement of goods in international trade.” In the Doha Development Agenda, trade facilitation negotiations focus on freedom of transit, fees and formalities related to importing and exporting and transparency of trade regulations – which essentially relates to border procedures such as customs and port procedures and transport formalities. 1
• European Commission. The Commission defines trade facilitation as the simplification and harmonization of international trade procedures including import and export procedures, which largely refer to the activities (practices and formalities) involved in collecting, presenting, communicating and processing the data required for the movement of goods in international trade. 2
• Organization for Economic Co-operation and Development. For the OECD, trade facilitation is about streamlining and simplifying international trade procedures in order to allow for easier flow of goods and trade at both national and international level. 3
• United Nations Conference on Trade and Development. For UNCTAD, any measure that eases a trade transaction and leads to time and cost reductions in the transaction cycle fits into the category of trade facilitation. The latter can be effected through more
efficient procedures and operations or through removing any deadweight economic loss and redundancies. It may cover measures regarding: (a) formalities, procedures and documents and the use of standard and electronic messages for trade transactions; (b) the physical movement of goods through improvements in services, the legal framework, and the transport and communications infrastructure, as well as the use of modern information technology tools by services providers and users; and (c) the timely discussion and dissemination of trade-related information to all concerned parties. 4
• World Customs Organization. For the WCO trade facilitation amounts to the avoidance of unnecessary trade restrictiveness. This can be achieved by applying modern techniques and technologies, while improving the quality of controls in an internationally harmonized manner. 5
• World Bank. The term trade facilitation refers to a series of complex, border and behind-border measures. Broadly defined, these measures include anything from institutional and regulatory reform to customs and port efficiency and are inherently far more intricate and costly to implement. The Bank’s areas of focus are: infrastructure investment; customs modernization and border-crossing environment; streamlining of documentary requirements and information flows; automation and electronic data interchange (EDI); ports efficiency; logistics and transport services; regulation and competitiveness; transit and multimode transport; and transport security. 6
Notes1 See http://gtad.wto.org/trta_subcategory.aspx?cat=33121.
2 See http://ec.europa.eu/taxation_customs/customs/policy_issues/trade_falicitation/index_en.htm.
3 See http://www.oecd.org/tad/facilitation/whatistradefacilitation.htm.
4 See http://unctad.org/en/Docs/sdtetlb20051_en.pdf.
5 See http://www.wcoomd.org/en/topics/facilitation/overview/customs-procedures-and-facilitation.aspx.
6 See http://go.worldbank.org/QWGE7JNJG0.
© 2014 World Economic Forum

Chapter 1: The Enabling Trade Index 2014
6 | The Global Enabling Trade Report 2014
Since the pilot edition in 2008, the methodology of the ETI has evolved. The framework was revamped in 2009 based on the feedback received. The methodology remained essentially unchanged in the two subsequent editions (2010 and 2012). For the 2014 edition—the fifth in the series—we have introduced a number of innovations and methodological changes to further improve the soundness of the framework and increase its relevance as a policy tool. As a result of this modernization effort, the results are not strictly comparable over time. While the four subindexes have been maintained, the number of pillars has been reduced from nine to seven. We have added a number of indicators, thus allowing for a more granular analysis, and excluded several, mostly within the operating environment subindex, that were not directly linked to enabling trade. We believe that the significant improvements to the methodology offset the costs associated with the loss of comparability over time.
Despite these latest improvements, it was not possible to fully cover some key concepts relevant to enabling trade due to a lack of data (see Box 4). We hope to fill these gaps in future editions of the ETI.
DataThe 56 indicators used in the ETI are sourced from various organizations, several of which provided guidance and support in designing the ETI framework, creating new indicators or providing privileged or
advanced access to their proprietary datasets. The International Trade Centre, the Global Express Association, the World Bank, the World Trade Organization and UNCTAD are among the long-standing partners of the project.1
In addition, 23 indicators, accounting for 36% of the ETI score, are derived from the World Economic Forum’s Executive Opinion Survey (EOS).2 The Forum has conducted the EOS annually for over 30 years, making it one of the longest-running and most extensive global surveys on the business environment.3 The 2013 edition of the EOS gathered the opinion of 13,000 respondents from 148 economies. The EOS results are used in the computation of the Enabling Trade Index and other Forum indexes, including the Global Competitiveness Index, the Networked Readiness Index, the Travel & Tourism Competitiveness Index and the Gender Gap Index, as well as in a number of regional studies. In addition, the EOS data has long served a number of international and local organizations, government bodies, academia, as well as the private sector to inform policy work, strategies and investment decisions.
In terms of coverage, among the 7,728 individual data points used for the computation of the ETI 2014 (i.e. 138 economies times 56 individual indicators), only 102 (1.3%) are missing.
Subindex C.
Infrastructure
Subindex B. Border
administration
Subindex A.
Market access
Figure 1: The Enabling Trade Index Framework
FOREIGN MARKET
Imports
Exports
Exports
Imports
DOMESTIC MARKET
Subindex D. Operating environment
Pillar 7. Operating environment
Pillar 5. Availability and quality of transport
services
Pillar 3. Efficiency and transparency
of border administration
Pillar 4. Availability and quality of transport
infrastructure
Pillar 6. Availability
and use of ICTs
Pillar 1. Domestic
market access
Pillar 2. Foreign
market access
© 2014 World Economic Forum
The Global Enabling Trade Report 2014 | 7
Chapter 1: The Enabling Trade Index 2014
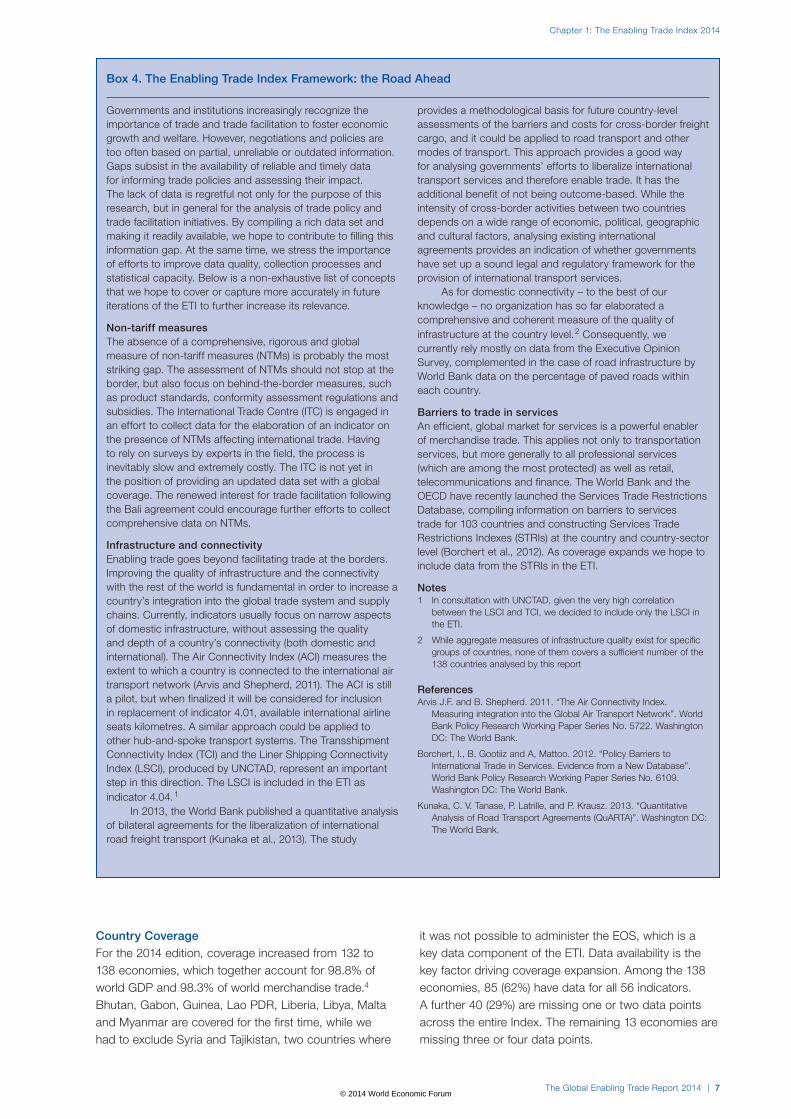
Country CoverageFor the 2014 edition, coverage increased from 132 to 138 economies, which together account for 98.8% of world GDP and 98.3% of world merchandise trade.4 Bhutan, Gabon, Guinea, Lao PDR, Liberia, Libya, Malta and Myanmar are covered for the first time, while we had to exclude Syria and Tajikistan, two countries where
it was not possible to administer the EOS, which is a key data component of the ETI. Data availability is the key factor driving coverage expansion. Among the 138 economies, 85 (62%) have data for all 56 indicators. A further 40 (29%) are missing one or two data points across the entire Index. The remaining 13 economies are missing three or four data points.
Box 4. The Enabling Trade Index Framework: the Road Ahead
Governments and institutions increasingly recognize the importance of trade and trade facilitation to foster economic growth and welfare. However, negotiations and policies are too often based on partial, unreliable or outdated information. Gaps subsist in the availability of reliable and timely data for informing trade policies and assessing their impact. The lack of data is regretful not only for the purpose of this research, but in general for the analysis of trade policy and trade facilitation initiatives. By compiling a rich data set and making it readily available, we hope to contribute to filling this information gap. At the same time, we stress the importance of efforts to improve data quality, collection processes and statistical capacity. Below is a non-exhaustive list of concepts that we hope to cover or capture more accurately in future iterations of the ETI to further increase its relevance.
Non-tariff measuresThe absence of a comprehensive, rigorous and global measure of non-tariff measures (NTMs) is probably the most striking gap. The assessment of NTMs should not stop at the border, but also focus on behind-the-border measures, such as product standards, conformity assessment regulations and subsidies. The International Trade Centre (ITC) is engaged in an effort to collect data for the elaboration of an indicator on the presence of NTMs affecting international trade. Having to rely on surveys by experts in the field, the process is inevitably slow and extremely costly. The ITC is not yet in the position of providing an updated data set with a global coverage. The renewed interest for trade facilitation following the Bali agreement could encourage further efforts to collect comprehensive data on NTMs.
Infrastructure and connectivityEnabling trade goes beyond facilitating trade at the borders. Improving the quality of infrastructure and the connectivity with the rest of the world is fundamental in order to increase a country’s integration into the global trade system and supply chains. Currently, indicators usually focus on narrow aspects of domestic infrastructure, without assessing the quality and depth of a country’s connectivity (both domestic and international). The Air Connectivity Index (ACI) measures the extent to which a country is connected to the international air transport network (Arvis and Shepherd, 2011). The ACI is still a pilot, but when finalized it will be considered for inclusion in replacement of indicator 4.01, available international airline seats kilometres. A similar approach could be applied to other hub-and-spoke transport systems. The Transshipment Connectivity Index (TCI) and the Liner Shipping Connectivity Index (LSCI), produced by UNCTAD, represent an important step in this direction. The LSCI is included in the ETI as indicator 4.04. 1
In 2013, the World Bank published a quantitative analysis of bilateral agreements for the liberalization of international road freight transport (Kunaka et al., 2013). The study
provides a methodological basis for future country-level assessments of the barriers and costs for cross-border freight cargo, and it could be applied to road transport and other modes of transport. This approach provides a good way for analysing governments’ efforts to liberalize international transport services and therefore enable trade. It has the additional benefit of not being outcome-based. While the intensity of cross-border activities between two countries depends on a wide range of economic, political, geographic and cultural factors, analysing existing international agreements provides an indication of whether governments have set up a sound legal and regulatory framework for the provision of international transport services.
As for domestic connectivity – to the best of our knowledge – no organization has so far elaborated a comprehensive and coherent measure of the quality of infrastructure at the country level. 2 Consequently, we currently rely mostly on data from the Executive Opinion Survey, complemented in the case of road infrastructure by World Bank data on the percentage of paved roads within each country.
Barriers to trade in servicesAn efficient, global market for services is a powerful enabler of merchandise trade. This applies not only to transportation services, but more generally to all professional services (which are among the most protected) as well as retail, telecommunications and finance. The World Bank and the OECD have recently launched the Services Trade Restrictions Database, compiling information on barriers to services trade for 103 countries and constructing Services Trade Restrictions Indexes (STRIs) at the country and country-sector level (Borchert et al., 2012). As coverage expands we hope to include data from the STRIs in the ETI.
Notes1 In consultation with UNCTAD, given the very high correlation
between the LSCI and TCI, we decided to include only the LSCI in the ETI.
2 While aggregate measures of infrastructure quality exist for specific groups of countries, none of them covers a sufficient number of the 138 countries analysed by this report
ReferencesArvis J.F. and B. Shepherd. 2011. “The Air Connectivity Index.
Measuring integration into the Global Air Transport Network”. World Bank Policy Research Working Paper Series No. 5722. Washington DC: The World Bank.
Borchert, I., B. Gootiiz and A, Mattoo. 2012. “Policy Barriers to International Trade in Services. Evidence from a New Database”. World Bank Policy Research Working Paper Series No. 6109. Washington DC: The World Bank.
Kunaka, C. V. Tanase, P. Latrille, and P. Krausz. 2013. “Quantitative Analysis of Road Transport Agreements (QuARTA)”. Washington DC: The World Bank.
© 2014 World Economic Forum

Chapter 1: The Enabling Trade Index 2014
8 | The Global Enabling Trade Report 2014
ENABLING TRADE INDEX 2014 RESULTSTables 1–5 present the rankings for the overall ETI, the four subindexes, and five of the seven pillars of the Enabling Trade Index. Rankings and scores for pillars 3 and 7 are not reported since they are the same as for the border administration subindex and the operating environment subindex, respectively.
General TrendsNot unexpectedly, advanced economies are better at enabling trade than developing countries. They dominate the ETI rankings, with 17 advanced economies among the top 20. These countries typically enjoy lower trade costs not only because their tariffs are low, but also because economic development itself is intimately associated with enhanced capabilities in administration, infrastructure and telecommunications and regulation. As developing countries take on a more prominent role in the global economy and are becoming the drivers of international trade, these issues are bound to assume increasing significance.
Performance in the ETI largely mirrors the position on the development ladder. A higher level of income is typically associated with a higher ETI score (see Figure 2). High-income countries perform systematically better across the different pillars, with the noteworthy exception of the foreign market access pillar, where the relation is inversed (see Figure 4). Expectedly, low-income countries typically enjoy better market access conditions abroad, notably through preferential trade agreements.5 In other pillars, the gap between advanced economies and the developing world remains large.
Despite the strength of the relationship between income and performance in the ETI, there are exceptions. More open economies (as measured by the sum of merchandise imports and exports, divided by GDP) perform better, all else being equal. Global trade hubs like Singapore, Hong Kong SAR, the Netherlands, the UAE and Taiwan, as well as certain export-led economies such as Malaysia, Thailand, Vietnam and Cambodia, typically do better than most of the other, more closed economies at a similar stage of development. Figure 2 also reveals that commodity-rich countries perform, on average, much worse than other nations with a similar level of income. Among the 29 countries where mineral products account for more than 50% of total exports, 21 score below their respective income group averages.6 In addition, in the four lowest-ranked countries in the ETI (Guinea, Angola, Venezuela and Chad, which ranks last) and 14 of the bottom 20, the share of mineral products in total exports is above 70%. And the worst performers in Latin America (Venezuela), Developing Asia (Mongolia), Middle East and North Africa (Iran), and Sub-Saharan Africa (Chad) have a share above 70%.
Within the developing world, differences across regions are relatively small, although some patterns emerge (see Figure 3). Central and Eastern Europe outperforms the other regions by a small margin in five of the seven pillars of the index. The region is dominated by Eastern members of the EU, namely Latvia (41st), Lithuania (44th), and Poland (45th). At the other end of the spectrum, the Sub-Saharan Africa region, home
1 10 100 1,000 10,000 100,000 1,000,000
1
2
3
4
5
6
7
Singapore
Kuwait
Russian FederationLybiaAlgeria
MongoliaAngola
Gabon
Iran, Islamic Rep.
Venezuela
Figure 2: GDP per capita and the Enabling Trade Index 2014
Sources: IMF, World Economic Outlook (October 2013 edition) and World Economic Forum.
ETI 2
014
scor
e (1
–7)
GDP per capita (US$, log scale), 2012
© 2014 World Economic Forum

The Global Enabling Trade Report 2014 | 9
Chapter 1: The Enabling Trade Index 2014
Figure 3: The Enabling Trade Index 2014: Regional averages and best performers
Note: Based on IMF classification (see Table 1).
1
2
3
4
5
6
7
7. Operatingenvironment
6. Availabilityand use of
ICTs
5. Availabilityand qualityof transport
services
4. Availabilityand qualityof transport
infrastructure
3. Efficiencyand transparency
of borderadministration
2. Foreignmarketaccess
1. Domesticmarketaccess
ENABLINGTRADE INDEX
2014
Average of 5 best performers
Advanced Economies
Central and Eastern Europe
Commonwealth of Independent States
Developing Asia
Latin America and the Caribbean
Middle East, North Africa, and Pakistan
Sub-Saharan Africa
ETI 2
014
scor
e (1
–7)
Figure 4: The Enabling Trade Index 2014: Income group averages and best performers
Note: Based on World Bank classification (see Table 1).
1
2
3
4
5
6
7
7. Operatingenvironment
6. Availabilityand use of
ICTs
5. Availabilityand qualityof transport
services
4. Availabilityand qualityof transport
infrastructure
3. Efficiencyand transparency
of borderadministration
2. Foreignmarketaccess
1. Domesticmarketaccess
ENABLINGTRADE INDEX
2014
Average of 5 best performers
High-income (non-OECD)
High-income (OECD)
Low-income
Lower-middle income
Upper-middle income
ETI 2
014
scor
e (1
–7)
PILLARS
PILLARS
© 2014 World Economic Forum

Chapter 1: The Enabling Trade Index 2014
10 | The Global Enabling Trade Report 2014
Table 1: The Enabling Trade Index 2014 rankings
Country / Economy Rank Score (1–7) Region* Income†
Singapore 1 5.9 ADV HICHong Kong SAR 2 5.5 ADV HICNetherlands 3 5.3 ADV HIC-OECDNew Zealand 4 5.2 ADV HIC-OECDFinland 5 5.2 ADV HIC-OECDUnited Kingdom 6 5.2 ADV HIC-OECDSwitzerland 7 5.2 ADV HIC-OECDChile 8 5.1 SA HIC-OECDSweden 9 5.1 ADV HIC-OECDGermany 10 5.1 ADV HIC-OECDLuxembourg 11 5.1 ADV HIC-OECDNorway 12 5.1 ADV HIC-OECDJapan 13 5.1 ADV HIC-OECDCanada 14 5.0 ADV HIC-OECDUnited States 15 5.0 ADV HIC-OECDUnited Arab Emirates 16 5.0 MENAP HICDenmark 17 5.0 ADV HIC-OECDAustria 18 5.0 ADV HIC-OECDQatar 19 4.9 MENAP HICBelgium 20 4.9 ADV HIC-OECDFrance 21 4.9 ADV HIC-OECDIceland 22 4.9 ADV HIC-OECDAustralia 23 4.9 ADV HIC-OECDTaiwan, China 24 4.9 ADV HICMalaysia 25 4.8 DA UMCIreland 26 4.8 ADV HIC-OECDSpain 27 4.8 ADV HIC-OECDEstonia 28 4.8 ADV HIC-OECDMauritius 29 4.7 SSA UMCKorea, Rep. 30 4.7 ADV HIC-OECDOman 31 4.7 MENAP HICIsrael 32 4.7 ADV HIC-OECDBahrain 33 4.6 MENAP HICMalta 34 4.6 ADV HICPortugal 35 4.5 ADV HIC-OECDGeorgia 36 4.5 CIS LMCCyprus 37 4.4 ADV HICSlovenia 38 4.4 ADV HIC-OECDCzech Republic 39 4.4 ADV HIC-OECDJordan 40 4.4 MENAP UMCLatvia 41 4.4 CEE HICCosta Rica 42 4.4 CAC UMCMorocco 43 4.4 MENAP LMCLithuania 44 4.4 CEE HICPoland 45 4.3 CEE HIC-OECDTurkey 46 4.3 CEE UMCItaly 47 4.3 ADV HIC-OECDSaudi Arabia 48 4.3 MENAP HICMontenegro 49 4.3 CEE UMCHungary 50 4.3 CEE UMCPeru 51 4.3 SA UMCPanama 52 4.3 CAC UMCArmenia 53 4.3 CIS LMCChina 54 4.3 DA UMCSlovak Republic 55 4.3 ADV HIC-OECDCroatia 56 4.2 CEE HICThailand 57 4.2 DA UMCIndonesia 58 4.2 DA LMCSouth Africa 59 4.2 SSA UMCUruguay 60 4.2 SA HICMexico 61 4.1 CAC UMCGuatemala 62 4.1 CAC LMCMacedonia, FYR 63 4.1 CEE UMCPhilippines 64 4.1 DA LMCEcuador 65 4.1 SA UMCRwanda 66 4.1 SSA LICGreece 67 4.0 ADV HIC-OECDNicaragua 68 4.0 CAC LMCAlbania 69 4.0 CEE UMC
Country / Economy Rank Score (1–7) Region* Income†
Bulgaria 70 4.0 CEE UMCEl Salvador 71 4.0 CAC LMCVietnam 72 4.0 DA LMCColombia 73 4.0 SA UMCKuwait 74 4.0 MENAP HICRomania 75 3.9 CEE UMCTunisia 76 3.9 MENAP UMCAzerbaijan 77 3.9 CIS UMCBosnia and Herzegovina 78 3.9 CEE UMCDominican Republic 79 3.9 CAC UMCJamaica 80 3.9 CAC UMCNamibia 81 3.9 SSA UMCLebanon 82 3.8 MENAP UMCUkraine 83 3.8 CIS LMCSri Lanka 84 3.8 DA LMCHonduras 85 3.8 CAC LMCBrazil 86 3.8 SA UMCBolivia 87 3.7 SA LMCBotswana 88 3.7 SSA UMCSerbia 89 3.7 CEE UMCKenya 90 3.7 SSA LICZambia 91 3.7 SSA LMCMoldova 92 3.7 CIS LMCCambodia 93 3.7 DA LICKazakhstan 94 3.7 CIS UMCArgentina 95 3.7 SA UMCIndia 96 3.6 DA LMCEgypt 97 3.6 MENAP LMCLao PDR 98 3.6 DA LMCGambia, The 99 3.6 SSA LICSenegal 100 3.6 SSA LMCUganda 101 3.6 SSA LICGhana 102 3.6 SSA LMCMadagascar 103 3.6 SSA LICGuyana 104 3.6 SA LMCRussian Federation 105 3.5 CIS HICLibya 106 3.5 MENAP UMCBhutan 107 3.5 DA LMCLesotho 108 3.5 SSA LMCKyrgyz Republic 109 3.5 CIS LICMozambique 110 3.5 SSA LICTanzania 111 3.5 SSA LICMalawi 112 3.5 SSA LICParaguay 113 3.5 SA LMCPakistan 114 3.5 MENAP LMCBangladesh 115 3.4 DA LICNepal 116 3.3 DA LICCôte d’Ivoire 117 3.3 SSA LMCEthiopia 118 3.2 SSA LICCameroon 119 3.2 SSA LMCAlgeria 120 3.2 MENAP UMCMyanmar 121 3.2 DA LICGabon 122 3.1 SSA UMCMali 123 3.1 SSA LICNigeria 124 3.1 SSA LMCHaiti 125 3.1 CAC LICLiberia 126 3.1 SSA LICBenin 127 3.1 SSA LICYemen 128 3.0 MENAP LMCMauritania 129 3.0 MENAP LMCMongolia 130 3.0 DA LMCIran, Islamic Rep. 131 3.0 MENAP UMCBurundi 132 3.0 SSA LICBurkina Faso 133 2.9 SSA LICZimbabwe 134 2.9 SSA LICGuinea 135 2.9 SSA LICAngola 136 2.8 SSA UMCVenezuela 137 2.8 SA UMCChad 138 2.5 SSA LIC
* Region (adapted from IMF classification): ADV = Advanced economies; CAC = Central America and the Caribbean; CEE = Central and Eastern Europe; CIS = Commonwealth of Independent States; DA = Developing Asia; MENAP = Middle East, North Africa, and Pakistan; SA = South America; and SSA = Sub-Saharan Africa.
† Income group (World Bank classification): HIC-OECD = High income OECD; HIC = Other high income; UMC = Upper-middle income; LMC = Lower-middle income; and LIC = Low income.
© 2014 World Economic Forum

The Global Enabling Trade Report 2014 | 11
Chapter 1: The Enabling Trade Index 2014
Table 2: Market access subindex rankings Market access subindex
Score Rank Country/Economy (1–7)
1 Chile 5.5 2 Singapore 5.5 3 Mauritius 5.3 4 Peru 5.0 5 Libya 4.8 6 El Salvador 4.7 7 Nicaragua 4.7 8 Costa Rica 4.7 9 Armenia 4.6 10 Honduras 4.6 11 Philippines 4.6 12 Guatemala 4.6 13 Georgia 4.6 14 Uganda 4.5 15 Malawi 4.5 16 Colombia 4.5 17 Albania 4.4 18 Mexico 4.4 19 Rwanda 4.4 20 Indonesia 4.4 21 Iceland 4.3 22 New Zealand 4.3 23 Zambia 4.3 24 Madagascar 4.3 25 Myanmar 4.3 26 Bolivia 4.3 27 Moldova 4.3 28 Macedonia, FYR 4.3 29 Mozambique 4.2 30 Ecuador 4.2 31 Tanzania 4.2 32 Kyrgyz Republic 4.2 33 Montenegro 4.2 34 Vietnam 4.2 35 Uruguay 4.1 36 Cambodia 4.1 37 Hong Kong SAR 4.1 38 Ukraine 4.1 39 Lao PDR 4.1 40 Malaysia 4.0 41 Canada 4.0 42 Kenya 4.0 43 Jordan 4.0 44 Burundi 4.0 45 Bosnia and Herzegovina 4.0 46 Namibia 4.0 47 Lesotho 3.9 48 Haiti 3.9 49 Israel 3.9 50 Croatia 3.9 51 Thailand 3.9 52 Tunisia 3.9 53 Morocco 3.8 54 Oman 3.8 55 Argentina 3.8 56 Norway 3.8 57 Bangladesh 3.8 58 Jamaica 3.8 59 Qatar 3.8 60 Lebanon 3.8 61 Nepal 3.7 62 Turkey 3.7 63 Botswana 3.7 64 Paraguay 3.6 65 Yemen 3.6 66 Azerbaijan 3.6 67 Dominican Republic 3.6 68 Guyana 3.6 69 South Africa 3.6
Score Rank Country/Economy (1–7)
70 United States 3.5 71 Switzerland 3.5 72 Bahrain 3.5 73 Panama 3.5 74 Australia 3.4 75 Austria 3.4 75 Belgium 3.4 75 Bulgaria 3.4 75 Cyprus 3.4 75 Czech Republic 3.4 75 Denmark 3.4 75 Estonia 3.4 75 Finland 3.4 75 France 3.4 75 Germany 3.4 75 Greece 3.4 75 Hungary 3.4 75 Ireland 3.4 75 Italy 3.4 75 Latvia 3.4 75 Lithuania 3.4 75 Luxembourg 3.4 75 Malta 3.4 75 Netherlands 3.4 75 Poland 3.4 75 Portugal 3.4 75 Romania 3.4 75 Slovak Republic 3.4 75 Slovenia 3.4 75 Spain 3.4 75 Sweden 3.4 75 United Kingdom 3.4 102 Bhutan 3.4 103 Egypt 3.3 104 Sri Lanka 3.3 105 Saudi Arabia 3.3 106 Mauritania 3.3 107 Angola 3.3 108 Kazakhstan 3.2 109 United Arab Emirates 3.2 110 Brazil 3.2 111 Japan 3.2 112 Serbia 3.2 113 Kuwait 3.2 114 Ethiopia 3.2 115 Senegal 3.1 116 Mali 3.1 117 Cameroon 3.1 118 Burkina Faso 3.1 119 China 3.1 120 Korea, Rep. 3.1 121 Taiwan, China 3.0 122 Ghana 3.0 123 Chad 3.0 124 Benin 3.0 125 Côte d’Ivoire 2.9 126 Mongolia 2.9 127 Venezuela 2.9 128 Algeria 2.8 129 Gambia, The 2.8 130 Zimbabwe 2.8 131 Guinea 2.8 132 Russian Federation 2.8 133 Pakistan 2.7 134 Gabon 2.5 135 Nigeria 2.5 136 India 2.4 137 Liberia 2.2 138 Iran, Islamic Rep. 1.9
Pillar 1: Domestic market access
Score Rank Country/Economy (1–7)
1 Hong Kong SAR 7.0 1 Libya 7.0 3 Singapore 7.0 4 Mauritius 6.1 5 New Zealand 6.1 6 Nicaragua 6.0 7 Georgia 6.0 8 Guatemala 6.0 9 Chile 5.9 10 Qatar 5.9 11 Albania 5.9 12 Armenia 5.8 13 Peru 5.8 14 El Salvador 5.7 15 Montenegro 5.7 16 Canada 5.7 17 Honduras 5.7 18 Australia 5.6 19 Philippines 5.6 20 Costa Rica 5.5 21 Iceland 5.5 22 Ukraine 5.5 23 Macedonia, FYR 5.5 24 Botswana 5.4 25 Namibia 5.4 26 Indonesia 5.4 27 United States 5.3 28 Japan 5.3 29 Israel 5.3 30 Bosnia and Herzegovina 5.3 31 Croatia 5.2 32 Oman 5.2 33 Mexico 5.2 34 Turkey 5.1 35 Ecuador 5.1 36 Colombia 5.1 37 Paraguay 5.1 38 Moldova 5.0 39 Zambia 5.0 40 Taiwan, China 5.0 41 Norway 5.0 42 Rwanda 5.0 43 South Africa 5.0 44 Uruguay 4.9 45 Malawi 4.9 46 Austria 4.9 46 Belgium 4.9 46 Bulgaria 4.9 46 Cyprus 4.9 46 Czech Republic 4.9 46 Denmark 4.9 46 Estonia 4.9 46 Finland 4.9 46 France 4.9 46 Germany 4.9 46 Greece 4.9 46 Hungary 4.9 46 Ireland 4.9 46 Italy 4.9 46 Latvia 4.9 46 Lithuania 4.9 46 Luxembourg 4.9 46 Malta 4.9 46 Netherlands 4.9 46 Poland 4.9 46 Portugal 4.9 46 Romania 4.9 46 Slovak Republic 4.9 46 Slovenia 4.9
Score Rank Country/Economy (1–7)
46 Spain 4.9 46 Sweden 4.9 46 United Kingdom 4.9 73 Uganda 4.9 74 United Arab Emirates 4.9 75 Malaysia 4.8 76 Vietnam 4.8 77 Bahrain 4.8 78 Dominican Republic 4.7 79 Yemen 4.7 80 Saudi Arabia 4.7 81 Burundi 4.7 82 Kyrgyz Republic 4.7 83 Bolivia 4.7 84 Kenya 4.6 85 Switzerland 4.6 86 Panama 4.6 87 Tanzania 4.6 88 Kuwait 4.5 89 Mozambique 4.5 90 Argentina 4.4 91 Madagascar 4.4 92 Mongolia 4.4 93 Jamaica 4.4 94 Sri Lanka 4.4 95 Azerbaijan 4.3 96 Jordan 4.3 97 Myanmar 4.3 98 China 4.2 99 Tunisia 4.2 100 Morocco 4.2 101 Lebanon 4.1 102 Lesotho 4.1 103 Haiti 4.1 104 Korea, Rep. 4.1 105 Mali 4.1 106 Ghana 4.0 107 Serbia 4.0 108 Brazil 4.0 109 Bhutan 3.9 110 Burkina Faso 3.8 111 Guyana 3.8 112 Kazakhstan 3.8 113 Thailand 3.7 114 Senegal 3.6 115 Côte d’Ivoire 3.6 116 Angola 3.6 117 Benin 3.5 118 Mauritania 3.5 119 Guinea 3.5 120 Venezuela 3.5 121 Lao PDR 3.4 122 Nigeria 3.4 123 Algeria 3.4 124 Ethiopia 3.4 125 Cameroon 3.4 126 Bangladesh 3.4 127 Russian Federation 3.3 128 Egypt 3.3 129 Liberia 3.3 130 Gambia, The 3.2 131 Pakistan 3.2 132 Gabon 3.0 133 Cambodia 2.9 134 Chad 2.9 135 India 2.9 136 Nepal 2.8 137 Zimbabwe 2.4 138 Iran, Islamic Rep. 2.4
(Cont’d.)
© 2014 World Economic Forum

Chapter 1: The Enabling Trade Index 2014
12 | The Global Enabling Trade Report 2014
Table 2: Market access subindex rankings (cont’d.) Pillar 2: Foreign market access
Score Rank Country/Economy (1–7)
1 Cambodia 5.3 2 Chile 5.1 3 Nepal 4.7 4 Lao PDR 4.7 5 Mauritius 4.5 6 Myanmar 4.4 7 Bangladesh 4.2 8 Madagascar 4.2 9 Peru 4.2 10 Uganda 4.2 11 Malawi 4.1 12 Thailand 4.0 13 Singapore 3.9 14 Mozambique 3.9 15 Bolivia 3.9 16 Costa Rica 3.9 17 Tanzania 3.9 18 Colombia 3.8 19 Kyrgyz Republic 3.8 20 Rwanda 3.8 21 El Salvador 3.7 22 Haiti 3.7 23 Lesotho 3.7 24 Jordan 3.6 25 Zambia 3.6 26 Philippines 3.6 27 Honduras 3.6 28 Vietnam 3.6 29 Mexico 3.5 30 Nicaragua 3.5 31 Tunisia 3.5 32 Morocco 3.5 33 Moldova 3.5 34 Armenia 3.5 35 Lebanon 3.4 36 Ecuador 3.4 37 Indonesia 3.4 38 Kenya 3.3 39 Egypt 3.3 40 Guyana 3.3 41 Uruguay 3.3 42 Malaysia 3.3 43 Burundi 3.3 44 Argentina 3.2 45 Jamaica 3.2 46 Iceland 3.2 47 Guatemala 3.2 48 Zimbabwe 3.2 49 Georgia 3.2 50 Macedonia, FYR 3.1 51 Chad 3.1 52 Mauritania 3.0 53 Albania 3.0 54 Ethiopia 2.9 55 Angola 2.9 56 Azerbaijan 2.9 57 Bhutan 2.8 58 Cameroon 2.8 59 Kazakhstan 2.7 60 Montenegro 2.7 61 Ukraine 2.7 62 Bosnia and Herzegovina 2.7 63 Norway 2.6 64 Senegal 2.6 65 New Zealand 2.6 66 Libya 2.6 67 Yemen 2.5 68 Croatia 2.5 69 Namibia 2.5
Score Rank Country/Economy (1–7)
70 Dominican Republic 2.5 71 Switzerland 2.5 72 Oman 2.5 73 Israel 2.4 74 Benin 2.4 75 Gambia, The 2.4 76 Canada 2.4 77 Brazil 2.4 78 Panama 2.4 79 Serbia 2.3 80 Turkey 2.3 81 Burkina Faso 2.3 82 Algeria 2.3 83 Côte d’Ivoire 2.3 84 Russian Federation 2.2 85 Sri Lanka 2.2 86 Venezuela 2.2 87 Bahrain 2.2 88 Paraguay 2.2 89 Pakistan 2.2 90 Mali 2.2 91 South Africa 2.2 92 Guinea 2.1 93 Korea, Rep. 2.0 94 India 2.0 95 Ghana 2.0 96 Gabon 1.9 97 Austria 1.9 97 Belgium 1.9 97 Bulgaria 1.9 97 Cyprus 1.9 97 Czech Republic 1.9 97 Denmark 1.9 97 Estonia 1.9 97 Finland 1.9 97 France 1.9 97 Germany 1.9 97 Greece 1.9 97 Hungary 1.9 97 Ireland 1.9 97 Italy 1.9 97 Latvia 1.9 97 Lithuania 1.9 97 Luxembourg 1.9 97 Malta 1.9 97 Netherlands 1.9 97 Poland 1.9 97 Portugal 1.9 97 Romania 1.9 97 Slovak Republic 1.9 97 Slovenia 1.9 97 Spain 1.9 97 Sweden 1.9 97 United Kingdom 1.9 124 Botswana 1.9 125 China 1.9 126 Kuwait 1.8 127 Saudi Arabia 1.8 128 United States 1.7 129 Qatar 1.7 130 United Arab Emirates 1.6 131 Nigeria 1.5 132 Mongolia 1.4 133 Iran, Islamic Rep. 1.4 134 Australia 1.2 135 Hong Kong SAR 1.2 136 Liberia 1.1 137 Taiwan, China 1.1 138 Japan 1.1
Table 3: Border administration subindex rankings Pillar 3: Efficiency and transparency of border administration*
Score Rank Country/Economy (1–7)
1 Singapore 6.3 2 Finland 6.2 3 Sweden 6.2 4 Netherlands 6.1 5 Japan 6.0 6 New Zealand 6.0 7 United Kingdom 6.0 8 Estonia 5.9 9 Denmark 5.9 10 Austria 5.8 11 Hong Kong SAR 5.8 12 Switzerland 5.8 13 Germany 5.8 14 Ireland 5.8 15 Luxembourg 5.8 16 Norway 5.8 17 United Arab Emirates 5.7 18 Taiwan, China 5.7 19 Korea, Rep. 5.7 20 Canada 5.7 21 United States 5.7 22 Australia 5.6 23 Belgium 5.6 24 Iceland 5.6 25 Spain 5.6 26 Chile 5.6 27 France 5.6 28 Slovenia 5.4 29 Israel 5.4 30 Latvia 5.3 31 Poland 5.2 32 Malta 5.2 33 Malaysia 5.2 34 Lithuania 5.2 35 Georgia 5.2 36 Qatar 5.2 37 Czech Republic 5.1 38 Hungary 5.1 39 Jordan 5.1 40 Oman 5.1 41 Bahrain 5.1 42 Cyprus 5.1 43 Portugal 5.0 44 Turkey 4.9 45 Morocco 4.9 46 Costa Rica 4.9 47 Italy 4.9 48 China 4.9 49 South Africa 4.8 50 Slovak Republic 4.8 51 Peru 4.7 52 Saudi Arabia 4.7 53 Mauritius 4.7 54 Montenegro 4.7 55 Panama 4.7 56 Thailand 4.7 57 Bulgaria 4.7 58 Romania 4.6 59 Greece 4.6 60 Nicaragua 4.6 61 Guatemala 4.6 62 Mexico 4.6 63 Dominican Republic 4.6 64 Ecuador 4.5 65 Croatia 4.5 66 Kuwait 4.5 67 Uruguay 4.5 68 Colombia 4.4 69 Indonesia 4.4
Score Rank Country/Economy (1–7)
70 Albania 4.4 71 Philippines 4.3 72 Pakistan 4.3 73 Armenia 4.3 74 India 4.2 75 Senegal 4.2 76 Jamaica 4.2 77 Lebanon 4.2 78 Serbia 4.2 79 Tunisia 4.2 80 Brazil 4.2 81 Gambia, The 4.1 82 Honduras 4.1 83 Ghana 4.1 84 El Salvador 4.1 85 Macedonia, FYR 4.0 86 Vietnam 4.0 87 Sri Lanka 4.0 88 Guyana 3.9 89 Rwanda 3.9 90 Bosnia and Herzegovina 3.9 91 Madagascar 3.8 92 Namibia 3.8 93 Bolivia 3.8 94 Azerbaijan 3.8 95 Liberia 3.7 96 Argentina 3.7 97 Nigeria 3.7 98 Algeria 3.7 99 Gabon 3.7 100 Ukraine 3.6 101 Kenya 3.6 102 Bhutan 3.6 103 Russian Federation 3.6 104 Lesotho 3.6 105 Mozambique 3.6 106 Côte d’Ivoire 3.5 107 Botswana 3.5 108 Cambodia 3.4 109 Egypt 3.4 110 Ethiopia 3.4 111 Tanzania 3.4 112 Benin 3.4 113 Libya 3.4 114 Lao PDR 3.4 115 Uganda 3.3 116 Moldova 3.3 117 Myanmar 3.3 118 Kyrgyz Republic 3.3 119 Iran, Islamic Rep. 3.3 120 Paraguay 3.3 121 Cameroon 3.2 122 Guinea 3.2 123 Bangladesh 3.2 124 Yemen 3.2 125 Nepal 3.1 126 Haiti 3.1 127 Kazakhstan 3.0 128 Mauritania 3.0 129 Zambia 3.0 130 Malawi 3.0 131 Angola 2.8 132 Mali 2.7 133 Venezuela 2.7 134 Zimbabwe 2.5 135 Burkina Faso 2.4 136 Burundi 2.4 137 Mongolia 2.4 138 Chad 2.1
* Since this subindex is made up of only one pillar, data for this subindex and pillar 3 are identical.
© 2014 World Economic Forum
The Global Enabling Trade Report 2014 | 13
Chapter 1: The Enabling Trade Index 2014
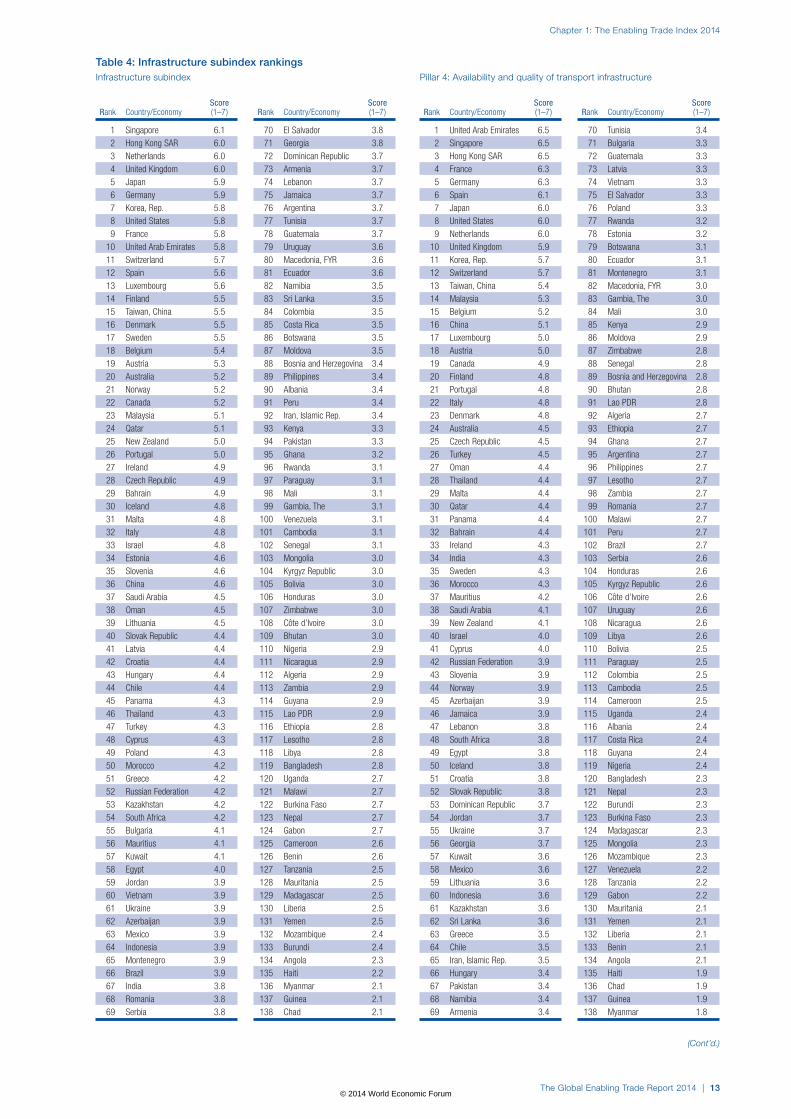
Table 4: Infrastructure subindex rankings Infrastructure subindex
Score Rank Country/Economy (1–7)
1 Singapore 6.1 2 Hong Kong SAR 6.0 3 Netherlands 6.0 4 United Kingdom 6.0 5 Japan 5.9 6 Germany 5.9 7 Korea, Rep. 5.8 8 United States 5.8 9 France 5.8 10 United Arab Emirates 5.8 11 Switzerland 5.7 12 Spain 5.6 13 Luxembourg 5.6 14 Finland 5.5 15 Taiwan, China 5.5 16 Denmark 5.5 17 Sweden 5.5 18 Belgium 5.4 19 Austria 5.3 20 Australia 5.2 21 Norway 5.2 22 Canada 5.2 23 Malaysia 5.1 24 Qatar 5.1 25 New Zealand 5.0 26 Portugal 5.0 27 Ireland 4.9 28 Czech Republic 4.9 29 Bahrain 4.9 30 Iceland 4.8 31 Malta 4.8 32 Italy 4.8 33 Israel 4.8 34 Estonia 4.6 35 Slovenia 4.6 36 China 4.6 37 Saudi Arabia 4.5 38 Oman 4.5 39 Lithuania 4.5 40 Slovak Republic 4.4 41 Latvia 4.4 42 Croatia 4.4 43 Hungary 4.4 44 Chile 4.4 45 Panama 4.3 46 Thailand 4.3 47 Turkey 4.3 48 Cyprus 4.3 49 Poland 4.3 50 Morocco 4.2 51 Greece 4.2 52 Russian Federation 4.2 53 Kazakhstan 4.2 54 South Africa 4.2 55 Bulgaria 4.1 56 Mauritius 4.1 57 Kuwait 4.1 58 Egypt 4.0 59 Jordan 3.9 60 Vietnam 3.9 61 Ukraine 3.9 62 Azerbaijan 3.9 63 Mexico 3.9 64 Indonesia 3.9 65 Montenegro 3.9 66 Brazil 3.9 67 India 3.8 68 Romania 3.8 69 Serbia 3.8
Score Rank Country/Economy (1–7)
70 El Salvador 3.8 71 Georgia 3.8 72 Dominican Republic 3.7 73 Armenia 3.7 74 Lebanon 3.7 75 Jamaica 3.7 76 Argentina 3.7 77 Tunisia 3.7 78 Guatemala 3.7 79 Uruguay 3.6 80 Macedonia, FYR 3.6 81 Ecuador 3.6 82 Namibia 3.5 83 Sri Lanka 3.5 84 Colombia 3.5 85 Costa Rica 3.5 86 Botswana 3.5 87 Moldova 3.5 88 Bosnia and Herzegovina 3.4 89 Philippines 3.4 90 Albania 3.4 91 Peru 3.4 92 Iran, Islamic Rep. 3.4 93 Kenya 3.3 94 Pakistan 3.3 95 Ghana 3.2 96 Rwanda 3.1 97 Paraguay 3.1 98 Mali 3.1 99 Gambia, The 3.1 100 Venezuela 3.1 101 Cambodia 3.1 102 Senegal 3.1 103 Mongolia 3.0 104 Kyrgyz Republic 3.0 105 Bolivia 3.0 106 Honduras 3.0 107 Zimbabwe 3.0 108 Côte d’Ivoire 3.0 109 Bhutan 3.0 110 Nigeria 2.9 111 Nicaragua 2.9 112 Algeria 2.9 113 Zambia 2.9 114 Guyana 2.9 115 Lao PDR 2.9 116 Ethiopia 2.8 117 Lesotho 2.8 118 Libya 2.8 119 Bangladesh 2.8 120 Uganda 2.7 121 Malawi 2.7 122 Burkina Faso 2.7 123 Nepal 2.7 124 Gabon 2.7 125 Cameroon 2.6 126 Benin 2.6 127 Tanzania 2.5 128 Mauritania 2.5 129 Madagascar 2.5 130 Liberia 2.5 131 Yemen 2.5 132 Mozambique 2.4 133 Burundi 2.4 134 Angola 2.3 135 Haiti 2.2 136 Myanmar 2.1 137 Guinea 2.1 138 Chad 2.1
Pillar 4: Availability and quality of transport infrastructure
Score Rank Country/Economy (1–7)
1 United Arab Emirates 6.5 2 Singapore 6.5 3 Hong Kong SAR 6.5 4 France 6.3 5 Germany 6.3 6 Spain 6.1 7 Japan 6.0 8 United States 6.0 9 Netherlands 6.0 10 United Kingdom 5.9 11 Korea, Rep. 5.7 12 Switzerland 5.7 13 Taiwan, China 5.4 14 Malaysia 5.3 15 Belgium 5.2 16 China 5.1 17 Luxembourg 5.0 18 Austria 5.0 19 Canada 4.9 20 Finland 4.8 21 Portugal 4.8 22 Italy 4.8 23 Denmark 4.8 24 Australia 4.5 25 Czech Republic 4.5 26 Turkey 4.5 27 Oman 4.4 28 Thailand 4.4 29 Malta 4.4 30 Qatar 4.4 31 Panama 4.4 32 Bahrain 4.4 33 Ireland 4.3 34 India 4.3 35 Sweden 4.3 36 Morocco 4.3 37 Mauritius 4.2 38 Saudi Arabia 4.1 39 New Zealand 4.1 40 Israel 4.0 41 Cyprus 4.0 42 Russian Federation 3.9 43 Slovenia 3.9 44 Norway 3.9 45 Azerbaijan 3.9 46 Jamaica 3.9 47 Lebanon 3.8 48 South Africa 3.8 49 Egypt 3.8 50 Iceland 3.8 51 Croatia 3.8 52 Slovak Republic 3.8 53 Dominican Republic 3.7 54 Jordan 3.7 55 Ukraine 3.7 56 Georgia 3.7 57 Kuwait 3.6 58 Mexico 3.6 59 Lithuania 3.6 60 Indonesia 3.6 61 Kazakhstan 3.6 62 Sri Lanka 3.6 63 Greece 3.5 64 Chile 3.5 65 Iran, Islamic Rep. 3.5 66 Hungary 3.4 67 Pakistan 3.4 68 Namibia 3.4 69 Armenia 3.4
Score Rank Country/Economy (1–7)
70 Tunisia 3.4 71 Bulgaria 3.3 72 Guatemala 3.3 73 Latvia 3.3 74 Vietnam 3.3 75 El Salvador 3.3 76 Poland 3.3 77 Rwanda 3.2 78 Estonia 3.2 79 Botswana 3.1 80 Ecuador 3.1 81 Montenegro 3.1 82 Macedonia, FYR 3.0 83 Gambia, The 3.0 84 Mali 3.0 85 Kenya 2.9 86 Moldova 2.9 87 Zimbabwe 2.8 88 Senegal 2.8 89 Bosnia and Herzegovina 2.8 90 Bhutan 2.8 91 Lao PDR 2.8 92 Algeria 2.7 93 Ethiopia 2.7 94 Ghana 2.7 95 Argentina 2.7 96 Philippines 2.7 97 Lesotho 2.7 98 Zambia 2.7 99 Romania 2.7 100 Malawi 2.7 101 Peru 2.7 102 Brazil 2.7 103 Serbia 2.6 104 Honduras 2.6 105 Kyrgyz Republic 2.6 106 Côte d’Ivoire 2.6 107 Uruguay 2.6 108 Nicaragua 2.6 109 Libya 2.6 110 Bolivia 2.5 111 Paraguay 2.5 112 Colombia 2.5 113 Cambodia 2.5 114 Cameroon 2.5 115 Uganda 2.4 116 Albania 2.4 117 Costa Rica 2.4 118 Guyana 2.4 119 Nigeria 2.4 120 Bangladesh 2.3 121 Nepal 2.3 122 Burundi 2.3 123 Burkina Faso 2.3 124 Madagascar 2.3 125 Mongolia 2.3 126 Mozambique 2.3 127 Venezuela 2.2 128 Tanzania 2.2 129 Gabon 2.2 130 Mauritania 2.1 131 Yemen 2.1 132 Liberia 2.1 133 Benin 2.1 134 Angola 2.1 135 Haiti 1.9 136 Chad 1.9 137 Guinea 1.9 138 Myanmar 1.8
(Cont’d.)
© 2014 World Economic Forum

Chapter 1: The Enabling Trade Index 2014
14 | The Global Enabling Trade Report 2014
Table 4: Infrastructure subindex rankings (cont’d.) Pillar 5: Availability and quality of transport services
Score Rank Country/Economy (1–7)
1 Singapore 5.7 2 Netherlands 5.7 3 Germany 5.7 4 Japan 5.7 5 Hong Kong SAR 5.7 6 Belgium 5.7 7 Sweden 5.6 8 Switzerland 5.6 9 United Kingdom 5.6 10 Luxembourg 5.6 11 United States 5.5 12 Taiwan, China 5.5 13 Canada 5.4 14 Norway 5.4 15 France 5.4 16 Spain 5.4 17 Finland 5.4 18 Korea, Rep. 5.4 19 Ireland 5.3 20 Australia 5.3 21 Denmark 5.3 22 Qatar 5.3 23 Austria 5.2 24 Portugal 5.2 25 New Zealand 5.2 26 Malaysia 5.1 27 United Arab Emirates 5.1 28 Iceland 5.0 29 Czech Republic 5.0 30 Slovenia 4.9 31 China 4.8 32 Latvia 4.8 33 Israel 4.8 34 Italy 4.8 35 Hungary 4.7 36 Turkey 4.7 37 Estonia 4.7 38 Poland 4.7 39 Thailand 4.7 40 Malta 4.6 41 Slovak Republic 4.6 42 Lithuania 4.6 43 Chile 4.6 44 Saudi Arabia 4.5 45 Cyprus 4.5 46 Bahrain 4.5 47 Romania 4.5 48 Croatia 4.5 49 South Africa 4.5 50 Vietnam 4.4 51 Bulgaria 4.4 52 Panama 4.4 53 Morocco 4.3 54 Greece 4.3 55 Serbia 4.3 56 Oman 4.3 57 India 4.3 58 Indonesia 4.3 59 Mexico 4.2 60 Brazil 4.2 61 Ukraine 4.2 62 Jordan 4.2 63 El Salvador 4.1 64 Kenya 4.1 65 Kazakhstan 4.1 66 Montenegro 4.1 67 Mauritius 4.0 68 Namibia 4.0 69 Rwanda 4.0
Score Rank Country/Economy (1–7)
70 Guatemala 4.0 71 Ecuador 4.0 72 Egypt 4.0 73 Argentina 4.0 74 Albania 3.9 75 Kuwait 3.9 76 Armenia 3.9 77 Peru 3.9 78 Pakistan 3.9 79 Sri Lanka 3.9 80 Tunisia 3.9 81 Jamaica 3.9 82 Russian Federation 3.8 83 Costa Rica 3.8 84 Philippines 3.8 85 Dominican Republic 3.8 86 Ethiopia 3.8 87 Bosnia and Herzegovina 3.8 88 Colombia 3.7 89 Uruguay 3.7 90 Iran, Islamic Rep. 3.7 91 Moldova 3.7 92 Nigeria 3.7 93 Uganda 3.7 94 Malawi 3.6 95 Lebanon 3.6 96 Nicaragua 3.6 97 Cambodia 3.6 98 Côte d’Ivoire 3.6 99 Georgia 3.6 100 Macedonia, FYR 3.6 101 Azerbaijan 3.6 102 Ghana 3.6 103 Bangladesh 3.6 104 Senegal 3.6 105 Burkina Faso 3.6 106 Botswana 3.5 107 Lao PDR 3.5 108 Paraguay 3.5 109 Guyana 3.5 110 Gambia, The 3.5 111 Mali 3.5 112 Bhutan 3.4 113 Zambia 3.4 114 Bolivia 3.4 115 Algeria 3.4 116 Nepal 3.4 117 Liberia 3.4 118 Honduras 3.3 119 Burundi 3.3 120 Lesotho 3.3 121 Venezuela 3.3 122 Benin 3.3 123 Madagascar 3.2 124 Yemen 3.2 125 Cameroon 3.2 126 Zimbabwe 3.2 127 Tanzania 3.1 128 Kyrgyz Republic 3.1 129 Mongolia 3.0 130 Chad 3.0 131 Guinea 3.0 132 Mozambique 2.9 133 Myanmar 2.9 134 Angola 2.9 135 Gabon 2.9 136 Mauritania 2.8 137 Libya 2.8 138 Haiti 2.7
Pillar 6: Availability and use of ICTs
Score Rank Country/Economy (1–7)
1 Sweden 6.5 2 United Kingdom 6.4 3 Finland 6.4 4 Netherlands 6.4 5 Denmark 6.4 6 Korea, Rep. 6.4 7 Norway 6.4 8 Singapore 6.2 9 Luxembourg 6.1 10 Japan 6.0 11 Hong Kong SAR 6.0 12 Estonia 6.0 13 United States 5.9 14 Switzerland 5.9 15 Australia 5.9 16 New Zealand 5.8 17 Bahrain 5.8 18 Austria 5.8 19 Taiwan, China 5.7 20 Iceland 5.7 21 Germany 5.7 22 France 5.7 23 United Arab Emirates 5.6 24 Israel 5.6 25 Qatar 5.6 26 Belgium 5.4 27 Malta 5.4 28 Canada 5.3 29 Spain 5.3 30 Lithuania 5.2 31 Czech Republic 5.2 32 Latvia 5.2 33 Ireland 5.2 34 Hungary 5.1 35 Slovenia 5.0 36 Chile 5.0 37 Portugal 5.0 38 Malaysia 5.0 39 Croatia 5.0 40 Saudi Arabia 5.0 41 Poland 4.9 42 Kazakhstan 4.9 43 Slovak Republic 4.9 44 Russian Federation 4.9 45 Italy 4.9 46 Greece 4.8 47 Oman 4.7 48 Brazil 4.7 49 Bulgaria 4.7 50 Uruguay 4.6 51 Kuwait 4.6 52 Montenegro 4.5 53 Cyprus 4.5 54 Serbia 4.4 55 Argentina 4.4 56 Colombia 4.3 57 Panama 4.3 58 Macedonia, FYR 4.3 59 Romania 4.3 60 Egypt 4.2 61 Azerbaijan 4.2 62 Costa Rica 4.2 63 South Africa 4.2 64 Vietnam 4.1 65 Morocco 4.1 66 Mauritius 4.1 67 Jordan 4.0 68 Georgia 4.0 69 El Salvador 4.0
Score Rank Country/Economy (1–7)
70 Ukraine 3.9 71 Thailand 3.9 72 Armenia 3.8 73 Mexico 3.8 74 Albania 3.8 75 Turkey 3.8 76 Tunisia 3.8 77 Moldova 3.8 78 Mongolia 3.8 79 Bosnia and Herzegovina 3.8 80 Ecuador 3.8 81 Indonesia 3.7 82 China 3.7 83 Dominican Republic 3.7 84 Botswana 3.7 85 Philippines 3.7 86 Guatemala 3.7 87 Venezuela 3.7 88 Lebanon 3.6 89 Peru 3.6 90 Kyrgyz Republic 3.4 91 Jamaica 3.4 92 Paraguay 3.4 93 Ghana 3.1 94 Bolivia 3.1 95 Cambodia 3.1 96 Namibia 3.1 97 Sri Lanka 3.1 98 Honduras 3.0 99 Kenya 3.0 100 Libya 3.0 101 Zimbabwe 3.0 102 Gabon 3.0 103 Iran, Islamic Rep. 2.9 104 India 2.9 105 Senegal 2.9 106 Mali 2.8 107 Nigeria 2.8 108 Guyana 2.8 109 Gambia, The 2.8 110 Côte d’Ivoire 2.7 111 Nicaragua 2.7 112 Bhutan 2.6 113 Mauritania 2.6 114 Zambia 2.6 115 Algeria 2.6 116 Pakistan 2.5 117 Benin 2.4 118 Bangladesh 2.4 119 Lesotho 2.4 120 Nepal 2.3 121 Cameroon 2.3 122 Lao PDR 2.3 123 Tanzania 2.2 124 Rwanda 2.2 125 Burkina Faso 2.2 126 Yemen 2.1 127 Uganda 2.1 128 Mozambique 2.0 129 Angola 2.0 130 Madagascar 2.0 131 Ethiopia 2.0 132 Liberia 2.0 133 Haiti 1.9 134 Malawi 1.9 135 Myanmar 1.6 136 Guinea 1.5 137 Burundi 1.5 138 Chad 1.5
© 2014 World Economic Forum

The Global Enabling Trade Report 2014 | 15
Chapter 1: The Enabling Trade Index 2014
to two-thirds of the world’s least-developed countries, obtains the lowest average score in six of the seven pillars of the index. Only three countries, Mauritius (29th), South Africa (59th) and Rwanda (66th), of the 30 covered in this region, feature in the first half of the overall ETI ranking.
Average performances necessarily conceal significant differences within groups. Figure 5 shows the performance gap in the overall ETI between the highest- and lowest- ranked economies, as well as the median ETI rank in each region. The diagram reveals the existence of regional champions: Chile (8th overall) in Latin America and the Caribbean; the UAE (16th) in the Middle East, North Africa, and Pakistan region; Malaysia (25th) in Developing Asia; Mauritius in Sub-Saharan Africa; Georgia in the CIS region and Latvia in Central and Eastern Europe.7 In the case of Chile, the UAE, Malaysia and Mauritius, more than 100 places separate them from the lowest-ranked economy of their respective regions.
While such vast disparities necessarily represent a major obstacle to South-South trade, the fact that certain emerging and developing countries have managed to rise to the level of advanced economies is encouraging. In challenging environments and despite adverse factors, policies, targeted investments and other measures aimed at enabling trade can make a difference. These should primarily be targeted at those areas where relatively small investments can quickly generate sizeable gains. Border administration is therefore an area of choice for reforms towards enabling trade (see Box 5). Improving information disclosure or making it possible to clear shipments via electronic data interchange is relatively easy to implement. Regional cooperation, sharing of good practices adapted to the regional context, capacity building and technical assistance programmes are critical enablers for generating such quick wins.
Transport infrastructure (pillar 4) is one of the areas where the performance gaps between advanced economies and the rest of the world are the widest (see Figure 4). Transport infrastructure is far more costly and time-consuming to deploy and upgrade than improving border administration. However, the benefits extend well beyond enhancing a country’s capacity to fully reap the benefits of trade. Improved transport infrastructure helps create new business opportunities, connect producers and consumers, and reduce time to market. It is a critical driver of human development, competitiveness and growth.
Digital connectivity (pillar 6) can go a long way in filling critical information gaps. The use of information and communication technologies (ICTs) by border and customs agencies results in enormous productivity gains, which benefits government and businesses. They also help connect producers and customers along supply chains. Indeed, according to the pool of
Table 5: Operating environment subindex rankings Pillar 7: Operating environment
Score Rank Country/Economy (1–7)
1 Hong Kong SAR 5.8 2 Singapore 5.8 3 Finland 5.8 4 Qatar 5.7 5 Switzerland 5.7 6 Luxembourg 5.6 7 New Zealand 5.6 8 Netherlands 5.5 9 Sweden 5.5 10 Norway 5.5 11 United Kingdom 5.4 12 Germany 5.4 13 United Arab Emirates 5.3 14 Austria 5.3 15 Canada 5.2 16 Belgium 5.2 17 Oman 5.2 18 Taiwan, China 5.2 19 Australia 5.2 20 Ireland 5.1 21 Denmark 5.1 22 Japan 5.1 23 Estonia 5.1 24 United States 5.0 25 Chile 5.0 26 Malta 5.0 27 Malaysia 5.0 28 Bahrain 5.0 29 Cyprus 5.0 30 France 4.9 31 Iceland 4.8 32 Mauritius 4.8 33 Rwanda 4.8 34 Saudi Arabia 4.7 35 Jordan 4.6 36 Uruguay 4.6 37 China 4.6 38 Panama 4.6 39 Portugal 4.6 40 Israel 4.5 41 Spain 4.5 42 Zambia 4.5 43 Macedonia, FYR 4.5 44 Latvia 4.5 45 Morocco 4.5 46 Costa Rica 4.5 47 Armenia 4.4 48 Georgia 4.4 49 Slovak Republic 4.4 50 Poland 4.4 51 Montenegro 4.4 52 Gambia, The 4.4 53 Sri Lanka 4.4 54 Lithuania 4.4 55 Korea, Rep. 4.3 56 Turkey 4.3 57 South Africa 4.3 58 Azerbaijan 4.3 59 Slovenia 4.3 60 Czech Republic 4.3 61 Indonesia 4.2 62 Botswana 4.2 63 Kuwait 4.2 64 Bosnia and Herzegovina 4.2 65 Italy 4.2 66 Hungary 4.2 67 Kazakhstan 4.2 68 Lao PDR 4.2 69 Croatia 4.1
Score Rank Country/Economy (1–7)
70 Namibia 4.1 71 Ghana 4.1 72 Bhutan 4.1 73 India 4.1 74 Cambodia 4.1 75 Thailand 4.1 76 Tunisia 4.0 77 Senegal 4.0 78 Liberia 4.0 79 Greece 4.0 80 Peru 4.0 81 Vietnam 4.0 82 Philippines 4.0 83 Bulgaria 4.0 84 Romania 3.9 85 Albania 3.9 86 Nicaragua 3.9 87 Cameroon 3.9 88 Ecuador 3.9 89 Kenya 3.9 90 Brazil 3.9 91 Guyana 3.8 92 Jamaica 3.8 93 Paraguay 3.8 94 Guatemala 3.8 95 Uganda 3.8 96 Bolivia 3.8 97 Mexico 3.8 98 Lesotho 3.7 99 Bangladesh 3.7 100 Moldova 3.7 101 Tanzania 3.7 102 Lebanon 3.7 103 Ukraine 3.7 104 Serbia 3.7 105 Mongolia 3.7 106 Egypt 3.7 107 Gabon 3.6 108 Malawi 3.6 109 Mozambique 3.6 110 Dominican Republic 3.6 111 Côte d’Ivoire 3.6 112 Colombia 3.6 113 Nepal 3.5 114 El Salvador 3.5 115 Ethiopia 3.5 116 Pakistan 3.5 117 Madagascar 3.5 118 Mali 3.5 119 Russian Federation 3.5 120 Honduras 3.5 121 Kyrgyz Republic 3.4 122 Burkina Faso 3.4 123 Benin 3.4 124 Argentina 3.4 125 Iran, Islamic Rep. 3.4 126 Zimbabwe 3.3 127 Mauritania 3.3 128 Nigeria 3.3 129 Guinea 3.3 130 Algeria 3.3 131 Haiti 3.3 132 Libya 3.1 133 Burundi 3.1 134 Myanmar 2.9 135 Angola 2.9 136 Yemen 2.9 137 Chad 2.8 138 Venezuela 2.6
* Since this subindex is made up of only one pillar, data for this subindex and pillar 7 are identical.
© 2014 World Economic Forum

Chapter 1: The Enabling Trade Index 2014
16 | The Global Enabling Trade Report 2014
Box 5: Border Administration: The Low-Hanging Fruit of Enabling Trade
Improving the efficiency and transparency of border administration is at the core of the Agreement on Trade Facilitation adopted in Bali. This aspect is often perceived as a quick win for boosting trade, as the benefits significantly outweigh the cost of the necessary reforms.
When studying the dispersion of results across the four main dimensions of the Enabling Trade Index 2014, the border administration subindex scores exhibit the largest standard deviation (equal to 1.0, same as for the infrastructure subindex scores) and the biggest score differential between the best- (Singapore) and worst- (Chad) performing economies. This suggests huge scope for improvement in this area in developing countries. These have the most to gain from a speedy ratification and effective implementation of the trade facilitation agreement adopted in Bali, whereas advanced economies already operate at a very high level of efficiency and transparency.
For a more granular analysis, Table 1 reports the performance of selected country groups on the border administration pillar and its eleven indicators, expressed as a ratio of the group average value to the best score on each indicator. The gaps are the widest in the Global Express Association’s Customs Services Index, a survey of the quality of information and services provided by agencies; in the World Bank’s indicator capturing the efficiency of the clearance process; and in terms of irregular payments. The number of procedures required to import and to export goods also varies greatly.
But there is a silver lining amidst this mixed picture. Compared with other indicators in the ETI (within the market access, infrastructure and operating environment subindexes),
modernizing border administration is relatively less costly and less time-consuming. It is also politically easier, because less controversial, as attested by the Bali agreement adopted at a tumultuous time for international governance. Therefore, above all, it requires political will. But it also requires upgrading the capacity and skills of personnel and agencies. Indeed, the Bali Package stresses the importance of technical assistance and capacity building programmes in achieving successful implementation of the agreement.
Moreover, improvements on a specific indicator of the border administration pillar are likely to have a positive spillover effect on other indicators of this pillar. For instance, reducing paperwork and red tape reduces room for discretionary measures and irregular payments throughout the importing/exporting process. Improving border administration brings fiscal advantages for the government, by bringing down the costs associated with collecting duties, thus increasing profit margins.
In addition, there are examples of economies performing relatively well (above the sample average) on the border administration pillar, despite struggling on other ETI indicators assessing broader institutional aspects. Such is the case in a number of Latin American countries: Mexico ranks 62nd on the border administration pillar and 97th on the operating environment pillar; Dominican Republic ranks 63rd and 110th, respectively; Colombia, 68th and 112th. Elsewhere, Korea ranks 19th in terms of border administration, but a low 55th on the operating environment and Georgia ranks 35th and 71st, respectively. This suggests it is possible to reform border administration amidst a challenging overall environment.
Group PILL
AR 3
: BO
RDER
AD
MIN
ISTR
ATIO
N
Cust
oms
serv
ices
in
dex
Effic
ienc
y of
the
clea
ranc
e pr
oces
s
No. o
f day
s
to im
port
No. o
f doc
umen
ts
to im
port
Cost
to im
port
No. o
f day
s
to e
xpor
t
No. o
f doc
umen
ts
to e
xpor
t
Cost
to e
xpor
t
Irreg
ular
pay
men
ts
in e
xpor
ts a
nd
impo
rts
Tim
e pr
edic
tabi
lity
of im
port
proc
edur
es
Cust
oms
trans
pare
ncy
inde
x
INCO
ME
GROU
P
High-income: OECD 0.8 0.8 0.8 0.9 0.8 0.9 0.9 0.8 0.9 0.7 0.7 0.9
High-income: non OECD 0.7 0.6 0.6 0.9 0.6 0.9 0.9 0.6 0.9 0.7 0.7 0.8
Upper-middle income 0.5 0.4 0.4 0.8 0.6 0.9 0.8 0.5 0.8 0.4 0.4 0.8
Lower-middle income 0.4 0.4 0.3 0.8 0.4 0.9 0.8 0.4 0.9 0.3 0.4 0.7
Low income 0.3 0.3 0.3 0.6 0.3 0.7 0.6 0.4 0.7 0.2 0.3 0.5
REGI
ON
Advanced Economies 0.8 0.7 0.8 0.9 0.8 0.9 0.9 0.8 0.9 0.7 0.8 0.9
Central and Eastern Europe 0.6 0.5 0.5 0.9 0.6 0.9 0.9 0.6 0.9 0.5 0.5 0.8
MENAP 0.5 0.5 0.4 0.8 0.5 0.9 0.9 0.5 0.9 0.4 0.4 0.8
Latin America & Caribbean 0.5 0.4 0.4 0.8 0.6 0.9 0.8 0.6 0.8 0.3 0.4 0.8
Developing Asia 0.4 0.4 0.4 0.8 0.4 0.9 0.8 0.4 0.9 0.3 0.4 0.6
CIS 0.4 0.4 0.3 0.7 0.4 0.7 0.6 0.4 0.6 0.3 0.4 0.8
Sub-Saharan Africa 0.3 0.3 0.3 0.7 0.4 0.7 0.7 0.4 0.7 0.3 0.4 0.6
SELE
CTED
AGR
EEM
ENTS EU 28 0.8 0.7 0.7 0.9 0.8 0.9 0.9 0.8 0.9 0.7 0.7 0.9
GGC 0.7 0.5 0.5 0.9 0.5 0.9 0.9 0.6 0.9 0.7 0.6 0.8
ASEAN 0.5 0.5 0.5 0.8 0.5 1.0 0.8 0.5 0.9 0.2 0.5 0.5
SACU 0.4 0.6 0.3 0.8 0.6 0.8 0.8 0.5 0.7 0.5 0.5 1.0
SAFTA 0.4 0.3 0.3 0.7 0.3 0.9 0.7 0.3 0.9 0.2 0.4 0.7
MERCOSUR 0.4 0.3 0.3 0.7 0.4 0.8 0.7 0.5 0.7 0.3 0.3 0.7
Best Performer Singapore Singapore Norway Singapore Multiple Singapore Multiple Multiple MalaysiaNew
Zealand Finland Multiple
Table 1: Border administration: performance gap between selected groups and best performers in pillar componentsScores correspond to the ratio of group average values to best performing economy’s values
© 2014 World Economic Forum

The Global Enabling Trade Report 2014 | 17
Chapter 1: The Enabling Trade Index 2014
some 13,000 business executives who participated in the Executive Opinion Survey 2013, at the global level, identifying potential buyers is the most problematic factor for exporting. The benefits to society of improved ICT infrastructure are considerable. It facilitates the delivery of basic services, including education and financial services, creates new business models, and improves the transparency and accountability of administrations, thus contributing to better governance, to name just a few.
Yet the digital divide remains profound between advanced economies and the rest of the world (see Figure 4). Although mobile telephony is ubiquitous in most parts of the world, the capacity to fully leverage ICTs remains extremely limited in vast swaths of the developing world, owing to the lack of skills, infrastructure and equipment, digital content, affordability and political will (World Economic Forum, 2013). As of 2012, only one in ten individuals in Sub-Saharan Africa used the Internet on a regular basis, and there was less than one broadband Internet subscription per 100 population. The situation is slightly better in Developing Asia, the second-worst performing region in the ICTs pillar. Most governments and administrations have yet to adopt new technology. Not surprisingly, businesses are the most prompt at adopting new technologies. Due to advances in innovation, more competition and ever-falling costs and tariffs, one can expect the uptake in ICTs worldwide to increase rapidly in the coming years.
Country HighlightsAs a complement to the rankings tables, Table 6 reports the 10 best-performing economies on the overall Enabling Trade Index and the seven pillars, illustrating the quality and consistency of their performance across the index. The table also lists the top 5 by pillar. Below, we describe the performance of selected countries listed by region and by rank.8
Asia and the PacificFor the fourth consecutive edition, Singapore ranks 1st in the ETI. The level and consistency of Singapore’s performance is outstanding. As shown in Table 6, Singapore leads in two pillars (border administration and transport services), features in the top 5 of three more and ranks 8th and 13th in the remaining two. As a result, the score differential with second-ranked Hong Kong SAR is 0.5 points, which is considerable by ETI standards. One of the world’s leading trading platforms, the total value of merchandise exported to and imported from Singapore represented 2.9 times its GDP in 2012. A champion of government efficiency, Singapore’s excellent performance in terms of border administration is reflected in the top result achieved by the country on the related pillar (Singapore ranks in the top 3 on 10 of the 11 indicators composing the border administration pillar). Singapore established the world’s first national single window for trade (TradeNet) in 1989, bringing together more than 35 border agencies. As a result of this focus on efficiency, Singapore Customs estimated
Greece (67)73
Venezuela (137)
Chile (8)
UAE (16)
Iran (131)
Malaysia (25)
93
111.5
87.5
56
Mongolia (130)
Mauritius (29)
Chad (138)
Georgia (36)
Kyrgyz Rep. (109)
Latvia (41)
Serbia (89)
76
Central andEastern Europe
Commonwealth ofIndependent States
Sub-SaharanAfrica
DevelopingAsia
Middle East,North Africa,and Pakistan
Latin Americaand the Caribbean
AdvancedEconomies
Singapore (1)
20.5
Figure 5: The Enabling Trade Index 2014: Intra-regional performance gaps
Note: Based on IMF classification (see Table 1).
Highest-ranked
Median rank
Lowest-ranked
Rank
(out
of 1
38)
© 2014 World Economic Forum

Chapter 1: The Enabling Trade Index 2014
18 | The Global Enabling Trade Report 2014
JEAN-FRANÇOIS ARVIS (World Bank) and BEN SHEPHERD (Developing Trade Consultants Ltd.)
Bilateral trade costs capture all factors that drive a wedge between the price of goods at the factory or farm gate in the exporting country and the price paid by a consumer in the importing country. They, therefore, include factors such as distance, supply chain inefficiencies, tariff and non-tariff barriers. Lower trade costs make a country more competitive, and contribute to its global and regional integration.
The UNESCAP-World Bank bilateral trade costs database (Arvis et al., 2013) gives trade costs by pair of countries for the manufacturing and the agricultural sectors. The authors estimate the breakdown of trade costs by source of cost (see Figure 1). Expectedly, distance is a major source of trade costs, but logistics performance and connectivity are at least as important, and more so than tariffs. Developing countries face much higher trade costs in part due to the importance of policy in addressing the sources of trade costs. For example, regulation of transport and distribution markets, as well as trade policy measures, affect the level of trade costs, and are often more restrictive in developing countries than in developed ones.
Some trade costs are exogenous, in the sense that they are largely outside a country’s control. Geographical remoteness is an example. Other types of trade costs are endogenous, which means that they are primarily related to national policies. This means that policy reforms can do much to reduce trade costs and boost trade integration, especially measures that improve connectivity and logistics performance.
The Enabling Trade Index (ETI) captures most of the policy measures that influence trade costs. Expectedly, economies with a higher ETI score experience much lower trade costs (see Figure 2), in large part due to these enabling policies. The effect is quite strong—on average, a one-point increase in the ETI score is associated with a reduction of 40% in trade costs.
ReferenceArvis, J.-F., Y. Duval, B. Shepherd, and C. Utoktham. 2013. “Trade
Costs in the Developing World.” Policy Research Working Paper No. 6309, World Bank. Access the UNESCAP-World Bank trade costs database at http://data.worldbank.org/data-catalog/trade-costs-dataset.
Box 6: Logistics Inefficiencies a Primary Source of Trade Costs
0 50 100 150 200 250 300
1
2
3
4
5
6
7
Zimbabwe
Hungary
Singapore
BelgiumGermany
Hong Kong SAR
Armenia Rwanda
Gambia
Burundi
Figure 2: Relationship between the Enabling Trade Index, 2014, and average trade costs, 2010
Sources: Arvis et al, 2013, and World Economic Forum.Note: Only the 115 economies included both in the ETI and the trade costs database are represented.
ETI 2
014
scor
e (1
–7)
Trade costs (% ad valorem)
–0.50 -0.375 –0.25 –0.125 0.00 0.125 0.25 0.375 0.50
Cost of Starting a Business
Logistics Performance Index
Air Connectivity
Liner Shipping Connectivity
Exchange Rate
RTA
Tariffs
Same Country
Common Colonizer
Colony
Common Language (Official)
Common Language (Ethno.)
Common Border
Distance
Figure 1: Relative impact of different sources of trade costs
Source: Arvis et al, 2013.Note: For each component, the represented score corresponds to the group average value to the best performing economy’s value.
Exogenous factor
Endogenous factor
Standardized regression coefficients
© 2014 World Economic Forum

The Global Enabling Trade Report 2014 | 19
Chapter 1: The Enabling Trade Index 2014
that in 2012, the cost per Singaporean dollar of duty it collected was a mere 1.15 cents, a margin of 98.9%.9
Hong Kong SAR ranks 2nd overall for the fourth edition in a row, as a result of an excellent performance across the board. The territory is arguably the world’s most open market: it does not levy any customs tariff on imports or exports. There is also no tariff quota or surcharge, no value-added taxes or general services taxes. Hong Kong’s exporters do not enjoy a similar level of openness abroad. They face on average among the highest tariffs in the world (135th). Hong Kong ranks 39th in terms of GDP but is the world’s 9th largest exporter. The volume of merchandise traded through the territory amounted to four times its GDP in 2012. In general, Hong Kong offers the world’s friendliest operating environment for traders and businesses. It boasts world-class transport infrastructure, combined with excellent logistics and transport services. These features contribute to making Hong Kong one of the most connected places on the planet.
Japan ranks 15th overall in the ETI and 3rd in Asia behind the two frontrunners. While the country’s performance is strong overall, it is uneven across the different areas. Japan ranks 5th in the border administration pillar and in the top 10 of each of the three infrastructure-related pillars. In particular, it places 4th for the availability of transport and logistics services. By contrast, Japan ranks last in the foreign market access pillar. Its exporters face tariffs of 6% on average—one of the highest rates among the 138 economies studied (133rd) - and enjoy almost no preferential treatment
(138th). Domestically, Japan applies relatively low tariffs, but this is undermined by the complexity of its tariff regime (103rd). The county’s operating environment is favourable (22nd), but certainly not to the same degree as Singapore or Hong Kong SAR. Red tape (75th) and limited openness to foreign participation (66th)—in particular, for hiring foreign labour (109th)—are the country’s two main weaknesses within this pillar.
Far below its neighbour New Zealand (4th), Australia ranks 23rd overall, as a result of a very consistent performance across the indicators of the index. The country ranks no better than 15th—in ICT use—but no lower than 24th—in transport infrastructure—in six of the seven pillars. However, Australia is penalized by a low score in the foreign market access pillar (134th), reflecting the high tariffs faced abroad by Australian exporters. The country possesses excellent transport infrastructure overall, but port (40th) and railroad (32nd) infrastructures are strained by the boom in exports of various minerals, including coal and iron ore, of which the country is the world’s largest exporter, resulting in bottlenecks. Border administration (22nd) is very efficient, although room for improvement remains in terms of the cost and number of documents required to import and export. The fees associated with shipping a container from Australia (US$ 1,170) are approximately US$ 300 more than in New Zealand and almost three times as much as in Singapore.
Malaysia (25th) ranks second within ASEAN, behind Singapore. It is the best-performing country in the Developing Asia region, almost 30 places ahead of
Table 6: Performance of the ETI 2014 top 10 countries and presence in the top 5 by pillar
Country/EconomyOVERALL
ETI1. Domestic
market access2. Foreign
market access
3. Efficiency and transparency
of border administration
4. Availability and quality of transport
infrastructure
5. Availability and quality of
transport services6. Availability
and use of ICTs7. Operating environment
Number of times in top 5
Singapore 1 3 13 1 2 1 8 2 5
Hong Kong SAR 2 1 135 11 3 5 11 1 4
Netherlands 3 46 97 4 9 2 4 8 3
New Zealand 4 5 65 6 39 25 16 7 1
Finland 5 46 97 2 20 17 3 3 3
United Kingdom 6 46 97 7 10 9 2 11 1
Switzerland 7 85 71 12 12 8 14 5 1
Chile 8 9 2 26 64 43 36 25 1
Sweden 9 46 97 3 35 7 1 9 2
Germany 10 46 97 13 5 3 21 12 2
Japan 13 — — 5 — 4 — — 2
United Arab Emirates 16 — — — 1 — — — 1
Denmark 17 — — — — — 5 — 1
Qatar 19 — — — — — — 4 1
France 21 — — — 4 — — — 1
Mauritius 29 4 5 — — — — — 2
Cambodia 93 — 1 — — — — — 1
Lao PDR 98 — 4 — — — — — 1
Libya 106 1 — — — — — — 1
Nepal 116 — 3 — — — — — 1
© 2014 World Economic Forum
Chapter 1: The Enabling Trade Index 2014
20 | The Global Enabling Trade Report 2014
second-best China (54th). In a region afflicted by red tape, corruption and lack of infrastructure, Malaysia is an outlier. It ranks a remarkable 14th for the availability and quality of transport infrastructure. Maritime connectivity is among the world’s best (5th), far behind leading China, but almost on par with Hong Kong SAR (2nd), Singapore (3rd), and Korea (4th). The measures by Malaysia’s government to streamline and simplify regulations across its administration are having a positive impact on the efficiency of border administration. As a result, fees for exporting a container from Malaysia are the lowest in the world, according to the World Bank. Yet, the time and paperwork it takes to export remain significantly higher than in neighbouring Singapore, and corruption is present throughout the process.
The performance of Korea (30th) is uneven. The country ranks 5th on the infrastructure subindex of the ETI, owing to its outstanding level of digital readiness (6th) and world-class transport infrastructure (10th). The government is a world leader in e-government, and ICTs are ubiquitous across the entire society. This partly explains the excellent level of efficiency and transparency observed in border administration (19th). Yet Korea is penalized for low marks earned in the market access subindex (120th) and, to a lesser extent, for the quality of its operating environment (55th). Various aspects of the institutional framework, from red tape to the judiciary, as well as the access to finance (82nd), and the inward-looking nature of certain regulations, remain problematic.
At 54th, China is the best performing of the BRICS economies, a few notches ahead of South Africa (59th). The world’s largest exporter—China accounted for some 11% of all merchandise exports in 2012, significantly more than the United States and Germany—boasts good transport infrastructure by regional standards. While transport infrastructure has served China’s formidable exporting machine, other barriers certainly have been slowing it down. Clearing customs remains cumbersome in many ways, requiring significant paperwork. Consequently, China ranks 48th in border administration, thus suggesting much room for improvement. In addition, China still lags in terms of digital connectivity (82nd), although the situation is improving fast. The country’s performance is further weakened by relatively high tariff rates (114th) and the complexity of its tariff schedule (57th), as well as the high tariff barriers faced by Chinese exporters (125th).
Indonesia ranks 58th on the Enabling Trade Index—4th in ASEAN behind Singapore, Malaysia (25th) and Thailand (57th). Indonesia’s tariff regime offers relatively favourable conditions of access to its domestic market (26th) and abroad, Indonesian exporters enjoy some of the lowest tariff rates in the world (8th).
The Philippines ranks 64th on the ETI, and 5th within ASEAN. The country does well on the domestic market access (19th) and foreign market access (26th) pillars, but room for improvement remains with respect
to the other five pillars of the index. It ranks in the bottom half of the ETI sample in all of them. Border administration (71st) is mired by corruption and red tape, two factors also contributing to weakening the general operating environment (82nd). Like many countries in the region, the Philippines’ biggest weakness is the lack of adequate transport infrastructure (96th). The shortcomings are the most severe in the airport (105th) and port (107th) infrastructure. To make things worse, the availability and quality of associated logistics services remains largely insufficient (84th).
India ranks 96th on the overall ETI ranking. Among the BRICS economies, it lags far behind China and South Africa and trails Brazil by a few notches, but is 9 places ahead of the Russian Federation. Access to India’s domestic market is made difficult by high tariff barriers (135th). At 12.4%, average applied tariffs are among the world’s highest, with a low 10% share of duty-free imports. The tariff regime is complex and characterized by a high quantity of distinct tariffs and vast tariff dispersion across tariff lines. Abroad, Indian exporters face relatively high tariffs and benefit from almost no preferences. Thanks to good maritime and air connectivity, and its extensive rail network, India ranks a satisfactory 34th on the transport infrastructure pillar. But India must invest massively to develop and upgrade its infrastructure in order to respond to the needs created by the development of the manufacturing sector in the decades to come. The sector accounts only for 14% of GDP in an economy largely dominated by low value-added services and agriculture. In addition, ICT use remains limited by international standards (104th). The Indian administration is far from leveraging ICTs to their full extent. Red tape and corruption in connection with border administration (74th) lead to inefficiencies, delays and lack of predictability. India’s first position—along with several other countries—on the customs transparency index helps brighten the picture in this category.
Europe and Central AsiaRounding out the top 3, the Netherlands features in the top 10 of five pillars. The country boasts the best port infrastructure in the world, and the rest of its transport and ICT infrastructures are top-notch, earning the country the 3rd rank on the infrastructure subindex. The transparency and efficiency of its border administration are excellent, even though exporting to and importing from the country is costly on average, much more than in Singapore, Hong Kong SAR and most economies in East and Southeast Asia. Its overall performance on the ETI is weakened by a low mark on the market access subindex (75th).
The United Kingdom, leveraging its world-class border administration and infrastructure, ranks 6th in this year’s report. In particular, the United Kingdom ranks 2nd on the availability and use of ICTs and 1st in terms of Internet use for business-to-consumer transactions. Transport services can rely on good
© 2014 World Economic Forum

The Global Enabling Trade Report 2014 | 21
Chapter 1: The Enabling Trade Index 2014
logistics competence (5th), tracing and tracking ability (5th) and timeliness of shipments in reaching destinations (7th). Customs procedures are efficient and transparent, although the cost to export and import remains high (51st and 48th, respectively). The United Kingdom’s operating environment can leverage a strong protection of property rights (4th) and on a judicial system that is efficient and transparent in settling commercial disputes (1st). In line with other advanced economies, market access remains the main weak spot in the United Kingdom’s ability to enable trade. Domestic market access is discouraged by the high complexity of the tariff structure, while high tariffs faced and low margin of preference in destination markets impairs British firms’ opportunities to export.
Germany places 10th in the 2014 edition of the Enabling Trade Index. The country’s strong performance is based on excellent transport infrastructure facilities (5th) across all modes of transport, efficient border administration and an operating environment for business that is based on strong protection of property rights and high levels of accountability and efficiency within the public administration. The country also excels in terms of logistics services (3rd). The sector is highly competent and excels in terms of timeliness and ease of arranging shipments as well as their affordability. Despite this very positive assessment, there is room for improvement in some selected areas. Foreign direct investment and hiring of foreign labour remain constrained by restrictive regulations. In light of the rising importance of movement of people and capital for trade performance, these factors are likely to undermine Germany’s future performance if unaddressed. As with other EU economies, the country also suffers from a highly complex tariff structure, which primarily affects agricultural products.
France ranks 21st in this year’s ranking. Like other advanced economies, it experiences tariff restrictions in accessing foreign markets as well as domestically. In particular, the country faces high tariffs in destination markets and has a very low margin of preference over competitors. High complexity of the tariff structure (110th, together with other EU countries) discourages importing foreign products into the country. France can leverage a world-class transport infrastructure (4th in terms of availability and quality of transport infrastructure) and efficient transport services (15th). Border administration is generally efficient and transparent: France ranks 1st in terms of number of documents to import and export (only two documents are required), although the cost to import and export remains high (79th and 83rd, respectively). Finally, government bureaucracy and regulation impair an overall good operating environment: France ranks 120th for ease of compliance with government regulation and ease of hiring foreign labour.
Turkey occupies the 46th position, a good result among large emerging markets. The environment for exporters and importers in Turkey is characterized by good transport infrastructure (26th), in particular for air transport, well-developed logistics services (36th) and easy access to domestic markets (34th). The strong performance of the country on these elements allows it to benefit from its proximity to large markets. Further developing trade in Turkey would necessitate addressing some of the challenges the country is facing with respect to access in target markets, which remains more restricted than for most other economies (80th). The country could also benefit from more use of ICTs, in particular mobile telephony and the Internet. The government could play a leading role in promoting ICTs by putting more public services online (76th). Last, and not least, physical security remains fragile and represents a cost factor for trading companies.
Ranked 47th for enabling trade across borders, Italy remains one of the poorest performers among advanced economies (32nd out of 34, followed by the Slovak Republic and Greece). This is in spite of Italy’s role as the 10th largest trader in the world and 2nd largest manufacturing economy in Europe. A poor operating environment continues to be Italy’s weak spot. Access to finance is especially problematic, with the country ranking 111th worldwide. Availability of trade finance services is poor (115th) and businesses have indicated this as the most problematic factor for exporting. In recent years, the government has failed to reform the banking and financial sector, where balance sheets are increasingly burdened by non-performing loans and some banks need fresh capital. In line with other advanced economies, Italy suffers from restricted access to foreign markets, due to high tariffs faced and a low margin of preference. In line with other EU members, the country’s tariff structure is complex (110th), which increases the transaction costs of importing final products and inputs for production. The quality of Italian transport services and infrastructure is substantially in line with other advanced economies, with postal and intermodal transport services as the main competitive disadvantages. Finally, Italy lags behind other advanced economies in the availability and use of ICTs. In particular, poor use of ICTs by businesses and government and low percentage of individuals using the Internet are competitive disadvantages.
The Russian Federation occupies a low 105th position, thus enabling trade to a lesser degree than other BRICS economies. The country is also less export-oriented than other large emerging markets, primarily relying on energy exports. Export diversification would enable the country to put growth on a more stable footing. Some factors supportive of diversifying exports are in place. The country has solid infrastructure networks (42nd) in place and takes advantage of the availability of ICTs. At the same time, trade performance
© 2014 World Economic Forum

Chapter 1: The Enabling Trade Index 2014
22 | The Global Enabling Trade Report 2014
remains limited by the high and complex domestic tariffs (127th) as well as restricted access to markets abroad (84th). The Russian Federation’s recent accession to the WTO should help the country in this respect. Reforms to the operating environment could significantly improve its trade performance, in particular given the country’s strong human capital base. Better protection of property rights, more efficient and transparent public administration, less restrictive regulations to hire foreign labour and to invest from abroad as well as improvements to the overall physical security would enable the country to take advantage of its remarkable potential.
Latin America and CaribbeanChile enters the top ten of this year’s report, ranking 8th. The country has come a long way in the last years, improving its trade policy and reaching the top position in terms of market access (1st). In particular, the county enjoys very good access to destination markets (2nd) due to an average tariff faced of 3.5% (lowest rate worldwide). Access to domestic market is also facilitated by a very simple tariff structure (3rd worldwide) consisting of only two distinct tariffs, zero tariff peaks and specific tariffs, and almost no tariff dispersion. Infrastructure remains a weak spot for the country, ranking 64th in terms of availability and use of transport infrastructure. Border administration is rather efficient and transparent, and the country’s operating environment benefits from good openness to foreign participation, with an efficient regulation on foreign direct investments (FDIs) (10th). However, protection of property, and in particular intellectual property rights, could be improved.
One of the best performing countries in Central America and the Caribbean, Panama ranks 52nd in this year’s report. Poor foreign market access burdens the country’s performance and constitutes the main competitive disadvantage vis-à-vis its neighbours. Infrastructure is one of Panama’s strengths; it ranks 5th for quality of air transport infrastructure and 6th for quality of port infrastructure. Transport mode change is also efficient as well as border procedures. Exporting and importing requires only three documents (3rd) and the cost to export amounts to US$ 625 per container (14th worldwide). Panama’s operating environment benefits from top-level access to finance (7th), good protection of property rights (35th) and openness to foreign participation and FDIs. Availability and use of transport services and ICTs are also above regional average, although broadband connectivity remains low and the quality of government online services poor.
Mexico ranks 61st in this year’s report, performing slightly better than the rest of Central America and the Caribbean. Market access is one of the country’s competitive advantages: it ranks, respectively, 33rd and 29th in terms of domestic and foreign market access. A vast majority (83.7%) of imports enter the
Mexican market free of duty (ranked 16th). Border administration is generally in line with the rest of Central America. Only four documents are necessary to export and import (16th and 11th respectively). Transport infrastructure, particularly railroads, should be improved, as well as postal services’ efficiency. Low efficiency and accountability of public institutions (128th) and poor physical security (130th) plague Mexico’s operating environment. The country has one of the highest homicide rates in the world, making protection from crime and violence for businesses very costly. Businesses have also identified corruption, crime and theft as some of the most problematic factors for importing. Notwithstanding the weaknesses of public institutions, Mexico remains open to foreign participation: the country ranks 44th for business impact of regulations on FDIs and 26th in terms of openness to multilateral trade rules.
Ranked 86th in this year’s Report, Brazil’s performance leaves room for improvement. Market access is generally poor and below the South American average. Access to the domestic market is restricted by high tariff rates (117th) and a low share of imports free of duty (33.1%, ranked 99th). These shortcomings are only partially offset by the simplicity of the tariff structure, characterized by the lowest presence of specific tariff in the sample and few tariff peaks (25th). Infrastructure development is of utmost importance. Brazil’s domestic infrastructure ranks low across all modes of transport, although the country’s market size (it is the 7th largest economy and 5th most populous country in the world) allows maintaining good air and liner shipping connectivity with the rest of the world. Transport mode change is also particularly inefficient. Availability and use of ICTs are two of Brazil’s competitive advantages and are significantly better than in the rest of South America. In particular, mobile phone connectivity is good, as is Internet use by businesses and government. Finally, Brazil’s operating environment continues to be characterized by high levels of corruption and complicated government regulations. Physical security is also one of Brazil’s weak spots (103rd), with one of the highest homicide rates in the world and high business costs of crime and violence.
At 95th position, Argentina occupies a rather low place in the ETI. Measures to enhance trade would allow the country to spur economic growth by enabling Argentina to participate in cross-border value chains. Argentina enjoys good market access conditions in major export markets, and importers benefit from a simple, albeit relatively high, domestic tariffs. Other advantages include high levels of ICT connectivity, which could enable Argentinean traders to connect easily. Enabling trade and the participation in cross-border supply chains in Argentina will require progress on two fronts. One is border administration, which remains burdensome and is ranked 96th overall. Export and
© 2014 World Economic Forum

The Global Enabling Trade Report 2014 | 23
Chapter 1: The Enabling Trade Index 2014
import procedures are costly and lengthy in international comparison and require many steps to be taken. A simplification of these administrative requirements—for example, by stronger reliance on ICTs for administrative procedures—could significantly improve the profitability of exports. More prevalent use of ICTs could equally help increase the transparency and accountability of these transactions, thereby reducing opportunities for corruption related to importing and exporting. The second area where Argentina is disadvantaged is the overall operating environment. Insufficient protection of property rights, difficult access to finance (including trade finance) and restrictive rules and regulations governing FDIs are important impediments to developing trade in the country. The increasing share of trade taking place in cross-border supply chains raises the importance of the business environment for trade performance, and Argentina will have to address some of these challenges if it wishes to further benefit from international trade.
Middle East and North AfricaThe United Arab Emirates occupies the 16th place on this year’s edition of the ETI and leads the Middle East and North Africa region. The country’s success in establishing a logistics, trade and tourism hub in the region is reflected in its solid positioning on the ETI, which is buoyed by strong performance in terms of transport infrastructure, where the country is second to none. The UAE also boast a very efficient border administration system and an operating environment that is very conducive to trade with easy accessible finance and ease of hiring foreign labour. Further enabling trade in the UAE will require further strengthening of logistics services (27th) and efforts to reduce the tariff burden faced by UAE exporters abroad. Certain aspects of public institutions would also merit additional attention; for example, judicial efficiency and impartiality and protection of property rights.
Saudi Arabia comes in at 48th in the ETI sample. Importers and exporters benefit from a fairly sound operating environment (34th) and from fairly good transport infrastructure (38th), in particular when it comes to the quality of air transport (24th) and seaport facilities (19th). The country also has a fairly simple tariff regime (29th) and benefits from prevalent use of new technologies for business-to-business transactions (23rd) and the provision of government services (19th). The country’s performance could be improved through efforts to reform border administration in order to make the clearance process more efficient (54th) and more predictable (46th). World Bank data10 indicates that although the number of procedures and time necessary to clear goods at the border remained unchanged, the costs associated with the clearance process have increased significantly over the past two years.11 Increasing and diversifying its export performance will be important for Saudi Arabia in order to stabilize growth, create employment and reduce reliance
on the energy sector. One area of focus for the country should be to review the trade barriers its exporters face abroad and to look into initiating international agreements to reduce this burden.
North AmericaCanada comes in 14th in this year’s ranking. The country performs rather homogenously across all dimensions of trade facilitation, but suffers from high faced tariffs and a low margin of preference in destination markets. Exporting and importing goods across borders is also particularly expensive, with the country ranking respectively 95th and 106th in terms of cost to export and cost to import. With 89.4% of imports entering the country free of duty, Canada’s domestic market is one of the most accessible among advanced economies (4th out of 34). Nonetheless, businesses have identified high tariffs and burdensome import procedures as the two most problematic factors for importing. Limited openness to multilateral trade rules and difficulties in hiring foreign labour are among the competitive disadvantages of Canada’s operating environment.
Ranked 15th in this year’s report, the United States is the world’s main trader of manufactured goods, accounting for 10.49% of world trade. The country can leverage good border administration and infrastructure. Customs are generally efficient and transparent, and exporting and importing procedures require, respectively, only 6 and 5 days (1st and 2nd respectively). Costs remain high, however, especially for importing (US$ 1,315 per container). Transport connectivity and infrastructure are two of the country’s competitive advantages, mainly due to good connections with the rest of the world. Good logistics competences (7th) and tracking and tracing ability (2nd) characterize the United States’ transport services. ICTs are also one of the country’s competitive assets, with a high number of active mobile broadband subscriptions (8th) and extensive use of Internet for business-to-consumer transactions (3rd). The United States also ranks 1st for quality of government online services. However, market access remains one of the country’s weak spots, in line with most other advanced economies. High complexity of the domestic tariff structure discourages imports while local firms face one of the highest tariff rates in destination markets (130th) and a low margin of preference. Deepening international trade policy initiatives could help to address these shortcomings.
Sub-Saharan AfricaMauritius remains the best performer on the African continent at 29th position. The country is one of the success stories in terms of trade development in Africa and its strong trade performance is reflected in the results it achieves on the ETI. Access to domestic markets is almost completely free, with very low tariff rates (0.8%, on average), and Mauritius also benefits from a high margin of preference on tariffs in target
© 2014 World Economic Forum

Chapter 1: The Enabling Trade Index 2014
24 | The Global Enabling Trade Report 2014
markets. Infrastructure is fairly good and the overall business environment is conducive to trade, with rules and regulations that are open to FDIs, fairly good levels of physical security, and an impartial and efficient judicial system. At the same time, room for improvement remains in terms of the availability of quality logistics services in the country. Advanced logistics services, such as tracking and tracing consignments or reliability in terms of timeliness, are not prevalent in the country. Despite the open economy, some sectors remain protected by tariff peaks and specific tariffs, which makes it difficult to navigate the tariff regime for exporters.
South Africa’s assessment on the ETI results in a rank of 59th, and its performance on most of the indicators is consistent with this overall rank. The areas that stand out positively include the quality of infrastructure in certain modes of transport, in particular for air and sea. The country also benefits from well-protected property rights (18th) and ease of access to finance for businesses (15th), including the ability to trade finance (24th). At the same time, some challenges remain to be addressed. These include the dismal security situation (123rd), which imposes additional costs on businesses operating and trading in the country. The tariff structure for imports is highly complex (92nd) and average tariffs are fairly high in international comparison (74th). Last but not least, the efficiency of border administration could be improved as procedures to import and export goods are lengthy and costly
Nigeria occupies a low 124th position, which is illustrative of a significant number of challenges faced by the country. As African economies continue to grow, demand is set to increase and African economies should be well positioned to take advantage of these new potential export opportunities. For Nigeria to take more advantage of exports for its development, the country will have to identify ways to reduce the high trade barriers exporters face in target markets. Nigeria’s market is very open, yet many non-tariff barriers are hindering trade development. These include underdeveloped infrastructure across all modes of transport, insufficiently available and costly transport services and low use of ICTs. The country is also struggling with challenges related to the overall business environment. Physical security imposes significant costs on foreign and local businesses and is a major deterrent to foreign direct investment in the country. The governance framework, as far as it pertains to trade (property rights, impartiality and efficiency of the judiciary and transparency), is also in need of strengthening.
CONCLUSIONThe agreement on trade facilitation at the Bali WTO ministerial meeting created renewed momentum for enabling trade and removing many of the trade barriers assessed by the Enabling Trade Index, such as the
cumbersome border procedures, burdensome customs clearance or lack of transparency on regulations. As countries wish to seize the momentum created by the favourable environment, the Enabling Trade Index can provide a tool for identifying strengths and weaknesses and tracking progress in enabling trade.
Three types of trade barriers stand out among the measures assessed by the ETI. Two of them, measures to reform border administration and enhancing the quality and efficiency of logistics services, have received much attention recently, as they bear the promise of considerable gains at limited cost. Thirdly, although tariff barriers have, on average, diminished in importance as they have come down through consecutive rounds of trade liberalization over the past decades, the complexity of tariff regimes, in particular in advanced economies still presents an important obstacle to international trade.
Our results show that various and significant trade barriers persist, particularly in the developing world. The good news is that some of these barriers can be removed relatively quickly, at a low cost and using limited political capital. Our findings point to a number of success stories, ranging from Chile to Mauritius and Malaysia. They also highlight the weaknesses of several large emerging economies, such as Brazil, India, Russia and Nigeria, where trade is impeded by red tape, pervasive corruption, inadequate infrastructure and low levels of security, to name a few issues. The mediocre performance of these countries on the Enabling Trade Index suggests that they are failing to put in place the reforms needed to enable trade and step up to the next stage of their development.
By ranking countries according to the barriers to trade they have in place, The Global Enabling Trade Report provides key information on one specific set of measures that could enable countries to further benefit from trade in this new and rapidly changing global environment. The Report is intended to be a motivator for change and a foundation for dialogue, by providing a yardstick of the extent to which countries have in place the factors that facilitate the free flow of goods and by identifying areas where improvements are most needed.
NOTES 1 See the Acknowledgments section at the end of this Report for a
list of data partner organizations.
2 The contribution of Survey indicators to the overall ETI is calculated as the sum of individual weights, which depend on the placement in the Index. The contribution is calculated as the weight of the individual indicator within the component it belongs to, multiplied by the weight in the ETI of that component.
3 See Browne et al. (2013) for more information about the Executive Opinion Survey process and data.
4 Estimates based on the International Monetary Fund’s World Economic Outlook (October 2013 edition) and on the World Trade Organization’s Time Series on Merchandise and Commercial Services Database (retrieved November 8th, 2013), respectively.
© 2014 World Economic Forum

The Global Enabling Trade Report 2014 | 25
Chapter 1: The Enabling Trade Index 2014
5 For example, the general scheme of preference (GSP), GSP+, and Everything But Arms (EBA) arrangements of the European Union for selected developing countries, the Caribbean Basin Economic Recovery Act (CBERA) and Caribbean Basin Trade Partnership Act (CBTPA) of the United States.
6 Mineral products comprise crude oil and gas, metal ores and other minerals as well as petroleum products, liquefied gas, coal, and precious stones. The figures cited here are averages of annual shares over the period 2007-2011 and come from the International Trade Centre.
7 Georgia officially withdrew from the CIS on August 18, 2009, but the International Monetary Fund includes it in the CIS group for reasons of geography and similarities in economic structure.
8 The selection comprises the top 3 performing economies, the 19 countries member of the G20 (the 20th member is the European Union), the regional champions, and those countries where the World Economic Forum has a regional event in 2014.
9 According to Singapore Customs Yearly Revenue Statistics (accessed March 7, 2014) available at http://www.customs.gov.sg/topNav/pub/Statistics.htm.
10 World Bank’s Doing Business historical database.
11 For example, the cost to export a container has increased from 765 USD in 2011 to 1055 USD in 2013.
REFERENCESBhagwati, J. 2013. “Dawn of a New System”. Finance and Development.
Washington, DC: International Monetary Fund. December.
Browne, C., T. Geiger, and T. Gutknecht. 2013. “The Executive Opinion Survey: The Voice of the Business Community”. The Global Competitiveness Report 2013-2014. K. Schwab ed. Geneva: World Economic Forum.
International Monetary Fund. 2013. World Economic Outlook database (October 2013 edition). Available at www.imf.org/weo.
Lawrence, S, S. Doherty and M. Drzeniek Hanouz, 2012. “Reducing Supply Chain Barriers: The Enabling Trade Index 2012”. The Global Enabling Trade Report 2012. Geneva: World Economic Forum.
United Nations. 2014. “Document on the Focus Areas. Open Working Group on Sustainable Development Goals”. Available at: http://sustainabledevelopment.un.org/focussdgs.html (retrieved 21 February, 2014).
World Economic Forum. 2013. “The Global Information Technology Report 2013; Growth and Jobs in a Hyperconnected World”. Bilbao-Osorio, B., S. Dutta, and B. Lanvin, Editors. Geneva: World Economic Forum.
© 2014 World Economic Forum

© 2014 World Economic Forum

The Global Enabling Trade Report 2014 | 27
CHAPTER 2
Latin America and the Caribbean in South-South Trade: Trade Performance and Main Obstacles to Developing TradeMARGARETA DRZENIEK HANOUZ
World Economic Forum
ANTONI ESTEVADEORDAL
PAOLO GIORDANO
MAURICIO MESQUITA MOREIRA
Inter-American Development Bank
In the last three decades, the Latin America and the Caribbean (LAC) region’s quest for growth and development hinged, to a great extent, on its capacity to harness the benefits of international trade. The region participated actively in multilateral trade negotiations, embarked on novel North-South trade agreements with developed countries and, more recently, witnessed a boom of South-South trade, fueled by the rise of China and other emerging economies and the related rising demand for commodities. As a result LAC trade expansion consistently exceeded GDP growth, and functioned as an effective engine of growth until the 2008-2009 global financial crisis brought this virtuous circle to an end.
The crisis is now in the past, but the future of the global economy and the world trading system has been profoundly altered by the events of the last decade. With the countries of the South still growing at a faster rate than the North,1 import demand in the South has become large enough to cause a major shift in trade patterns. The South is now trading more with itself than with the North. In addition, this South-South trade is becoming more diverse and complex. Although the South still relies heavily on commodity trade, some countries have been successfully moving up the value chain and joining global and regional production networks.
The Inter-American Development Bank’s (IDB) Trade and Integration Monitor 2013 illustrates and analyzes long-term trends in the global economic and trade structure and their impact on LAC trade prospects. In 2012, while advanced economies grew at an average of only 1.2%, Developing Asia2 and Sub-Saharan Africa, in contrast, posted average growth rates of 6.5% and 4.9%, respectively. In the same year, LAC grew by 3% and is expected to grow at 2.7% in 2013. As illustrated in these figures, over half of global GDP growth in 2012 occurred in the developing South.
The growth of trade flows reflects the divergence in economic performances of North and South. Exports originating in developing countries have been growing rapidly and are expected to account for over 50% of world exports within the next few years (Figure 1). In real terms, trade of advanced economies stabilized in 2011–2012 at a level below the pre-crisis peak, and began to decline in the second half of 2012 as advanced economies’ growth slowed.3 In contrast, trade of developing countries, particularly those in Asia, is above pre-crisis levels by a wide margin and continues to follow a positive trend. Thus, the fact that world trade has been exceeding pre-crisis levels since 2010 is solely due to the performance of developing countries. With respect to LAC, at the beginning of 2013, real imports and exports were higher than their pre-crisis peaks. However, while LAC imports have expanded at a faster pace than developing countries’ trade, real exports have grown only on pace with total world trade.
© 2014 World Economic Forum

Chapter 2: Latin America and the Caribbean in South-South Trade
28 | The Global Enabling Trade Report 2014
South-South trade has thus emerged as a main driver of LAC trade performance. The identified trends provide compelling reasons for seeking better access to developing markets in Asia as well as deepening economic integration within LAC and forging new trade ties with Africa. Exports to the South have been growing at a higher rate than exports to the North in nearly all LAC countries, and exports to partners within the region account for over half of LAC South-South trade. These exports are more diverse and more concentrated in manufacturing (nearly 60% of intra-LAC trade in 2011) than LAC exports to other regions (Figure 2). Thus, South-South trade, in particular regional trade within LAC, holds the potential to become an important avenue for export development and diversification for the countries of the region.
ENHANCING SOUTH-SOUTH TRADE AND LAC INTEGRATIONThe challenge then is to promote policies that encourage companies to take advantage of the opportunities presented by these evolving trends. Southern countries face significantly higher overall export costs than do Northern countries, both in South-South and in South-North trade. The South faces higher tariffs, but these have fallen more rapidly as developing countries concluded South-South free trade agreements (Figure 3). Yet, while South-South tariffs have been falling, from over 10% on average in the 1990’s to under 5% by 2010, they have been replaced by other trade restrictions that are less transparent and harder to quantify. Such restrictions
have been implemented mostly by developing countries, including countries within LAC.
Seizing the opportunities of growing South-South trade therefore requires the removal of policy barriers, which, although common to all trade, are often more prevalent in trade among developing countries. Policymakers need a full understanding of the quantitatively and qualitatively different obstacles to such trade, and need to avoid protectionist measures that limit their trade potential. Such obstacles are located both within exporting countries (e.g. high trade costs caused by inadequate infrastructure and burdensome rules and regulations), as well as among Southern countries (e.g. the imposition of tariffs and especially non-tariff measures that hurt trade interests in a non-transparent manner). Among the former, transport costs merit particular attention. Recent analysis shows that the cost of getting goods to market, both international shipment and transport within countries to the port, far exceeds the costs of most policy-related costs, such as tariffs (see Box 1).
As Southern countries take a larger role in global trade, changes in the trading system are not restricted to the emergence of new big players, but also include the reorganization of production and trade among all countries. The growing presence of transnational corporations originating and operating in the South is a key trend, leading to increased South-South flows of foreign direct investment, and the greater fragmentation of production processes across countries.
0
20
40
60
80
100
2018e
2017e
2016e
2015e
2014e
2013e
2012e
2011
2010
2009
2008
2007
2006
2005
2004
2003
2002
2001
2000
1999
1998
1997
1996
1995
Figure 1: Growth of South-South trade, 1995-2018
Source: IDB Integration and Trade Sector based on COMTRADE data and IMF WEO, April 2013 (GDP forecasts).Note: Trade values between 2012 and 2018 are forecasts.
Perc
enta
ge o
f tot
al w
orld
trad
eNorth-All
South-North
South-South
South-South Upper Range
South-South Lower Range
53%
© 2014 World Economic Forum

The Global Enabling Trade Report 2014 | 29
Chapter 2: Latin America and the Caribbean in South-South Trade
0
20
40
60
80
100
2011
2010
2009
2008
2007
2006
2005
2004
2003
2002
2001
2000
1999
1998
1997
1996
1995
2011
2010
2009
2008
2007
2006
2005
2004
2003
2002
2001
2000
1999
1998
1997
1996
1995
Figure 2: Sector composition of LAC south-south exports: intra-LAC vs. LAC-Asia, 1995–2011
Source: IDB Integration and Trade Sector based on COMTRADE data.
Intra-LAC LAC-Asia
n Manufacturing
n Fuels
n Ores and Minerals
n Agriculture
0
5
10
15
20112010200920082007200620052004200320022001200019991998199719961995
Figure 3: Effective applied tariffs, including preferences, 1995–2011
Source: IDB Integration and Trade Sector based on TRAINS and INTrade data.Note: Trade-weighted average of tariff faced by exports.
Tarif
f fac
ed, a
d va
lore
m e
quiv
alen
t (%
)
North-North
South-North
South-South
© 2014 World Economic Forum

Chapter 2: Latin America and the Caribbean in South-South Trade
30 | The Global Enabling Trade Report 2014
In Punta Arenas, Chile, at South America’s southern tip, beer producers wishing to sell abroad must ship their product by truck to the port of San Antonio, in the country’s central region, a distance of more than 1,800 miles. In Pucallpa, capital of Peru’s low-income department of Ucayali in the Selva region, exporters of wood products must ship their goods to the port of Callao, in Lima, over 466 miles of often unpaved roads that wind through the Andes, sometimes at elevations higher than 13,000 feet. In Mexico, exporters of powdered milk in Chiapa de Corzo, in the southern state of Chiapas, have to ship their products to ports on the Pacific Ocean and Gulf of Mexico—on average 671 miles away—and often must cross mountain passes at elevations up to 7,400 feet. Similarly, in Brazil long and costly shipments are also part of the challenge faced by soy exporters in the municipality of Sapezal in the central-west state of Mato Grosso. Most of their products are shipped through the congested port of Santos in the southeast, 1,400 miles away.
These stories might be considered extreme and anecdotal, but unfortunately they largely reflect the reality confronted by most firms located in regions far from the main urban agglomerations and ports in Latin America and the Caribbean (LAC). Firms with the resources and skills to produce goods in high demand by regional or world markets face high domestic transport costs that erode their gains, literally along the road. Or they refrain from exporting altogether.
Why should governments care?Any serious analysis of the trade consequences of domestic transport costs faces formidable empirical, theoretical and policy challenges. In Too Far to Export,1 we set out to meet these challenges by building an unprecedented database of the municipal origin and domestic shipping costs of exports for five of the largest and most representative countries in the region: Brazil, Chile, Colombia, Mexico and Peru. The data leaves no doubt about the high subnational concentration of exports--with the top ten municipalities accounting from 45% of total exports in Peru to 74% in Chile. It also suggests that these high levels of concentration are inversely correlated with domestic transport costs to export.
This inverse relationship suggests that policies tailored to these costs are likely to have a significant impact on exports, but by how much? We sought to answer this question by estimating an equation that relates municipal exports at the product level with their ad valorem transport costs to the customs of exit, while controlling for the influence of factors such as comparative advantages that might also affect exports. The results, shown in Figure 1 below, confirm the inverse relationship and point to an economically and statistically significant impact in all five countries studied. Colombia emerges as the country with the most to gain from improvements in transport infrastructure and services: a 1% reduction in ad valorem transport costs can increase exports by as much as 7.9% in agriculture, 7.8% in manufacturing, and 5.9% in mining. But even Mexico, where average impact across sectors was the lowest, would see substantial gains through improved transport, particularly in agriculture, where a 1% drop in transport costs could produce a 4% increase in exports.
(Cont’d.)
Box 1: Too Far to Export
0 1 2 3 4 5 6 7 8
Peru
Mexico
Colombia
Chile
Brazil
Figure 1: Average impact on municipal exports by a 1% reduction in domestic transport costs, by sector
n Agriculture
n Manufacturing
n Mining
Percent growth in exports
Source: IDB, 2013.
© 2014 World Economic Forum

The Global Enabling Trade Report 2014 | 31
Chapter 2: Latin America and the Caribbean in South-South Trade
Bringing the discussion closer to actual policiesTo move this discussion closer to the world of policymaking, we used these estimates to simulate the impact on exports of straightforward measures to lower domestic transport, some of which are already being implemented by governments in the region. In Brazil and Peru, we combined government projects to expand the transport networks with ad hoc measures to improve their quality. In Mexico, we focused on the investment projects of the country’s 2007-2012 road program. In Colombia and Chile, we simulated a regional cost convergence to a benchmark defined by the municipalities with the lowest transport costs.
The overwhelming message that emerges from these exercises is that policies to minimize domestic shipping costs can be particularly powerful in reshaping the sub-national distribution of exports and spreading the gains of trade more evenly. In Peru, for instance, we estimate that building new paved roads has the most impact on the Selva and Sierra departments, which are among those that export the least. These paved roads would reduce domestic shipping costs 15-40% and increase exports 10-23%.
In Brazil, implementation of the National Logistic Plan’s major railway and waterways projects and an overall improvement in road quality are estimated to benefit
disproportionally the country’s remote agricultural and mining regions, particularly in the north and central-west. These investments would reduce average domestic shipping costs in these areas by 30% and would boost exports by an average of 12.5%.
In Mexico, even though the 100 strategic projects of the road program do not particularly seem to target the peripheral regions, some of these region’s states, particularly in the south, appear among the greatest beneficiaries.
In Colombia, a countrywide convergence in domestic transport costs to the level enjoyed by a department such as Magdalena in the north—whose costs are among the lowest 25% in the country—would have the most impact in the remote and poorer regions. Among the most to gain are municipalities in the southeast, where exports would increase on average 10-45%.
Finally, there is Chile, where a countrywide convergence in domestic transport costs to the level of Santiago—one of the lowest in the country—would produce dramatic transport cost savings in the most remote and least export-oriented regions of up to 80% and increases in exports of up to 40%.
Notes1 IDB, 2013.
Box 1: Too Far to Export (cont’d.)
To take just one measure of increasing fragmentation of production, the share of parts and components (P&C) in intra-LAC exports has remained relatively stable from 1995 to 2011, and higher than the share of P&C exports in LAC-Asia and LAC (excluding Mexico)-North trade (Figure 4). Thus, promoting intra-LAC trade is crucial for sustaining the region’s participation in network trade. These changes open new opportunities, from increased South-South FDI flows to insertion into global value chains. But, again, in order to harness these possibilities, LAC policymakers and exporters need to fully grasp and address the constraints that hamper South-South trade.
Going forward, the region should be wary of the risks of excessive export concentration and be ready to adjust to new risks looming over the world economy. China, which has been the principal driver of South-South trade, may not only be slowing down from the high growth rates of the past decade. It may also be shifting its development strategy from the export-led model that favored trade with emerging economies, including the commodity exporters of the region, to one based more on internal consumption. While focusing on South-South trade is certainly a valuable strategic option for LAC, it should be regarded as an additional component of a more comprehensive trade strategy that actively pursues export diversification, both in
terms of products and destinations. Given the rising share of supply-chain trade in world trade, participation in globalized supply chains is an imperative and not a choice for Latin American economies. In this context, the regional integration efforts in other regions, such as the EU and ASEAN, provide interesting examples.
MAIN OBSTACLES TO DEVELOPING TRADE IN LATIN AMERICAThe Enabling Trade Index (ETI) presented in Chapter 1 of this report offers a tool to identify the most pressing obstacles to trade. It assesses to which extent countries have in place the attributes to enable and facilitate trade across borders. Published since 2008, the ETI has informed countries in their efforts to enable trade. It assesses 138 countries on a number of factors that are known to enable trade, such as market access, efficiency and transparency of border administration, transport infrastructure, logistics services, ICT infrastructure, as well as relevant aspects of the operating environment, including property rights and security.
Given its focus on trade facilitation, the ETI can be particularly useful to shed light on supply chain barriers to trade faced by companies in different countries. Estimates of the potential gains of improving on two of the areas captured in the index (border administration
© 2014 World Economic Forum

Chapter 2: Latin America and the Caribbean in South-South Trade
32 | The Global Enabling Trade Report 2014
and infrastructure) using gravity and computable general equilibrium (CGE) modelling show that countries in the region could gain substantially from reforms. If countries improved halfway to global best practice (Singapore), they would realize significant gains in terms of increase in exports and imports, as well as GDP (Table 1). For the LAC region without Mexico and Brazil, such reforms would result in gains around 7.5% of GDP growth.4
Table 1: Potential gains from trade facilitation improvements in Latin American countries
GDP Export Import Growth, % Growth, % Growth, %
Mexico 4.4 11.2 26.3Brazil 3.6 29.7 73.9Rest of the Americas 7.5 37.9 39.1
Source: World Economic Forum, 2013.
In its 2014 edition, the ETI covers 20 countries from the Latin America and Caribbean region, which are presented in Table 2.5 Overall, the ETI results show that countries in the region enable trade to very different degrees. Chile leads the way as the only Latin American economy to enter the top 10 at 8th position. Chile’s strengths are to be found in its very open tariff regime (9th) and the low tariffs its exports face abroad (2nd). Yet even in Chile there is some room for improvement with respect to infrastructure and transport services, and to a lesser extent in the efficiency of border administration.
The remaining countries from the region occupy lower positions, spreading from Costa Rica at 42nd to Venezuela at 137th. The two largest economies in the region, Mexico and Brazil place 61st and 86th, respectively. In the case of Mexico, while the country benefits from fairly accessible markets at home and abroad, trade growth is constrained by high levels of crime and violence (130th) and an overall operating environment that is difficult due to red tape, a high regulatory burden and corruption. In Brazil, trade is enabled by the widespread use of ICTs and fairly widely available transport services. At the same time, domestic market access is relatively constrained (108th) and the country faces challenges with respect to transport infrastructure (102nd) as well as physical security (130th) and red tape (137th).
At the regional level, the ETI results for Latin America in comparison with the average of high-income OECD countries on the one hand and Developing Asia on the other (Figure 5) show that the region on average has achieved a high level of market access for goods to domestic and foreign markets. The LAC region’s markets are more easily accessible than those in the Developing Asia region. Yet, although over the past years, many efforts have been undertaken in the region to improve domestic market access, but also to improve access to destination markets, considerable differences between countries prevail. While Brazil’s (108th) and Argentina’s (90th) domestic markets are among the most protected by tariffs in the ETI sample, countries
0
5
10
15
20
25
30
35
20112010200920082007200620052004200320022001200019991998199719961995
Figure 4: Share of parts and components in LAC exports, 1995–2011
Source: IDB Integration and Trade Sector based on INTrade/DataINTAL.
Perc
enta
ge o
f tot
al e
xpor
ts
Mexico-North
LAC-Asia
Intra-LAC
LAC-North (excl. Mexico)
© 2014 World Economic Forum

The Global Enabling Trade Report 2014 | 33
Chapter 2: Latin America and the Caribbean in South-South Trade
2
1
3
4
5
6
7
Pillar 7: Operating environment
Pillar 6: Availability and use of ICTs
Pillar 5: Availability and quality of transport services
Pillar 4: Availability and quality of transport infrastructure
Pillar 3: Efficiency and transparency of border administration
Pillar 2: Foreign market access
Pillar 1: Domestic market access
Figure 5: Latin America and the Caribbean pillar scores vs other key regions, 2014
Developing Asia Average
High-Income OECD Average
LAC Average
Table 2: Latin America and Caribbean economies in the Enabling Trade Index, 2014
Pillar 3: Pillar 4: Pillar 5: Pillar 1: Efficiency Availability Availability Index Pillar 2: and and and Pillar 6: Enabling Domestic Foreign trans parency quality of quality of Availability Pillar 7: Trade market market of border infrastructure transport and use Operating Index access access admin istration transport and services of ICTs environment
Economy Rank Score Rank Score Rank Score Rank Score Rank Score Rank Score Rank Score Rank Score
Argentina 95 3.66 90 4.41 44 3.24 96 3.73 95 2.71 73 3.96 55 4.39 124 3.38
Bolivia 87 3.72 83 4.65 15 3.90 93 3.81 110 2.50 114 3.43 94 3.15 96 3.77
Brazil 86 3.77 108 4.01 77 2.38 80 4.17 102 2.65 60 4.20 48 4.72 90 3.86
Chile 8 5.13 9 5.93 2 5.08 26 5.60 63 3.53 43 4.60 36 5.02 25 5.03
Colombia 73 4.00 36 5.08 18 3.85 68 4.44 112 2.48 88 3.74 56 4.34 112 3.55
Costa Rica 42 4.39 20 5.55 16 3.89 46 4.88 117 2.44 83 3.83 62 4.20 46 4.48
Ecuador 65 4.07 35 5.09 36 3.38 64 4.54 80 3.13 71 3.97 80 3.76 88 3.89
Dominican Republic 79 3.89 78 4.74 70 2.49 63 4.55 53 3.72 85 3.80 83 3.71 110 3.63
El Salvador 71 4.04 14 5.75 21 3.75 84 4.07 75 3.28 63 4.14 69 3.98 114 3.55
Guatemala 62 4.14 8 5.96 47 3.17 61 4.57 72 3.30 70 3.99 86 3.67 94 3.78
Guyana 104 3.55 111 3.84 40 3.33 88 3.93 118 2.39 109 3.52 108 2.77 91 3.81
Haiti 125 3.11 103 4.12 22 3.72 126 3.06 135 1.94 138 2.72 133 1.91 131 3.28
Honduras 84 3.79 17 5.66 27 3.59 82 4.09 104 2.63 118 3.35 98 3.04 120 3.46
Jamaica 80 3.87 93 4.36 45 3.20 76 4.18 46 3.86 81 3.85 91 3.40 92 3.79
Mexico 61 4.15 33 5.19 29 3.55 62 4.56 58 3.64 59 4.22 73 3.81 97 3.76
Nicaragua 68 4.05 6 5.98 30 3.50 60 4.59 108 2.56 96 3.62 111 2.66 86 3.91
Panama 52 4.28 86 4.60 78 2.37 55 4.71 31 4.37 52 4.36 57 4.29 38 4.57
Paraguay 113 3.45 37 5.06 88 2.22 120 3.25 111 2.49 108 3.53 92 3.37 93 3.78
Peru 51 4.28 13 5.83 9 4.20 51 4.74 101 2.67 77 3.88 89 3.62 80 3.97
Uruguay 60 4.21 44 4.94 41 3.30 67 4.45 107 2.57 89 3.74 50 4.63 36 4.62
Venezuela 137 2.81 120 3.48 86 2.23 133 2.71 127 2.23 121 3.32 87 3.66 138 2.59
Pacific Alliance 4.39 5.51 4.17 4.84 3.08 4.11 4.20 4.08
EU 28 4.63 4.90 1.94 5.39 4.44 5.02 5.39 4.78
ASEAN 3.98 4.37 4.02 4.09 3.30 4.05 3.44 4.05
LAC Average 3.92 4.96 3.35 4.22 2.91 3.80 3.72 3.83
High income OECD Average 4.85 5.04 2.10 5.62 4.76 5.22 5.67 4.99
Developing Asia Average 3.78 4.05 3.43 3.87 3.26 3.92 3.23 4.03
Note: Costa Rica is not included in the calculations for Pacific Alliance.
© 2014 World Economic Forum
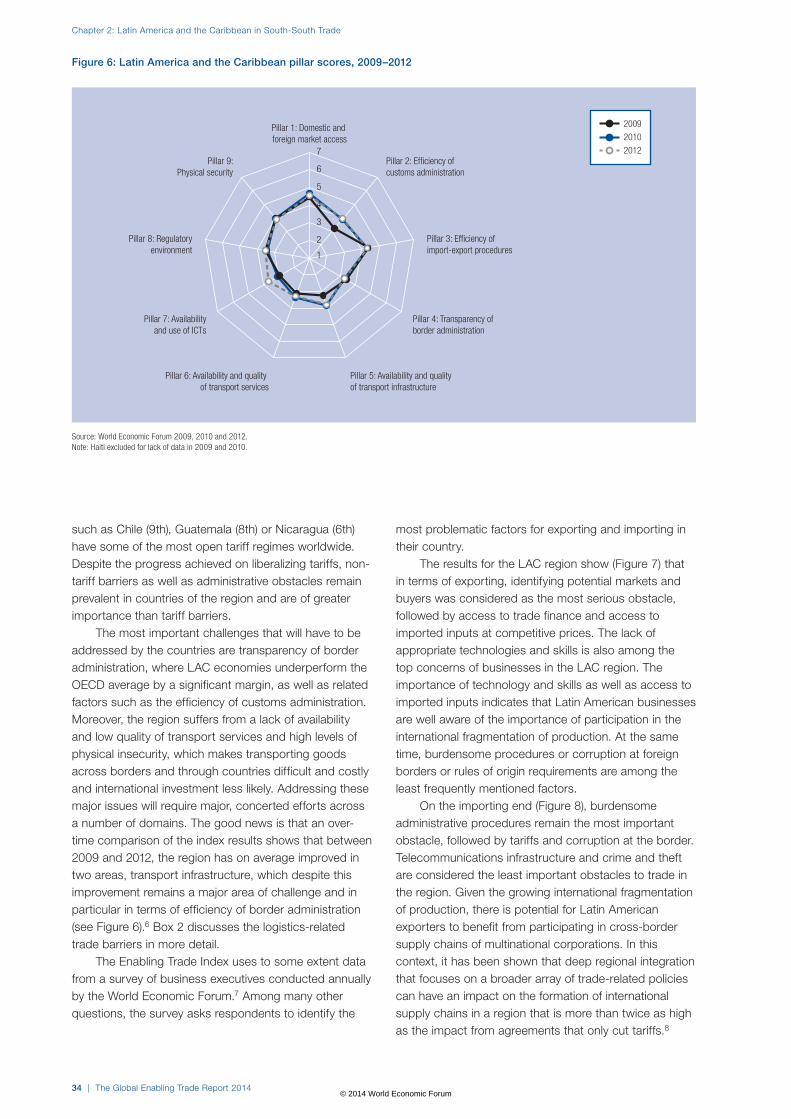
Chapter 2: Latin America and the Caribbean in South-South Trade
34 | The Global Enabling Trade Report 2014
such as Chile (9th), Guatemala (8th) or Nicaragua (6th) have some of the most open tariff regimes worldwide. Despite the progress achieved on liberalizing tariffs, non-tariff barriers as well as administrative obstacles remain prevalent in countries of the region and are of greater importance than tariff barriers.
The most important challenges that will have to be addressed by the countries are transparency of border administration, where LAC economies underperform the OECD average by a significant margin, as well as related factors such as the efficiency of customs administration. Moreover, the region suffers from a lack of availability and low quality of transport services and high levels of physical insecurity, which makes transporting goods across borders and through countries difficult and costly and international investment less likely. Addressing these major issues will require major, concerted efforts across a number of domains. The good news is that an over-time comparison of the index results shows that between 2009 and 2012, the region has on average improved in two areas, transport infrastructure, which despite this improvement remains a major area of challenge and in particular in terms of efficiency of border administration (see Figure 6).6 Box 2 discusses the logistics-related trade barriers in more detail.
The Enabling Trade Index uses to some extent data from a survey of business executives conducted annually by the World Economic Forum.7 Among many other questions, the survey asks respondents to identify the
most problematic factors for exporting and importing in their country.
The results for the LAC region show (Figure 7) that in terms of exporting, identifying potential markets and buyers was considered as the most serious obstacle, followed by access to trade finance and access to imported inputs at competitive prices. The lack of appropriate technologies and skills is also among the top concerns of businesses in the LAC region. The importance of technology and skills as well as access to imported inputs indicates that Latin American businesses are well aware of the importance of participation in the international fragmentation of production. At the same time, burdensome procedures or corruption at foreign borders or rules of origin requirements are among the least frequently mentioned factors.
On the importing end (Figure 8), burdensome administrative procedures remain the most important obstacle, followed by tariffs and corruption at the border. Telecommunications infrastructure and crime and theft are considered the least important obstacles to trade in the region. Given the growing international fragmentation of production, there is potential for Latin American exporters to benefit from participating in cross-border supply chains of multinational corporations. In this context, it has been shown that deep regional integration that focuses on a broader array of trade-related policies can have an impact on the formation of international supply chains in a region that is more than twice as high as the impact from agreements that only cut tariffs.8
2
3
4
5
6
7Pillar 9:
Physical security
Pillar 8: Regulatoryenvironment
Pillar 7: Availabilityand use of ICTs
Pillar 6: Availability and quality of transport services
Pillar 5: Availability and quality of transport infrastructure
Pillar 4: Transparency of border administration
Pillar 3: Efficiency of import-export procedures
Pillar 2: Efficiency of customs administration
Pillar 1: Domestic and foreign market access
1
Figure 6: Latin America and the Caribbean pillar scores, 2009–2012
Source: World Economic Forum 2009, 2010 and 2012.Note: Haiti excluded for lack of data in 2009 and 2010.
2009
2010
2012
© 2014 World Economic Forum
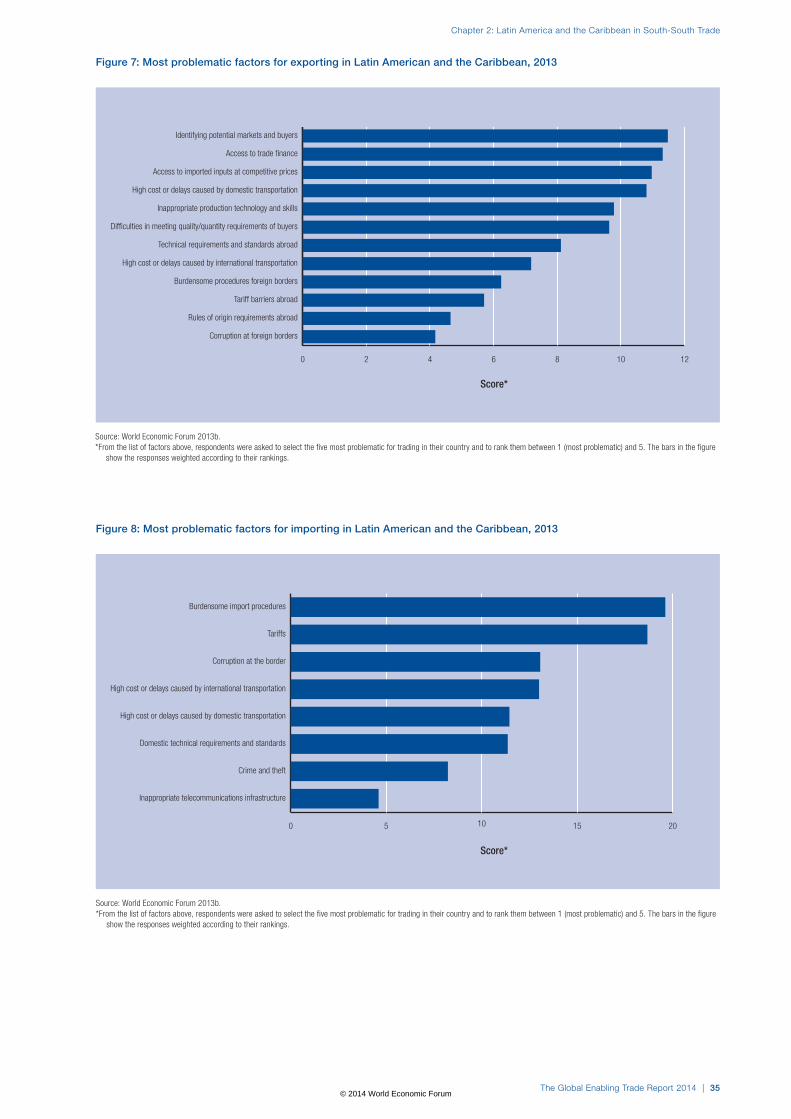
The Global Enabling Trade Report 2014 | 35
Chapter 2: Latin America and the Caribbean in South-South Trade
0 2 4 6 8 10 12
Corruption at foreign borders
Rules of origin requirements abroad
Tariff barriers abroad
Burdensome procedures foreign borders
High cost or delays caused by international transportation
Technical requirements and standards abroad
Difficulties in meeting quality/quantity requirements of buyers
Inappropriate production technology and skills
High cost or delays caused by domestic transportation
Access to imported inputs at competitive prices
Access to trade finance
Identifying potential markets and buyers
0 5 10 15 20
Inappropriate telecommunications infrastructure
Crime and theft
Domestic technical requirements and standards
High cost or delays caused by domestic transportation
High cost or delays caused by international transportation
Corruption at the border
Tariffs
Burdensome import procedures
Figure 7: Most problematic factors for exporting in Latin American and the Caribbean, 2013
Figure 8: Most problematic factors for importing in Latin American and the Caribbean, 2013
Source: World Economic Forum 2013b.*From the list of factors above, respondents were asked to select the five most problematic for trading in their country and to rank them between 1 (most problematic) and 5. The bars in the figure
show the responses weighted according to their rankings.
Source: World Economic Forum 2013b.*From the list of factors above, respondents were asked to select the five most problematic for trading in their country and to rank them between 1 (most problematic) and 5. The bars in the figure
show the responses weighted according to their rankings.
Score*
Score*
© 2014 World Economic Forum
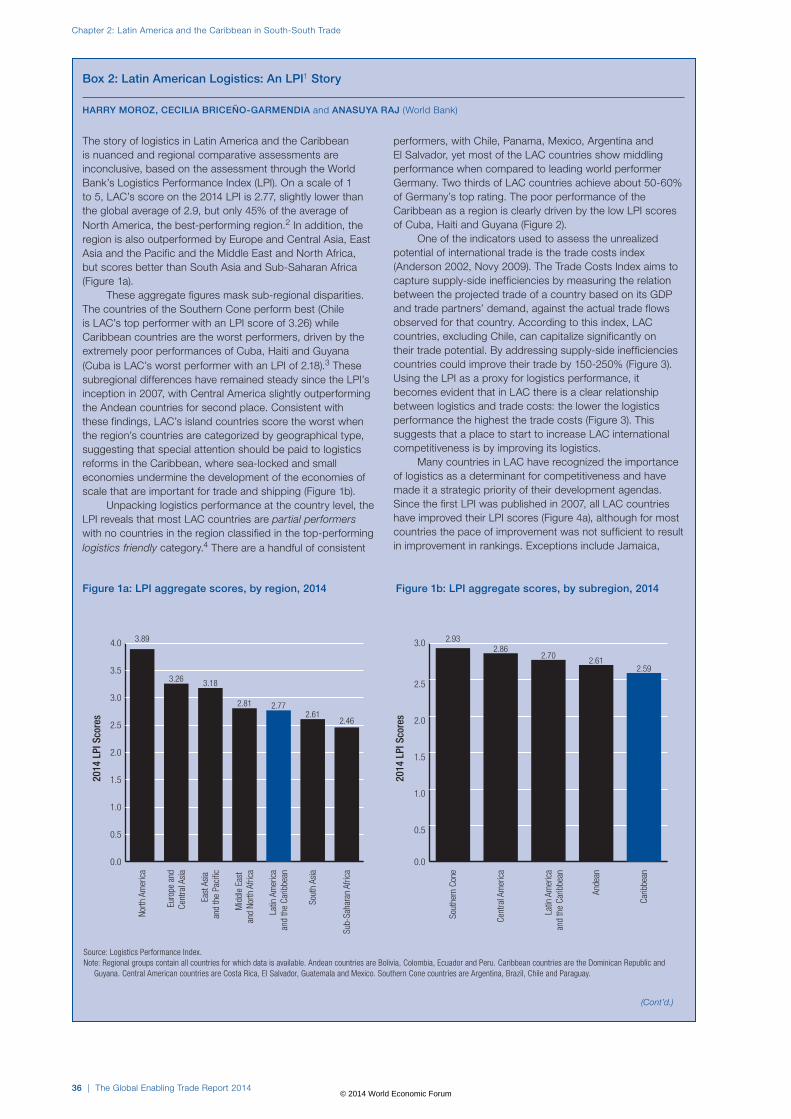
Chapter 2: Latin America and the Caribbean in South-South Trade
36 | The Global Enabling Trade Report 2014
HARRY MOROZ, CECILIA BRICEÑO-GARMENDIA and ANASUYA RAJ (World Bank)
The story of logistics in Latin America and the Caribbean is nuanced and regional comparative assessments are inconclusive, based on the assessment through the World Bank’s Logistics Performance Index (LPI). On a scale of 1 to 5, LAC’s score on the 2014 LPI is 2.77, slightly lower than the global average of 2.9, but only 45% of the average of North America, the best-performing region.2 In addition, the region is also outperformed by Europe and Central Asia, East Asia and the Pacific and the Middle East and North Africa, but scores better than South Asia and Sub-Saharan Africa (Figure 1a).
These aggregate figures mask sub-regional disparities. The countries of the Southern Cone perform best (Chile is LAC’s top performer with an LPI score of 3.26) while Caribbean countries are the worst performers, driven by the extremely poor performances of Cuba, Haiti and Guyana (Cuba is LAC’s worst performer with an LPI of 2.18).3 These subregional differences have remained steady since the LPI’s inception in 2007, with Central America slightly outperforming the Andean countries for second place. Consistent with these findings, LAC’s island countries score the worst when the region’s countries are categorized by geographical type, suggesting that special attention should be paid to logistics reforms in the Caribbean, where sea-locked and small economies undermine the development of the economies of scale that are important for trade and shipping (Figure 1b).
Unpacking logistics performance at the country level, the LPI reveals that most LAC countries are partial performers with no countries in the region classified in the top-performing logistics friendly category.4 There are a handful of consistent
performers, with Chile, Panama, Mexico, Argentina and El Salvador, yet most of the LAC countries show middling performance when compared to leading world performer Germany. Two thirds of LAC countries achieve about 50-60% of Germany’s top rating. The poor performance of the Caribbean as a region is clearly driven by the low LPI scores of Cuba, Haiti and Guyana (Figure 2).
One of the indicators used to assess the unrealized potential of international trade is the trade costs index (Anderson 2002, Novy 2009). The Trade Costs Index aims to capture supply-side inefficiencies by measuring the relation between the projected trade of a country based on its GDP and trade partners’ demand, against the actual trade flows observed for that country. According to this index, LAC countries, excluding Chile, can capitalize significantly on their trade potential. By addressing supply-side inefficiencies countries could improve their trade by 150-250% (Figure 3). Using the LPI as a proxy for logistics performance, it becomes evident that in LAC there is a clear relationship between logistics and trade costs: the lower the logistics performance the highest the trade costs (Figure 3). This suggests that a place to start to increase LAC international competitiveness is by improving its logistics.
Many countries in LAC have recognized the importance of logistics as a determinant for competitiveness and have made it a strategic priority of their development agendas. Since the first LPI was published in 2007, all LAC countries have improved their LPI scores (Figure 4a), although for most countries the pace of improvement was not sufficient to result in improvement in rankings. Exceptions include Jamaica,
(Cont’d.)
Box 2: Latin American Logistics: An LPI1 Story
Figure 1a: LPI aggregate scores, by region, 2014 Figure 1b: LPI aggregate scores, by subregion, 2014
0.0
0.5
1.0
1.5
2.0
2.5
3.0
3.5
4.0
Sub-
Saha
ran
Afric
a
Sout
h As
ia
Latin
Am
eric
aan
d th
e Ca
ribbe
an
Mid
dle
East
an
d No
rth A
frica
East
Asi
a an
d th
e Pa
cific
Euro
pe a
ndCe
ntra
l Asi
a
North
Am
eric
a
3.89
3.26 3.18
2.81 2.772.61
2.46
0.0
0.5
1.0
1.5
2.0
2.5
3.0Ca
ribbe
an
Ande
an
Latin
Am
eric
aan
d th
e Ca
ribbe
an
Cent
ral A
mer
ica
Sout
hern
Con
e
2.932.86
2.702.61
2.59
2014
LPI
Sco
res
2014
LPI
Sco
res
Source: Logistics Performance Index.Note: Regional groups contain all countries for which data is available. Andean countries are Bolivia, Colombia, Ecuador and Peru. Caribbean countries are the Dominican Republic and
Guyana. Central American countries are Costa Rica, El Salvador, Guatemala and Mexico. Southern Cone countries are Argentina, Brazil, Chile and Paraguay.
© 2014 World Economic Forum

The Global Enabling Trade Report 2014 | 37
Chapter 2: Latin America and the Caribbean in South-South Trade
Box 2: Latin American Logistics: An LPI Story (cont’d.)
(Cont’d.)
Figure 2: LPI scores of Latin American and the Caribbean countries, 2014
0
10
20
30
40
50
60
70
80
Chile
Pana
ma
Mex
ico
Arge
ntin
a
El S
alva
dor
Braz
il
Baha
mas
Dom
inic
an R
epub
lic
Jam
aica
Peru
Vene
zuel
a
Guat
emal
a
Para
guay
Ecua
dor
Cost
a Ri
ca
Urug
uay
Nica
ragu
a
Colo
mbi
a
Hond
uras
Boliv
ia
Guya
na
Haiti
Cuba
Figure 3: Trade costs and logistics performance in Latin American and the Caribbean, 2011
2.0 2.5 3.0 3.5
100
150
200
250
300
350
Perc
enta
ge o
f 201
4 LP
I top
per
form
er G
erm
any
Ad v
alor
em tr
ade
cost
s (%
)
2012 LPI
LogisticsUnfriendly
Partial Performers ConsistentPerformers
Caribbean
Southern Cone
Central America
Andean
Source: Logistics Performance Index and Arvis and others, 2013. Notes: The Bahamas, which has trade costs more than twice as high as the LAC average, is excluded from the Caribbean. Trade costs are average trade costs by country for 2011 and
LPI is a country’s 2012 LPI score. The white lines represent the linear fit (solid line) with 95% confidence intervals (dashed lines).
GUY
COLECU
PER
ARGBRA
MEX
CHL
CRI GTMSLV
BOLDOMPRY
© 2014 World Economic Forum
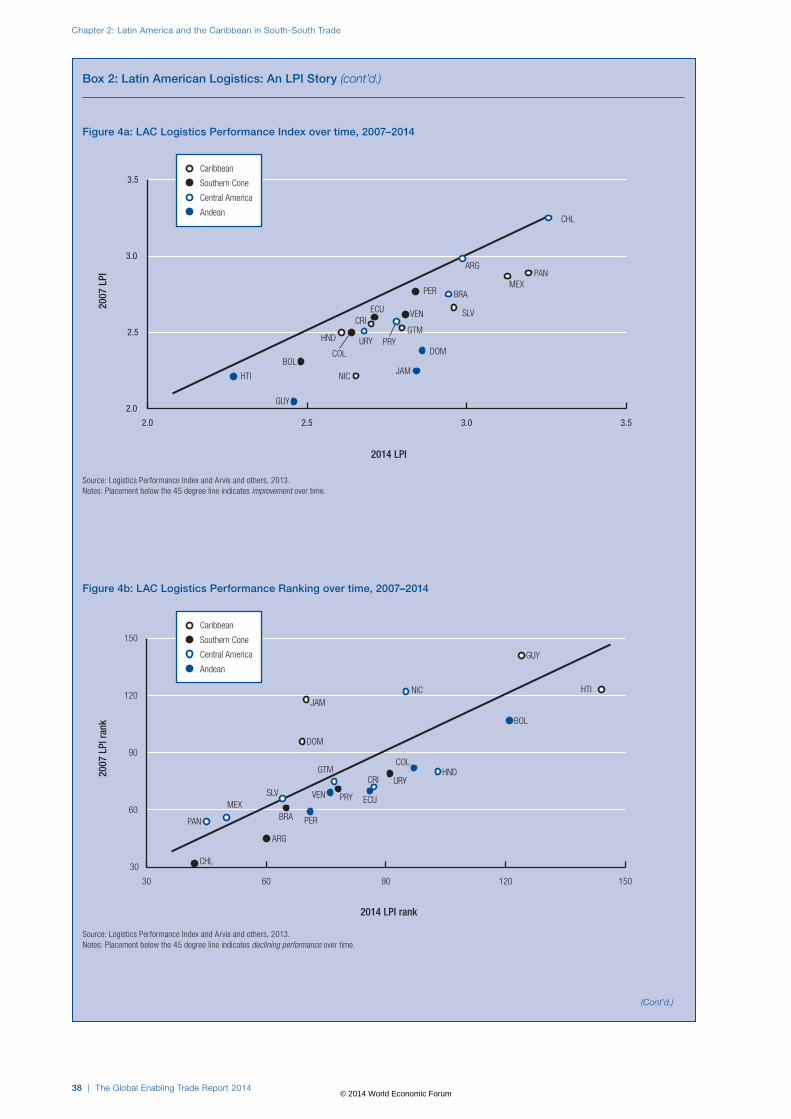
Chapter 2: Latin America and the Caribbean in South-South Trade
38 | The Global Enabling Trade Report 2014
Box 2: Latin American Logistics: An LPI Story (cont’d.)
(Cont’d.)
Figure 4a: LAC Logistics Performance Index over time, 2007–2014
2.0 2.5 3.0 3.5
2.0
2.5
3.0
3.5
Figure 4b: LAC Logistics Performance Ranking over time, 2007–2014
30 60 90 120 150
30
60
90
120
150
2007
LPI
20
07 L
PI ra
nk
2014 LPI rank
2014 LPI
Caribbean
Southern Cone
Central America
Andean
Caribbean
Southern Cone
Central America
Andean
GUY
ECUCRI
URYCOL
HND
CHL
PANMEX
ARG
PER BRA
SLVVEN
GTMPRY
DOM
JAMNIC
BOL
HTI
GUY
HTI
BOL
NICJAM
DOM
COLHND
URYCRI
ECU
GTM
VEN PRY
PAN
MEXSLV
BRA PER
ARG
CHL
Source: Logistics Performance Index and Arvis and others, 2013. Notes: Placement below the 45 degree line indicates improvement over time.
Source: Logistics Performance Index and Arvis and others, 2013. Notes: Placement below the 45 degree line indicates declining performance over time.
© 2014 World Economic Forum

The Global Enabling Trade Report 2014 | 39
Chapter 2: Latin America and the Caribbean in South-South Trade
which has improved the most in the region, moving up 48 places in the world rankings to 70th position (out of 160), as well as Dominican Republic (27 positions), Nicaragua (27 positions) and Guyana (17 positions). In contrast, Haiti and Honduras both experienced declines in their rankings of more than 20 places (Figure 4b).
The key question in this respect is on which dimensions of logistics should the Latin American continent focus. While this question merits a closer look at each country individually, comparing aggregate values of each LPI component against the aggregate average LPI for LAC countries (reported at 2.77) can help identify bottlenecks. Physical infrastructure stands out as the most serious impediment to logistics performance, with a component score 8% worse than the average, followed by customs and border issues (6% worse). The overall LAC score for ability to track and trace consignments is the component that sticks out positively, with a component score 12% higher than the average.
The need to improve infrastructure is consistent with the findings of the second part of the LPI survey, which asks logistics professionals about the logistics environments in which they work. The percentage of respondents rating the quality of various infrastructure types as “high” or “very high” was the lowest or second-lowest in Latin America and the Caribbean across every mode and type. The situation is particularly dire for transport infrastructure: only 7% of respondents gave a “high” or “very high” rating to LAC road infrastructure and only 1% to rail infrastructure (World Bank, 2014).
Notes1 The World Bank’s Logistics Performance Index is a tool designed
to assess the performance of a country’s logistics services and infrastructure. The index, ranging from 1 for weak performers to 5 for the strongest performers, is based on a survey of nearly 1,000 logistics professionals worldwide about different components of the supply chains of their main overseas’ markets. For more information, please refer to http://lpi.worldbank.org/.
2 Scores are standardized according to the formula:
100 x (LPI – 1)
LPIHighest – 1
3 Cuba’s position on the rankings may change with the $1 billion project for the Port of Mariel renovation. This renovation would allow Mariel to handle Post-Panama ships. Using this project as a starting point, Cuba hopes to develop into a hub of regional trade in partnership with Brazil, the main financier of the project.
4 LPI classifies countries as (1) logistics unfriendly countries with severe logistics constraints (representing the bottom quintile of global LPI scores), (2) partial performers with LPI scores in the third and fourth quintile, consistent performers in the second-highest quintile, and (3) logistics-friendly countries in the top LPI quintile with high-performing logistics services and infrastructure.
ReferencesAndean Development Corportation. 2013. “Latin American Economic
Outlook 2014: Logistics and Competitiveness for Development.” Caracas: Andean Development Corporation.
Anderson, James E. and Eric van Wincoop. 2004. “Trade Costs”. Journal of Economic Literature 42(3):691-751.
Arvis, Jean-Francois, Yann Duval, Ben Shapherd, and Chorthip Utoktham. 2013. “Trade Costs in the Developing World.” Policy Research Working Paper 6309. Washington, D.C: World Bank.
Morales Sarriera, Javier; Gonzalo Araya, Tomas Serebrisky, Cecilia Briceño-Garmendia, and Jordan Schwartz. 2013. “Benchmarking Container Port Technical Efficiency in Latin America and the Caribbean: A Stochastic Frontier Analysis.” Policy Research Working paper 6680. Washington D.C.: World Bank.
Novy, Dennis. 2013. “Gravity Redux: Measuring International Trade Costs with Panel Data.” Economic Inquiry 51(1):101-121.
World Bank. Forthcoming. “Connecting to Compete 2014: Trade Logistics in the Global Economy: The Logistics Performance Index and Its Indicators.” Washington, D.C.
———. “Latin American and the Caribbean as Tailwinds Recede, Semiannual Report, Office of the Regional Chief Economist.” April 2013.
Box 2: Latin American Logistics: An LPI Story (cont’d.)
In this context, deep integration efforts in the region, such as the recent Pacific Alliance initiative (Colombia, Chile, Mexico, Peru and, more recently, Costa Rica; Panama acts as observer) can help countries promote regional, South-South trade thereby contributing to diversifying the trade performance of countries in both geographical and product terms. Box 3 discusses the challenges faced by the Pacific Alliance as identified by the ETI.
CONCLUSIONInternational trade is a key ingredient for growth and development in Latin America and the Caribbean. During the last three decades, the region has come a long way in reforming its trade regimes, and some of the benefits of the reforms have unmistakably materialized. Import and export expansion has consistently exceeded GDP growth, and international trade has functioned as an engine of growth.
However, in the aftermath of the global financial crisis the region is facing a new reality. On one hand,
trade growth is trailing GDP growth, which implies that in order to take advantage of international trade flows to promote development, the region needs to tackle a new generation of trade-enhancing policies. On the other hand, South-South trade has grown exponentially in relative terms, and securing market shares in the emerging economies, including within the intra-regional market, has become an increasing important component of any trade strategy.
In order to fully realize the growth potential of international trade the countries of the region are urged to take bold steps towards trade diversification, both in terms of products and destinations. The region should indeed be wary of the risks of excessive export concentration. While South-South trade with Asia has made a significant contribution to LAC’s trade performance in the last decade, it has not helped to reduce the region’s dependence on the exports of primary goods. Likewise, the intra-regional markets, in which supply chains are more prevalent and sophisticated, can play an important role in that regard.
© 2014 World Economic Forum

Chapter 2: Latin America and the Caribbean in South-South Trade
40 | The Global Enabling Trade Report 2014
Figure 1 compares the average performance of the Pacific Alliance with that of different extra-regional reference groups: the EU 28 and ASEAN. Although the ETI cannot show how trade is enabled within the region, it gives a good indication of the main obstacles that exporters and importers are facing. It shows that, first of all, the Pacific Alliance economies, on average, benefit from a higher level of domestic and foreign market access than the other regional groupings. Countries also perform relatively well in terms of efficiency and transparency of border administration, where their institutions perform better than in ASEAN. The ETI also shows solid performance on the use of ICTs. The performance is in line with the ASEAN average on the availability and quality of transport services, and the operating environment. Finally,
major room for improvements remains with respect to the availability and quality of transport infrastructure.
The most problematic factors for exporting and importing for the Pacific Alliance show that exports are constrained by difficulties in identifying potential markets and buyers and high costs or delays caused by domestic transportation, indicating a need for further investment in transport infrastructure and the development of transport services in the region. When importing, businesses face burdensome import procedures and tariffs as well as delays caused by international transportation.
These results show that investment in infrastructure, better connectivity and more developed transport services are among the most pressing agenda points for enabling trade in the Pacific Alliance countries.
Box 3: The Role of Regional Integration in Developing Trade: Pacific Alliance
Figure 1: Comparing Pacific Alliance, EU and ASEAN pillar scores, 2014
Note: Costa Rica is not included in the calculations for Pacific Alliance.
2
1
3
4
5
6
7
Pillar 7: Operating environment
Pillar 6: Availability and use of ICTs
Pillar 5: Availability and quality of transport services
Pillar 4: Availability and quality of transport infrastructure
Pillar 3: Efficiency and transparency of border administration
Pillar 2: Foreign market access
Pillar 1: Domestic market access
ASEAN
EU 28
Pacific Alliance
Figure 2: Most problematic factors for exporting in the Pacific Alliance, 2013
0 3 6 9 12 15
Corruption at foreign borders
Rules of origin requirements abroad
High cost or delays caused by international transportation
Burdensome procedures foreign borders
Tariff barriers abroad
Access to imported inputs at competitive prices
Difficulties in meeting quality/quantity requirements of buyers
Inappropriate production technology and skills
Technical requirements and standards abroad
Access to trade finance
High cost or delays caused by domestic transportation
Identifying potential markets and buyers
Score*
Source: World Economic Forum 2013b.Note: Costa Rica is not included in the calculations for Pacific Alliance.*From the list of factors above, respondents were asked to select the five most problematic for trading in their country and to rank them between 1 (most problematic) and 5.
The bars in the figure show the responses weighted according to their rankings.
(Cont’d.)
© 2014 World Economic Forum
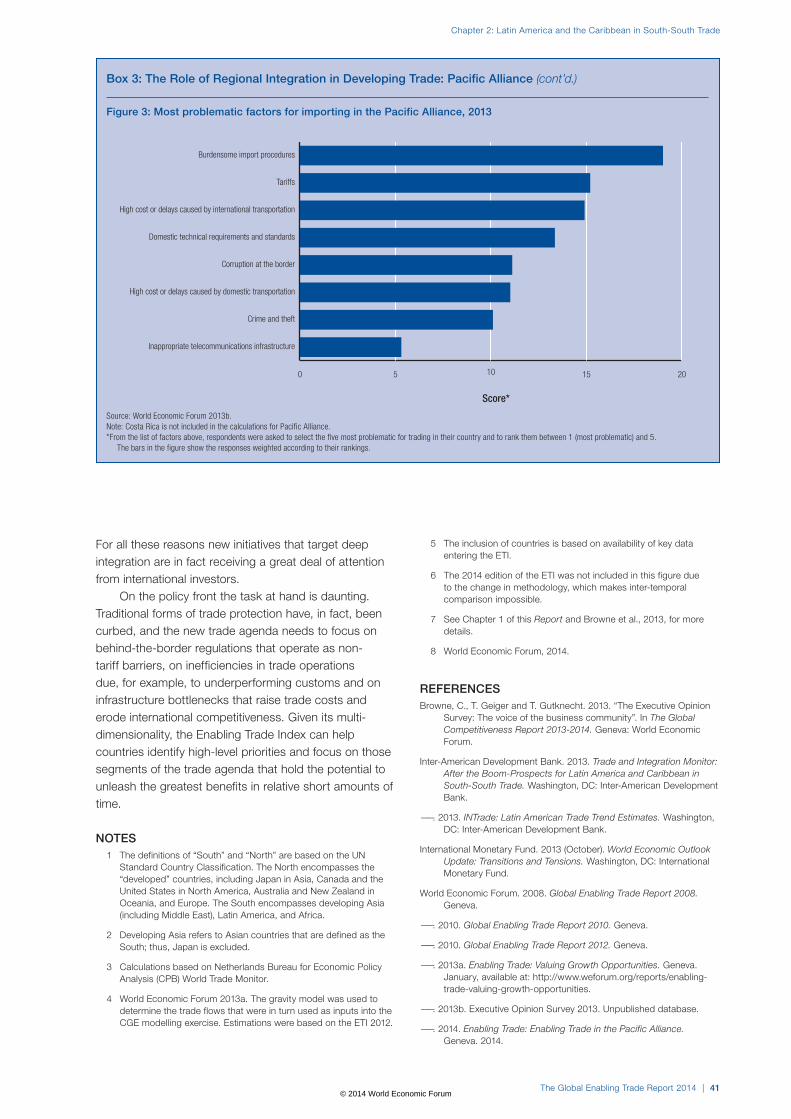
The Global Enabling Trade Report 2014 | 41
Chapter 2: Latin America and the Caribbean in South-South Trade
Box 3: The Role of Regional Integration in Developing Trade: Pacific Alliance (cont’d.)
Figure 3: Most problematic factors for importing in the Pacific Alliance, 2013
Score*
Source: World Economic Forum 2013b.Note: Costa Rica is not included in the calculations for Pacific Alliance.*From the list of factors above, respondents were asked to select the five most problematic for trading in their country and to rank them between 1 (most problematic) and 5.
The bars in the figure show the responses weighted according to their rankings.
0 5 10 15 20
Inappropriate telecommunications infrastructure
Crime and theft
High cost or delays caused by domestic transportation
Corruption at the border
Domestic technical requirements and standards
High cost or delays caused by international transportation
Tariffs
Burdensome import procedures
For all these reasons new initiatives that target deep integration are in fact receiving a great deal of attention from international investors.
On the policy front the task at hand is daunting. Traditional forms of trade protection have, in fact, been curbed, and the new trade agenda needs to focus on behind-the-border regulations that operate as non-tariff barriers, on inefficiencies in trade operations due, for example, to underperforming customs and on infrastructure bottlenecks that raise trade costs and erode international competitiveness. Given its multi-dimensionality, the Enabling Trade Index can help countries identify high-level priorities and focus on those segments of the trade agenda that hold the potential to unleash the greatest benefits in relative short amounts of time.
NOTES1 The definitions of “South” and “North” are based on the UN
Standard Country Classification. The North encompasses the “developed” countries, including Japan in Asia, Canada and the United States in North America, Australia and New Zealand in Oceania, and Europe. The South encompasses developing Asia (including Middle East), Latin America, and Africa.
2 Developing Asia refers to Asian countries that are defined as the South; thus, Japan is excluded.
3 Calculations based on Netherlands Bureau for Economic Policy Analysis (CPB) World Trade Monitor.
4 World Economic Forum 2013a. The gravity model was used to determine the trade flows that were in turn used as inputs into the CGE modelling exercise. Estimations were based on the ETI 2012.
5 The inclusion of countries is based on availability of key data entering the ETI.
6 The 2014 edition of the ETI was not included in this figure due to the change in methodology, which makes inter-temporal comparison impossible.
7 See Chapter 1 of this Report and Browne et al., 2013, for more details.
8 World Economic Forum, 2014.
REFERENCESBrowne, C., T. Geiger and T. Gutknecht. 2013. “The Executive Opinion
Survey: The voice of the business community”. In The Global Competitiveness Report 2013-2014. Geneva: World Economic Forum.
Inter-American Development Bank. 2013. Trade and Integration Monitor: After the Boom-Prospects for Latin America and Caribbean in South-South Trade. Washington, DC: Inter-American Development Bank.
——. 2013. INTrade: Latin American Trade Trend Estimates. Washington, DC: Inter-American Development Bank.
International Monetary Fund. 2013 (October). World Economic Outlook Update: Transitions and Tensions. Washington, DC: International Monetary Fund.
World Economic Forum. 2008. Global Enabling Trade Report 2008. Geneva.
——. 2010. Global Enabling Trade Report 2010. Geneva.
——. 2010. Global Enabling Trade Report 2012. Geneva.
——. 2013a. Enabling Trade: Valuing Growth Opportunities. Geneva. January, available at: http://www.weforum.org/reports/enabling-trade-valuing-growth-opportunities.
——. 2013b. Executive Opinion Survey 2013. Unpublished database.
——. 2014. Enabling Trade: Enabling Trade in the Pacific Alliance. Geneva. 2014.
© 2014 World Economic Forum

© 2014 World Economic Forum

Country/Economy Profiles
© 2014 World Economic Forum

© 2014 World Economic Forum

The Global Enabling Trade Report 2014 | 45
How to Read the Country/Economy Profiles
The Country/Economy Profiles section presents a two-page profile of each of the 138 economies covered by The Global Enabling Trade Report 2014. Each profile summarizes an economy’s performance on the various dimensions of the Enabling Trade Index (ETI) and provides additional trade performance indicators.
PAGE 1
Key indicators
The first section (on the upper left-hand side of the page) presents a selection of key overall indicators:
• Data for population (millions), gross domestic product (GDP, current US$ billions) and GDP per capita (current US$) are from the International Monetary Fund (IMF)’s World Economic Outlook Online database (October 2013 edition).
• Trade openness (% of GDP) data is from the World Bank’s World Development Indicators database (retrieved January 28, 2014) and corresponds to the sum of merchandise imports and exports as a percentage of the economy’s GDP.
• Imports and exports share (%) in world trade total as well as total exports and imports (US$ billions) are based on merchandise trade data from the World Trade Organization (WTO)’s Statistical Database, Total Merchandise Trade time series (retrieved November 8, 2013).
Value chain indicators
The upper right-hand side of the page provides an overview of an economy’s presence in the global value chain. It follows the Broad Economic Categories (BEC) classification and the data is sourced from the World Bank’s World Integrated Trade Solution (WITS) database (retrieved January 24, 2014). Data has been grouped to mirror the System of National Accounts (SNA)1:
• Capital Goods corresponds to BEC 41 (Capital goods except transport equipment) and 521 (Transport equipment for industrial use).
• Intermediate Goods is the sum of:
– Food and Beverages for industrial use, which corresponds to BEC 111 (Food and beverages, primary, mainly for industry) and 121 (Food and beverages, processed, mainly for industry).
– Industrial supplies (primary and processed), which corresponds to BEC 21 (Industrial supplies not elsewhere specified, primary) and
22 (Industrial supplies not elsewhere specified, processed).
– Parts and accessories, which corresponds to BEC 42 (Parts and accessories of capital goods, except transport equipment) and 53 (Parts and accessories of transport equipment).
– Fuels and lubricants, which corresponds to BEC 31 (Fuels and lubricants, primary) and 322 (Fuels and lubricants, processed, other than motor spirit).
• Consumer Goods is the sum of:
– Food and beverages for consumer use, which corresponds to BEC 112 (Food and beverages, primary, mainly for household consumption) and 122 (Food and beverages, processed, mainly for household consumption).
– Transport equipment and consumer goods, which corresponds to BEC 522 (Transport equipment for non-industrial use), 61 (Consumer goods not elsewhere specified, durable), 62 (Consumer goods not elsewhere specified, semi-durable), and 63 (Consumer goods not elsewhere specified, non-durable).
Country/Economy Profiles
50 | The Global Enabling Trade Report 2014
* From the list of factors above, respondents were asked to select the five most problematic for trading in their country and to rank them between 1 (most problematic) and 5. The bars in the figure show the responses weighted according to their rankings.
For methodology, indicator descriptions and sources, and for a list of multiple best-performing economies, see page 45.
0 105 15 20 25 30
0 5 10 15 20 25 30
2
3
4
5
6
7
Operating environment
Availability & use of ICTs
Availability & quality of transport services
Availability & quality of transport infrastructure
Efficiency & transparency of border administration
Foreign market access
Domestic market access
1
Enabling Trade Index 2014 Rank Score (out of 138) (1–7)
Enabling Trade Index 2014 .................... 69 ..... 4.0
Subindex A: Market access (25%) .................... 17 .......4.4Pillar 1: Domestic market access ..................................... 11 ........ 5.9Pillar 2: Foreign market access ........................................53 ........ 3.0
Subindex B: Border administration (25%) ........70 .......4.4Pillar 3: Efficiency & transparencyof border administration ...................................................70 .........4.4
Subindex C: Infrastructure (25%) ......................90 .......3.4Pillar 4: Availability & quality of transport infrastructure . 116 .........2.4Pillar 5: Availability & quality of transport services ........... 74 ........ 3.9Pillar 6: Availability & use of ICTs ..................................... 74 ........ 3.8
Subindex D: Operating environment (25%) ......85 .......3.9Pillar 7: Operating environment ........................................85 ........ 3.9
Key indicators, 2012 Rank/138
Population (millions) .............................................................. 3.2 ..........115GDP (US$ billions) ...............................................................12.6 ..........112GDP per capita (US$) .....................................................3,870.3 ........... 86
Merchandise tradeTrade openness (imports+exports)/GDP ............................ 52.2 ........... 97Share of world trade (%) ..................................................... 0.02 ......... 120Total Exports (US$ billions) ....................................................2.0 ......... 120Total Imports (US$ billions) ................................................... 4.9 ..........116
Value chain indicators, 2012Share (%) of merchandise trade Exports Imports
Capital goods ..................................................................... 2.0 ..........8.5
Intermediate goods .......................................................... 62.2 ........ 47.0Food and beverages (industrial) ..................................... 0.2 .......... 3.7Industrial supplies (primary and processed) ................ 34.5 ........ 31.2Parts and accessories .....................................................1.4 .......... 4.5Fuels and lubricants ..................................................... 26.2 ...........7.6
Consumer goods .............................................................. 35.5 ........ 28.1Food and beverages (consumer) .................................... 3.9 ........ 10.2Transport equipment and consumer goods ..................31.6 .........17.9
Passenger motor cars ........................................................ 0.0 .......... 4.3
Others .................................................................................. 0.2 ........ 12.0
The most problematic factors for trade, 2013Most problematic factors for exporting Score*
Identifying potential markets and buyers .............................................................. 26.4Access to trade finance ........................................................................................ 22.3Technical requirements and standards abroad .......................................................9.7Rules of origin requirements abroad ....................................................................... 8.8Tariff barriers abroad .............................................................................................. 8.6Access to imported inputs at competitive prices ................................................... 6.5Difficulties in meeting quality/quantity requirements of buyers ............................... 5.9High cost or delays caused by domestic transportation ........................................ 5.4Inappropriate production technology and skills .......................................................4.7Burdensome procedures at foreign borders .......................................................... 0.8Corruption at foreign borders ................................................................................. 0.5High cost or delays caused by international transportation ................................... 0.4
Most problematic factors for importing Score*
Corruption at the border ........................................................................................27.7Tariffs .................................................................................................................... 23.2Burdensome import procedures .......................................................................... 22.3Crime and theft ........................................................................................................9.1High cost or delays caused by domestic transportation ........................................ 8.4Domestic technical requirements and standards ................................................... 5.4Inappropriate telecommunications infrastructure ....................................................3.1High cost or delays caused by international transportation ....................................0.7
Albania
Sources: International Monetary Fund, World Bank, World Trade Organization, United Nations COMTRADE
Albania
Central and Eastern Europe
© 2014 World Economic Forum

Country/Economy Profiles
46 | The Global Enabling Trade Report 2014
• Passenger motor cars corresponds to BEC 51.
• Others includes:
– Motor spirit, which corresponds to BEC 321.
– Goods not elsewhere classified, which corresponds to BEC 7.
Given their vast use by both industries and households (as capital, intermediate and consumer goods), passenger motor cars and motor spirit have been listed separately.
Enabling Trade Index 2014
The mid-section summarizes the economy’s performance on the main components of the ETI 2014. The two columns show, respectively, its rank among the sample of 138 economies and its score on a 1-to-7 scale, where 7 corresponds to the best possible outcome.
The blue line on the radar chart plots the economy’s score on each of the seven pillars and compares it to the average scores of up to two relevant groups of economies. The black dashed comparator line plots the average score of the economy’s region or group, as defined by the IMF: Advanced Economies; Central America and Caribbean; Central and Eastern Europe; Commonwealth of Independent States; Developing Asia, Middle-East, North Africa and Pakistan; South America; and Sub-Saharan Africa. Some profiles include a light blue dotted comparator line, which depicts the average score of Least Developed Countries (LDCs), Land-Locked Developing Countries (LLDCs), Land-Locked, and Least Developed Countries.2
The most problematic factors for trade
The charts at the bottom of the page summarize those factors seen by business executives as the most problematic for, respectively, exporting from and importing to their economy. The bars show the responses weighted according to their rankings. The information is drawn from the 2013 edition of the World Economic Forum’s Executive Opinion Survey (the Survey). Respondents were asked to select the five most problematic factors from a list of twelve and eight, respectively for exporting and importing. Respondents were further asked to rank these from 1 (most problematic) to 5. A score was assigned for each answer based on the rank, from 5 points for the first-ranked factor to 1 point for the fifth-ranked. For example, if high cost or delays caused by international transportation was cited by a respondent as the most problematic factor for exporting (i.e. rank of 1), this answer would be assigned 5 points; if it was cited as the fifth most problematic factor, the answer would be assigned 1 point. For a given economy, the reported score earned by each factor corresponds to the total points earned by that factor across all responses from this economy divided by the total points earned by all factors. For Bosnia and Herzegovina, Jordan, Oman and the United Arab Emirates, the results from the 2012 edition of the Survey were used. Note that corruption at the border was added to the list of problematic factors for exporting in 2013.
For a more detailed explanation of the Survey methodology and data treatment, refer to Chapter 1.3 of the The Global Competitiveness Report 2013-2014 (available at www.weforum.org/gcr).
PAGE 2
The Enabling Trade Index 2014 in detail
This section presents an economy’s performance (rank and score) on each individual indicator composing the ETI. The indicators are organized by pillar. Units or index ranges are indicated next to the indicator’s name. Please refer to Appendix A of this Report for the composition and computation of the ETI and to Appendix B for detailed descriptions and sources for all indicators composing the ETI. The rankings by indicator can be found online at www.weforum.org/getr.
Next to the rank, a coloured square indicates whether the indicator constitutes an advantage (a blue square) or a disadvantage (a grey square) for the country. In order to identify an indicator as an advantage or disadvantage, the following rules apply:
• For the top 10 economies in the overall ETI, any indicators on which the economy is ranked 10th or higher are considered to be competitive advantages. Any indicators ranked below 10 are considered to be competitive disadvantages.
• For those economies ranked from 11th through 50th on the overall ETI, any indicators with a rank higher than the economy’s overall rank are considered to be competitive advantages. Any indicators ranked equal to or lower than the economy’s overall rank are competitive disadvantages.
Country/Economy Profiles
The Global Enabling Trade Report 2014 | 51
* Indicator derived from the World Economic Forum’s Executive Opinion Survey and measured on a 1-to-7 scale, where 7 indicates best outcome.
The Enabling Trade Index 2014 in detail ■ Competitive Advantage ■ Competitive Disadvantage
For methodology, indicator descriptions and sources, and for a list of multiple best-performing economies, see page 45. Albania
INDICATOR, UNITS RANK/138 VALUE BEST PERFORMER VALUE
Pillar 1: Domestic market access (1–7) ........................................................... 11 ...........................5.9 Multiple economies (2) ................................ 7.0 1.01 Tariff rate (%)............................................................................................. 40 .......... ■ ..........2.8 Multiple economies (2) .............................0.0 1.02 Complexity of tariffs index (1–7) ................................................................ 77 .......... ■ ..........5.6 Multiple economies (2) .............................7.0
Tariff dispersion (standard deviation) ......................................................... 12 .......... ■ ..........5.2 Multiple economies (2) .............................0.0Tariff peaks (% of tariff lines) ................................................................... 133 .......... ■ ........12.0 Multiple economies (24) ...........................0.0Specific tariffs (% of tariff lines) ................................................................... 1 .......... ■ ..........0.0 Multiple economies (54) ...........................0.0Number of distinct tariffs ........................................................................... 25 .......... ■ .............6 Multiple economies (2) ................................1
1.03 Share of duty-free imports (%) .................................................................. 14 .......... ■ ........85.9 Multiple economies (2) .........................100.0
Pillar 2: Foreign market access (1–7) .............................................................. 53 ...........................3.0 Cambodia ..................................................... 5.3 2.01 Tariffs faced (%) ...................................................................................... 123 .......... ■ ..........5.8 Chile .........................................................3.5 2.02 Index of margin of preference in destination mkts (0–100) ........................ 19 .......... ■ ........56.9 Mauritius ................................................97.1
Pillar 3: Efficiency and transparency of border administration (1–7) .............. 70 ...........................4.4 Singapore..................................................... 6.3 3.01 Customs services index (0–1) ................................................................... 38 .......... ■ ........0.69 Singapore...............................................0.97 3.02 Efficiency of the clearance process (1–5) .................................................. 96 .......... ■ ..........2.4 Norway ....................................................4.2 3.03 No. of days to import ............................................................................... 74 .......... ■ ...........18 Singapore....................................................4 3.04 No. of documents to import ..................................................................... 82 .......... ■ .............8 Multiple economies (2) ................................2 3.05 Cost to import (US$ per container) ........................................................... 18 .......... ■ .........730 Singapore................................................440 3.06 No. of days to export................................................................................ 81 .......... ■ ...........19 Multiple economies (5) ................................6 3.07 No. of documents to export ..................................................................... 85 .......... ■ .............7 Multiple economies (2) ................................2 3.08 Cost to export (US$ per container) ........................................................... 24 .......... ■ .........745 Malaysia ..................................................450 3.09 Irregular payments in exports and imports*............................................... 85 .......... ■ ..........3.2 New Zealand ............................................6.6 3.10 Time predictability of import procedures* .................................................. 91 .......... ■ ..........3.5 Finland .....................................................6.0 3.11 Customs transparency index (0–1) ........................................................... 56 .......... ■ ........0.83 Multiple economies (35) .........................1.00
Pillar 4: Availability and quality of transport infrastructure (1-7) ................... 116 ...........................2.4 United Arab Emirates ................................... 6.5 4.01 Available int’l airline seat km/week, millions ............................................ 111 .......... ■ ........24.2 United States ..................................11,481.7 4.02 Quality of air transport infrastructure* ........................................................ 72 .......... ■ ..........4.3 Singapore.................................................6.8 4.03 Quality of railroad infrastructure* ............................................................. 107 .......... ■ ..........1.2 Japan .......................................................6.7 4.04 Liner Shipping Connectivity Index (0–157.1) ........................................... 101 .......... ■ ..........4.4 China ...................................................157.5 4.05 Quality of port infrastructure* .................................................................. 100 .......... ■ ..........3.5 Netherlands ..............................................6.8 4.06 Paved roads (% of total) ........................................................................... 79 .......... ■ ........39.0 Multiple economies (18) .......................100.0 4.07 Quality of roads* ....................................................................................... 68 .......... ■ ..........3.9 United Arab Emirates ...............................6.6
Pillar 5: Availability and quality of transport services (1–7) ............................ 74 ...........................3.9 Singapore..................................................... 5.7 5.01 Ease and affordability of shipment (1–5).................................................... 77 .......... ■ ..........2.8 Luxembourg .............................................3.8 5.02 Logistics competence (1–5) ...................................................................... 90 .......... ■ ..........2.6 Norway ....................................................4.2 5.03 Tracking and tracing ability (1–5) ............................................................... 96 .......... ■ ..........2.6 Germany ..................................................4.2 5.04 Timeliness of shipments in reaching destination (1–5) ............................... 46 .......... ■ ..........3.6 Luxembourg .............................................4.7 5.05 Postal services efficiency* ......................................................................... 62 .......... ■ ..........4.6 Japan .......................................................6.8 5.06 Efficiency of transport mode change* ....................................................... 99 .......... ■ ..........3.5 Hong Kong SAR ......................................6.4
Pillar 6: Availability and use of ICTs (1–7) ........................................................ 74 ...........................3.8 Sweden ........................................................ 6.5 6.01 Mobile phone subscriptions/100 pop. ...................................................... 66 .......... ■ ......110.7 Hong Kong SAR ..................................229.2 6.02 Individuals using Internet (%) .................................................................... 55 .......... ■ ........54.7 Iceland ...................................................96.2 6.03 Fixed broadband Internet subscriptions/100 pop. .................................... 73 .......... ■ ..........5.1 Switzerland ............................................39.9 6.04 Active mobile broadband Internet subscriptions/100 pop. ........................ 68 .......... ■ ........18.8 Singapore.............................................124.5 6.05 ICT use for business-to-business transactions* ...................................... 126 .......... ■ ..........3.8 Finland .....................................................6.2 6.06 Internet use for business-to-consumer transactions* .............................. 123 .......... ■ ..........3.4 United Kingdom .......................................6.3 6.07 Government Online Service Index (0–1) .................................................... 86 .......... ■ ........0.42 Multiple economies (3) ...........................1.00
Pillar 7: Operating environment (1–7) .............................................................. 85 ...........................3.9 Hong Kong SAR ............................................ 5.8 7.01 Protection of property index (1–7) ........................................................... 122 .......... ■ ..........2.9 Finland .....................................................6.3
Property rights* ....................................................................................... 128 .......... ■ ..........2.8 Finland .....................................................6.4Intellectual property protection* .............................................................. 106 .......... ■ ..........2.9 Finland .....................................................6.2
7.02 Efficiency and accountability of public institutions index (1–7) ................... 65 .......... ■ ..........3.6 Singapore.................................................6.0Judicial efficiency & impartiality in commercial disputes (0–4)....................55 .......... ■ ..........2.3 Multiple economies (7) .............................4.0Diversion of public funds* ....................................................................... 102 .......... ■ ..........2.5 New Zealand ............................................6.5Ease of compliance with government regulation* ...................................... 29 .......... ■ ..........3.9 Singapore.................................................5.4
7.03 Access to finance index (1–7) ................................................................ 124 .......... ■ ..........2.8 Hong Kong SAR ......................................5.7Affordability of financial services* ........................................................... 118 .......... ■ ..........3.4 Hong Kong SAR ......................................6.1Availability of financial services* .............................................................. 120 .......... ■ ..........3.5 Switzerland ..............................................6.4Ease of access to loans* ........................................................................ 126 .......... ■ ..........1.9 Qatar ........................................................4.9Availability of trade finance* .................................................................... 132 .......... ■ ..........2.6 Hong Kong SAR ......................................5.8
7.04 Openness to foreign participation index (1–7) ........................................... 28 .......... ■ ..........4.8 Ireland ......................................................5.5Ease of hiring foreign labour* ...................................................................... 5 .......... ■ ..........5.2 United Arab Emirates ...............................5.6Business impact of rules on FDI* .............................................................. 75 .......... ■ ..........4.5 Ireland ......................................................6.7Openness to multilateral trade rules (0–100) ............................................. 48 .......... ■ ........69.9 Slovenia .................................................92.2
7.05 Index of physical security (1–7) ................................................................. 73 .......... ■ ..........5.4 Qatar ........................................................6.8Reliability of police services* ..................................................................... 92 .......... ■ ..........3.7 Finland .....................................................6.7Business costs of crime and violence* ...................................................... 86 .......... ■ ..........4.3 Qatar ........................................................6.8Business costs of terrorism* ..................................................................... 83 .......... ■ ..........5.2 Slovenia ...................................................6.7Homicide cases/100,000 pop. ................................................................. 79 .......... ■ ..........4.4 Hong Kong SAR ......................................0.2Index of terrorism incidence (1-7) ............................................................... 1 .......... ■ ..........7.0 Multiple economies (48) ...........................7.0
© 2014 World Economic Forum

Country/Economy Profiles
The Global Enabling Trade Report 2014 | 47
• For economies with an overall rank on the ETI lower than 50, any indicators on which the economy ranks 50th or higher are considered to be competitive advantages. Any indicators ranked below 50 are considered competitive disadvantages.
For the sake of comparison, we report in the two right-most columns the score and name of the best performing economy for each indicator. ‘Multiple economies’ denotes a tie for the best score on a specific indicator. In this case, the number of economies is reported in brackets. For these indicators, we provide below the list of best-performing economies.
• Tariff rate. Two economies have an average tariff rate equal to zero: Hong Kong SAR and Libya.
• Tariff dispersion. Two economies have zero tariff dispersion: Hong Kong SAR and Libya.
• Tariff peaks. A total of 24 economies have no tariff peaks: Algeria, Argentina, Bangladesh, Benin, Burkina Faso, Cameroon, Chad, Chile, Côte d’Ivoire, Ethiopia, Gabon, Gambia, Ghana, Hong Kong SAR, Libya, Madagascar, Mali, Mauritania, Mozambique, Nigeria, Paraguay, Senegal, Tunisia and Zambia.
• Specific tariffs. A total of 54 economies have no specific tariffs: Albania, Algeria, Angola, Argentina, Benin, Bhutan, Bolivia, Brazil, Burkina Faso, Cambodia, Cameroon, Chad, Chile, Colombia, Costa Rica, Côte d’Ivoire, Dominican Republic, Ecuador, El Salvador, Ethiopia, Gabon, Gambia, Ghana, Guatemala, Guinea, Guyana, Haiti, Honduras, Hong Kong SAR, Iran, Jamaica, Lao PDR, Libya, Madagascar, Malawi, Mali, Mauritania, Mongolia, Morocco, Mozambique, Myanmar, Nicaragua, Nigeria, Panama, Paraguay, Peru, Philippines, Senegal, Tunisia, Uruguay, Venezuela, Vietnam, Yemen and Zambia.
• Number of distinct tariffs. Two economies have only one tariff: Hong Kong SAR and Libya.
• Complexity of tariff index. Two economies have obtained the maximum score of 7: Hong Kong SAR and Libya.
• Share of duty-free imports. Two economies have zero duties on 100 percent of their imports: Hong Kong SAR and Libya.
• Domestic market access. Two economies have obtained the maximum score of 7: Hong Kong SAR and Libya.
• Number of documents to import. Two economies require only two documents in order to import goods: France and Ireland.
• Number of days to export. It takes six days on average to export goods in Denmark, Estonia, Hong Kong SAR, Singapore and the United States.
• Number of documents to export. Two economies require only two documents in order to export goods: France and Ireland.
• Customs transparency index. A total of 35 economies have obtained the maximum possible score in terms of transparency of customs: Australia; Austria; Belgium; Brazil; Canada; Chile; Colombia; Costa Rica; Czech Republic; Denmark; Ecuador; Estonia; Germany; Guatemala; Hungary; India; Japan; Jordan; Korea, Rep.; Kyrgyz Republic; Luxembourg; Malta; Morocco; Netherlands; New Zealand; Nigeria; Poland; Slovenia; South Africa; Sweden; Switzerland; Taiwan (China); Turkey; United Kingdom; and the United States.
• Paved roads. A total of 18 economies have 100% of their road network paved: Austria, Czech Republic, Denmark, France, Germany, Hong Kong SAR, Ireland, Israel, Italy, Jordan, Luxembourg, Singapore, Slovenia, Spain, Switzerland, United Arab Emirates, United Kingdom and the United States.
• Government online service index. Three economies have obtained the best possible score in the government online service index: Korea, Rep.; Singapore; and the United States.
• Judicial efficiency and impartiality in commercial disputes. A total of seven economies have the most efficient and impartial judicial system to address commercial disputes: Australia, Cyprus, Denmark, Germany, Hong Kong SAR, Netherlands and the United Kingdom.
• Terrorism Incidence Index. A total of 48 economies have obtained the Index score of 7: Albania; Armenia; Azerbaijan; Benin; Botswana; Burkina Faso; Cambodia; Costa Rica; Croatia; Dominican Republic; El Salvador; Finland; Gabon; Gambia; Ghana; Guinea; Guyana; Haiti; Honduras; Hong Kong SAR; Hungary; Jamaica; Japan; Korea, Rep.; Latvia; Lesotho; Lithuania; Luxembourg; Malawi; Malta; Mauritius; Mongolia; Montenegro; Namibia; New Zealand; Nicaragua; Oman; Panama; Poland; Qatar; Romania; Singapore; Slovak Republic; Slovenia; Taiwan (China); Uruguay; Vietnam; and Zambia.
NOTES 1 United Nations, Department of Economic and Social Affairs,
Statistics Division, 2002. “Classification by Broad Economic Categories”. New York, NY: United Nations. Available at http://unstats.un.org/unsd/publication/SeriesM/SeriesM_53rev4e.pdf.
2 See IMF’s World Economic Outlook database (October 2013 edition), available at http://www.imf.org/weo. In accordance with the IMF’s classification, Georgia has been included in the Commonwealth of Independent States even though the country officially withdrew from the organization in 2009. Latin America and the Caribbean has been disaggregated into South America and Central America and Caribbean, so as to allow for a more granular level of analysis.
© 2014 World Economic Forum

© 2014 World Economic Forum

The Global Enabling Trade Report 2014 | 49
Index of Countries/Economies
Country/Economy Page
Albania 50Algeria 52Angola 54Argentina 56Armenia 58Australia 60Austria 62Azerbaijan 64Bahrain 66Bangladesh 68Belgium 70Benin 72Bhutan 74Bolivia 76Bosnia and Herzegovina 78Botswana 80Brazil 82Bulgaria 84Burkina Faso 86Burundi 88Cambodia 90Cameroon 92Canada 94Chad 96Chile 98China 100Colombia 102Costa Rica 104Côte d'Ivoire 106Croatia 108Cyprus 110Czech Republic 112Denmark 114Dominican Republic 116Ecuador 118Egypt 120El Salvador 122Estonia 124Ethiopia 126Finland 128France 130Gabon 132Gambia, The 134Georgia 136Germany 138Ghana 140
Country/Economy Page
Greece 142Guatemala 144Guinea 146Guyana 148Haiti 150Honduras 152Hong Kong SAR 154Hungary 156Iceland 158India 160Indonesia 162Iran, Islamic Rep. 164Ireland 166Israel 168Italy 170Jamaica 172Japan 174Jordan 176Kazakhstan 178Kenya 180Korea, Rep. 182Kuwait 184Kyrgyz Republic 186Lao PDR 188Latvia 190Lebanon 192Lesotho 194Liberia 196Libya 198Lithuania 200Luxembourg 202Macedonia, FYR 204Madagascar 206Malawi 208Malaysia 210Mali 212Malta 214Mauritania 216Mauritius 218Mexico 220Moldova 222Mongolia 224Montenegro 226Morocco 228Mozambique 230Myanmar 232
Country/Economy Page
Namibia 234Nepal 236Netherlands 238New Zealand 240Nicaragua 242Nigeria 244Norway 246Oman 248Pakistan 250Panama 252Paraguay 254Peru 256Philippines 258Poland 260Portugal 262Qatar 264Romania 266Russian Federation 268Rwanda 270Saudi Arabia 272Senegal 274Serbia 276Singapore 278Slovak Republic 280Slovenia 282South Africa 284Spain 286Sri Lanka 288Sweden 290Switzerland 292Taiwan, China 294Tanzania 296Thailand 298Tunisia 300Turkey 302Uganda 304Ukraine 306United Arab Emirates 308United Kingdom 310United States 312Uruguay 314Venezuela 316Vietnam 318Yemen 320Zambia 322Zimbabwe 324
© 2014 World Economic Forum
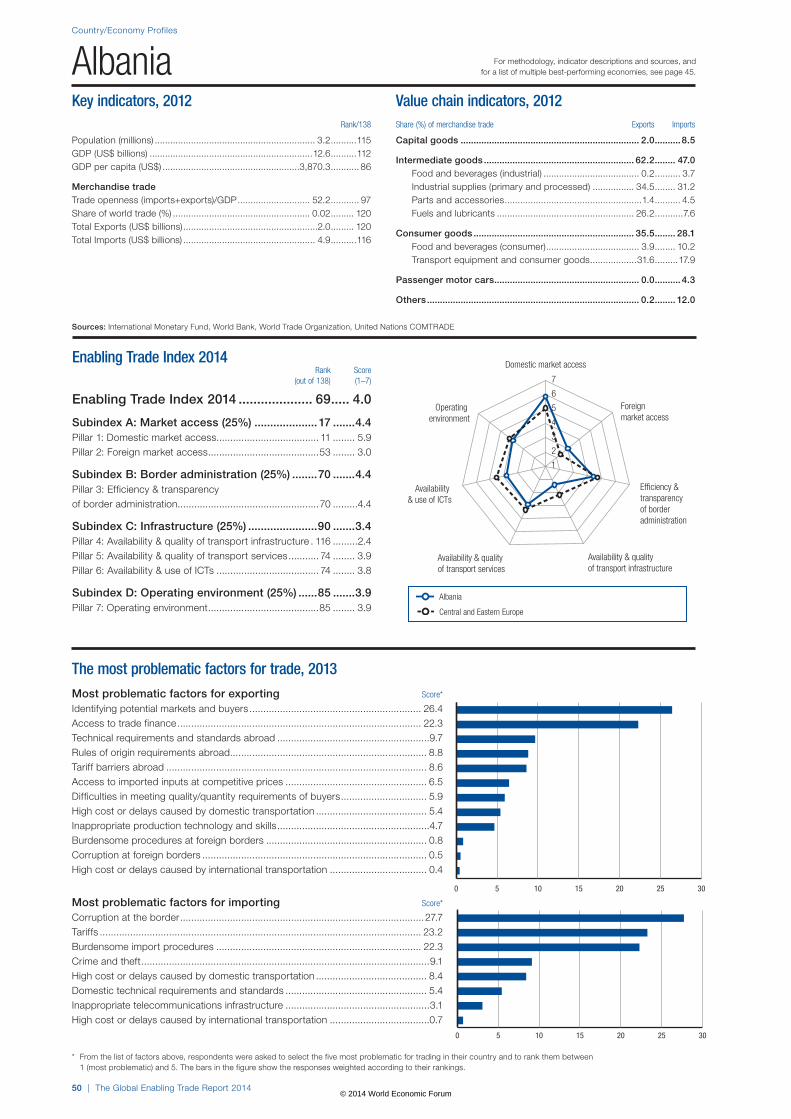
Country/Economy Profiles
50 | The Global Enabling Trade Report 2014
* From the list of factors above, respondents were asked to select the five most problematic for trading in their country and to rank them between 1 (most problematic) and 5. The bars in the figure show the responses weighted according to their rankings.
For methodology, indicator descriptions and sources, and for a list of multiple best-performing economies, see page 45.
0 105 15 20 25 30
0 5 10 15 20 25 30
2
3
4
5
6
7
Operating environment
Availability & use of ICTs
Availability & quality of transport services
Availability & quality of transport infrastructure
Efficiency & transparency of border administration
Foreign market access
Domestic market access
1
Enabling Trade Index 2014 Rank Score (out of 138) (1–7)
Enabling Trade Index 2014 .................... 69 ..... 4.0
Subindex A: Market access (25%) .................... 17 .......4.4Pillar 1: Domestic market access ..................................... 11 ........ 5.9Pillar 2: Foreign market access ........................................53 ........ 3.0
Subindex B: Border administration (25%) ........70 .......4.4Pillar 3: Efficiency & transparency of border administration ...................................................70 .........4.4
Subindex C: Infrastructure (25%) ......................90 .......3.4Pillar 4: Availability & quality of transport infrastructure . 116 .........2.4Pillar 5: Availability & quality of transport services ........... 74 ........ 3.9Pillar 6: Availability & use of ICTs ..................................... 74 ........ 3.8
Subindex D: Operating environment (25%) ......85 .......3.9Pillar 7: Operating environment ........................................85 ........ 3.9
Key indicators, 2012 Rank/138
Population (millions) .............................................................. 3.2 ..........115GDP (US$ billions) ...............................................................12.6 ..........112GDP per capita (US$) .....................................................3,870.3 ........... 86
Merchandise tradeTrade openness (imports+exports)/GDP ............................ 52.2 ........... 97Share of world trade (%) ..................................................... 0.02 ......... 120Total Exports (US$ billions) ....................................................2.0 ......... 120Total Imports (US$ billions) ................................................... 4.9 ..........116
Value chain indicators, 2012Share (%) of merchandise trade Exports Imports
Capital goods ..................................................................... 2.0 ..........8.5
Intermediate goods .......................................................... 62.2 ........ 47.0Food and beverages (industrial) ..................................... 0.2 .......... 3.7Industrial supplies (primary and processed) ................ 34.5 ........ 31.2Parts and accessories .....................................................1.4 .......... 4.5Fuels and lubricants ..................................................... 26.2 ...........7.6
Consumer goods .............................................................. 35.5 ........ 28.1Food and beverages (consumer) .................................... 3.9 ........ 10.2Transport equipment and consumer goods ..................31.6 .........17.9
Passenger motor cars ........................................................ 0.0 .......... 4.3
Others .................................................................................. 0.2 ........ 12.0
The most problematic factors for trade, 2013Most problematic factors for exporting Score*
Identifying potential markets and buyers .............................................................. 26.4Access to trade finance ........................................................................................ 22.3Technical requirements and standards abroad .......................................................9.7Rules of origin requirements abroad ....................................................................... 8.8Tariff barriers abroad .............................................................................................. 8.6Access to imported inputs at competitive prices ................................................... 6.5Difficulties in meeting quality/quantity requirements of buyers ............................... 5.9High cost or delays caused by domestic transportation ........................................ 5.4Inappropriate production technology and skills .......................................................4.7Burdensome procedures at foreign borders .......................................................... 0.8Corruption at foreign borders ................................................................................. 0.5High cost or delays caused by international transportation ................................... 0.4
Most problematic factors for importing Score*
Corruption at the border ........................................................................................27.7Tariffs .................................................................................................................... 23.2Burdensome import procedures .......................................................................... 22.3Crime and theft ........................................................................................................9.1High cost or delays caused by domestic transportation ........................................ 8.4Domestic technical requirements and standards ................................................... 5.4Inappropriate telecommunications infrastructure ....................................................3.1High cost or delays caused by international transportation ....................................0.7
Albania
Sources: International Monetary Fund, World Bank, World Trade Organization, United Nations COMTRADE
Albania
Central and Eastern Europe
© 2014 World Economic Forum

Country/Economy Profiles
The Global Enabling Trade Report 2014 | 51
* Indicator derived from the World Economic Forum’s Executive Opinion Survey and measured on a 1-to-7 scale, where 7 indicates best outcome.
The Enabling Trade Index 2014 in detail n Competitive Advantage n Competitive Disadvantage
For methodology, indicator descriptions and sources, and for a list of multiple best-performing economies, see page 45. Albania
INDICATOR, UNITS RANK/138 VALUE BEST PERFORMER VALUE
Pillar 1: Domestic market access (1–7) ........................................................... 11 ...........................5.9 Multiple economies (2) ................................ 7.0 1.01 Tariff rate (%)............................................................................................. 40 .......... n ..........2.8 Multiple economies (2) .............................0.0 1.02 Complexity of tariffs index (1–7) ................................................................ 77 .......... n ..........5.6 Multiple economies (2) .............................7.0
Tariff dispersion (standard deviation) ......................................................... 12 .......... n ..........5.2 Multiple economies (2) .............................0.0Tariff peaks (% of tariff lines) ................................................................... 133 .......... n ........12.0 Multiple economies (24) ...........................0.0Specific tariffs (% of tariff lines) ................................................................... 1 .......... n ..........0.0 Multiple economies (54) ...........................0.0Number of distinct tariffs ........................................................................... 25 .......... n .............6 Multiple economies (2) ................................1
1.03 Share of duty-free imports (%) .................................................................. 14 .......... n ........85.9 Multiple economies (2) .........................100.0
Pillar 2: Foreign market access (1–7) .............................................................. 53 ...........................3.0 Cambodia ..................................................... 5.3 2.01 Tariffs faced (%) ...................................................................................... 123 .......... n ..........5.8 Chile .........................................................3.5 2.02 Index of margin of preference in destination mkts (0–100) ........................ 19 .......... n ........56.9 Mauritius ................................................97.1
Pillar 3: Efficiency and transparency of border administration (1–7) .............. 70 ...........................4.4 Singapore..................................................... 6.3 3.01 Customs services index (0–1) ................................................................... 38 .......... n ........0.69 Singapore...............................................0.97 3.02 Efficiency of the clearance process (1–5) .................................................. 96 .......... n ..........2.4 Norway ....................................................4.2 3.03 No. of days to import ............................................................................... 74 .......... n ...........18 Singapore....................................................4 3.04 No. of documents to import ..................................................................... 82 .......... n .............8 Multiple economies (2) ................................2 3.05 Cost to import (US$ per container) ........................................................... 18 .......... n .........730 Singapore................................................440 3.06 No. of days to export................................................................................ 81 .......... n ...........19 Multiple economies (5) ................................6 3.07 No. of documents to export ..................................................................... 85 .......... n .............7 Multiple economies (2) ................................2 3.08 Cost to export (US$ per container) ........................................................... 24 .......... n .........745 Malaysia ..................................................450 3.09 Irregular payments in exports and imports*............................................... 85 .......... n ..........3.2 New Zealand ............................................6.6 3.10 Time predictability of import procedures* .................................................. 91 .......... n ..........3.5 Finland .....................................................6.0 3.11 Customs transparency index (0–1) ........................................................... 56 .......... n ........0.83 Multiple economies (35) .........................1.00
Pillar 4: Availability and quality of transport infrastructure (1-7) ................... 116 ...........................2.4 United Arab Emirates ................................... 6.5 4.01 Available int’l airline seat km/week, millions ............................................ 111 .......... n ........24.2 United States ..................................11,481.7 4.02 Quality of air transport infrastructure* ........................................................ 72 .......... n ..........4.3 Singapore.................................................6.8 4.03 Quality of railroad infrastructure* ............................................................. 107 .......... n ..........1.2 Japan .......................................................6.7 4.04 Liner Shipping Connectivity Index (0–157.1) ........................................... 101 .......... n ..........4.4 China ...................................................157.5 4.05 Quality of port infrastructure* .................................................................. 100 .......... n ..........3.5 Netherlands ..............................................6.8 4.06 Paved roads (% of total) ........................................................................... 79 .......... n ........39.0 Multiple economies (18) .......................100.0 4.07 Quality of roads* ....................................................................................... 68 .......... n ..........3.9 United Arab Emirates ...............................6.6
Pillar 5: Availability and quality of transport services (1–7) ............................ 74 ...........................3.9 Singapore..................................................... 5.7 5.01 Ease and affordability of shipment (1–5).................................................... 77 .......... n ..........2.8 Luxembourg .............................................3.8 5.02 Logistics competence (1–5) ...................................................................... 90 .......... n ..........2.6 Norway ....................................................4.2 5.03 Tracking and tracing ability (1–5) ............................................................... 96 .......... n ..........2.6 Germany ..................................................4.2 5.04 Timeliness of shipments in reaching destination (1–5) ............................... 46 .......... n ..........3.6 Luxembourg .............................................4.7 5.05 Postal services efficiency* ......................................................................... 62 .......... n ..........4.6 Japan .......................................................6.8 5.06 Efficiency of transport mode change* ....................................................... 99 .......... n ..........3.5 Hong Kong SAR ......................................6.4
Pillar 6: Availability and use of ICTs (1–7) ........................................................ 74 ...........................3.8 Sweden ........................................................ 6.5 6.01 Mobile phone subscriptions/100 pop. ...................................................... 66 .......... n ......110.7 Hong Kong SAR ..................................229.2 6.02 Individuals using Internet (%) .................................................................... 55 .......... n ........54.7 Iceland ...................................................96.2 6.03 Fixed broadband Internet subscriptions/100 pop. .................................... 73 .......... n ..........5.1 Switzerland ............................................39.9 6.04 Active mobile broadband Internet subscriptions/100 pop. ........................ 68 .......... n ........18.8 Singapore.............................................124.5 6.05 ICT use for business-to-business transactions* ...................................... 126 .......... n ..........3.8 Finland .....................................................6.2 6.06 Internet use for business-to-consumer transactions* .............................. 123 .......... n ..........3.4 United Kingdom .......................................6.3 6.07 Government Online Service Index (0–1) .................................................... 86 .......... n ........0.42 Multiple economies (3) ...........................1.00
Pillar 7: Operating environment (1–7) .............................................................. 85 ...........................3.9 Hong Kong SAR ............................................ 5.8 7.01 Protection of property index (1–7) ........................................................... 122 .......... n ..........2.9 Finland .....................................................6.3
Property rights* ....................................................................................... 128 .......... n ..........2.8 Finland .....................................................6.4Intellectual property protection* .............................................................. 106 .......... n ..........2.9 Finland .....................................................6.2
7.02 Efficiency and accountability of public institutions index (1–7) ................... 65 .......... n ..........3.6 Singapore.................................................6.0Judicial efficiency & impartiality in commercial disputes (0–4).................... 55 .......... n ..........2.3 Multiple economies (7) .............................4.0Diversion of public funds* ....................................................................... 102 .......... n ..........2.5 New Zealand ............................................6.5Ease of compliance with government regulation* ...................................... 29 .......... n ..........3.9 Singapore.................................................5.4
7.03 Access to finance index (1–7) ................................................................ 124 .......... n ..........2.8 Hong Kong SAR ......................................5.7Affordability of financial services* ........................................................... 118 .......... n ..........3.4 Hong Kong SAR ......................................6.1Availability of financial services* .............................................................. 120 .......... n ..........3.5 Switzerland ..............................................6.4Ease of access to loans* ........................................................................ 126 .......... n ..........1.9 Qatar ........................................................4.9Availability of trade finance* .................................................................... 132 .......... n ..........2.6 Hong Kong SAR ......................................5.8
7.04 Openness to foreign participation index (1–7) ........................................... 28 .......... n ..........4.8 Ireland ......................................................5.5Ease of hiring foreign labour* ...................................................................... 5 .......... n ..........5.2 United Arab Emirates ...............................5.6Business impact of rules on FDI* .............................................................. 75 .......... n ..........4.5 Ireland ......................................................6.7Openness to multilateral trade rules (0–100) ............................................. 48 .......... n ........69.9 Slovenia .................................................92.2
7.05 Index of physical security (1–7) ................................................................. 73 .......... n ..........5.4 Qatar ........................................................6.8Reliability of police services* ..................................................................... 92 .......... n ..........3.7 Finland .....................................................6.7Business costs of crime and violence* ...................................................... 86 .......... n ..........4.3 Qatar ........................................................6.8Business costs of terrorism* ..................................................................... 83 .......... n ..........5.2 Slovenia ...................................................6.7Homicide cases/100,000 pop. ................................................................. 79 .......... n ..........4.4 Hong Kong SAR ......................................0.2Index of terrorism incidence (1-7) ............................................................... 1 .......... n ..........7.0 Multiple economies (48) ...........................7.0
© 2014 World Economic Forum

Country/Economy Profiles
52 | The Global Enabling Trade Report 2014
* From the list of factors above, respondents were asked to select the five most problematic for trading in their country and to rank them between 1 (most problematic) and 5. The bars in the figure show the responses weighted according to their rankings.
For methodology, indicator descriptions and sources, and for a list of multiple best-performing economies, see page 45.
0 105 15 20 25 30
0 5 10 15 20 25 30
2
3
4
5
6
7
Operating environment
Availability & use of ICTs
Availability & quality of transport services
Availability & quality of transport infrastructure
Efficiency & transparency of border administration
Foreign market access
Domestic market access
1
Enabling Trade Index 2014 Rank Score (out of 138) (1–7)
Enabling Trade Index 2014 ...................120 ..... 3.2
Subindex A: Market access (25%) ..................128 .......2.8Pillar 1: Domestic market access ...................................123 .........3.4Pillar 2: Foreign market access ........................................82 .........2.3
Subindex B: Border administration (25%) ........98 .......3.7Pillar 3: Efficiency & transparency of border administration ...................................................98 .........3.7
Subindex C: Infrastructure (25%) .................... 112 .......2.9Pillar 4: Availability & quality of transport infrastructure ...92 .........2.7Pillar 5: Availability & quality of transport services ......... 115 .........3.4Pillar 6: Availability & use of ICTs ................................... 115 .........2.6
Subindex D: Operating environment (25%) ....130 .......3.3Pillar 7: Operating environment ......................................130 ........ 3.3
Key indicators, 2012 Rank/138
Population (millions) .............................................................37.5 ........... 33GDP (US$ billions) ............................................................ 209.3 ........... 48GDP per capita (US$) .................................................... 5,582.8 ........... 76
Merchandise tradeTrade openness (imports+exports)/GDP .............................58.1 ........... 87Share of world trade (%) ..................................................... 0.32 ........... 53Total Exports (US$ billions) ..................................................71.9 ........... 49Total Imports (US$ billions) ..................................................47.5 ........... 53
Value chain indicators, 2012Share (%) of merchandise trade Exports Imports
Capital goods ..................................................................... 0.0 ........ 19.1
Intermediate goods .......................................................... 85.8 ........48.8Food and beverages (industrial) ..................................... 0.0 .......... 9.8Industrial supplies (primary and processed) ...................2.4 ........ 30.1Parts and accessories .................................................... 0.0 .......... 8.7Fuels and lubricants ..................................................... 83.3 .......... 0.3
Consumer goods ................................................................ 0.4 ........ 15.5Food and beverages (consumer) .................................... 0.4 .......... 5.9Transport equipment and consumer goods ................... 0.0 .......... 9.6
Passenger motor cars ........................................................ 0.0 .......... 7.8
Others ................................................................................ 13.8 ..........8.8
The most problematic factors for trade, 2013Most problematic factors for exporting Score*
Identifying potential markets and buyers ...............................................................14.4Inappropriate production technology and skills .....................................................14.1Difficulties in meeting quality/quantity requirements of buyers ..............................14.0Access to trade finance ........................................................................................ 13.2Burdensome procedures at foreign borders .......................................................... 8.5Access to imported inputs at competitive prices ....................................................7.8High cost or delays caused by domestic transportation .........................................7.6Technical requirements and standards abroad ...................................................... 6.7High cost or delays caused by international transportation ................................... 4.5Tariff barriers abroad .............................................................................................. 3.7Corruption at foreign borders ................................................................................. 2.9Rules of origin requirements abroad ....................................................................... 2.6
Most problematic factors for importing Score*
Burdensome import procedures ...........................................................................24.1Tariffs .................................................................................................................... 20.8Corruption at the border ........................................................................................ 17.0High cost or delays caused by international transportation ..................................11.3High cost or delays caused by domestic transportation ........................................ 9.5Inappropriate telecommunications infrastructure ....................................................7.5Domestic technical requirements and standards ....................................................5.7Crime and theft ....................................................................................................... 4.2
Algeria
Sources: International Monetary Fund, World Bank, World Trade Organization, United Nations COMTRADE
Algeria
Middle East, North Africa, and Pakistan
© 2014 World Economic Forum

Country/Economy Profiles
The Global Enabling Trade Report 2014 | 53
* Indicator derived from the World Economic Forum’s Executive Opinion Survey and measured on a 1-to-7 scale, where 7 indicates best outcome.
The Enabling Trade Index 2014 in detail n Competitive Advantage n Competitive Disadvantage
For methodology, indicator descriptions and sources, and for a list of multiple best-performing economies, see page 45. Algeria
INDICATOR, UNITS RANK/138 VALUE BEST PERFORMER VALUE
Pillar 1: Domestic market access (1–7) ......................................................... 123 ...........................3.4 Multiple economies (2) ................................ 7.0 1.01 Tariff rate (%)........................................................................................... 130 .......... n ........14.5 Multiple economies (2) .............................0.0 1.02 Complexity of tariffs index (1–7) ................................................................ 32 .......... n ..........6.6 Multiple economies (2) .............................7.0
Tariff dispersion (standard deviation) ......................................................... 96 .......... n ........10.1 Multiple economies (2) .............................0.0Tariff peaks (% of tariff lines) ....................................................................... 1 .......... n ..........0.0 Multiple economies (24) ...........................0.0Specific tariffs (% of tariff lines) ................................................................... 1 .......... n ..........0.0 Multiple economies (54) ...........................0.0Number of distinct tariffs ............................................................................. 5 .......... n .............4 Multiple economies (2) ................................1
1.03 Share of duty-free imports (%) ................................................................ 108 .......... n ........24.5 Multiple economies (2) .........................100.0
Pillar 2: Foreign market access (1–7) .............................................................. 82 ...........................2.3 Cambodia ..................................................... 5.3 2.01 Tariffs faced (%) ...................................................................................... 113 .......... n ..........5.6 Chile .........................................................3.5 2.02 Index of margin of preference in destination mkts (0–100) ........................ 64 .......... n ........28.5 Mauritius ................................................97.1
Pillar 3: Efficiency and transparency of border administration (1–7) .............. 98 ...........................3.7 Singapore..................................................... 6.3 3.01 Customs services index (0–1) ................................................................... 38 .......... n ........0.69 Singapore...............................................0.97 3.02 Efficiency of the clearance process (1–5) .................................................. 65 .......... n ..........2.7 Norway ....................................................4.2 3.03 No. of days to import ............................................................................. 101 .......... n ...........27 Singapore....................................................4 3.04 No. of documents to import ................................................................... 101 .......... n .............9 Multiple economies (2) ................................2 3.05 Cost to import (US$ per container) ........................................................... 68 .......... n ......1,330 Singapore................................................440 3.06 No. of days to export................................................................................ 71 .......... n ...........17 Multiple economies (5) ................................6 3.07 No. of documents to export ................................................................... 108 .......... n .............8 Multiple economies (2) ................................2 3.08 Cost to export (US$ per container) ........................................................... 81 .......... n ......1,270 Malaysia ..................................................450 3.09 Irregular payments in exports and imports*............................................. 133 .......... n ..........2.0 New Zealand ............................................6.6 3.10 Time predictability of import procedures* ................................................ 119 .......... n ..........3.0 Finland .....................................................6.0 3.11 Customs transparency index (0–1) .......................................................... n/a ........................n/a Multiple economies (35) .........................1.00
Pillar 4: Availability and quality of transport infrastructure (1-7) ..................... 92 ...........................2.7 United Arab Emirates ................................... 6.5 4.01 Available int’l airline seat km/week, millions .............................................. 68 .......... n ......159.3 United States ..................................11,481.7 4.02 Quality of air transport infrastructure* ...................................................... 124 .......... n ..........3.0 Singapore.................................................6.8 4.03 Quality of railroad infrastructure* ............................................................... 75 .......... n ..........2.3 Japan .......................................................6.7 4.04 Liner Shipping Connectivity Index (0–157.1) ............................................. 88 .......... n ..........6.9 China ...................................................157.5 4.05 Quality of port infrastructure* .................................................................. 123 .......... n ..........2.7 Netherlands ..............................................6.8 4.06 Paved roads (% of total) ........................................................................... 47 .......... n ........77.1 Multiple economies (18) .......................100.0 4.07 Quality of roads* ....................................................................................... 91 .......... n ..........3.3 United Arab Emirates ...............................6.6
Pillar 5: Availability and quality of transport services (1–7) .......................... 115 ...........................3.4 Singapore..................................................... 5.7 5.01 Ease and affordability of shipment (1–5).................................................. 113 .......... n ..........2.5 Luxembourg .............................................3.8 5.02 Logistics competence (1–5) .................................................................... 102 .......... n ..........2.5 Norway ....................................................4.2 5.03 Tracking and tracing ability (1–5) ............................................................. 106 .......... n ..........2.5 Germany ..................................................4.2 5.04 Timeliness of shipments in reaching destination (1–5) ............................... 94 .......... n ..........3.0 Luxembourg .............................................4.7 5.05 Postal services efficiency* ......................................................................... 93 .......... n ..........3.8 Japan .......................................................6.8 5.06 Efficiency of transport mode change* ..................................................... 128 .......... n ..........2.8 Hong Kong SAR ......................................6.4
Pillar 6: Availability and use of ICTs (1–7) ...................................................... 115 ...........................2.6 Sweden ........................................................ 6.5 6.01 Mobile phone subscriptions/100 pop. ...................................................... 89 .......... n ........97.9 Hong Kong SAR ..................................229.2 6.02 Individuals using Internet (%) .................................................................. 105 .......... n ........15.2 Iceland ...................................................96.2 6.03 Fixed broadband Internet subscriptions/100 pop. .................................... 83 .......... n ..........2.9 Switzerland ............................................39.9 6.04 Active mobile broadband Internet subscriptions/100 pop. ...................... 127 .......... n ..........0.0 Singapore.............................................124.5 6.05 ICT use for business-to-business transactions* ...................................... 137 .......... n ..........3.0 Finland .....................................................6.2 6.06 Internet use for business-to-consumer transactions* .............................. 135 .......... n ..........2.7 United Kingdom .......................................6.3 6.07 Government Online Service Index (0–1) .................................................. 120 .......... n ........0.25 Multiple economies (3) ...........................1.00
Pillar 7: Operating environment (1–7) ............................................................ 130 ...........................3.3 Hong Kong SAR ............................................ 5.8 7.01 Protection of property index (1–7) ........................................................... 126 .......... n ..........2.7 Finland .....................................................6.3
Property rights* ....................................................................................... 119 .......... n ..........3.2 Finland .....................................................6.4Intellectual property protection* .............................................................. 135 .......... n ..........2.2 Finland .....................................................6.2
7.02 Efficiency and accountability of public institutions index (1–7) ................. 120 .......... n ..........2.8 Singapore.................................................6.0Judicial efficiency & impartiality in commercial disputes (0–4).................... 77 .......... n ..........1.8 Multiple economies (7) .............................4.0Diversion of public funds* ....................................................................... 121 .......... n ..........2.3 New Zealand ............................................6.5Ease of compliance with government regulation* .................................... 128 .......... n ..........2.5 Singapore.................................................5.4
7.03 Access to finance index (1–7) ................................................................ 126 .......... n ..........2.7 Hong Kong SAR ......................................5.7Affordability of financial services* ........................................................... 134 .......... n ..........2.7 Hong Kong SAR ......................................6.1Availability of financial services* .............................................................. 132 .......... n ..........3.0 Switzerland ..............................................6.4Ease of access to loans* .......................................................................... 82 .......... n ..........2.7 Qatar ........................................................4.9Availability of trade finance* .................................................................... 131 .......... n ..........2.6 Hong Kong SAR ......................................5.8
7.04 Openness to foreign participation index (1–7) ......................................... 120 .......... n ..........3.5 Ireland ......................................................5.5Ease of hiring foreign labour* .................................................................. 117 .......... n ..........3.4 United Arab Emirates ...............................5.6Business impact of rules on FDI* ............................................................ 124 .......... n ..........3.3 Ireland ......................................................6.7Openness to multilateral trade rules (0–100) ............................................. 85 .......... n ........59.8 Slovenia .................................................92.2
7.05 Index of physical security (1–7) ................................................................. 99 .......... n ..........4.7 Qatar ........................................................6.8Reliability of police services* ..................................................................... 89 .......... n ..........3.7 Finland .....................................................6.7Business costs of crime and violence* ...................................................... 95 .......... n ..........4.1 Qatar ........................................................6.8Business costs of terrorism* ................................................................... 128 .......... n ..........3.7 Slovenia ...................................................6.7Homicide cases/100,000 pop. ................................................................. 10 .......... n ..........0.8 Hong Kong SAR ......................................0.2Index of terrorism incidence (1-7) ........................................................... 127 .......... n ..........5.2 Multiple economies (48) ...........................7.0
© 2014 World Economic Forum

Country/Economy Profiles
54 | The Global Enabling Trade Report 2014
* From the list of factors above, respondents were asked to select the five most problematic for trading in their country and to rank them between 1 (most problematic) and 5. The bars in the figure show the responses weighted according to their rankings.
For methodology, indicator descriptions and sources, and for a list of multiple best-performing economies, see page 45.
0 105 15 20 25 30
0 5 10 15 20 25 30
2
3
4
5
6
7
Operating environment
Availability & use of ICTs
Availability & quality of transport services
Availability & quality of transport infrastructure
Efficiency & transparency of border administration
Foreign market access
Domestic market access
1
Enabling Trade Index 2014 Rank Score (out of 138) (1–7)
Enabling Trade Index 2014 ...................136 ..... 2.8
Subindex A: Market access (25%) ..................107 .......3.3Pillar 1: Domestic market access ................................... 116 ........ 3.6Pillar 2: Foreign market access ........................................55 .........2.9
Subindex B: Border administration (25%) ......131 .......2.8Pillar 3: Efficiency & transparency of border administration ................................................. 131 .........2.8
Subindex C: Infrastructure (25%) ....................134 .......2.3Pillar 4: Availability & quality of transport infrastructure .134 .........2.1Pillar 5: Availability & quality of transport services .........134 .........2.9Pillar 6: Availability & use of ICTs ...................................129 .........2.0
Subindex D: Operating environment (25%) ....135 .......2.9Pillar 7: Operating environment ......................................135 .........2.9
Key indicators, 2012 Rank/138
Population (millions) ............................................................ 20.2 ........... 52GDP (US$ billions) .............................................................115.2 ........... 60GDP per capita (US$) .................................................... 5,699.7 ........... 75
Merchandise tradeTrade openness (imports+exports)/GDP ............................ 84.9 ........... 45Share of world trade (%) ..................................................... 0.26 ........... 57Total Exports (US$ billions) ..................................................74.0 ........... 47Total Imports (US$ billions) ..................................................24.0 ........... 69
The most problematic factors for trade, 2013Most problematic factors for exporting Score*
Inappropriate production technology and skills .....................................................15.1High cost or delays caused by domestic transportation .......................................13.9Corruption at foreign borders ................................................................................13.6Access to trade finance .........................................................................................12.2Difficulties in meeting quality/quantity requirements of buyers .............................. 11.7Burdensome procedures at foreign borders .......................................................... 8.4High cost or delays caused by international transportation ....................................7.7Access to imported inputs at competitive prices ....................................................7.4Identifying potential markets and buyers ................................................................ 3.2Rules of origin requirements abroad ........................................................................2.7Technical requirements and standards abroad ...................................................... 2.2Tariff barriers abroad ...............................................................................................1.7
Most problematic factors for importing Score*
Corruption at the border ....................................................................................... 20.6Burdensome import procedures ...........................................................................19.5High cost or delays caused by domestic transportation ...................................... 16.3Tariffs .....................................................................................................................16.1High cost or delays caused by international transportation ..................................12.7Crime and theft ........................................................................................................6.1Domestic technical requirements and standards ................................................... 4.5Inappropriate telecommunications infrastructure ....................................................4.1
Angola
Sources: International Monetary Fund, World Bank, World Trade Organization, United Nations COMTRADE
Angola Least Developed Countries
Sub-Saharan Africa
© 2014 World Economic Forum

Country/Economy Profiles
The Global Enabling Trade Report 2014 | 55
* Indicator derived from the World Economic Forum’s Executive Opinion Survey and measured on a 1-to-7 scale, where 7 indicates best outcome.
The Enabling Trade Index 2014 in detail n Competitive Advantage n Competitive Disadvantage
For methodology, indicator descriptions and sources, and for a list of multiple best-performing economies, see page 45. Angola
INDICATOR, UNITS RANK/138 VALUE BEST PERFORMER VALUE
Pillar 1: Domestic market access (1–7) ......................................................... 116 ...........................3.6 Multiple economies (2) ................................ 7.0 1.01 Tariff rate (%)............................................................................................. 98 .......... n ..........9.3 Multiple economies (2) .............................0.0 1.02 Complexity of tariffs index (1–7) ................................................................ 42 .......... n ..........6.4 Multiple economies (2) .............................7.0
Tariff dispersion (standard deviation) ......................................................... 23 .......... n ..........6.7 Multiple economies (2) .............................0.0Tariff peaks (% of tariff lines) ..................................................................... 64 .......... n ..........2.7 Multiple economies (24) ...........................0.0Specific tariffs (% of tariff lines) ................................................................... 1 .......... n ..........0.0 Multiple economies (54) ...........................0.0Number of distinct tariffs ........................................................................... 25 .......... n .............6 Multiple economies (2) ................................1
1.03 Share of duty-free imports (%) ................................................................ 137 .......... n ..........0.0 Multiple economies (2) .........................100.0
Pillar 2: Foreign market access (1–7) .............................................................. 55 ...........................2.9 Cambodia ..................................................... 5.3 2.01 Tariffs faced (%) ........................................................................................ 29 .......... n ..........5.1 Chile .........................................................3.5 2.02 Index of margin of preference in destination mkts (0–100) ........................ 63 .......... n ........28.7 Mauritius ................................................97.1
Pillar 3: Efficiency and transparency of border administration (1–7) ............ 131 ...........................2.8 Singapore..................................................... 6.3 3.01 Customs services index (0–1) ................................................................. 107 .......... n ........0.27 Singapore...............................................0.97 3.02 Efficiency of the clearance process (1–5) ................................................ 106 .......... n ..........2.4 Norway ....................................................4.2 3.03 No. of days to import ............................................................................. 127 .......... n ...........43 Singapore....................................................4 3.04 No. of documents to import ................................................................... 101 .......... n .............9 Multiple economies (2) ................................2 3.05 Cost to import (US$ per container) ......................................................... 120 .......... n ......2,700 Singapore................................................440 3.06 No. of days to export.............................................................................. 128 .......... n ...........40 Multiple economies (5) ................................6 3.07 No. of documents to export ................................................................... 130 .......... n ...........10 Multiple economies (2) ................................2 3.08 Cost to export (US$ per container) ......................................................... 111 .......... n ......1,860 Malaysia ..................................................450 3.09 Irregular payments in exports and imports*............................................. 127 .......... n ..........2.2 New Zealand ............................................6.6 3.10 Time predictability of import procedures* ................................................ 130 .......... n ..........2.5 Finland .....................................................6.0 3.11 Customs transparency index (0–1) ......................................................... 100 .......... n ........0.57 Multiple economies (35) .........................1.00
Pillar 4: Availability and quality of transport infrastructure (1-7) ................... 134 ...........................2.1 United Arab Emirates ................................... 6.5 4.01 Available int’l airline seat km/week, millions .............................................. 77 .......... n ......103.3 United States ..................................11,481.7 4.02 Quality of air transport infrastructure* ...................................................... 110 .......... n ..........3.4 Singapore.................................................6.8 4.03 Quality of railroad infrastructure* ............................................................... 99 .......... n ..........1.7 Japan .......................................................6.7 4.04 Liner Shipping Connectivity Index (0–157.1) ............................................. 71 .......... n ........13.8 China ...................................................157.5 4.05 Quality of port infrastructure* .................................................................. 116 .......... n ..........2.9 Netherlands ..............................................6.8 4.06 Paved roads (% of total) ......................................................................... 125 .......... n ........10.4 Multiple economies (18) .......................100.0 4.07 Quality of roads* ..................................................................................... 130 .......... n ..........2.4 United Arab Emirates ...............................6.6
Pillar 5: Availability and quality of transport services (1–7) .......................... 134 ...........................2.9 Singapore..................................................... 5.7 5.01 Ease and affordability of shipment (1–5).................................................... 84 .......... n ..........2.8 Luxembourg .............................................3.8 5.02 Logistics competence (1–5) .................................................................... 123 .......... n ..........2.3 Norway ....................................................4.2 5.03 Tracking and tracing ability (1–5) ............................................................. 100 .......... n ..........2.6 Germany ..................................................4.2 5.04 Timeliness of shipments in reaching destination (1–5) ............................... 96 .......... n ..........3.0 Luxembourg .............................................4.7 5.05 Postal services efficiency* ....................................................................... 133 .......... n ..........1.7 Japan .......................................................6.8 5.06 Efficiency of transport mode change* ..................................................... 138 .......... n ..........1.8 Hong Kong SAR ......................................6.4
Pillar 6: Availability and use of ICTs (1–7) ...................................................... 129 ...........................2.0 Sweden ........................................................ 6.5 6.01 Mobile phone subscriptions/100 pop. .................................................... 129 .......... n ........47.1 Hong Kong SAR ..................................229.2 6.02 Individuals using Internet (%) .................................................................. 101 .......... n ........16.9 Iceland ...................................................96.2 6.03 Fixed broadband Internet subscriptions/100 pop. .................................. 116 .......... n ..........0.2 Switzerland ............................................39.9 6.04 Active mobile broadband Internet subscriptions/100 pop. ...................... 111 .......... n ..........1.5 Singapore.............................................124.5 6.05 ICT use for business-to-business transactions* ...................................... 135 .......... n ..........3.2 Finland .....................................................6.2 6.06 Internet use for business-to-consumer transactions* .............................. 131 .......... n ..........3.0 United Kingdom .......................................6.3 6.07 Government Online Service Index (0–1) .................................................. 103 .......... n ........0.33 Multiple economies (3) ...........................1.00
Pillar 7: Operating environment (1–7) ............................................................ 135 ...........................2.9 Hong Kong SAR ............................................ 5.8 7.01 Protection of property index (1–7) ........................................................... 132 .......... n ..........2.6 Finland .....................................................6.3
Property rights* ....................................................................................... 130 .......... n ..........2.8 Finland .....................................................6.4Intellectual property protection* .............................................................. 127 .......... n ..........2.4 Finland .....................................................6.2
7.02 Efficiency and accountability of public institutions index (1–7) ................. 117 .......... n ..........2.8 Singapore.................................................6.0Judicial efficiency & impartiality in commercial disputes (0–4).................... 77 .......... n ..........1.8 Multiple economies (7) .............................4.0Diversion of public funds* ....................................................................... 127 .......... n ..........2.2 New Zealand ............................................6.5Ease of compliance with government regulation* .................................... 119 .......... n ..........2.8 Singapore.................................................5.4
7.03 Access to finance index (1–7) ................................................................ 135 .......... n ..........2.4 Hong Kong SAR ......................................5.7Affordability of financial services* ........................................................... 128 .......... n ..........3.1 Hong Kong SAR ......................................6.1Availability of financial services* .............................................................. 138 .......... n ..........2.4 Switzerland ..............................................6.4Ease of access to loans* ........................................................................ 130 .......... n ..........1.7 Qatar ........................................................4.9Availability of trade finance* .................................................................... 136 .......... n ..........2.4 Hong Kong SAR ......................................5.8
7.04 Openness to foreign participation index (1–7) ......................................... 138 .......... n ..........2.5 Ireland ......................................................5.5Ease of hiring foreign labour* .................................................................. 127 .......... n ..........3.1 United Arab Emirates ...............................5.6Business impact of rules on FDI* ............................................................ 135 .......... n ..........2.5 Ireland ......................................................6.7Openness to multilateral trade rules (0–100) ........................................... 132 .......... n ........32.0 Slovenia .................................................92.2
7.05 Index of physical security (1–7) ............................................................... 116 .......... n ..........4.2 Qatar ........................................................6.8Reliability of police services* ................................................................... 117 .......... n ..........3.0 Finland .....................................................6.7Business costs of crime and violence* .................................................... 116 .......... n ..........3.4 Qatar ........................................................6.8Business costs of terrorism* ................................................................... 105 .......... n ..........4.7 Slovenia ...................................................6.7Homicide cases/100,000 pop. ............................................................... 121 .......... n ........19.0 Hong Kong SAR ......................................0.2Index of terrorism incidence (1-7) ............................................................. 85 .......... n ..........7.0 Multiple economies (48) ...........................7.0
© 2014 World Economic Forum

Country/Economy Profiles
56 | The Global Enabling Trade Report 2014
* From the list of factors above, respondents were asked to select the five most problematic for trading in their country and to rank them between 1 (most problematic) and 5. The bars in the figure show the responses weighted according to their rankings.
For methodology, indicator descriptions and sources, and for a list of multiple best-performing economies, see page 45.
0 105 15 20 25 30
0 5 10 15 20 25 30
2
3
4
5
6
7
Operating environment
Availability & use of ICTs
Availability & quality of transport services
Availability & quality of transport infrastructure
Efficiency & transparency of border administration
Foreign market access
Domestic market access
1
Enabling Trade Index 2014 Rank Score (out of 138) (1–7)
Enabling Trade Index 2014 .................... 95 ......3.7
Subindex A: Market access (25%) ....................55 .......3.8Pillar 1: Domestic market access .....................................90 .........4.4Pillar 2: Foreign market access ........................................44 ........ 3.2
Subindex B: Border administration (25%) ........96 .......3.7Pillar 3: Efficiency & transparency of border administration ...................................................96 .........3.7
Subindex C: Infrastructure (25%) ......................76 .......3.7Pillar 4: Availability & quality of transport infrastructure ...95 .........2.7Pillar 5: Availability & quality of transport services ...........73 .........4.0Pillar 6: Availability & use of ICTs .....................................55 .........4.4
Subindex D: Operating environment (25%) .... 124 .......3.4Pillar 7: Operating environment ...................................... 124 .........3.4
Key indicators, 2012 Rank/138
Population (millions) .............................................................41.0 ........... 31GDP (US$ billions) .............................................................475.2 ........... 26GDP per capita (US$) ...................................................11,582.5 ........... 53
Merchandise tradeTrade openness (imports+exports)/GDP .............................31.5 ......... 134Share of world trade (%) ..................................................... 0.40 ........... 45Total Exports (US$ billions) ................................................. 80.9 ........... 45Total Imports (US$ billions) ................................................. 68.5 ........... 45
Value chain indicators, 2012Share (%) of merchandise trade Exports Imports
Capital goods ......................................................................8.1 .........17.3
Intermediate goods .......................................................... 69.0 ........ 57.8Food and beverages (industrial) .................................... 17.8 .......... 0.6Industrial supplies (primary and processed) .................42.9 ........ 29.6Parts and accessories .....................................................3.7 ........ 20.6Fuels and lubricants ........................................................4.6 ...........7.1
Consumer goods .............................................................. 16.2 ........ 10.8Food and beverages (consumer) ...................................13.3 .......... 1.6Transport equipment and consumer goods ....................2.9 .......... 9.2
Passenger motor cars ........................................................ 5.0 .......... 7.9
Others ...................................................................................1.7 .......... 6.1
The most problematic factors for trade, 2013Most problematic factors for exporting Score*
Access to imported inputs at competitive prices ................................................. 20.8Access to trade finance .........................................................................................19.2High cost or delays caused by domestic transportation .......................................12.0Corruption at foreign borders ................................................................................. 8.8Inappropriate production technology and skills ...................................................... 8.7Burdensome procedures at foreign borders .......................................................... 8.2Identifying potential markets and buyers .................................................................5.7Difficulties in meeting quality/quantity requirements of buyers ............................... 5.0High cost or delays caused by international transportation ....................................4.7Tariff barriers abroad ...............................................................................................3.1Technical requirements and standards abroad ...................................................... 2.4Rules of origin requirements abroad ........................................................................1.4
Most problematic factors for importing Score*
Tariffs .................................................................................................................... 30.6Burdensome import procedures .......................................................................... 22.4Domestic technical requirements and standards ..................................................15.6Corruption at the border ........................................................................................12.9High cost or delays caused by international transportation ....................................9.1High cost or delays caused by domestic transportation ........................................ 4.8Crime and theft ....................................................................................................... 2.8Inappropriate telecommunications infrastructure ....................................................1.7
Argentina
Sources: International Monetary Fund, World Bank, World Trade Organization, United Nations COMTRADE
Argentina
South America
© 2014 World Economic Forum

Country/Economy Profiles
The Global Enabling Trade Report 2014 | 57
* Indicator derived from the World Economic Forum’s Executive Opinion Survey and measured on a 1-to-7 scale, where 7 indicates best outcome.
The Enabling Trade Index 2014 in detail n Competitive Advantage n Competitive Disadvantage
For methodology, indicator descriptions and sources, and for a list of multiple best-performing economies, see page 45. Argentina
INDICATOR, UNITS RANK/138 VALUE BEST PERFORMER VALUE
Pillar 1: Domestic market access (1–7) ........................................................... 90 ...........................4.4 Multiple economies (2) ................................ 7.0 1.01 Tariff rate (%)........................................................................................... 105 .......... n ........10.5 Multiple economies (2) .............................0.0 1.02 Complexity of tariffs index (1–7) ................................................................ 21 .......... n ..........6.6 Multiple economies (2) .............................7.0
Tariff dispersion (standard deviation) ......................................................... 53 .......... n ..........8.3 Multiple economies (2) .............................0.0Tariff peaks (% of tariff lines) ....................................................................... 1 .......... n ..........0.0 Multiple economies (24) ...........................0.0Specific tariffs (% of tariff lines) ................................................................... 1 .......... n ..........0.0 Multiple economies (54) ...........................0.0Number of distinct tariffs ........................................................................... 49 .......... n ...........17 Multiple economies (2) ................................1
1.03 Share of duty-free imports (%) .................................................................. 90 .......... n ........46.4 Multiple economies (2) .........................100.0
Pillar 2: Foreign market access (1–7) .............................................................. 44 ...........................3.2 Cambodia ..................................................... 5.3 2.01 Tariffs faced (%) ........................................................................................ 42 .......... n ..........5.3 Chile .........................................................3.5 2.02 Index of margin of preference in destination mkts (0–100) ........................ 41 .......... n ........44.9 Mauritius ................................................97.1
Pillar 3: Efficiency and transparency of border administration (1–7) .............. 96 ...........................3.7 Singapore..................................................... 6.3 3.01 Customs services index (0–1) ................................................................... 69 .......... n ........0.56 Singapore...............................................0.97 3.02 Efficiency of the clearance process (1–5) .................................................. 84 .......... n ..........2.5 Norway ....................................................4.2 3.03 No. of days to import ............................................................................. 106 .......... n ...........30 Singapore....................................................4 3.04 No. of documents to import ..................................................................... 82 .......... n .............8 Multiple economies (2) ................................2 3.05 Cost to import (US$ per container) ......................................................... 112 .......... n ......2,260 Singapore................................................440 3.06 No. of days to export................................................................................ 41 .......... n ...........12 Multiple economies (5) ................................6 3.07 No. of documents to export ..................................................................... 65 .......... n .............6 Multiple economies (2) ................................2 3.08 Cost to export (US$ per container) ......................................................... 105 .......... n ......1,650 Malaysia ..................................................450 3.09 Irregular payments in exports and imports*............................................. 124 .......... n ..........2.3 New Zealand ............................................6.6 3.10 Time predictability of import procedures* ................................................ 134 .......... n ..........1.9 Finland .....................................................6.0 3.11 Customs transparency index (0–1) ........................................................... 59 .......... n ........0.80 Multiple economies (35) .........................1.00
Pillar 4: Availability and quality of transport infrastructure (1-7) ..................... 95 ...........................2.7 United Arab Emirates ................................... 6.5 4.01 Available int’l airline seat km/week, millions .............................................. 32 .......... n ......576.9 United States ..................................11,481.7 4.02 Quality of air transport infrastructure* ...................................................... 103 .......... n ..........3.6 Singapore.................................................6.8 4.03 Quality of railroad infrastructure* ............................................................... 98 .......... n ..........1.7 Japan .......................................................6.7 4.04 Liner Shipping Connectivity Index (0–157.1) ............................................. 40 .......... n ........33.5 China ...................................................157.5 4.05 Quality of port infrastructure* .................................................................... 91 .......... n ..........3.7 Netherlands ..............................................6.8 4.06 Paved roads (% of total) ........................................................................... 86 .......... n ........30.0 Multiple economies (18) .......................100.0 4.07 Quality of roads* ....................................................................................... 95 .......... n ..........3.1 United Arab Emirates ...............................6.6
Pillar 5: Availability and quality of transport services (1–7) ............................ 73 ...........................4.0 Singapore..................................................... 5.7 5.01 Ease and affordability of shipment (1–5).................................................... 65 .......... n ..........3.0 Luxembourg .............................................3.8 5.02 Logistics competence (1–5) ...................................................................... 62 .......... n ..........2.9 Norway ....................................................4.2 5.03 Tracking and tracing ability (1–5) ............................................................... 53 .......... n ..........3.2 Germany ..................................................4.2 5.04 Timeliness of shipments in reaching destination (1–5) ............................... 58 .......... n ..........3.5 Luxembourg .............................................4.7 5.05 Postal services efficiency* ......................................................................... 85 .......... n ..........4.1 Japan .......................................................6.8 5.06 Efficiency of transport mode change* ..................................................... 122 .......... n ..........2.9 Hong Kong SAR ......................................6.4
Pillar 6: Availability and use of ICTs (1–7) ........................................................ 55 ...........................4.4 Sweden ........................................................ 6.5 6.01 Mobile phone subscriptions/100 pop. ...................................................... 19 .......... n ......151.9 Hong Kong SAR ..................................229.2 6.02 Individuals using Internet (%) .................................................................... 51 .......... n ........55.8 Iceland ...................................................96.2 6.03 Fixed broadband Internet subscriptions/100 pop. .................................... 52 .......... n ........10.9 Switzerland ............................................39.9 6.04 Active mobile broadband Internet subscriptions/100 pop. ........................ 77 .......... n ........12.4 Singapore.............................................124.5 6.05 ICT use for business-to-business transactions* ...................................... 100 .......... n ..........4.4 Finland .....................................................6.2 6.06 Internet use for business-to-consumer transactions* ................................ 67 .......... n ..........4.6 United Kingdom .......................................6.3 6.07 Government Online Service Index (0–1) .................................................... 59 .......... n ........0.53 Multiple economies (3) ...........................1.00
Pillar 7: Operating environment (1–7) ............................................................ 124 ...........................3.4 Hong Kong SAR ............................................ 5.8 7.01 Protection of property index (1–7) ........................................................... 135 .......... n ..........2.4 Finland .....................................................6.3
Property rights* ....................................................................................... 135 .......... n ..........2.5 Finland .....................................................6.4Intellectual property protection* .............................................................. 129 .......... n ..........2.3 Finland .....................................................6.2
7.02 Efficiency and accountability of public institutions index (1–7) ................. 111 .......... n ..........3.0 Singapore.................................................6.0Judicial efficiency & impartiality in commercial disputes (0–4).................... 44 .......... n ..........2.5 Multiple economies (7) .............................4.0Diversion of public funds* ....................................................................... 135 .......... n ..........1.8 New Zealand ............................................6.5Ease of compliance with government regulation* .................................... 131 .......... n ..........2.3 Singapore.................................................5.4
7.03 Access to finance index (1–7) ................................................................ 133 .......... n ..........2.6 Hong Kong SAR ......................................5.7Affordability of financial services* ........................................................... 133 .......... n ..........2.9 Hong Kong SAR ......................................6.1Availability of financial services* .............................................................. 127 .......... n ..........3.1 Switzerland ..............................................6.4Ease of access to loans* ........................................................................ 133 .......... n ..........1.7 Qatar ........................................................4.9Availability of trade finance* .................................................................... 129 .......... n ..........2.6 Hong Kong SAR ......................................5.8
7.04 Openness to foreign participation index (1–7) ......................................... 112 .......... n ..........3.7 Ireland ......................................................5.5Ease of hiring foreign labour* .................................................................... 54 .......... n ..........4.2 United Arab Emirates ...............................5.6Business impact of rules on FDI* ............................................................ 137 .......... n ..........2.0 Ireland ......................................................6.7Openness to multilateral trade rules (0–100) ............................................. 46 .......... n ........71.3 Slovenia .................................................92.2
7.05 Index of physical security (1–7) ................................................................. 78 .......... n ..........5.3 Qatar ........................................................6.8Reliability of police services* ................................................................... 129 .......... n ..........2.8 Finland .....................................................6.7Business costs of crime and violence* .................................................... 109 .......... n ..........3.6 Qatar ........................................................6.8Business costs of terrorism* ..................................................................... 23 .......... n ..........6.2 Slovenia ...................................................6.7Homicide cases/100,000 pop. ................................................................. 85 .......... n ..........5.5 Hong Kong SAR ......................................0.2Index of terrorism incidence (1-7) ............................................................. 87 .......... n ..........6.9 Multiple economies (48) ...........................7.0
© 2014 World Economic Forum
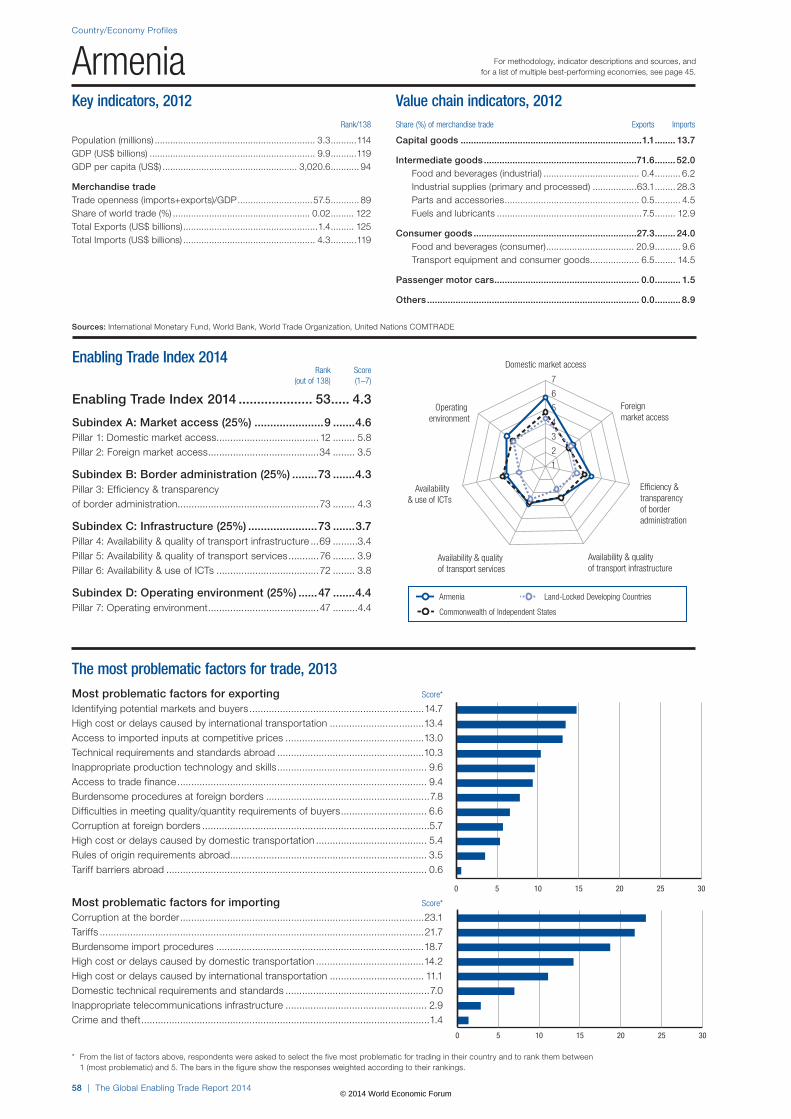
Country/Economy Profiles
58 | The Global Enabling Trade Report 2014
* From the list of factors above, respondents were asked to select the five most problematic for trading in their country and to rank them between 1 (most problematic) and 5. The bars in the figure show the responses weighted according to their rankings.
For methodology, indicator descriptions and sources, and for a list of multiple best-performing economies, see page 45.
0 105 15 20 25 30
0 5 10 15 20 25 30
2
3
4
5
6
7
Operating environment
Availability & use of ICTs
Availability & quality of transport services
Availability & quality of transport infrastructure
Efficiency & transparency of border administration
Foreign market access
Domestic market access
1
Enabling Trade Index 2014 Rank Score (out of 138) (1–7)
Enabling Trade Index 2014 .................... 53 ..... 4.3
Subindex A: Market access (25%) ......................9 .......4.6Pillar 1: Domestic market access .....................................12 ........ 5.8Pillar 2: Foreign market access ........................................34 ........ 3.5
Subindex B: Border administration (25%) ........73 .......4.3Pillar 3: Efficiency & transparency of border administration ...................................................73 ........ 4.3
Subindex C: Infrastructure (25%) ......................73 .......3.7Pillar 4: Availability & quality of transport infrastructure ...69 .........3.4Pillar 5: Availability & quality of transport services ...........76 ........ 3.9Pillar 6: Availability & use of ICTs .....................................72 ........ 3.8
Subindex D: Operating environment (25%) ......47 .......4.4Pillar 7: Operating environment ........................................47 .........4.4
Key indicators, 2012 Rank/138
Population (millions) .............................................................. 3.3 ..........114GDP (US$ billions) ................................................................ 9.9 ..........119GDP per capita (US$) .................................................... 3,020.6 ........... 94
Merchandise tradeTrade openness (imports+exports)/GDP .............................57.5 ........... 89Share of world trade (%) ..................................................... 0.02 ......... 122Total Exports (US$ billions) ....................................................1.4 ......... 125Total Imports (US$ billions) ................................................... 4.3 ..........119
Value chain indicators, 2012Share (%) of merchandise trade Exports Imports
Capital goods ......................................................................1.1 ........ 13.7
Intermediate goods ...........................................................71.6 ........52.0Food and beverages (industrial) ..................................... 0.4 .......... 6.2Industrial supplies (primary and processed) .................63.1 ........ 28.3Parts and accessories .................................................... 0.5 .......... 4.5Fuels and lubricants ........................................................7.5 ........ 12.9
Consumer goods ...............................................................27.3 ........ 24.0Food and beverages (consumer) .................................. 20.9 .......... 9.6Transport equipment and consumer goods ................... 6.5 ........ 14.5
Passenger motor cars ........................................................ 0.0 .......... 1.5
Others .................................................................................. 0.0 ..........8.9
The most problematic factors for trade, 2013Most problematic factors for exporting Score*
Identifying potential markets and buyers ...............................................................14.7High cost or delays caused by international transportation ..................................13.4Access to imported inputs at competitive prices ..................................................13.0Technical requirements and standards abroad .....................................................10.3Inappropriate production technology and skills ...................................................... 9.6Access to trade finance .......................................................................................... 9.4Burdensome procedures at foreign borders ...........................................................7.8Difficulties in meeting quality/quantity requirements of buyers ............................... 6.6Corruption at foreign borders ..................................................................................5.7High cost or delays caused by domestic transportation ........................................ 5.4Rules of origin requirements abroad ....................................................................... 3.5Tariff barriers abroad .............................................................................................. 0.6
Most problematic factors for importing Score*
Corruption at the border ........................................................................................23.1Tariffs .....................................................................................................................21.7Burdensome import procedures ...........................................................................18.7High cost or delays caused by domestic transportation .......................................14.2High cost or delays caused by international transportation .................................. 11.1Domestic technical requirements and standards ....................................................7.0Inappropriate telecommunications infrastructure ................................................... 2.9Crime and theft ........................................................................................................1.4
Armenia
Sources: International Monetary Fund, World Bank, World Trade Organization, United Nations COMTRADE
Armenia Land-Locked Developing Countries
Commonwealth of Independent States
© 2014 World Economic Forum

Country/Economy Profiles
The Global Enabling Trade Report 2014 | 59
* Indicator derived from the World Economic Forum’s Executive Opinion Survey and measured on a 1-to-7 scale, where 7 indicates best outcome.
The Enabling Trade Index 2014 in detail n Competitive Advantage n Competitive Disadvantage
For methodology, indicator descriptions and sources, and for a list of multiple best-performing economies, see page 45. Armenia
INDICATOR, UNITS RANK/138 VALUE BEST PERFORMER VALUE
Pillar 1: Domestic market access (1–7) ........................................................... 12 ...........................5.8 Multiple economies (2) ................................ 7.0 1.01 Tariff rate (%)............................................................................................. 39 .......... n ..........2.8 Multiple economies (2) .............................0.0 1.02 Complexity of tariffs index (1–7) ................................................................ 40 .......... n ..........6.5 Multiple economies (2) .............................7.0
Tariff dispersion (standard deviation) ......................................................... 10 .......... n ..........4.8 Multiple economies (2) .............................0.0Tariff peaks (% of tariff lines) ..................................................................... 37 .......... n ..........0.4 Multiple economies (24) ...........................0.0Specific tariffs (% of tariff lines) ................................................................. 83 .......... n ..........1.6 Multiple economies (54) ...........................0.0Number of distinct tariffs ........................................................................... 82 .......... n .........166 Multiple economies (2) ................................1
1.03 Share of duty-free imports (%) .................................................................. 34 .......... n ........69.0 Multiple economies (2) .........................100.0
Pillar 2: Foreign market access (1–7) .............................................................. 34 ...........................3.5 Cambodia ..................................................... 5.3 2.01 Tariffs faced (%) ........................................................................................ 62 .......... n ..........5.4 Chile .........................................................3.5 2.02 Index of margin of preference in destination mkts (0–100) ........................ 17 .......... n ........57.8 Mauritius ................................................97.1
Pillar 3: Efficiency and transparency of border administration (1–7) .............. 73 ...........................4.3 Singapore..................................................... 6.3 3.01 Customs services index (0–1) ................................................................... 63 .......... n ........0.59 Singapore...............................................0.97 3.02 Efficiency of the clearance process (1–5) .................................................. 75 .......... n ..........2.6 Norway ....................................................4.2 3.03 No. of days to import ............................................................................... 74 .......... n ...........18 Singapore....................................................4 3.04 No. of documents to import ..................................................................... 82 .......... n .............8 Multiple economies (2) ................................2 3.05 Cost to import (US$ per container) ......................................................... 109 .......... n ......2,175 Singapore................................................440 3.06 No. of days to export................................................................................ 63 .......... n ...........16 Multiple economies (5) ................................6 3.07 No. of documents to export ..................................................................... 40 .......... n .............5 Multiple economies (2) ................................2 3.08 Cost to export (US$ per container) ......................................................... 112 .......... n ......1,885 Malaysia ..................................................450 3.09 Irregular payments in exports and imports*............................................... 91 .......... n ..........3.0 New Zealand ............................................6.6 3.10 Time predictability of import procedures* .................................................. 81 .......... n ..........3.7 Finland .....................................................6.0 3.11 Customs transparency index (0–1) ........................................................... 39 .......... n ........0.90 Multiple economies (35) .........................1.00
Pillar 4: Availability and quality of transport infrastructure (1-7) ..................... 69 ...........................3.4 United Arab Emirates ................................... 6.5 4.01 Available int’l airline seat km/week, millions .............................................. 99 .......... n ........43.4 United States ..................................11,481.7 4.02 Quality of air transport infrastructure* ........................................................ 61 .......... n ..........4.5 Singapore.................................................6.8 4.03 Quality of railroad infrastructure* ............................................................... 64 .......... n ..........2.6 Japan .......................................................6.7 4.04 Liner Shipping Connectivity Index (0–157.1) ............................................ n/a ........................n/a China ...................................................157.5 4.05 Quality of port infrastructure* .................................................................. 113 .......... n ..........3.0 Netherlands ..............................................6.8 4.06 Paved roads (% of total) ........................................................................... 25 .......... n ........93.6 Multiple economies (18) .......................100.0 4.07 Quality of roads* ....................................................................................... 74 .......... n ..........3.7 United Arab Emirates ...............................6.6
Pillar 5: Availability and quality of transport services (1–7) ............................ 76 ...........................3.9 Singapore..................................................... 5.7 5.01 Ease and affordability of shipment (1–5).................................................... 90 .......... n ..........2.8 Luxembourg .............................................3.8 5.02 Logistics competence (1–5) ...................................................................... 78 .......... n ..........2.8 Norway ....................................................4.2 5.03 Tracking and tracing ability (1–5) ............................................................. 109 .......... n ..........2.5 Germany ..................................................4.2 5.04 Timeliness of shipments in reaching destination (1–5) ............................... 98 .......... n ..........3.0 Luxembourg .............................................4.7 5.05 Postal services efficiency* ......................................................................... 55 .......... n ..........4.9 Japan .......................................................6.8 5.06 Efficiency of transport mode change* ....................................................... 68 .......... n ..........4.0 Hong Kong SAR ......................................6.4
Pillar 6: Availability and use of ICTs (1–7) ........................................................ 72 ...........................3.8 Sweden ........................................................ 6.5 6.01 Mobile phone subscriptions/100 pop. ...................................................... 61 .......... n ......111.9 Hong Kong SAR ..................................229.2 6.02 Individuals using Internet (%) .................................................................... 79 .......... n ........39.2 Iceland ...................................................96.2 6.03 Fixed broadband Internet subscriptions/100 pop. .................................... 70 .......... n ..........6.7 Switzerland ............................................39.9 6.04 Active mobile broadband Internet subscriptions/100 pop. ........................ 54 .......... n ........28.9 Singapore.............................................124.5 6.05 ICT use for business-to-business transactions* ........................................ 47 .......... n ..........5.2 Finland .....................................................6.2 6.06 Internet use for business-to-consumer transactions* ................................ 76 .......... n ..........4.4 United Kingdom .......................................6.3 6.07 Government Online Service Index (0–1) .................................................. 105 .......... n ........0.33 Multiple economies (3) ...........................1.00
Pillar 7: Operating environment (1–7) .............................................................. 47 ...........................4.4 Hong Kong SAR ............................................ 5.8 7.01 Protection of property index (1–7) ............................................................. 56 .......... n ..........4.1 Finland .....................................................6.3
Property rights* ......................................................................................... 51 .......... n ..........4.6 Finland .....................................................6.4Intellectual property protection* ................................................................ 70 .......... n ..........3.6 Finland .....................................................6.2
7.02 Efficiency and accountability of public institutions index (1–7) ................... 83 .......... n ..........3.4 Singapore.................................................6.0Judicial efficiency & impartiality in commercial disputes (0–4).................. 100 .......... n ..........1.5 Multiple economies (7) .............................4.0Diversion of public funds* ......................................................................... 76 .......... n ..........3.1 New Zealand ............................................6.5Ease of compliance with government regulation* ...................................... 30 .......... n ..........3.9 Singapore.................................................5.4
7.03 Access to finance index (1–7) .................................................................. 60 .......... n ..........3.9 Hong Kong SAR ......................................5.7Affordability of financial services* ............................................................. 48 .......... n ..........4.4 Hong Kong SAR ......................................6.1Availability of financial services* ................................................................ 60 .......... n ..........4.6 Switzerland ..............................................6.4Ease of access to loans* .......................................................................... 84 .......... n ..........2.6 Qatar ........................................................4.9Availability of trade finance* ...................................................................... 60 .......... n ..........3.9 Hong Kong SAR ......................................5.8
7.04 Openness to foreign participation index (1–7) ........................................... 22 .......... n ..........4.9 Ireland ......................................................5.5Ease of hiring foreign labour* ...................................................................... 6 .......... n ..........5.1 United Arab Emirates ...............................5.6Business impact of rules on FDI* .............................................................. 87 .......... n ..........4.3 Ireland ......................................................6.7Openness to multilateral trade rules (0–100) ............................................. 35 .......... n ........75.4 Slovenia .................................................92.2
7.05 Index of physical security (1–7) ................................................................. 39 .......... n ..........6.0 Qatar ........................................................6.8Reliability of police services* ..................................................................... 70 .......... n ..........4.0 Finland .....................................................6.7Business costs of crime and violence* ...................................................... 19 .......... n ..........5.7 Qatar ........................................................6.8Business costs of terrorism* ..................................................................... 36 .......... n ..........6.1 Slovenia ...................................................6.7Homicide cases/100,000 pop. ................................................................. 39 .......... n ..........1.4 Hong Kong SAR ......................................0.2Index of terrorism incidence (1-7) ............................................................... 1 .......... n ..........7.0 Multiple economies (48) ...........................7.0
© 2014 World Economic Forum

Country/Economy Profiles
60 | The Global Enabling Trade Report 2014
* From the list of factors above, respondents were asked to select the five most problematic for trading in their country and to rank them between 1 (most problematic) and 5. The bars in the figure show the responses weighted according to their rankings.
For methodology, indicator descriptions and sources, and for a list of multiple best-performing economies, see page 45.
0 105 15 20 25 30
0 5 10 15 20 25 30
2
3
4
5
6
7
Operating environment
Availability & use of ICTs
Availability & quality of transport services
Availability & quality of transport infrastructure
Efficiency & transparency of border administration
Foreign market access
Domestic market access
1
Enabling Trade Index 2014 Rank Score (out of 138) (1–7)
Enabling Trade Index 2014 .................... 23 ..... 4.9
Subindex A: Market access (25%) .................... 74 .......3.4Pillar 1: Domestic market access .....................................18 .........5.6Pillar 2: Foreign market access ......................................134 .........1.2
Subindex B: Border administration (25%) ........22 .......5.6Pillar 3: Efficiency & transparency of border administration ...................................................22 .........5.6
Subindex C: Infrastructure (25%) ......................20 .......5.2Pillar 4: Availability & quality of transport infrastructure ...24 ........ 4.5Pillar 5: Availability & quality of transport services ...........20 ........ 5.3Pillar 6: Availability & use of ICTs .....................................15 ........ 5.9
Subindex D: Operating environment (25%) ......19 .......5.2Pillar 7: Operating environment ........................................19 ........ 5.2
Key indicators, 2012 Rank/138
Population (millions) ............................................................ 22.9 ........... 46GDP (US$ billions) .......................................................... 1,541.7 ........... 12GDP per capita (US$) ...................................................67,304.5 ............. 5
Merchandise tradeTrade openness (imports+exports)/GDP .............................34.1 ......... 131Share of world trade (%) ......................................................1.40 ........... 21Total Exports (US$ billions) ................................................256.7 ........... 21Total Imports (US$ billions) ............................................... 260.9 ........... 19
Value chain indicators, 2012Share (%) of merchandise trade Exports Imports
Capital goods ..................................................................... 2.8 ........23.4
Intermediate goods .......................................................... 85.2 ........40.8Food and beverages (industrial) ..................................... 5.0 .......... 0.5Industrial supplies (primary and processed) .................49.1 ........ 19.6Parts and accessories .....................................................2.9 ........ 10.4Fuels and lubricants ..................................................... 28.2 ........ 10.3
Consumer goods ................................................................ 9.9 ........ 21.2Food and beverages (consumer) .....................................6.7 .......... 4.2Transport equipment and consumer goods ................... 3.2 .........17.0
Passenger motor cars ........................................................ 0.7 .......... 7.2
Others ...................................................................................1.4 .......... 7.5
The most problematic factors for trade, 2013Most problematic factors for exporting Score*
Identifying potential markets and buyers ............................................................... 17.4High cost or delays caused by international transportation ..................................13.3Access to imported inputs at competitive prices ..................................................11.2Tariff barriers abroad .............................................................................................10.8Burdensome procedures at foreign borders .......................................................... 9.2Rules of origin requirements abroad ....................................................................... 8.5Access to trade finance .......................................................................................... 6.8High cost or delays caused by domestic transportation ........................................ 5.8Technical requirements and standards abroad .......................................................4.7Difficulties in meeting quality/quantity requirements of buyers ................................4.7Inappropriate production technology and skills ...................................................... 4.3Corruption at foreign borders ................................................................................. 3.4
Most problematic factors for importing Score*
Burdensome import procedures ...........................................................................24.6High cost or delays caused by international transportation ..................................19.7Tariffs .....................................................................................................................16.5Domestic technical requirements and standards ..................................................15.3High cost or delays caused by domestic transportation .......................................13.6Inappropriate telecommunications infrastructure ................................................... 4.6Corruption at the border ......................................................................................... 3.6Crime and theft ....................................................................................................... 2.2
Australia
Sources: International Monetary Fund, World Bank, World Trade Organization, United Nations COMTRADE
Australia
Advanced economies
© 2014 World Economic Forum
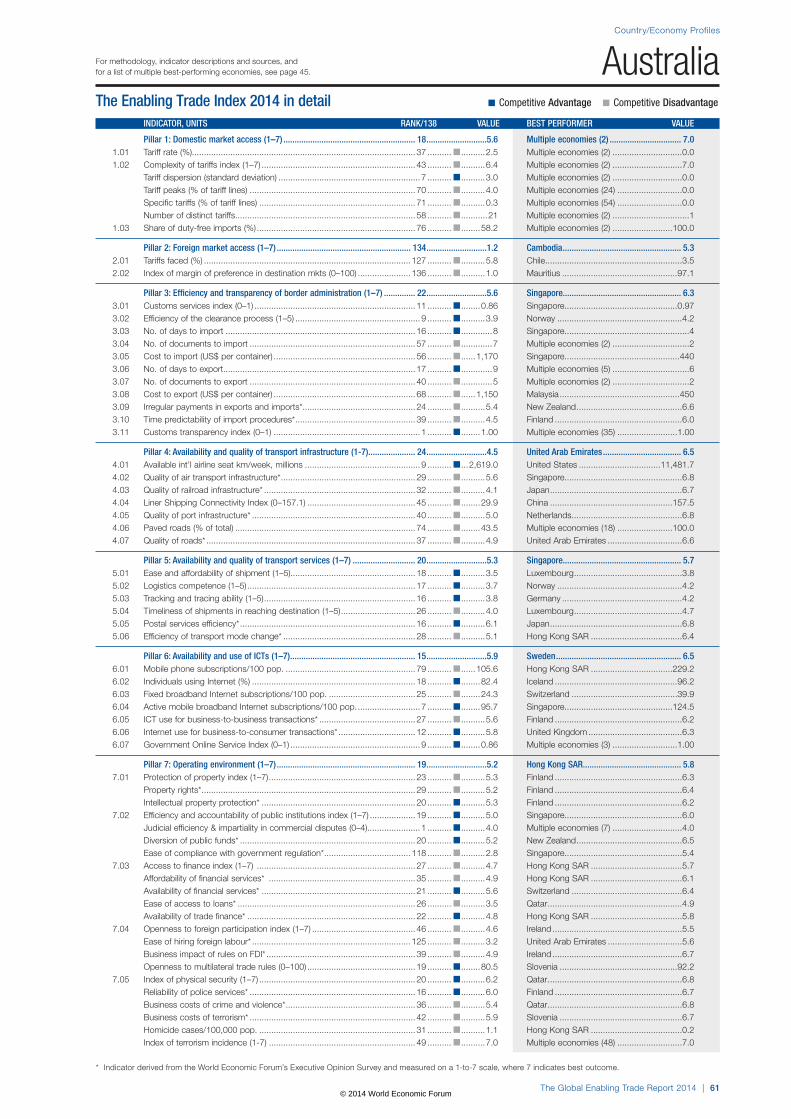
Country/Economy Profiles
The Global Enabling Trade Report 2014 | 61
* Indicator derived from the World Economic Forum’s Executive Opinion Survey and measured on a 1-to-7 scale, where 7 indicates best outcome.
The Enabling Trade Index 2014 in detail n Competitive Advantage n Competitive Disadvantage
For methodology, indicator descriptions and sources, and for a list of multiple best-performing economies, see page 45. Australia
INDICATOR, UNITS RANK/138 VALUE BEST PERFORMER VALUE
Pillar 1: Domestic market access (1–7) ........................................................... 18 ...........................5.6 Multiple economies (2) ................................ 7.0 1.01 Tariff rate (%)............................................................................................. 37 .......... n ..........2.5 Multiple economies (2) .............................0.0 1.02 Complexity of tariffs index (1–7) ................................................................ 43 .......... n ..........6.4 Multiple economies (2) .............................7.0
Tariff dispersion (standard deviation) ........................................................... 7 .......... n ..........3.0 Multiple economies (2) .............................0.0Tariff peaks (% of tariff lines) ..................................................................... 70 .......... n ..........4.0 Multiple economies (24) ...........................0.0Specific tariffs (% of tariff lines) ................................................................. 71 .......... n ..........0.3 Multiple economies (54) ...........................0.0Number of distinct tariffs ........................................................................... 58 .......... n ...........21 Multiple economies (2) ................................1
1.03 Share of duty-free imports (%) .................................................................. 76 .......... n ........58.2 Multiple economies (2) .........................100.0
Pillar 2: Foreign market access (1–7) ............................................................ 134 ...........................1.2 Cambodia ..................................................... 5.3 2.01 Tariffs faced (%) ...................................................................................... 127 .......... n ..........5.8 Chile .........................................................3.5 2.02 Index of margin of preference in destination mkts (0–100) ...................... 136 .......... n ..........1.0 Mauritius ................................................97.1
Pillar 3: Efficiency and transparency of border administration (1–7) .............. 22 ...........................5.6 Singapore..................................................... 6.3 3.01 Customs services index (0–1) ................................................................... 11 .......... n ........0.86 Singapore...............................................0.97 3.02 Efficiency of the clearance process (1–5) .................................................... 9 .......... n ..........3.9 Norway ....................................................4.2 3.03 No. of days to import ............................................................................... 16 .......... n .............8 Singapore....................................................4 3.04 No. of documents to import ..................................................................... 57 .......... n .............7 Multiple economies (2) ................................2 3.05 Cost to import (US$ per container) ........................................................... 56 .......... n ......1,170 Singapore................................................440 3.06 No. of days to export................................................................................ 17 .......... n .............9 Multiple economies (5) ................................6 3.07 No. of documents to export ..................................................................... 40 .......... n .............5 Multiple economies (2) ................................2 3.08 Cost to export (US$ per container) ........................................................... 68 .......... n ......1,150 Malaysia ..................................................450 3.09 Irregular payments in exports and imports*............................................... 24 .......... n ..........5.4 New Zealand ............................................6.6 3.10 Time predictability of import procedures* .................................................. 39 .......... n ..........4.5 Finland .....................................................6.0 3.11 Customs transparency index (0–1) ............................................................. 1 .......... n ........1.00 Multiple economies (35) .........................1.00
Pillar 4: Availability and quality of transport infrastructure (1-7) ..................... 24 ...........................4.5 United Arab Emirates ................................... 6.5 4.01 Available int’l airline seat km/week, millions ................................................ 9 .......... n ...2,619.0 United States ..................................11,481.7 4.02 Quality of air transport infrastructure* ........................................................ 29 .......... n ..........5.6 Singapore.................................................6.8 4.03 Quality of railroad infrastructure* ............................................................... 32 .......... n ..........4.1 Japan .......................................................6.7 4.04 Liner Shipping Connectivity Index (0–157.1) ............................................. 45 .......... n ........29.9 China ...................................................157.5 4.05 Quality of port infrastructure* .................................................................... 40 .......... n ..........5.0 Netherlands ..............................................6.8 4.06 Paved roads (% of total) ........................................................................... 74 .......... n ........43.5 Multiple economies (18) .......................100.0 4.07 Quality of roads* ....................................................................................... 37 .......... n ..........4.9 United Arab Emirates ...............................6.6
Pillar 5: Availability and quality of transport services (1–7) ............................ 20 ...........................5.3 Singapore..................................................... 5.7 5.01 Ease and affordability of shipment (1–5).................................................... 18 .......... n ..........3.5 Luxembourg .............................................3.8 5.02 Logistics competence (1–5) ...................................................................... 17 .......... n ..........3.7 Norway ....................................................4.2 5.03 Tracking and tracing ability (1–5) ............................................................... 16 .......... n ..........3.8 Germany ..................................................4.2 5.04 Timeliness of shipments in reaching destination (1–5) ............................... 26 .......... n ..........4.0 Luxembourg .............................................4.7 5.05 Postal services efficiency* ......................................................................... 16 .......... n ..........6.1 Japan .......................................................6.8 5.06 Efficiency of transport mode change* ....................................................... 28 .......... n ..........5.1 Hong Kong SAR ......................................6.4
Pillar 6: Availability and use of ICTs (1–7) ........................................................ 15 ...........................5.9 Sweden ........................................................ 6.5 6.01 Mobile phone subscriptions/100 pop. ...................................................... 79 .......... n ......105.6 Hong Kong SAR ..................................229.2 6.02 Individuals using Internet (%) .................................................................... 18 .......... n ........82.4 Iceland ...................................................96.2 6.03 Fixed broadband Internet subscriptions/100 pop. .................................... 25 .......... n ........24.3 Switzerland ............................................39.9 6.04 Active mobile broadband Internet subscriptions/100 pop. .......................... 7 .......... n ........95.7 Singapore.............................................124.5 6.05 ICT use for business-to-business transactions* ........................................ 27 .......... n ..........5.6 Finland .....................................................6.2 6.06 Internet use for business-to-consumer transactions* ................................ 12 .......... n ..........5.8 United Kingdom .......................................6.3 6.07 Government Online Service Index (0–1) ...................................................... 9 .......... n ........0.86 Multiple economies (3) ...........................1.00
Pillar 7: Operating environment (1–7) .............................................................. 19 ...........................5.2 Hong Kong SAR ............................................ 5.8 7.01 Protection of property index (1–7) ............................................................. 23 .......... n ..........5.3 Finland .....................................................6.3
Property rights* ......................................................................................... 29 .......... n ..........5.2 Finland .....................................................6.4Intellectual property protection* ................................................................ 20 .......... n ..........5.3 Finland .....................................................6.2
7.02 Efficiency and accountability of public institutions index (1–7) ................... 19 .......... n ..........5.0 Singapore.................................................6.0Judicial efficiency & impartiality in commercial disputes (0–4)...................... 1 .......... n ..........4.0 Multiple economies (7) .............................4.0Diversion of public funds* ......................................................................... 20 .......... n ..........5.2 New Zealand ............................................6.5Ease of compliance with government regulation* .................................... 118 .......... n ..........2.8 Singapore.................................................5.4
7.03 Access to finance index (1–7) .................................................................. 27 .......... n ..........4.7 Hong Kong SAR ......................................5.7Affordability of financial services* ............................................................. 35 .......... n ..........4.9 Hong Kong SAR ......................................6.1Availability of financial services* ................................................................ 21 .......... n ..........5.6 Switzerland ..............................................6.4Ease of access to loans* .......................................................................... 26 .......... n ..........3.5 Qatar ........................................................4.9Availability of trade finance* ...................................................................... 22 .......... n ..........4.8 Hong Kong SAR ......................................5.8
7.04 Openness to foreign participation index (1–7) ........................................... 46 .......... n ..........4.6 Ireland ......................................................5.5Ease of hiring foreign labour* .................................................................. 125 .......... n ..........3.2 United Arab Emirates ...............................5.6Business impact of rules on FDI* .............................................................. 39 .......... n ..........4.9 Ireland ......................................................6.7Openness to multilateral trade rules (0–100) ............................................. 19 .......... n ........80.5 Slovenia .................................................92.2
7.05 Index of physical security (1–7) ................................................................. 20 .......... n ..........6.2 Qatar ........................................................6.8Reliability of police services* ..................................................................... 16 .......... n ..........6.0 Finland .....................................................6.7Business costs of crime and violence* ...................................................... 36 .......... n ..........5.4 Qatar ........................................................6.8Business costs of terrorism* ..................................................................... 42 .......... n ..........5.9 Slovenia ...................................................6.7Homicide cases/100,000 pop. ................................................................. 31 .......... n ..........1.1 Hong Kong SAR ......................................0.2Index of terrorism incidence (1-7) ............................................................. 49 .......... n ..........7.0 Multiple economies (48) ...........................7.0
© 2014 World Economic Forum

Country/Economy Profiles
62 | The Global Enabling Trade Report 2014
* From the list of factors above, respondents were asked to select the five most problematic for trading in their country and to rank them between 1 (most problematic) and 5. The bars in the figure show the responses weighted according to their rankings.
For methodology, indicator descriptions and sources, and for a list of multiple best-performing economies, see page 45.
0 105 15 20 25 30
0 5 10 15 20 25 30
2
3
4
5
6
7
Operating environment
Availability & use of ICTs
Availability & quality of transport services
Availability & quality of transport infrastructure
Efficiency & transparency of border administration
Foreign market access
Domestic market access
1
Enabling Trade Index 2014 Rank Score (out of 138) (1–7)
Enabling Trade Index 2014 .....................18 ..... 5.0
Subindex A: Market access (25%) ....................75 .......3.4Pillar 1: Domestic market access .....................................46 .........4.9Pillar 2: Foreign market access ........................................97 .........1.9
Subindex B: Border administration (25%) ........10 .......5.8Pillar 3: Efficiency & transparency of border administration ...................................................10 ........ 5.8
Subindex C: Infrastructure (25%) ......................19 .......5.3Pillar 4: Availability & quality of transport infrastructure ...18 .........5.0Pillar 5: Availability & quality of transport services ...........23 ........ 5.2Pillar 6: Availability & use of ICTs .....................................18 ........ 5.8
Subindex D: Operating environment (25%) ...... 14 .......5.3Pillar 7: Operating environment ........................................ 14 ........ 5.3
Key indicators, 2012 Rank/138
Population (millions) .............................................................. 8.5 ........... 82GDP (US$ billions) ............................................................ 394.9 ........... 28GDP per capita (US$) .................................................. 46,642.9 ........... 13
Merchandise tradeTrade openness (imports+exports)/GDP ............................ 86.2 ........... 40Share of world trade (%) ..................................................... 0.93 ........... 29Total Exports (US$ billions) ................................................166.4 ........... 29Total Imports (US$ billions) ................................................178.4 ........... 28
Value chain indicators, 2012Share (%) of merchandise trade Exports Imports
Capital goods ................................................................... 19.2 ........ 13.2
Intermediate goods .......................................................... 56.9 ........56.0Food and beverages (industrial) ......................................0.7 .......... 1.0Industrial supplies (primary and processed) ................ 35.5 ........ 31.8Parts and accessories ...................................................18.6 ........ 14.4Fuels and lubricants ........................................................2.1 .......... 8.7
Consumer goods .............................................................. 19.2 ........ 21.3Food and beverages (consumer) .................................... 6.0 .......... 5.3Transport equipment and consumer goods ..................13.2 .........16.1
Passenger motor cars ........................................................ 3.2 .......... 5.1
Others ...................................................................................1.6 .......... 4.4
The most problematic factors for trade, 2013Most problematic factors for exporting Score*
Identifying potential markets and buyers ...............................................................18.8Technical requirements and standards abroad .....................................................10.7Tariff barriers abroad .............................................................................................10.7Access to trade finance ...........................................................................................9.7Rules of origin requirements abroad ....................................................................... 9.4Burdensome procedures at foreign borders .......................................................... 9.4Access to imported inputs at competitive prices ................................................... 9.4High cost or delays caused by international transportation ....................................7.0Corruption at foreign borders ..................................................................................5.7High cost or delays caused by domestic transportation ........................................ 3.8Difficulties in meeting quality/quantity requirements of buyers ............................... 3.5Inappropriate production technology and skills .......................................................2.1
Most problematic factors for importing Score*
Domestic technical requirements and standards ................................................. 24.2Tariffs .................................................................................................................... 23.9High cost or delays caused by international transportation ..................................19.2Burdensome import procedures ...........................................................................13.4High cost or delays caused by domestic transportation ........................................ 9.9Inappropriate telecommunications infrastructure ................................................... 3.6Crime and theft ....................................................................................................... 3.5Corruption at the border ......................................................................................... 2.2
Austria
Sources: International Monetary Fund, World Bank, World Trade Organization, United Nations COMTRADE
Austria
Advanced economies
© 2014 World Economic Forum

Country/Economy Profiles
The Global Enabling Trade Report 2014 | 63
* Indicator derived from the World Economic Forum’s Executive Opinion Survey and measured on a 1-to-7 scale, where 7 indicates best outcome.
The Enabling Trade Index 2014 in detail n Competitive Advantage n Competitive Disadvantage
For methodology, indicator descriptions and sources, and for a list of multiple best-performing economies, see page 45. Austria
INDICATOR, UNITS RANK/138 VALUE BEST PERFORMER VALUE
Pillar 1: Domestic market access (1–7) ........................................................... 46 ...........................4.9 Multiple economies (2) ................................ 7.0 1.01 Tariff rate (%)............................................................................................... 5 .......... n ..........0.8 Multiple economies (2) .............................0.0 1.02 Complexity of tariffs index (1–7) .............................................................. 110 .......... n ..........3.1 Multiple economies (2) .............................7.0
Tariff dispersion (standard deviation) ......................................................... 55 .......... n ..........8.4 Multiple economies (2) .............................0.0Tariff peaks (% of tariff lines) ................................................................... 104 .......... n ........10.6 Multiple economies (24) ...........................0.0Specific tariffs (% of tariff lines) ............................................................... 107 .......... n ........11.0 Multiple economies (54) ...........................0.0Number of distinct tariffs ......................................................................... 109 .......... n ......1,755 Multiple economies (2) ................................1
1.03 Share of duty-free imports (%) .................................................................. 42 .......... n ........65.4 Multiple economies (2) .........................100.0
Pillar 2: Foreign market access (1–7) .............................................................. 97 ...........................1.9 Cambodia ..................................................... 5.3 2.01 Tariffs faced (%) ........................................................................................ 73 .......... n ..........5.5 Chile .........................................................3.5 2.02 Index of margin of preference in destination mkts (0–100) ........................ 96 .......... n ..........9.1 Mauritius ................................................97.1
Pillar 3: Efficiency and transparency of border administration (1–7) .............. 10 ...........................5.8 Singapore..................................................... 6.3 3.01 Customs services index (0–1) ..................................................................... 3 .......... n ........0.92 Singapore...............................................0.97 3.02 Efficiency of the clearance process (1–5) .................................................. 23 .......... n ..........3.5 Norway ....................................................4.2 3.03 No. of days to import ............................................................................... 16 .......... n .............8 Singapore....................................................4 3.04 No. of documents to import ..................................................................... 11 .......... n .............4 Multiple economies (2) ................................2 3.05 Cost to import (US$ per container) ........................................................... 55 .......... n ......1,155 Singapore................................................440 3.06 No. of days to export................................................................................ 17 .......... n .............9 Multiple economies (5) ................................6 3.07 No. of documents to export ....................................................................... 3 .......... n .............3 Multiple economies (2) ................................2 3.08 Cost to export (US$ per container) ........................................................... 61 .......... n ......1,090 Malaysia ..................................................450 3.09 Irregular payments in exports and imports*............................................... 32 .......... n ..........5.1 New Zealand ............................................6.6 3.10 Time predictability of import procedures* .................................................. 16 .......... n ..........5.2 Finland .....................................................6.0 3.11 Customs transparency index (0–1) ............................................................. 1 .......... n ........1.00 Multiple economies (35) .........................1.00
Pillar 4: Availability and quality of transport infrastructure (1-7) ..................... 18 ...........................5.0 United Arab Emirates ................................... 6.5 4.01 Available int’l airline seat km/week, millions .............................................. 41 .......... n ......410.6 United States ..................................11,481.7 4.02 Quality of air transport infrastructure* ........................................................ 37 .......... n ..........5.4 Singapore.................................................6.8 4.03 Quality of railroad infrastructure* ............................................................... 11 .......... n ..........5.2 Japan .......................................................6.7 4.04 Liner Shipping Connectivity Index (0–157.1) ............................................ n/a ........................n/a China ...................................................157.5 4.05 Quality of port infrastructure* .................................................................... 44 .......... n ..........4.7 Netherlands ..............................................6.8 4.06 Paved roads (% of total) ............................................................................. 1 .......... n ......100.0 Multiple economies (18) .......................100.0 4.07 Quality of roads* ......................................................................................... 6 .......... n ..........6.2 United Arab Emirates ...............................6.6
Pillar 5: Availability and quality of transport services (1–7) ............................ 23 ...........................5.2 Singapore..................................................... 5.7 5.01 Ease and affordability of shipment (1–5).................................................... 40 .......... n ..........3.3 Luxembourg .............................................3.8 5.02 Logistics competence (1–5) ...................................................................... 26 .......... n ..........3.6 Norway ....................................................4.2 5.03 Tracking and tracing ability (1–5) ............................................................... 10 .......... n ..........3.9 Germany ..................................................4.2 5.04 Timeliness of shipments in reaching destination (1–5) ............................... 23 .......... n ..........4.0 Luxembourg .............................................4.7 5.05 Postal services efficiency* ......................................................................... 23 .......... n ..........5.9 Japan .......................................................6.8 5.06 Efficiency of transport mode change* ....................................................... 26 .......... n ..........5.1 Hong Kong SAR ......................................6.4
Pillar 6: Availability and use of ICTs (1–7) ........................................................ 18 ...........................5.8 Sweden ........................................................ 6.5 6.01 Mobile phone subscriptions/100 pop. ...................................................... 11 .......... n ......160.5 Hong Kong SAR ..................................229.2 6.02 Individuals using Internet (%) .................................................................... 21 .......... n ........81.0 Iceland ...................................................96.2 6.03 Fixed broadband Internet subscriptions/100 pop. .................................... 23 .......... n ........25.0 Switzerland ............................................39.9 6.04 Active mobile broadband Internet subscriptions/100 pop. ........................ 22 .......... n ........56.1 Singapore.............................................124.5 6.05 ICT use for business-to-business transactions* .......................................... 9 .......... n ..........5.9 Finland .....................................................6.2 6.06 Internet use for business-to-consumer transactions* ................................ 17 .......... n ..........5.6 United Kingdom .......................................6.3 6.07 Government Online Service Index (0–1) .................................................... 26 .......... n ........0.75 Multiple economies (3) ...........................1.00
Pillar 7: Operating environment (1–7) .............................................................. 14 ...........................5.3 Hong Kong SAR ............................................ 5.8 7.01 Protection of property index (1–7) ............................................................. 15 .......... n ..........5.7 Finland .....................................................6.3
Property rights* ......................................................................................... 12 .......... n ..........5.9 Finland .....................................................6.4Intellectual property protection* ................................................................ 16 .......... n ..........5.5 Finland .....................................................6.2
7.02 Efficiency and accountability of public institutions index (1–7) ................... 22 .......... n ..........4.8 Singapore.................................................6.0Judicial efficiency & impartiality in commercial disputes (0–4)...................... 8 .......... n ..........3.8 Multiple economies (7) .............................4.0Diversion of public funds* ......................................................................... 35 .......... n ..........4.5 New Zealand ............................................6.5Ease of compliance with government regulation* ...................................... 80 .......... n ..........3.4 Singapore.................................................5.4
7.03 Access to finance index (1–7) .................................................................. 25 .......... n ..........4.7 Hong Kong SAR ......................................5.7Affordability of financial services* ............................................................. 20 .......... n ..........5.3 Hong Kong SAR ......................................6.1Availability of financial services* ................................................................ 16 .......... n ..........5.7 Switzerland ..............................................6.4Ease of access to loans* .......................................................................... 51 .......... n ..........3.0 Qatar ........................................................4.9Availability of trade finance* ...................................................................... 20 .......... n ..........4.8 Hong Kong SAR ......................................5.8
7.04 Openness to foreign participation index (1–7) ........................................... 47 .......... n ..........4.6 Ireland ......................................................5.5Ease of hiring foreign labour* .................................................................. 101 .......... n ..........3.7 United Arab Emirates ...............................5.6Business impact of rules on FDI* .............................................................. 56 .......... n ..........4.7 Ireland ......................................................6.7Openness to multilateral trade rules (0–100) ............................................. 29 .......... n ........77.2 Slovenia .................................................92.2
7.05 Index of physical security (1–7) ................................................................... 8 .......... n ..........6.5 Qatar ........................................................6.8Reliability of police services* ..................................................................... 20 .......... n ..........5.9 Finland .....................................................6.7Business costs of crime and violence* ........................................................ 9 .......... n ..........6.0 Qatar ........................................................6.8Business costs of terrorism* ....................................................................... 6 .......... n ..........6.6 Slovenia ...................................................6.7Homicide cases/100,000 pop. ................................................................. 18 .......... n ..........0.8 Hong Kong SAR ......................................0.2Index of terrorism incidence (1-7) ............................................................. 49 .......... n ..........7.0 Multiple economies (48) ...........................7.0
© 2014 World Economic Forum
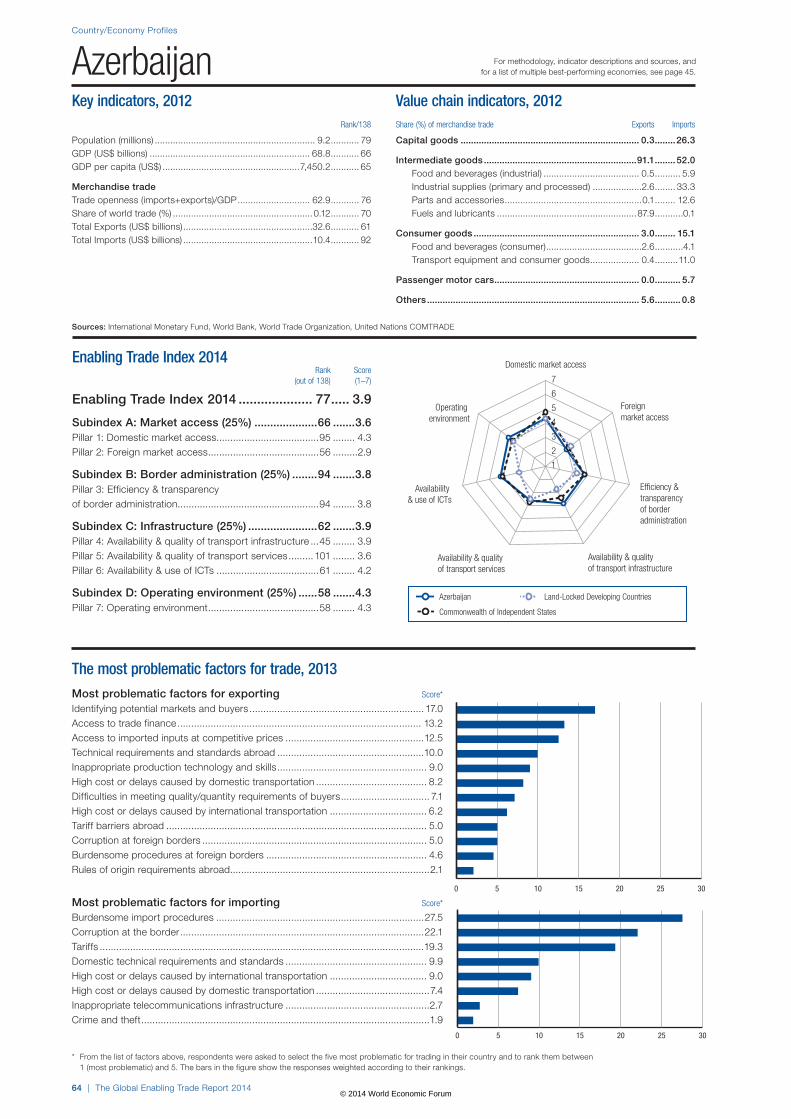
Country/Economy Profiles
64 | The Global Enabling Trade Report 2014
* From the list of factors above, respondents were asked to select the five most problematic for trading in their country and to rank them between 1 (most problematic) and 5. The bars in the figure show the responses weighted according to their rankings.
For methodology, indicator descriptions and sources, and for a list of multiple best-performing economies, see page 45.
0 105 15 20 25 30
0 5 10 15 20 25 30
2
3
4
5
6
7
Operating environment
Availability & use of ICTs
Availability & quality of transport services
Availability & quality of transport infrastructure
Efficiency & transparency of border administration
Foreign market access
Domestic market access
1
Enabling Trade Index 2014 Rank Score (out of 138) (1–7)
Enabling Trade Index 2014 .................... 77 ..... 3.9
Subindex A: Market access (25%) ....................66 .......3.6Pillar 1: Domestic market access .....................................95 ........ 4.3Pillar 2: Foreign market access ........................................56 .........2.9
Subindex B: Border administration (25%) ........94 .......3.8Pillar 3: Efficiency & transparency of border administration ...................................................94 ........ 3.8
Subindex C: Infrastructure (25%) ......................62 .......3.9Pillar 4: Availability & quality of transport infrastructure ...45 ........ 3.9Pillar 5: Availability & quality of transport services ......... 101 ........ 3.6Pillar 6: Availability & use of ICTs .....................................61 ........ 4.2
Subindex D: Operating environment (25%) ......58 .......4.3Pillar 7: Operating environment ........................................58 ........ 4.3
Key indicators, 2012 Rank/138
Population (millions) .............................................................. 9.2 ........... 79GDP (US$ billions) .............................................................. 68.8 ........... 66GDP per capita (US$) .....................................................7,450.2 ........... 65
Merchandise tradeTrade openness (imports+exports)/GDP ............................ 62.9 ........... 76Share of world trade (%) ......................................................0.12 ........... 70Total Exports (US$ billions) ..................................................32.6 ........... 61Total Imports (US$ billions) ..................................................10.4 ........... 92
Value chain indicators, 2012Share (%) of merchandise trade Exports Imports
Capital goods ..................................................................... 0.3 ........26.3
Intermediate goods ...........................................................91.1 ........52.0Food and beverages (industrial) ..................................... 0.5 .......... 5.9Industrial supplies (primary and processed) ...................2.6 ........ 33.3Parts and accessories .....................................................0.1 ........ 12.6Fuels and lubricants ......................................................87.9 ...........0.1
Consumer goods ................................................................ 3.0 ........ 15.1Food and beverages (consumer) .....................................2.6 ...........4.1Transport equipment and consumer goods ................... 0.4 .........11.0
Passenger motor cars ........................................................ 0.0 .......... 5.7
Others .................................................................................. 5.6 .......... 0.8
The most problematic factors for trade, 2013Most problematic factors for exporting Score*
Identifying potential markets and buyers ............................................................... 17.0Access to trade finance ........................................................................................ 13.2Access to imported inputs at competitive prices ..................................................12.5Technical requirements and standards abroad .....................................................10.0Inappropriate production technology and skills ...................................................... 9.0High cost or delays caused by domestic transportation ........................................ 8.2Difficulties in meeting quality/quantity requirements of buyers ................................ 7.1High cost or delays caused by international transportation ................................... 6.2Tariff barriers abroad .............................................................................................. 5.0Corruption at foreign borders ................................................................................. 5.0Burdensome procedures at foreign borders .......................................................... 4.6Rules of origin requirements abroad ........................................................................2.1
Most problematic factors for importing Score*
Burdensome import procedures ...........................................................................27.5Corruption at the border ........................................................................................22.1Tariffs .....................................................................................................................19.3Domestic technical requirements and standards ................................................... 9.9High cost or delays caused by international transportation ................................... 9.0High cost or delays caused by domestic transportation .........................................7.4Inappropriate telecommunications infrastructure ....................................................2.7Crime and theft ........................................................................................................1.9
Azerbaijan
Sources: International Monetary Fund, World Bank, World Trade Organization, United Nations COMTRADE
Azerbaijan Land-Locked Developing Countries
Commonwealth of Independent States
© 2014 World Economic Forum
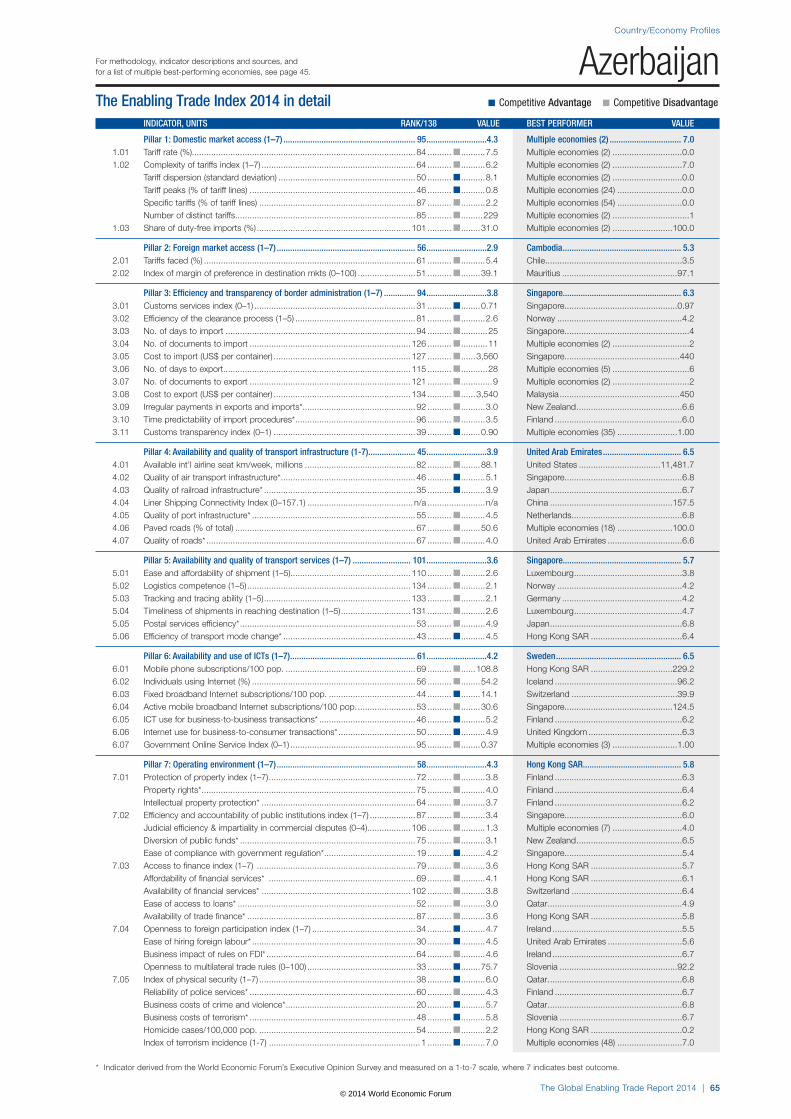
Country/Economy Profiles
The Global Enabling Trade Report 2014 | 65
* Indicator derived from the World Economic Forum’s Executive Opinion Survey and measured on a 1-to-7 scale, where 7 indicates best outcome.
The Enabling Trade Index 2014 in detail n Competitive Advantage n Competitive Disadvantage
For methodology, indicator descriptions and sources, and for a list of multiple best-performing economies, see page 45. Azerbaijan
INDICATOR, UNITS RANK/138 VALUE BEST PERFORMER VALUE
Pillar 1: Domestic market access (1–7) ........................................................... 95 ...........................4.3 Multiple economies (2) ................................ 7.0 1.01 Tariff rate (%)............................................................................................. 84 .......... n ..........7.5 Multiple economies (2) .............................0.0 1.02 Complexity of tariffs index (1–7) ................................................................ 64 .......... n ..........6.2 Multiple economies (2) .............................7.0
Tariff dispersion (standard deviation) ......................................................... 50 .......... n ..........8.1 Multiple economies (2) .............................0.0Tariff peaks (% of tariff lines) ..................................................................... 46 .......... n ..........0.8 Multiple economies (24) ...........................0.0Specific tariffs (% of tariff lines) ................................................................. 87 .......... n ..........2.2 Multiple economies (54) ...........................0.0Number of distinct tariffs ........................................................................... 85 .......... n .........229 Multiple economies (2) ................................1
1.03 Share of duty-free imports (%) ................................................................ 101 .......... n ........31.0 Multiple economies (2) .........................100.0
Pillar 2: Foreign market access (1–7) .............................................................. 56 ...........................2.9 Cambodia ..................................................... 5.3 2.01 Tariffs faced (%) ........................................................................................ 61 .......... n ..........5.4 Chile .........................................................3.5 2.02 Index of margin of preference in destination mkts (0–100) ........................ 51 .......... n ........39.1 Mauritius ................................................97.1
Pillar 3: Efficiency and transparency of border administration (1–7) .............. 94 ...........................3.8 Singapore..................................................... 6.3 3.01 Customs services index (0–1) ................................................................... 31 .......... n ........0.71 Singapore...............................................0.97 3.02 Efficiency of the clearance process (1–5) .................................................. 81 .......... n ..........2.6 Norway ....................................................4.2 3.03 No. of days to import ............................................................................... 94 .......... n ...........25 Singapore....................................................4 3.04 No. of documents to import ................................................................... 126 .......... n ...........11 Multiple economies (2) ................................2 3.05 Cost to import (US$ per container) ......................................................... 127 .......... n ......3,560 Singapore................................................440 3.06 No. of days to export.............................................................................. 115 .......... n ...........28 Multiple economies (5) ................................6 3.07 No. of documents to export ................................................................... 121 .......... n .............9 Multiple economies (2) ................................2 3.08 Cost to export (US$ per container) ......................................................... 134 .......... n ......3,540 Malaysia ..................................................450 3.09 Irregular payments in exports and imports*............................................... 92 .......... n ..........3.0 New Zealand ............................................6.6 3.10 Time predictability of import procedures* .................................................. 96 .......... n ..........3.5 Finland .....................................................6.0 3.11 Customs transparency index (0–1) ........................................................... 39 .......... n ........0.90 Multiple economies (35) .........................1.00
Pillar 4: Availability and quality of transport infrastructure (1-7) ..................... 45 ...........................3.9 United Arab Emirates ................................... 6.5 4.01 Available int’l airline seat km/week, millions .............................................. 82 .......... n ........88.1 United States ..................................11,481.7 4.02 Quality of air transport infrastructure* ........................................................ 46 .......... n ..........5.1 Singapore.................................................6.8 4.03 Quality of railroad infrastructure* ............................................................... 35 .......... n ..........3.9 Japan .......................................................6.7 4.04 Liner Shipping Connectivity Index (0–157.1) ............................................ n/a ........................n/a China ...................................................157.5 4.05 Quality of port infrastructure* .................................................................... 55 .......... n ..........4.5 Netherlands ..............................................6.8 4.06 Paved roads (% of total) ........................................................................... 67 .......... n ........50.6 Multiple economies (18) .......................100.0 4.07 Quality of roads* ....................................................................................... 67 .......... n ..........4.0 United Arab Emirates ...............................6.6
Pillar 5: Availability and quality of transport services (1–7) .......................... 101 ...........................3.6 Singapore..................................................... 5.7 5.01 Ease and affordability of shipment (1–5).................................................. 110 .......... n ..........2.6 Luxembourg .............................................3.8 5.02 Logistics competence (1–5) .................................................................... 134 .......... n ..........2.1 Norway ....................................................4.2 5.03 Tracking and tracing ability (1–5) ............................................................. 133 .......... n ..........2.1 Germany ..................................................4.2 5.04 Timeliness of shipments in reaching destination (1–5) ............................. 131 .......... n ..........2.6 Luxembourg .............................................4.7 5.05 Postal services efficiency* ......................................................................... 53 .......... n ..........4.9 Japan .......................................................6.8 5.06 Efficiency of transport mode change* ....................................................... 43 .......... n ..........4.5 Hong Kong SAR ......................................6.4
Pillar 6: Availability and use of ICTs (1–7) ........................................................ 61 ...........................4.2 Sweden ........................................................ 6.5 6.01 Mobile phone subscriptions/100 pop. ...................................................... 69 .......... n ......108.8 Hong Kong SAR ..................................229.2 6.02 Individuals using Internet (%) .................................................................... 56 .......... n ........54.2 Iceland ...................................................96.2 6.03 Fixed broadband Internet subscriptions/100 pop. .................................... 44 .......... n ........14.1 Switzerland ............................................39.9 6.04 Active mobile broadband Internet subscriptions/100 pop. ........................ 53 .......... n ........30.6 Singapore.............................................124.5 6.05 ICT use for business-to-business transactions* ........................................ 46 .......... n ..........5.2 Finland .....................................................6.2 6.06 Internet use for business-to-consumer transactions* ................................ 50 .......... n ..........4.9 United Kingdom .......................................6.3 6.07 Government Online Service Index (0–1) .................................................... 95 .......... n ........0.37 Multiple economies (3) ...........................1.00
Pillar 7: Operating environment (1–7) .............................................................. 58 ...........................4.3 Hong Kong SAR ............................................ 5.8 7.01 Protection of property index (1–7) ............................................................. 72 .......... n ..........3.8 Finland .....................................................6.3
Property rights* ......................................................................................... 75 .......... n ..........4.0 Finland .....................................................6.4Intellectual property protection* ................................................................ 64 .......... n ..........3.7 Finland .....................................................6.2
7.02 Efficiency and accountability of public institutions index (1–7) ................... 87 .......... n ..........3.4 Singapore.................................................6.0Judicial efficiency & impartiality in commercial disputes (0–4).................. 106 .......... n ..........1.3 Multiple economies (7) .............................4.0Diversion of public funds* ......................................................................... 75 .......... n ..........3.1 New Zealand ............................................6.5Ease of compliance with government regulation* ...................................... 19 .......... n ..........4.2 Singapore.................................................5.4
7.03 Access to finance index (1–7) .................................................................. 79 .......... n ..........3.6 Hong Kong SAR ......................................5.7Affordability of financial services* ............................................................. 69 .......... n ..........4.1 Hong Kong SAR ......................................6.1Availability of financial services* .............................................................. 102 .......... n ..........3.8 Switzerland ..............................................6.4Ease of access to loans* .......................................................................... 52 .......... n ..........3.0 Qatar ........................................................4.9Availability of trade finance* ...................................................................... 87 .......... n ..........3.6 Hong Kong SAR ......................................5.8
7.04 Openness to foreign participation index (1–7) ........................................... 34 .......... n ..........4.7 Ireland ......................................................5.5Ease of hiring foreign labour* .................................................................... 30 .......... n ..........4.5 United Arab Emirates ...............................5.6Business impact of rules on FDI* .............................................................. 64 .......... n ..........4.6 Ireland ......................................................6.7Openness to multilateral trade rules (0–100) ............................................. 33 .......... n ........75.7 Slovenia .................................................92.2
7.05 Index of physical security (1–7) ................................................................. 38 .......... n ..........6.0 Qatar ........................................................6.8Reliability of police services* ..................................................................... 60 .......... n ..........4.3 Finland .....................................................6.7Business costs of crime and violence* ...................................................... 20 .......... n ..........5.7 Qatar ........................................................6.8Business costs of terrorism* ..................................................................... 48 .......... n ..........5.8 Slovenia ...................................................6.7Homicide cases/100,000 pop. ................................................................. 54 .......... n ..........2.2 Hong Kong SAR ......................................0.2Index of terrorism incidence (1-7) ............................................................... 1 .......... n ..........7.0 Multiple economies (48) ...........................7.0
© 2014 World Economic Forum

Country/Economy Profiles
66 | The Global Enabling Trade Report 2014
* From the list of factors above, respondents were asked to select the five most problematic for trading in their country and to rank them between 1 (most problematic) and 5. The bars in the figure show the responses weighted according to their rankings.
For methodology, indicator descriptions and sources, and for a list of multiple best-performing economies, see page 45.
0 105 15 20 25 30
0 5 10 15 20 25 30
2
3
4
5
6
7
Operating environment
Availability & use of ICTs
Availability & quality of transport services
Availability & quality of transport infrastructure
Efficiency & transparency of border administration
Foreign market access
Domestic market access
1
Enabling Trade Index 2014 Rank Score (out of 138) (1–7)
Enabling Trade Index 2014 .................... 33 ..... 4.6
Subindex A: Market access (25%) ....................72 .......3.5Pillar 1: Domestic market access .....................................77 ........ 4.8Pillar 2: Foreign market access ........................................87 ........ 2.2
Subindex B: Border administration (25%) ........41 .......5.1Pillar 3: Efficiency & transparency of border administration ................................................... 41 .........5.1
Subindex C: Infrastructure (25%) ......................29 .......4.9Pillar 4: Availability & quality of transport infrastructure ...32 .........4.4Pillar 5: Availability & quality of transport services ...........46 ........ 4.5Pillar 6: Availability & use of ICTs ..................................... 17 ........ 5.8
Subindex D: Operating environment (25%) ......28 .......5.0Pillar 7: Operating environment ........................................28 .........5.0
Key indicators, 2012 Rank/138
Population (millions) ...............................................................1.2 ......... 131GDP (US$ billions) ............................................................... 27.1 ........... 90GDP per capita (US$) .................................................. 23,554.8 ........... 31
Merchandise tradeTrade openness (imports+exports)/GDP, 2010 ................. 118.7 ........... 19Share of world trade (%) ..................................................... 0.09 ........... 74Total Exports (US$ billions) ..................................................19.8 ........... 70Total Imports (US$ billions) ..................................................13.9 ........... 84
Value chain indicators, 2011Share (%) of merchandise trade Exports Imports
Capital goods ..................................................................... 0.7 .......... 9.0
Intermediate goods .......................................................... 24.7 ........72.5Food and beverages (industrial) ..................................... 0.0 ...........1.1Industrial supplies (primary and processed) .................24.6 ........ 23.7Parts and accessories .................................................... 0.0 .......... 5.3Fuels and lubricants ....................................................... 0.0 ........ 42.4
Consumer goods ................................................................ 3.0 ........ 13.4Food and beverages (consumer) .....................................1.7 .......... 6.2Transport equipment and consumer goods ....................1.3 ...........7.1
Passenger motor cars ........................................................ 0.0 .......... 4.9
Others .................................................................................71.7 .......... 0.3
The most problematic factors for trade, 2013Most problematic factors for exporting Score*
Identifying potential markets and buyers ...............................................................19.3Burdensome procedures at foreign borders .........................................................14.4High cost or delays caused by international transportation ..................................12.5Access to imported inputs at competitive prices ..................................................10.9Tariff barriers abroad .............................................................................................. 8.7Access to trade finance ........................................................................................... 7.1Inappropriate production technology and skills ...................................................... 6.5Technical requirements and standards abroad ...................................................... 6.0High cost or delays caused by domestic transportation ........................................ 4.4Rules of origin requirements abroad ........................................................................4.1Difficulties in meeting quality/quantity requirements of buyers ............................... 3.0Corruption at foreign borders ................................................................................. 3.0
Most problematic factors for importing Score*
High cost or delays caused by international transportation ..................................24.6Burdensome import procedures .......................................................................... 23.9Domestic technical requirements and standards ..................................................17.2Tariffs .....................................................................................................................12.5High cost or delays caused by domestic transportation ........................................ 9.8Corruption at the border ......................................................................................... 5.4Inappropriate telecommunications infrastructure ....................................................4.7Crime and theft ....................................................................................................... 2.0
Bahrain
Sources: International Monetary Fund, World Bank, World Trade Organization, United Nations COMTRADE
Bahrain
Middle East, North Africa, and Pakistan
© 2014 World Economic Forum
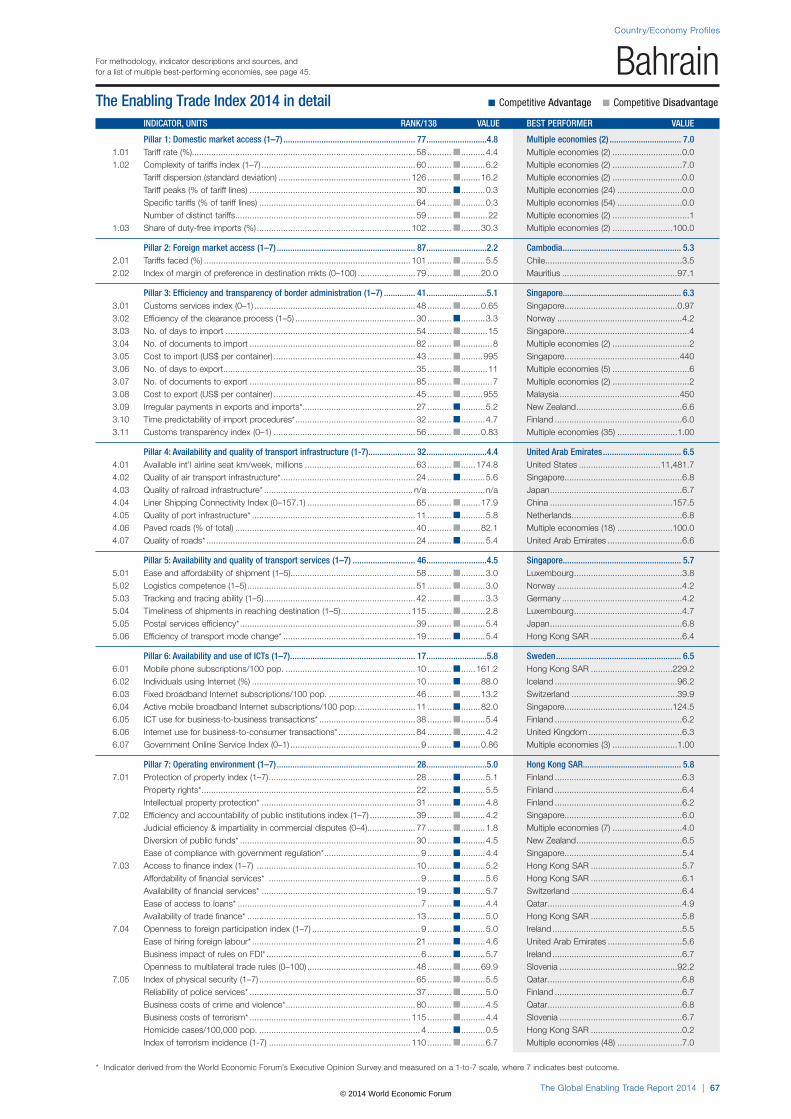
Country/Economy Profiles
The Global Enabling Trade Report 2014 | 67
* Indicator derived from the World Economic Forum’s Executive Opinion Survey and measured on a 1-to-7 scale, where 7 indicates best outcome.
The Enabling Trade Index 2014 in detail n Competitive Advantage n Competitive Disadvantage
For methodology, indicator descriptions and sources, and for a list of multiple best-performing economies, see page 45. Bahrain
INDICATOR, UNITS RANK/138 VALUE BEST PERFORMER VALUE
Pillar 1: Domestic market access (1–7) ........................................................... 77 ...........................4.8 Multiple economies (2) ................................ 7.0 1.01 Tariff rate (%)............................................................................................. 58 .......... n ..........4.4 Multiple economies (2) .............................0.0 1.02 Complexity of tariffs index (1–7) ................................................................ 60 .......... n ..........6.2 Multiple economies (2) .............................7.0
Tariff dispersion (standard deviation) ....................................................... 126 .......... n ........16.2 Multiple economies (2) .............................0.0Tariff peaks (% of tariff lines) ..................................................................... 30 .......... n ..........0.3 Multiple economies (24) ...........................0.0Specific tariffs (% of tariff lines) ................................................................. 64 .......... n ..........0.3 Multiple economies (54) ...........................0.0Number of distinct tariffs ........................................................................... 59 .......... n ...........22 Multiple economies (2) ................................1
1.03 Share of duty-free imports (%) ................................................................ 102 .......... n ........30.3 Multiple economies (2) .........................100.0
Pillar 2: Foreign market access (1–7) .............................................................. 87 ...........................2.2 Cambodia ..................................................... 5.3 2.01 Tariffs faced (%) ...................................................................................... 101 .......... n ..........5.5 Chile .........................................................3.5 2.02 Index of margin of preference in destination mkts (0–100) ........................ 79 .......... n ........20.0 Mauritius ................................................97.1
Pillar 3: Efficiency and transparency of border administration (1–7) .............. 41 ...........................5.1 Singapore..................................................... 6.3 3.01 Customs services index (0–1) ................................................................... 48 .......... n ........0.65 Singapore...............................................0.97 3.02 Efficiency of the clearance process (1–5) .................................................. 30 .......... n ..........3.3 Norway ....................................................4.2 3.03 No. of days to import ............................................................................... 54 .......... n ...........15 Singapore....................................................4 3.04 No. of documents to import ..................................................................... 82 .......... n .............8 Multiple economies (2) ................................2 3.05 Cost to import (US$ per container) ........................................................... 43 .......... n .........995 Singapore................................................440 3.06 No. of days to export................................................................................ 35 .......... n ...........11 Multiple economies (5) ................................6 3.07 No. of documents to export ..................................................................... 85 .......... n .............7 Multiple economies (2) ................................2 3.08 Cost to export (US$ per container) ........................................................... 45 .......... n .........955 Malaysia ..................................................450 3.09 Irregular payments in exports and imports*............................................... 27 .......... n ..........5.2 New Zealand ............................................6.6 3.10 Time predictability of import procedures* .................................................. 32 .......... n ..........4.7 Finland .....................................................6.0 3.11 Customs transparency index (0–1) ........................................................... 56 .......... n ........0.83 Multiple economies (35) .........................1.00
Pillar 4: Availability and quality of transport infrastructure (1-7) ..................... 32 ...........................4.4 United Arab Emirates ................................... 6.5 4.01 Available int’l airline seat km/week, millions .............................................. 63 .......... n ......174.8 United States ..................................11,481.7 4.02 Quality of air transport infrastructure* ........................................................ 24 .......... n ..........5.6 Singapore.................................................6.8 4.03 Quality of railroad infrastructure* .............................................................. n/a ........................n/a Japan .......................................................6.7 4.04 Liner Shipping Connectivity Index (0–157.1) ............................................. 65 .......... n ........17.9 China ...................................................157.5 4.05 Quality of port infrastructure* .................................................................... 11 .......... n ..........5.8 Netherlands ..............................................6.8 4.06 Paved roads (% of total) ........................................................................... 40 .......... n ........82.1 Multiple economies (18) .......................100.0 4.07 Quality of roads* ....................................................................................... 24 .......... n ..........5.4 United Arab Emirates ...............................6.6
Pillar 5: Availability and quality of transport services (1–7) ............................ 46 ...........................4.5 Singapore..................................................... 5.7 5.01 Ease and affordability of shipment (1–5).................................................... 58 .......... n ..........3.0 Luxembourg .............................................3.8 5.02 Logistics competence (1–5) ...................................................................... 51 .......... n ..........3.0 Norway ....................................................4.2 5.03 Tracking and tracing ability (1–5) ............................................................... 42 .......... n ..........3.3 Germany ..................................................4.2 5.04 Timeliness of shipments in reaching destination (1–5) ............................. 115 .......... n ..........2.8 Luxembourg .............................................4.7 5.05 Postal services efficiency* ......................................................................... 39 .......... n ..........5.4 Japan .......................................................6.8 5.06 Efficiency of transport mode change* ....................................................... 19 .......... n ..........5.4 Hong Kong SAR ......................................6.4
Pillar 6: Availability and use of ICTs (1–7) ........................................................ 17 ...........................5.8 Sweden ........................................................ 6.5 6.01 Mobile phone subscriptions/100 pop. ...................................................... 10 .......... n ......161.2 Hong Kong SAR ..................................229.2 6.02 Individuals using Internet (%) .................................................................... 10 .......... n ........88.0 Iceland ...................................................96.2 6.03 Fixed broadband Internet subscriptions/100 pop. .................................... 46 .......... n ........13.2 Switzerland ............................................39.9 6.04 Active mobile broadband Internet subscriptions/100 pop. ........................ 11 .......... n ........82.0 Singapore.............................................124.5 6.05 ICT use for business-to-business transactions* ........................................ 38 .......... n ..........5.4 Finland .....................................................6.2 6.06 Internet use for business-to-consumer transactions* ................................ 84 .......... n ..........4.2 United Kingdom .......................................6.3 6.07 Government Online Service Index (0–1) ...................................................... 9 .......... n ........0.86 Multiple economies (3) ...........................1.00
Pillar 7: Operating environment (1–7) .............................................................. 28 ...........................5.0 Hong Kong SAR ............................................ 5.8 7.01 Protection of property index (1–7) ............................................................. 28 .......... n ..........5.1 Finland .....................................................6.3
Property rights* ......................................................................................... 22 .......... n ..........5.5 Finland .....................................................6.4Intellectual property protection* ................................................................ 31 .......... n ..........4.8 Finland .....................................................6.2
7.02 Efficiency and accountability of public institutions index (1–7) ................... 39 .......... n ..........4.2 Singapore.................................................6.0Judicial efficiency & impartiality in commercial disputes (0–4).................... 77 .......... n ..........1.8 Multiple economies (7) .............................4.0Diversion of public funds* ......................................................................... 30 .......... n ..........4.5 New Zealand ............................................6.5Ease of compliance with government regulation* ........................................ 9 .......... n ..........4.4 Singapore.................................................5.4
7.03 Access to finance index (1–7) .................................................................. 10 .......... n ..........5.2 Hong Kong SAR ......................................5.7Affordability of financial services* ............................................................... 9 .......... n ..........5.6 Hong Kong SAR ......................................6.1Availability of financial services* ................................................................ 19 .......... n ..........5.7 Switzerland ..............................................6.4Ease of access to loans* ............................................................................ 7 .......... n ..........4.4 Qatar ........................................................4.9Availability of trade finance* ...................................................................... 13 .......... n ..........5.0 Hong Kong SAR ......................................5.8
7.04 Openness to foreign participation index (1–7) ............................................. 9 .......... n ..........5.0 Ireland ......................................................5.5Ease of hiring foreign labour* .................................................................... 21 .......... n ..........4.6 United Arab Emirates ...............................5.6Business impact of rules on FDI* ................................................................ 6 .......... n ..........5.7 Ireland ......................................................6.7Openness to multilateral trade rules (0–100) ............................................. 48 .......... n ........69.9 Slovenia .................................................92.2
7.05 Index of physical security (1–7) ................................................................. 65 .......... n ..........5.5 Qatar ........................................................6.8Reliability of police services* ..................................................................... 37 .......... n ..........5.0 Finland .....................................................6.7Business costs of crime and violence* ...................................................... 80 .......... n ..........4.5 Qatar ........................................................6.8Business costs of terrorism* ................................................................... 115 .......... n ..........4.4 Slovenia ...................................................6.7Homicide cases/100,000 pop. ................................................................... 4 .......... n ..........0.5 Hong Kong SAR ......................................0.2Index of terrorism incidence (1-7) ........................................................... 110 .......... n ..........6.7 Multiple economies (48) ...........................7.0
© 2014 World Economic Forum

Country/Economy Profiles
68 | The Global Enabling Trade Report 2014
* From the list of factors above, respondents were asked to select the five most problematic for trading in their country and to rank them between 1 (most problematic) and 5. The bars in the figure show the responses weighted according to their rankings.
For methodology, indicator descriptions and sources, and for a list of multiple best-performing economies, see page 45.
0 105 15 20 25 30
0 5 10 15 20 25 30
2
3
4
5
6
7
Operating environment
Availability & use of ICTs
Availability & quality of transport services
Availability & quality of transport infrastructure
Efficiency & transparency of border administration
Foreign market access
Domestic market access
1
Enabling Trade Index 2014 Rank Score (out of 138) (1–7)
Enabling Trade Index 2014 ...................115 ..... 3.4
Subindex A: Market access (25%) ....................57 .......3.8Pillar 1: Domestic market access ................................... 126 .........3.4Pillar 2: Foreign market access ..........................................7 ........ 4.2
Subindex B: Border administration (25%) ......123 .......3.2Pillar 3: Efficiency & transparency of border administration ................................................. 123 ........ 3.2
Subindex C: Infrastructure (25%) .................... 119 .......2.8Pillar 4: Availability & quality of transport infrastructure .120 .........2.3Pillar 5: Availability & quality of transport services .........103 ........ 3.6Pillar 6: Availability & use of ICTs ................................... 118 .........2.4
Subindex D: Operating environment (25%) ......99 .......3.7Pillar 7: Operating environment ........................................99 .........3.7
Key indicators, 2012 Rank/138
Population (millions) ...........................................................154.3 ............. 8GDP (US$ billions) .............................................................123.0 ........... 59GDP per capita (US$) ........................................................797.2 ......... 121
Merchandise tradeTrade openness (imports+exports)/GDP .............................51.2 ........... 98Share of world trade (%) ......................................................0.16 ........... 67Total Exports (US$ billions) ..................................................25.1 ........... 66Total Imports (US$ billions) ..................................................34.1 ........... 60
The most problematic factors for trade, 2013Most problematic factors for exporting Score*
Inappropriate production technology and skills .....................................................15.6Access to trade finance .........................................................................................15.6Identifying potential markets and buyers ...............................................................13.3High cost or delays caused by domestic transportation .......................................12.2Access to imported inputs at competitive prices ..................................................10.9Difficulties in meeting quality/quantity requirements of buyers ................................9.7Technical requirements and standards abroad .......................................................7.8High cost or delays caused by international transportation ................................... 5.5Tariff barriers abroad .............................................................................................. 4.6Burdensome procedures at foreign borders .......................................................... 2.4Rules of origin requirements abroad ........................................................................1.3Corruption at foreign borders ..................................................................................1.0
Most problematic factors for importing Score*
Tariffs .....................................................................................................................21.0Burdensome import procedures .......................................................................... 20.5Corruption at the border ........................................................................................19.1High cost or delays caused by domestic transportation ....................................... 11.1High cost or delays caused by international transportation ................................. 10.2Domestic technical requirements and standards .................................................... 7.1Crime and theft ....................................................................................................... 6.0Inappropriate telecommunications infrastructure ................................................... 5.0
Bangladesh
Sources: International Monetary Fund, World Bank, World Trade Organization, United Nations COMTRADE
Bangladesh Least Developed Countries
Developing Asia
© 2014 World Economic Forum

Country/Economy Profiles
The Global Enabling Trade Report 2014 | 69
* Indicator derived from the World Economic Forum’s Executive Opinion Survey and measured on a 1-to-7 scale, where 7 indicates best outcome.
The Enabling Trade Index 2014 in detail n Competitive Advantage n Competitive Disadvantage
For methodology, indicator descriptions and sources, and for a list of multiple best-performing economies, see page 45. Bangladesh
INDICATOR, UNITS RANK/138 VALUE BEST PERFORMER VALUE
Pillar 1: Domestic market access (1–7) ......................................................... 126 ...........................3.4 Multiple economies (2) ................................ 7.0 1.01 Tariff rate (%)........................................................................................... 126 .......... n ........13.7 Multiple economies (2) .............................0.0 1.02 Complexity of tariffs index (1–7) ................................................................ 33 .......... n ..........6.5 Multiple economies (2) .............................7.0
Tariff dispersion (standard deviation) ......................................................... 88 .......... n ..........9.1 Multiple economies (2) .............................0.0Tariff peaks (% of tariff lines) ....................................................................... 1 .......... n ..........0.0 Multiple economies (24) ...........................0.0Specific tariffs (% of tariff lines) ................................................................. 72 .......... n ..........0.4 Multiple economies (54) ...........................0.0Number of distinct tariffs ........................................................................... 68 .......... n ...........30 Multiple economies (2) ................................1
1.03 Share of duty-free imports (%) ................................................................ 117 .......... n ........17.1 Multiple economies (2) .........................100.0
Pillar 2: Foreign market access (1–7) ................................................................ 7 ...........................4.2 Cambodia ..................................................... 5.3 2.01 Tariffs faced (%) ........................................................................................ 13 .......... n ..........4.8 Chile .........................................................3.5 2.02 Index of margin of preference in destination mkts (0–100) ........................ 15 .......... n ........60.5 Mauritius ................................................97.1
Pillar 3: Efficiency and transparency of border administration (1–7) ............ 123 ...........................3.2 Singapore..................................................... 6.3 3.01 Customs services index (0–1) ................................................................. 102 .......... n ........0.35 Singapore...............................................0.97 3.02 Efficiency of the clearance process (1–5) ................................................ 125 .......... n ..........2.1 Norway ....................................................4.2 3.03 No. of days to import ............................................................................. 118 .......... n ...........35 Singapore....................................................4 3.04 No. of documents to import ..................................................................... 82 .......... n .............8 Multiple economies (2) ................................2 3.05 Cost to import (US$ per container) ........................................................... 80 .......... n ......1,470 Singapore................................................440 3.06 No. of days to export.............................................................................. 105 .......... n ...........25 Multiple economies (5) ................................6 3.07 No. of documents to export ..................................................................... 65 .......... n .............6 Multiple economies (2) ................................2 3.08 Cost to export (US$ per container) ........................................................... 58 .......... n ......1,075 Malaysia ..................................................450 3.09 Irregular payments in exports and imports*............................................. 132 .......... n ..........2.0 New Zealand ............................................6.6 3.10 Time predictability of import procedures* ................................................ 116 .......... n ..........3.1 Finland .....................................................6.0 3.11 Customs transparency index (0–1) ......................................................... 107 .......... n ........0.38 Multiple economies (35) .........................1.00
Pillar 4: Availability and quality of transport infrastructure (1-7) ................... 120 ...........................2.3 United Arab Emirates ................................... 6.5 4.01 Available int’l airline seat km/week, millions .............................................. 58 .......... n ......198.8 United States ..................................11,481.7 4.02 Quality of air transport infrastructure* ...................................................... 117 .......... n ..........3.2 Singapore.................................................6.8 4.03 Quality of railroad infrastructure* ............................................................... 71 .......... n ..........2.4 Japan .......................................................6.7 4.04 Liner Shipping Connectivity Index (0–157.1) ............................................. 85 .......... n ..........8.0 China ...................................................157.5 4.05 Quality of port infrastructure* .................................................................... 95 .......... n ..........3.5 Netherlands ..............................................6.8 4.06 Paved roads (% of total) ......................................................................... 129 .......... n ..........9.5 Multiple economies (18) .......................100.0 4.07 Quality of roads* ..................................................................................... 109 .......... n ..........2.8 United Arab Emirates ...............................6.6
Pillar 5: Availability and quality of transport services (1–7) .......................... 103 ...........................3.6 Singapore..................................................... 5.7 5.01 Ease and affordability of shipment (1–5).................................................... 80 .......... n ..........2.8 Luxembourg .............................................3.8 5.02 Logistics competence (1–5) ...................................................................... 93 .......... n ..........2.6 Norway ....................................................4.2 5.03 Tracking and tracing ability (1–5) ............................................................. 115 .......... n ..........2.5 Germany ..................................................4.2 5.04 Timeliness of shipments in reaching destination (1–5) ............................... 77 .......... n ..........3.2 Luxembourg .............................................4.7 5.05 Postal services efficiency* ....................................................................... 106 .......... n ..........3.5 Japan .......................................................6.8 5.06 Efficiency of transport mode change* ..................................................... 108 .......... n ..........3.3 Hong Kong SAR ......................................6.4
Pillar 6: Availability and use of ICTs (1–7) ...................................................... 118 ...........................2.4 Sweden ........................................................ 6.5 6.01 Mobile phone subscriptions/100 pop. .................................................... 120 .......... n ........62.8 Hong Kong SAR ..................................229.2 6.02 Individuals using Internet (%) .................................................................. 119 .......... n ..........6.3 Iceland ...................................................96.2 6.03 Fixed broadband Internet subscriptions/100 pop. .................................. 110 .......... n ..........0.4 Switzerland ............................................39.9 6.04 Active mobile broadband Internet subscriptions/100 pop. ...................... 120 .......... n ..........0.2 Singapore.............................................124.5 6.05 ICT use for business-to-business transactions* ...................................... 122 .......... n ..........4.0 Finland .....................................................6.2 6.06 Internet use for business-to-consumer transactions* .............................. 117 .......... n ..........3.5 United Kingdom .......................................6.3 6.07 Government Online Service Index (0–1) .................................................... 83 .......... n ........0.44 Multiple economies (3) ...........................1.00
Pillar 7: Operating environment (1–7) .............................................................. 99 ...........................3.7 Hong Kong SAR ............................................ 5.8 7.01 Protection of property index (1–7) ........................................................... 118 .......... n ..........3.0 Finland .....................................................6.3
Property rights* ....................................................................................... 113 .......... n ..........3.4 Finland .....................................................6.4Intellectual property protection* .............................................................. 120 .......... n ..........2.6 Finland .....................................................6.2
7.02 Efficiency and accountability of public institutions index (1–7) ................... 94 .......... n ..........3.3 Singapore.................................................6.0Judicial efficiency & impartiality in commercial disputes (0–4).................... 63 .......... n ..........2.0 Multiple economies (7) .............................4.0Diversion of public funds* ......................................................................... 98 .......... n ..........2.7 New Zealand ............................................6.5Ease of compliance with government regulation* ...................................... 89 .......... n ..........3.2 Singapore.................................................5.4
7.03 Access to finance index (1–7) .................................................................. 96 .......... n ..........3.4 Hong Kong SAR ......................................5.7Affordability of financial services* ........................................................... 102 .......... n ..........3.7 Hong Kong SAR ......................................6.1Availability of financial services* ................................................................ 95 .......... n ..........3.9 Switzerland ..............................................6.4Ease of access to loans* ........................................................................ 106 .......... n ..........2.3 Qatar ........................................................4.9Availability of trade finance* ...................................................................... 79 .......... n ..........3.7 Hong Kong SAR ......................................5.8
7.04 Openness to foreign participation index (1–7) ......................................... 101 .......... n ..........4.0 Ireland ......................................................5.5Ease of hiring foreign labour* .................................................................. 112 .......... n ..........3.4 United Arab Emirates ...............................5.6Business impact of rules on FDI* .............................................................. 42 .......... n ..........4.9 Ireland ......................................................6.7Openness to multilateral trade rules (0–100) ........................................... 104 .......... n ........54.4 Slovenia .................................................92.2
7.05 Index of physical security (1–7) ................................................................. 90 .......... n ..........4.9 Qatar ........................................................6.8Reliability of police services* ................................................................... 131 .......... n ..........2.6 Finland .....................................................6.7Business costs of crime and violence* .................................................... 102 .......... n ..........3.9 Qatar ........................................................6.8Business costs of terrorism* ................................................................... 108 .......... n ..........4.6 Slovenia ...................................................6.7Homicide cases/100,000 pop. ................................................................. 61 .......... n ..........2.7 Hong Kong SAR ......................................0.2Index of terrorism incidence (1-7) ........................................................... 116 .......... n ..........6.4 Multiple economies (48) ...........................7.0
© 2014 World Economic Forum

Country/Economy Profiles
70 | The Global Enabling Trade Report 2014
* From the list of factors above, respondents were asked to select the five most problematic for trading in their country and to rank them between 1 (most problematic) and 5. The bars in the figure show the responses weighted according to their rankings.
For methodology, indicator descriptions and sources, and for a list of multiple best-performing economies, see page 45.
0 105 15 20 25 30
0 5 10 15 20 25 30
2
3
4
5
6
7
Operating environment
Availability & use of ICTs
Availability & quality of transport services
Availability & quality of transport infrastructure
Efficiency & transparency of border administration
Foreign market access
Domestic market access
1
Enabling Trade Index 2014 Rank Score (out of 138) (1–7)
Enabling Trade Index 2014 .................... 20 ..... 4.9
Subindex A: Market access (25%) ....................75 .......3.4Pillar 1: Domestic market access .....................................46 .........4.9Pillar 2: Foreign market access ........................................97 .........1.9
Subindex B: Border administration (25%) ........23 .......5.6Pillar 3: Efficiency & transparency of border administration ...................................................23 .........5.6
Subindex C: Infrastructure (25%) ......................18 .......5.4Pillar 4: Availability & quality of transport infrastructure ...15 ........ 5.2Pillar 5: Availability & quality of transport services .............6 .........5.7Pillar 6: Availability & use of ICTs .....................................26 .........5.4
Subindex D: Operating environment (25%) ......16 .......5.2Pillar 7: Operating environment ........................................16 ........ 5.2
Key indicators, 2012 Rank/138
Population (millions) ............................................................. 11.1 ........... 66GDP (US$ billions) ............................................................ 483.9 ........... 25GDP per capita (US$) ...................................................43,615.2 ........... 18
Merchandise tradeTrade openness (imports+exports)/GDP ...........................182.2 ............. 3Share of world trade (%) ..................................................... 2.39 ........... 12Total Exports (US$ billions) ............................................... 446.5 ........... 13Total Imports (US$ billions) ................................................437.2 ........... 13
Value chain indicators, 2012Share (%) of merchandise trade Exports Imports
Capital goods ..................................................................... 8.4 ..........8.9
Intermediate goods .......................................................... 53.9 ........ 59.6Food and beverages (industrial) ......................................1.2 .......... 2.3Industrial supplies (primary and processed) .................42.2 .........37.2Parts and accessories .....................................................7.5 .......... 9.0Fuels and lubricants ....................................................... 3.0 .........11.2
Consumer goods .............................................................. 22.9 ........ 19.2Food and beverages (consumer) ..................................... 7.1 .......... 5.2Transport equipment and consumer goods ..................15.9 ........ 13.9
Passenger motor cars ........................................................ 6.3 .......... 5.9
Others .................................................................................. 8.5 .......... 6.4
The most problematic factors for trade, 2013Most problematic factors for exporting Score*
Identifying potential markets and buyers .............................................................. 20.5Tariff barriers abroad .............................................................................................12.0Access to imported inputs at competitive prices ..................................................11.2Burdensome procedures at foreign borders ......................................................... 11.1Technical requirements and standards abroad ...................................................... 9.8Rules of origin requirements abroad ....................................................................... 9.4Access to trade finance ...........................................................................................7.9High cost or delays caused by international transportation ....................................5.7Corruption at foreign borders ................................................................................. 5.3Difficulties in meeting quality/quantity requirements of buyers ............................... 3.8High cost or delays caused by domestic transportation .........................................1.9Inappropriate production technology and skills .......................................................1.1
Most problematic factors for importing Score*
Domestic technical requirements and standards ................................................. 22.9Burdensome import procedures ........................................................................... 21.1High cost or delays caused by international transportation ................................. 20.2Tariffs .....................................................................................................................19.4High cost or delays caused by domestic transportation ........................................ 9.4Inappropriate telecommunications infrastructure ................................................... 3.2Crime and theft ....................................................................................................... 2.9Corruption at the border ......................................................................................... 0.8
Belgium
Sources: International Monetary Fund, World Bank, World Trade Organization, United Nations COMTRADE
Belgium
Advanced economies
© 2014 World Economic Forum
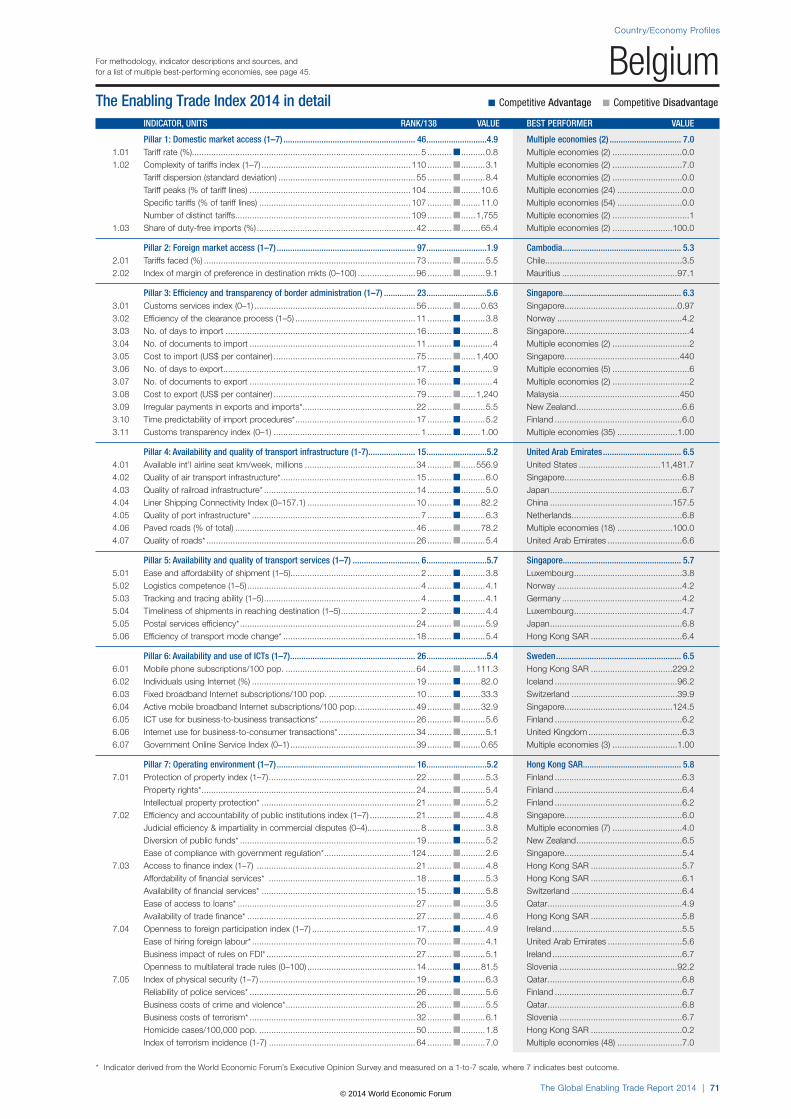
Country/Economy Profiles
The Global Enabling Trade Report 2014 | 71
* Indicator derived from the World Economic Forum’s Executive Opinion Survey and measured on a 1-to-7 scale, where 7 indicates best outcome.
The Enabling Trade Index 2014 in detail n Competitive Advantage n Competitive Disadvantage
For methodology, indicator descriptions and sources, and for a list of multiple best-performing economies, see page 45. Belgium
INDICATOR, UNITS RANK/138 VALUE BEST PERFORMER VALUE
Pillar 1: Domestic market access (1–7) ........................................................... 46 ...........................4.9 Multiple economies (2) ................................ 7.0 1.01 Tariff rate (%)............................................................................................... 5 .......... n ..........0.8 Multiple economies (2) .............................0.0 1.02 Complexity of tariffs index (1–7) .............................................................. 110 .......... n ..........3.1 Multiple economies (2) .............................7.0
Tariff dispersion (standard deviation) ......................................................... 55 .......... n ..........8.4 Multiple economies (2) .............................0.0Tariff peaks (% of tariff lines) ................................................................... 104 .......... n ........10.6 Multiple economies (24) ...........................0.0Specific tariffs (% of tariff lines) ............................................................... 107 .......... n ........11.0 Multiple economies (54) ...........................0.0Number of distinct tariffs ......................................................................... 109 .......... n ......1,755 Multiple economies (2) ................................1
1.03 Share of duty-free imports (%) .................................................................. 42 .......... n ........65.4 Multiple economies (2) .........................100.0
Pillar 2: Foreign market access (1–7) .............................................................. 97 ...........................1.9 Cambodia ..................................................... 5.3 2.01 Tariffs faced (%) ........................................................................................ 73 .......... n ..........5.5 Chile .........................................................3.5 2.02 Index of margin of preference in destination mkts (0–100) ........................ 96 .......... n ..........9.1 Mauritius ................................................97.1
Pillar 3: Efficiency and transparency of border administration (1–7) .............. 23 ...........................5.6 Singapore..................................................... 6.3 3.01 Customs services index (0–1) ................................................................... 56 .......... n ........0.63 Singapore...............................................0.97 3.02 Efficiency of the clearance process (1–5) .................................................. 11 .......... n ..........3.8 Norway ....................................................4.2 3.03 No. of days to import ............................................................................... 16 .......... n .............8 Singapore....................................................4 3.04 No. of documents to import ..................................................................... 11 .......... n .............4 Multiple economies (2) ................................2 3.05 Cost to import (US$ per container) ........................................................... 75 .......... n ......1,400 Singapore................................................440 3.06 No. of days to export................................................................................ 17 .......... n .............9 Multiple economies (5) ................................6 3.07 No. of documents to export ..................................................................... 16 .......... n .............4 Multiple economies (2) ................................2 3.08 Cost to export (US$ per container) ........................................................... 79 .......... n ......1,240 Malaysia ..................................................450 3.09 Irregular payments in exports and imports*............................................... 22 .......... n ..........5.5 New Zealand ............................................6.6 3.10 Time predictability of import procedures* .................................................. 17 .......... n ..........5.2 Finland .....................................................6.0 3.11 Customs transparency index (0–1) ............................................................. 1 .......... n ........1.00 Multiple economies (35) .........................1.00
Pillar 4: Availability and quality of transport infrastructure (1-7) ..................... 15 ...........................5.2 United Arab Emirates ................................... 6.5 4.01 Available int’l airline seat km/week, millions .............................................. 34 .......... n ......556.9 United States ..................................11,481.7 4.02 Quality of air transport infrastructure* ........................................................ 15 .......... n ..........6.0 Singapore.................................................6.8 4.03 Quality of railroad infrastructure* ............................................................... 14 .......... n ..........5.0 Japan .......................................................6.7 4.04 Liner Shipping Connectivity Index (0–157.1) ............................................. 10 .......... n ........82.2 China ...................................................157.5 4.05 Quality of port infrastructure* ...................................................................... 7 .......... n ..........6.3 Netherlands ..............................................6.8 4.06 Paved roads (% of total) ........................................................................... 46 .......... n ........78.2 Multiple economies (18) .......................100.0 4.07 Quality of roads* ....................................................................................... 26 .......... n ..........5.4 United Arab Emirates ...............................6.6
Pillar 5: Availability and quality of transport services (1–7) .............................. 6 ...........................5.7 Singapore..................................................... 5.7 5.01 Ease and affordability of shipment (1–5)...................................................... 2 .......... n ..........3.8 Luxembourg .............................................3.8 5.02 Logistics competence (1–5) ........................................................................ 4 .......... n ..........4.1 Norway ....................................................4.2 5.03 Tracking and tracing ability (1–5) ................................................................. 4 .......... n ..........4.1 Germany ..................................................4.2 5.04 Timeliness of shipments in reaching destination (1–5) ................................. 2 .......... n ..........4.4 Luxembourg .............................................4.7 5.05 Postal services efficiency* ......................................................................... 24 .......... n ..........5.9 Japan .......................................................6.8 5.06 Efficiency of transport mode change* ....................................................... 18 .......... n ..........5.4 Hong Kong SAR ......................................6.4
Pillar 6: Availability and use of ICTs (1–7) ........................................................ 26 ...........................5.4 Sweden ........................................................ 6.5 6.01 Mobile phone subscriptions/100 pop. ...................................................... 64 .......... n ......111.3 Hong Kong SAR ..................................229.2 6.02 Individuals using Internet (%) .................................................................... 19 .......... n ........82.0 Iceland ...................................................96.2 6.03 Fixed broadband Internet subscriptions/100 pop. .................................... 10 .......... n ........33.3 Switzerland ............................................39.9 6.04 Active mobile broadband Internet subscriptions/100 pop. ........................ 49 .......... n ........32.9 Singapore.............................................124.5 6.05 ICT use for business-to-business transactions* ........................................ 26 .......... n ..........5.6 Finland .....................................................6.2 6.06 Internet use for business-to-consumer transactions* ................................ 34 .......... n ..........5.1 United Kingdom .......................................6.3 6.07 Government Online Service Index (0–1) .................................................... 39 .......... n ........0.65 Multiple economies (3) ...........................1.00
Pillar 7: Operating environment (1–7) .............................................................. 16 ...........................5.2 Hong Kong SAR ............................................ 5.8 7.01 Protection of property index (1–7) ............................................................. 22 .......... n ..........5.3 Finland .....................................................6.3
Property rights* ......................................................................................... 24 .......... n ..........5.4 Finland .....................................................6.4Intellectual property protection* ................................................................ 21 .......... n ..........5.2 Finland .....................................................6.2
7.02 Efficiency and accountability of public institutions index (1–7) ................... 21 .......... n ..........4.8 Singapore.................................................6.0Judicial efficiency & impartiality in commercial disputes (0–4)...................... 8 .......... n ..........3.8 Multiple economies (7) .............................4.0Diversion of public funds* ......................................................................... 19 .......... n ..........5.2 New Zealand ............................................6.5Ease of compliance with government regulation* .................................... 124 .......... n ..........2.6 Singapore.................................................5.4
7.03 Access to finance index (1–7) .................................................................. 21 .......... n ..........4.8 Hong Kong SAR ......................................5.7Affordability of financial services* ............................................................. 18 .......... n ..........5.3 Hong Kong SAR ......................................6.1Availability of financial services* ................................................................ 15 .......... n ..........5.8 Switzerland ..............................................6.4Ease of access to loans* .......................................................................... 27 .......... n ..........3.5 Qatar ........................................................4.9Availability of trade finance* ...................................................................... 27 .......... n ..........4.6 Hong Kong SAR ......................................5.8
7.04 Openness to foreign participation index (1–7) ........................................... 17 .......... n ..........4.9 Ireland ......................................................5.5Ease of hiring foreign labour* .................................................................... 70 .......... n ..........4.1 United Arab Emirates ...............................5.6Business impact of rules on FDI* .............................................................. 27 .......... n ..........5.1 Ireland ......................................................6.7Openness to multilateral trade rules (0–100) ............................................. 14 .......... n ........81.5 Slovenia .................................................92.2
7.05 Index of physical security (1–7) ................................................................. 19 .......... n ..........6.3 Qatar ........................................................6.8Reliability of police services* ..................................................................... 26 .......... n ..........5.6 Finland .....................................................6.7Business costs of crime and violence* ...................................................... 26 .......... n ..........5.5 Qatar ........................................................6.8Business costs of terrorism* ..................................................................... 32 .......... n ..........6.1 Slovenia ...................................................6.7Homicide cases/100,000 pop. ................................................................. 50 .......... n ..........1.8 Hong Kong SAR ......................................0.2Index of terrorism incidence (1-7) ............................................................. 64 .......... n ..........7.0 Multiple economies (48) ...........................7.0
© 2014 World Economic Forum

Country/Economy Profiles
72 | The Global Enabling Trade Report 2014
* From the list of factors above, respondents were asked to select the five most problematic for trading in their country and to rank them between 1 (most problematic) and 5. The bars in the figure show the responses weighted according to their rankings.
For methodology, indicator descriptions and sources, and for a list of multiple best-performing economies, see page 45.
0 105 15 20 25 30
0 5 10 15 20 25 30
2
3
4
5
6
7
Operating environment
Availability & use of ICTs
Availability & quality of transport services
Availability & quality of transport infrastructure
Efficiency & transparency of border administration
Foreign market access
Domestic market access
1
Enabling Trade Index 2014 Rank Score (out of 138) (1–7)
Enabling Trade Index 2014 ...................127 ......3.1
Subindex A: Market access (25%) .................. 124 .......3.0Pillar 1: Domestic market access ................................... 117 ........ 3.5Pillar 2: Foreign market access ........................................ 74 .........2.4
Subindex B: Border administration (25%) ...... 112 .......3.4Pillar 3: Efficiency & transparency of border administration ................................................. 112 .........3.4
Subindex C: Infrastructure (25%) ....................126 .......2.6Pillar 4: Availability & quality of transport infrastructure .133 .........2.1Pillar 5: Availability & quality of transport services .........122 ........ 3.3Pillar 6: Availability & use of ICTs ................................... 117 .........2.4
Subindex D: Operating environment (25%) ....123 .......3.4Pillar 7: Operating environment ......................................123 .........3.4
Key indicators, 2012 Rank/138
Population (millions) .............................................................10.1 ........... 76GDP (US$ billions) .................................................................7.6 ......... 125GDP per capita (US$) ........................................................752.7 ......... 124
Merchandise tradeTrade openness (imports+exports)/GDP .............................47.6 ......... 105Share of world trade (%) ......................................................0.01 ......... 130Total Exports (US$ billions) ....................................................1.4 ......... 126Total Imports (US$ billions) ................................................... 2.2 ......... 133
The most problematic factors for trade, 2013Most problematic factors for exporting Score*
Access to trade finance .........................................................................................16.6Difficulties in meeting quality/quantity requirements of buyers ..............................16.0Identifying potential markets and buyers ...............................................................14.8Inappropriate production technology and skills .....................................................11.0Access to imported inputs at competitive prices ................................................... 9.5Technical requirements and standards abroad .......................................................7.4Burdensome procedures at foreign borders ...........................................................7.0High cost or delays caused by international transportation ................................... 5.4High cost or delays caused by domestic transportation ........................................ 3.9Tariff barriers abroad .............................................................................................. 3.4Corruption at foreign borders ..................................................................................2.7Rules of origin requirements abroad ....................................................................... 2.4
Most problematic factors for importing Score*
Burdensome import procedures .......................................................................... 25.4Tariffs .................................................................................................................... 23.6Corruption at the border ........................................................................................18.5High cost or delays caused by international transportation ..................................11.3High cost or delays caused by domestic transportation ........................................ 8.0Crime and theft ....................................................................................................... 4.9Domestic technical requirements and standards ................................................... 4.2Inappropriate telecommunications infrastructure ....................................................4.1
Benin
Sources: International Monetary Fund, World Bank, World Trade Organization, United Nations COMTRADE
Benin Least Developed Countries
Sub-Saharan Africa
© 2014 World Economic Forum

Country/Economy Profiles
The Global Enabling Trade Report 2014 | 73
* Indicator derived from the World Economic Forum’s Executive Opinion Survey and measured on a 1-to-7 scale, where 7 indicates best outcome.
The Enabling Trade Index 2014 in detail n Competitive Advantage n Competitive Disadvantage
For methodology, indicator descriptions and sources, and for a list of multiple best-performing economies, see page 45. Benin
INDICATOR, UNITS RANK/138 VALUE BEST PERFORMER VALUE
Pillar 1: Domestic market access (1–7) ......................................................... 117 ...........................3.5 Multiple economies (2) ................................ 7.0 1.01 Tariff rate (%)........................................................................................... 108 .......... n ........10.8 Multiple economies (2) .............................0.0 1.02 Complexity of tariffs index (1–7) .................................................................. 6 .......... n ..........6.7 Multiple economies (2) .............................7.0
Tariff dispersion (standard deviation) ......................................................... 26 .......... n ..........6.8 Multiple economies (2) .............................0.0Tariff peaks (% of tariff lines) ....................................................................... 1 .......... n ..........0.0 Multiple economies (24) ...........................0.0Specific tariffs (% of tariff lines) ................................................................... 1 .......... n ..........0.0 Multiple economies (54) ...........................0.0Number of distinct tariffs ............................................................................. 5 .......... n .............4 Multiple economies (2) ................................1
1.03 Share of duty-free imports (%) ................................................................ 129 .......... n ..........4.4 Multiple economies (2) .........................100.0
Pillar 2: Foreign market access (1–7) .............................................................. 74 ...........................2.4 Cambodia ..................................................... 5.3 2.01 Tariffs faced (%) ........................................................................................ 38 .......... n ..........5.3 Chile .........................................................3.5 2.02 Index of margin of preference in destination mkts (0–100) ........................ 82 .......... n ........17.8 Mauritius ................................................97.1
Pillar 3: Efficiency and transparency of border administration (1–7) ............ 112 ...........................3.4 Singapore..................................................... 6.3 3.01 Customs services index (0–1) ................................................................. 109 .......... n ........0.26 Singapore...............................................0.97 3.02 Efficiency of the clearance process (1–5) .................................................. 72 .......... n ..........2.6 Norway ....................................................4.2 3.03 No. of days to import ............................................................................. 101 .......... n ...........27 Singapore....................................................4 3.04 No. of documents to import ..................................................................... 57 .......... n .............7 Multiple economies (2) ................................2 3.05 Cost to import (US$ per container) ........................................................... 86 .......... n ......1,520 Singapore................................................440 3.06 No. of days to export.............................................................................. 110 .......... n ...........26 Multiple economies (5) ................................6 3.07 No. of documents to export ..................................................................... 65 .......... n .............6 Multiple economies (2) ................................2 3.08 Cost to export (US$ per container) ........................................................... 53 .......... n ......1,030 Malaysia ..................................................450 3.09 Irregular payments in exports and imports*............................................. 131 .......... n ..........2.1 New Zealand ............................................6.6 3.10 Time predictability of import procedures* ................................................ 106 .......... n ..........3.3 Finland .....................................................6.0 3.11 Customs transparency index (0–1) ......................................................... 106 .......... n ........0.40 Multiple economies (35) .........................1.00
Pillar 4: Availability and quality of transport infrastructure (1-7) ................... 133 ...........................2.1 United Arab Emirates ................................... 6.5 4.01 Available int’l airline seat km/week, millions ............................................ 119 .......... n ........20.2 United States ..................................11,481.7 4.02 Quality of air transport infrastructure* ...................................................... 125 .......... n ..........3.0 Singapore.................................................6.8 4.03 Quality of railroad infrastructure* ............................................................. 105 .......... n ..........1.4 Japan .......................................................6.7 4.04 Liner Shipping Connectivity Index (0–157.1) ............................................. 69 .......... n ........14.3 China ...................................................157.5 4.05 Quality of port infrastructure* .................................................................... 87 .......... n ..........3.7 Netherlands ..............................................6.8 4.06 Paved roads (% of total) ......................................................................... 129 .......... n ..........9.5 Multiple economies (18) .......................100.0 4.07 Quality of roads* ..................................................................................... 112 .......... n ..........2.8 United Arab Emirates ...............................6.6
Pillar 5: Availability and quality of transport services (1–7) .......................... 122 ...........................3.3 Singapore..................................................... 5.7 5.01 Ease and affordability of shipment (1–5).................................................... 96 .......... n ..........2.7 Luxembourg .............................................3.8 5.02 Logistics competence (1–5) .................................................................... 118 .......... n ..........2.4 Norway ....................................................4.2 5.03 Tracking and tracing ability (1–5) ............................................................. 116 .......... n ..........2.5 Germany ..................................................4.2 5.04 Timeliness of shipments in reaching destination (1–5) ............................. 112 .......... n ..........2.9 Luxembourg .............................................4.7 5.05 Postal services efficiency* ....................................................................... 104 .......... n ..........3.5 Japan .......................................................6.8 5.06 Efficiency of transport mode change* ..................................................... 132 .......... n ..........2.5 Hong Kong SAR ......................................6.4
Pillar 6: Availability and use of ICTs (1–7) ...................................................... 117 ...........................2.4 Sweden ........................................................ 6.5 6.01 Mobile phone subscriptions/100 pop. .................................................... 104 .......... n ........83.7 Hong Kong SAR ..................................229.2 6.02 Individuals using Internet (%) .................................................................. 127 .......... n ..........3.8 Iceland ...................................................96.2 6.03 Fixed broadband Internet subscriptions/100 pop. .................................. 125 .......... n ..........0.1 Switzerland ............................................39.9 6.04 Active mobile broadband Internet subscriptions/100 pop. ...................... 127 .......... n ..........0.0 Singapore.............................................124.5 6.05 ICT use for business-to-business transactions* ...................................... 121 .......... n ..........4.0 Finland .....................................................6.2 6.06 Internet use for business-to-consumer transactions* .............................. 107 .......... n ..........3.7 United Kingdom .......................................6.3 6.07 Government Online Service Index (0–1) .................................................. 125 .......... n ........0.20 Multiple economies (3) ...........................1.00
Pillar 7: Operating environment (1–7) ............................................................ 123 ...........................3.4 Hong Kong SAR ............................................ 5.8 7.01 Protection of property index (1–7) ............................................................. 98 .......... n ..........3.3 Finland .....................................................6.3
Property rights* ....................................................................................... 109 .......... n ..........3.4 Finland .....................................................6.4Intellectual property protection* ................................................................ 94 .......... n ..........3.1 Finland .....................................................6.2
7.02 Efficiency and accountability of public institutions index (1–7) ................. 136 .......... n ..........2.3 Singapore.................................................6.0Judicial efficiency & impartiality in commercial disputes (0–4).................. 124 .......... n ..........0.5 Multiple economies (7) .............................4.0Diversion of public funds* ....................................................................... 109 .......... n ..........2.4 New Zealand ............................................6.5Ease of compliance with government regulation* .................................... 114 .......... n ..........2.8 Singapore.................................................5.4
7.03 Access to finance index (1–7) ................................................................ 122 .......... n ..........2.9 Hong Kong SAR ......................................5.7Affordability of financial services* ........................................................... 123 .......... n ..........3.2 Hong Kong SAR ......................................6.1Availability of financial services* .............................................................. 125 .......... n ..........3.3 Switzerland ..............................................6.4Ease of access to loans* ........................................................................ 108 .......... n ..........2.2 Qatar ........................................................4.9Availability of trade finance* .................................................................... 121 .......... n ..........2.7 Hong Kong SAR ......................................5.8
7.04 Openness to foreign participation index (1–7) ......................................... 117 .......... n ..........3.6 Ireland ......................................................5.5Ease of hiring foreign labour* .................................................................... 80 .......... n ..........4.0 United Arab Emirates ...............................5.6Business impact of rules on FDI* ............................................................ 128 .......... n ..........3.2 Ireland ......................................................6.7Openness to multilateral trade rules (0–100) ........................................... 102 .......... n ........54.8 Slovenia .................................................92.2
7.05 Index of physical security (1–7) ................................................................. 89 .......... n ..........4.9 Qatar ........................................................6.8Reliability of police services* ..................................................................... 56 .......... n ..........4.4 Finland .....................................................6.7Business costs of crime and violence* ...................................................... 91 .......... n ..........4.2 Qatar ........................................................6.8Business costs of terrorism* ..................................................................... 94 .......... n ..........5.0 Slovenia ...................................................6.7Homicide cases/100,000 pop. ............................................................... 113 .......... n ........15.1 Hong Kong SAR ......................................0.2Index of terrorism incidence (1-7) ............................................................... 1 .......... n ..........7.0 Multiple economies (48) ...........................7.0
© 2014 World Economic Forum
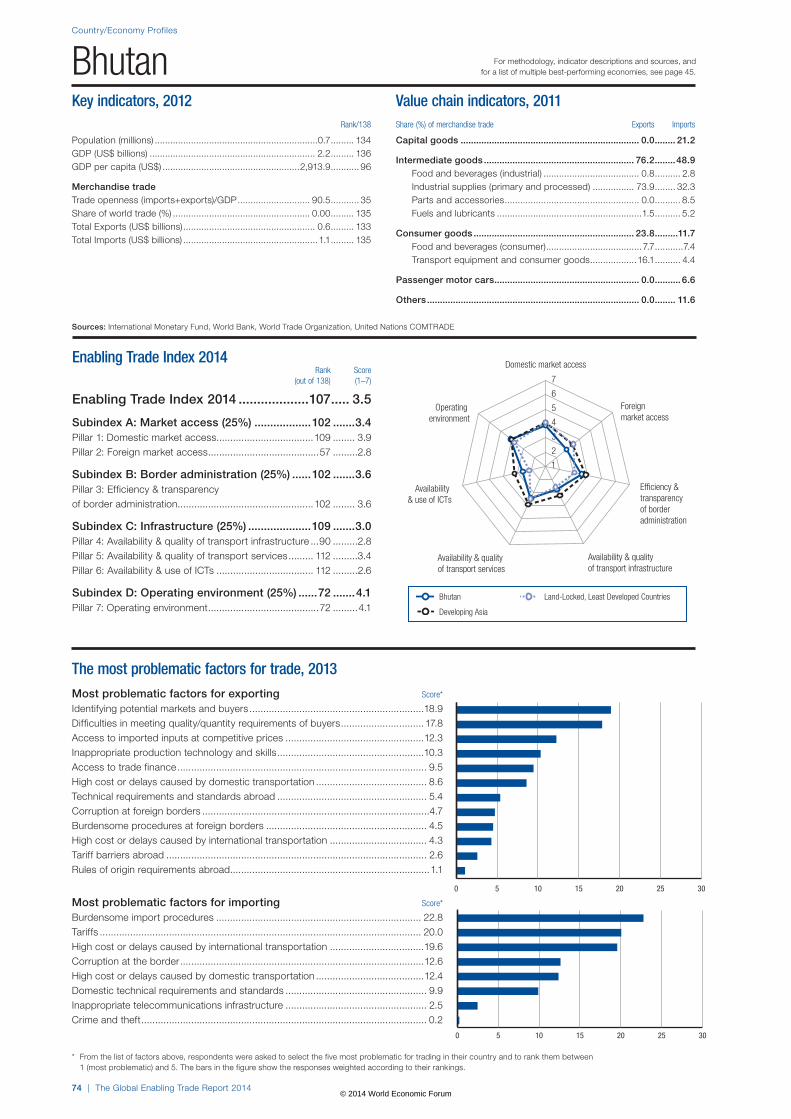
Country/Economy Profiles
74 | The Global Enabling Trade Report 2014
* From the list of factors above, respondents were asked to select the five most problematic for trading in their country and to rank them between 1 (most problematic) and 5. The bars in the figure show the responses weighted according to their rankings.
For methodology, indicator descriptions and sources, and for a list of multiple best-performing economies, see page 45.
0 105 15 20 25 30
0 5 10 15 20 25 30
2
3
4
5
6
7
Operating environment
Availability & use of ICTs
Availability & quality of transport services
Availability & quality of transport infrastructure
Efficiency & transparency of border administration
Foreign market access
Domestic market access
1
Enabling Trade Index 2014 Rank Score (out of 138) (1–7)
Enabling Trade Index 2014 ...................107 ..... 3.5
Subindex A: Market access (25%) ..................102 .......3.4Pillar 1: Domestic market access ...................................109 ........ 3.9Pillar 2: Foreign market access ........................................57 .........2.8
Subindex B: Border administration (25%) ......102 .......3.6Pillar 3: Efficiency & transparency of border administration .................................................102 ........ 3.6
Subindex C: Infrastructure (25%) ....................109 .......3.0Pillar 4: Availability & quality of transport infrastructure ...90 .........2.8Pillar 5: Availability & quality of transport services ......... 112 .........3.4Pillar 6: Availability & use of ICTs ................................... 112 .........2.6
Subindex D: Operating environment (25%) ......72 .......4.1Pillar 7: Operating environment ........................................72 .........4.1
Key indicators, 2012 Rank/138
Population (millions) ...............................................................0.7 ......... 134GDP (US$ billions) ................................................................ 2.2 ......... 136GDP per capita (US$) .....................................................2,913.9 ........... 96
Merchandise tradeTrade openness (imports+exports)/GDP ............................ 90.5 ........... 35Share of world trade (%) ..................................................... 0.00 ......... 135Total Exports (US$ billions) ................................................... 0.6 ......... 133Total Imports (US$ billions) ....................................................1.1 ......... 135
Value chain indicators, 2011Share (%) of merchandise trade Exports Imports
Capital goods ..................................................................... 0.0 ........ 21.2
Intermediate goods .......................................................... 76.2 ........48.9Food and beverages (industrial) ..................................... 0.8 .......... 2.8Industrial supplies (primary and processed) ................ 73.9 ........ 32.3Parts and accessories .................................................... 0.0 .......... 8.5Fuels and lubricants ........................................................1.5 .......... 5.2
Consumer goods .............................................................. 23.8 .........11.7Food and beverages (consumer) .....................................7.7 ...........7.4Transport equipment and consumer goods ..................16.1 .......... 4.4
Passenger motor cars ........................................................ 0.0 .......... 6.6
Others .................................................................................. 0.0 ........ 11.6
The most problematic factors for trade, 2013Most problematic factors for exporting Score*
Identifying potential markets and buyers ...............................................................18.9Difficulties in meeting quality/quantity requirements of buyers .............................. 17.8Access to imported inputs at competitive prices ..................................................12.3Inappropriate production technology and skills .....................................................10.3Access to trade finance .......................................................................................... 9.5High cost or delays caused by domestic transportation ........................................ 8.6Technical requirements and standards abroad ...................................................... 5.4Corruption at foreign borders ..................................................................................4.7Burdensome procedures at foreign borders .......................................................... 4.5High cost or delays caused by international transportation ................................... 4.3Tariff barriers abroad .............................................................................................. 2.6Rules of origin requirements abroad ........................................................................1.1
Most problematic factors for importing Score*
Burdensome import procedures .......................................................................... 22.8Tariffs .................................................................................................................... 20.0High cost or delays caused by international transportation ..................................19.6Corruption at the border ........................................................................................12.6High cost or delays caused by domestic transportation .......................................12.4Domestic technical requirements and standards ................................................... 9.9Inappropriate telecommunications infrastructure ................................................... 2.5Crime and theft ....................................................................................................... 0.2
Bhutan
Sources: International Monetary Fund, World Bank, World Trade Organization, United Nations COMTRADE
Bhutan Land-Locked, Least Developed Countries
Developing Asia
© 2014 World Economic Forum

Country/Economy Profiles
The Global Enabling Trade Report 2014 | 75
* Indicator derived from the World Economic Forum’s Executive Opinion Survey and measured on a 1-to-7 scale, where 7 indicates best outcome.
The Enabling Trade Index 2014 in detail n Competitive Advantage n Competitive Disadvantage
For methodology, indicator descriptions and sources, and for a list of multiple best-performing economies, see page 45. Bhutan
INDICATOR, UNITS RANK/138 VALUE BEST PERFORMER VALUE
Pillar 1: Domestic market access (1–7) ......................................................... 109 ...........................3.9 Multiple economies (2) ................................ 7.0 1.01 Tariff rate (%)........................................................................................... 137 .......... n ........22.7 Multiple economies (2) .............................0.0 1.02 Complexity of tariffs index (1–7) ................................................................ 52 .......... n ..........6.3 Multiple economies (2) .............................7.0
Tariff dispersion (standard deviation) ....................................................... 118 .......... n ........13.7 Multiple economies (2) .............................0.0Tariff peaks (% of tariff lines) ..................................................................... 45 .......... n ..........0.8 Multiple economies (24) ...........................0.0Specific tariffs (% of tariff lines) ................................................................... 1 .......... n ..........0.0 Multiple economies (54) ...........................0.0Number of distinct tariffs ........................................................................... 32 .......... n .............8 Multiple economies (2) ................................1
1.03 Share of duty-free imports (%) .................................................................. 81 .......... n ........55.2 Multiple economies (2) .........................100.0
Pillar 2: Foreign market access (1–7) .............................................................. 57 ...........................2.8 Cambodia ..................................................... 5.3 2.01 Tariffs faced (%) ...................................................................................... 137 .......... n ........13.3 Chile .........................................................3.5 2.02 Index of margin of preference in destination mkts (0–100) ........................ 12 .......... n ........61.5 Mauritius ................................................97.1
Pillar 3: Efficiency and transparency of border administration (1–7) ............ 102 ...........................3.6 Singapore..................................................... 6.3 3.01 Customs services index (0–1) ................................................................... 80 .......... n ........0.50 Singapore...............................................0.97 3.02 Efficiency of the clearance process (1–5) ................................................ 125 .......... n ..........2.1 Norway ....................................................4.2 3.03 No. of days to import ............................................................................. 123 .......... n ...........38 Singapore....................................................4 3.04 No. of documents to import ................................................................... 134 .......... n ...........12 Multiple economies (2) ................................2 3.05 Cost to import (US$ per container) ......................................................... 115 .......... n ......2,330 Singapore................................................440 3.06 No. of days to export.............................................................................. 127 .......... n ...........38 Multiple economies (5) ................................6 3.07 No. of documents to export ................................................................... 121 .......... n .............9 Multiple economies (2) ................................2 3.08 Cost to export (US$ per container) ......................................................... 120 .......... n ......2,230 Malaysia ..................................................450 3.09 Irregular payments in exports and imports*............................................... 51 .......... n ..........4.1 New Zealand ............................................6.6 3.10 Time predictability of import procedures* .................................................. 80 .......... n ..........3.7 Finland .....................................................6.0 3.11 Customs transparency index (0–1) ........................................................... 59 .......... n ........0.80 Multiple economies (35) .........................1.00
Pillar 4: Availability and quality of transport infrastructure (1-7) ..................... 90 ...........................2.8 United Arab Emirates ................................... 6.5 4.01 Available int’l airline seat km/week, millions ............................................ 137 .......... n ..........2.2 United States ..................................11,481.7 4.02 Quality of air transport infrastructure* ...................................................... 107 .......... n ..........3.5 Singapore.................................................6.8 4.03 Quality of railroad infrastructure* .............................................................. n/a ........................n/a Japan .......................................................6.7 4.04 Liner Shipping Connectivity Index (0–157.1) ............................................ n/a ........................n/a China ...................................................157.5 4.05 Quality of port infrastructure* .................................................................. 136 .......... n ..........2.2 Netherlands ..............................................6.8 4.06 Paved roads (% of total) ........................................................................... 76 .......... n ........40.4 Multiple economies (18) .......................100.0 4.07 Quality of roads* ....................................................................................... 52 .......... n ..........4.3 United Arab Emirates ...............................6.6
Pillar 5: Availability and quality of transport services (1–7) .......................... 112 ...........................3.4 Singapore..................................................... 5.7 5.01 Ease and affordability of shipment (1–5).................................................. 123 .......... n ..........2.4 Luxembourg .............................................3.8 5.02 Logistics competence (1–5) .................................................................... 110 .......... n ..........2.5 Norway ....................................................4.2 5.03 Tracking and tracing ability (1–5) ............................................................. 127 .......... n ..........2.3 Germany ..................................................4.2 5.04 Timeliness of shipments in reaching destination (1–5) ............................. 138 .......... n ..........2.3 Luxembourg .............................................4.7 5.05 Postal services efficiency* ......................................................................... 48 .......... n ..........5.0 Japan .......................................................6.8 5.06 Efficiency of transport mode change* ....................................................... 94 .......... n ..........3.5 Hong Kong SAR ......................................6.4
Pillar 6: Availability and use of ICTs (1–7) ...................................................... 112 ...........................2.6 Sweden ........................................................ 6.5 6.01 Mobile phone subscriptions/100 pop. .................................................... 111 .......... n ........75.6 Hong Kong SAR ..................................229.2 6.02 Individuals using Internet (%) .................................................................... 93 .......... n ........25.4 Iceland ...................................................96.2 6.03 Fixed broadband Internet subscriptions/100 pop. .................................... 86 .......... n ..........2.3 Switzerland ............................................39.9 6.04 Active mobile broadband Internet subscriptions/100 pop. ...................... 106 .......... n ..........2.5 Singapore.............................................124.5 6.05 ICT use for business-to-business transactions* ...................................... 125 .......... n ..........3.8 Finland .....................................................6.2 6.06 Internet use for business-to-consumer transactions* .............................. 133 .......... n ..........3.0 United Kingdom .......................................6.3 6.07 Government Online Service Index (0–1) .................................................... 99 .......... n ........0.35 Multiple economies (3) ...........................1.00
Pillar 7: Operating environment (1–7) .............................................................. 72 ...........................4.1 Hong Kong SAR ............................................ 5.8 7.01 Protection of property index (1–7) ............................................................. 50 .......... n ..........4.2 Finland .....................................................6.3
Property rights* ......................................................................................... 59 .......... n ..........4.3 Finland .....................................................6.4Intellectual property protection* ................................................................ 41 .......... n ..........4.1 Finland .....................................................6.2
7.02 Efficiency and accountability of public institutions index (1–7) ................... 42 .......... n ..........4.0 Singapore.................................................6.0Judicial efficiency & impartiality in commercial disputes (0–4)................... n/a ........................n/a Multiple economies (7) .............................4.0Diversion of public funds* ......................................................................... 34 .......... n ..........4.5 New Zealand ............................................6.5Ease of compliance with government regulation* ...................................... 60 .......... n ..........3.5 Singapore.................................................5.4
7.03 Access to finance index (1–7) .................................................................. 87 .......... n ..........3.5 Hong Kong SAR ......................................5.7Affordability of financial services* ............................................................. 86 .......... n ..........3.9 Hong Kong SAR ......................................6.1Availability of financial services* .............................................................. 108 .......... n ..........3.8 Switzerland ..............................................6.4Ease of access to loans* .......................................................................... 89 .......... n ..........2.5 Qatar ........................................................4.9Availability of trade finance* ...................................................................... 53 .......... n ..........4.0 Hong Kong SAR ......................................5.8
7.04 Openness to foreign participation index (1–7) ......................................... 134 .......... n ..........2.8 Ireland ......................................................5.5Ease of hiring foreign labour* .................................................................. 128 .......... n ..........3.1 United Arab Emirates ...............................5.6Business impact of rules on FDI* .............................................................. 79 .......... n ..........4.4 Ireland ......................................................6.7Openness to multilateral trade rules (0–100) ........................................... 135 .......... n ........19.1 Slovenia .................................................92.2
7.05 Index of physical security (1–7) ................................................................. 41 .......... n ..........5.9 Qatar ........................................................6.8Reliability of police services* ..................................................................... 39 .......... n ..........4.9 Finland .....................................................6.7Business costs of crime and violence* ...................................................... 41 .......... n ..........5.2 Qatar ........................................................6.8Business costs of terrorism* ..................................................................... 66 .......... n ..........5.4 Slovenia ...................................................6.7Homicide cases/100,000 pop. ................................................................. 26 .......... n ..........1.0 Hong Kong SAR ......................................0.2Index of terrorism incidence (1-7) ............................................................. 64 .......... n ..........7.0 Multiple economies (48) ...........................7.0
© 2014 World Economic Forum

Country/Economy Profiles
76 | The Global Enabling Trade Report 2014
* From the list of factors above, respondents were asked to select the five most problematic for trading in their country and to rank them between 1 (most problematic) and 5. The bars in the figure show the responses weighted according to their rankings.
For methodology, indicator descriptions and sources, and for a list of multiple best-performing economies, see page 45.
0 105 15 20 25 30
0 5 10 15 20 25 30
2
3
4
5
6
7
Operating environment
Availability & use of ICTs
Availability & quality of transport services
Availability & quality of transport infrastructure
Efficiency & transparency of border administration
Foreign market access
Domestic market access
1
Enabling Trade Index 2014 Rank Score (out of 138) (1–7)
Enabling Trade Index 2014 .................... 87 ......3.7
Subindex A: Market access (25%) ....................26 .......4.3Pillar 1: Domestic market access .....................................83 .........4.7Pillar 2: Foreign market access ........................................15 ........ 3.9
Subindex B: Border administration (25%) ........93 .......3.8Pillar 3: Efficiency & transparency of border administration ...................................................93 ........ 3.8
Subindex C: Infrastructure (25%) ....................105 .......3.0Pillar 4: Availability & quality of transport infrastructure . 110 .........2.5Pillar 5: Availability & quality of transport services ......... 114 .........3.4Pillar 6: Availability & use of ICTs .....................................94 .........3.1
Subindex D: Operating environment (25%) ......96 .......3.8Pillar 7: Operating environment ........................................96 ........ 3.8
Key indicators, 2012 Rank/138
Population (millions) .............................................................10.8 ........... 68GDP (US$ billions) ...............................................................27.2 ........... 89GDP per capita (US$) .....................................................2,514.3 ........... 99
Merchandise tradeTrade openness (imports+exports)/GDP ............................ 70.3 ........... 63Share of world trade (%) ..................................................... 0.05 ........... 89Total Exports (US$ billions) .................................................. 11.1 ........... 81Total Imports (US$ billions) ................................................... 8.3 ........... 97
Value chain indicators, 2012Share (%) of merchandise trade Exports Imports
Capital goods ......................................................................0.1 ........22.6
Intermediate goods .......................................................... 95.8 ........42.8Food and beverages (industrial) ......................................5.1 .......... 2.3Industrial supplies (primary and processed) ................ 40.6 ........ 30.6Parts and accessories .................................................... 0.3 .......... 9.0Fuels and lubricants ..................................................... 49.8 .......... 0.9
Consumer goods ................................................................ 3.7 ........ 16.3Food and beverages (consumer) .....................................2.6 .......... 4.6Transport equipment and consumer goods ....................1.1 .........11.7
Passenger motor cars ........................................................ 0.0 .......... 4.1
Others .................................................................................. 0.3 ........ 14.1
The most problematic factors for trade, 2013Most problematic factors for exporting Score*
Access to trade finance .........................................................................................16.1Identifying potential markets and buyers ...............................................................14.3Access to imported inputs at competitive prices ..................................................13.6High cost or delays caused by domestic transportation .......................................11.0Inappropriate production technology and skills ...................................................... 9.0High cost or delays caused by international transportation ................................... 8.6Difficulties in meeting quality/quantity requirements of buyers ................................7.9Technical requirements and standards abroad ...................................................... 5.6Tariff barriers abroad .............................................................................................. 4.0Burdensome procedures at foreign borders .......................................................... 3.7Corruption at foreign borders ................................................................................. 3.2Rules of origin requirements abroad ........................................................................3.1
Most problematic factors for importing Score*
Corruption at the border ........................................................................................20.1Tariffs .....................................................................................................................18.9Burdensome import procedures ...........................................................................15.1High cost or delays caused by international transportation ..................................13.7High cost or delays caused by domestic transportation .......................................11.2Inappropriate telecommunications infrastructure ....................................................7.2Domestic technical requirements and standards .................................................... 7.1Crime and theft ....................................................................................................... 6.8
Bolivia
Sources: International Monetary Fund, World Bank, World Trade Organization, United Nations COMTRADE
Bolivia Land-Locked Developing Countries
South America
© 2014 World Economic Forum
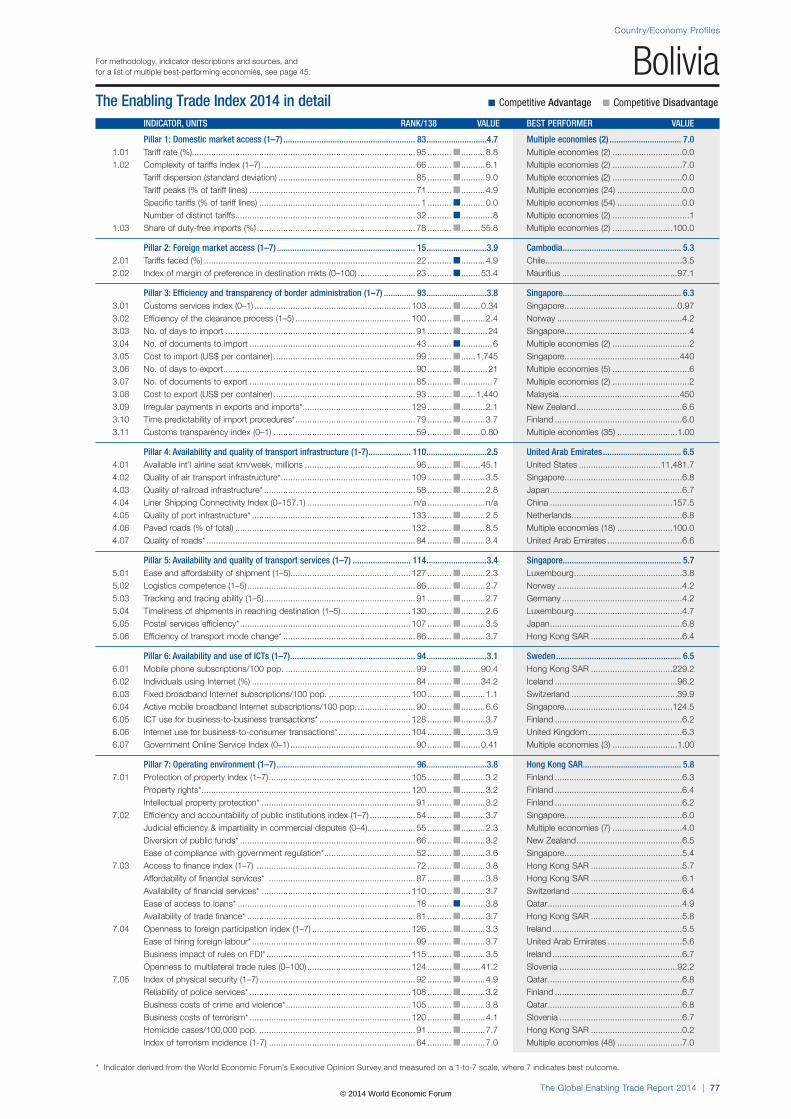
Country/Economy Profiles
The Global Enabling Trade Report 2014 | 77
* Indicator derived from the World Economic Forum’s Executive Opinion Survey and measured on a 1-to-7 scale, where 7 indicates best outcome.
The Enabling Trade Index 2014 in detail n Competitive Advantage n Competitive Disadvantage
For methodology, indicator descriptions and sources, and for a list of multiple best-performing economies, see page 45. Bolivia
INDICATOR, UNITS RANK/138 VALUE BEST PERFORMER VALUE
Pillar 1: Domestic market access (1–7) ........................................................... 83 ...........................4.7 Multiple economies (2) ................................ 7.0 1.01 Tariff rate (%)............................................................................................. 95 .......... n ..........8.8 Multiple economies (2) .............................0.0 1.02 Complexity of tariffs index (1–7) ................................................................ 66 .......... n ..........6.1 Multiple economies (2) .............................7.0
Tariff dispersion (standard deviation) ......................................................... 85 .......... n ..........9.0 Multiple economies (2) .............................0.0Tariff peaks (% of tariff lines) ..................................................................... 71 .......... n ..........4.9 Multiple economies (24) ...........................0.0Specific tariffs (% of tariff lines) ................................................................... 1 .......... n ..........0.0 Multiple economies (54) ...........................0.0Number of distinct tariffs ........................................................................... 32 .......... n .............8 Multiple economies (2) ................................1
1.03 Share of duty-free imports (%) .................................................................. 78 .......... n ........55.8 Multiple economies (2) .........................100.0
Pillar 2: Foreign market access (1–7) .............................................................. 15 ...........................3.9 Cambodia ..................................................... 5.3 2.01 Tariffs faced (%) ........................................................................................ 22 .......... n ..........4.9 Chile .........................................................3.5 2.02 Index of margin of preference in destination mkts (0–100) ........................ 23 .......... n ........53.4 Mauritius ................................................97.1
Pillar 3: Efficiency and transparency of border administration (1–7) .............. 93 ...........................3.8 Singapore..................................................... 6.3 3.01 Customs services index (0–1) ................................................................. 103 .......... n ........0.34 Singapore...............................................0.97 3.02 Efficiency of the clearance process (1–5) ................................................ 100 .......... n ..........2.4 Norway ....................................................4.2 3.03 No. of days to import ............................................................................... 91 .......... n ...........24 Singapore....................................................4 3.04 No. of documents to import ..................................................................... 43 .......... n .............6 Multiple economies (2) ................................2 3.05 Cost to import (US$ per container) ........................................................... 99 .......... n ......1,745 Singapore................................................440 3.06 No. of days to export................................................................................ 90 .......... n ...........21 Multiple economies (5) ................................6 3.07 No. of documents to export ..................................................................... 85 .......... n .............7 Multiple economies (2) ................................2 3.08 Cost to export (US$ per container) ........................................................... 93 .......... n ......1,440 Malaysia ..................................................450 3.09 Irregular payments in exports and imports*............................................. 129 .......... n ..........2.1 New Zealand ............................................6.6 3.10 Time predictability of import procedures* .................................................. 79 .......... n ..........3.7 Finland .....................................................6.0 3.11 Customs transparency index (0–1) ........................................................... 59 .......... n ........0.80 Multiple economies (35) .........................1.00
Pillar 4: Availability and quality of transport infrastructure (1-7) ................... 110 ...........................2.5 United Arab Emirates ................................... 6.5 4.01 Available int’l airline seat km/week, millions .............................................. 96 .......... n ........45.1 United States ..................................11,481.7 4.02 Quality of air transport infrastructure* ...................................................... 109 .......... n ..........3.5 Singapore.................................................6.8 4.03 Quality of railroad infrastructure* ............................................................... 58 .......... n ..........2.8 Japan .......................................................6.7 4.04 Liner Shipping Connectivity Index (0–157.1) ............................................ n/a ........................n/a China ...................................................157.5 4.05 Quality of port infrastructure* .................................................................. 133 .......... n ..........2.5 Netherlands ..............................................6.8 4.06 Paved roads (% of total) ......................................................................... 132 .......... n ..........8.5 Multiple economies (18) .......................100.0 4.07 Quality of roads* ....................................................................................... 84 .......... n ..........3.4 United Arab Emirates ...............................6.6
Pillar 5: Availability and quality of transport services (1–7) .......................... 114 ...........................3.4 Singapore..................................................... 5.7 5.01 Ease and affordability of shipment (1–5).................................................. 127 .......... n ..........2.3 Luxembourg .............................................3.8 5.02 Logistics competence (1–5) ...................................................................... 86 .......... n ..........2.7 Norway ....................................................4.2 5.03 Tracking and tracing ability (1–5) ............................................................... 91 .......... n ..........2.7 Germany ..................................................4.2 5.04 Timeliness of shipments in reaching destination (1–5) ............................. 130 .......... n ..........2.6 Luxembourg .............................................4.7 5.05 Postal services efficiency* ....................................................................... 107 .......... n ..........3.5 Japan .......................................................6.8 5.06 Efficiency of transport mode change* ....................................................... 86 .......... n ..........3.7 Hong Kong SAR ......................................6.4
Pillar 6: Availability and use of ICTs (1–7) ........................................................ 94 ...........................3.1 Sweden ........................................................ 6.5 6.01 Mobile phone subscriptions/100 pop. ...................................................... 99 .......... n ........90.4 Hong Kong SAR ..................................229.2 6.02 Individuals using Internet (%) .................................................................... 84 .......... n ........34.2 Iceland ...................................................96.2 6.03 Fixed broadband Internet subscriptions/100 pop. .................................. 100 .......... n ..........1.1 Switzerland ............................................39.9 6.04 Active mobile broadband Internet subscriptions/100 pop. ........................ 90 .......... n ..........6.6 Singapore.............................................124.5 6.05 ICT use for business-to-business transactions* ...................................... 128 .......... n ..........3.7 Finland .....................................................6.2 6.06 Internet use for business-to-consumer transactions* .............................. 104 .......... n ..........3.9 United Kingdom .......................................6.3 6.07 Government Online Service Index (0–1) .................................................... 90 .......... n ........0.41 Multiple economies (3) ...........................1.00
Pillar 7: Operating environment (1–7) .............................................................. 96 ...........................3.8 Hong Kong SAR ............................................ 5.8 7.01 Protection of property index (1–7) ........................................................... 105 .......... n ..........3.2 Finland .....................................................6.3
Property rights* ....................................................................................... 120 .......... n ..........3.2 Finland .....................................................6.4Intellectual property protection* ................................................................ 91 .......... n ..........3.2 Finland .....................................................6.2
7.02 Efficiency and accountability of public institutions index (1–7) ................... 54 .......... n ..........3.7 Singapore.................................................6.0Judicial efficiency & impartiality in commercial disputes (0–4).................... 55 .......... n ..........2.3 Multiple economies (7) .............................4.0Diversion of public funds* ......................................................................... 66 .......... n ..........3.2 New Zealand ............................................6.5Ease of compliance with government regulation* ...................................... 52 .......... n ..........3.6 Singapore.................................................5.4
7.03 Access to finance index (1–7) .................................................................. 72 .......... n ..........3.8 Hong Kong SAR ......................................5.7Affordability of financial services* ............................................................. 87 .......... n ..........3.8 Hong Kong SAR ......................................6.1Availability of financial services* .............................................................. 110 .......... n ..........3.7 Switzerland ..............................................6.4Ease of access to loans* .......................................................................... 18 .......... n ..........3.8 Qatar ........................................................4.9Availability of trade finance* ...................................................................... 81 .......... n ..........3.7 Hong Kong SAR ......................................5.8
7.04 Openness to foreign participation index (1–7) ......................................... 126 .......... n ..........3.3 Ireland ......................................................5.5Ease of hiring foreign labour* .................................................................... 99 .......... n ..........3.7 United Arab Emirates ...............................5.6Business impact of rules on FDI* ............................................................ 115 .......... n ..........3.5 Ireland ......................................................6.7Openness to multilateral trade rules (0–100) ........................................... 124 .......... n ........41.2 Slovenia .................................................92.2
7.05 Index of physical security (1–7) ................................................................. 92 .......... n ..........4.9 Qatar ........................................................6.8Reliability of police services* ................................................................... 108 .......... n ..........3.2 Finland .....................................................6.7Business costs of crime and violence* .................................................... 105 .......... n ..........3.8 Qatar ........................................................6.8Business costs of terrorism* ................................................................... 120 .......... n ..........4.1 Slovenia ...................................................6.7Homicide cases/100,000 pop. ................................................................. 91 .......... n ..........7.7 Hong Kong SAR ......................................0.2Index of terrorism incidence (1-7) ............................................................. 64 .......... n ..........7.0 Multiple economies (48) ...........................7.0
© 2014 World Economic Forum
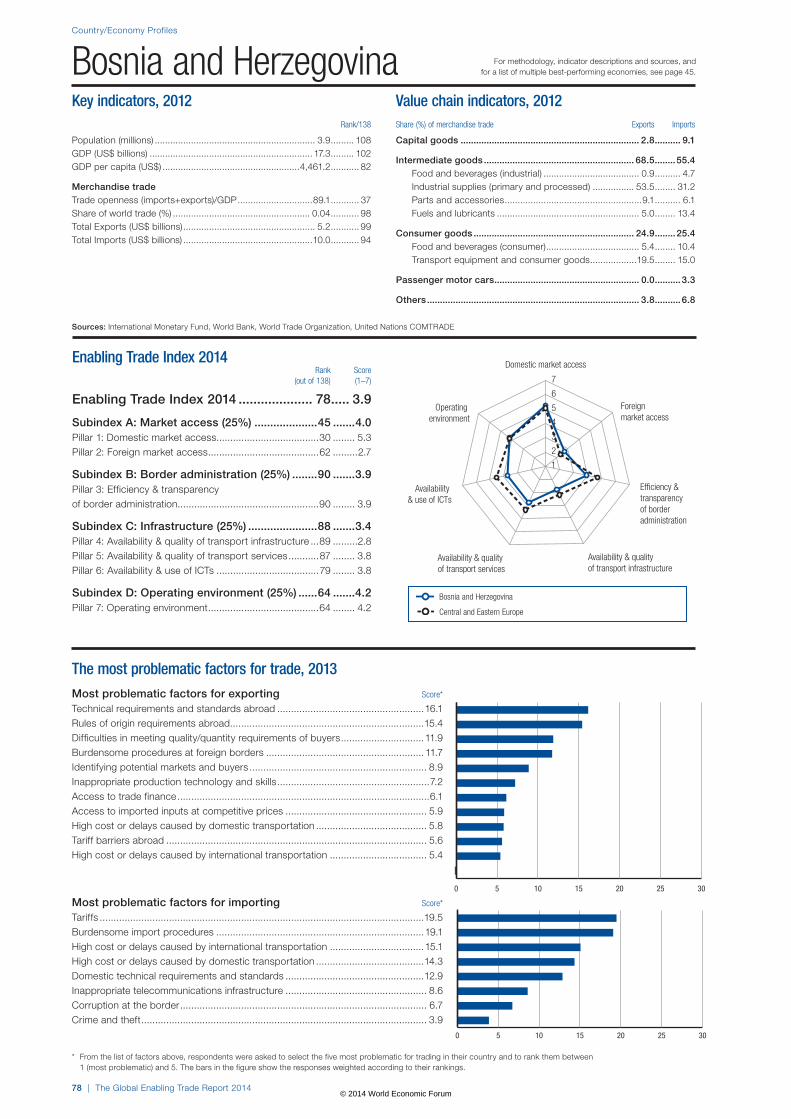
Country/Economy Profiles
78 | The Global Enabling Trade Report 2014
* From the list of factors above, respondents were asked to select the five most problematic for trading in their country and to rank them between 1 (most problematic) and 5. The bars in the figure show the responses weighted according to their rankings.
For methodology, indicator descriptions and sources, and for a list of multiple best-performing economies, see page 45.
0 105 15 20 25 30
0 5 10 15 20 25 30
2
3
4
5
6
7
Operating environment
Availability & use of ICTs
Availability & quality of transport services
Availability & quality of transport infrastructure
Efficiency & transparency of border administration
Foreign market access
Domestic market access
1
Enabling Trade Index 2014 Rank Score (out of 138) (1–7)
Enabling Trade Index 2014 .................... 78 ..... 3.9
Subindex A: Market access (25%) ....................45 .......4.0Pillar 1: Domestic market access .....................................30 ........ 5.3Pillar 2: Foreign market access ........................................62 .........2.7
Subindex B: Border administration (25%) ........90 .......3.9Pillar 3: Efficiency & transparency of border administration ...................................................90 ........ 3.9
Subindex C: Infrastructure (25%) ......................88 .......3.4Pillar 4: Availability & quality of transport infrastructure ...89 .........2.8Pillar 5: Availability & quality of transport services ...........87 ........ 3.8Pillar 6: Availability & use of ICTs .....................................79 ........ 3.8
Subindex D: Operating environment (25%) ......64 .......4.2Pillar 7: Operating environment ........................................64 ........ 4.2
Key indicators, 2012 Rank/138
Population (millions) .............................................................. 3.9 ......... 108GDP (US$ billions) ............................................................... 17.3 ......... 102GDP per capita (US$) .....................................................4,461.2 ........... 82
Merchandise tradeTrade openness (imports+exports)/GDP .............................89.1 ........... 37Share of world trade (%) ..................................................... 0.04 ........... 98Total Exports (US$ billions) ................................................... 5.2 ........... 99Total Imports (US$ billions) ..................................................10.0 ........... 94
Value chain indicators, 2012Share (%) of merchandise trade Exports Imports
Capital goods ..................................................................... 2.8 .......... 9.1
Intermediate goods .......................................................... 68.5 ........55.4Food and beverages (industrial) ..................................... 0.9 .......... 4.7Industrial supplies (primary and processed) ................ 53.5 ........ 31.2Parts and accessories .....................................................9.1 .......... 6.1Fuels and lubricants ....................................................... 5.0 ........ 13.4
Consumer goods .............................................................. 24.9 ........25.4Food and beverages (consumer) .................................... 5.4 ........ 10.4Transport equipment and consumer goods ..................19.5 ........ 15.0
Passenger motor cars ........................................................ 0.0 ..........3.3
Others .................................................................................. 3.8 ..........6.8
The most problematic factors for trade, 2013Most problematic factors for exporting Score*
Technical requirements and standards abroad .....................................................16.1Rules of origin requirements abroad ......................................................................15.4Difficulties in meeting quality/quantity requirements of buyers ..............................11.9Burdensome procedures at foreign borders ......................................................... 11.7Identifying potential markets and buyers ................................................................ 8.9Inappropriate production technology and skills .......................................................7.2Access to trade finance ...........................................................................................6.1Access to imported inputs at competitive prices ................................................... 5.9High cost or delays caused by domestic transportation ........................................ 5.8Tariff barriers abroad .............................................................................................. 5.6High cost or delays caused by international transportation ................................... 5.4
Most problematic factors for importing Score*
Tariffs .....................................................................................................................19.5Burdensome import procedures ...........................................................................19.1High cost or delays caused by international transportation ..................................15.1High cost or delays caused by domestic transportation .......................................14.3Domestic technical requirements and standards ..................................................12.9Inappropriate telecommunications infrastructure ................................................... 8.6Corruption at the border ......................................................................................... 6.7Crime and theft ....................................................................................................... 3.9
Bosnia and Herzegovina
Sources: International Monetary Fund, World Bank, World Trade Organization, United Nations COMTRADE
Bosnia and Herzegovina
Central and Eastern Europe
© 2014 World Economic Forum

Country/Economy Profiles
The Global Enabling Trade Report 2014 | 79
* Indicator derived from the World Economic Forum’s Executive Opinion Survey and measured on a 1-to-7 scale, where 7 indicates best outcome.
The Enabling Trade Index 2014 in detail n Competitive Advantage n Competitive Disadvantage
For methodology, indicator descriptions and sources, and for a list of multiple best-performing economies, see page 45. Bosnia and Herzegovina
INDICATOR, UNITS RANK/138 VALUE BEST PERFORMER VALUE
Pillar 1: Domestic market access (1–7) ........................................................... 30 ...........................5.3 Multiple economies (2) ................................ 7.0 1.01 Tariff rate (%)............................................................................................. 66 .......... n ..........5.0 Multiple economies (2) .............................0.0 1.02 Complexity of tariffs index (1–7) ................................................................ 99 .......... n ..........4.6 Multiple economies (2) .............................7.0
Tariff dispersion (standard deviation) ......................................................... 40 .......... n ..........7.4 Multiple economies (2) .............................0.0Tariff peaks (% of tariff lines) ..................................................................... 82 .......... n ..........6.7 Multiple economies (24) ...........................0.0Specific tariffs (% of tariff lines) ............................................................... 105 .......... n ..........7.8 Multiple economies (54) ...........................0.0Number of distinct tariffs ......................................................................... 105 .......... n .........798 Multiple economies (2) ................................1
1.03 Share of duty-free imports (%) .................................................................. 15 .......... n ........85.3 Multiple economies (2) .........................100.0
Pillar 2: Foreign market access (1–7) .............................................................. 62 ...........................2.7 Cambodia ..................................................... 5.3 2.01 Tariffs faced (%) ...................................................................................... 131 .......... n ..........5.9 Chile .........................................................3.5 2.02 Index of margin of preference in destination mkts (0–100) ........................ 22 .......... n ........53.5 Mauritius ................................................97.1
Pillar 3: Efficiency and transparency of border administration (1–7) .............. 90 ...........................3.9 Singapore..................................................... 6.3 3.01 Customs services index (0–1) ................................................................... 89 .......... n ........0.43 Singapore...............................................0.97 3.02 Efficiency of the clearance process (1–5) .................................................. 99 .......... n ..........2.4 Norway ....................................................4.2 3.03 No. of days to import ............................................................................... 42 .......... n ...........13 Singapore....................................................4 3.04 No. of documents to import ..................................................................... 82 .......... n .............8 Multiple economies (2) ................................2 3.05 Cost to import (US$ per container) ........................................................... 59 .......... n ......1,200 Singapore................................................440 3.06 No. of days to export................................................................................ 63 .......... n ...........16 Multiple economies (5) ................................6 3.07 No. of documents to export ................................................................... 108 .......... n .............8 Multiple economies (2) ................................2 3.08 Cost to export (US$ per container) ........................................................... 80 .......... n ......1,260 Malaysia ..................................................450 3.09 Irregular payments in exports and imports*............................................... 49 .......... n ..........4.2 New Zealand ............................................6.6 3.10 Time predictability of import procedures* ................................................. n/a ........................n/a Finland .....................................................6.0 3.11 Customs transparency index (0–1) ......................................................... 107 .......... n ........0.38 Multiple economies (35) .........................1.00
Pillar 4: Availability and quality of transport infrastructure (1-7) ..................... 89 ...........................2.8 United Arab Emirates ................................... 6.5 4.01 Available int’l airline seat km/week, millions ............................................ 132 .......... n ..........7.6 United States ..................................11,481.7 4.02 Quality of air transport infrastructure* ...................................................... 138 .......... n ..........2.0 Singapore.................................................6.8 4.03 Quality of railroad infrastructure* ............................................................... 53 .......... n ..........3.0 Japan .......................................................6.7 4.04 Liner Shipping Connectivity Index (0–157.1) ............................................ n/a ........................n/a China ...................................................157.5 4.05 Quality of port infrastructure* .................................................................. 137 .......... n ..........1.8 Netherlands ..............................................6.8 4.06 Paved roads (% of total) ........................................................................... 27 .......... n ........92.1 Multiple economies (18) .......................100.0 4.07 Quality of roads* ....................................................................................... 96 .......... n ..........3.1 United Arab Emirates ...............................6.6
Pillar 5: Availability and quality of transport services (1–7) ............................ 87 ...........................3.8 Singapore..................................................... 5.7 5.01 Ease and affordability of shipment (1–5).................................................... 87 .......... n ..........2.8 Luxembourg .............................................3.8 5.02 Logistics competence (1–5) ...................................................................... 80 .......... n ..........2.7 Norway ....................................................4.2 5.03 Tracking and tracing ability (1–5) ............................................................. 104 .......... n ..........2.6 Germany ..................................................4.2 5.04 Timeliness of shipments in reaching destination (1–5) ............................... 62 .......... n ..........3.4 Luxembourg .............................................4.7 5.05 Postal services efficiency* ........................................................................ n/a ........................n/a Japan .......................................................6.8 5.06 Efficiency of transport mode change* ....................................................... 87 .......... n ..........3.7 Hong Kong SAR ......................................6.4
Pillar 6: Availability and use of ICTs (1–7) ........................................................ 79 ...........................3.8 Sweden ........................................................ 6.5 6.01 Mobile phone subscriptions/100 pop. .................................................... 100 .......... n ........87.6 Hong Kong SAR ..................................229.2 6.02 Individuals using Internet (%) .................................................................... 39 .......... n ........65.4 Iceland ...................................................96.2 6.03 Fixed broadband Internet subscriptions/100 pop. .................................... 54 .......... n ........10.6 Switzerland ............................................39.9 6.04 Active mobile broadband Internet subscriptions/100 pop. ........................ 79 .......... n ........10.6 Singapore.............................................124.5 6.05 ICT use for business-to-business transactions* ........................................ 95 .......... n ..........4.5 Finland .....................................................6.2 6.06 Internet use for business-to-consumer transactions* ................................ 85 .......... n ..........4.2 United Kingdom .......................................6.3 6.07 Government Online Service Index (0–1) .................................................... 94 .......... n ........0.37 Multiple economies (3) ...........................1.00
Pillar 7: Operating environment (1–7) .............................................................. 64 ...........................4.2 Hong Kong SAR ............................................ 5.8 7.01 Protection of property index (1–7) ........................................................... 111 .......... n ..........3.1 Finland .....................................................6.3
Property rights* ......................................................................................... 97 .......... n ..........3.7 Finland .....................................................6.4Intellectual property protection* .............................................................. 125 .......... n ..........2.5 Finland .....................................................6.2
7.02 Efficiency and accountability of public institutions index (1–7) ................... 40 .......... n ..........4.1 Singapore.................................................6.0Judicial efficiency & impartiality in commercial disputes (0–4).................... 44 .......... n ..........2.5 Multiple economies (7) .............................4.0Diversion of public funds* ......................................................................... 43 .......... n ..........3.9 New Zealand ............................................6.5Ease of compliance with government regulation* ...................................... 56 .......... n ..........3.6 Singapore.................................................5.4
7.03 Access to finance index (1–7) ................................................................ 108 .......... n ..........3.2 Hong Kong SAR ......................................5.7Affordability of financial services* ............................................................. 98 .......... n ..........3.7 Hong Kong SAR ......................................6.1Availability of financial services* .............................................................. 104 .......... n ..........3.8 Switzerland ..............................................6.4Ease of access to loans* ........................................................................ 116 .......... n ..........2.0 Qatar ........................................................4.9Availability of trade finance* .................................................................... 102 .......... n ..........3.3 Hong Kong SAR ......................................5.8
7.04 Openness to foreign participation index (1–7) ........................................... 61 .......... n ..........4.4 Ireland ......................................................5.5Ease of hiring foreign labour* .................................................................... 87 .......... n ..........3.9 United Arab Emirates ...............................5.6Business impact of rules on FDI* .............................................................. 85 .......... n ..........4.3 Ireland ......................................................6.7Openness to multilateral trade rules (0–100) ............................................. 40 .......... n ........72.6 Slovenia .................................................92.2
7.05 Index of physical security (1–7) ................................................................. 10 .......... n ..........6.4 Qatar ........................................................6.8Reliability of police services* ..................................................................... 29 .......... n ..........5.4 Finland .....................................................6.7Business costs of crime and violence* ........................................................ 7 .......... n ..........6.2 Qatar ........................................................6.8Business costs of terrorism* ....................................................................... 8 .......... n ..........6.5 Slovenia ...................................................6.7Homicide cases/100,000 pop. ................................................................. 37 .......... n ..........1.3 Hong Kong SAR ......................................0.2Index of terrorism incidence (1-7) ............................................................. 82 .......... n ..........7.0 Multiple economies (48) ...........................7.0
© 2014 World Economic Forum

Country/Economy Profiles
80 | The Global Enabling Trade Report 2014
* From the list of factors above, respondents were asked to select the five most problematic for trading in their country and to rank them between 1 (most problematic) and 5. The bars in the figure show the responses weighted according to their rankings.
For methodology, indicator descriptions and sources, and for a list of multiple best-performing economies, see page 45.
0 105 15 20 25 30
0 5 10 15 20 25 30
2
3
4
5
6
7
Operating environment
Availability & use of ICTs
Availability & quality of transport services
Availability & quality of transport infrastructure
Efficiency & transparency of border administration
Foreign market access
Domestic market access
1
Enabling Trade Index 2014 Rank Score (out of 138) (1–7)
Enabling Trade Index 2014 .................... 88 ......3.7
Subindex A: Market access (25%) ....................63 .......3.7Pillar 1: Domestic market access .....................................24 .........5.4Pillar 2: Foreign market access ...................................... 124 .........1.9
Subindex B: Border administration (25%) ......107 .......3.5Pillar 3: Efficiency & transparency of border administration ................................................. 107 ........ 3.5
Subindex C: Infrastructure (25%) ......................86 .......3.5Pillar 4: Availability & quality of transport infrastructure ...79 .........3.1Pillar 5: Availability & quality of transport services .........106 ........ 3.5Pillar 6: Availability & use of ICTs .....................................84 .........3.7
Subindex D: Operating environment (25%) ......62 .......4.2Pillar 7: Operating environment ........................................62 ........ 4.2
Key indicators, 2012 Rank/138
Population (millions) ...............................................................2.1 ......... 122GDP (US$ billions) ...............................................................14.4 ......... 105GDP per capita (US$) ..................................................... 7,020.1 ........... 67
Merchandise tradeTrade openness (imports+exports)/GDP ............................. 97.1 ........... 31Share of world trade (%) ..................................................... 0.04 ........... 99Total Exports (US$ billions) ................................................... 6.0 ........... 95Total Imports (US$ billions) ................................................... 8.0 ........... 99
The most problematic factors for trade, 2013Most problematic factors for exporting Score*
Identifying potential markets and buyers ............................................................... 17.0Inappropriate production technology and skills .....................................................12.2Access to imported inputs at competitive prices ..................................................12.1Access to trade finance .........................................................................................10.0Technical requirements and standards abroad ...................................................... 9.6Difficulties in meeting quality/quantity requirements of buyers ............................... 9.6Burdensome procedures at foreign borders ...........................................................7.3High cost or delays caused by international transportation ................................... 6.2Rules of origin requirements abroad ....................................................................... 4.9High cost or delays caused by domestic transportation ........................................ 4.8Tariff barriers abroad .............................................................................................. 4.3Corruption at foreign borders ..................................................................................1.8
Most problematic factors for importing Score*
Burdensome import procedures ...........................................................................22.7High cost or delays caused by international transportation ................................. 22.6Tariffs .....................................................................................................................18.6High cost or delays caused by domestic transportation .......................................13.7Domestic technical requirements and standards ..................................................10.3Inappropriate telecommunications infrastructure ....................................................5.7Corruption at the border ......................................................................................... 3.8Crime and theft ....................................................................................................... 2.6
Botswana
Sources: International Monetary Fund, World Bank, World Trade Organization, United Nations COMTRADE
Botswana Land-Locked Developing Countries
Sub-Saharan Africa
© 2014 World Economic Forum

Country/Economy Profiles
The Global Enabling Trade Report 2014 | 81
* Indicator derived from the World Economic Forum’s Executive Opinion Survey and measured on a 1-to-7 scale, where 7 indicates best outcome.
The Enabling Trade Index 2014 in detail n Competitive Advantage n Competitive Disadvantage
For methodology, indicator descriptions and sources, and for a list of multiple best-performing economies, see page 45. Botswana
INDICATOR, UNITS RANK/138 VALUE BEST PERFORMER VALUE
Pillar 1: Domestic market access (1–7) ........................................................... 24 ...........................5.4 Multiple economies (2) ................................ 7.0 1.01 Tariff rate (%)............................................................................................. 73 .......... n ..........5.9 Multiple economies (2) .............................0.0 1.02 Complexity of tariffs index (1–7) ................................................................ 89 .......... n ..........4.9 Multiple economies (2) .............................7.0
Tariff dispersion (standard deviation) ....................................................... 100 .......... n ........11.5 Multiple economies (2) .............................0.0Tariff peaks (% of tariff lines) ..................................................................... 95 .......... n ..........9.7 Multiple economies (24) ...........................0.0Specific tariffs (% of tariff lines) ................................................................. 90 .......... n ..........3.8 Multiple economies (54) ...........................0.0Number of distinct tariffs ........................................................................... 90 .......... n .........309 Multiple economies (2) ................................1
1.03 Share of duty-free imports (%) .................................................................... 5 .......... n ........95.7 Multiple economies (2) .........................100.0
Pillar 2: Foreign market access (1–7) ............................................................ 124 ...........................1.9 Cambodia ..................................................... 5.3 2.01 Tariffs faced (%) ...................................................................................... 108 .......... n ..........5.6 Chile .........................................................3.5 2.02 Index of margin of preference in destination mkts (0–100) ........................ 91 .......... n ........11.7 Mauritius ................................................97.1
Pillar 3: Efficiency and transparency of border administration (1–7) ............ 107 ...........................3.5 Singapore..................................................... 6.3 3.01 Customs services index (0–1) .................................................................. n/a ........................n/a Singapore...............................................0.97 3.02 Efficiency of the clearance process (1–5) ................................................ 104 .......... n ..........2.4 Norway ....................................................4.2 3.03 No. of days to import ............................................................................. 118 .......... n ...........35 Singapore....................................................4 3.04 No. of documents to import ..................................................................... 43 .......... n .............6 Multiple economies (2) ................................2 3.05 Cost to import (US$ per container) ......................................................... 129 .......... n ......3,610 Singapore................................................440 3.06 No. of days to export.............................................................................. 114 .......... n ...........27 Multiple economies (5) ................................6 3.07 No. of documents to export ..................................................................... 65 .......... n .............6 Multiple economies (2) ................................2 3.08 Cost to export (US$ per container) ......................................................... 131 .......... n ......3,045 Malaysia ..................................................450 3.09 Irregular payments in exports and imports*............................................... 45 .......... n ..........4.4 New Zealand ............................................6.6 3.10 Time predictability of import procedures* .................................................. 62 .......... n ..........3.9 Finland .....................................................6.0 3.11 Customs transparency index (0–1) .......................................................... n/a ........................n/a Multiple economies (35) .........................1.00
Pillar 4: Availability and quality of transport infrastructure (1-7) ..................... 79 ...........................3.1 United Arab Emirates ................................... 6.5 4.01 Available int’l airline seat km/week, millions ............................................ 135 .......... n ..........4.8 United States ..................................11,481.7 4.02 Quality of air transport infrastructure* ........................................................ 89 .......... n ..........4.0 Singapore.................................................6.8 4.03 Quality of railroad infrastructure* ............................................................... 56 .......... n ..........2.9 Japan .......................................................6.7 4.04 Liner Shipping Connectivity Index (0–157.1) ............................................ n/a ........................n/a China ...................................................157.5 4.05 Quality of port infrastructure* .................................................................... 93 .......... n ..........3.6 Netherlands ..............................................6.8 4.06 Paved roads (% of total) ........................................................................... 85 .......... n ........32.6 Multiple economies (18) .......................100.0 4.07 Quality of roads* ....................................................................................... 54 .......... n ..........4.3 United Arab Emirates ...............................6.6
Pillar 5: Availability and quality of transport services (1–7) .......................... 106 ...........................3.5 Singapore..................................................... 5.7 5.01 Ease and affordability of shipment (1–5).................................................. 122 .......... n ..........2.4 Luxembourg .............................................3.8 5.02 Logistics competence (1–5) .................................................................... 100 .......... n ..........2.6 Norway ....................................................4.2 5.03 Tracking and tracing ability (1–5) ............................................................. 120 .......... n ..........2.4 Germany ..................................................4.2 5.04 Timeliness of shipments in reaching destination (1–5) ............................. 101 .......... n ..........2.9 Luxembourg .............................................4.7 5.05 Postal services efficiency* ......................................................................... 76 .......... n ..........4.4 Japan .......................................................6.8 5.06 Efficiency of transport mode change* ..................................................... 101 .......... n ..........3.4 Hong Kong SAR ......................................6.4
Pillar 6: Availability and use of ICTs (1–7) ........................................................ 84 ...........................3.7 Sweden ........................................................ 6.5 6.01 Mobile phone subscriptions/100 pop. ...................................................... 17 .......... n ......153.8 Hong Kong SAR ..................................229.2 6.02 Individuals using Internet (%) .................................................................. 112 .......... n ........11.5 Iceland ...................................................96.2 6.03 Fixed broadband Internet subscriptions/100 pop. .................................. 101 .......... n ..........0.9 Switzerland ............................................39.9 6.04 Active mobile broadband Internet subscriptions/100 pop. ........................ 14 .......... n ........74.8 Singapore.............................................124.5 6.05 ICT use for business-to-business transactions* ...................................... 112 .......... n ..........4.2 Finland .....................................................6.2 6.06 Internet use for business-to-consumer transactions* .............................. 115 .......... n ..........3.5 United Kingdom .......................................6.3 6.07 Government Online Service Index (0–1) .................................................... 98 .......... n ........0.36 Multiple economies (3) ...........................1.00
Pillar 7: Operating environment (1–7) .............................................................. 62 ...........................4.2 Hong Kong SAR ............................................ 5.8 7.01 Protection of property index (1–7) ............................................................. 40 .......... n ..........4.5 Finland .....................................................6.3
Property rights* ......................................................................................... 39 .......... n ..........4.9 Finland .....................................................6.4Intellectual property protection* ................................................................ 43 .......... n ..........4.1 Finland .....................................................6.2
7.02 Efficiency and accountability of public institutions index (1–7) ................... 55 .......... n ..........3.7 Singapore.................................................6.0Judicial efficiency & impartiality in commercial disputes (0–4).................. 106 .......... n ..........1.3 Multiple economies (7) .............................4.0Diversion of public funds* ......................................................................... 28 .......... n ..........4.5 New Zealand ............................................6.5Ease of compliance with government regulation* ...................................... 35 .......... n ..........3.8 Singapore.................................................5.4
7.03 Access to finance index (1–7) .................................................................. 56 .......... n ..........3.9 Hong Kong SAR ......................................5.7Affordability of financial services* ............................................................. 66 .......... n ..........4.1 Hong Kong SAR ......................................6.1Availability of financial services* ................................................................ 73 .......... n ..........4.4 Switzerland ..............................................6.4Ease of access to loans* .......................................................................... 41 .......... n ..........3.2 Qatar ........................................................4.9Availability of trade finance* ...................................................................... 61 .......... n ..........3.9 Hong Kong SAR ......................................5.8
7.04 Openness to foreign participation index (1–7) ......................................... 111 .......... n ..........3.7 Ireland ......................................................5.5Ease of hiring foreign labour* .................................................................. 126 .......... n ..........3.1 United Arab Emirates ...............................5.6Business impact of rules on FDI* .............................................................. 83 .......... n ..........4.4 Ireland ......................................................6.7Openness to multilateral trade rules (0–100) ............................................. 99 .......... n ........55.4 Slovenia .................................................92.2
7.05 Index of physical security (1–7) ................................................................. 77 .......... n ..........5.3 Qatar ........................................................6.8Reliability of police services* ..................................................................... 54 .......... n ..........4.4 Finland .....................................................6.7Business costs of crime and violence* ...................................................... 66 .......... n ..........4.7 Qatar ........................................................6.8Business costs of terrorism* ..................................................................... 20 .......... n ..........6.3 Slovenia ...................................................6.7Homicide cases/100,000 pop. ............................................................... 111 .......... n ........14.5 Hong Kong SAR ......................................0.2Index of terrorism incidence (1-7) ............................................................... 1 .......... n ..........7.0 Multiple economies (48) ...........................7.0
© 2014 World Economic Forum

Country/Economy Profiles
82 | The Global Enabling Trade Report 2014
* From the list of factors above, respondents were asked to select the five most problematic for trading in their country and to rank them between 1 (most problematic) and 5. The bars in the figure show the responses weighted according to their rankings.
For methodology, indicator descriptions and sources, and for a list of multiple best-performing economies, see page 45.
0 105 15 20 25 30
0 5 10 15 20 25 30
2
3
4
5
6
7
Operating environment
Availability & use of ICTs
Availability & quality of transport services
Availability & quality of transport infrastructure
Efficiency & transparency of border administration
Foreign market access
Domestic market access
1
Enabling Trade Index 2014 Rank Score (out of 138) (1–7)
Enabling Trade Index 2014 .................... 86 ..... 3.8
Subindex A: Market access (25%) .................. 110 .......3.2Pillar 1: Domestic market access ...................................108 .........4.0Pillar 2: Foreign market access ........................................77 .........2.4
Subindex B: Border administration (25%) ........80 .......4.2Pillar 3: Efficiency & transparency of border administration ...................................................80 ........ 4.2
Subindex C: Infrastructure (25%) ......................66 .......3.9Pillar 4: Availability & quality of transport infrastructure .102 .........2.7Pillar 5: Availability & quality of transport services ...........60 ........ 4.2Pillar 6: Availability & use of ICTs .....................................48 .........4.7
Subindex D: Operating environment (25%) ......90 .......3.9Pillar 7: Operating environment ........................................90 ........ 3.9
Key indicators, 2012 Rank/138
Population (millions) ...........................................................198.4 ............. 5GDP (US$ billions) ..........................................................2,253.1 ............. 7GDP per capita (US$) ...................................................11,358.5 ........... 54
Merchandise tradeTrade openness (imports+exports)/GDP ............................. 21.1 ......... 138Share of world trade (%) ......................................................1.29 ........... 23Total Exports (US$ billions) ................................................242.6 ........... 22Total Imports (US$ billions) ............................................... 233.4 ........... 22
Value chain indicators, 2012Share (%) of merchandise trade Exports Imports
Capital goods ..................................................................... 8.8 ........ 16.4
Intermediate goods ...........................................................74.3 ........ 61.9Food and beverages (industrial) ....................................15.6 .......... 1.8Industrial supplies (primary and processed) ................ 43.4 ........ 30.3Parts and accessories .................................................... 6.6 ........ 19.4Fuels and lubricants ....................................................... 8.8 ........ 10.4
Consumer goods .............................................................. 13.0 ........ 10.0Food and beverages (consumer) ...................................10.3 .......... 2.6Transport equipment and consumer goods ....................2.6 ...........7.4
Passenger motor cars .........................................................1.6 .......... 4.3
Others .................................................................................. 2.3 .......... 7.4
The most problematic factors for trade, 2013Most problematic factors for exporting Score*
High cost or delays caused by domestic transportation .......................................25.7Access to imported inputs at competitive prices ..................................................10.4Inappropriate production technology and skills .....................................................10.1Access to trade finance .......................................................................................... 8.8Burdensome procedures at foreign borders .......................................................... 8.5Tariff barriers abroad ...............................................................................................7.6High cost or delays caused by international transportation ....................................7.6Difficulties in meeting quality/quantity requirements of buyers ............................... 6.7Identifying potential markets and buyers .................................................................6.1Technical requirements and standards abroad ...................................................... 3.8Rules of origin requirements abroad ....................................................................... 2.3Corruption at foreign borders ................................................................................. 2.3
Most problematic factors for importing Score*
Tariffs .....................................................................................................................27.0Burdensome import procedures ...........................................................................24.9High cost or delays caused by domestic transportation .......................................20.1High cost or delays caused by international transportation ................................... 9.8Domestic technical requirements and standards ....................................................7.6Corruption at the border ......................................................................................... 4.8Inappropriate telecommunications infrastructure ................................................... 3.0Crime and theft ....................................................................................................... 2.9
Brazil
Sources: International Monetary Fund, World Bank, World Trade Organization, United Nations COMTRADE
Brazil
South America
© 2014 World Economic Forum

Country/Economy Profiles
The Global Enabling Trade Report 2014 | 83
* Indicator derived from the World Economic Forum’s Executive Opinion Survey and measured on a 1-to-7 scale, where 7 indicates best outcome.
The Enabling Trade Index 2014 in detail n Competitive Advantage n Competitive Disadvantage
For methodology, indicator descriptions and sources, and for a list of multiple best-performing economies, see page 45. Brazil
INDICATOR, UNITS RANK/138 VALUE BEST PERFORMER VALUE
Pillar 1: Domestic market access (1–7) ......................................................... 108 ...........................4.0 Multiple economies (2) ................................ 7.0 1.01 Tariff rate (%)........................................................................................... 117 .......... n ........11.4 Multiple economies (2) .............................0.0 1.02 Complexity of tariffs index (1–7) ................................................................ 23 .......... n ..........6.6 Multiple economies (2) .............................7.0
Tariff dispersion (standard deviation) ......................................................... 82 .......... n ..........8.5 Multiple economies (2) .............................0.0Tariff peaks (% of tariff lines) ..................................................................... 25 .......... n ..........0.0 Multiple economies (24) ...........................0.0Specific tariffs (% of tariff lines) ................................................................... 1 .......... n ..........0.0 Multiple economies (54) ...........................0.0Number of distinct tariffs ........................................................................... 52 .......... n ...........19 Multiple economies (2) ................................1
1.03 Share of duty-free imports (%) .................................................................. 99 .......... n ........33.1 Multiple economies (2) .........................100.0
Pillar 2: Foreign market access (1–7) .............................................................. 77 ...........................2.4 Cambodia ..................................................... 5.3 2.01 Tariffs faced (%) ........................................................................................ 51 .......... n ..........5.3 Chile .........................................................3.5 2.02 Index of margin of preference in destination mkts (0–100) ........................ 81 .......... n ........18.2 Mauritius ................................................97.1
Pillar 3: Efficiency and transparency of border administration (1–7) .............. 80 ...........................4.2 Singapore..................................................... 6.3 3.01 Customs services index (0–1) ................................................................... 90 .......... n ........0.43 Singapore...............................................0.97 3.02 Efficiency of the clearance process (1–5) .................................................. 90 .......... n ..........2.5 Norway ....................................................4.2 3.03 No. of days to import ............................................................................... 64 .......... n ...........17 Singapore....................................................4 3.04 No. of documents to import ..................................................................... 82 .......... n .............8 Multiple economies (2) ................................2 3.05 Cost to import (US$ per container) ......................................................... 113 .......... n ......2,275 Singapore................................................440 3.06 No. of days to export................................................................................ 48 .......... n ...........13 Multiple economies (5) ................................6 3.07 No. of documents to export ..................................................................... 65 .......... n .............6 Multiple economies (2) ................................2 3.08 Cost to export (US$ per container) ......................................................... 119 .......... n ......2,215 Malaysia ..................................................450 3.09 Irregular payments in exports and imports*............................................... 61 .......... n ..........3.9 New Zealand ............................................6.6 3.10 Time predictability of import procedures* ................................................ 125 .......... n ..........2.9 Finland .....................................................6.0 3.11 Customs transparency index (0–1) ............................................................. 1 .......... n ........1.00 Multiple economies (35) .........................1.00
Pillar 4: Availability and quality of transport infrastructure (1-7) ................... 102 ...........................2.7 United Arab Emirates ................................... 6.5 4.01 Available int’l airline seat km/week, millions .............................................. 20 .......... n ...1,490.0 United States ..................................11,481.7 4.02 Quality of air transport infrastructure* ...................................................... 115 .......... n ..........3.3 Singapore.................................................6.8 4.03 Quality of railroad infrastructure* ............................................................... 95 .......... n ..........1.8 Japan .......................................................6.7 4.04 Liner Shipping Connectivity Index (0–157.1) ............................................. 39 .......... n ........36.9 China ...................................................157.5 4.05 Quality of port infrastructure* .................................................................. 122 .......... n ..........2.7 Netherlands ..............................................6.8 4.06 Paved roads (% of total) ......................................................................... 119 .......... n ........13.5 Multiple economies (18) .......................100.0 4.07 Quality of roads* ..................................................................................... 111 .......... n ..........2.8 United Arab Emirates ...............................6.6
Pillar 5: Availability and quality of transport services (1–7) ............................ 60 ...........................4.2 Singapore..................................................... 5.7 5.01 Ease and affordability of shipment (1–5).................................................... 81 .......... n ..........2.8 Luxembourg .............................................3.8 5.02 Logistics competence (1–5) ...................................................................... 50 .......... n ..........3.1 Norway ....................................................4.2 5.03 Tracking and tracing ability (1–5) ............................................................... 61 .......... n ..........3.0 Germany ..................................................4.2 5.04 Timeliness of shipments in reaching destination (1–5) ............................... 64 .......... n ..........3.4 Luxembourg .............................................4.7 5.05 Postal services efficiency* ......................................................................... 32 .......... n ..........5.7 Japan .......................................................6.8 5.06 Efficiency of transport mode change* ..................................................... 116 .......... n ..........3.1 Hong Kong SAR ......................................6.4
Pillar 6: Availability and use of ICTs (1–7) ........................................................ 48 ...........................4.7 Sweden ........................................................ 6.5 6.01 Mobile phone subscriptions/100 pop. ...................................................... 41 .......... n ......125.0 Hong Kong SAR ..................................229.2 6.02 Individuals using Internet (%) .................................................................... 61 .......... n ........49.8 Iceland ...................................................96.2 6.03 Fixed broadband Internet subscriptions/100 pop. .................................... 61 .......... n ..........9.2 Switzerland ............................................39.9 6.04 Active mobile broadband Internet subscriptions/100 pop. ........................ 48 .......... n ........33.2 Singapore.............................................124.5 6.05 ICT use for business-to-business transactions* ........................................ 53 .......... n ..........5.1 Finland .....................................................6.2 6.06 Internet use for business-to-consumer transactions* ................................ 30 .......... n ..........5.2 United Kingdom .......................................6.3 6.07 Government Online Service Index (0–1) .................................................... 32 .......... n ........0.67 Multiple economies (3) ...........................1.00
Pillar 7: Operating environment (1–7) .............................................................. 90 ...........................3.9 Hong Kong SAR ............................................ 5.8 7.01 Protection of property index (1–7) ............................................................. 57 .......... n ..........4.1 Finland .....................................................6.3
Property rights* ......................................................................................... 49 .......... n ..........4.6 Finland .....................................................6.4Intellectual property protection* ................................................................ 75 .......... n ..........3.5 Finland .....................................................6.2
7.02 Efficiency and accountability of public institutions index (1–7) ................. 122 .......... n ..........2.7 Singapore.................................................6.0Judicial efficiency & impartiality in commercial disputes (0–4).................... 63 .......... n ..........2.0 Multiple economies (7) .............................4.0Diversion of public funds* ....................................................................... 123 .......... n ..........2.3 New Zealand ............................................6.5Ease of compliance with government regulation* .................................... 137 .......... n ..........2.0 Singapore.................................................5.4
7.03 Access to finance index (1–7) .................................................................. 44 .......... n ..........4.1 Hong Kong SAR ......................................5.7Affordability of financial services* ............................................................. 46 .......... n ..........4.5 Hong Kong SAR ......................................6.1Availability of financial services* ................................................................ 29 .......... n ..........5.3 Switzerland ..............................................6.4Ease of access to loans* .......................................................................... 61 .......... n ..........2.9 Qatar ........................................................4.9Availability of trade finance* ...................................................................... 69 .......... n ..........3.8 Hong Kong SAR ......................................5.8
7.04 Openness to foreign participation index (1–7) ......................................... 110 .......... n ..........3.8 Ireland ......................................................5.5Ease of hiring foreign labour* .................................................................. 114 .......... n ..........3.4 United Arab Emirates ...............................5.6Business impact of rules on FDI* .............................................................. 90 .......... n ..........4.3 Ireland ......................................................6.7Openness to multilateral trade rules (0–100) ........................................... 100 .......... n ........55.2 Slovenia .................................................92.2
7.05 Index of physical security (1–7) ............................................................... 103 .......... n ..........4.6 Qatar ........................................................6.8Reliability of police services* ..................................................................... 59 .......... n ..........4.3 Finland .....................................................6.7Business costs of crime and violence* .................................................... 115 .......... n ..........3.4 Qatar ........................................................6.8Business costs of terrorism* ..................................................................... 21 .......... n ..........6.3 Slovenia ...................................................6.7Homicide cases/100,000 pop. ............................................................... 123 .......... n ........21.8 Hong Kong SAR ......................................0.2Index of terrorism incidence (1-7) ............................................................. 63 .......... n ..........7.0 Multiple economies (48) ...........................7.0
© 2014 World Economic Forum

Country/Economy Profiles
84 | The Global Enabling Trade Report 2014
* From the list of factors above, respondents were asked to select the five most problematic for trading in their country and to rank them between 1 (most problematic) and 5. The bars in the figure show the responses weighted according to their rankings.
For methodology, indicator descriptions and sources, and for a list of multiple best-performing economies, see page 45.
0 105 15 20 25 30
0 5 10 15 20 25 30
2
3
4
5
6
7
Operating environment
Availability & use of ICTs
Availability & quality of transport services
Availability & quality of transport infrastructure
Efficiency & transparency of border administration
Foreign market access
Domestic market access
1
Enabling Trade Index 2014 Rank Score (out of 138) (1–7)
Enabling Trade Index 2014 .....................70 ..... 4.0
Subindex A: Market access (25%) ....................75 .......3.4Pillar 1: Domestic market access .....................................46 .........4.9Pillar 2: Foreign market access ........................................97 .........1.9
Subindex B: Border administration (25%) ........57 .......4.7Pillar 3: Efficiency & transparency of border administration ...................................................57 .........4.7
Subindex C: Infrastructure (25%) ......................55 .......4.1Pillar 4: Availability & quality of transport infrastructure ...71 ........ 3.3Pillar 5: Availability & quality of transport services ...........51 .........4.4Pillar 6: Availability & use of ICTs .....................................49 .........4.7
Subindex D: Operating environment (25%) ......83 .......4.0Pillar 7: Operating environment ........................................83 .........4.0
Key indicators, 2012 Rank/138
Population (millions) ...............................................................7.3 ........... 86GDP (US$ billions) ...............................................................51.0 ........... 72GDP per capita (US$) .....................................................7,006.2 ........... 68
Merchandise tradeTrade openness (imports+exports)/GDP ...........................116.5 ........... 20Share of world trade (%) ......................................................0.16 ........... 66Total Exports (US$ billions) ..................................................26.7 ........... 65Total Imports (US$ billions) ..................................................32.7 ........... 61
Value chain indicators, 2012Share (%) of merchandise trade Exports Imports
Capital goods ......................................................................7.3 ........ 11.4
Intermediate goods .......................................................... 55.5 ........ 65.7Food and beverages (industrial) ..................................... 6.8 .......... 1.6Industrial supplies (primary and processed) ................ 38.9 ........ 34.0Parts and accessories .....................................................7.6 .......... 9.5Fuels and lubricants ....................................................... 2.2 ........ 20.6
Consumer goods .............................................................. 22.3 ........ 16.2Food and beverages (consumer) .................................... 5.0 .......... 6.0Transport equipment and consumer goods .................. 17.3 ........ 10.2
Passenger motor cars ........................................................ 0.6 .......... 1.9
Others .................................................................................14.4 .......... 4.7
The most problematic factors for trade, 2013Most problematic factors for exporting Score*
Identifying potential markets and buyers ...............................................................16.1Access to trade finance .........................................................................................15.4Difficulties in meeting quality/quantity requirements of buyers ..............................11.5Technical requirements and standards abroad .....................................................10.9Inappropriate production technology and skills ...................................................... 8.3Corruption at foreign borders ..................................................................................7.0Access to imported inputs at competitive prices ....................................................7.0Burdensome procedures at foreign borders .......................................................... 6.7High cost or delays caused by domestic transportation ........................................ 6.4High cost or delays caused by international transportation ................................... 4.6Rules of origin requirements abroad ....................................................................... 3.8Tariff barriers abroad .............................................................................................. 2.3
Most problematic factors for importing Score*
Tariffs ..................................................................................................................... 17.9Burdensome import procedures ........................................................................... 17.9Corruption at the border ....................................................................................... 16.3High cost or delays caused by international transportation ..................................15.2Domestic technical requirements and standards ................................................. 10.2High cost or delays caused by domestic transportation ........................................ 9.5Crime and theft ....................................................................................................... 8.7Inappropriate telecommunications infrastructure ................................................... 4.4
Bulgaria
Sources: International Monetary Fund, World Bank, World Trade Organization, United Nations COMTRADE
Bulgaria
Central and Eastern Europe
© 2014 World Economic Forum

Country/Economy Profiles
The Global Enabling Trade Report 2014 | 85
* Indicator derived from the World Economic Forum’s Executive Opinion Survey and measured on a 1-to-7 scale, where 7 indicates best outcome.
The Enabling Trade Index 2014 in detail n Competitive Advantage n Competitive Disadvantage
For methodology, indicator descriptions and sources, and for a list of multiple best-performing economies, see page 45. Bulgaria
INDICATOR, UNITS RANK/138 VALUE BEST PERFORMER VALUE
Pillar 1: Domestic market access (1–7) ........................................................... 46 ...........................4.9 Multiple economies (2) ................................ 7.0 1.01 Tariff rate (%)............................................................................................... 5 .......... n ..........0.8 Multiple economies (2) .............................0.0 1.02 Complexity of tariffs index (1–7) .............................................................. 110 .......... n ..........3.1 Multiple economies (2) .............................7.0
Tariff dispersion (standard deviation) ......................................................... 55 .......... n ..........8.4 Multiple economies (2) .............................0.0Tariff peaks (% of tariff lines) ................................................................... 104 .......... n ........10.6 Multiple economies (24) ...........................0.0Specific tariffs (% of tariff lines) ............................................................... 107 .......... n ........11.0 Multiple economies (54) ...........................0.0Number of distinct tariffs ......................................................................... 109 .......... n ......1,755 Multiple economies (2) ................................1
1.03 Share of duty-free imports (%) .................................................................. 42 .......... n ........65.4 Multiple economies (2) .........................100.0
Pillar 2: Foreign market access (1–7) .............................................................. 97 ...........................1.9 Cambodia ..................................................... 5.3 2.01 Tariffs faced (%) ........................................................................................ 73 .......... n ..........5.5 Chile .........................................................3.5 2.02 Index of margin of preference in destination mkts (0–100) ........................ 96 .......... n ..........9.1 Mauritius ................................................97.1
Pillar 3: Efficiency and transparency of border administration (1–7) .............. 57 ...........................4.7 Singapore..................................................... 6.3 3.01 Customs services index (0–1) ................................................................... 60 .......... n ........0.62 Singapore...............................................0.97 3.02 Efficiency of the clearance process (1–5) .................................................. 62 .......... n ..........2.8 Norway ....................................................4.2 3.03 No. of days to import ............................................................................... 64 .......... n ...........17 Singapore....................................................4 3.04 No. of documents to import ..................................................................... 27 .......... n .............5 Multiple economies (2) ................................2 3.05 Cost to import (US$ per container) ........................................................... 71 .......... n ......1,365 Singapore................................................440 3.06 No. of days to export................................................................................ 85 .......... n ...........20 Multiple economies (5) ................................6 3.07 No. of documents to export ..................................................................... 16 .......... n .............4 Multiple economies (2) ................................2 3.08 Cost to export (US$ per container) ........................................................... 87 .......... n ......1,375 Malaysia ..................................................450 3.09 Irregular payments in exports and imports*............................................... 54 .......... n ..........3.9 New Zealand ............................................6.6 3.10 Time predictability of import procedures* .................................................. 50 .......... n ..........4.3 Finland .....................................................6.0 3.11 Customs transparency index (0–1) ........................................................... 72 .......... n ........0.79 Multiple economies (35) .........................1.00
Pillar 4: Availability and quality of transport infrastructure (1-7) ..................... 71 ...........................3.3 United Arab Emirates ................................... 6.5 4.01 Available int’l airline seat km/week, millions .............................................. 78 .......... n ......101.8 United States ..................................11,481.7 4.02 Quality of air transport infrastructure* ........................................................ 78 .......... n ..........4.2 Singapore.................................................6.8 4.03 Quality of railroad infrastructure* ............................................................... 52 .......... n ..........3.1 Japan .......................................................6.7 4.04 Liner Shipping Connectivity Index (0–157.1) ............................................. 92 .......... n ..........5.9 China ...................................................157.5 4.05 Quality of port infrastructure* .................................................................... 78 .......... n ..........3.9 Netherlands ..............................................6.8 4.06 Paved roads (% of total) ........................................................................... 20 .......... n ........98.6 Multiple economies (18) .......................100.0 4.07 Quality of roads* ..................................................................................... 103 .......... n ..........2.9 United Arab Emirates ...............................6.6
Pillar 5: Availability and quality of transport services (1–7) ............................ 51 ...........................4.4 Singapore..................................................... 5.7 5.01 Ease and affordability of shipment (1–5).................................................... 37 .......... n ..........3.3 Luxembourg .............................................3.8 5.02 Logistics competence (1–5) ...................................................................... 54 .......... n ..........3.0 Norway ....................................................4.2 5.03 Tracking and tracing ability (1–5) ............................................................... 76 .......... n ..........2.9 Germany ..................................................4.2 5.04 Timeliness of shipments in reaching destination (1–5) ............................... 24 .......... n ..........4.0 Luxembourg .............................................4.7 5.05 Postal services efficiency* ......................................................................... 71 .......... n ..........4.5 Japan .......................................................6.8 5.06 Efficiency of transport mode change* ....................................................... 62 .......... n ..........4.1 Hong Kong SAR ......................................6.4
Pillar 6: Availability and use of ICTs (1–7) ........................................................ 49 ...........................4.7 Sweden ........................................................ 6.5 6.01 Mobile phone subscriptions/100 pop. ...................................................... 21 .......... n ......148.1 Hong Kong SAR ..................................229.2 6.02 Individuals using Internet (%) .................................................................... 52 .......... n ........55.1 Iceland ...................................................96.2 6.03 Fixed broadband Internet subscriptions/100 pop. .................................... 37 .......... n ........17.9 Switzerland ............................................39.9 6.04 Active mobile broadband Internet subscriptions/100 pop. ........................ 32 .......... n ........48.2 Singapore.............................................124.5 6.05 ICT use for business-to-business transactions* ........................................ 74 .......... n ..........4.8 Finland .....................................................6.2 6.06 Internet use for business-to-consumer transactions* ................................ 63 .......... n ..........4.7 United Kingdom .......................................6.3 6.07 Government Online Service Index (0–1) .................................................... 70 .......... n ........0.49 Multiple economies (3) ...........................1.00
Pillar 7: Operating environment (1–7) .............................................................. 83 ...........................4.0 Hong Kong SAR ............................................ 5.8 7.01 Protection of property index (1–7) ............................................................. 99 .......... n ..........3.3 Finland .....................................................6.3
Property rights* ....................................................................................... 102 .......... n ..........3.5 Finland .....................................................6.4Intellectual property protection* ................................................................ 97 .......... n ..........3.0 Finland .....................................................6.2
7.02 Efficiency and accountability of public institutions index (1–7) ................... 97 .......... n ..........3.3 Singapore.................................................6.0Judicial efficiency & impartiality in commercial disputes (0–4).................... 63 .......... n ..........2.0 Multiple economies (7) .............................4.0Diversion of public funds* ......................................................................... 97 .......... n ..........2.7 New Zealand ............................................6.5Ease of compliance with government regulation* ...................................... 96 .......... n ..........3.1 Singapore.................................................5.4
7.03 Access to finance index (1–7) .................................................................. 86 .......... n ..........3.6 Hong Kong SAR ......................................5.7Affordability of financial services* ........................................................... 115 .......... n ..........3.5 Hong Kong SAR ......................................6.1Availability of financial services* .............................................................. 101 .......... n ..........3.8 Switzerland ..............................................6.4Ease of access to loans* .......................................................................... 37 .......... n ..........3.3 Qatar ........................................................4.9Availability of trade finance* ...................................................................... 80 .......... n ..........3.7 Hong Kong SAR ......................................5.8
7.04 Openness to foreign participation index (1–7) ........................................... 57 .......... n ..........4.4 Ireland ......................................................5.5Ease of hiring foreign labour* .................................................................... 79 .......... n ..........4.0 United Arab Emirates ...............................5.6Business impact of rules on FDI* ............................................................ 108 .......... n ..........3.7 Ireland ......................................................6.7Openness to multilateral trade rules (0–100) ............................................. 12 .......... n ........82.0 Slovenia .................................................92.2
7.05 Index of physical security (1–7) ................................................................. 81 .......... n ..........5.2 Qatar ........................................................6.8Reliability of police services* ................................................................... 104 .......... n ..........3.4 Finland .....................................................6.7Business costs of crime and violence* .................................................... 101 .......... n ..........3.9 Qatar ........................................................6.8Business costs of terrorism* ..................................................................... 97 .......... n ..........4.9 Slovenia ...................................................6.7Homicide cases/100,000 pop. ................................................................. 46 .......... n ..........1.7 Hong Kong SAR ......................................0.2Index of terrorism incidence (1-7) ........................................................... 101 .......... n ..........6.9 Multiple economies (48) ...........................7.0
© 2014 World Economic Forum

Country/Economy Profiles
86 | The Global Enabling Trade Report 2014
* From the list of factors above, respondents were asked to select the five most problematic for trading in their country and to rank them between 1 (most problematic) and 5. The bars in the figure show the responses weighted according to their rankings.
For methodology, indicator descriptions and sources, and for a list of multiple best-performing economies, see page 45.
0 105 15 20 25 30
0 5 10 15 20 25 30
2
3
4
5
6
7
Operating environment
Availability & use of ICTs
Availability & quality of transport services
Availability & quality of transport infrastructure
Efficiency & transparency of border administration
Foreign market access
Domestic market access
1
Enabling Trade Index 2014 Rank Score (out of 138) (1–7)
Enabling Trade Index 2014 ...................133 ..... 2.9
Subindex A: Market access (25%) .................. 118 .......3.1Pillar 1: Domestic market access ................................... 110 ........ 3.8Pillar 2: Foreign market access ........................................81 .........2.3
Subindex B: Border administration (25%) ......135 .......2.4Pillar 3: Efficiency & transparency of border administration .................................................135 .........2.4
Subindex C: Infrastructure (25%) ....................122 .......2.7Pillar 4: Availability & quality of transport infrastructure .123 .........2.3Pillar 5: Availability & quality of transport services .........105 ........ 3.6Pillar 6: Availability & use of ICTs ................................... 125 ........ 2.2
Subindex D: Operating environment (25%) ....122 .......3.4Pillar 7: Operating environment ......................................122 .........3.4
Key indicators, 2012 Rank/138
Population (millions) ............................................................. 17.4 ........... 54GDP (US$ billions) ...............................................................11.0 ..........114GDP per capita (US$) ....................................................... 635.8 ......... 127
Merchandise tradeTrade openness (imports+exports)/GDP .............................52.7 ........... 95Share of world trade (%) ......................................................0.01 ......... 123Total Exports (US$ billions) ................................................... 2.2 ..........117Total Imports (US$ billions) ................................................... 3.2 ......... 123
Value chain indicators, 2011Share (%) of merchandise trade Exports Imports
Capital goods ..................................................................... 0.3 .........11.1
Intermediate goods .......................................................... 95.7 ........40.3Food and beverages (industrial) ......................................3.1 .......... 4.6Industrial supplies (primary and processed) ................ 92.3 .........27.0Parts and accessories .................................................... 0.3 ...........7.3Fuels and lubricants ....................................................... 0.0 .......... 1.3
Consumer goods ................................................................ 3.9 ........23.9Food and beverages (consumer) .................................... 3.4 .......... 9.8Transport equipment and consumer goods ................... 0.5 .........14.1
Passenger motor cars ........................................................ 0.0 ..........2.4
Others .................................................................................. 0.0 ........22.4
The most problematic factors for trade, 2013Most problematic factors for exporting Score*
Access to trade finance .........................................................................................19.6Identifying potential markets and buyers ...............................................................14.0Difficulties in meeting quality/quantity requirements of buyers ..............................12.0Inappropriate production technology and skills .....................................................10.1High cost or delays caused by domestic transportation ........................................ 8.4Access to imported inputs at competitive prices ....................................................8.1High cost or delays caused by international transportation ....................................7.5Burdensome procedures at foreign borders ...........................................................7.0Technical requirements and standards abroad ...................................................... 5.4Rules of origin requirements abroad ....................................................................... 3.4Corruption at foreign borders ................................................................................. 3.2Tariff barriers abroad ...............................................................................................1.3
Most problematic factors for importing Score*
Burdensome import procedures ...........................................................................21.9High cost or delays caused by international transportation ..................................19.9Tariffs .....................................................................................................................19.6Corruption at the border ........................................................................................16.0High cost or delays caused by domestic transportation .......................................10.6Inappropriate telecommunications infrastructure ................................................... 6.3Domestic technical requirements and standards ................................................... 3.3Crime and theft ....................................................................................................... 2.5
Burkina Faso
Sources: International Monetary Fund, World Bank, World Trade Organization, United Nations COMTRADE
Burkina Faso Land-Locked, Least Developed Countries
Sub-Saharan Africa
© 2014 World Economic Forum

Country/Economy Profiles
The Global Enabling Trade Report 2014 | 87
* Indicator derived from the World Economic Forum’s Executive Opinion Survey and measured on a 1-to-7 scale, where 7 indicates best outcome.
The Enabling Trade Index 2014 in detail n Competitive Advantage n Competitive Disadvantage
For methodology, indicator descriptions and sources, and for a list of multiple best-performing economies, see page 45. Burkina Faso
INDICATOR, UNITS RANK/138 VALUE BEST PERFORMER VALUE
Pillar 1: Domestic market access (1–7) ......................................................... 110 ...........................3.8 Multiple economies (2) ................................ 7.0 1.01 Tariff rate (%)........................................................................................... 110 .......... n ........10.8 Multiple economies (2) .............................0.0 1.02 Complexity of tariffs index (1–7) .................................................................. 6 .......... n ..........6.7 Multiple economies (2) .............................7.0
Tariff dispersion (standard deviation) ......................................................... 26 .......... n ..........6.8 Multiple economies (2) .............................0.0Tariff peaks (% of tariff lines) ....................................................................... 1 .......... n ..........0.0 Multiple economies (24) ...........................0.0Specific tariffs (% of tariff lines) ................................................................... 1 .......... n ..........0.0 Multiple economies (54) ...........................0.0Number of distinct tariffs ............................................................................. 5 .......... n .............4 Multiple economies (2) ................................1
1.03 Share of duty-free imports (%) ................................................................ 115 .......... n ........19.3 Multiple economies (2) .........................100.0
Pillar 2: Foreign market access (1–7) .............................................................. 81 ...........................2.3 Cambodia ..................................................... 5.3 2.01 Tariffs faced (%) ........................................................................................ 48 .......... n ..........5.3 Chile .........................................................3.5 2.02 Index of margin of preference in destination mkts (0–100) ........................ 88 .......... n ........14.8 Mauritius ................................................97.1
Pillar 3: Efficiency and transparency of border administration (1–7) ............ 135 ...........................2.4 Singapore..................................................... 6.3 3.01 Customs services index (0–1) ................................................................. 108 .......... n ........0.26 Singapore...............................................0.97 3.02 Efficiency of the clearance process (1–5) .................................................. 86 .......... n ..........2.5 Norway ....................................................4.2 3.03 No. of days to import ............................................................................. 131 .......... n ...........49 Singapore....................................................4 3.04 No. of documents to import ................................................................... 101 .......... n .............9 Multiple economies (2) ................................2 3.05 Cost to import (US$ per container) ......................................................... 133 .......... n ......4,430 Singapore................................................440 3.06 No. of days to export.............................................................................. 129 .......... n ...........41 Multiple economies (5) ................................6 3.07 No. of documents to export ................................................................... 130 .......... n ...........10 Multiple economies (2) ................................2 3.08 Cost to export (US$ per container) ......................................................... 125 .......... n ......2,455 Malaysia ..................................................450 3.09 Irregular payments in exports and imports*............................................. 121 .......... n ..........2.4 New Zealand ............................................6.6 3.10 Time predictability of import procedures* .................................................. 88 .......... n ..........3.5 Finland .....................................................6.0 3.11 Customs transparency index (0–1) ......................................................... 109 .......... n ........0.20 Multiple economies (35) .........................1.00
Pillar 4: Availability and quality of transport infrastructure (1-7) ................... 123 ...........................2.3 United Arab Emirates ................................... 6.5 4.01 Available int’l airline seat km/week, millions ............................................ 121 .......... n ........17.8 United States ..................................11,481.7 4.02 Quality of air transport infrastructure* ...................................................... 121 .......... n ..........3.1 Singapore.................................................6.8 4.03 Quality of railroad infrastructure* ............................................................... 92 .......... n ..........1.8 Japan .......................................................6.7 4.04 Liner Shipping Connectivity Index (0–157.1) ............................................ n/a ........................n/a China ...................................................157.5 4.05 Quality of port infrastructure* .................................................................... 97 .......... n ..........3.5 Netherlands ..............................................6.8 4.06 Paved roads (% of total) ......................................................................... 137 .......... n ..........4.2 Multiple economies (18) .......................100.0 4.07 Quality of roads* ..................................................................................... 122 .......... n ..........2.6 United Arab Emirates ...............................6.6
Pillar 5: Availability and quality of transport services (1–7) .......................... 105 ...........................3.6 Singapore..................................................... 5.7 5.01 Ease and affordability of shipment (1–5).................................................. 102 .......... n ..........2.6 Luxembourg .............................................3.8 5.02 Logistics competence (1–5) ...................................................................... 94 .......... n ..........2.6 Norway ....................................................4.2 5.03 Tracking and tracing ability (1–5) ............................................................. 111 .......... n ..........2.5 Germany ..................................................4.2 5.04 Timeliness of shipments in reaching destination (1–5) ............................... 74 .......... n ..........3.2 Luxembourg .............................................4.7 5.05 Postal services efficiency* ......................................................................... 97 .......... n ..........3.8 Japan .......................................................6.8 5.06 Efficiency of transport mode change* ..................................................... 115 .......... n ..........3.1 Hong Kong SAR ......................................6.4
Pillar 6: Availability and use of ICTs (1–7) ...................................................... 125 ...........................2.2 Sweden ........................................................ 6.5 6.01 Mobile phone subscriptions/100 pop. .................................................... 121 .......... n ........60.6 Hong Kong SAR ..................................229.2 6.02 Individuals using Internet (%) .................................................................. 129 .......... n ..........3.7 Iceland ...................................................96.2 6.03 Fixed broadband Internet subscriptions/100 pop. .................................. 121 .......... n ..........0.1 Switzerland ............................................39.9 6.04 Active mobile broadband Internet subscriptions/100 pop. ...................... 127 .......... n ..........0.0 Singapore.............................................124.5 6.05 ICT use for business-to-business transactions* ...................................... 110 .......... n ..........4.3 Finland .....................................................6.2 6.06 Internet use for business-to-consumer transactions* .............................. 121 .......... n ..........3.4 United Kingdom .......................................6.3 6.07 Government Online Service Index (0–1) .................................................. 117 .......... n ........0.29 Multiple economies (3) ...........................1.00
Pillar 7: Operating environment (1–7) ............................................................ 122 ...........................3.4 Hong Kong SAR ............................................ 5.8 7.01 Protection of property index (1–7) ............................................................. 87 .......... n ..........3.5 Finland .....................................................6.3
Property rights* ......................................................................................... 98 .......... n ..........3.7 Finland .....................................................6.4Intellectual property protection* ................................................................ 82 .......... n ..........3.4 Finland .....................................................6.2
7.02 Efficiency and accountability of public institutions index (1–7) ................. 137 .......... n ..........2.3 Singapore.................................................6.0Judicial efficiency & impartiality in commercial disputes (0–4).................. 127 .......... n ..........0.0 Multiple economies (7) .............................4.0Diversion of public funds* ....................................................................... 129 .......... n ..........2.1 New Zealand ............................................6.5Ease of compliance with government regulation* ...................................... 42 .......... n ..........3.7 Singapore.................................................5.4
7.03 Access to finance index (1–7) ................................................................ 131 .......... n ..........2.6 Hong Kong SAR ......................................5.7Affordability of financial services* ........................................................... 132 .......... n ..........3.0 Hong Kong SAR ......................................6.1Availability of financial services* .............................................................. 126 .......... n ..........3.2 Switzerland ..............................................6.4Ease of access to loans* ........................................................................ 134 .......... n ..........1.6 Qatar ........................................................4.9Availability of trade finance* .................................................................... 123 .......... n ..........2.6 Hong Kong SAR ......................................5.8
7.04 Openness to foreign participation index (1–7) ........................................... 80 .......... n ..........4.2 Ireland ......................................................5.5Ease of hiring foreign labour* .................................................................... 44 .......... n ..........4.3 United Arab Emirates ...............................5.6Business impact of rules on FDI* .............................................................. 59 .......... n ..........4.6 Ireland ......................................................6.7Openness to multilateral trade rules (0–100) ........................................... 105 .......... n ........54.2 Slovenia .................................................92.2
7.05 Index of physical security (1–7) ............................................................... 107 .......... n ..........4.5 Qatar ........................................................6.8Reliability of police services* ..................................................................... 69 .......... n ..........4.1 Finland .....................................................6.7Business costs of crime and violence* .................................................... 100 .......... n ..........3.9 Qatar ........................................................6.8Business costs of terrorism* ................................................................... 116 .......... n ..........4.4 Slovenia ...................................................6.7Homicide cases/100,000 pop. ............................................................... 119 .......... n ........18.0 Hong Kong SAR ......................................0.2Index of terrorism incidence (1-7) ............................................................... 1 .......... n ..........7.0 Multiple economies (48) ...........................7.0
© 2014 World Economic Forum

Country/Economy Profiles
88 | The Global Enabling Trade Report 2014
* From the list of factors above, respondents were asked to select the five most problematic for trading in their country and to rank them between 1 (most problematic) and 5. The bars in the figure show the responses weighted according to their rankings.
For methodology, indicator descriptions and sources, and for a list of multiple best-performing economies, see page 45.
0 105 15 20 25 30
0 5 10 15 20 25 30
2
3
4
5
6
7
Operating environment
Availability & use of ICTs
Availability & quality of transport services
Availability & quality of transport infrastructure
Efficiency & transparency of border administration
Foreign market access
Domestic market access
1
Enabling Trade Index 2014 Rank Score (out of 138) (1–7)
Enabling Trade Index 2014 ...................132 ..... 3.0
Subindex A: Market access (25%) ....................44 .......4.0Pillar 1: Domestic market access .....................................81 .........4.7Pillar 2: Foreign market access ........................................43 ........ 3.3
Subindex B: Border administration (25%) ......136 .......2.4Pillar 3: Efficiency & transparency of border administration .................................................136 .........2.4
Subindex C: Infrastructure (25%) ....................133 .......2.4Pillar 4: Availability & quality of transport infrastructure .122 .........2.3Pillar 5: Availability & quality of transport services ......... 119 ........ 3.3Pillar 6: Availability & use of ICTs ................................... 137 .........1.5
Subindex D: Operating environment (25%) ....133 .......3.1Pillar 7: Operating environment ......................................133 .........3.1
Key indicators, 2012 Rank/138
Population (millions) .............................................................. 8.8 ........... 80GDP (US$ billions) .................................................................2.5 ......... 134GDP per capita (US$) ........................................................281.8 ......... 137
Merchandise tradeTrade openness (imports+exports)/GDP ............................ 36.8 ......... 128Share of world trade (%) ..................................................... 0.00 ......... 137Total Exports (US$ billions) ....................................................0.1 ......... 137Total Imports (US$ billions) ................................................... 0.8 ......... 137
Value chain indicators, 2010Share (%) of merchandise trade Exports Imports
Capital goods ..................................................................... 0.9 ........ 18.3
Intermediate goods ...........................................................81.7 ........52.0Food and beverages (industrial) ................................... 60.0 ...........7.7Industrial supplies (primary and processed) .................21.0 ........ 35.9Parts and accessories .....................................................0.7 .......... 8.3Fuels and lubricants ....................................................... 0.0 ...........0.1
Consumer goods .............................................................. 14.8 ........22.9Food and beverages (consumer) ................................... 11.4 .......... 5.2Transport equipment and consumer goods ................... 3.4 .........17.7
Passenger motor cars ........................................................ 0.5 .......... 5.0
Others .................................................................................. 2.1 .......... 1.7
The most problematic factors for trade, 2013Most problematic factors for exporting Score*
Access to trade finance .........................................................................................21.6Identifying potential markets and buyers ...............................................................14.5Inappropriate production technology and skills .....................................................14.2Difficulties in meeting quality/quantity requirements of buyers ............................... 9.8High cost or delays caused by international transportation ................................... 8.2Access to imported inputs at competitive prices ................................................... 6.6Technical requirements and standards abroad ...................................................... 6.0Tariff barriers abroad .............................................................................................. 5.8Burdensome procedures at foreign borders .......................................................... 4.8High cost or delays caused by domestic transportation ........................................ 3.6Rules of origin requirements abroad ....................................................................... 3.3Corruption at foreign borders ..................................................................................1.6
Most problematic factors for importing Score*
Corruption at the border ....................................................................................... 22.5Tariffs .................................................................................................................... 22.0Burdensome import procedures ...........................................................................19.4High cost or delays caused by international transportation ..................................11.0High cost or delays caused by domestic transportation .......................................10.1Inappropriate telecommunications infrastructure ....................................................7.2Domestic technical requirements and standards ................................................... 6.0Crime and theft ........................................................................................................1.9
Burundi
Sources: International Monetary Fund, World Bank, World Trade Organization, United Nations COMTRADE
Burundi Land-Locked, Least Developed Countries
Sub-Saharan Africa
© 2014 World Economic Forum

Country/Economy Profiles
The Global Enabling Trade Report 2014 | 89
* Indicator derived from the World Economic Forum’s Executive Opinion Survey and measured on a 1-to-7 scale, where 7 indicates best outcome.
The Enabling Trade Index 2014 in detail n Competitive Advantage n Competitive Disadvantage
For methodology, indicator descriptions and sources, and for a list of multiple best-performing economies, see page 45. Burundi
INDICATOR, UNITS RANK/138 VALUE BEST PERFORMER VALUE
Pillar 1: Domestic market access (1–7) ........................................................... 81 ...........................4.7 Multiple economies (2) ................................ 7.0 1.01 Tariff rate (%)............................................................................................. 93 .......... n ..........8.7 Multiple economies (2) .............................0.0 1.02 Complexity of tariffs index (1–7) ................................................................ 47 .......... n ..........6.4 Multiple economies (2) .............................7.0
Tariff dispersion (standard deviation) ....................................................... 106 .......... n ........11.7 Multiple economies (2) .............................0.0Tariff peaks (% of tariff lines) ..................................................................... 47 .......... n ..........0.8 Multiple economies (24) ...........................0.0Specific tariffs (% of tariff lines) ................................................................. 60 .......... n ..........0.2 Multiple economies (54) ...........................0.0Number of distinct tariffs ........................................................................... 52 .......... n ...........19 Multiple economies (2) ................................1
1.03 Share of duty-free imports (%) .................................................................. 84 .......... n ........53.5 Multiple economies (2) .........................100.0
Pillar 2: Foreign market access (1–7) .............................................................. 43 ...........................3.3 Cambodia ..................................................... 5.3 2.01 Tariffs faced (%) ........................................................................................ 34 .......... n ..........5.2 Chile .........................................................3.5 2.02 Index of margin of preference in destination mkts (0–100) ........................ 45 .......... n ........43.1 Mauritius ................................................97.1
Pillar 3: Efficiency and transparency of border administration (1–7) ............ 136 ...........................2.4 Singapore..................................................... 6.3 3.01 Customs services index (0–1) ................................................................... 97 .......... n ........0.38 Singapore...............................................0.97 3.02 Efficiency of the clearance process (1–5) .................................................. 77 .......... n ..........2.6 Norway ....................................................4.2 3.03 No. of days to import ............................................................................. 130 .......... n ...........46 Singapore....................................................4 3.04 No. of documents to import ................................................................... 115 .......... n ...........10 Multiple economies (2) ................................2 3.05 Cost to import (US$ per container) ......................................................... 132 .......... n ......4,420 Singapore................................................440 3.06 No. of days to export.............................................................................. 122 .......... n ...........32 Multiple economies (5) ................................6 3.07 No. of documents to export ................................................................... 121 .......... n .............9 Multiple economies (2) ................................2 3.08 Cost to export (US$ per container) ......................................................... 130 .......... n ......2,905 Malaysia ..................................................450 3.09 Irregular payments in exports and imports*............................................. 126 .......... n ..........2.2 New Zealand ............................................6.6 3.10 Time predictability of import procedures* ................................................ 126 .......... n ..........2.8 Finland .....................................................6.0 3.11 Customs transparency index (0–1) ......................................................... 112 .......... n ........0.10 Multiple economies (35) .........................1.00
Pillar 4: Availability and quality of transport infrastructure (1-7) ................... 122 ...........................2.3 United Arab Emirates ................................... 6.5 4.01 Available int’l airline seat km/week, millions ............................................ 136 .......... n ..........2.6 United States ..................................11,481.7 4.02 Quality of air transport infrastructure* ...................................................... 133 .......... n ..........2.7 Singapore.................................................6.8 4.03 Quality of railroad infrastructure* .............................................................. n/a ........................n/a Japan .......................................................6.7 4.04 Liner Shipping Connectivity Index (0–157.1) ............................................ n/a ........................n/a China ...................................................157.5 4.05 Quality of port infrastructure* .................................................................. 121 .......... n ..........2.8 Netherlands ..............................................6.8 4.06 Paved roads (% of total) ......................................................................... 124 .......... n ........10.4 Multiple economies (18) .......................100.0 4.07 Quality of roads* ....................................................................................... 99 .......... n ..........3.0 United Arab Emirates ...............................6.6
Pillar 5: Availability and quality of transport services (1–7) .......................... 119 ...........................3.3 Singapore..................................................... 5.7 5.01 Ease and affordability of shipment (1–5).................................................. 108 .......... n ..........2.6 Luxembourg .............................................3.8 5.02 Logistics competence (1–5) .................................................................... 106 .......... n ..........2.5 Norway ....................................................4.2 5.03 Tracking and tracing ability (1–5) ............................................................. 108 .......... n ..........2.5 Germany ..................................................4.2 5.04 Timeliness of shipments in reaching destination (1–5) ............................. 120 .......... n ..........2.8 Luxembourg .............................................4.7 5.05 Postal services efficiency* ......................................................................... 96 .......... n ..........3.8 Japan .......................................................6.8 5.06 Efficiency of transport mode change* ..................................................... 130 .......... n ..........2.7 Hong Kong SAR ......................................6.4
Pillar 6: Availability and use of ICTs (1–7) ...................................................... 137 ...........................1.5 Sweden ........................................................ 6.5 6.01 Mobile phone subscriptions/100 pop. .................................................... 136 .......... n ........22.8 Hong Kong SAR ..................................229.2 6.02 Individuals using Internet (%) .................................................................. 136 .......... n ..........1.2 Iceland ...................................................96.2 6.03 Fixed broadband Internet subscriptions/100 pop. .................................. 136 .......... n ..........0.0 Switzerland ............................................39.9 6.04 Active mobile broadband Internet subscriptions/100 pop. ...................... 126 .......... n ..........0.0 Singapore.............................................124.5 6.05 ICT use for business-to-business transactions* ...................................... 136 .......... n ..........3.0 Finland .....................................................6.2 6.06 Internet use for business-to-consumer transactions* .............................. 137 .......... n ..........2.6 United Kingdom .......................................6.3 6.07 Government Online Service Index (0–1) .................................................. 130 .......... n ........0.15 Multiple economies (3) ...........................1.00
Pillar 7: Operating environment (1–7) ............................................................ 133 ...........................3.1 Hong Kong SAR ............................................ 5.8 7.01 Protection of property index (1–7) ........................................................... 134 .......... n ..........2.5 Finland .....................................................6.3
Property rights* ....................................................................................... 131 .......... n ..........2.7 Finland .....................................................6.4Intellectual property protection* .............................................................. 132 .......... n ..........2.3 Finland .....................................................6.2
7.02 Efficiency and accountability of public institutions index (1–7) ................. 114 .......... n ..........2.9 Singapore.................................................6.0Judicial efficiency & impartiality in commercial disputes (0–4).................... 77 .......... n ..........1.8 Multiple economies (7) .............................4.0Diversion of public funds* ....................................................................... 125 .......... n ..........2.2 New Zealand ............................................6.5Ease of compliance with government regulation* .................................... 108 .......... n ..........2.9 Singapore.................................................5.4
7.03 Access to finance index (1–7) ................................................................ 137 .......... n ..........2.3 Hong Kong SAR ......................................5.7Affordability of financial services* ........................................................... 137 .......... n ..........2.6 Hong Kong SAR ......................................6.1Availability of financial services* .............................................................. 136 .......... n ..........2.5 Switzerland ..............................................6.4Ease of access to loans* ........................................................................ 131 .......... n ..........1.7 Qatar ........................................................4.9Availability of trade finance* .................................................................... 133 .......... n ..........2.5 Hong Kong SAR ......................................5.8
7.04 Openness to foreign participation index (1–7) ......................................... 132 .......... n ..........3.0 Ireland ......................................................5.5Ease of hiring foreign labour* .................................................................. 122 .......... n ..........3.3 United Arab Emirates ...............................5.6Business impact of rules on FDI* ............................................................ 127 .......... n ..........3.2 Ireland ......................................................6.7Openness to multilateral trade rules (0–100) ........................................... 127 .......... n ........38.8 Slovenia .................................................92.2
7.05 Index of physical security (1–7) ............................................................... 102 .......... n ..........4.7 Qatar ........................................................6.8Reliability of police services* ................................................................... 137 .......... n ..........2.1 Finland .....................................................6.7Business costs of crime and violence* .................................................... 106 .......... n ..........3.8 Qatar ........................................................6.8Business costs of terrorism* ................................................................... 113 .......... n ..........4.4 Slovenia ...................................................6.7Homicide cases/100,000 pop. ................................................................. 76 .......... n ..........4.1 Hong Kong SAR ......................................0.2Index of terrorism incidence (1-7) ........................................................... 122 .......... n ..........6.2 Multiple economies (48) ...........................7.0
© 2014 World Economic Forum

Country/Economy Profiles
90 | The Global Enabling Trade Report 2014
* From the list of factors above, respondents were asked to select the five most problematic for trading in their country and to rank them between 1 (most problematic) and 5. The bars in the figure show the responses weighted according to their rankings.
For methodology, indicator descriptions and sources, and for a list of multiple best-performing economies, see page 45.
0 105 15 20 25 30
0 5 10 15 20 25 30
2
3
4
5
6
7
Operating environment
Availability & use of ICTs
Availability & quality of transport services
Availability & quality of transport infrastructure
Efficiency & transparency of border administration
Foreign market access
Domestic market access
1
Enabling Trade Index 2014 Rank Score (out of 138) (1–7)
Enabling Trade Index 2014 .................... 93 ......3.7
Subindex A: Market access (25%) ....................36 .......4.1Pillar 1: Domestic market access ...................................133 .........2.9Pillar 2: Foreign market access ..........................................1 ........ 5.3
Subindex B: Border administration (25%) ......108 .......3.4Pillar 3: Efficiency & transparency of border administration .................................................108 .........3.4
Subindex C: Infrastructure (25%) ....................101 .......3.1Pillar 4: Availability & quality of transport infrastructure . 113 .........2.5Pillar 5: Availability & quality of transport services ...........97 ........ 3.6Pillar 6: Availability & use of ICTs .....................................95 .........3.1
Subindex D: Operating environment (25%) ...... 74 .......4.1Pillar 7: Operating environment ........................................ 74 .........4.1
Key indicators, 2012 Rank/138
Population (millions) .............................................................15.3 ........... 59GDP (US$ billions) ............................................................... 14.1 ......... 107GDP per capita (US$) ....................................................... 925.5 ..........119
Merchandise tradeTrade openness (imports+exports)/GDP ...........................136.5 ........... 14Share of world trade (%) ..................................................... 0.05 ........... 90Total Exports (US$ billions) ................................................... 8.2 ........... 90Total Imports (US$ billions) ..................................................11.0 ........... 91
Value chain indicators, 2012Share (%) of merchandise trade Exports Imports
Capital goods ..................................................................... 0.5 ........ 11.3
Intermediate goods .......................................................... 34.0 ........ 59.4Food and beverages (industrial) ..................................... 0.3 .......... 1.0Industrial supplies (primary and processed) ................ 33.5 ........ 54.9Parts and accessories .................................................... 0.2 .......... 2.5Fuels and lubricants ....................................................... 0.0 .......... 0.9
Consumer goods .............................................................. 65.3 ........ 13.3Food and beverages (consumer) .....................................1.9 ...........2.1Transport equipment and consumer goods ................. 63.4 .........11.2
Passenger motor cars ........................................................ 0.2 ..........2.9
Others .................................................................................. 0.0 ........ 13.1
The most problematic factors for trade, 2013Most problematic factors for exporting Score*
Identifying potential markets and buyers ...............................................................14.4Difficulties in meeting quality/quantity requirements of buyers ..............................14.3Inappropriate production technology and skills .....................................................12.7High cost or delays caused by domestic transportation .......................................11.2Technical requirements and standards abroad .....................................................10.4Access to trade finance .......................................................................................... 9.5Access to imported inputs at competitive prices ................................................... 9.0Corruption at foreign borders ................................................................................. 6.5Burdensome procedures at foreign borders .......................................................... 3.7Rules of origin requirements abroad ....................................................................... 3.4High cost or delays caused by international transportation ................................... 3.3Tariff barriers abroad ...............................................................................................1.6
Most problematic factors for importing Score*
Corruption at the border ....................................................................................... 23.6Burdensome import procedures ...........................................................................19.9Tariffs ..................................................................................................................... 17.5High cost or delays caused by domestic transportation .......................................13.3High cost or delays caused by international transportation ................................... 8.4Inappropriate telecommunications infrastructure ....................................................7.2Crime and theft ....................................................................................................... 5.3Domestic technical requirements and standards ................................................... 4.8
Cambodia
Sources: International Monetary Fund, World Bank, World Trade Organization, United Nations COMTRADE
Cambodia Least Developed Countries
Developing Asia
© 2014 World Economic Forum

Country/Economy Profiles
The Global Enabling Trade Report 2014 | 91
* Indicator derived from the World Economic Forum’s Executive Opinion Survey and measured on a 1-to-7 scale, where 7 indicates best outcome.
The Enabling Trade Index 2014 in detail n Competitive Advantage n Competitive Disadvantage
For methodology, indicator descriptions and sources, and for a list of multiple best-performing economies, see page 45. Cambodia
INDICATOR, UNITS RANK/138 VALUE BEST PERFORMER VALUE
Pillar 1: Domestic market access (1–7) ......................................................... 133 ...........................2.9 Multiple economies (2) ................................ 7.0 1.01 Tariff rate (%)........................................................................................... 125 .......... n ........13.0 Multiple economies (2) .............................0.0 1.02 Complexity of tariffs index (1–7) ................................................................ 76 .......... n ..........5.6 Multiple economies (2) .............................7.0
Tariff dispersion (standard deviation) ......................................................... 87 .......... n ..........9.1 Multiple economies (2) .............................0.0Tariff peaks (% of tariff lines) ..................................................................... 98 .......... n ..........9.9 Multiple economies (24) ...........................0.0Specific tariffs (% of tariff lines) ................................................................... 1 .......... n ..........0.0 Multiple economies (54) ...........................0.0Number of distinct tariffs ............................................................................. 5 .......... n .............4 Multiple economies (2) ................................1
1.03 Share of duty-free imports (%) ................................................................ 124 .......... n ..........7.3 Multiple economies (2) .........................100.0
Pillar 2: Foreign market access (1–7) ................................................................ 1 ...........................5.3 Cambodia ..................................................... 5.3 2.01 Tariffs faced (%) .......................................................................................... 2 .......... n ..........3.7 Chile .........................................................3.5 2.02 Index of margin of preference in destination mkts (0–100) ........................ 28 .......... n ........50.5 Mauritius ................................................97.1
Pillar 3: Efficiency and transparency of border administration (1–7) ............ 108 ...........................3.4 Singapore..................................................... 6.3 3.01 Customs services index (0–1) ................................................................... 66 .......... n ........0.58 Singapore...............................................0.97 3.02 Efficiency of the clearance process (1–5) .................................................. 70 .......... n ..........2.7 Norway ....................................................4.2 3.03 No. of days to import ............................................................................... 91 .......... n ...........24 Singapore....................................................4 3.04 No. of documents to import ................................................................... 101 .......... n .............9 Multiple economies (2) ................................2 3.05 Cost to import (US$ per container) ........................................................... 33 .......... n .........930 Singapore................................................440 3.06 No. of days to export................................................................................ 96 .......... n ...........22 Multiple economies (5) ................................6 3.07 No. of documents to export ................................................................... 108 .......... n .............8 Multiple economies (2) ................................2 3.08 Cost to export (US$ per container) ........................................................... 31 .......... n .........795 Malaysia ..................................................450 3.09 Irregular payments in exports and imports*............................................. 119 .......... n ..........2.4 New Zealand ............................................6.6 3.10 Time predictability of import procedures* .................................................. 82 .......... n ..........3.7 Finland .....................................................6.0 3.11 Customs transparency index (0–1) ......................................................... 113 .......... n ........0.07 Multiple economies (35) .........................1.00
Pillar 4: Availability and quality of transport infrastructure (1-7) ................... 113 ...........................2.5 United Arab Emirates ................................... 6.5 4.01 Available int’l airline seat km/week, millions .............................................. 85 .......... n ........73.9 United States ..................................11,481.7 4.02 Quality of air transport infrastructure* ........................................................ 85 .......... n ..........4.1 Singapore.................................................6.8 4.03 Quality of railroad infrastructure* ............................................................... 83 .......... n ..........2.0 Japan .......................................................6.7 4.04 Liner Shipping Connectivity Index (0–157.1) ............................................. 97 .......... n ..........5.3 China ...................................................157.5 4.05 Quality of port infrastructure* .................................................................... 74 .......... n ..........4.0 Netherlands ..............................................6.8 4.06 Paved roads (% of total) ......................................................................... 135 .......... n ..........6.3 Multiple economies (18) .......................100.0 4.07 Quality of roads* ....................................................................................... 72 .......... n ..........3.7 United Arab Emirates ...............................6.6
Pillar 5: Availability and quality of transport services (1–7) ............................ 97 ...........................3.6 Singapore..................................................... 5.7 5.01 Ease and affordability of shipment (1–5).................................................... 78 .......... n ..........2.8 Luxembourg .............................................3.8 5.02 Logistics competence (1–5) ...................................................................... 87 .......... n ..........2.7 Norway ....................................................4.2 5.03 Tracking and tracing ability (1–5) ............................................................... 71 .......... n ..........2.9 Germany ..................................................4.2 5.04 Timeliness of shipments in reaching destination (1–5) ............................. 122 .......... n ..........2.8 Luxembourg .............................................4.7 5.05 Postal services efficiency* ....................................................................... 111 .......... n ..........3.3 Japan .......................................................6.8 5.06 Efficiency of transport mode change* ....................................................... 89 .......... n ..........3.6 Hong Kong SAR ......................................6.4
Pillar 6: Availability and use of ICTs (1–7) ........................................................ 95 ...........................3.1 Sweden ........................................................ 6.5 6.01 Mobile phone subscriptions/100 pop. ...................................................... 34 .......... n ......128.5 Hong Kong SAR ..................................229.2 6.02 Individuals using Internet (%) .................................................................. 122 .......... n ..........4.9 Iceland ...................................................96.2 6.03 Fixed broadband Internet subscriptions/100 pop. .................................. 113 .......... n ..........0.2 Switzerland ............................................39.9 6.04 Active mobile broadband Internet subscriptions/100 pop. ........................ 89 .......... n ..........6.7 Singapore.............................................124.5 6.05 ICT use for business-to-business transactions* ........................................ 78 .......... n ..........4.7 Finland .....................................................6.2 6.06 Internet use for business-to-consumer transactions* .............................. 103 .......... n ..........3.9 United Kingdom .......................................6.3 6.07 Government Online Service Index (0–1) .................................................. 126 .......... n ........0.19 Multiple economies (3) ...........................1.00
Pillar 7: Operating environment (1–7) .............................................................. 74 ...........................4.1 Hong Kong SAR ............................................ 5.8 7.01 Protection of property index (1–7) ............................................................. 94 .......... n ..........3.4 Finland .....................................................6.3
Property rights* ....................................................................................... 100 .......... n ..........3.6 Finland .....................................................6.4Intellectual property protection* ................................................................ 92 .......... n ..........3.2 Finland .....................................................6.2
7.02 Efficiency and accountability of public institutions index (1–7) ................. 102 .......... n ..........3.2 Singapore.................................................6.0Judicial efficiency & impartiality in commercial disputes (0–4).................. 106 .......... n ..........1.3 Multiple economies (7) .............................4.0Diversion of public funds* ......................................................................... 74 .......... n ..........3.1 New Zealand ............................................6.5Ease of compliance with government regulation* ...................................... 65 .......... n ..........3.5 Singapore.................................................5.4
7.03 Access to finance index (1–7) .................................................................. 64 .......... n ..........3.9 Hong Kong SAR ......................................5.7Affordability of financial services* ............................................................. 67 .......... n ..........4.1 Hong Kong SAR ......................................6.1Availability of financial services* ................................................................ 76 .......... n ..........4.3 Switzerland ..............................................6.4Ease of access to loans* .......................................................................... 53 .......... n ..........3.0 Qatar ........................................................4.9Availability of trade finance* ...................................................................... 51 .......... n ..........4.0 Hong Kong SAR ......................................5.8
7.04 Openness to foreign participation index (1–7) ........................................... 56 .......... n ..........4.4 Ireland ......................................................5.5Ease of hiring foreign labour* .................................................................... 14 .......... n ..........4.8 United Arab Emirates ...............................5.6Business impact of rules on FDI* .............................................................. 30 .......... n ..........5.0 Ireland ......................................................6.7Openness to multilateral trade rules (0–100) ........................................... 108 .......... n ........53.0 Slovenia .................................................92.2
7.05 Index of physical security (1–7) ................................................................. 74 .......... n ..........5.4 Qatar ........................................................6.8Reliability of police services* ................................................................... 106 .......... n ..........3.3 Finland .....................................................6.7Business costs of crime and violence* ...................................................... 77 .......... n ..........4.5 Qatar ........................................................6.8Business costs of terrorism* ..................................................................... 78 .......... n ..........5.3 Slovenia ...................................................6.7Homicide cases/100,000 pop. ................................................................. 70 .......... n ..........3.4 Hong Kong SAR ......................................0.2Index of terrorism incidence (1-7) ............................................................... 1 .......... n ..........7.0 Multiple economies (48) ...........................7.0
© 2014 World Economic Forum
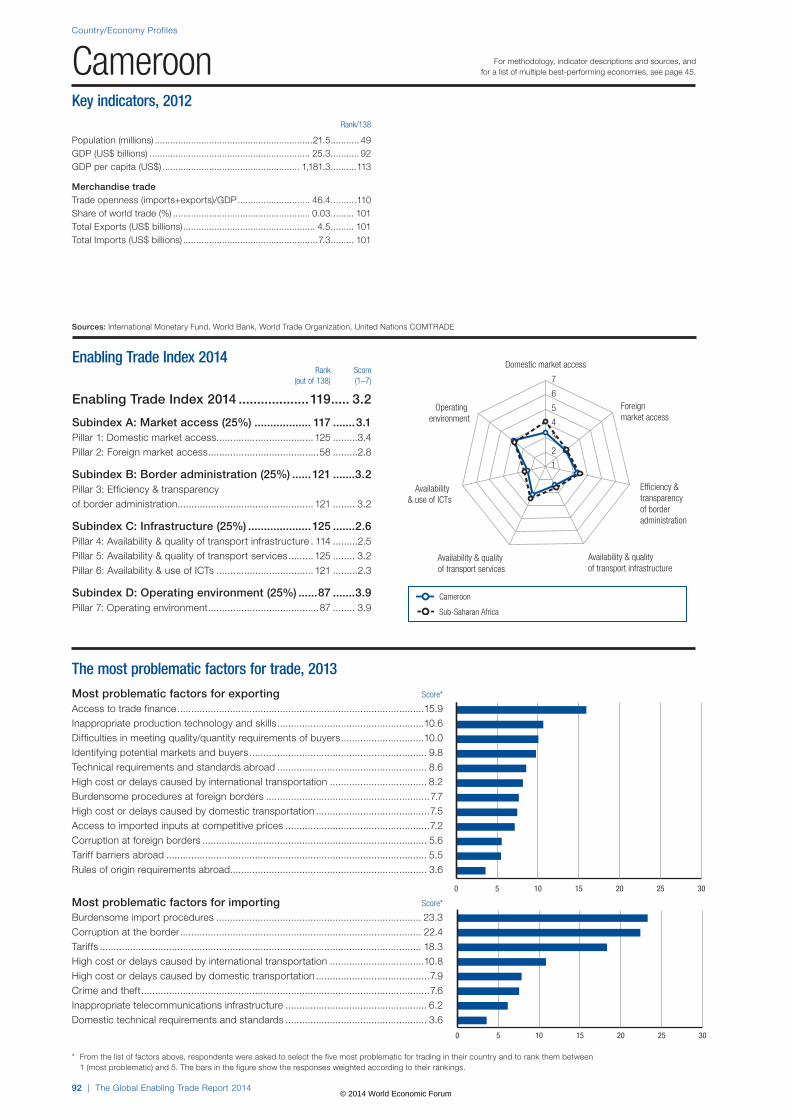
Country/Economy Profiles
92 | The Global Enabling Trade Report 2014
* From the list of factors above, respondents were asked to select the five most problematic for trading in their country and to rank them between 1 (most problematic) and 5. The bars in the figure show the responses weighted according to their rankings.
For methodology, indicator descriptions and sources, and for a list of multiple best-performing economies, see page 45.
0 105 15 20 25 30
0 5 10 15 20 25 30
2
3
4
5
6
7
Operating environment
Availability & use of ICTs
Availability & quality of transport services
Availability & quality of transport infrastructure
Efficiency & transparency of border administration
Foreign market access
Domestic market access
1
Enabling Trade Index 2014 Rank Score (out of 138) (1–7)
Enabling Trade Index 2014 ...................119 ..... 3.2
Subindex A: Market access (25%) .................. 117 .......3.1Pillar 1: Domestic market access ................................... 125 .........3.4Pillar 2: Foreign market access ........................................58 .........2.8
Subindex B: Border administration (25%) ......121 .......3.2Pillar 3: Efficiency & transparency of border administration ................................................. 121 ........ 3.2
Subindex C: Infrastructure (25%) ....................125 .......2.6Pillar 4: Availability & quality of transport infrastructure . 114 .........2.5Pillar 5: Availability & quality of transport services ......... 125 ........ 3.2Pillar 6: Availability & use of ICTs ................................... 121 .........2.3
Subindex D: Operating environment (25%) ......87 .......3.9Pillar 7: Operating environment ........................................87 ........ 3.9
Key indicators, 2012 Rank/138
Population (millions) .............................................................21.5 ........... 49GDP (US$ billions) .............................................................. 25.3 ........... 92GDP per capita (US$) ..................................................... 1,181.3 ..........113
Merchandise tradeTrade openness (imports+exports)/GDP ............................ 46.4 ..........110Share of world trade (%) ..................................................... 0.03 ......... 101Total Exports (US$ billions) ................................................... 4.5 ......... 101Total Imports (US$ billions) ....................................................7.3 ......... 101
The most problematic factors for trade, 2013Most problematic factors for exporting Score*
Access to trade finance .........................................................................................15.9Inappropriate production technology and skills .....................................................10.6Difficulties in meeting quality/quantity requirements of buyers ..............................10.0Identifying potential markets and buyers ................................................................ 9.8Technical requirements and standards abroad ...................................................... 8.6High cost or delays caused by international transportation ................................... 8.2Burdensome procedures at foreign borders ...........................................................7.7High cost or delays caused by domestic transportation .........................................7.5Access to imported inputs at competitive prices ....................................................7.2Corruption at foreign borders ................................................................................. 5.6Tariff barriers abroad .............................................................................................. 5.5Rules of origin requirements abroad ....................................................................... 3.6
Most problematic factors for importing Score*
Burdensome import procedures .......................................................................... 23.3Corruption at the border ....................................................................................... 22.4Tariffs .................................................................................................................... 18.3High cost or delays caused by international transportation ..................................10.8High cost or delays caused by domestic transportation .........................................7.9Crime and theft ........................................................................................................7.6Inappropriate telecommunications infrastructure ................................................... 6.2Domestic technical requirements and standards ................................................... 3.6
Cameroon
Sources: International Monetary Fund, World Bank, World Trade Organization, United Nations COMTRADE
Cameroon
Sub-Saharan Africa
© 2014 World Economic Forum

Country/Economy Profiles
The Global Enabling Trade Report 2014 | 93
* Indicator derived from the World Economic Forum’s Executive Opinion Survey and measured on a 1-to-7 scale, where 7 indicates best outcome.
The Enabling Trade Index 2014 in detail n Competitive Advantage n Competitive Disadvantage
For methodology, indicator descriptions and sources, and for a list of multiple best-performing economies, see page 45. Cameroon
INDICATOR, UNITS RANK/138 VALUE BEST PERFORMER VALUE
Pillar 1: Domestic market access (1–7) ......................................................... 125 ...........................3.4 Multiple economies (2) ................................ 7.0 1.01 Tariff rate (%)........................................................................................... 128 .......... n ........14.3 Multiple economies (2) .............................0.0 1.02 Complexity of tariffs index (1–7) ................................................................ 28 .......... n ..........6.6 Multiple economies (2) .............................7.0
Tariff dispersion (standard deviation) ......................................................... 93 .......... n ..........9.6 Multiple economies (2) .............................0.0Tariff peaks (% of tariff lines) ....................................................................... 1 .......... n ..........0.0 Multiple economies (24) ...........................0.0Specific tariffs (% of tariff lines) ................................................................... 1 .......... n ..........0.0 Multiple economies (54) ...........................0.0Number of distinct tariffs ........................................................................... 19 .......... n .............5 Multiple economies (2) ................................1
1.03 Share of duty-free imports (%) ................................................................ 110 .......... n ........21.5 Multiple economies (2) .........................100.0
Pillar 2: Foreign market access (1–7) .............................................................. 58 ...........................2.8 Cambodia ..................................................... 5.3 2.01 Tariffs faced (%) ...................................................................................... 104 .......... n ..........5.5 Chile .........................................................3.5 2.02 Index of margin of preference in destination mkts (0–100) ........................ 47 .......... n ........42.2 Mauritius ................................................97.1
Pillar 3: Efficiency and transparency of border administration (1–7) ............ 121 ...........................3.2 Singapore..................................................... 6.3 3.01 Customs services index (0–1) ................................................................... 91 .......... n ........0.42 Singapore...............................................0.97 3.02 Efficiency of the clearance process (1–5) ................................................ 137 .......... n ..........1.9 Norway ....................................................4.2 3.03 No. of days to import ............................................................................... 94 .......... n ...........25 Singapore....................................................4 3.04 No. of documents to import ................................................................... 126 .......... n ...........11 Multiple economies (2) ................................2 3.05 Cost to import (US$ per container) ......................................................... 108 .......... n ......2,167 Singapore................................................440 3.06 No. of days to export.............................................................................. 101 .......... n ...........23 Multiple economies (5) ................................6 3.07 No. of documents to export ................................................................... 136 .......... n ...........11 Multiple economies (2) ................................2 3.08 Cost to export (US$ per container) ........................................................... 89 .......... n ......1,379 Malaysia ..................................................450 3.09 Irregular payments in exports and imports*............................................. 114 .......... n ..........2.6 New Zealand ............................................6.6 3.10 Time predictability of import procedures* .................................................. 83 .......... n ..........3.6 Finland .....................................................6.0 3.11 Customs transparency index (0–1) ......................................................... 102 .......... n ........0.50 Multiple economies (35) .........................1.00
Pillar 4: Availability and quality of transport infrastructure (1-7) ................... 114 ...........................2.5 United Arab Emirates ................................... 6.5 4.01 Available int’l airline seat km/week, millions .............................................. 94 .......... n ........47.5 United States ..................................11,481.7 4.02 Quality of air transport infrastructure* ...................................................... 104 .......... n ..........3.5 Singapore.................................................6.8 4.03 Quality of railroad infrastructure* ............................................................... 70 .......... n ..........2.5 Japan .......................................................6.7 4.04 Liner Shipping Connectivity Index (0–157.1) ............................................. 77 .......... n ........10.9 China ...................................................157.5 4.05 Quality of port infrastructure* .................................................................... 92 .......... n ..........3.7 Netherlands ..............................................6.8 4.06 Paved roads (% of total) ......................................................................... 106 .......... n ........17.0 Multiple economies (18) .......................100.0 4.07 Quality of roads* ..................................................................................... 107 .......... n ..........2.8 United Arab Emirates ...............................6.6
Pillar 5: Availability and quality of transport services (1–7) .......................... 125 ...........................3.2 Singapore..................................................... 5.7 5.01 Ease and affordability of shipment (1–5).................................................. 134 .......... n ..........2.2 Luxembourg .............................................3.8 5.02 Logistics competence (1–5) .................................................................... 104 .......... n ..........2.5 Norway ....................................................4.2 5.03 Tracking and tracing ability (1–5) ............................................................. 107 .......... n ..........2.5 Germany ..................................................4.2 5.04 Timeliness of shipments in reaching destination (1–5) ............................. 116 .......... n ..........2.8 Luxembourg .............................................4.7 5.05 Postal services efficiency* ....................................................................... 122 .......... n ..........2.9 Japan .......................................................6.8 5.06 Efficiency of transport mode change* ..................................................... 120 .......... n ..........3.0 Hong Kong SAR ......................................6.4
Pillar 6: Availability and use of ICTs (1–7) ...................................................... 121 ...........................2.3 Sweden ........................................................ 6.5 6.01 Mobile phone subscriptions/100 pop. .................................................... 122 .......... n ........60.4 Hong Kong SAR ..................................229.2 6.02 Individuals using Internet (%) .................................................................. 120 .......... n ..........5.7 Iceland ...................................................96.2 6.03 Fixed broadband Internet subscriptions/100 pop. .................................. 106 .......... n ..........0.6 Switzerland ............................................39.9 6.04 Active mobile broadband Internet subscriptions/100 pop. ...................... 124 .......... n ..........0.0 Singapore.............................................124.5 6.05 ICT use for business-to-business transactions* ........................................ 66 .......... n ..........4.8 Finland .....................................................6.2 6.06 Internet use for business-to-consumer transactions* .............................. 100 .......... n ..........4.0 United Kingdom .......................................6.3 6.07 Government Online Service Index (0–1) .................................................. 112 .......... n ........0.30 Multiple economies (3) ...........................1.00
Pillar 7: Operating environment (1–7) .............................................................. 87 ...........................3.9 Hong Kong SAR ............................................ 5.8 7.01 Protection of property index (1–7) ............................................................. 90 .......... n ..........3.5 Finland .....................................................6.3
Property rights* ......................................................................................... 84 .......... n ..........3.8 Finland .....................................................6.4Intellectual property protection* ................................................................ 93 .......... n ..........3.2 Finland .....................................................6.2
7.02 Efficiency and accountability of public institutions index (1–7) ................. 126 .......... n ..........2.7 Singapore.................................................6.0Judicial efficiency & impartiality in commercial disputes (0–4).................. 113 .......... n ..........1.0 Multiple economies (7) .............................4.0Diversion of public funds* ....................................................................... 130 .......... n ..........2.0 New Zealand ............................................6.5Ease of compliance with government regulation* ...................................... 71 .......... n ..........3.4 Singapore.................................................5.4
7.03 Access to finance index (1–7) .................................................................. 95 .......... n ..........3.4 Hong Kong SAR ......................................5.7Affordability of financial services* ........................................................... 100 .......... n ..........3.7 Hong Kong SAR ......................................6.1Availability of financial services* ................................................................ 97 .......... n ..........3.9 Switzerland ..............................................6.4Ease of access to loans* .......................................................................... 95 .......... n ..........2.4 Qatar ........................................................4.9Availability of trade finance* ...................................................................... 83 .......... n ..........3.6 Hong Kong SAR ......................................5.8
7.04 Openness to foreign participation index (1–7) ........................................... 59 .......... n ..........4.4 Ireland ......................................................5.5Ease of hiring foreign labour* ...................................................................... 7 .......... n ..........5.0 United Arab Emirates ...............................5.6Business impact of rules on FDI* .............................................................. 38 .......... n ..........4.9 Ireland ......................................................6.7Openness to multilateral trade rules (0–100) ........................................... 111 .......... n ........50.0 Slovenia .................................................92.2
7.05 Index of physical security (1–7) ................................................................. 66 .......... n ..........5.5 Qatar ........................................................6.8Reliability of police services* ..................................................................... 63 .......... n ..........4.3 Finland .....................................................6.7Business costs of crime and violence* ...................................................... 85 .......... n ..........4.3 Qatar ........................................................6.8Business costs of terrorism* ..................................................................... 90 .......... n ..........5.0 Slovenia ...................................................6.7Homicide cases/100,000 pop. ................................................................. 58 .......... n ..........2.3 Hong Kong SAR ......................................0.2Index of terrorism incidence (1-7) ............................................................. 92 .......... n ..........6.9 Multiple economies (48) ...........................7.0
© 2014 World Economic Forum

Country/Economy Profiles
94 | The Global Enabling Trade Report 2014
* From the list of factors above, respondents were asked to select the five most problematic for trading in their country and to rank them between 1 (most problematic) and 5. The bars in the figure show the responses weighted according to their rankings.
For methodology, indicator descriptions and sources, and for a list of multiple best-performing economies, see page 45.
0 105 15 20 25 30
0 5 10 15 20 25 30
2
3
4
5
6
7
Operating environment
Availability & use of ICTs
Availability & quality of transport services
Availability & quality of transport infrastructure
Efficiency & transparency of border administration
Foreign market access
Domestic market access
1
Enabling Trade Index 2014 Rank Score (out of 138) (1–7)
Enabling Trade Index 2014 .....................14 ..... 5.0
Subindex A: Market access (25%) ....................41 .......4.0Pillar 1: Domestic market access .....................................16 .........5.7Pillar 2: Foreign market access ........................................76 .........2.4
Subindex B: Border administration (25%) ........20 .......5.7Pillar 3: Efficiency & transparency of border administration ...................................................20 .........5.7
Subindex C: Infrastructure (25%) ......................22 .......5.2Pillar 4: Availability & quality of transport infrastructure ...19 .........4.9Pillar 5: Availability & quality of transport services ...........13 .........5.4Pillar 6: Availability & use of ICTs .....................................28 ........ 5.3
Subindex D: Operating environment (25%) ......15 .......5.2Pillar 7: Operating environment ........................................15 ........ 5.2
Key indicators, 2012 Rank/138
Population (millions) ............................................................ 34.8 ........... 35GDP (US$ billions) ..........................................................1,821.4 ............11GDP per capita (US$) .................................................. 52,299.8 ............. 8
Merchandise tradeTrade openness (imports+exports)/GDP .............................51.0 ........... 99Share of world trade (%) ......................................................2.51 ............11Total Exports (US$ billions) ............................................... 454.8 ........... 12Total Imports (US$ billions) ................................................474.9 ........... 12
Value chain indicators, 2012Share (%) of merchandise trade Exports Imports
Capital goods ..................................................................... 6.9 ........ 19.5
Intermediate goods .......................................................... 68.0 .........51.1Food and beverages (industrial) ......................................4.6 .......... 0.9Industrial supplies (primary and processed) .................31.8 ........ 25.3Parts and accessories .................................................... 9.3 ......... 17.1Fuels and lubricants ......................................................22.4 ...........7.8
Consumer goods ................................................................ 9.0 ........20.2Food and beverages (consumer) .................................... 5.0 .......... 5.9Transport equipment and consumer goods ................... 4.0 ........ 14.2
Passenger motor cars .......................................................11.1 .......... 5.7
Others ...................................................................................5.1 .......... 3.6
The most problematic factors for trade, 2013Most problematic factors for exporting Score*
Identifying potential markets and buyers ...............................................................19.9Burdensome procedures at foreign borders .........................................................12.1Tariff barriers abroad .............................................................................................11.4Access to trade finance .........................................................................................11.5Rules of origin requirements abroad ........................................................................7.4Technical requirements and standards abroad ....................................................... 7.1High cost or delays caused by international transportation ................................... 6.9Access to imported inputs at competitive prices ................................................... 6.7Corruption at foreign borders ................................................................................. 6.0Inappropriate production technology and skills .......................................................5.7High cost or delays caused by domestic transportation ........................................ 2.9Difficulties in meeting quality/quantity requirements of buyers ............................... 2.5
Most problematic factors for importing Score*
Tariffs .....................................................................................................................24.6Burdensome import procedures .......................................................................... 23.9Domestic technical requirements and standards ..................................................19.6High cost or delays caused by international transportation ..................................16.6High cost or delays caused by domestic transportation ........................................ 6.6Inappropriate telecommunications infrastructure ................................................... 5.5Crime and theft ....................................................................................................... 2.0Corruption at the border ..........................................................................................1.3
Canada
Sources: International Monetary Fund, World Bank, World Trade Organization, United Nations COMTRADE
Canada
Advanced economies
© 2014 World Economic Forum

Country/Economy Profiles
The Global Enabling Trade Report 2014 | 95
* Indicator derived from the World Economic Forum’s Executive Opinion Survey and measured on a 1-to-7 scale, where 7 indicates best outcome.
The Enabling Trade Index 2014 in detail n Competitive Advantage n Competitive Disadvantage
For methodology, indicator descriptions and sources, and for a list of multiple best-performing economies, see page 45. Canada
INDICATOR, UNITS RANK/138 VALUE BEST PERFORMER VALUE
Pillar 1: Domestic market access (1–7) ........................................................... 16 ...........................5.7 Multiple economies (2) ................................ 7.0 1.01 Tariff rate (%)............................................................................................. 38 .......... n ..........2.7 Multiple economies (2) .............................0.0 1.02 Complexity of tariffs index (1–7) ................................................................ 97 .......... n ..........4.7 Multiple economies (2) .............................7.0
Tariff dispersion (standard deviation) ....................................................... 127 .......... n ........20.3 Multiple economies (2) .............................0.0Tariff peaks (% of tariff lines) ..................................................................... 85 .......... n ..........7.7 Multiple economies (24) ...........................0.0Specific tariffs (% of tariff lines) ................................................................. 95 .......... n ..........3.9 Multiple economies (54) ...........................0.0Number of distinct tariffs ........................................................................... 94 .......... n .........329 Multiple economies (2) ................................1
1.03 Share of duty-free imports (%) .................................................................. 11 .......... n ........89.4 Multiple economies (2) .........................100.0
Pillar 2: Foreign market access (1–7) .............................................................. 76 ...........................2.4 Cambodia ..................................................... 5.3 2.01 Tariffs faced (%) ........................................................................................ 72 .......... n ..........5.5 Chile .........................................................3.5 2.02 Index of margin of preference in destination mkts (0–100) ........................ 69 .......... n ........25.2 Mauritius ................................................97.1
Pillar 3: Efficiency and transparency of border administration (1–7) .............. 20 ...........................5.7 Singapore..................................................... 6.3 3.01 Customs services index (0–1) ..................................................................... 9 .......... n ........0.90 Singapore...............................................0.97 3.02 Efficiency of the clearance process (1–5) .................................................. 20 .......... n ..........3.6 Norway ....................................................4.2 3.03 No. of days to import ............................................................................... 28 .......... n ...........10 Singapore....................................................4 3.04 No. of documents to import ....................................................................... 3 .......... n .............3 Multiple economies (2) ................................2 3.05 Cost to import (US$ per container) ........................................................... 95 .......... n ......1,680 Singapore................................................440 3.06 No. of days to export.................................................................................. 9 .......... n .............8 Multiple economies (5) ................................6 3.07 No. of documents to export ....................................................................... 3 .......... n .............3 Multiple economies (2) ................................2 3.08 Cost to export (US$ per container) ......................................................... 106 .......... n ......1,680 Malaysia ..................................................450 3.09 Irregular payments in exports and imports*............................................... 18 .......... n ..........5.5 New Zealand ............................................6.6 3.10 Time predictability of import procedures* .................................................. 48 .......... n ..........4.3 Finland .....................................................6.0 3.11 Customs transparency index (0–1) ............................................................. 1 .......... n ........1.00 Multiple economies (35) .........................1.00
Pillar 4: Availability and quality of transport infrastructure (1-7) ..................... 19 ...........................4.9 United Arab Emirates ................................... 6.5 4.01 Available int’l airline seat km/week, millions .............................................. 13 .......... n ...2,156.4 United States ..................................11,481.7 4.02 Quality of air transport infrastructure* ........................................................ 18 .......... n ..........5.9 Singapore.................................................6.8 4.03 Quality of railroad infrastructure* ............................................................... 15 .......... n ..........5.0 Japan .......................................................6.7 4.04 Liner Shipping Connectivity Index (0–157.1) ............................................. 34 .......... n ........38.4 China ...................................................157.5 4.05 Quality of port infrastructure* .................................................................... 19 .......... n ..........5.5 Netherlands ..............................................6.8 4.06 Paved roads (% of total) ........................................................................... 78 .......... n ........39.9 Multiple economies (18) .......................100.0 4.07 Quality of roads* ....................................................................................... 19 .......... n ..........5.6 United Arab Emirates ...............................6.6
Pillar 5: Availability and quality of transport services (1–7) ............................ 13 ...........................5.4 Singapore..................................................... 5.7 5.01 Ease and affordability of shipment (1–5).................................................... 23 .......... n ..........3.5 Luxembourg .............................................3.8 5.02 Logistics competence (1–5) ...................................................................... 10 .......... n ..........3.9 Norway ....................................................4.2 5.03 Tracking and tracing ability (1–5) ................................................................. 8 .......... n ..........4.0 Germany ..................................................4.2 5.04 Timeliness of shipments in reaching destination (1–5) ............................... 11 .......... n ..........4.2 Luxembourg .............................................4.7 5.05 Postal services efficiency* ......................................................................... 29 .......... n ..........5.8 Japan .......................................................6.8 5.06 Efficiency of transport mode change* ....................................................... 15 .......... n ..........5.5 Hong Kong SAR ......................................6.4
Pillar 6: Availability and use of ICTs (1–7) ........................................................ 28 ...........................5.3 Sweden ........................................................ 6.5 6.01 Mobile phone subscriptions/100 pop. .................................................... 109 .......... n ........80.1 Hong Kong SAR ..................................229.2 6.02 Individuals using Internet (%) .................................................................... 12 .......... n ........86.8 Iceland ...................................................96.2 6.03 Fixed broadband Internet subscriptions/100 pop. .................................... 11 .......... n ........32.5 Switzerland ............................................39.9 6.04 Active mobile broadband Internet subscriptions/100 pop. ........................ 39 .......... n ........41.0 Singapore.............................................124.5 6.05 ICT use for business-to-business transactions* ........................................ 31 .......... n ..........5.5 Finland .....................................................6.2 6.06 Internet use for business-to-consumer transactions* ................................ 21 .......... n ..........5.5 United Kingdom .......................................6.3 6.07 Government Online Service Index (0–1) ...................................................... 6 .......... n ........0.89 Multiple economies (3) ...........................1.00
Pillar 7: Operating environment (1–7) .............................................................. 15 ...........................5.2 Hong Kong SAR ............................................ 5.8 7.01 Protection of property index (1–7) ............................................................. 10 .......... n ..........5.8 Finland .....................................................6.3
Property rights* ........................................................................................... 6 .......... n ..........6.0 Finland .....................................................6.4Intellectual property protection* ................................................................ 12 .......... n ..........5.6 Finland .....................................................6.2
7.02 Efficiency and accountability of public institutions index (1–7) ................... 13 .......... n ..........5.2 Singapore.................................................6.0Judicial efficiency & impartiality in commercial disputes (0–4)...................... 8 .......... n ..........3.8 Multiple economies (7) .............................4.0Diversion of public funds* ......................................................................... 18 .......... n ..........5.3 New Zealand ............................................6.5Ease of compliance with government regulation* ...................................... 47 .......... n ..........3.7 Singapore.................................................5.4
7.03 Access to finance index (1–7) .................................................................. 18 .......... n ..........4.9 Hong Kong SAR ......................................5.7Affordability of financial services* ............................................................. 11 .......... n ..........5.6 Hong Kong SAR ......................................6.1Availability of financial services* .................................................................. 9 .......... n ..........6.1 Switzerland ..............................................6.4Ease of access to loans* .......................................................................... 24 .......... n ..........3.6 Qatar ........................................................4.9Availability of trade finance* ...................................................................... 28 .......... n ..........4.5 Hong Kong SAR ......................................5.8
7.04 Openness to foreign participation index (1–7) ........................................... 79 .......... n ..........4.2 Ireland ......................................................5.5Ease of hiring foreign labour* .................................................................... 85 .......... n ..........3.9 United Arab Emirates ...............................5.6Business impact of rules on FDI* .............................................................. 55 .......... n ..........4.7 Ireland ......................................................6.7Openness to multilateral trade rules (0–100) ............................................. 88 .......... n ........59.3 Slovenia .................................................92.2
7.05 Index of physical security (1–7) ................................................................. 28 .......... n ..........6.1 Qatar ........................................................6.8Reliability of police services* ..................................................................... 14 .......... n ..........6.0 Finland .....................................................6.7Business costs of crime and violence* ...................................................... 39 .......... n ..........5.3 Qatar ........................................................6.8Business costs of terrorism* ..................................................................... 79 .......... n ..........5.2 Slovenia ...................................................6.7Homicide cases/100,000 pop. ................................................................. 42 .......... n ..........1.5 Hong Kong SAR ......................................0.2Index of terrorism incidence (1-7) ............................................................. 78 .......... n ..........7.0 Multiple economies (48) ...........................7.0
© 2014 World Economic Forum
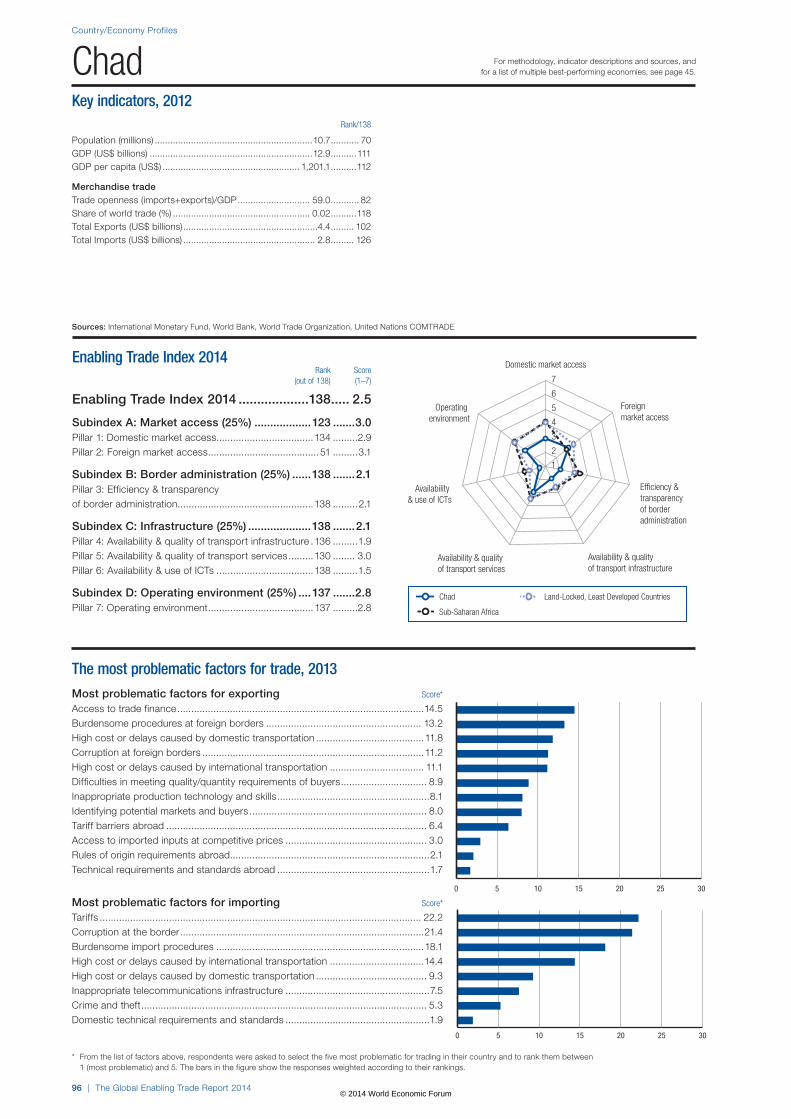
Country/Economy Profiles
96 | The Global Enabling Trade Report 2014
* From the list of factors above, respondents were asked to select the five most problematic for trading in their country and to rank them between 1 (most problematic) and 5. The bars in the figure show the responses weighted according to their rankings.
For methodology, indicator descriptions and sources, and for a list of multiple best-performing economies, see page 45.
0 105 15 20 25 30
0 5 10 15 20 25 30
2
3
4
5
6
7
Operating environment
Availability & use of ICTs
Availability & quality of transport services
Availability & quality of transport infrastructure
Efficiency & transparency of border administration
Foreign market access
Domestic market access
1
Enabling Trade Index 2014 Rank Score (out of 138) (1–7)
Enabling Trade Index 2014 ...................138 ..... 2.5
Subindex A: Market access (25%) ..................123 .......3.0Pillar 1: Domestic market access ...................................134 .........2.9Pillar 2: Foreign market access ........................................51 .........3.1
Subindex B: Border administration (25%) ......138 .......2.1Pillar 3: Efficiency & transparency of border administration .................................................138 .........2.1
Subindex C: Infrastructure (25%) ....................138 .......2.1Pillar 4: Availability & quality of transport infrastructure .136 .........1.9Pillar 5: Availability & quality of transport services .........130 ........ 3.0Pillar 6: Availability & use of ICTs ...................................138 .........1.5
Subindex D: Operating environment (25%) ....137 .......2.8Pillar 7: Operating environment ...................................... 137 .........2.8
Key indicators, 2012 Rank/138
Population (millions) .............................................................10.7 ........... 70GDP (US$ billions) ...............................................................12.9 ..........111GDP per capita (US$) ..................................................... 1,201.1 ..........112
Merchandise tradeTrade openness (imports+exports)/GDP ............................ 59.0 ........... 82Share of world trade (%) ..................................................... 0.02 ..........118Total Exports (US$ billions) ....................................................4.4 ......... 102Total Imports (US$ billions) ................................................... 2.8 ......... 126
The most problematic factors for trade, 2013Most problematic factors for exporting Score*
Access to trade finance .........................................................................................14.5Burdensome procedures at foreign borders ........................................................ 13.2High cost or delays caused by domestic transportation .......................................11.8Corruption at foreign borders ................................................................................11.2High cost or delays caused by international transportation .................................. 11.1Difficulties in meeting quality/quantity requirements of buyers ............................... 8.9Inappropriate production technology and skills .......................................................8.1Identifying potential markets and buyers ................................................................ 8.0Tariff barriers abroad .............................................................................................. 6.4Access to imported inputs at competitive prices ................................................... 3.0Rules of origin requirements abroad ........................................................................2.1Technical requirements and standards abroad .......................................................1.7
Most problematic factors for importing Score*
Tariffs .................................................................................................................... 22.2Corruption at the border ........................................................................................21.4Burdensome import procedures ...........................................................................18.1High cost or delays caused by international transportation ..................................14.4High cost or delays caused by domestic transportation ........................................ 9.3Inappropriate telecommunications infrastructure ....................................................7.5Crime and theft ....................................................................................................... 5.3Domestic technical requirements and standards ....................................................1.9
Chad
Sources: International Monetary Fund, World Bank, World Trade Organization, United Nations COMTRADE
Chad Land-Locked, Least Developed Countries
Sub-Saharan Africa
© 2014 World Economic Forum
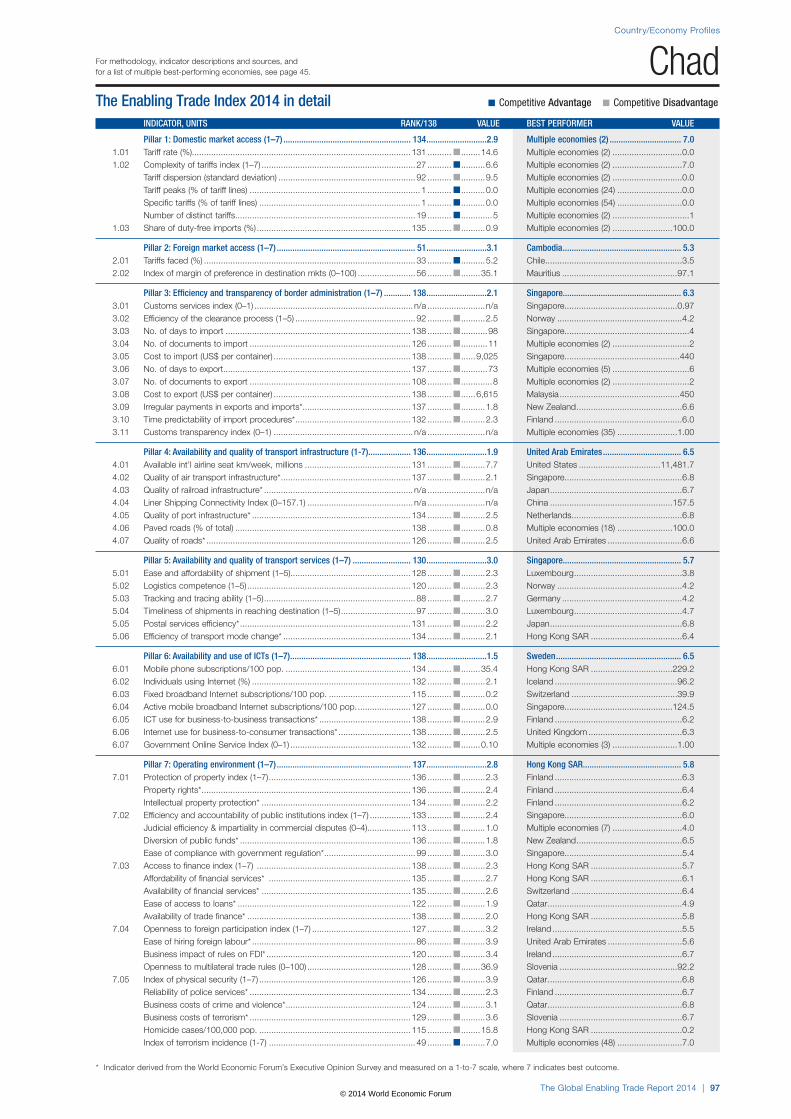
Country/Economy Profiles
The Global Enabling Trade Report 2014 | 97
* Indicator derived from the World Economic Forum’s Executive Opinion Survey and measured on a 1-to-7 scale, where 7 indicates best outcome.
The Enabling Trade Index 2014 in detail n Competitive Advantage n Competitive Disadvantage
For methodology, indicator descriptions and sources, and for a list of multiple best-performing economies, see page 45. Chad
INDICATOR, UNITS RANK/138 VALUE BEST PERFORMER VALUE
Pillar 1: Domestic market access (1–7) ......................................................... 134 ...........................2.9 Multiple economies (2) ................................ 7.0 1.01 Tariff rate (%)........................................................................................... 131 .......... n ........14.6 Multiple economies (2) .............................0.0 1.02 Complexity of tariffs index (1–7) ................................................................ 27 .......... n ..........6.6 Multiple economies (2) .............................7.0
Tariff dispersion (standard deviation) ......................................................... 92 .......... n ..........9.5 Multiple economies (2) .............................0.0Tariff peaks (% of tariff lines) ....................................................................... 1 .......... n ..........0.0 Multiple economies (24) ...........................0.0Specific tariffs (% of tariff lines) ................................................................... 1 .......... n ..........0.0 Multiple economies (54) ...........................0.0Number of distinct tariffs ........................................................................... 19 .......... n .............5 Multiple economies (2) ................................1
1.03 Share of duty-free imports (%) ................................................................ 135 .......... n ..........0.9 Multiple economies (2) .........................100.0
Pillar 2: Foreign market access (1–7) .............................................................. 51 ...........................3.1 Cambodia ..................................................... 5.3 2.01 Tariffs faced (%) ........................................................................................ 33 .......... n ..........5.2 Chile .........................................................3.5 2.02 Index of margin of preference in destination mkts (0–100) ........................ 56 .......... n ........35.1 Mauritius ................................................97.1
Pillar 3: Efficiency and transparency of border administration (1–7) ............ 138 ...........................2.1 Singapore..................................................... 6.3 3.01 Customs services index (0–1) .................................................................. n/a ........................n/a Singapore...............................................0.97 3.02 Efficiency of the clearance process (1–5) .................................................. 92 .......... n ..........2.5 Norway ....................................................4.2 3.03 No. of days to import ............................................................................. 138 .......... n ...........98 Singapore....................................................4 3.04 No. of documents to import ................................................................... 126 .......... n ...........11 Multiple economies (2) ................................2 3.05 Cost to import (US$ per container) ......................................................... 138 .......... n ......9,025 Singapore................................................440 3.06 No. of days to export.............................................................................. 137 .......... n ...........73 Multiple economies (5) ................................6 3.07 No. of documents to export ................................................................... 108 .......... n .............8 Multiple economies (2) ................................2 3.08 Cost to export (US$ per container) ......................................................... 138 .......... n ......6,615 Malaysia ..................................................450 3.09 Irregular payments in exports and imports*............................................. 137 .......... n ..........1.8 New Zealand ............................................6.6 3.10 Time predictability of import procedures* ................................................ 132 .......... n ..........2.3 Finland .....................................................6.0 3.11 Customs transparency index (0–1) .......................................................... n/a ........................n/a Multiple economies (35) .........................1.00
Pillar 4: Availability and quality of transport infrastructure (1-7) ................... 136 ...........................1.9 United Arab Emirates ................................... 6.5 4.01 Available int’l airline seat km/week, millions ............................................ 131 .......... n ..........7.7 United States ..................................11,481.7 4.02 Quality of air transport infrastructure* ...................................................... 137 .......... n ..........2.1 Singapore.................................................6.8 4.03 Quality of railroad infrastructure* .............................................................. n/a ........................n/a Japan .......................................................6.7 4.04 Liner Shipping Connectivity Index (0–157.1) ............................................ n/a ........................n/a China ...................................................157.5 4.05 Quality of port infrastructure* .................................................................. 134 .......... n ..........2.5 Netherlands ..............................................6.8 4.06 Paved roads (% of total) ......................................................................... 138 .......... n ..........0.8 Multiple economies (18) .......................100.0 4.07 Quality of roads* ..................................................................................... 126 .......... n ..........2.5 United Arab Emirates ...............................6.6
Pillar 5: Availability and quality of transport services (1–7) .......................... 130 ...........................3.0 Singapore..................................................... 5.7 5.01 Ease and affordability of shipment (1–5).................................................. 128 .......... n ..........2.3 Luxembourg .............................................3.8 5.02 Logistics competence (1–5) .................................................................... 120 .......... n ..........2.3 Norway ....................................................4.2 5.03 Tracking and tracing ability (1–5) ............................................................... 88 .......... n ..........2.7 Germany ..................................................4.2 5.04 Timeliness of shipments in reaching destination (1–5) ............................... 97 .......... n ..........3.0 Luxembourg .............................................4.7 5.05 Postal services efficiency* ....................................................................... 131 .......... n ..........2.2 Japan .......................................................6.8 5.06 Efficiency of transport mode change* ..................................................... 134 .......... n ..........2.1 Hong Kong SAR ......................................6.4
Pillar 6: Availability and use of ICTs (1–7) ...................................................... 138 ...........................1.5 Sweden ........................................................ 6.5 6.01 Mobile phone subscriptions/100 pop. .................................................... 134 .......... n ........35.4 Hong Kong SAR ..................................229.2 6.02 Individuals using Internet (%) .................................................................. 132 .......... n ..........2.1 Iceland ...................................................96.2 6.03 Fixed broadband Internet subscriptions/100 pop. .................................. 115 .......... n ..........0.2 Switzerland ............................................39.9 6.04 Active mobile broadband Internet subscriptions/100 pop. ...................... 127 .......... n ..........0.0 Singapore.............................................124.5 6.05 ICT use for business-to-business transactions* ...................................... 138 .......... n ..........2.9 Finland .....................................................6.2 6.06 Internet use for business-to-consumer transactions* .............................. 138 .......... n ..........2.5 United Kingdom .......................................6.3 6.07 Government Online Service Index (0–1) .................................................. 132 .......... n ........0.10 Multiple economies (3) ...........................1.00
Pillar 7: Operating environment (1–7) ............................................................ 137 ...........................2.8 Hong Kong SAR ............................................ 5.8 7.01 Protection of property index (1–7) ........................................................... 136 .......... n ..........2.3 Finland .....................................................6.3
Property rights* ....................................................................................... 136 .......... n ..........2.4 Finland .....................................................6.4Intellectual property protection* .............................................................. 134 .......... n ..........2.2 Finland .....................................................6.2
7.02 Efficiency and accountability of public institutions index (1–7) ................. 133 .......... n ..........2.4 Singapore.................................................6.0Judicial efficiency & impartiality in commercial disputes (0–4).................. 113 .......... n ..........1.0 Multiple economies (7) .............................4.0Diversion of public funds* ....................................................................... 136 .......... n ..........1.8 New Zealand ............................................6.5Ease of compliance with government regulation* ...................................... 99 .......... n ..........3.0 Singapore.................................................5.4
7.03 Access to finance index (1–7) ................................................................ 138 .......... n ..........2.3 Hong Kong SAR ......................................5.7Affordability of financial services* ........................................................... 135 .......... n ..........2.7 Hong Kong SAR ......................................6.1Availability of financial services* .............................................................. 135 .......... n ..........2.6 Switzerland ..............................................6.4Ease of access to loans* ........................................................................ 122 .......... n ..........1.9 Qatar ........................................................4.9Availability of trade finance* .................................................................... 138 .......... n ..........2.0 Hong Kong SAR ......................................5.8
7.04 Openness to foreign participation index (1–7) ......................................... 127 .......... n ..........3.2 Ireland ......................................................5.5Ease of hiring foreign labour* .................................................................... 86 .......... n ..........3.9 United Arab Emirates ...............................5.6Business impact of rules on FDI* ............................................................ 120 .......... n ..........3.4 Ireland ......................................................6.7Openness to multilateral trade rules (0–100) ........................................... 128 .......... n ........36.9 Slovenia .................................................92.2
7.05 Index of physical security (1–7) ............................................................... 126 .......... n ..........3.9 Qatar ........................................................6.8Reliability of police services* ................................................................... 134 .......... n ..........2.3 Finland .....................................................6.7Business costs of crime and violence* .................................................... 124 .......... n ..........3.1 Qatar ........................................................6.8Business costs of terrorism* ................................................................... 129 .......... n ..........3.6 Slovenia ...................................................6.7Homicide cases/100,000 pop. ............................................................... 115 .......... n ........15.8 Hong Kong SAR ......................................0.2Index of terrorism incidence (1-7) ............................................................. 49 .......... n ..........7.0 Multiple economies (48) ...........................7.0
© 2014 World Economic Forum
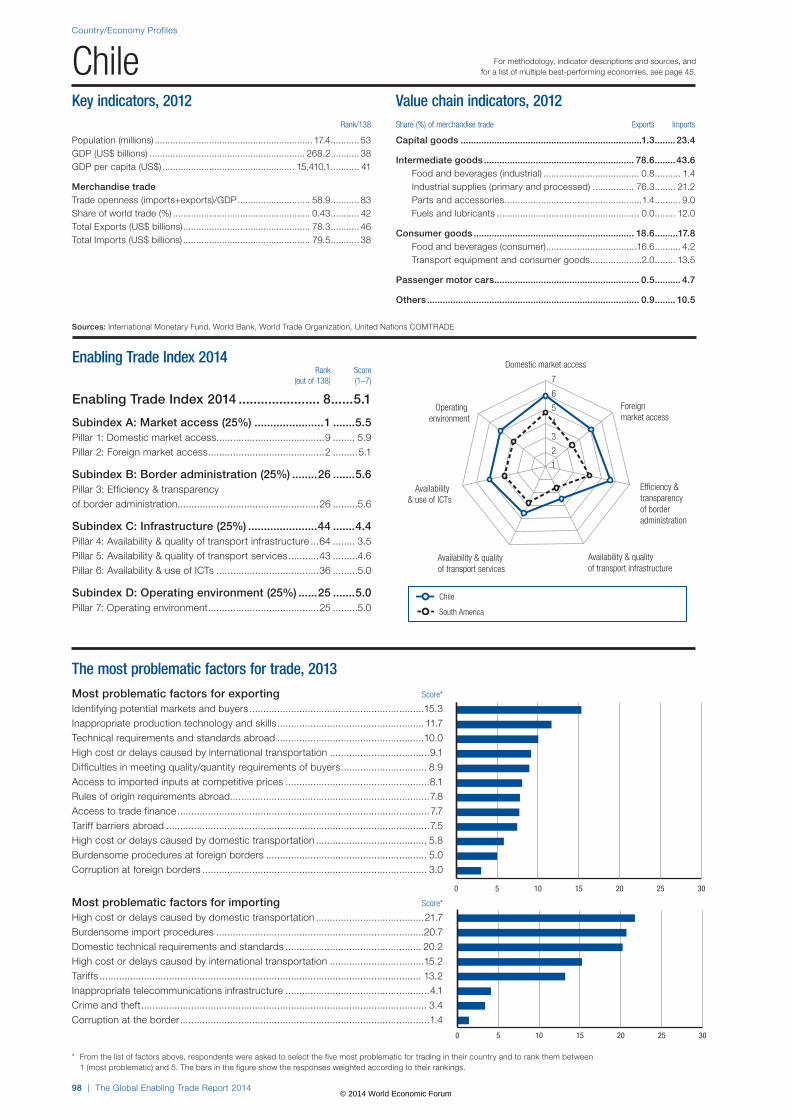
Country/Economy Profiles
98 | The Global Enabling Trade Report 2014
* From the list of factors above, respondents were asked to select the five most problematic for trading in their country and to rank them between 1 (most problematic) and 5. The bars in the figure show the responses weighted according to their rankings.
For methodology, indicator descriptions and sources, and for a list of multiple best-performing economies, see page 45.
0 105 15 20 25 30
0 5 10 15 20 25 30
2
3
4
5
6
7
Operating environment
Availability & use of ICTs
Availability & quality of transport services
Availability & quality of transport infrastructure
Efficiency & transparency of border administration
Foreign market access
Domestic market access
1
Enabling Trade Index 2014 Rank Score (out of 138) (1–7)
Enabling Trade Index 2014 ...................... 8 ......5.1
Subindex A: Market access (25%) ......................1 .......5.5Pillar 1: Domestic market access .......................................9 ........ 5.9Pillar 2: Foreign market access ..........................................2 .........5.1
Subindex B: Border administration (25%) ........26 .......5.6Pillar 3: Efficiency & transparency of border administration ...................................................26 .........5.6
Subindex C: Infrastructure (25%) ......................44 .......4.4Pillar 4: Availability & quality of transport infrastructure ...64 ........ 3.5Pillar 5: Availability & quality of transport services ...........43 .........4.6Pillar 6: Availability & use of ICTs .....................................36 .........5.0
Subindex D: Operating environment (25%) ......25 .......5.0Pillar 7: Operating environment ........................................25 .........5.0
Key indicators, 2012 Rank/138
Population (millions) ............................................................. 17.4 ........... 53GDP (US$ billions) ............................................................ 268.2 ........... 38GDP per capita (US$) ................................................... 15,410.1 ........... 41
Merchandise tradeTrade openness (imports+exports)/GDP ............................ 58.9 ........... 83Share of world trade (%) ..................................................... 0.43 ........... 42Total Exports (US$ billions) ................................................. 78.3 ........... 46Total Imports (US$ billions) ................................................. 79.5 ........... 38
Value chain indicators, 2012Share (%) of merchandise trade Exports Imports
Capital goods ......................................................................1.3 ........23.4
Intermediate goods .......................................................... 78.6 ........43.6Food and beverages (industrial) ..................................... 0.8 .......... 1.4Industrial supplies (primary and processed) ................ 76.3 ........ 21.2Parts and accessories .....................................................1.4 .......... 9.0Fuels and lubricants ....................................................... 0.0 ........ 12.0
Consumer goods .............................................................. 18.6 .........17.8Food and beverages (consumer) ...................................16.6 .......... 4.2Transport equipment and consumer goods ....................2.0 ........ 13.5
Passenger motor cars ........................................................ 0.5 .......... 4.7
Others .................................................................................. 0.9 ........ 10.5
The most problematic factors for trade, 2013Most problematic factors for exporting Score*
Identifying potential markets and buyers ...............................................................15.3Inappropriate production technology and skills ..................................................... 11.7Technical requirements and standards abroad .....................................................10.0High cost or delays caused by international transportation ....................................9.1Difficulties in meeting quality/quantity requirements of buyers ............................... 8.9Access to imported inputs at competitive prices ....................................................8.1Rules of origin requirements abroad ........................................................................7.8Access to trade finance ...........................................................................................7.7Tariff barriers abroad ...............................................................................................7.5High cost or delays caused by domestic transportation ........................................ 5.8Burdensome procedures at foreign borders .......................................................... 5.0Corruption at foreign borders ................................................................................. 3.0
Most problematic factors for importing Score*
High cost or delays caused by domestic transportation .......................................21.7Burdensome import procedures ...........................................................................20.7Domestic technical requirements and standards ................................................. 20.2High cost or delays caused by international transportation ..................................15.2Tariffs .................................................................................................................... 13.2Inappropriate telecommunications infrastructure ....................................................4.1Crime and theft ....................................................................................................... 3.4Corruption at the border ..........................................................................................1.4
Chile
Sources: International Monetary Fund, World Bank, World Trade Organization, United Nations COMTRADE
Chile
South America
© 2014 World Economic Forum

Country/Economy Profiles
The Global Enabling Trade Report 2014 | 99
* Indicator derived from the World Economic Forum’s Executive Opinion Survey and measured on a 1-to-7 scale, where 7 indicates best outcome.
The Enabling Trade Index 2014 in detail n Competitive Advantage n Competitive Disadvantage
For methodology, indicator descriptions and sources, and for a list of multiple best-performing economies, see page 45. Chile
INDICATOR, UNITS RANK/138 VALUE BEST PERFORMER VALUE
Pillar 1: Domestic market access (1–7) ............................................................. 9 ...........................5.9 Multiple economies (2) ................................ 7.0 1.01 Tariff rate (%)............................................................................................. 64 .......... n ..........4.6 Multiple economies (2) .............................0.0 1.02 Complexity of tariffs index (1–7) .................................................................. 3 .......... n ..........7.0 Multiple economies (2) .............................7.0
Tariff dispersion (standard deviation) ........................................................... 3 .......... n ..........0.3 Multiple economies (2) .............................0.0Tariff peaks (% of tariff lines) ....................................................................... 1 .......... n ..........0.0 Multiple economies (24) ...........................0.0Specific tariffs (% of tariff lines) ................................................................... 1 .......... n ..........0.0 Multiple economies (54) ...........................0.0Number of distinct tariffs ............................................................................. 3 .......... n .............2 Multiple economies (2) ................................1
1.03 Share of duty-free imports (%) .................................................................. 25 .......... n ........77.8 Multiple economies (2) .........................100.0
Pillar 2: Foreign market access (1–7) ................................................................ 2 ...........................5.1 Cambodia ..................................................... 5.3 2.01 Tariffs faced (%) .......................................................................................... 1 .......... n ..........3.5 Chile .........................................................3.5 2.02 Index of margin of preference in destination mkts (0–100) ........................ 54 .......... n ........35.9 Mauritius ................................................97.1
Pillar 3: Efficiency and transparency of border administration (1–7) .............. 26 ...........................5.6 Singapore..................................................... 6.3 3.01 Customs services index (0–1) ................................................................... 13 .......... n ........0.82 Singapore...............................................0.97 3.02 Efficiency of the clearance process (1–5) .................................................. 39 .......... n ..........3.2 Norway ....................................................4.2 3.03 No. of days to import ............................................................................... 41 .......... n ...........12 Singapore....................................................4 3.04 No. of documents to import ..................................................................... 27 .......... n .............5 Multiple economies (2) ................................2 3.05 Cost to import (US$ per container) ........................................................... 33 .......... n .........930 Singapore................................................440 3.06 No. of days to export................................................................................ 59 .......... n ...........15 Multiple economies (5) ................................6 3.07 No. of documents to export ..................................................................... 40 .......... n .............5 Multiple economies (2) ................................2 3.08 Cost to export (US$ per container) ........................................................... 46 .......... n .........980 Malaysia ..................................................450 3.09 Irregular payments in exports and imports*............................................... 16 .......... n ..........5.7 New Zealand ............................................6.6 3.10 Time predictability of import procedures* .................................................. 24 .......... n ..........5.0 Finland .....................................................6.0 3.11 Customs transparency index (0–1) ............................................................. 1 .......... n ........1.00 Multiple economies (35) .........................1.00
Pillar 4: Availability and quality of transport infrastructure (1-7) ..................... 64 ...........................3.5 United Arab Emirates ................................... 6.5 4.01 Available int’l airline seat km/week, millions .............................................. 47 .......... n ......355.0 United States ..................................11,481.7 4.02 Quality of air transport infrastructure* ........................................................ 44 .......... n ..........5.2 Singapore.................................................6.8 4.03 Quality of railroad infrastructure* ............................................................... 61 .......... n ..........2.7 Japan .......................................................6.7 4.04 Liner Shipping Connectivity Index (0–157.1) ............................................. 41 .......... n ........33.0 China ...................................................157.5 4.05 Quality of port infrastructure* .................................................................... 30 .......... n ..........5.2 Netherlands ..............................................6.8 4.06 Paved roads (% of total) ........................................................................... 94 .......... n ........23.3 Multiple economies (18) .......................100.0 4.07 Quality of roads* ....................................................................................... 27 .......... n ..........5.4 United Arab Emirates ...............................6.6
Pillar 5: Availability and quality of transport services (1–7) ............................ 43 ...........................4.6 Singapore..................................................... 5.7 5.01 Ease and affordability of shipment (1–5).................................................... 53 .......... n ..........3.1 Luxembourg .............................................3.8 5.02 Logistics competence (1–5) ...................................................................... 44 .......... n ..........3.2 Norway ....................................................4.2 5.03 Tracking and tracing ability (1–5) ............................................................... 40 .......... n ..........3.3 Germany ..................................................4.2 5.04 Timeliness of shipments in reaching destination (1–5) ............................... 44 .......... n ..........3.6 Luxembourg .............................................4.7 5.05 Postal services efficiency* ......................................................................... 40 .......... n ..........5.3 Japan .......................................................6.8 5.06 Efficiency of transport mode change* ....................................................... 42 .......... n ..........4.5 Hong Kong SAR ......................................6.4
Pillar 6: Availability and use of ICTs (1–7) ........................................................ 36 ...........................5.0 Sweden ........................................................ 6.5 6.01 Mobile phone subscriptions/100 pop. ...................................................... 27 .......... n ......138.2 Hong Kong SAR ..................................229.2 6.02 Individuals using Internet (%) .................................................................... 44 .......... n ........61.4 Iceland ...................................................96.2 6.03 Fixed broadband Internet subscriptions/100 pop. .................................... 49 .......... n ........12.4 Switzerland ............................................39.9 6.04 Active mobile broadband Internet subscriptions/100 pop. ........................ 57 .......... n ........27.9 Singapore.............................................124.5 6.05 ICT use for business-to-business transactions* ........................................ 35 .......... n ..........5.5 Finland .....................................................6.2 6.06 Internet use for business-to-consumer transactions* ................................ 35 .......... n ..........5.1 United Kingdom .......................................6.3 6.07 Government Online Service Index (0–1) .................................................... 24 .......... n ........0.75 Multiple economies (3) ...........................1.00
Pillar 7: Operating environment (1–7) .............................................................. 25 ...........................5.0 Hong Kong SAR ............................................ 5.8 7.01 Protection of property index (1–7) ............................................................. 42 .......... n ..........4.5 Finland .....................................................6.3
Property rights* ......................................................................................... 34 .......... n ..........5.1 Finland .....................................................6.4Intellectual property protection* ................................................................ 55 .......... n ..........3.8 Finland .....................................................6.2
7.02 Efficiency and accountability of public institutions index (1–7) ................... 18 .......... n ..........5.0 Singapore.................................................6.0Judicial efficiency & impartiality in commercial disputes (0–4).................... 20 .......... n ..........3.3 Multiple economies (7) .............................4.0Diversion of public funds* ......................................................................... 22 .......... n ..........5.1 New Zealand ............................................6.5Ease of compliance with government regulation* ...................................... 23 .......... n ..........4.1 Singapore.................................................5.4
7.03 Access to finance index (1–7) .................................................................. 23 .......... n ..........4.8 Hong Kong SAR ......................................5.7Affordability of financial services* ............................................................. 29 .......... n ..........5.0 Hong Kong SAR ......................................6.1Availability of financial services* ................................................................ 20 .......... n ..........5.6 Switzerland ..............................................6.4Ease of access to loans* .......................................................................... 20 .......... n ..........3.6 Qatar ........................................................4.9Availability of trade finance* ...................................................................... 23 .......... n ..........4.8 Hong Kong SAR ......................................5.8
7.04 Openness to foreign participation index (1–7) ........................................... 27 .......... n ..........4.8 Ireland ......................................................5.5Ease of hiring foreign labour* .................................................................... 39 .......... n ..........4.4 United Arab Emirates ...............................5.6Business impact of rules on FDI* .............................................................. 10 .......... n ..........5.5 Ireland ......................................................6.7Openness to multilateral trade rules (0–100) ............................................. 55 .......... n ........68.2 Slovenia .................................................92.2
7.05 Index of physical security (1–7) ................................................................. 30 .......... n ..........6.1 Qatar ........................................................6.8Reliability of police services* ....................................................................... 7 .......... n ..........6.2 Finland .....................................................6.7Business costs of crime and violence* ...................................................... 65 .......... n ..........4.7 Qatar ........................................................6.8Business costs of terrorism* ..................................................................... 62 .......... n ..........5.6 Slovenia ...................................................6.7Homicide cases/100,000 pop. ................................................................. 75 .......... n ..........3.7 Hong Kong SAR ......................................0.2Index of terrorism incidence (1-7) ............................................................. 96 .......... n ..........6.9 Multiple economies (48) ...........................7.0
© 2014 World Economic Forum

Country/Economy Profiles
100 | The Global Enabling Trade Report 2014
* From the list of factors above, respondents were asked to select the five most problematic for trading in their country and to rank them between 1 (most problematic) and 5. The bars in the figure show the responses weighted according to their rankings.
For methodology, indicator descriptions and sources, and for a list of multiple best-performing economies, see page 45.
0 105 15 20 25 30
0 5 10 15 20 25 30
2
3
4
5
6
7
Operating environment
Availability & use of ICTs
Availability & quality of transport services
Availability & quality of transport infrastructure
Efficiency & transparency of border administration
Foreign market access
Domestic market access
1
Enabling Trade Index 2014 Rank Score (out of 138) (1–7)
Enabling Trade Index 2014 .................... 54 ..... 4.3
Subindex A: Market access (25%) .................. 119 .......3.1Pillar 1: Domestic market access .....................................98 ........ 4.2Pillar 2: Foreign market access ...................................... 125 .........1.9
Subindex B: Border administration (25%) ........48 .......4.9Pillar 3: Efficiency & transparency of border administration ...................................................48 .........4.9
Subindex C: Infrastructure (25%) ......................36 .......4.6Pillar 4: Availability & quality of transport infrastructure ...16 .........5.1Pillar 5: Availability & quality of transport services ...........31 ........ 4.8Pillar 6: Availability & use of ICTs .....................................82 .........3.7
Subindex D: Operating environment (25%) ......37 .......4.6Pillar 7: Operating environment ........................................37 .........4.6
Key indicators, 2012 Rank/138
Population (millions) ........................................................1,354.0 ............. 1GDP (US$ billions) ..........................................................8,221.0 ............. 2GDP per capita (US$) .....................................................6,071.5 ........... 71
Merchandise tradeTrade openness (imports+exports)/GDP .............................47.0 ......... 108Share of world trade (%) ....................................................10.45 ............. 2Total Exports (US$ billions) .............................................2,048.7 ............. 1Total Imports (US$ billions) .............................................1,818.4 ............. 2
Value chain indicators, 2012Share (%) of merchandise trade Exports Imports
Capital goods ................................................................... 29.9 ........ 13.9
Intermediate goods .......................................................... 39.9 ........ 77.0Food and beverages (industrial) ..................................... 0.2 .......... 3.5Industrial supplies (primary and processed) ................ 22.2 ........ 35.4Parts and accessories ................................................... 17.1 ........ 21.2Fuels and lubricants ....................................................... 0.4 ........ 16.9
Consumer goods .............................................................. 28.8 ..........4.2Food and beverages (consumer) .................................... 2.3 .......... 1.6Transport equipment and consumer goods ................. 26.5 .......... 2.6
Passenger motor cars ........................................................ 0.2 ..........2.8
Others ...................................................................................1.1 .......... 2.1
The most problematic factors for trade, 2013Most problematic factors for exporting Score*
Identifying potential markets and buyers ...............................................................14.0Technical requirements and standards abroad .....................................................11.6Access to imported inputs at competitive prices .................................................. 11.1Access to trade finance .........................................................................................10.1Tariff barriers abroad .............................................................................................. 9.5Inappropriate production technology and skills ...................................................... 8.8High cost or delays caused by international transportation ....................................7.8Burdensome procedures at foreign borders ...........................................................7.5Difficulties in meeting quality/quantity requirements of buyers ............................... 6.8High cost or delays caused by domestic transportation .........................................5.1Rules of origin requirements abroad ....................................................................... 5.0Corruption at foreign borders ................................................................................. 2.8
Most problematic factors for importing Score*
Tariffs .....................................................................................................................21.7Burdensome import procedures .......................................................................... 18.3High cost or delays caused by international transportation ..................................13.9High cost or delays caused by domestic transportation .......................................13.8Domestic technical requirements and standards ..................................................11.3Corruption at the border ......................................................................................... 9.6Inappropriate telecommunications infrastructure ....................................................7.2Crime and theft ....................................................................................................... 4.3
China
Sources: International Monetary Fund, World Bank, World Trade Organization, United Nations COMTRADE
China
Developing Asia
© 2014 World Economic Forum

Country/Economy Profiles
The Global Enabling Trade Report 2014 | 101
* Indicator derived from the World Economic Forum’s Executive Opinion Survey and measured on a 1-to-7 scale, where 7 indicates best outcome.
The Enabling Trade Index 2014 in detail n Competitive Advantage n Competitive Disadvantage
For methodology, indicator descriptions and sources, and for a list of multiple best-performing economies, see page 45. China
INDICATOR, UNITS RANK/138 VALUE BEST PERFORMER VALUE
Pillar 1: Domestic market access (1–7) ........................................................... 98 ...........................4.2 Multiple economies (2) ................................ 7.0 1.01 Tariff rate (%)........................................................................................... 114 .......... n ........11.1 Multiple economies (2) .............................0.0 1.02 Complexity of tariffs index (1–7) ................................................................ 57 .......... n ..........6.3 Multiple economies (2) .............................7.0
Tariff dispersion (standard deviation) ......................................................... 45 .......... n ..........7.7 Multiple economies (2) .............................0.0Tariff peaks (% of tariff lines) ..................................................................... 60 .......... n ..........2.3 Multiple economies (24) ...........................0.0Specific tariffs (% of tariff lines) ................................................................. 75 .......... n ..........0.7 Multiple economies (54) ...........................0.0Number of distinct tariffs ........................................................................... 78 .......... n .........106 Multiple economies (2) ................................1
1.03 Share of duty-free imports (%) .................................................................. 89 .......... n ........48.1 Multiple economies (2) .........................100.0
Pillar 2: Foreign market access (1–7) ............................................................ 125 ...........................1.9 Cambodia ..................................................... 5.3 2.01 Tariffs faced (%) ........................................................................................ 58 .......... n ..........5.4 Chile .........................................................3.5 2.02 Index of margin of preference in destination mkts (0–100) ...................... 132 .......... n ..........3.5 Mauritius ................................................97.1
Pillar 3: Efficiency and transparency of border administration (1–7) .............. 48 ...........................4.9 Singapore..................................................... 6.3 3.01 Customs services index (0–1) ................................................................... 53 .......... n ........0.64 Singapore...............................................0.97 3.02 Efficiency of the clearance process (1–5) .................................................. 38 .......... n ..........3.2 Norway ....................................................4.2 3.03 No. of days to import ............................................................................... 91 .......... n ...........24 Singapore....................................................4 3.04 No. of documents to import ..................................................................... 27 .......... n .............5 Multiple economies (2) ................................2 3.05 Cost to import (US$ per container) ............................................................. 6 .......... n .........615 Singapore................................................440 3.06 No. of days to export................................................................................ 90 .......... n ...........21 Multiple economies (5) ................................6 3.07 No. of documents to export ................................................................... 108 .......... n .............8 Multiple economies (2) ................................2 3.08 Cost to export (US$ per container) ........................................................... 12 .......... n .........620 Malaysia ..................................................450 3.09 Irregular payments in exports and imports*............................................... 55 .......... n ..........3.9 New Zealand ............................................6.6 3.10 Time predictability of import procedures* .................................................. 41 .......... n ..........4.5 Finland .....................................................6.0 3.11 Customs transparency index (0–1) ........................................................... 39 .......... n ........0.90 Multiple economies (35) .........................1.00
Pillar 4: Availability and quality of transport infrastructure (1-7) ..................... 16 ...........................5.1 United Arab Emirates ................................... 6.5 4.01 Available int’l airline seat km/week, millions ................................................ 6 .......... n ...3,452.7 United States ..................................11,481.7 4.02 Quality of air transport infrastructure* ........................................................ 60 .......... n ..........4.5 Singapore.................................................6.8 4.03 Quality of railroad infrastructure* ............................................................... 19 .......... n ..........4.7 Japan .......................................................6.7 4.04 Liner Shipping Connectivity Index (0–157.1) ............................................... 1 .......... n ......157.5 China ...................................................157.5 4.05 Quality of port infrastructure* .................................................................... 54 .......... n ..........4.5 Netherlands ..............................................6.8 4.06 Paved roads (% of total) ........................................................................... 65 .......... n ........53.5 Multiple economies (18) .......................100.0 4.07 Quality of roads* ....................................................................................... 50 .......... n ..........4.5 United Arab Emirates ...............................6.6
Pillar 5: Availability and quality of transport services (1–7) ............................ 31 ...........................4.8 Singapore..................................................... 5.7 5.01 Ease and affordability of shipment (1–5).................................................... 22 .......... n ..........3.5 Luxembourg .............................................3.8 5.02 Logistics competence (1–5) ...................................................................... 35 .......... n ..........3.5 Norway ....................................................4.2 5.03 Tracking and tracing ability (1–5) ............................................................... 29 .......... n ..........3.5 Germany ..................................................4.2 5.04 Timeliness of shipments in reaching destination (1–5) ............................... 36 .......... n ..........3.9 Luxembourg .............................................4.7 5.05 Postal services efficiency* ......................................................................... 57 .......... n ..........4.8 Japan .......................................................6.8 5.06 Efficiency of transport mode change* ....................................................... 40 .......... n ..........4.6 Hong Kong SAR ......................................6.4
Pillar 6: Availability and use of ICTs (1–7) ........................................................ 82 ...........................3.7 Sweden ........................................................ 6.5 6.01 Mobile phone subscriptions/100 pop. .................................................... 108 .......... n ........80.8 Hong Kong SAR ..................................229.2 6.02 Individuals using Internet (%) .................................................................... 73 .......... n ........42.3 Iceland ...................................................96.2 6.03 Fixed broadband Internet subscriptions/100 pop. .................................... 48 .......... n ........12.7 Switzerland ............................................39.9 6.04 Active mobile broadband Internet subscriptions/100 pop. ........................ 72 .......... n ........16.9 Singapore.............................................124.5 6.05 ICT use for business-to-business transactions* ........................................ 64 .......... n ..........4.9 Finland .....................................................6.2 6.06 Internet use for business-to-consumer transactions* ................................ 40 .......... n ..........5.1 United Kingdom .......................................6.3 6.07 Government Online Service Index (0–1) .................................................... 59 .......... n ........0.53 Multiple economies (3) ...........................1.00
Pillar 7: Operating environment (1–7) .............................................................. 37 ...........................4.6 Hong Kong SAR ............................................ 5.8 7.01 Protection of property index (1–7) ............................................................. 46 .......... n ..........4.3 Finland .....................................................6.3
Property rights* ......................................................................................... 48 .......... n ..........4.6 Finland .....................................................6.4Intellectual property protection* ................................................................ 48 .......... n ..........3.9 Finland .....................................................6.2
7.02 Efficiency and accountability of public institutions index (1–7) ................... 49 .......... n ..........3.8 Singapore.................................................6.0Judicial efficiency & impartiality in commercial disputes (0–4).................. 100 .......... n ..........1.5 Multiple economies (7) .............................4.0Diversion of public funds* ......................................................................... 41 .......... n ..........3.9 New Zealand ............................................6.5Ease of compliance with government regulation* ...................................... 14 .......... n ..........4.3 Singapore.................................................5.4
7.03 Access to finance index (1–7) .................................................................. 42 .......... n ..........4.1 Hong Kong SAR ......................................5.7Affordability of financial services* ............................................................. 49 .......... n ..........4.4 Hong Kong SAR ......................................6.1Availability of financial services* ................................................................ 66 .......... n ..........4.5 Switzerland ..............................................6.4Ease of access to loans* .......................................................................... 30 .......... n ..........3.4 Qatar ........................................................4.9Availability of trade finance* ...................................................................... 37 .......... n ..........4.3 Hong Kong SAR ......................................5.8
7.04 Openness to foreign participation index (1–7) ............................................. 5 .......... n ..........5.1 Ireland ......................................................5.5Ease of hiring foreign labour* .................................................................... 20 .......... n ..........4.6 United Arab Emirates ...............................5.6Business impact of rules on FDI* .............................................................. 43 .......... n ..........4.8 Ireland ......................................................6.7Openness to multilateral trade rules (0–100) ............................................... 5 .......... n ........85.8 Slovenia .................................................92.2
7.05 Index of physical security (1–7) ................................................................. 63 .......... n ..........5.6 Qatar ........................................................6.8Reliability of police services* ..................................................................... 55 .......... n ..........4.4 Finland .....................................................6.7Business costs of crime and violence* ...................................................... 61 .......... n ..........4.8 Qatar ........................................................6.8Business costs of terrorism* ..................................................................... 89 .......... n ..........5.0 Slovenia ...................................................6.7Homicide cases/100,000 pop. ................................................................. 27 .......... n ..........1.0 Hong Kong SAR ......................................0.2Index of terrorism incidence (1-7) ........................................................... 114 .......... n ..........6.5 Multiple economies (48) ...........................7.0
© 2014 World Economic Forum

Country/Economy Profiles
102 | The Global Enabling Trade Report 2014
* From the list of factors above, respondents were asked to select the five most problematic for trading in their country and to rank them between 1 (most problematic) and 5. The bars in the figure show the responses weighted according to their rankings.
For methodology, indicator descriptions and sources, and for a list of multiple best-performing economies, see page 45.
0 105 15 20 25 30
0 5 10 15 20 25 30
2
3
4
5
6
7
Operating environment
Availability & use of ICTs
Availability & quality of transport services
Availability & quality of transport infrastructure
Efficiency & transparency of border administration
Foreign market access
Domestic market access
1
Enabling Trade Index 2014 Rank Score (out of 138) (1–7)
Enabling Trade Index 2014 .................... 73 ..... 4.0
Subindex A: Market access (25%) ....................16 .......4.5Pillar 1: Domestic market access .....................................36 .........5.1Pillar 2: Foreign market access ........................................18 ........ 3.8
Subindex B: Border administration (25%) ........68 .......4.4Pillar 3: Efficiency & transparency of border administration ...................................................68 .........4.4
Subindex C: Infrastructure (25%) ......................84 .......3.5Pillar 4: Availability & quality of transport infrastructure . 112 .........2.5Pillar 5: Availability & quality of transport services ...........88 .........3.7Pillar 6: Availability & use of ICTs .....................................56 ........ 4.3
Subindex D: Operating environment (25%) .... 112 .......3.6Pillar 7: Operating environment ...................................... 112 ........ 3.6
Key indicators, 2012 Rank/138
Population (millions) ............................................................ 46.6 ........... 26GDP (US$ billions) ............................................................ 369.0 ........... 32GDP per capita (US$) ..................................................... 7,919.2 ........... 63
Merchandise tradeTrade openness (imports+exports)/GDP ............................ 32.3 ......... 133Share of world trade (%) ..................................................... 0.32 ........... 52Total Exports (US$ billions) ................................................. 60.3 ........... 53Total Imports (US$ billions) ..................................................59.1 ........... 50
Value chain indicators, 2012Share (%) of merchandise trade Exports Imports
Capital goods ......................................................................1.0 ........ 24.4
Intermediate goods .......................................................... 79.6 ........45.5Food and beverages (industrial) ..................................... 4.2 .......... 3.1Industrial supplies (primary and processed) .................16.4 ........ 33.1Parts and accessories .....................................................1.0 ...........9.1Fuels and lubricants ..................................................... 58.0 ...........0.1
Consumer goods ...............................................................11.2 ........ 16.0Food and beverages (consumer) .....................................4.1 .......... 3.8Transport equipment and consumer goods .................... 7.1 .........12.1
Passenger motor cars ........................................................ 0.5 .......... 4.0
Others ...................................................................................7.8 ........ 10.1
The most problematic factors for trade, 2013Most problematic factors for exporting Score*
High cost or delays caused by domestic transportation ....................................... 17.6Difficulties in meeting quality/quantity requirements of buyers ..............................10.6Identifying potential markets and buyers ...............................................................10.6Inappropriate production technology and skills ...................................................... 9.2Technical requirements and standards abroad ...................................................... 8.9Access to trade finance .......................................................................................... 8.9Access to imported inputs at competitive prices ................................................... 8.6Burdensome procedures at foreign borders .......................................................... 6.3High cost or delays caused by international transportation ................................... 5.5Tariff barriers abroad .............................................................................................. 5.0Corruption at foreign borders ................................................................................. 4.5Rules of origin requirements abroad ....................................................................... 4.4
Most problematic factors for importing Score*
High cost or delays caused by international transportation ..................................19.5Burdensome import procedures ...........................................................................18.1Tariffs .....................................................................................................................16.9Domestic technical requirements and standards ..................................................12.4Corruption at the border ........................................................................................11.0High cost or delays caused by domestic transportation ........................................ 8.8Crime and theft ....................................................................................................... 8.4Inappropriate telecommunications infrastructure ................................................... 5.0
Colombia
Sources: International Monetary Fund, World Bank, World Trade Organization, United Nations COMTRADE
Colombia
South America
© 2014 World Economic Forum

Country/Economy Profiles
The Global Enabling Trade Report 2014 | 103
* Indicator derived from the World Economic Forum’s Executive Opinion Survey and measured on a 1-to-7 scale, where 7 indicates best outcome.
The Enabling Trade Index 2014 in detail n Competitive Advantage n Competitive Disadvantage
For methodology, indicator descriptions and sources, and for a list of multiple best-performing economies, see page 45. Colombia
INDICATOR, UNITS RANK/138 VALUE BEST PERFORMER VALUE
Pillar 1: Domestic market access (1–7) ........................................................... 36 ...........................5.1 Multiple economies (2) ................................ 7.0 1.01 Tariff rate (%)............................................................................................. 79 .......... n ..........6.6 Multiple economies (2) .............................0.0 1.02 Complexity of tariffs index (1–7) ................................................................ 36 .......... n ..........6.5 Multiple economies (2) .............................7.0
Tariff dispersion (standard deviation) ......................................................... 52 .......... n ..........8.2 Multiple economies (2) .............................0.0Tariff peaks (% of tariff lines) ..................................................................... 56 .......... n ..........1.2 Multiple economies (24) ...........................0.0Specific tariffs (% of tariff lines) ................................................................... 1 .......... n ..........0.0 Multiple economies (54) ...........................0.0Number of distinct tariffs ........................................................................... 43 .......... n ...........13 Multiple economies (2) ................................1
1.03 Share of duty-free imports (%) .................................................................. 77 .......... n ........56.0 Multiple economies (2) .........................100.0
Pillar 2: Foreign market access (1–7) .............................................................. 18 ...........................3.8 Cambodia ..................................................... 5.3 2.01 Tariffs faced (%) ........................................................................................ 15 .......... n ..........4.9 Chile .........................................................3.5 2.02 Index of margin of preference in destination mkts (0–100) ........................ 36 .......... n ........48.4 Mauritius ................................................97.1
Pillar 3: Efficiency and transparency of border administration (1–7) .............. 68 ...........................4.4 Singapore..................................................... 6.3 3.01 Customs services index (0–1) ................................................................... 76 .......... n ........0.51 Singapore...............................................0.97 3.02 Efficiency of the clearance process (1–5) .................................................. 79 .......... n ..........2.6 Norway ....................................................4.2 3.03 No. of days to import ............................................................................... 42 .......... n ...........13 Singapore....................................................4 3.04 No. of documents to import ..................................................................... 43 .......... n .............6 Multiple economies (2) ................................2 3.05 Cost to import (US$ per container) ......................................................... 118 .......... n ......2,470 Singapore................................................440 3.06 No. of days to export................................................................................ 56 .......... n ...........14 Multiple economies (5) ................................6 3.07 No. of documents to export ..................................................................... 16 .......... n .............4 Multiple economies (2) ................................2 3.08 Cost to export (US$ per container) ......................................................... 123 .......... n ......2,355 Malaysia ..................................................450 3.09 Irregular payments in exports and imports*............................................... 78 .......... n ..........3.4 New Zealand ............................................6.6 3.10 Time predictability of import procedures* .................................................. 68 .......... n ..........3.9 Finland .....................................................6.0 3.11 Customs transparency index (0–1) ............................................................. 1 .......... n ........1.00 Multiple economies (35) .........................1.00
Pillar 4: Availability and quality of transport infrastructure (1-7) ................... 112 ...........................2.5 United Arab Emirates ................................... 6.5 4.01 Available int’l airline seat km/week, millions .............................................. 50 .......... n ......326.1 United States ..................................11,481.7 4.02 Quality of air transport infrastructure* ........................................................ 90 .......... n ..........4.0 Singapore.................................................6.8 4.03 Quality of railroad infrastructure* ............................................................. 103 .......... n ..........1.5 Japan .......................................................6.7 4.04 Liner Shipping Connectivity Index (0–157.1) ............................................. 38 .......... n ........37.5 China ...................................................157.5 4.05 Quality of port infrastructure* .................................................................. 101 .......... n ..........3.5 Netherlands ..............................................6.8 4.06 Paved roads (% of total) ......................................................................... 114 .......... n ........14.4 Multiple economies (18) .......................100.0 4.07 Quality of roads* ..................................................................................... 121 .......... n ..........2.6 United Arab Emirates ...............................6.6
Pillar 5: Availability and quality of transport services (1–7) ............................ 88 ...........................3.7 Singapore..................................................... 5.7 5.01 Ease and affordability of shipment (1–5).................................................... 92 .......... n ..........2.7 Luxembourg .............................................3.8 5.02 Logistics competence (1–5) ...................................................................... 91 .......... n ..........2.6 Norway ....................................................4.2 5.03 Tracking and tracing ability (1–5) ............................................................. 105 .......... n ..........2.5 Germany ..................................................4.2 5.04 Timeliness of shipments in reaching destination (1–5) ............................. 109 .......... n ..........2.9 Luxembourg .............................................4.7 5.05 Postal services efficiency* ......................................................................... 50 .......... n ..........5.0 Japan .......................................................6.8 5.06 Efficiency of transport mode change* ..................................................... 104 .......... n ..........3.3 Hong Kong SAR ......................................6.4
Pillar 6: Availability and use of ICTs (1–7) ........................................................ 56 ...........................4.3 Sweden ........................................................ 6.5 6.01 Mobile phone subscriptions/100 pop. ...................................................... 81 .......... n ......102.9 Hong Kong SAR ..................................229.2 6.02 Individuals using Internet (%) .................................................................... 62 .......... n ........49.0 Iceland ...................................................96.2 6.03 Fixed broadband Internet subscriptions/100 pop. .................................... 65 .......... n ..........8.2 Switzerland ............................................39.9 6.04 Active mobile broadband Internet subscriptions/100 pop. ........................ 96 .......... n ..........4.9 Singapore.............................................124.5 6.05 ICT use for business-to-business transactions* ........................................ 60 .......... n ..........4.9 Finland .....................................................6.2 6.06 Internet use for business-to-consumer transactions* ................................ 55 .......... n ..........4.8 United Kingdom .......................................6.3 6.07 Government Online Service Index (0–1) .................................................... 16 .......... n ........0.84 Multiple economies (3) ...........................1.00
Pillar 7: Operating environment (1–7) ............................................................ 112 ...........................3.6 Hong Kong SAR ............................................ 5.8 7.01 Protection of property index (1–7) ............................................................. 88 .......... n ..........3.5 Finland .....................................................6.3
Property rights* ......................................................................................... 85 .......... n ..........3.8 Finland .....................................................6.4Intellectual property protection* ................................................................ 88 .......... n ..........3.2 Finland .....................................................6.2
7.02 Efficiency and accountability of public institutions index (1–7) ................... 69 .......... n ..........3.6 Singapore.................................................6.0Judicial efficiency & impartiality in commercial disputes (0–4).................... 22 .......... n ..........3.0 Multiple economies (7) .............................4.0Diversion of public funds* ....................................................................... 119 .......... n ..........2.3 New Zealand ............................................6.5Ease of compliance with government regulation* .................................... 105 .......... n ..........2.9 Singapore.................................................5.4
7.03 Access to finance index (1–7) .................................................................. 67 .......... n ..........3.8 Hong Kong SAR ......................................5.7Affordability of financial services* ............................................................. 94 .......... n ..........3.8 Hong Kong SAR ......................................6.1Availability of financial services* ................................................................ 50 .......... n ..........4.9 Switzerland ..............................................6.4Ease of access to loans* .......................................................................... 67 .......... n ..........2.8 Qatar ........................................................4.9Availability of trade finance* ...................................................................... 67 .......... n ..........3.8 Hong Kong SAR ......................................5.8
7.04 Openness to foreign participation index (1–7) ........................................... 68 .......... n ..........4.3 Ireland ......................................................5.5Ease of hiring foreign labour* .................................................................... 73 .......... n ..........4.1 United Arab Emirates ...............................5.6Business impact of rules on FDI* .............................................................. 69 .......... n ..........4.5 Ireland ......................................................6.7Openness to multilateral trade rules (0–100) ............................................. 72 .......... n ........63.5 Slovenia .................................................92.2
7.05 Index of physical security (1–7) ............................................................... 138 .......... n ..........2.5 Qatar ........................................................6.8Reliability of police services* ..................................................................... 67 .......... n ..........4.2 Finland .....................................................6.7Business costs of crime and violence* .................................................... 131 .......... n ..........2.7 Qatar ........................................................6.8Business costs of terrorism* ................................................................... 137 .......... n ..........2.7 Slovenia ...................................................6.7Homicide cases/100,000 pop. ............................................................... 130 .......... n ........33.2 Hong Kong SAR ......................................0.2Index of terrorism incidence (1-7) ........................................................... 131 .......... n ..........2.2 Multiple economies (48) ...........................7.0
© 2014 World Economic Forum

Country/Economy Profiles
104 | The Global Enabling Trade Report 2014
* From the list of factors above, respondents were asked to select the five most problematic for trading in their country and to rank them between 1 (most problematic) and 5. The bars in the figure show the responses weighted according to their rankings.
For methodology, indicator descriptions and sources, and for a list of multiple best-performing economies, see page 45.
0 105 15 20 25 30
0 5 10 15 20 25 30
2
3
4
5
6
7
Operating environment
Availability & use of ICTs
Availability & quality of transport services
Availability & quality of transport infrastructure
Efficiency & transparency of border administration
Foreign market access
Domestic market access
1
Enabling Trade Index 2014 Rank Score (out of 138) (1–7)
Enabling Trade Index 2014 .....................42 ..... 4.4
Subindex A: Market access (25%) ......................8 .......4.7Pillar 1: Domestic market access .....................................20 ........ 5.5Pillar 2: Foreign market access ........................................16 ........ 3.9
Subindex B: Border administration (25%) ........46 .......4.9Pillar 3: Efficiency & transparency of border administration ...................................................46 .........4.9
Subindex C: Infrastructure (25%) ......................85 .......3.5Pillar 4: Availability & quality of transport infrastructure . 117 .........2.4Pillar 5: Availability & quality of transport services ...........83 ........ 3.8Pillar 6: Availability & use of ICTs .....................................62 ........ 4.2
Subindex D: Operating environment (25%) ......46 .......4.5Pillar 7: Operating environment ........................................46 ........ 4.5
Key indicators, 2012 Rank/138
Population (millions) ...............................................................4.7 ......... 101GDP (US$ billions) ...............................................................45.1 ........... 77GDP per capita (US$) .................................................... 9,665.0 ........... 60
Merchandise tradeTrade openness (imports+exports)/GDP ............................ 64.2 ........... 71Share of world trade (%) ..................................................... 0.08 ........... 79Total Exports (US$ billions) ..................................................11.5 ........... 79Total Imports (US$ billions) .................................................. 17.6 ........... 80
Value chain indicators, 2012Share (%) of merchandise trade Exports Imports
Capital goods ................................................................... 10.8 ........ 14.5
Intermediate goods ...........................................................51.6 ........ 51.0Food and beverages (industrial) ..................................... 6.2 .......... 2.2Industrial supplies (primary and processed) .................21.3 ........ 29.3Parts and accessories ...................................................24.0 ........ 18.9Fuels and lubricants ....................................................... 0.0 .......... 0.6
Consumer goods ...............................................................37.5 ........ 19.3Food and beverages (consumer) .................................. 25.5 .......... 6.2Transport equipment and consumer goods ..................12.0 .........13.1
Passenger motor cars ........................................................ 0.0 ..........3.3
Others .................................................................................. 0.0 ........ 11.9
The most problematic factors for trade, 2013Most problematic factors for exporting Score*
Identifying potential markets and buyers ...............................................................14.0Access to trade finance .........................................................................................12.8High cost or delays caused by domestic transportation .......................................11.5Access to imported inputs at competitive prices ..................................................11.0High cost or delays caused by international transportation ................................... 9.5Difficulties in meeting quality/quantity requirements of buyers ................................8.1Technical requirements and standards abroad .......................................................7.8Tariff barriers abroad .............................................................................................. 6.6Inappropriate production technology and skills ...................................................... 6.2Burdensome procedures at foreign borders .......................................................... 5.5Rules of origin requirements abroad ....................................................................... 4.8Corruption at foreign borders ..................................................................................2.1
Most problematic factors for importing Score*
Burdensome import procedures .......................................................................... 20.9Tariffs .................................................................................................................... 20.4Domestic technical requirements and standards ..................................................15.2High cost or delays caused by domestic transportation .......................................13.8High cost or delays caused by international transportation ..................................13.3Corruption at the border ......................................................................................... 8.3Inappropriate telecommunications infrastructure ....................................................5.1Crime and theft ....................................................................................................... 3.0
Costa Rica
Sources: International Monetary Fund, World Bank, World Trade Organization, United Nations COMTRADE
Costa Rica
Central America and Caribbean
© 2014 World Economic Forum

Country/Economy Profiles
The Global Enabling Trade Report 2014 | 105
* Indicator derived from the World Economic Forum’s Executive Opinion Survey and measured on a 1-to-7 scale, where 7 indicates best outcome.
The Enabling Trade Index 2014 in detail n Competitive Advantage n Competitive Disadvantage
For methodology, indicator descriptions and sources, and for a list of multiple best-performing economies, see page 45. Costa Rica
INDICATOR, UNITS RANK/138 VALUE BEST PERFORMER VALUE
Pillar 1: Domestic market access (1–7) ........................................................... 20 ...........................5.5 Multiple economies (2) ................................ 7.0 1.01 Tariff rate (%)............................................................................................. 48 .......... n ..........3.9 Multiple economies (2) .............................0.0 1.02 Complexity of tariffs index (1–7) ................................................................ 50 .......... n ..........6.4 Multiple economies (2) .............................7.0
Tariff dispersion (standard deviation) ......................................................... 41 .......... n ..........7.4 Multiple economies (2) .............................0.0Tariff peaks (% of tariff lines) ..................................................................... 67 .......... n ..........3.0 Multiple economies (24) ...........................0.0Specific tariffs (% of tariff lines) ................................................................... 1 .......... n ..........0.0 Multiple economies (54) ...........................0.0Number of distinct tariffs ........................................................................... 49 .......... n ...........17 Multiple economies (2) ................................1
1.03 Share of duty-free imports (%) .................................................................. 72 .......... n ........64.0 Multiple economies (2) .........................100.0
Pillar 2: Foreign market access (1–7) .............................................................. 16 ...........................3.9 Cambodia ..................................................... 5.3 2.01 Tariffs faced (%) ........................................................................................ 12 .......... n ..........4.7 Chile .........................................................3.5 2.02 Index of margin of preference in destination mkts (0–100) ........................ 46 .......... n ........42.5 Mauritius ................................................97.1
Pillar 3: Efficiency and transparency of border administration (1–7) .............. 46 ...........................4.9 Singapore..................................................... 6.3 3.01 Customs services index (0–1) ................................................................... 38 .......... n ........0.69 Singapore...............................................0.97 3.02 Efficiency of the clearance process (1–5) ................................................ 102 .......... n ..........2.4 Norway ....................................................4.2 3.03 No. of days to import ............................................................................... 47 .......... n ...........14 Singapore....................................................4 3.04 No. of documents to import ..................................................................... 27 .......... n .............5 Multiple economies (2) ................................2 3.05 Cost to import (US$ per container) ........................................................... 49 .......... n ......1,070 Singapore................................................440 3.06 No. of days to export................................................................................ 48 .......... n ...........13 Multiple economies (5) ................................6 3.07 No. of documents to export ..................................................................... 40 .......... n .............5 Multiple economies (2) ................................2 3.08 Cost to export (US$ per container) ........................................................... 52 .......... n ......1,015 Malaysia ..................................................450 3.09 Irregular payments in exports and imports*............................................... 59 .......... n ..........3.9 New Zealand ............................................6.6 3.10 Time predictability of import procedures* .................................................. 63 .......... n ..........3.9 Finland .....................................................6.0 3.11 Customs transparency index (0–1) ............................................................. 1 .......... n ........1.00 Multiple economies (35) .........................1.00
Pillar 4: Availability and quality of transport infrastructure (1-7) ................... 117 ...........................2.4 United Arab Emirates ................................... 6.5 4.01 Available int’l airline seat km/week, millions .............................................. 72 .......... n ......135.2 United States ..................................11,481.7 4.02 Quality of air transport infrastructure* ........................................................ 52 .......... n ..........4.8 Singapore.................................................6.8 4.03 Quality of railroad infrastructure* ............................................................... 97 .......... n ..........1.7 Japan .......................................................6.7 4.04 Liner Shipping Connectivity Index (0–157.1) ............................................. 70 .......... n ........14.0 China ...................................................157.5 4.05 Quality of port infrastructure* .................................................................. 119 .......... n ..........2.9 Netherlands ..............................................6.8 4.06 Paved roads (% of total) ........................................................................... 89 .......... n ........26.0 Multiple economies (18) .......................100.0 4.07 Quality of roads* ..................................................................................... 116 .......... n ..........2.7 United Arab Emirates ...............................6.6
Pillar 5: Availability and quality of transport services (1–7) ............................ 83 ...........................3.8 Singapore..................................................... 5.7 5.01 Ease and affordability of shipment (1–5).................................................. 103 .......... n ..........2.6 Luxembourg .............................................3.8 5.02 Logistics competence (1–5) ...................................................................... 69 .......... n ..........2.9 Norway ....................................................4.2 5.03 Tracking and tracing ability (1–5) ............................................................... 81 .......... n ..........2.8 Germany ..................................................4.2 5.04 Timeliness of shipments in reaching destination (1–5) ............................... 95 .......... n ..........3.0 Luxembourg .............................................4.7 5.05 Postal services efficiency* ......................................................................... 73 .......... n ..........4.4 Japan .......................................................6.8 5.06 Efficiency of transport mode change* ....................................................... 95 .......... n ..........3.5 Hong Kong SAR ......................................6.4
Pillar 6: Availability and use of ICTs (1–7) ........................................................ 62 ...........................4.2 Sweden ........................................................ 6.5 6.01 Mobile phone subscriptions/100 pop. ...................................................... 60 .......... n ......111.9 Hong Kong SAR ..................................229.2 6.02 Individuals using Internet (%) .................................................................... 64 .......... n ........47.5 Iceland ...................................................96.2 6.03 Fixed broadband Internet subscriptions/100 pop. .................................... 60 .......... n ..........9.3 Switzerland ............................................39.9 6.04 Active mobile broadband Internet subscriptions/100 pop. ........................ 67 .......... n ........20.3 Singapore.............................................124.5 6.05 ICT use for business-to-business transactions* ........................................ 42 .......... n ..........5.3 Finland .....................................................6.2 6.06 Internet use for business-to-consumer transactions* ................................ 46 .......... n ..........4.9 United Kingdom .......................................6.3 6.07 Government Online Service Index (0–1) .................................................... 67 .......... n ........0.50 Multiple economies (3) ...........................1.00
Pillar 7: Operating environment (1–7) .............................................................. 46 ...........................4.5 Hong Kong SAR ............................................ 5.8 7.01 Protection of property index (1–7) ............................................................. 51 .......... n ..........4.2 Finland .....................................................6.3
Property rights* ......................................................................................... 50 .......... n ..........4.6 Finland .....................................................6.4Intellectual property protection* ................................................................ 54 .......... n ..........3.8 Finland .....................................................6.2
7.02 Efficiency and accountability of public institutions index (1–7) ................... 33 .......... n ..........4.4 Singapore.................................................6.0Judicial efficiency & impartiality in commercial disputes (0–4).................... 13 .......... n ..........3.5 Multiple economies (7) .............................4.0Diversion of public funds* ......................................................................... 50 .......... n ..........3.7 New Zealand ............................................6.5Ease of compliance with government regulation* ...................................... 86 .......... n ..........3.3 Singapore.................................................5.4
7.03 Access to finance index (1–7) .................................................................. 73 .......... n ..........3.8 Hong Kong SAR ......................................5.7Affordability of financial services* ............................................................. 58 .......... n ..........4.2 Hong Kong SAR ......................................6.1Availability of financial services* ................................................................ 69 .......... n ..........4.4 Switzerland ..............................................6.4Ease of access to loans* ........................................................................ 100 .......... n ..........2.4 Qatar ........................................................4.9Availability of trade finance* ...................................................................... 56 .......... n ..........4.0 Hong Kong SAR ......................................5.8
7.04 Openness to foreign participation index (1–7) ........................................... 48 .......... n ..........4.6 Ireland ......................................................5.5Ease of hiring foreign labour* .................................................................... 68 .......... n ..........4.1 United Arab Emirates ...............................5.6Business impact of rules on FDI* .............................................................. 25 .......... n ..........5.1 Ireland ......................................................6.7Openness to multilateral trade rules (0–100) ............................................. 62 .......... n ........65.9 Slovenia .................................................92.2
7.05 Index of physical security (1–7) ................................................................. 70 .......... n ..........5.5 Qatar ........................................................6.8Reliability of police services* ..................................................................... 41 .......... n ..........4.9 Finland .....................................................6.7Business costs of crime and violence* ...................................................... 99 .......... n ..........3.9 Qatar ........................................................6.8Business costs of terrorism* ..................................................................... 34 .......... n ..........6.1 Slovenia ...................................................6.7Homicide cases/100,000 pop. ............................................................... 101 .......... n ........10.0 Hong Kong SAR ......................................0.2Index of terrorism incidence (1-7) ............................................................... 1 .......... n ..........7.0 Multiple economies (48) ...........................7.0
© 2014 World Economic Forum

Country/Economy Profiles
106 | The Global Enabling Trade Report 2014
* From the list of factors above, respondents were asked to select the five most problematic for trading in their country and to rank them between 1 (most problematic) and 5. The bars in the figure show the responses weighted according to their rankings.
For methodology, indicator descriptions and sources, and for a list of multiple best-performing economies, see page 45.
0 105 15 20 25 30
0 5 10 15 20 25 30
2
3
4
5
6
7
Operating environment
Availability & use of ICTs
Availability & quality of transport services
Availability & quality of transport infrastructure
Efficiency & transparency of border administration
Foreign market access
Domestic market access
1
Enabling Trade Index 2014 Rank Score (out of 138) (1–7)
Enabling Trade Index 2014 ................... 117 ..... 3.3
Subindex A: Market access (25%) ..................125 .......2.9Pillar 1: Domestic market access ................................... 115 ........ 3.6Pillar 2: Foreign market access ........................................83 .........2.3
Subindex B: Border administration (25%) ......106 .......3.5Pillar 3: Efficiency & transparency of border administration .................................................106 ........ 3.5
Subindex C: Infrastructure (25%) ....................108 .......3.0Pillar 4: Availability & quality of transport infrastructure .106 .........2.6Pillar 5: Availability & quality of transport services ...........98 ........ 3.6Pillar 6: Availability & use of ICTs ................................... 110 .........2.7
Subindex D: Operating environment (25%) .... 111 .......3.6Pillar 7: Operating environment ...................................... 111 ........ 3.6
Key indicators, 2012 Rank/138
Population (millions) ............................................................ 23.4 ........... 44GDP (US$ billions) ...............................................................24.7 ........... 93GDP per capita (US$) .....................................................1,057.3 ..........117
Merchandise tradeTrade openness (imports+exports)/GDP .............................89.7 ........... 36Share of world trade (%) ..................................................... 0.06 ........... 86Total Exports (US$ billions) ..................................................12.4 ........... 77Total Imports (US$ billions) ................................................... 9.8 ........... 95
Value chain indicators, 2012Share (%) of merchandise trade Exports Imports
Capital goods ..................................................................... 1.2 ........ 14.4
Intermediate goods .......................................................... 70.8 ........60.3Food and beverages (industrial) ....................................35.1 .......... 2.9Industrial supplies (primary and processed) .................23.1 ........ 22.0Parts and accessories .....................................................1.0 .......... 6.0Fuels and lubricants ......................................................11.6 ........ 29.4
Consumer goods ...............................................................11.6 ........ 21.3Food and beverages (consumer) .....................................7.7 ........ 14.6Transport equipment and consumer goods ................... 3.9 .......... 6.7
Passenger motor cars ........................................................ 0.0 ..........2.4
Others ................................................................................ 16.3 .......... 1.6
The most problematic factors for trade, 2013Most problematic factors for exporting Score*
Access to trade finance ........................................................................................ 28.3Identifying potential markets and buyers ...............................................................14.7Access to imported inputs at competitive prices ..................................................13.4High cost or delays caused by international transportation ................................. 10.2High cost or delays caused by domestic transportation ........................................ 8.3Burdensome procedures at foreign borders ........................................................... 7.1Difficulties in meeting quality/quantity requirements of buyers ............................... 5.4Inappropriate production technology and skills ...................................................... 5.2Corruption at foreign borders ................................................................................. 3.6Technical requirements and standards abroad .......................................................1.5Rules of origin requirements abroad ........................................................................1.2Tariff barriers abroad ...............................................................................................1.1
Most problematic factors for importing Score*
Tariffs .....................................................................................................................24.0Burdensome import procedures .......................................................................... 23.0High cost or delays caused by international transportation ..................................15.6Corruption at the border ........................................................................................13.4High cost or delays caused by domestic transportation .......................................10.6Crime and theft ........................................................................................................9.7Inappropriate telecommunications infrastructure ................................................... 2.5Domestic technical requirements and standards ....................................................1.2
Côte d’Ivoire
Sources: International Monetary Fund, World Bank, World Trade Organization, United Nations COMTRADE
Côte d’Ivoire
Sub-Saharan Africa
© 2014 World Economic Forum
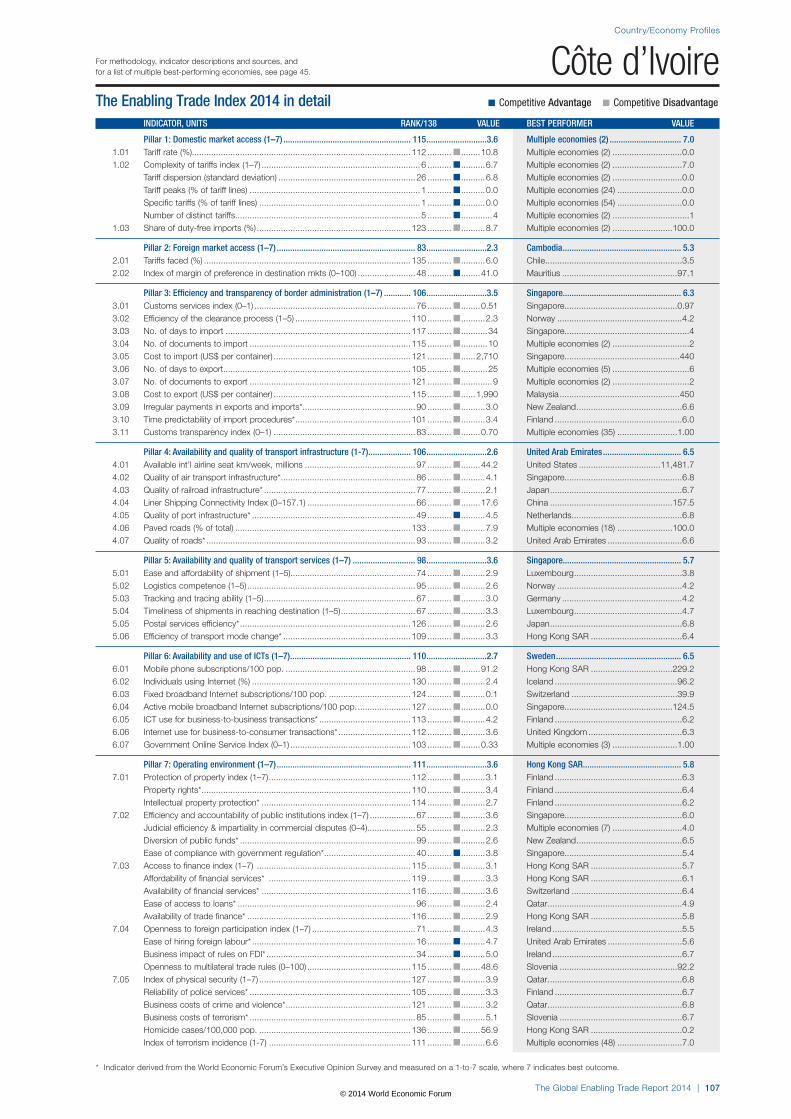
Country/Economy Profiles
The Global Enabling Trade Report 2014 | 107
* Indicator derived from the World Economic Forum’s Executive Opinion Survey and measured on a 1-to-7 scale, where 7 indicates best outcome.
The Enabling Trade Index 2014 in detail n Competitive Advantage n Competitive Disadvantage
For methodology, indicator descriptions and sources, and for a list of multiple best-performing economies, see page 45. Côte d’Ivoire
INDICATOR, UNITS RANK/138 VALUE BEST PERFORMER VALUE
Pillar 1: Domestic market access (1–7) ......................................................... 115 ...........................3.6 Multiple economies (2) ................................ 7.0 1.01 Tariff rate (%)........................................................................................... 112 .......... n ........10.8 Multiple economies (2) .............................0.0 1.02 Complexity of tariffs index (1–7) .................................................................. 6 .......... n ..........6.7 Multiple economies (2) .............................7.0
Tariff dispersion (standard deviation) ......................................................... 26 .......... n ..........6.8 Multiple economies (2) .............................0.0Tariff peaks (% of tariff lines) ....................................................................... 1 .......... n ..........0.0 Multiple economies (24) ...........................0.0Specific tariffs (% of tariff lines) ................................................................... 1 .......... n ..........0.0 Multiple economies (54) ...........................0.0Number of distinct tariffs ............................................................................. 5 .......... n .............4 Multiple economies (2) ................................1
1.03 Share of duty-free imports (%) ................................................................ 123 .......... n ..........8.7 Multiple economies (2) .........................100.0
Pillar 2: Foreign market access (1–7) .............................................................. 83 ...........................2.3 Cambodia ..................................................... 5.3 2.01 Tariffs faced (%) ...................................................................................... 135 .......... n ..........6.0 Chile .........................................................3.5 2.02 Index of margin of preference in destination mkts (0–100) ........................ 48 .......... n ........41.0 Mauritius ................................................97.1
Pillar 3: Efficiency and transparency of border administration (1–7) ............ 106 ...........................3.5 Singapore..................................................... 6.3 3.01 Customs services index (0–1) ................................................................... 76 .......... n ........0.51 Singapore...............................................0.97 3.02 Efficiency of the clearance process (1–5) ................................................ 110 .......... n ..........2.3 Norway ....................................................4.2 3.03 No. of days to import ............................................................................. 117 .......... n ...........34 Singapore....................................................4 3.04 No. of documents to import ................................................................... 115 .......... n ...........10 Multiple economies (2) ................................2 3.05 Cost to import (US$ per container) ......................................................... 121 .......... n ......2,710 Singapore................................................440 3.06 No. of days to export.............................................................................. 105 .......... n ...........25 Multiple economies (5) ................................6 3.07 No. of documents to export ................................................................... 121 .......... n .............9 Multiple economies (2) ................................2 3.08 Cost to export (US$ per container) ......................................................... 115 .......... n ......1,990 Malaysia ..................................................450 3.09 Irregular payments in exports and imports*............................................... 90 .......... n ..........3.0 New Zealand ............................................6.6 3.10 Time predictability of import procedures* ................................................ 101 .......... n ..........3.4 Finland .....................................................6.0 3.11 Customs transparency index (0–1) ........................................................... 83 .......... n ........0.70 Multiple economies (35) .........................1.00
Pillar 4: Availability and quality of transport infrastructure (1-7) ................... 106 ...........................2.6 United Arab Emirates ................................... 6.5 4.01 Available int’l airline seat km/week, millions .............................................. 97 .......... n ........44.2 United States ..................................11,481.7 4.02 Quality of air transport infrastructure* ........................................................ 86 .......... n ..........4.1 Singapore.................................................6.8 4.03 Quality of railroad infrastructure* ............................................................... 77 .......... n ..........2.1 Japan .......................................................6.7 4.04 Liner Shipping Connectivity Index (0–157.1) ............................................. 66 .......... n ........17.6 China ...................................................157.5 4.05 Quality of port infrastructure* .................................................................... 49 .......... n ..........4.5 Netherlands ..............................................6.8 4.06 Paved roads (% of total) ......................................................................... 133 .......... n ..........7.9 Multiple economies (18) .......................100.0 4.07 Quality of roads* ....................................................................................... 93 .......... n ..........3.2 United Arab Emirates ...............................6.6
Pillar 5: Availability and quality of transport services (1–7) ............................ 98 ...........................3.6 Singapore..................................................... 5.7 5.01 Ease and affordability of shipment (1–5).................................................... 74 .......... n ..........2.9 Luxembourg .............................................3.8 5.02 Logistics competence (1–5) ...................................................................... 95 .......... n ..........2.6 Norway ....................................................4.2 5.03 Tracking and tracing ability (1–5) ............................................................... 67 .......... n ..........3.0 Germany ..................................................4.2 5.04 Timeliness of shipments in reaching destination (1–5) ............................... 67 .......... n ..........3.3 Luxembourg .............................................4.7 5.05 Postal services efficiency* ....................................................................... 126 .......... n ..........2.6 Japan .......................................................6.8 5.06 Efficiency of transport mode change* ..................................................... 109 .......... n ..........3.3 Hong Kong SAR ......................................6.4
Pillar 6: Availability and use of ICTs (1–7) ...................................................... 110 ...........................2.7 Sweden ........................................................ 6.5 6.01 Mobile phone subscriptions/100 pop. ...................................................... 98 .......... n ........91.2 Hong Kong SAR ..................................229.2 6.02 Individuals using Internet (%) .................................................................. 130 .......... n ..........2.4 Iceland ...................................................96.2 6.03 Fixed broadband Internet subscriptions/100 pop. .................................. 124 .......... n ..........0.1 Switzerland ............................................39.9 6.04 Active mobile broadband Internet subscriptions/100 pop. ...................... 127 .......... n ..........0.0 Singapore.............................................124.5 6.05 ICT use for business-to-business transactions* ...................................... 113 .......... n ..........4.2 Finland .....................................................6.2 6.06 Internet use for business-to-consumer transactions* .............................. 112 .......... n ..........3.6 United Kingdom .......................................6.3 6.07 Government Online Service Index (0–1) .................................................. 103 .......... n ........0.33 Multiple economies (3) ...........................1.00
Pillar 7: Operating environment (1–7) ............................................................ 111 ...........................3.6 Hong Kong SAR ............................................ 5.8 7.01 Protection of property index (1–7) ........................................................... 112 .......... n ..........3.1 Finland .....................................................6.3
Property rights* ....................................................................................... 110 .......... n ..........3.4 Finland .....................................................6.4Intellectual property protection* .............................................................. 114 .......... n ..........2.7 Finland .....................................................6.2
7.02 Efficiency and accountability of public institutions index (1–7) ................... 67 .......... n ..........3.6 Singapore.................................................6.0Judicial efficiency & impartiality in commercial disputes (0–4).................... 55 .......... n ..........2.3 Multiple economies (7) .............................4.0Diversion of public funds* ......................................................................... 99 .......... n ..........2.6 New Zealand ............................................6.5Ease of compliance with government regulation* ...................................... 40 .......... n ..........3.8 Singapore.................................................5.4
7.03 Access to finance index (1–7) ................................................................ 115 .......... n ..........3.1 Hong Kong SAR ......................................5.7Affordability of financial services* ........................................................... 119 .......... n ..........3.3 Hong Kong SAR ......................................6.1Availability of financial services* .............................................................. 116 .......... n ..........3.6 Switzerland ..............................................6.4Ease of access to loans* .......................................................................... 96 .......... n ..........2.4 Qatar ........................................................4.9Availability of trade finance* .................................................................... 116 .......... n ..........2.9 Hong Kong SAR ......................................5.8
7.04 Openness to foreign participation index (1–7) ........................................... 71 .......... n ..........4.3 Ireland ......................................................5.5Ease of hiring foreign labour* .................................................................... 16 .......... n ..........4.7 United Arab Emirates ...............................5.6Business impact of rules on FDI* .............................................................. 34 .......... n ..........5.0 Ireland ......................................................6.7Openness to multilateral trade rules (0–100) ........................................... 115 .......... n ........48.6 Slovenia .................................................92.2
7.05 Index of physical security (1–7) ............................................................... 127 .......... n ..........3.9 Qatar ........................................................6.8Reliability of police services* ................................................................... 105 .......... n ..........3.3 Finland .....................................................6.7Business costs of crime and violence* .................................................... 121 .......... n ..........3.2 Qatar ........................................................6.8Business costs of terrorism* ..................................................................... 85 .......... n ..........5.1 Slovenia ...................................................6.7Homicide cases/100,000 pop. ............................................................... 136 .......... n ........56.9 Hong Kong SAR ......................................0.2Index of terrorism incidence (1-7) ........................................................... 111 .......... n ..........6.6 Multiple economies (48) ...........................7.0
© 2014 World Economic Forum

Country/Economy Profiles
108 | The Global Enabling Trade Report 2014
* From the list of factors above, respondents were asked to select the five most problematic for trading in their country and to rank them between 1 (most problematic) and 5. The bars in the figure show the responses weighted according to their rankings.
For methodology, indicator descriptions and sources, and for a list of multiple best-performing economies, see page 45.
0 105 15 20 25 30
0 5 10 15 20 25 30
2
3
4
5
6
7
Operating environment
Availability & use of ICTs
Availability & quality of transport services
Availability & quality of transport infrastructure
Efficiency & transparency of border administration
Foreign market access
Domestic market access
1
Enabling Trade Index 2014 Rank Score (out of 138) (1–7)
Enabling Trade Index 2014 .................... 56 ..... 4.2
Subindex A: Market access (25%) ....................50 .......3.9Pillar 1: Domestic market access .....................................31 ........ 5.2Pillar 2: Foreign market access ........................................68 .........2.5
Subindex B: Border administration (25%) ........65 .......4.5Pillar 3: Efficiency & transparency of border administration ...................................................65 ........ 4.5
Subindex C: Infrastructure (25%) ......................42 .......4.4Pillar 4: Availability & quality of transport infrastructure ...51 ........ 3.8Pillar 5: Availability & quality of transport services ...........48 ........ 4.5Pillar 6: Availability & use of ICTs .....................................39 .........5.0
Subindex D: Operating environment (25%) ......69 .......4.1Pillar 7: Operating environment ........................................69 .........4.1
Key indicators, 2012 Rank/138
Population (millions) ...............................................................4.4 ......... 105GDP (US$ billions) .............................................................. 56.5 ........... 70GDP per capita (US$) ...................................................12,829.5 ........... 47
Merchandise tradeTrade openness (imports+exports)/GDP .............................58.7 ........... 85Share of world trade (%) ..................................................... 0.09 ........... 75Total Exports (US$ billions) ..................................................12.3 ........... 78Total Imports (US$ billions) ................................................. 20.8 ........... 73
Value chain indicators, 2012Share (%) of merchandise trade Exports Imports
Capital goods ................................................................... 15.3 ........ 12.0
Intermediate goods ...........................................................47.5 ........53.8Food and beverages (industrial) ......................................2.5 .......... 2.3Industrial supplies (primary and processed) .................32.1 ........ 28.4Parts and accessories .................................................... 9.9 ...........7.0Fuels and lubricants ........................................................3.1 ........ 16.2
Consumer goods .............................................................. 25.8 ........25.0Food and beverages (consumer) .................................... 8.6 ...........7.6Transport equipment and consumer goods .................. 17.2 .........17.3
Passenger motor cars ........................................................ 0.0 ..........2.4
Others .................................................................................11.3 .......... 6.9
The most problematic factors for trade, 2013Most problematic factors for exporting Score*
Inappropriate production technology and skills .................................................... 18.3Identifying potential markets and buyers ...............................................................14.6Access to trade finance .........................................................................................13.8Difficulties in meeting quality/quantity requirements of buyers .............................. 11.1Technical requirements and standards abroad .....................................................10.3Access to imported inputs at competitive prices ................................................... 8.2Burdensome procedures at foreign borders .......................................................... 6.0Rules of origin requirements abroad ........................................................................4.7High cost or delays caused by domestic transportation ........................................ 4.4Tariff barriers abroad .............................................................................................. 3.4High cost or delays caused by international transportation ................................... 2.6Corruption at foreign borders ................................................................................. 2.5
Most problematic factors for importing Score*
Burdensome import procedures ...........................................................................24.1Domestic technical requirements and standards ..................................................21.7Tariffs .................................................................................................................... 18.3High cost or delays caused by international transportation ..................................10.7High cost or delays caused by domestic transportation ........................................ 8.0Corruption at the border ..........................................................................................7.9Crime and theft ........................................................................................................5.1Inappropriate telecommunications infrastructure ................................................... 4.2
Croatia
Sources: International Monetary Fund, World Bank, World Trade Organization, United Nations COMTRADE
Croatia
Central and Eastern Europe
© 2014 World Economic Forum
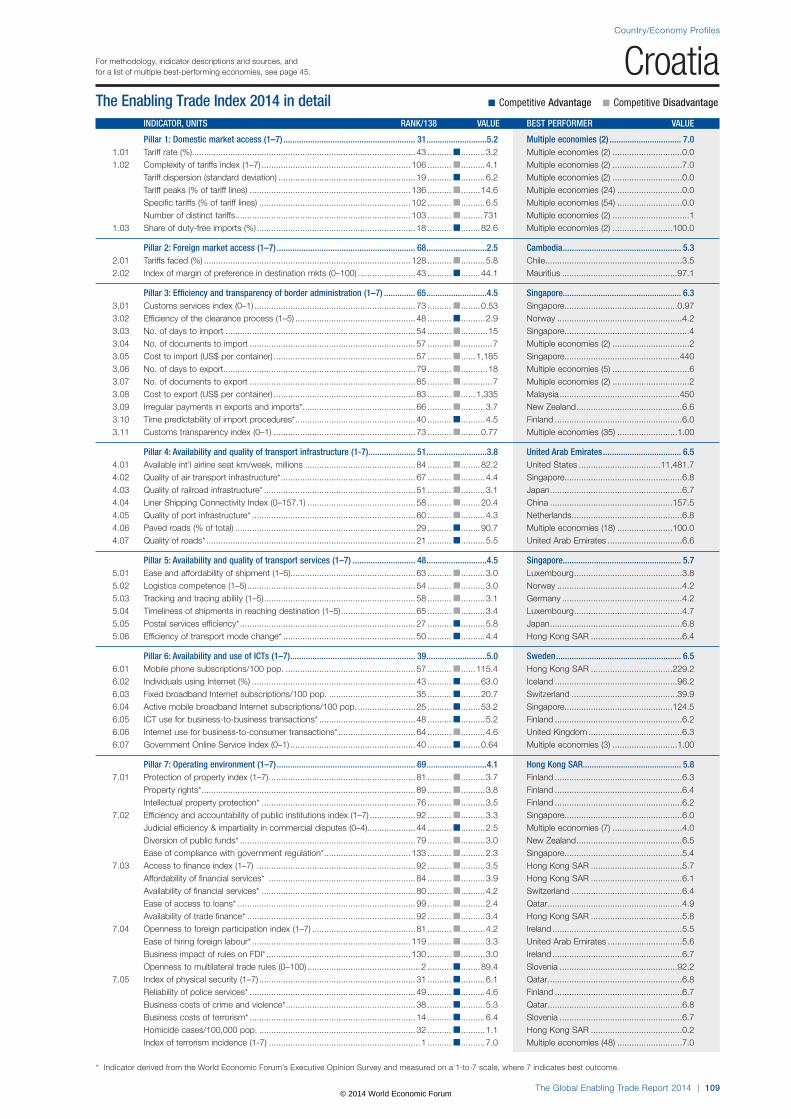
Country/Economy Profiles
The Global Enabling Trade Report 2014 | 109
* Indicator derived from the World Economic Forum’s Executive Opinion Survey and measured on a 1-to-7 scale, where 7 indicates best outcome.
The Enabling Trade Index 2014 in detail n Competitive Advantage n Competitive Disadvantage
For methodology, indicator descriptions and sources, and for a list of multiple best-performing economies, see page 45. Croatia
INDICATOR, UNITS RANK/138 VALUE BEST PERFORMER VALUE
Pillar 1: Domestic market access (1–7) ........................................................... 31 ...........................5.2 Multiple economies (2) ................................ 7.0 1.01 Tariff rate (%)............................................................................................. 43 .......... n ..........3.2 Multiple economies (2) .............................0.0 1.02 Complexity of tariffs index (1–7) .............................................................. 106 .......... n ..........4.1 Multiple economies (2) .............................7.0
Tariff dispersion (standard deviation) ......................................................... 19 .......... n ..........6.2 Multiple economies (2) .............................0.0Tariff peaks (% of tariff lines) ................................................................... 136 .......... n ........14.6 Multiple economies (24) ...........................0.0Specific tariffs (% of tariff lines) ............................................................... 102 .......... n ..........6.5 Multiple economies (54) ...........................0.0Number of distinct tariffs ......................................................................... 103 .......... n .........731 Multiple economies (2) ................................1
1.03 Share of duty-free imports (%) .................................................................. 18 .......... n ........82.6 Multiple economies (2) .........................100.0
Pillar 2: Foreign market access (1–7) .............................................................. 68 ...........................2.5 Cambodia ..................................................... 5.3 2.01 Tariffs faced (%) ...................................................................................... 128 .......... n ..........5.8 Chile .........................................................3.5 2.02 Index of margin of preference in destination mkts (0–100) ........................ 43 .......... n ........44.1 Mauritius ................................................97.1
Pillar 3: Efficiency and transparency of border administration (1–7) .............. 65 ...........................4.5 Singapore..................................................... 6.3 3.01 Customs services index (0–1) ................................................................... 73 .......... n ........0.53 Singapore...............................................0.97 3.02 Efficiency of the clearance process (1–5) .................................................. 48 .......... n ..........2.9 Norway ....................................................4.2 3.03 No. of days to import ............................................................................... 54 .......... n ...........15 Singapore....................................................4 3.04 No. of documents to import ..................................................................... 57 .......... n .............7 Multiple economies (2) ................................2 3.05 Cost to import (US$ per container) ........................................................... 57 .......... n ......1,185 Singapore................................................440 3.06 No. of days to export................................................................................ 79 .......... n ...........18 Multiple economies (5) ................................6 3.07 No. of documents to export ..................................................................... 85 .......... n .............7 Multiple economies (2) ................................2 3.08 Cost to export (US$ per container) ........................................................... 83 .......... n ......1,335 Malaysia ..................................................450 3.09 Irregular payments in exports and imports*............................................... 66 .......... n ..........3.7 New Zealand ............................................6.6 3.10 Time predictability of import procedures* .................................................. 40 .......... n ..........4.5 Finland .....................................................6.0 3.11 Customs transparency index (0–1) ........................................................... 73 .......... n ........0.77 Multiple economies (35) .........................1.00
Pillar 4: Availability and quality of transport infrastructure (1-7) ..................... 51 ...........................3.8 United Arab Emirates ................................... 6.5 4.01 Available int’l airline seat km/week, millions .............................................. 84 .......... n ........82.2 United States ..................................11,481.7 4.02 Quality of air transport infrastructure* ........................................................ 67 .......... n ..........4.4 Singapore.................................................6.8 4.03 Quality of railroad infrastructure* ............................................................... 51 .......... n ..........3.1 Japan .......................................................6.7 4.04 Liner Shipping Connectivity Index (0–157.1) ............................................. 58 .......... n ........20.4 China ...................................................157.5 4.05 Quality of port infrastructure* .................................................................... 60 .......... n ..........4.3 Netherlands ..............................................6.8 4.06 Paved roads (% of total) ........................................................................... 29 .......... n ........90.7 Multiple economies (18) .......................100.0 4.07 Quality of roads* ....................................................................................... 21 .......... n ..........5.5 United Arab Emirates ...............................6.6
Pillar 5: Availability and quality of transport services (1–7) ............................ 48 ...........................4.5 Singapore..................................................... 5.7 5.01 Ease and affordability of shipment (1–5).................................................... 63 .......... n ..........3.0 Luxembourg .............................................3.8 5.02 Logistics competence (1–5) ...................................................................... 54 .......... n ..........3.0 Norway ....................................................4.2 5.03 Tracking and tracing ability (1–5) ............................................................... 58 .......... n ..........3.1 Germany ..................................................4.2 5.04 Timeliness of shipments in reaching destination (1–5) ............................... 65 .......... n ..........3.4 Luxembourg .............................................4.7 5.05 Postal services efficiency* ......................................................................... 27 .......... n ..........5.8 Japan .......................................................6.8 5.06 Efficiency of transport mode change* ....................................................... 50 .......... n ..........4.4 Hong Kong SAR ......................................6.4
Pillar 6: Availability and use of ICTs (1–7) ........................................................ 39 ...........................5.0 Sweden ........................................................ 6.5 6.01 Mobile phone subscriptions/100 pop. ...................................................... 57 .......... n ......115.4 Hong Kong SAR ..................................229.2 6.02 Individuals using Internet (%) .................................................................... 43 .......... n ........63.0 Iceland ...................................................96.2 6.03 Fixed broadband Internet subscriptions/100 pop. .................................... 35 .......... n ........20.7 Switzerland ............................................39.9 6.04 Active mobile broadband Internet subscriptions/100 pop. ........................ 25 .......... n ........53.2 Singapore.............................................124.5 6.05 ICT use for business-to-business transactions* ........................................ 48 .......... n ..........5.2 Finland .....................................................6.2 6.06 Internet use for business-to-consumer transactions* ................................ 64 .......... n ..........4.6 United Kingdom .......................................6.3 6.07 Government Online Service Index (0–1) .................................................... 40 .......... n ........0.64 Multiple economies (3) ...........................1.00
Pillar 7: Operating environment (1–7) .............................................................. 69 ...........................4.1 Hong Kong SAR ............................................ 5.8 7.01 Protection of property index (1–7) ............................................................. 81 .......... n ..........3.7 Finland .....................................................6.3
Property rights* ......................................................................................... 89 .......... n ..........3.8 Finland .....................................................6.4Intellectual property protection* ................................................................ 76 .......... n ..........3.5 Finland .....................................................6.2
7.02 Efficiency and accountability of public institutions index (1–7) ................... 92 .......... n ..........3.3 Singapore.................................................6.0Judicial efficiency & impartiality in commercial disputes (0–4).................... 44 .......... n ..........2.5 Multiple economies (7) .............................4.0Diversion of public funds* ......................................................................... 79 .......... n ..........3.0 New Zealand ............................................6.5Ease of compliance with government regulation* .................................... 133 .......... n ..........2.3 Singapore.................................................5.4
7.03 Access to finance index (1–7) .................................................................. 92 .......... n ..........3.5 Hong Kong SAR ......................................5.7Affordability of financial services* ............................................................. 84 .......... n ..........3.9 Hong Kong SAR ......................................6.1Availability of financial services* ................................................................ 80 .......... n ..........4.2 Switzerland ..............................................6.4Ease of access to loans* .......................................................................... 99 .......... n ..........2.4 Qatar ........................................................4.9Availability of trade finance* ...................................................................... 92 .......... n ..........3.4 Hong Kong SAR ......................................5.8
7.04 Openness to foreign participation index (1–7) ........................................... 81 .......... n ..........4.2 Ireland ......................................................5.5Ease of hiring foreign labour* .................................................................. 119 .......... n ..........3.3 United Arab Emirates ...............................5.6Business impact of rules on FDI* ............................................................ 130 .......... n ..........3.0 Ireland ......................................................6.7Openness to multilateral trade rules (0–100) ............................................... 2 .......... n ........89.4 Slovenia .................................................92.2
7.05 Index of physical security (1–7) ................................................................. 31 .......... n ..........6.1 Qatar ........................................................6.8Reliability of police services* ..................................................................... 49 .......... n ..........4.6 Finland .....................................................6.7Business costs of crime and violence* ...................................................... 38 .......... n ..........5.3 Qatar ........................................................6.8Business costs of terrorism* ..................................................................... 14 .......... n ..........6.4 Slovenia ...................................................6.7Homicide cases/100,000 pop. ................................................................. 32 .......... n ..........1.1 Hong Kong SAR ......................................0.2Index of terrorism incidence (1-7) ............................................................... 1 .......... n ..........7.0 Multiple economies (48) ...........................7.0
© 2014 World Economic Forum

Country/Economy Profiles
110 | The Global Enabling Trade Report 2014
* From the list of factors above, respondents were asked to select the five most problematic for trading in their country and to rank them between 1 (most problematic) and 5. The bars in the figure show the responses weighted according to their rankings.
For methodology, indicator descriptions and sources, and for a list of multiple best-performing economies, see page 45.
0 105 15 20 25 30
0 5 10 15 20 25 30
2
3
4
5
6
7
Operating environment
Availability & use of ICTs
Availability & quality of transport services
Availability & quality of transport infrastructure
Efficiency & transparency of border administration
Foreign market access
Domestic market access
1
Enabling Trade Index 2014 Rank Score (out of 138) (1–7)
Enabling Trade Index 2014 .................... 37 ..... 4.4
Subindex A: Market access (25%) ....................75 .......3.4Pillar 1: Domestic market access .....................................46 .........4.9Pillar 2: Foreign market access ........................................97 .........1.9
Subindex B: Border administration (25%) ........42 .......5.1Pillar 3: Efficiency & transparency of border administration ...................................................42 .........5.1
Subindex C: Infrastructure (25%) ......................48 .......4.3Pillar 4: Availability & quality of transport infrastructure ... 41 .........4.0Pillar 5: Availability & quality of transport services ...........45 ........ 4.5Pillar 6: Availability & use of ICTs .....................................53 ........ 4.5
Subindex D: Operating environment (25%) ......29 .......5.0Pillar 7: Operating environment ........................................29 .........5.0
Key indicators, 2012 Rank/138
Population (millions) .............................................................. 0.9 ......... 132GDP (US$ billions) .............................................................. 23.0 ........... 95GDP per capita (US$) .................................................. 26,389.0 ........... 28
Merchandise tradeTrade openness (imports+exports)/GDP ............................ 39.4 ......... 123Share of world trade (%) ..................................................... 0.02 ......... 109Total Exports (US$ billions) ....................................................1.7 ......... 122Total Imports (US$ billions) ....................................................7.3 ......... 102
Value chain indicators, 2012Share (%) of merchandise trade Exports Imports
Capital goods ..................................................................... 3.7 .......... 7.5
Intermediate goods .......................................................... 35.9 ........26.0Food and beverages (industrial) ......................................1.5 .......... 1.8Industrial supplies (primary and processed) .................31.9 ........ 18.5Parts and accessories .....................................................2.4 .......... 4.8Fuels and lubricants ....................................................... 0.0 .......... 0.9
Consumer goods .............................................................. 59.9 ........33.4Food and beverages (consumer) .................................. 29.8 .........11.4Transport equipment and consumer goods ..................30.1 ........ 22.0
Passenger motor cars ........................................................ 0.0 ..........3.8
Others .................................................................................. 0.6 ........29.2
The most problematic factors for trade, 2013Most problematic factors for exporting Score*
Identifying potential markets and buyers .............................................................. 20.4Access to imported inputs at competitive prices ..................................................14.6Access to trade finance .........................................................................................14.0Inappropriate production technology and skills .....................................................11.8Difficulties in meeting quality/quantity requirements of buyers .............................. 11.1High cost or delays caused by domestic transportation ........................................ 8.3High cost or delays caused by international transportation ................................... 5.3Technical requirements and standards abroad .......................................................4.7Rules of origin requirements abroad ....................................................................... 3.0Burdensome procedures at foreign borders .......................................................... 3.0Tariff barriers abroad .............................................................................................. 2.4Corruption at foreign borders ..................................................................................1.4
Most problematic factors for importing Score*
Burdensome import procedures .......................................................................... 23.9High cost or delays caused by international transportation ..................................19.6Tariffs ..................................................................................................................... 17.7High cost or delays caused by domestic transportation .......................................14.9Domestic technical requirements and standards ..................................................14.2Corruption at the border ......................................................................................... 4.6Inappropriate telecommunications infrastructure ................................................... 3.4Crime and theft ........................................................................................................1.7
Cyprus
Sources: International Monetary Fund, World Bank, World Trade Organization, United Nations COMTRADE
Cyprus
Advanced economies
© 2014 World Economic Forum

Country/Economy Profiles
The Global Enabling Trade Report 2014 | 111
* Indicator derived from the World Economic Forum’s Executive Opinion Survey and measured on a 1-to-7 scale, where 7 indicates best outcome.
The Enabling Trade Index 2014 in detail n Competitive Advantage n Competitive Disadvantage
For methodology, indicator descriptions and sources, and for a list of multiple best-performing economies, see page 45. Cyprus
INDICATOR, UNITS RANK/138 VALUE BEST PERFORMER VALUE
Pillar 1: Domestic market access (1–7) ........................................................... 46 ...........................4.9 Multiple economies (2) ................................ 7.0 1.01 Tariff rate (%)............................................................................................... 5 .......... n ..........0.8 Multiple economies (2) .............................0.0 1.02 Complexity of tariffs index (1–7) .............................................................. 110 .......... n ..........3.1 Multiple economies (2) .............................7.0
Tariff dispersion (standard deviation) ......................................................... 55 .......... n ..........8.4 Multiple economies (2) .............................0.0Tariff peaks (% of tariff lines) ................................................................... 104 .......... n ........10.6 Multiple economies (24) ...........................0.0Specific tariffs (% of tariff lines) ............................................................... 107 .......... n ........11.0 Multiple economies (54) ...........................0.0Number of distinct tariffs ......................................................................... 109 .......... n ......1,755 Multiple economies (2) ................................1
1.03 Share of duty-free imports (%) .................................................................. 42 .......... n ........65.4 Multiple economies (2) .........................100.0
Pillar 2: Foreign market access (1–7) .............................................................. 97 ...........................1.9 Cambodia ..................................................... 5.3 2.01 Tariffs faced (%) ........................................................................................ 73 .......... n ..........5.5 Chile .........................................................3.5 2.02 Index of margin of preference in destination mkts (0–100) ........................ 96 .......... n ..........9.1 Mauritius ................................................97.1
Pillar 3: Efficiency and transparency of border administration (1–7) .............. 42 ...........................5.1 Singapore..................................................... 6.3 3.01 Customs services index (0–1) ................................................................... 52 .......... n ........0.64 Singapore...............................................0.97 3.02 Efficiency of the clearance process (1–5) .................................................. 51 .......... n ..........2.9 Norway ....................................................4.2 3.03 No. of days to import ................................................................................. 2 .......... n .............5 Singapore....................................................4 3.04 No. of documents to import ..................................................................... 57 .......... n .............7 Multiple economies (2) ................................2 3.05 Cost to import (US$ per container) ........................................................... 44 .......... n ......1,010 Singapore................................................440 3.06 No. of days to export.................................................................................. 6 .......... n .............7 Multiple economies (5) ................................6 3.07 No. of documents to export ..................................................................... 40 .......... n .............5 Multiple economies (2) ................................2 3.08 Cost to export (US$ per container) ........................................................... 35 .......... n .........865 Malaysia ..................................................450 3.09 Irregular payments in exports and imports*............................................... 34 .......... n ..........5.0 New Zealand ............................................6.6 3.10 Time predictability of import procedures* .................................................. 27 .......... n ..........4.9 Finland .....................................................6.0 3.11 Customs transparency index (0–1) ........................................................... 78 .......... n ........0.73 Multiple economies (35) .........................1.00
Pillar 4: Availability and quality of transport infrastructure (1-7) ..................... 41 ...........................4.0 United Arab Emirates ................................... 6.5 4.01 Available int’l airline seat km/week, millions .............................................. 64 .......... n ......173.4 United States ..................................11,481.7 4.02 Quality of air transport infrastructure* ........................................................ 41 .......... n ..........5.3 Singapore.................................................6.8 4.03 Quality of railroad infrastructure* .............................................................. n/a ........................n/a Japan .......................................................6.7 4.04 Liner Shipping Connectivity Index (0–157.1) ............................................. 67 .......... n ........16.4 China ...................................................157.5 4.05 Quality of port infrastructure* .................................................................... 42 .......... n ..........4.8 Netherlands ..............................................6.8 4.06 Paved roads (% of total) ........................................................................... 56 .......... n ........65.4 Multiple economies (18) .......................100.0 4.07 Quality of roads* ....................................................................................... 25 .......... n ..........5.4 United Arab Emirates ...............................6.6
Pillar 5: Availability and quality of transport services (1–7) ............................ 45 ...........................4.5 Singapore..................................................... 5.7 5.01 Ease and affordability of shipment (1–5).................................................... 61 .......... n ..........3.0 Luxembourg .............................................3.8 5.02 Logistics competence (1–5) ...................................................................... 63 .......... n ..........2.9 Norway ....................................................4.2 5.03 Tracking and tracing ability (1–5) ............................................................... 64 .......... n ..........3.0 Germany ..................................................4.2 5.04 Timeliness of shipments in reaching destination (1–5) ............................... 68 .......... n ..........3.3 Luxembourg .............................................4.7 5.05 Postal services efficiency* ......................................................................... 26 .......... n ..........5.9 Japan .......................................................6.8 5.06 Efficiency of transport mode change* ....................................................... 36 .......... n ..........4.9 Hong Kong SAR ......................................6.4
Pillar 6: Availability and use of ICTs (1–7) ........................................................ 53 ...........................4.5 Sweden ........................................................ 6.5 6.01 Mobile phone subscriptions/100 pop. ...................................................... 86 .......... n ........98.4 Hong Kong SAR ..................................229.2 6.02 Individuals using Internet (%) .................................................................... 46 .......... n ........61.0 Iceland ...................................................96.2 6.03 Fixed broadband Internet subscriptions/100 pop. .................................... 36 .......... n ........19.2 Switzerland ............................................39.9 6.04 Active mobile broadband Internet subscriptions/100 pop. ........................ 45 .......... n ........33.8 Singapore.............................................124.5 6.05 ICT use for business-to-business transactions* ........................................ 73 .......... n ..........4.8 Finland .....................................................6.2 6.06 Internet use for business-to-consumer transactions* ................................ 52 .......... n ..........4.9 United Kingdom .......................................6.3 6.07 Government Online Service Index (0–1) .................................................... 50 .......... n ........0.56 Multiple economies (3) ...........................1.00
Pillar 7: Operating environment (1–7) .............................................................. 29 ...........................5.0 Hong Kong SAR ............................................ 5.8 7.01 Protection of property index (1–7) ............................................................. 38 .......... n ..........4.6 Finland .....................................................6.3
Property rights* ......................................................................................... 44 .......... n ..........4.7 Finland .....................................................6.4Intellectual property protection* ................................................................ 37 .......... n ..........4.4 Finland .....................................................6.2
7.02 Efficiency and accountability of public institutions index (1–7) ................... 12 .......... n ..........5.2 Singapore.................................................6.0Judicial efficiency & impartiality in commercial disputes (0–4)...................... 1 .......... n ..........4.0 Multiple economies (7) .............................4.0Diversion of public funds* ......................................................................... 33 .......... n ..........4.5 New Zealand ............................................6.5Ease of compliance with government regulation* ...................................... 22 .......... n ..........4.1 Singapore.................................................5.4
7.03 Access to finance index (1–7) .................................................................. 45 .......... n ..........4.1 Hong Kong SAR ......................................5.7Affordability of financial services* ............................................................. 44 .......... n ..........4.5 Hong Kong SAR ......................................6.1Availability of financial services* ................................................................ 43 .......... n ..........5.0 Switzerland ..............................................6.4Ease of access to loans* .......................................................................... 76 .......... n ..........2.7 Qatar ........................................................4.9Availability of trade finance* ...................................................................... 39 .......... n ..........4.2 Hong Kong SAR ......................................5.8
7.04 Openness to foreign participation index (1–7) ........................................... 24 .......... n ..........4.9 Ireland ......................................................5.5Ease of hiring foreign labour* .................................................................... 34 .......... n ..........4.4 United Arab Emirates ...............................5.6Business impact of rules on FDI* .............................................................. 49 .......... n ..........4.7 Ireland ......................................................6.7Openness to multilateral trade rules (0–100) ............................................. 23 .......... n ........79.2 Slovenia .................................................92.2
7.05 Index of physical security (1–7) ................................................................. 32 .......... n ..........6.0 Qatar ........................................................6.8Reliability of police services* ..................................................................... 42 .......... n ..........4.8 Finland .....................................................6.7Business costs of crime and violence* ...................................................... 28 .......... n ..........5.5 Qatar ........................................................6.8Business costs of terrorism* ..................................................................... 41 .......... n ..........6.0 Slovenia ...................................................6.7Homicide cases/100,000 pop. ................................................................. 15 .......... n ..........0.8 Hong Kong SAR ......................................0.2Index of terrorism incidence (1-7) ............................................................. 49 .......... n ..........7.0 Multiple economies (48) ...........................7.0
© 2014 World Economic Forum

Country/Economy Profiles
112 | The Global Enabling Trade Report 2014
* From the list of factors above, respondents were asked to select the five most problematic for trading in their country and to rank them between 1 (most problematic) and 5. The bars in the figure show the responses weighted according to their rankings.
For methodology, indicator descriptions and sources, and for a list of multiple best-performing economies, see page 45.
0 105 15 20 25 30
0 5 10 15 20 25 30
2
3
4
5
6
7
Operating environment
Availability & use of ICTs
Availability & quality of transport services
Availability & quality of transport infrastructure
Efficiency & transparency of border administration
Foreign market access
Domestic market access
1
Enabling Trade Index 2014 Rank Score (out of 138) (1–7)
Enabling Trade Index 2014 .................... 39 ..... 4.4
Subindex A: Market access (25%) ....................75 .......3.4Pillar 1: Domestic market access .....................................46 .........4.9Pillar 2: Foreign market access ........................................97 .........1.9
Subindex B: Border administration (25%) ........37 .......5.1Pillar 3: Efficiency & transparency of border administration ...................................................37 .........5.1
Subindex C: Infrastructure (25%) ......................28 .......4.9Pillar 4: Availability & quality of transport infrastructure ...25 ........ 4.5Pillar 5: Availability & quality of transport services ...........29 .........5.0Pillar 6: Availability & use of ICTs .....................................31 ........ 5.2
Subindex D: Operating environment (25%) ......60 .......4.3Pillar 7: Operating environment ........................................60 ........ 4.3
Key indicators, 2012 Rank/138
Population (millions) .............................................................10.5 ........... 72GDP (US$ billions) .............................................................195.7 ........... 51GDP per capita (US$) ...................................................18,624.3 ........... 38
Merchandise tradeTrade openness (imports+exports)/GDP ........................... 151.9 ............. 9Share of world trade (%) ..................................................... 0.80 ........... 31Total Exports (US$ billions) ................................................156.6 ........... 31Total Imports (US$ billions) ................................................140.7 ........... 31
Value chain indicators, 2012Share (%) of merchandise trade Exports Imports
Capital goods ................................................................... 20.6 ........ 16.6
Intermediate goods .......................................................... 53.6 ........ 63.1Food and beverages (industrial) ......................................1.1 .......... 0.6Industrial supplies (primary and processed) ................ 26.3 ........ 30.6Parts and accessories .................................................. 23.5 ........ 23.3Fuels and lubricants ....................................................... 2.8 .......... 8.6
Consumer goods ...............................................................15.1 ........ 16.9Food and beverages (consumer) .....................................2.7 .......... 4.6Transport equipment and consumer goods ..................12.4 ........ 12.3
Passenger motor cars ........................................................ 9.7 .......... 1.8
Others .................................................................................. 0.9 .......... 1.6
The most problematic factors for trade, 2013Most problematic factors for exporting Score*
Identifying potential markets and buyers .............................................................. 22.3Access to trade finance .........................................................................................14.3Access to imported inputs at competitive prices .................................................. 11.7Technical requirements and standards abroad .....................................................10.1Rules of origin requirements abroad ........................................................................7.2Difficulties in meeting quality/quantity requirements of buyers ............................... 6.9High cost or delays caused by international transportation ................................... 6.5Inappropriate production technology and skills ...................................................... 6.2Tariff barriers abroad ...............................................................................................5.7Burdensome procedures at foreign borders .......................................................... 4.4High cost or delays caused by domestic transportation ........................................ 3.4Corruption at foreign borders ..................................................................................1.4
Most problematic factors for importing Score*
Burdensome import procedures ...........................................................................24.9High cost or delays caused by international transportation ..................................24.0Tariffs .....................................................................................................................19.0Domestic technical requirements and standards .................................................. 17.1High cost or delays caused by domestic transportation ......................................... 7.1Crime and theft ....................................................................................................... 4.3Inappropriate telecommunications infrastructure ....................................................2.1Corruption at the border ..........................................................................................1.4
Czech Republic
Sources: International Monetary Fund, World Bank, World Trade Organization, United Nations COMTRADE
Czech Republic
Advanced economies
© 2014 World Economic Forum

Country/Economy Profiles
The Global Enabling Trade Report 2014 | 113
* Indicator derived from the World Economic Forum’s Executive Opinion Survey and measured on a 1-to-7 scale, where 7 indicates best outcome.
The Enabling Trade Index 2014 in detail n Competitive Advantage n Competitive Disadvantage
For methodology, indicator descriptions and sources, and for a list of multiple best-performing economies, see page 45. Czech Republic
INDICATOR, UNITS RANK/138 VALUE BEST PERFORMER VALUE
Pillar 1: Domestic market access (1–7) ........................................................... 46 ...........................4.9 Multiple economies (2) ................................ 7.0 1.01 Tariff rate (%)............................................................................................... 5 .......... n ..........0.8 Multiple economies (2) .............................0.0 1.02 Complexity of tariffs index (1–7) .............................................................. 110 .......... n ..........3.1 Multiple economies (2) .............................7.0
Tariff dispersion (standard deviation) ......................................................... 55 .......... n ..........8.4 Multiple economies (2) .............................0.0Tariff peaks (% of tariff lines) ................................................................... 104 .......... n ........10.6 Multiple economies (24) ...........................0.0Specific tariffs (% of tariff lines) ............................................................... 107 .......... n ........11.0 Multiple economies (54) ...........................0.0Number of distinct tariffs ......................................................................... 109 .......... n ......1,755 Multiple economies (2) ................................1
1.03 Share of duty-free imports (%) .................................................................. 42 .......... n ........65.4 Multiple economies (2) .........................100.0
Pillar 2: Foreign market access (1–7) .............................................................. 97 ...........................1.9 Cambodia ..................................................... 5.3 2.01 Tariffs faced (%) ........................................................................................ 73 .......... n ..........5.5 Chile .........................................................3.5 2.02 Index of margin of preference in destination mkts (0–100) ........................ 96 .......... n ..........9.1 Mauritius ................................................97.1
Pillar 3: Efficiency and transparency of border administration (1–7) .............. 37 ...........................5.1 Singapore..................................................... 6.3 3.01 Customs services index (0–1) ................................................................... 28 .......... n ........0.73 Singapore...............................................0.97 3.02 Efficiency of the clearance process (1–5) .................................................. 33 .......... n ..........3.2 Norway ....................................................4.2 3.03 No. of days to import ............................................................................... 64 .......... n ...........17 Singapore....................................................4 3.04 No. of documents to import ..................................................................... 43 .......... n .............6 Multiple economies (2) ................................2 3.05 Cost to import (US$ per container) ........................................................... 58 .......... n ......1,190 Singapore................................................440 3.06 No. of days to export................................................................................ 71 .......... n ...........17 Multiple economies (5) ................................6 3.07 No. of documents to export ..................................................................... 16 .......... n .............4 Multiple economies (2) ................................2 3.08 Cost to export (US$ per container) ........................................................... 75 .......... n ......1,215 Malaysia ..................................................450 3.09 Irregular payments in exports and imports*............................................... 56 .......... n ..........3.9 New Zealand ............................................6.6 3.10 Time predictability of import procedures* .................................................. 37 .......... n ..........4.5 Finland .....................................................6.0 3.11 Customs transparency index (0–1) ............................................................. 1 .......... n ........1.00 Multiple economies (35) .........................1.00
Pillar 4: Availability and quality of transport infrastructure (1-7) ..................... 25 ...........................4.5 United Arab Emirates ................................... 6.5 4.01 Available int’l airline seat km/week, millions .............................................. 60 .......... n ......194.3 United States ..................................11,481.7 4.02 Quality of air transport infrastructure* ........................................................ 20 .......... n ..........5.8 Singapore.................................................6.8 4.03 Quality of railroad infrastructure* ............................................................... 21 .......... n ..........4.6 Japan .......................................................6.7 4.04 Liner Shipping Connectivity Index (0–157.1) ............................................ n/a ........................n/a China ...................................................157.5 4.05 Quality of port infrastructure* .................................................................... 56 .......... n ..........4.4 Netherlands ..............................................6.8 4.06 Paved roads (% of total) ............................................................................. 1 .......... n ......100.0 Multiple economies (18) .......................100.0 4.07 Quality of roads* ....................................................................................... 73 .......... n ..........3.7 United Arab Emirates ...............................6.6
Pillar 5: Availability and quality of transport services (1–7) ............................ 29 ...........................5.0 Singapore..................................................... 5.7 5.01 Ease and affordability of shipment (1–5).................................................... 13 .......... n ..........3.6 Luxembourg .............................................3.8 5.02 Logistics competence (1–5) ...................................................................... 29 .......... n ..........3.5 Norway ....................................................4.2 5.03 Tracking and tracing ability (1–5) ............................................................... 25 .......... n ..........3.6 Germany ..................................................4.2 5.04 Timeliness of shipments in reaching destination (1–5) ............................... 39 .......... n ..........3.7 Luxembourg .............................................4.7 5.05 Postal services efficiency* ......................................................................... 37 .......... n ..........5.5 Japan .......................................................6.8 5.06 Efficiency of transport mode change* ....................................................... 23 .......... n ..........5.1 Hong Kong SAR ......................................6.4
Pillar 6: Availability and use of ICTs (1–7) ........................................................ 31 ...........................5.2 Sweden ........................................................ 6.5 6.01 Mobile phone subscriptions/100 pop. ...................................................... 39 .......... n ......126.9 Hong Kong SAR ..................................229.2 6.02 Individuals using Internet (%) .................................................................... 28 .......... n ........75.0 Iceland ...................................................96.2 6.03 Fixed broadband Internet subscriptions/100 pop. .................................... 39 .......... n ........16.4 Switzerland ............................................39.9 6.04 Active mobile broadband Internet subscriptions/100 pop. ........................ 36 .......... n ........43.6 Singapore.............................................124.5 6.05 ICT use for business-to-business transactions* ........................................ 24 .......... n ..........5.7 Finland .....................................................6.2 6.06 Internet use for business-to-consumer transactions* .................................. 9 .......... n ..........5.8 United Kingdom .......................................6.3 6.07 Government Online Service Index (0–1) .................................................... 52 .......... n ........0.54 Multiple economies (3) ...........................1.00
Pillar 7: Operating environment (1–7) .............................................................. 60 ...........................4.3 Hong Kong SAR ............................................ 5.8 7.01 Protection of property index (1–7) ............................................................. 70 .......... n ..........3.9 Finland .....................................................6.3
Property rights* ......................................................................................... 82 .......... n ..........3.9 Finland .....................................................6.4Intellectual property protection* ................................................................ 56 .......... n ..........3.8 Finland .....................................................6.2
7.02 Efficiency and accountability of public institutions index (1–7) ................. 103 .......... n ..........3.2 Singapore.................................................6.0Judicial efficiency & impartiality in commercial disputes (0–4).................... 55 .......... n ..........2.3 Multiple economies (7) .............................4.0Diversion of public funds* ....................................................................... 107 .......... n ..........2.4 New Zealand ............................................6.5Ease of compliance with government regulation* .................................... 125 .......... n ..........2.6 Singapore.................................................5.4
7.03 Access to finance index (1–7) .................................................................. 57 .......... n ..........3.9 Hong Kong SAR ......................................5.7Affordability of financial services* ............................................................. 81 .......... n ..........4.0 Hong Kong SAR ......................................6.1Availability of financial services* ................................................................ 56 .......... n ..........4.7 Switzerland ..............................................6.4Ease of access to loans* .......................................................................... 55 .......... n ..........3.0 Qatar ........................................................4.9Availability of trade finance* ...................................................................... 55 .......... n ..........4.0 Hong Kong SAR ......................................5.8
7.04 Openness to foreign participation index (1–7) ........................................... 43 .......... n ..........4.6 Ireland ......................................................5.5Ease of hiring foreign labour* .................................................................... 93 .......... n ..........3.8 United Arab Emirates ...............................5.6Business impact of rules on FDI* .............................................................. 52 .......... n ..........4.7 Ireland ......................................................6.7Openness to multilateral trade rules (0–100) ............................................. 32 .......... n ........76.2 Slovenia .................................................92.2
7.05 Index of physical security (1–7) ................................................................. 45 .......... n ..........5.9 Qatar ........................................................6.8Reliability of police services* ..................................................................... 83 .......... n ..........3.9 Finland .....................................................6.7Business costs of crime and violence* ...................................................... 52 .......... n ..........5.0 Qatar ........................................................6.8Business costs of terrorism* ..................................................................... 15 .......... n ..........6.4 Slovenia ...................................................6.7Homicide cases/100,000 pop. ................................................................. 12 .......... n ..........0.8 Hong Kong SAR ......................................0.2Index of terrorism incidence (1-7) ............................................................. 49 .......... n ..........7.0 Multiple economies (48) ...........................7.0
© 2014 World Economic Forum
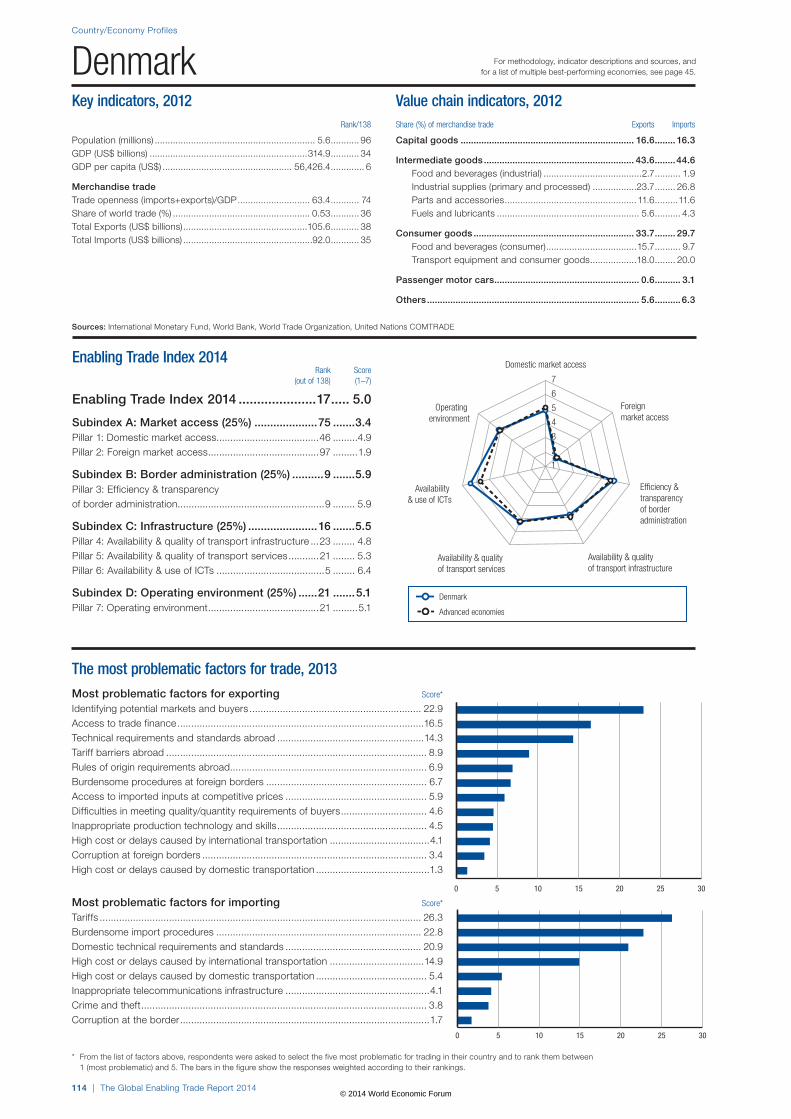
Country/Economy Profiles
114 | The Global Enabling Trade Report 2014
* From the list of factors above, respondents were asked to select the five most problematic for trading in their country and to rank them between 1 (most problematic) and 5. The bars in the figure show the responses weighted according to their rankings.
For methodology, indicator descriptions and sources, and for a list of multiple best-performing economies, see page 45.
0 105 15 20 25 30
0 5 10 15 20 25 30
2
3
4
5
6
7
Operating environment
Availability & use of ICTs
Availability & quality of transport services
Availability & quality of transport infrastructure
Efficiency & transparency of border administration
Foreign market access
Domestic market access
1
Enabling Trade Index 2014 Rank Score (out of 138) (1–7)
Enabling Trade Index 2014 .....................17 ..... 5.0
Subindex A: Market access (25%) ....................75 .......3.4Pillar 1: Domestic market access .....................................46 .........4.9Pillar 2: Foreign market access ........................................97 .........1.9
Subindex B: Border administration (25%) ..........9 .......5.9Pillar 3: Efficiency & transparency of border administration .....................................................9 ........ 5.9
Subindex C: Infrastructure (25%) ......................16 .......5.5Pillar 4: Availability & quality of transport infrastructure ...23 ........ 4.8Pillar 5: Availability & quality of transport services ...........21 ........ 5.3Pillar 6: Availability & use of ICTs .......................................5 ........ 6.4
Subindex D: Operating environment (25%) ......21 .......5.1Pillar 7: Operating environment ........................................21 .........5.1
Key indicators, 2012 Rank/138
Population (millions) .............................................................. 5.6 ........... 96GDP (US$ billions) .............................................................314.9 ........... 34GDP per capita (US$) .................................................. 56,426.4 ............. 6
Merchandise tradeTrade openness (imports+exports)/GDP ............................ 63.4 ........... 74Share of world trade (%) ..................................................... 0.53 ........... 36Total Exports (US$ billions) ................................................105.6 ........... 38Total Imports (US$ billions) ..................................................92.0 ........... 35
Value chain indicators, 2012Share (%) of merchandise trade Exports Imports
Capital goods ................................................................... 16.6 ........ 16.3
Intermediate goods .......................................................... 43.6 ........44.6Food and beverages (industrial) ......................................2.7 .......... 1.9Industrial supplies (primary and processed) .................23.7 ........ 26.8Parts and accessories ...................................................11.6 .........11.6Fuels and lubricants ....................................................... 5.6 .......... 4.3
Consumer goods .............................................................. 33.7 ........ 29.7Food and beverages (consumer) ...................................15.7 .......... 9.7Transport equipment and consumer goods ..................18.0 ........ 20.0
Passenger motor cars ........................................................ 0.6 .......... 3.1
Others .................................................................................. 5.6 .......... 6.3
The most problematic factors for trade, 2013Most problematic factors for exporting Score*
Identifying potential markets and buyers .............................................................. 22.9Access to trade finance .........................................................................................16.5Technical requirements and standards abroad .....................................................14.3Tariff barriers abroad .............................................................................................. 8.9Rules of origin requirements abroad ....................................................................... 6.9Burdensome procedures at foreign borders .......................................................... 6.7Access to imported inputs at competitive prices ................................................... 5.9Difficulties in meeting quality/quantity requirements of buyers ............................... 4.6Inappropriate production technology and skills ...................................................... 4.5High cost or delays caused by international transportation ....................................4.1Corruption at foreign borders ................................................................................. 3.4High cost or delays caused by domestic transportation .........................................1.3
Most problematic factors for importing Score*
Tariffs .................................................................................................................... 26.3Burdensome import procedures .......................................................................... 22.8Domestic technical requirements and standards ................................................. 20.9High cost or delays caused by international transportation ..................................14.9High cost or delays caused by domestic transportation ........................................ 5.4Inappropriate telecommunications infrastructure ....................................................4.1Crime and theft ....................................................................................................... 3.8Corruption at the border ..........................................................................................1.7
Denmark
Sources: International Monetary Fund, World Bank, World Trade Organization, United Nations COMTRADE
Denmark
Advanced economies
© 2014 World Economic Forum

Country/Economy Profiles
The Global Enabling Trade Report 2014 | 115
* Indicator derived from the World Economic Forum’s Executive Opinion Survey and measured on a 1-to-7 scale, where 7 indicates best outcome.
The Enabling Trade Index 2014 in detail n Competitive Advantage n Competitive Disadvantage
For methodology, indicator descriptions and sources, and for a list of multiple best-performing economies, see page 45. Denmark
INDICATOR, UNITS RANK/138 VALUE BEST PERFORMER VALUE
Pillar 1: Domestic market access (1–7) ........................................................... 46 ...........................4.9 Multiple economies (2) ................................ 7.0 1.01 Tariff rate (%)............................................................................................... 5 .......... n ..........0.8 Multiple economies (2) .............................0.0 1.02 Complexity of tariffs index (1–7) .............................................................. 110 .......... n ..........3.1 Multiple economies (2) .............................7.0
Tariff dispersion (standard deviation) ......................................................... 55 .......... n ..........8.4 Multiple economies (2) .............................0.0Tariff peaks (% of tariff lines) ................................................................... 104 .......... n ........10.6 Multiple economies (24) ...........................0.0Specific tariffs (% of tariff lines) ............................................................... 107 .......... n ........11.0 Multiple economies (54) ...........................0.0Number of distinct tariffs ......................................................................... 109 .......... n ......1,755 Multiple economies (2) ................................1
1.03 Share of duty-free imports (%) .................................................................. 42 .......... n ........65.4 Multiple economies (2) .........................100.0
Pillar 2: Foreign market access (1–7) .............................................................. 97 ...........................1.9 Cambodia ..................................................... 5.3 2.01 Tariffs faced (%) ........................................................................................ 73 .......... n ..........5.5 Chile .........................................................3.5 2.02 Index of margin of preference in destination mkts (0–100) ........................ 96 .......... n ..........9.1 Mauritius ................................................97.1
Pillar 3: Efficiency and transparency of border administration (1–7) ................ 9 ...........................5.9 Singapore..................................................... 6.3 3.01 Customs services index (0–1) ................................................................... 27 .......... n ........0.73 Singapore...............................................0.97 3.02 Efficiency of the clearance process (1–5) .................................................. 13 .......... n ..........3.8 Norway ....................................................4.2 3.03 No. of days to import ................................................................................. 2 .......... n .............5 Singapore....................................................4 3.04 No. of documents to import ....................................................................... 3 .......... n .............3 Multiple economies (2) ................................2 3.05 Cost to import (US$ per container) ........................................................... 20 .......... n .........745 Singapore................................................440 3.06 No. of days to export.................................................................................. 1 .......... n .............6 Multiple economies (5) ................................6 3.07 No. of documents to export ..................................................................... 16 .......... n .............4 Multiple economies (2) ................................2 3.08 Cost to export (US$ per container) ........................................................... 31 .......... n .........795 Malaysia ..................................................450 3.09 Irregular payments in exports and imports*............................................... 21 .......... n ..........5.5 New Zealand ............................................6.6 3.10 Time predictability of import procedures* .................................................. 18 .......... n ..........5.2 Finland .....................................................6.0 3.11 Customs transparency index (0–1) ............................................................. 1 .......... n ........1.00 Multiple economies (35) .........................1.00
Pillar 4: Availability and quality of transport infrastructure (1-7) ..................... 23 ...........................4.8 United Arab Emirates ................................... 6.5 4.01 Available int’l airline seat km/week, millions .............................................. 38 .......... n ......448.5 United States ..................................11,481.7 4.02 Quality of air transport infrastructure* ........................................................ 25 .......... n ..........5.6 Singapore.................................................6.8 4.03 Quality of railroad infrastructure* ............................................................... 23 .......... n ..........4.5 Japan .......................................................6.7 4.04 Liner Shipping Connectivity Index (0–157.1) ............................................. 33 .......... n ........38.7 China ...................................................157.5 4.05 Quality of port infrastructure* .................................................................... 14 .......... n ..........5.7 Netherlands ..............................................6.8 4.06 Paved roads (% of total) ............................................................................. 1 .......... n ......100.0 Multiple economies (18) .......................100.0 4.07 Quality of roads* ....................................................................................... 22 .......... n ..........5.5 United Arab Emirates ...............................6.6
Pillar 5: Availability and quality of transport services (1–7) ............................ 21 ...........................5.3 Singapore..................................................... 5.7 5.01 Ease and affordability of shipment (1–5)...................................................... 9 .......... n ..........3.6 Luxembourg .............................................3.8 5.02 Logistics competence (1–5) ...................................................................... 18 .......... n ..........3.7 Norway ....................................................4.2 5.03 Tracking and tracing ability (1–5) ............................................................... 36 .......... n ..........3.4 Germany ..................................................4.2 5.04 Timeliness of shipments in reaching destination (1–5) ................................. 3 .......... n ..........4.4 Luxembourg .............................................4.7 5.05 Postal services efficiency* ......................................................................... 35 .......... n ..........5.5 Japan .......................................................6.8 5.06 Efficiency of transport mode change* ....................................................... 17 .......... n ..........5.4 Hong Kong SAR ......................................6.4
Pillar 6: Availability and use of ICTs (1–7) .......................................................... 5 ...........................6.4 Sweden ........................................................ 6.5 6.01 Mobile phone subscriptions/100 pop. ...................................................... 53 .......... n ......117.6 Hong Kong SAR ..................................229.2 6.02 Individuals using Internet (%) ...................................................................... 4 .......... n ........93.0 Iceland ...................................................96.2 6.03 Fixed broadband Internet subscriptions/100 pop. ...................................... 3 .......... n ........38.8 Switzerland ............................................39.9 6.04 Active mobile broadband Internet subscriptions/100 pop. .......................... 6 .......... n ........97.0 Singapore.............................................124.5 6.05 ICT use for business-to-business transactions* ........................................ 21 .......... n ..........5.7 Finland .....................................................6.2 6.06 Internet use for business-to-consumer transactions* ................................ 18 .......... n ..........5.6 United Kingdom .......................................6.3 6.07 Government Online Service Index (0–1) .................................................... 13 .......... n ........0.86 Multiple economies (3) ...........................1.00
Pillar 7: Operating environment (1–7) .............................................................. 21 ...........................5.1 Hong Kong SAR ............................................ 5.8 7.01 Protection of property index (1–7) ............................................................. 24 .......... n ..........5.2 Finland .....................................................6.3
Property rights* ......................................................................................... 23 .......... n ..........5.4 Finland .....................................................6.4Intellectual property protection* ................................................................ 25 .......... n ..........5.0 Finland .....................................................6.2
7.02 Efficiency and accountability of public institutions index (1–7) ..................... 7 .......... n ..........5.5 Singapore.................................................6.0Judicial efficiency & impartiality in commercial disputes (0–4)...................... 1 .......... n ..........4.0 Multiple economies (7) .............................4.0Diversion of public funds* ........................................................................... 2 .......... n ..........6.3 New Zealand ............................................6.5Ease of compliance with government regulation* ...................................... 92 .......... n ..........3.2 Singapore.................................................5.4
7.03 Access to finance index (1–7) .................................................................. 41 .......... n ..........4.2 Hong Kong SAR ......................................5.7Affordability of financial services* ............................................................. 38 .......... n ..........4.7 Hong Kong SAR ......................................6.1Availability of financial services* ................................................................ 35 .......... n ..........5.1 Switzerland ..............................................6.4Ease of access to loans* .......................................................................... 62 .......... n ..........2.9 Qatar ........................................................4.9Availability of trade finance* ...................................................................... 46 .......... n ..........4.1 Hong Kong SAR ......................................5.8
7.04 Openness to foreign participation index (1–7) ........................................... 20 .......... n ..........4.9 Ireland ......................................................5.5Ease of hiring foreign labour* .................................................................... 35 .......... n ..........4.4 United Arab Emirates ...............................5.6Business impact of rules on FDI* .............................................................. 65 .......... n ..........4.6 Ireland ......................................................6.7Openness to multilateral trade rules (0–100) ............................................... 9 .......... n ........83.4 Slovenia .................................................92.2
7.05 Index of physical security (1–7) ................................................................. 42 .......... n ..........5.9 Qatar ........................................................6.8Reliability of police services* ..................................................................... 11 .......... n ..........6.1 Finland .....................................................6.7Business costs of crime and violence* ...................................................... 76 .......... n ..........4.6 Qatar ........................................................6.8Business costs of terrorism* ..................................................................... 98 .......... n ..........4.9 Slovenia ...................................................6.7Homicide cases/100,000 pop. ................................................................. 13 .......... n ..........0.8 Hong Kong SAR ......................................0.2Index of terrorism incidence (1-7) ............................................................. 75 .......... n ..........7.0 Multiple economies (48) ...........................7.0
© 2014 World Economic Forum

Country/Economy Profiles
116 | The Global Enabling Trade Report 2014
* From the list of factors above, respondents were asked to select the five most problematic for trading in their country and to rank them between 1 (most problematic) and 5. The bars in the figure show the responses weighted according to their rankings.
For methodology, indicator descriptions and sources, and for a list of multiple best-performing economies, see page 45.
0 105 15 20 25 30
0 5 10 15 20 25 30
2
3
4
5
6
7
Operating environment
Availability & use of ICTs
Availability & quality of transport services
Availability & quality of transport infrastructure
Efficiency & transparency of border administration
Foreign market access
Domestic market access
1
Enabling Trade Index 2014 Rank Score (out of 138) (1–7)
Enabling Trade Index 2014 .................... 79 ..... 3.9
Subindex A: Market access (25%) ....................67 .......3.6Pillar 1: Domestic market access .....................................78 .........4.7Pillar 2: Foreign market access ........................................70 .........2.5
Subindex B: Border administration (25%) ........63 .......4.6Pillar 3: Efficiency & transparency of border administration ...................................................63 .........4.6
Subindex C: Infrastructure (25%) ......................72 .......3.7Pillar 4: Availability & quality of transport infrastructure ...53 .........3.7Pillar 5: Availability & quality of transport services ...........85 ........ 3.8Pillar 6: Availability & use of ICTs .....................................83 .........3.7
Subindex D: Operating environment (25%) .... 110 .......3.6Pillar 7: Operating environment ...................................... 110 ........ 3.6
Key indicators, 2012 Rank/138
Population (millions) .............................................................10.2 ........... 75GDP (US$ billions) .............................................................. 59.0 ........... 68GDP per capita (US$) .....................................................5,766.2 ........... 73
Merchandise tradeTrade openness (imports+exports)/GDP .............................45.1 ..........114Share of world trade (%) ......................................................0.07 ........... 84Total Exports (US$ billions) ....................................................9.1 ........... 85Total Imports (US$ billions) .................................................. 17.8 ........... 78
Value chain indicators, 2012Share (%) of merchandise trade Exports Imports
Capital goods ................................................................... 13.4 ........ 10.7
Intermediate goods .......................................................... 46.0 ........52.2Food and beverages (industrial) ......................................7.3 .......... 2.9Industrial supplies (primary and processed) .................31.7 .........31.4Parts and accessories .................................................... 6.9 ...........7.6Fuels and lubricants ....................................................... 0.0 ........ 10.3
Consumer goods .............................................................. 40.3 ........22.8Food and beverages (consumer) .................................... 6.9 .......... 6.2Transport equipment and consumer goods ................. 33.4 ........ 16.6
Passenger motor cars ........................................................ 0.0 .......... 2.7
Others .................................................................................. 0.2 .........11.7
The most problematic factors for trade, 2013Most problematic factors for exporting Score*
Identifying potential markets and buyers ...............................................................15.1Access to trade finance .........................................................................................13.5Access to imported inputs at competitive prices ..................................................12.0Inappropriate production technology and skills .....................................................11.8Difficulties in meeting quality/quantity requirements of buyers ..............................11.8High cost or delays caused by domestic transportation .........................................7.8Technical requirements and standards abroad ...................................................... 6.9Corruption at foreign borders ................................................................................. 6.9High cost or delays caused by international transportation ................................... 6.3Rules of origin requirements abroad ....................................................................... 3.0Burdensome procedures at foreign borders ...........................................................2.7Tariff barriers abroad .............................................................................................. 2.2
Most problematic factors for importing Score*
Tariffs .................................................................................................................... 25.0High cost or delays caused by international transportation ..................................15.0Burdensome import procedures ...........................................................................15.0High cost or delays caused by domestic transportation .......................................14.1Corruption at the border ....................................................................................... 13.2Domestic technical requirements and standards ..................................................10.3Crime and theft ....................................................................................................... 6.8Inappropriate telecommunications infrastructure ....................................................0.7
Dominican Republic
Sources: International Monetary Fund, World Bank, World Trade Organization, United Nations COMTRADE
Dominican Republic
Central America and Caribbean
© 2014 World Economic Forum

Country/Economy Profiles
The Global Enabling Trade Report 2014 | 117
* Indicator derived from the World Economic Forum’s Executive Opinion Survey and measured on a 1-to-7 scale, where 7 indicates best outcome.
The Enabling Trade Index 2014 in detail n Competitive Advantage n Competitive Disadvantage
For methodology, indicator descriptions and sources, and for a list of multiple best-performing economies, see page 45. Dominican Republic
INDICATOR, UNITS RANK/138 VALUE BEST PERFORMER VALUE
Pillar 1: Domestic market access (1–7) ........................................................... 78 ...........................4.7 Multiple economies (2) ................................ 7.0 1.01 Tariff rate (%)............................................................................................. 83 .......... n ..........7.4 Multiple economies (2) .............................0.0 1.02 Complexity of tariffs index (1–7) ................................................................ 35 .......... n ..........6.5 Multiple economies (2) .............................7.0
Tariff dispersion (standard deviation) ......................................................... 86 .......... n ..........9.0 Multiple economies (2) .............................0.0Tariff peaks (% of tariff lines) ..................................................................... 48 .......... n ..........0.8 Multiple economies (24) ...........................0.0Specific tariffs (% of tariff lines) ................................................................... 1 .......... n ..........0.0 Multiple economies (54) ...........................0.0Number of distinct tariffs ........................................................................... 28 .......... n .............7 Multiple economies (2) ................................1
1.03 Share of duty-free imports (%) .................................................................. 93 .......... n ........44.2 Multiple economies (2) .........................100.0
Pillar 2: Foreign market access (1–7) .............................................................. 70 ...........................2.5 Cambodia ..................................................... 5.3 2.01 Tariffs faced (%) ...................................................................................... 132 .......... n ..........5.9 Chile .........................................................3.5 2.02 Index of margin of preference in destination mkts (0–100) ........................ 38 .......... n ........47.6 Mauritius ................................................97.1
Pillar 3: Efficiency and transparency of border administration (1–7) .............. 63 ...........................4.6 Singapore..................................................... 6.3 3.01 Customs services index (0–1) ................................................................... 75 .......... n ........0.51 Singapore...............................................0.97 3.02 Efficiency of the clearance process (1–5) .................................................. 80 .......... n ..........2.6 Norway ....................................................4.2 3.03 No. of days to import ............................................................................... 28 .......... n ...........10 Singapore....................................................4 3.04 No. of documents to import ..................................................................... 43 .......... n .............6 Multiple economies (2) ................................2 3.05 Cost to import (US$ per container) ........................................................... 53 .......... n ......1,145 Singapore................................................440 3.06 No. of days to export.................................................................................. 9 .......... n .............8 Multiple economies (5) ................................6 3.07 No. of documents to export ..................................................................... 40 .......... n .............5 Multiple economies (2) ................................2 3.08 Cost to export (US$ per container) ........................................................... 54 .......... n ......1,040 Malaysia ..................................................450 3.09 Irregular payments in exports and imports*............................................... 98 .......... n ..........2.9 New Zealand ............................................6.6 3.10 Time predictability of import procedures* .................................................. 43 .......... n ..........4.4 Finland .....................................................6.0 3.11 Customs transparency index (0–1) ........................................................... 59 .......... n ........0.80 Multiple economies (35) .........................1.00
Pillar 4: Availability and quality of transport infrastructure (1-7) ..................... 53 ...........................3.7 United Arab Emirates ................................... 6.5 4.01 Available int’l airline seat km/week, millions .............................................. 44 .......... n ......386.4 United States ..................................11,481.7 4.02 Quality of air transport infrastructure* ........................................................ 45 .......... n ..........5.2 Singapore.................................................6.8 4.03 Quality of railroad infrastructure* .............................................................. n/a ........................n/a Japan .......................................................6.7 4.04 Liner Shipping Connectivity Index (0–157.1) ............................................. 50 .......... n ........25.6 China ...................................................157.5 4.05 Quality of port infrastructure* .................................................................... 47 .......... n ..........4.6 Netherlands ..............................................6.8 4.06 Paved roads (% of total) ........................................................................... 68 .......... n ........50.1 Multiple economies (18) .......................100.0 4.07 Quality of roads* ....................................................................................... 57 .......... n ..........4.2 United Arab Emirates ...............................6.6
Pillar 5: Availability and quality of transport services (1–7) ............................ 85 ...........................3.8 Singapore..................................................... 5.7 5.01 Ease and affordability of shipment (1–5).................................................... 71 .......... n ..........2.9 Luxembourg .............................................3.8 5.02 Logistics competence (1–5) ...................................................................... 64 .......... n ..........2.9 Norway ....................................................4.2 5.03 Tracking and tracing ability (1–5) ............................................................... 72 .......... n ..........2.9 Germany ..................................................4.2 5.04 Timeliness of shipments in reaching destination (1–5) ............................... 78 .......... n ..........3.2 Luxembourg .............................................4.7 5.05 Postal services efficiency* ....................................................................... 119 .......... n ..........3.0 Japan .......................................................6.8 5.06 Efficiency of transport mode change* ....................................................... 78 .......... n ..........3.8 Hong Kong SAR ......................................6.4
Pillar 6: Availability and use of ICTs (1–7) ........................................................ 83 ...........................3.7 Sweden ........................................................ 6.5 6.01 Mobile phone subscriptions/100 pop. .................................................... 101 .......... n ........86.9 Hong Kong SAR ..................................229.2 6.02 Individuals using Internet (%) .................................................................... 69 .......... n ........45.0 Iceland ...................................................96.2 6.03 Fixed broadband Internet subscriptions/100 pop. .................................... 77 .......... n ..........4.3 Switzerland ............................................39.9 6.04 Active mobile broadband Internet subscriptions/100 pop. ........................ 74 .......... n ........15.2 Singapore.............................................124.5 6.05 ICT use for business-to-business transactions* ........................................ 52 .......... n ..........5.1 Finland .....................................................6.2 6.06 Internet use for business-to-consumer transactions* ................................ 60 .......... n ..........4.7 United Kingdom .......................................6.3 6.07 Government Online Service Index (0–1) .................................................... 55 .......... n ........0.54 Multiple economies (3) ...........................1.00
Pillar 7: Operating environment (1–7) ............................................................ 110 ...........................3.6 Hong Kong SAR ............................................ 5.8 7.01 Protection of property index (1–7) ............................................................. 95 .......... n ..........3.4 Finland .....................................................6.3
Property rights* ......................................................................................... 87 .......... n ..........3.8 Finland .....................................................6.4Intellectual property protection* ................................................................ 99 .......... n ..........3.0 Finland .....................................................6.2
7.02 Efficiency and accountability of public institutions index (1–7) ................. 134 .......... n ..........2.4 Singapore.................................................6.0Judicial efficiency & impartiality in commercial disputes (0–4).................. 124 .......... n ..........0.5 Multiple economies (7) .............................4.0Diversion of public funds* ....................................................................... 132 .......... n ..........1.9 New Zealand ............................................6.5Ease of compliance with government regulation* ...................................... 64 .......... n ..........3.5 Singapore.................................................5.4
7.03 Access to finance index (1–7) .................................................................. 47 .......... n ..........4.0 Hong Kong SAR ......................................5.7Affordability of financial services* ............................................................. 72 .......... n ..........4.1 Hong Kong SAR ......................................6.1Availability of financial services* ................................................................ 34 .......... n ..........5.2 Switzerland ..............................................6.4Ease of access to loans* .......................................................................... 54 .......... n ..........3.0 Qatar ........................................................4.9Availability of trade finance* ...................................................................... 62 .......... n ..........3.9 Hong Kong SAR ......................................5.8
7.04 Openness to foreign participation index (1–7) ........................................... 52 .......... n ..........4.5 Ireland ......................................................5.5Ease of hiring foreign labour* .................................................................... 18 .......... n ..........4.7 United Arab Emirates ...............................5.6Business impact of rules on FDI* .............................................................. 74 .......... n ..........4.5 Ireland ......................................................6.7Openness to multilateral trade rules (0–100) ............................................. 63 .......... n ........65.2 Slovenia .................................................92.2
7.05 Index of physical security (1–7) ............................................................... 128 .......... n ..........3.8 Qatar ........................................................6.8Reliability of police services* ................................................................... 133 .......... n ..........2.3 Finland .....................................................6.7Business costs of crime and violence* .................................................... 122 .......... n ..........3.2 Qatar ........................................................6.8Business costs of terrorism* ..................................................................... 64 .......... n ..........5.5 Slovenia ...................................................6.7Homicide cases/100,000 pop. ............................................................... 127 .......... n ........25.0 Hong Kong SAR ......................................0.2Index of terrorism incidence (1-7) ............................................................... 1 .......... n ..........7.0 Multiple economies (48) ...........................7.0
© 2014 World Economic Forum

Country/Economy Profiles
118 | The Global Enabling Trade Report 2014
* From the list of factors above, respondents were asked to select the five most problematic for trading in their country and to rank them between 1 (most problematic) and 5. The bars in the figure show the responses weighted according to their rankings.
For methodology, indicator descriptions and sources, and for a list of multiple best-performing economies, see page 45.
0 105 15 20 25 30
0 5 10 15 20 25 30
2
3
4
5
6
7
Operating environment
Availability & use of ICTs
Availability & quality of transport services
Availability & quality of transport infrastructure
Efficiency & transparency of border administration
Foreign market access
Domestic market access
1
Enabling Trade Index 2014 Rank Score (out of 138) (1–7)
Enabling Trade Index 2014 .................... 65 ......4.1
Subindex A: Market access (25%) ....................30 .......4.2Pillar 1: Domestic market access .....................................35 .........5.1Pillar 2: Foreign market access ........................................36 .........3.4
Subindex B: Border administration (25%) ........64 .......4.5Pillar 3: Efficiency & transparency of border administration ...................................................64 ........ 4.5
Subindex C: Infrastructure (25%) ......................81 .......3.6Pillar 4: Availability & quality of transport infrastructure ...80 .........3.1Pillar 5: Availability & quality of transport services ...........71 .........4.0Pillar 6: Availability & use of ICTs .....................................80 ........ 3.8
Subindex D: Operating environment (25%) ......88 .......3.9Pillar 7: Operating environment ........................................88 ........ 3.9
Key indicators, 2012 Rank/138
Population (millions) .............................................................14.6 ........... 61GDP (US$ billions) .............................................................. 84.0 ........... 63GDP per capita (US$) ..................................................... 5,742.6 ........... 74
Merchandise tradeTrade openness (imports+exports)/GDP .............................58.1 ........... 86Share of world trade (%) ......................................................0.13 ........... 68Total Exports (US$ billions) ................................................. 23.8 ........... 68Total Imports (US$ billions) ................................................. 25.2 ........... 67
Value chain indicators, 2012Share (%) of merchandise trade Exports Imports
Capital goods ......................................................................1.9 ........ 19.5
Intermediate goods .......................................................... 65.7 ........ 49.7Food and beverages (industrial) ..................................... 3.0 .......... 1.8Industrial supplies (primary and processed) .................. 8.8 ........ 36.5Parts and accessories .................................................... 0.6 .......... 8.7Fuels and lubricants ..................................................... 53.3 .......... 2.7
Consumer goods .............................................................. 28.0 ........ 16.2Food and beverages (consumer) .................................. 23.3 .......... 3.7Transport equipment and consumer goods ....................4.7 ........ 12.5
Passenger motor cars ........................................................ 0.8 .......... 3.0
Others .................................................................................. 3.6 ........ 11.5
The most problematic factors for trade, 2013Most problematic factors for exporting Score*
Tariff barriers abroad .............................................................................................11.3Difficulties in meeting quality/quantity requirements of buyers ..............................10.7High cost or delays caused by international transportation ................................... 9.3High cost or delays caused by domestic transportation ........................................ 9.2Access to trade finance .......................................................................................... 9.2Technical requirements and standards abroad ...................................................... 8.7Inappropriate production technology and skills ...................................................... 8.2Corruption at foreign borders ................................................................................. 8.2Burdensome procedures at foreign borders ...........................................................7.6Access to imported inputs at competitive prices ....................................................7.3Rules of origin requirements abroad ....................................................................... 5.3Identifying potential markets and buyers ................................................................ 5.0
Most problematic factors for importing Score*
Corruption at the border ........................................................................................16.7Crime and theft ......................................................................................................15.6Tariffs .....................................................................................................................14.1High cost or delays caused by international transportation ..................................13.8Burdensome import procedures ...........................................................................12.2Domestic technical requirements and standards ..................................................10.8High cost or delays caused by domestic transportation ........................................ 9.9Inappropriate telecommunications infrastructure ................................................... 6.9
Ecuador
Sources: International Monetary Fund, World Bank, World Trade Organization, United Nations COMTRADE
Ecuador
South America
© 2014 World Economic Forum

Country/Economy Profiles
The Global Enabling Trade Report 2014 | 119
* Indicator derived from the World Economic Forum’s Executive Opinion Survey and measured on a 1-to-7 scale, where 7 indicates best outcome.
The Enabling Trade Index 2014 in detail n Competitive Advantage n Competitive Disadvantage
For methodology, indicator descriptions and sources, and for a list of multiple best-performing economies, see page 45. Ecuador
INDICATOR, UNITS RANK/138 VALUE BEST PERFORMER VALUE
Pillar 1: Domestic market access (1–7) ........................................................... 35 ...........................5.1 Multiple economies (2) ................................ 7.0 1.01 Tariff rate (%)............................................................................................. 85 .......... n ..........7.6 Multiple economies (2) .............................0.0 1.02 Complexity of tariffs index (1–7) ................................................................ 41 .......... n ..........6.4 Multiple economies (2) .............................7.0
Tariff dispersion (standard deviation) ......................................................... 98 .......... n ........11.1 Multiple economies (2) .............................0.0Tariff peaks (% of tariff lines) ..................................................................... 40 .......... n ..........0.7 Multiple economies (24) ...........................0.0Specific tariffs (% of tariff lines) ................................................................... 1 .......... n ..........0.0 Multiple economies (54) ...........................0.0Number of distinct tariffs ........................................................................... 52 .......... n ...........19 Multiple economies (2) ................................1
1.03 Share of duty-free imports (%) .................................................................. 70 .......... n ........64.6 Multiple economies (2) .........................100.0
Pillar 2: Foreign market access (1–7) .............................................................. 36 ...........................3.4 Cambodia ..................................................... 5.3 2.01 Tariffs faced (%) ........................................................................................ 30 .......... n ..........5.1 Chile .........................................................3.5 2.02 Index of margin of preference in destination mkts (0–100) ........................ 44 .......... n ........43.6 Mauritius ................................................97.1
Pillar 3: Efficiency and transparency of border administration (1–7) .............. 64 ...........................4.5 Singapore..................................................... 6.3 3.01 Customs services index (0–1) ................................................................... 46 .......... n ........0.65 Singapore...............................................0.97 3.02 Efficiency of the clearance process (1–5) .................................................. 89 .......... n ..........2.5 Norway ....................................................4.2 3.03 No. of days to import ............................................................................... 94 .......... n ...........25 Singapore....................................................4 3.04 No. of documents to import ..................................................................... 43 .......... n .............6 Multiple economies (2) ................................2 3.05 Cost to import (US$ per container) ........................................................... 86 .......... n ......1,520 Singapore................................................440 3.06 No. of days to export................................................................................ 85 .......... n ...........20 Multiple economies (5) ................................6 3.07 No. of documents to export ..................................................................... 85 .......... n .............7 Multiple economies (2) ................................2 3.08 Cost to export (US$ per container) ......................................................... 101 .......... n ......1,535 Malaysia ..................................................450 3.09 Irregular payments in exports and imports*............................................... 73 .......... n ..........3.6 New Zealand ............................................6.6 3.10 Time predictability of import procedures* .................................................. 57 .......... n ..........4.0 Finland .....................................................6.0 3.11 Customs transparency index (0–1) ............................................................. 1 .......... n ........1.00 Multiple economies (35) .........................1.00
Pillar 4: Availability and quality of transport infrastructure (1-7) ..................... 80 ...........................3.1 United Arab Emirates ................................... 6.5 4.01 Available int’l airline seat km/week, millions .............................................. 74 .......... n ......122.5 United States ..................................11,481.7 4.02 Quality of air transport infrastructure* ........................................................ 65 .......... n ..........4.5 Singapore.................................................6.8 4.03 Quality of railroad infrastructure* .............................................................. n/a ........................n/a Japan .......................................................6.7 4.04 Liner Shipping Connectivity Index (0–157.1) ............................................. 54 .......... n ........21.7 China ...................................................157.5 4.05 Quality of port infrastructure* .................................................................... 63 .......... n ..........4.2 Netherlands ..............................................6.8 4.06 Paved roads (% of total) ......................................................................... 112 .......... n ........14.8 Multiple economies (18) .......................100.0 4.07 Quality of roads* ....................................................................................... 46 .......... n ..........4.6 United Arab Emirates ...............................6.6
Pillar 5: Availability and quality of transport services (1–7) ............................ 71 ...........................4.0 Singapore..................................................... 5.7 5.01 Ease and affordability of shipment (1–5).................................................... 83 .......... n ..........2.8 Luxembourg .............................................3.8 5.02 Logistics competence (1–5) ...................................................................... 97 .......... n ..........2.6 Norway ....................................................4.2 5.03 Tracking and tracing ability (1–5) ............................................................... 92 .......... n ..........2.7 Germany ..................................................4.2 5.04 Timeliness of shipments in reaching destination (1–5) ............................... 79 .......... n ..........3.2 Luxembourg .............................................4.7 5.05 Postal services efficiency* ......................................................................... 65 .......... n ..........4.6 Japan .......................................................6.8 5.06 Efficiency of transport mode change* ....................................................... 53 .......... n ..........4.4 Hong Kong SAR ......................................6.4
Pillar 6: Availability and use of ICTs (1–7) ........................................................ 80 ...........................3.8 Sweden ........................................................ 6.5 6.01 Mobile phone subscriptions/100 pop. ...................................................... 76 .......... n ......106.2 Hong Kong SAR ..................................229.2 6.02 Individuals using Internet (%) .................................................................... 83 .......... n ........35.1 Iceland ...................................................96.2 6.03 Fixed broadband Internet subscriptions/100 pop. .................................... 72 .......... n ..........5.3 Switzerland ............................................39.9 6.04 Active mobile broadband Internet subscriptions/100 pop. ........................ 66 .......... n ........21.3 Singapore.............................................124.5 6.05 ICT use for business-to-business transactions* ........................................ 91 .......... n ..........4.6 Finland .....................................................6.2 6.06 Internet use for business-to-consumer transactions* ................................ 56 .......... n ..........4.8 United Kingdom .......................................6.3 6.07 Government Online Service Index (0–1) .................................................... 79 .......... n ........0.46 Multiple economies (3) ...........................1.00
Pillar 7: Operating environment (1–7) .............................................................. 88 ...........................3.9 Hong Kong SAR ............................................ 5.8 7.01 Protection of property index (1–7) ............................................................. 80 .......... n ..........3.7 Finland .....................................................6.3
Property rights* ......................................................................................... 91 .......... n ..........3.8 Finland .....................................................6.4Intellectual property protection* ................................................................ 74 .......... n ..........3.6 Finland .....................................................6.2
7.02 Efficiency and accountability of public institutions index (1–7) ................... 68 .......... n ..........3.6 Singapore.................................................6.0Judicial efficiency & impartiality in commercial disputes (0–4).................... 63 .......... n ..........2.0 Multiple economies (7) .............................4.0Diversion of public funds* ......................................................................... 62 .......... n ..........3.2 New Zealand ............................................6.5Ease of compliance with government regulation* ...................................... 63 .......... n ..........3.5 Singapore.................................................5.4
7.03 Access to finance index (1–7) .................................................................. 66 .......... n ..........3.8 Hong Kong SAR ......................................5.7Affordability of financial services* ............................................................. 77 .......... n ..........4.0 Hong Kong SAR ......................................6.1Availability of financial services* ................................................................ 82 .......... n ..........4.2 Switzerland ..............................................6.4Ease of access to loans* .......................................................................... 29 .......... n ..........3.4 Qatar ........................................................4.9Availability of trade finance* ...................................................................... 71 .......... n ..........3.8 Hong Kong SAR ......................................5.8
7.04 Openness to foreign participation index (1–7) ........................................... 98 .......... n ..........4.0 Ireland ......................................................5.5Ease of hiring foreign labour* .................................................................... 53 .......... n ..........4.2 United Arab Emirates ...............................5.6Business impact of rules on FDI* ............................................................ 117 .......... n ..........3.5 Ireland ......................................................6.7Openness to multilateral trade rules (0–100) ............................................. 71 .......... n ........63.6 Slovenia .................................................92.2
7.05 Index of physical security (1–7) ............................................................... 112 .......... n ..........4.3 Qatar ........................................................6.8Reliability of police services* ..................................................................... 97 .......... n ..........3.6 Finland .....................................................6.7Business costs of crime and violence* .................................................... 110 .......... n ..........3.5 Qatar ........................................................6.8Business costs of terrorism* ................................................................... 112 .......... n ..........4.5 Slovenia ...................................................6.7Homicide cases/100,000 pop. ............................................................... 120 .......... n ........18.2 Hong Kong SAR ......................................0.2Index of terrorism incidence (1-7) ............................................................. 49 .......... n ..........7.0 Multiple economies (48) ...........................7.0
© 2014 World Economic Forum

Country/Economy Profiles
120 | The Global Enabling Trade Report 2014
* From the list of factors above, respondents were asked to select the five most problematic for trading in their country and to rank them between 1 (most problematic) and 5. The bars in the figure show the responses weighted according to their rankings.
For methodology, indicator descriptions and sources, and for a list of multiple best-performing economies, see page 45.
0 105 15 20 25 30
0 5 10 15 20 25 30
2
3
4
5
6
7
Operating environment
Availability & use of ICTs
Availability & quality of transport services
Availability & quality of transport infrastructure
Efficiency & transparency of border administration
Foreign market access
Domestic market access
1
Enabling Trade Index 2014 Rank Score (out of 138) (1–7)
Enabling Trade Index 2014 .................... 97 ..... 3.6
Subindex A: Market access (25%) ..................103 .......3.3Pillar 1: Domestic market access ................................... 128 ........ 3.3Pillar 2: Foreign market access ........................................39 ........ 3.3
Subindex B: Border administration (25%) ......109 .......3.4Pillar 3: Efficiency & transparency of border administration .................................................109 .........3.4
Subindex C: Infrastructure (25%) ......................58 .......4.0Pillar 4: Availability & quality of transport infrastructure ...49 ........ 3.8Pillar 5: Availability & quality of transport services ...........72 .........4.0Pillar 6: Availability & use of ICTs .....................................60 ........ 4.2
Subindex D: Operating environment (25%) ....106 .......3.7Pillar 7: Operating environment ......................................106 .........3.7
Key indicators, 2012 Rank/138
Population (millions) ............................................................ 82.5 ........... 15GDP (US$ billions) .............................................................256.7 ........... 41GDP per capita (US$) ......................................................3,111.9 ........... 93
Merchandise tradeTrade openness (imports+exports)/GDP ............................ 38.6 ......... 124Share of world trade (%) ..................................................... 0.27 ........... 56Total Exports (US$ billions) ................................................. 29.4 ........... 64Total Imports (US$ billions) ................................................. 69.3 ........... 44
Value chain indicators, 2012Share (%) of merchandise trade Exports Imports
Capital goods ......................................................................1.0 ........ 10.1
Intermediate goods .......................................................... 63.0 ........62.8Food and beverages (industrial) ......................................1.8 .......... 9.2Industrial supplies (primary and processed) .................41.5 ........ 38.5Parts and accessories .....................................................1.0 ...........7.4Fuels and lubricants ......................................................18.7 ...........7.7
Consumer goods .............................................................. 25.2 ........ 14.0Food and beverages (consumer) ...................................10.7 ...........7.1Transport equipment and consumer goods ..................14.5 .......... 6.9
Passenger motor cars ........................................................ 0.0 .......... 2.0
Others .................................................................................10.7 .........11.1
The most problematic factors for trade, 2013Most problematic factors for exporting Score*
Identifying potential markets and buyers ...............................................................13.5High cost or delays caused by domestic transportation .......................................11.3Access to imported inputs at competitive prices ..................................................11.3Inappropriate production technology and skills .....................................................10.5Access to trade finance .........................................................................................10.5Rules of origin requirements abroad ....................................................................... 9.0Corruption at foreign borders ................................................................................. 9.0Difficulties in meeting quality/quantity requirements of buyers ............................... 6.8Burdensome procedures at foreign borders .......................................................... 6.8High cost or delays caused by international transportation ................................... 5.3Tariff barriers abroad .............................................................................................. 3.8Technical requirements and standards abroad ...................................................... 2.3
Most problematic factors for importing Score*
Burdensome import procedures .......................................................................... 22.3Tariffs .....................................................................................................................19.9Crime and theft ......................................................................................................15.6Corruption at the border ........................................................................................11.3High cost or delays caused by international transportation ................................... 9.8High cost or delays caused by domestic transportation ........................................ 8.6Domestic technical requirements and standards ................................................... 8.0Inappropriate telecommunications infrastructure ................................................... 4.6
Egypt
Sources: International Monetary Fund, World Bank, World Trade Organization, United Nations COMTRADE
Egypt
Middle East, North Africa, and Pakistan
© 2014 World Economic Forum

Country/Economy Profiles
The Global Enabling Trade Report 2014 | 121
* Indicator derived from the World Economic Forum’s Executive Opinion Survey and measured on a 1-to-7 scale, where 7 indicates best outcome.
The Enabling Trade Index 2014 in detail n Competitive Advantage n Competitive Disadvantage
For methodology, indicator descriptions and sources, and for a list of multiple best-performing economies, see page 45. Egypt
INDICATOR, UNITS RANK/138 VALUE BEST PERFORMER VALUE
Pillar 1: Domestic market access (1–7) ......................................................... 128 ...........................3.3 Multiple economies (2) ................................ 7.0 1.01 Tariff rate (%)........................................................................................... 132 .......... n ........16.0 Multiple economies (2) .............................0.0 1.02 Complexity of tariffs index (1–7) ................................................................ 80 .......... n ..........5.4 Multiple economies (2) .............................7.0
Tariff dispersion (standard deviation) ....................................................... 138 .......... n ......144.0 Multiple economies (2) .............................0.0Tariff peaks (% of tariff lines) ..................................................................... 39 .......... n ..........0.6 Multiple economies (24) ...........................0.0Specific tariffs (% of tariff lines) ................................................................. 70 .......... n ..........0.3 Multiple economies (54) ...........................0.0Number of distinct tariffs ........................................................................... 70 .......... n ...........33 Multiple economies (2) ................................1
1.03 Share of duty-free imports (%) .................................................................. 94 .......... n ........42.6 Multiple economies (2) .........................100.0
Pillar 2: Foreign market access (1–7) .............................................................. 39 ...........................3.3 Cambodia ..................................................... 5.3 2.01 Tariffs faced (%) ........................................................................................ 36 .......... n ..........5.2 Chile .........................................................3.5 2.02 Index of margin of preference in destination mkts (0–100) ........................ 39 .......... n ........46.2 Mauritius ................................................97.1
Pillar 3: Efficiency and transparency of border administration (1–7) ............ 109 ...........................3.4 Singapore..................................................... 6.3 3.01 Customs services index (0–1) ................................................................. 104 .......... n ........0.33 Singapore...............................................0.97 3.02 Efficiency of the clearance process (1–5) .................................................. 55 .......... n ..........2.9 Norway ....................................................4.2 3.03 No. of days to import ............................................................................... 54 .......... n ...........15 Singapore....................................................4 3.04 No. of documents to import ................................................................... 115 .......... n ...........10 Multiple economies (2) ................................2 3.05 Cost to import (US$ per container) ........................................................... 23 .......... n .........790 Singapore................................................440 3.06 No. of days to export................................................................................ 41 .......... n ...........12 Multiple economies (5) ................................6 3.07 No. of documents to export ................................................................... 108 .......... n .............8 Multiple economies (2) ................................2 3.08 Cost to export (US$ per container) ........................................................... 14 .......... n .........625 Malaysia ..................................................450 3.09 Irregular payments in exports and imports*............................................. 109 .......... n ..........2.6 New Zealand ............................................6.6 3.10 Time predictability of import procedures* ................................................ 108 .......... n ..........3.3 Finland .....................................................6.0 3.11 Customs transparency index (0–1) ......................................................... 111 .......... n ........0.13 Multiple economies (35) .........................1.00
Pillar 4: Availability and quality of transport infrastructure (1-7) ..................... 49 ...........................3.8 United Arab Emirates ................................... 6.5 4.01 Available int’l airline seat km/week, millions .............................................. 30 .......... n ......689.0 United States ..................................11,481.7 4.02 Quality of air transport infrastructure* ........................................................ 54 .......... n ..........4.8 Singapore.................................................6.8 4.03 Quality of railroad infrastructure* ............................................................... 59 .......... n ..........2.7 Japan .......................................................6.7 4.04 Liner Shipping Connectivity Index (0–157.1) ............................................. 18 .......... n ........57.5 China ...................................................157.5 4.05 Quality of port infrastructure* .................................................................... 73 .......... n ..........4.1 Netherlands ..............................................6.8 4.06 Paved roads (% of total) ........................................................................... 26 .......... n ........92.2 Multiple economies (18) .......................100.0 4.07 Quality of roads* ..................................................................................... 113 .......... n ..........2.7 United Arab Emirates ...............................6.6
Pillar 5: Availability and quality of transport services (1–7) ............................ 72 ...........................4.0 Singapore..................................................... 5.7 5.01 Ease and affordability of shipment (1–5).................................................... 76 .......... n ..........2.9 Luxembourg .............................................3.8 5.02 Logistics competence (1–5) ...................................................................... 58 .......... n ..........3.0 Norway ....................................................4.2 5.03 Tracking and tracing ability (1–5) ............................................................... 43 .......... n ..........3.2 Germany ..................................................4.2 5.04 Timeliness of shipments in reaching destination (1–5) ............................... 99 .......... n ..........3.0 Luxembourg .............................................4.7 5.05 Postal services efficiency* ......................................................................... 89 .......... n ..........3.9 Japan .......................................................6.8 5.06 Efficiency of transport mode change* ....................................................... 84 .......... n ..........3.7 Hong Kong SAR ......................................6.4
Pillar 6: Availability and use of ICTs (1–7) ........................................................ 60 ...........................4.2 Sweden ........................................................ 6.5 6.01 Mobile phone subscriptions/100 pop. ...................................................... 48 .......... n ......119.9 Hong Kong SAR ..................................229.2 6.02 Individuals using Internet (%) .................................................................... 70 .......... n ........44.1 Iceland ...................................................96.2 6.03 Fixed broadband Internet subscriptions/100 pop. .................................... 84 .......... n ..........2.8 Switzerland ............................................39.9 6.04 Active mobile broadband Internet subscriptions/100 pop. ........................ 56 .......... n ........27.9 Singapore.............................................124.5 6.05 ICT use for business-to-business transactions* ........................................ 77 .......... n ..........4.7 Finland .....................................................6.2 6.06 Internet use for business-to-consumer transactions* ................................ 69 .......... n ..........4.5 United Kingdom .......................................6.3 6.07 Government Online Service Index (0–1) .................................................... 42 .......... n ........0.60 Multiple economies (3) ...........................1.00
Pillar 7: Operating environment (1–7) ............................................................ 106 ...........................3.7 Hong Kong SAR ............................................ 5.8 7.01 Protection of property index (1–7) ............................................................. 91 .......... n ..........3.5 Finland .....................................................6.3
Property rights* ......................................................................................... 93 .......... n ..........3.7 Finland .....................................................6.4Intellectual property protection* ................................................................ 87 .......... n ..........3.2 Finland .....................................................6.2
7.02 Efficiency and accountability of public institutions index (1–7) ................. 100 .......... n ..........3.2 Singapore.................................................6.0Judicial efficiency & impartiality in commercial disputes (0–4).................... 63 .......... n ..........2.0 Multiple economies (7) .............................4.0Diversion of public funds* ....................................................................... 106 .......... n ..........2.5 New Zealand ............................................6.5Ease of compliance with government regulation* ...................................... 88 .......... n ..........3.2 Singapore.................................................5.4
7.03 Access to finance index (1–7) ................................................................ 102 .......... n ..........3.3 Hong Kong SAR ......................................5.7Affordability of financial services* ............................................................. 99 .......... n ..........3.7 Hong Kong SAR ......................................6.1Availability of financial services* .............................................................. 105 .......... n ..........3.8 Switzerland ..............................................6.4Ease of access to loans* .......................................................................... 94 .......... n ..........2.4 Qatar ........................................................4.9Availability of trade finance* ...................................................................... 94 .......... n ..........3.4 Hong Kong SAR ......................................5.8
7.04 Openness to foreign participation index (1–7) ........................................... 91 .......... n ..........4.1 Ireland ......................................................5.5Ease of hiring foreign labour* .................................................................. 105 .......... n ..........3.6 United Arab Emirates ...............................5.6Business impact of rules on FDI* ............................................................ 112 .......... n ..........3.6 Ireland ......................................................6.7Openness to multilateral trade rules (0–100) ............................................. 39 .......... n ........73.8 Slovenia .................................................92.2
7.05 Index of physical security (1–7) ............................................................... 118 .......... n ..........4.1 Qatar ........................................................6.8Reliability of police services* ................................................................... 122 .......... n ..........2.9 Finland .....................................................6.7Business costs of crime and violence* .................................................... 134 .......... n ..........2.3 Qatar ........................................................6.8Business costs of terrorism* ................................................................... 138 .......... n ..........2.6 Slovenia ...................................................6.7Homicide cases/100,000 pop. ................................................................. 68 .......... n ..........3.3 Hong Kong SAR ......................................0.2Index of terrorism incidence (1-7) ........................................................... 124 .......... n ..........5.9 Multiple economies (48) ...........................7.0
© 2014 World Economic Forum

Country/Economy Profiles
122 | The Global Enabling Trade Report 2014
* From the list of factors above, respondents were asked to select the five most problematic for trading in their country and to rank them between 1 (most problematic) and 5. The bars in the figure show the responses weighted according to their rankings.
For methodology, indicator descriptions and sources, and for a list of multiple best-performing economies, see page 45.
0 105 15 20 25 30
0 5 10 15 20 25 30
2
3
4
5
6
7
Operating environment
Availability & use of ICTs
Availability & quality of transport services
Availability & quality of transport infrastructure
Efficiency & transparency of border administration
Foreign market access
Domestic market access
1
Enabling Trade Index 2014 Rank Score (out of 138) (1–7)
Enabling Trade Index 2014 .................... 71 ..... 4.0
Subindex A: Market access (25%) ......................6 .......4.7Pillar 1: Domestic market access ..................................... 14 .........5.7Pillar 2: Foreign market access ........................................21 .........3.7
Subindex B: Border administration (25%) ........84 .......4.1Pillar 3: Efficiency & transparency of border administration ...................................................84 .........4.1
Subindex C: Infrastructure (25%) ......................70 .......3.8Pillar 4: Availability & quality of transport infrastructure ...75 ........ 3.3Pillar 5: Availability & quality of transport services ...........63 .........4.1Pillar 6: Availability & use of ICTs .....................................69 .........4.0
Subindex D: Operating environment (25%) .... 114 .......3.5Pillar 7: Operating environment ...................................... 114 ........ 3.5
Key indicators, 2012 Rank/138
Population (millions) .............................................................. 6.3 ........... 93GDP (US$ billions) .............................................................. 23.9 ........... 94GDP per capita (US$) .....................................................3,788.0 ........... 87
Merchandise tradeTrade openness (imports+exports)/GDP ............................ 65.6 ........... 68Share of world trade (%) ..................................................... 0.04 ........... 97Total Exports (US$ billions) ................................................... 5.3 ........... 98Total Imports (US$ billions) ..................................................10.3 ........... 93
Value chain indicators, 2012Share (%) of merchandise trade Exports Imports
Capital goods ..................................................................... 4.9 .......... 9.4
Intermediate goods .......................................................... 35.3 ........50.9Food and beverages (industrial) ....................................10.9 .......... 3.2Industrial supplies (primary and processed) ................ 23.5 .........37.5Parts and accessories .................................................... 0.5 .......... 4.4Fuels and lubricants ....................................................... 0.3 .......... 5.8
Consumer goods ...............................................................57.0 ........25.5Food and beverages (consumer) ...................................11.6 .......... 9.8Transport equipment and consumer goods ................. 45.4 ........ 15.7
Passenger motor cars ........................................................ 0.0 .......... 1.2
Others .................................................................................. 2.8 ........ 13.0
The most problematic factors for trade, 2013Most problematic factors for exporting Score*
Identifying potential markets and buyers ...............................................................24.5Access to trade finance ......................................................................................... 17.8Access to imported inputs at competitive prices ..................................................16.6High cost or delays caused by domestic transportation .........................................8.1Technical requirements and standards abroad ...................................................... 6.9Inappropriate production technology and skills ...................................................... 6.7High cost or delays caused by international transportation ................................... 4.8Difficulties in meeting quality/quantity requirements of buyers ............................... 4.6Tariff barriers abroad .............................................................................................. 3.8Burdensome procedures at foreign borders .......................................................... 2.3Rules of origin requirements abroad ....................................................................... 2.0Corruption at foreign borders ..................................................................................1.8
Most problematic factors for importing Score*
Tariffs .................................................................................................................... 22.0Burdensome import procedures ........................................................................... 21.1High cost or delays caused by international transportation ..................................16.0High cost or delays caused by domestic transportation .......................................13.8Corruption at the border ........................................................................................12.2Crime and theft ....................................................................................................... 9.8Domestic technical requirements and standards ................................................... 4.6Inappropriate telecommunications infrastructure ................................................... 0.5
El Salvador
Sources: International Monetary Fund, World Bank, World Trade Organization, United Nations COMTRADE
El Salvador
Central America and Caribbean
© 2014 World Economic Forum

Country/Economy Profiles
The Global Enabling Trade Report 2014 | 123
* Indicator derived from the World Economic Forum’s Executive Opinion Survey and measured on a 1-to-7 scale, where 7 indicates best outcome.
The Enabling Trade Index 2014 in detail n Competitive Advantage n Competitive Disadvantage
For methodology, indicator descriptions and sources, and for a list of multiple best-performing economies, see page 45. El Salvador
INDICATOR, UNITS RANK/138 VALUE BEST PERFORMER VALUE
Pillar 1: Domestic market access (1–7) ........................................................... 14 ...........................5.7 Multiple economies (2) ................................ 7.0 1.01 Tariff rate (%)............................................................................................. 61 .......... n ..........4.6 Multiple economies (2) .............................0.0 1.02 Complexity of tariffs index (1–7) ................................................................ 51 .......... n ..........6.4 Multiple economies (2) .............................7.0
Tariff dispersion (standard deviation) ......................................................... 43 .......... n ..........7.7 Multiple economies (2) .............................0.0Tariff peaks (% of tariff lines) ..................................................................... 66 .......... n ..........3.0 Multiple economies (24) ...........................0.0Specific tariffs (% of tariff lines) ................................................................... 1 .......... n ..........0.0 Multiple economies (54) ...........................0.0Number of distinct tariffs ........................................................................... 40 .......... n ...........12 Multiple economies (2) ................................1
1.03 Share of duty-free imports (%) .................................................................. 23 .......... n ........78.6 Multiple economies (2) .........................100.0
Pillar 2: Foreign market access (1–7) .............................................................. 21 ...........................3.7 Cambodia ..................................................... 5.3 2.01 Tariffs faced (%) ........................................................................................ 60 .......... n ..........5.4 Chile .........................................................3.5 2.02 Index of margin of preference in destination mkts (0–100) .......................... 7 .......... n ........66.5 Mauritius ................................................97.1
Pillar 3: Efficiency and transparency of border administration (1–7) .............. 84 ...........................4.1 Singapore..................................................... 6.3 3.01 Customs services index (0–1) ................................................................... 86 .......... n ........0.45 Singapore...............................................0.97 3.02 Efficiency of the clearance process (1–5) .................................................. 49 .......... n ..........2.9 Norway ....................................................4.2 3.03 No. of days to import ............................................................................... 28 .......... n ...........10 Singapore....................................................4 3.04 No. of documents to import ..................................................................... 57 .......... n .............7 Multiple economies (2) ................................2 3.05 Cost to import (US$ per container) ........................................................... 37 .......... n .........970 Singapore................................................440 3.06 No. of days to export................................................................................ 48 .......... n ...........13 Multiple economies (5) ................................6 3.07 No. of documents to export ..................................................................... 85 .......... n .............7 Multiple economies (2) ................................2 3.08 Cost to export (US$ per container) ........................................................... 46 .......... n .........980 Malaysia ..................................................450 3.09 Irregular payments in exports and imports*............................................... 96 .......... n ..........2.9 New Zealand ............................................6.6 3.10 Time predictability of import procedures* .................................................. 93 .......... n ..........3.5 Finland .....................................................6.0 3.11 Customs transparency index (0–1) ......................................................... 102 .......... n ........0.50 Multiple economies (35) .........................1.00
Pillar 4: Availability and quality of transport infrastructure (1-7) ..................... 75 ...........................3.3 United Arab Emirates ................................... 6.5 4.01 Available int’l airline seat km/week, millions .............................................. 81 .......... n ........95.4 United States ..................................11,481.7 4.02 Quality of air transport infrastructure* ........................................................ 51 .......... n ..........4.8 Singapore.................................................6.8 4.03 Quality of railroad infrastructure* .............................................................. n/a ........................n/a Japan .......................................................6.7 4.04 Liner Shipping Connectivity Index (0–157.1) ............................................. 82 .......... n ..........8.4 China ...................................................157.5 4.05 Quality of port infrastructure* .................................................................... 66 .......... n ..........4.2 Netherlands ..............................................6.8 4.06 Paved roads (% of total) ........................................................................... 71 .......... n ........46.9 Multiple economies (18) .......................100.0 4.07 Quality of roads* ....................................................................................... 53 .......... n ..........4.3 United Arab Emirates ...............................6.6
Pillar 5: Availability and quality of transport services (1–7) ............................ 63 ...........................4.1 Singapore..................................................... 5.7 5.01 Ease and affordability of shipment (1–5).................................................... 45 .......... n ..........3.2 Luxembourg .............................................3.8 5.02 Logistics competence (1–5) ...................................................................... 45 .......... n ..........3.2 Norway ....................................................4.2 5.03 Tracking and tracing ability (1–5) ............................................................... 66 .......... n ..........3.0 Germany ..................................................4.2 5.04 Timeliness of shipments in reaching destination (1–5) ............................. 121 .......... n ..........2.8 Luxembourg .............................................4.7 5.05 Postal services efficiency* ......................................................................... 74 .......... n ..........4.4 Japan .......................................................6.8 5.06 Efficiency of transport mode change* ....................................................... 55 .......... n ..........4.2 Hong Kong SAR ......................................6.4
Pillar 6: Availability and use of ICTs (1–7) ........................................................ 69 ...........................4.0 Sweden ........................................................ 6.5 6.01 Mobile phone subscriptions/100 pop. ...................................................... 29 .......... n ......137.3 Hong Kong SAR ..................................229.2 6.02 Individuals using Internet (%) .................................................................... 92 .......... n ........25.5 Iceland ...................................................96.2 6.03 Fixed broadband Internet subscriptions/100 pop. .................................... 80 .......... n ..........3.8 Switzerland ............................................39.9 6.04 Active mobile broadband Internet subscriptions/100 pop. ........................ 91 .......... n ..........5.5 Singapore.............................................124.5 6.05 ICT use for business-to-business transactions* ........................................ 99 .......... n ..........4.4 Finland .....................................................6.2 6.06 Internet use for business-to-consumer transactions* ................................ 72 .......... n ..........4.5 United Kingdom .......................................6.3 6.07 Government Online Service Index (0–1) .................................................... 32 .......... n ........0.67 Multiple economies (3) ...........................1.00
Pillar 7: Operating environment (1–7) ............................................................ 114 ...........................3.5 Hong Kong SAR ............................................ 5.8 7.01 Protection of property index (1–7) ........................................................... 104 .......... n ..........3.2 Finland .....................................................6.3
Property rights* ....................................................................................... 103 .......... n ..........3.5 Finland .....................................................6.4Intellectual property protection* .............................................................. 104 .......... n ..........2.9 Finland .....................................................6.2
7.02 Efficiency and accountability of public institutions index (1–7) ................... 77 .......... n ..........3.4 Singapore.................................................6.0Judicial efficiency & impartiality in commercial disputes (0–4).................... 63 .......... n ..........2.0 Multiple economies (7) .............................4.0Diversion of public funds* ......................................................................... 83 .......... n ..........2.9 New Zealand ............................................6.5Ease of compliance with government regulation* ...................................... 72 .......... n ..........3.4 Singapore.................................................5.4
7.03 Access to finance index (1–7) .................................................................. 89 .......... n ..........3.5 Hong Kong SAR ......................................5.7Affordability of financial services* ............................................................. 96 .......... n ..........3.7 Hong Kong SAR ......................................6.1Availability of financial services* ................................................................ 89 .......... n ..........4.0 Switzerland ..............................................6.4Ease of access to loans* .......................................................................... 72 .......... n ..........2.8 Qatar ........................................................4.9Availability of trade finance* ...................................................................... 90 .......... n ..........3.5 Hong Kong SAR ......................................5.8
7.04 Openness to foreign participation index (1–7) ........................................... 92 .......... n ..........4.1 Ireland ......................................................5.5Ease of hiring foreign labour* .................................................................... 59 .......... n ..........4.2 United Arab Emirates ...............................5.6Business impact of rules on FDI* ............................................................ 116 .......... n ..........3.5 Ireland ......................................................6.7Openness to multilateral trade rules (0–100) ............................................. 61 .......... n ........66.4 Slovenia .................................................92.2
7.05 Index of physical security (1–7) ............................................................... 132 .......... n ..........3.5 Qatar ........................................................6.8Reliability of police services* ................................................................... 111 .......... n ..........3.1 Finland .....................................................6.7Business costs of crime and violence* .................................................... 133 .......... n ..........2.4 Qatar ........................................................6.8Business costs of terrorism* ................................................................... 121 .......... n ..........4.1 Slovenia ...................................................6.7Homicide cases/100,000 pop. ............................................................... 137 .......... n ........70.2 Hong Kong SAR ......................................0.2Index of terrorism incidence (1-7) ............................................................... 1 .......... n ..........7.0 Multiple economies (48) ...........................7.0
© 2014 World Economic Forum

Country/Economy Profiles
124 | The Global Enabling Trade Report 2014
* From the list of factors above, respondents were asked to select the five most problematic for trading in their country and to rank them between 1 (most problematic) and 5. The bars in the figure show the responses weighted according to their rankings.
For methodology, indicator descriptions and sources, and for a list of multiple best-performing economies, see page 45.
0 105 15 20 25 30
0 5 10 15 20 25 30
2
3
4
5
6
7
Operating environment
Availability & use of ICTs
Availability & quality of transport services
Availability & quality of transport infrastructure
Efficiency & transparency of border administration
Foreign market access
Domestic market access
1
Enabling Trade Index 2014 Rank Score (out of 138) (1–7)
Enabling Trade Index 2014 .................... 28 ..... 4.8
Subindex A: Market access (25%) ....................75 .......3.4Pillar 1: Domestic market access .....................................46 .........4.9Pillar 2: Foreign market access ........................................97 .........1.9
Subindex B: Border administration (25%) ..........8 .......5.9Pillar 3: Efficiency & transparency of border administration .....................................................8 ........ 5.9
Subindex C: Infrastructure (25%) ......................34 .......4.6Pillar 4: Availability & quality of transport infrastructure ...78 ........ 3.2Pillar 5: Availability & quality of transport services ...........37 .........4.7Pillar 6: Availability & use of ICTs .....................................12 ........ 6.0
Subindex D: Operating environment (25%) ......23 .......5.1Pillar 7: Operating environment ........................................23 .........5.1
Key indicators, 2012 Rank/138
Population (millions) ...............................................................1.3 ......... 129GDP (US$ billions) ...............................................................22.4 ........... 96GDP per capita (US$) ...................................................16,720.2 ........... 40
Merchandise tradeTrade openness (imports+exports)/GDP ...........................154.6 ............. 8Share of world trade (%) ..................................................... 0.09 ........... 73Total Exports (US$ billions) ..................................................16.1 ........... 74Total Imports (US$ billions) .................................................. 17.7 ........... 79
Value chain indicators, 2012Share (%) of merchandise trade Exports Imports
Capital goods ................................................................... 18.8 ........ 15.0
Intermediate goods ...........................................................47.2 ........46.9Food and beverages (industrial) ..................................... 3.3 .......... 1.8Industrial supplies (primary and processed) ................ 29.6 ........ 25.9Parts and accessories ................................................... 12.1 ........ 16.7Fuels and lubricants ....................................................... 2.2 .......... 2.4
Consumer goods .............................................................. 18.2 .........17.8Food and beverages (consumer) .................................... 6.2 ...........7.2Transport equipment and consumer goods ..................12.0 ........ 10.6
Passenger motor cars .........................................................1.4 .......... 3.4
Others .................................................................................14.4 ........ 16.8
The most problematic factors for trade, 2013Most problematic factors for exporting Score*
Identifying potential markets and buyers .............................................................. 23.0Access to imported inputs at competitive prices ..................................................14.8Difficulties in meeting quality/quantity requirements of buyers ..............................12.6Inappropriate production technology and skills .......................................................9.7Technical requirements and standards abroad ...................................................... 8.8Access to trade finance ...........................................................................................7.3Burdensome procedures at foreign borders .......................................................... 6.2Rules of origin requirements abroad ........................................................................5.1High cost or delays caused by international transportation ................................... 4.2Corruption at foreign borders ................................................................................. 3.9Tariff barriers abroad .............................................................................................. 3.2High cost or delays caused by domestic transportation .........................................1.0
Most problematic factors for importing Score*
High cost or delays caused by international transportation ................................. 26.8Domestic technical requirements and standards ..................................................19.5Burdensome import procedures ........................................................................... 17.6Tariffs .....................................................................................................................12.2High cost or delays caused by domestic transportation ........................................ 9.2Crime and theft ........................................................................................................7.7Inappropriate telecommunications infrastructure ....................................................5.1Corruption at the border ..........................................................................................1.7
Estonia
Sources: International Monetary Fund, World Bank, World Trade Organization, United Nations COMTRADE
Estonia
Advanced economies
© 2014 World Economic Forum
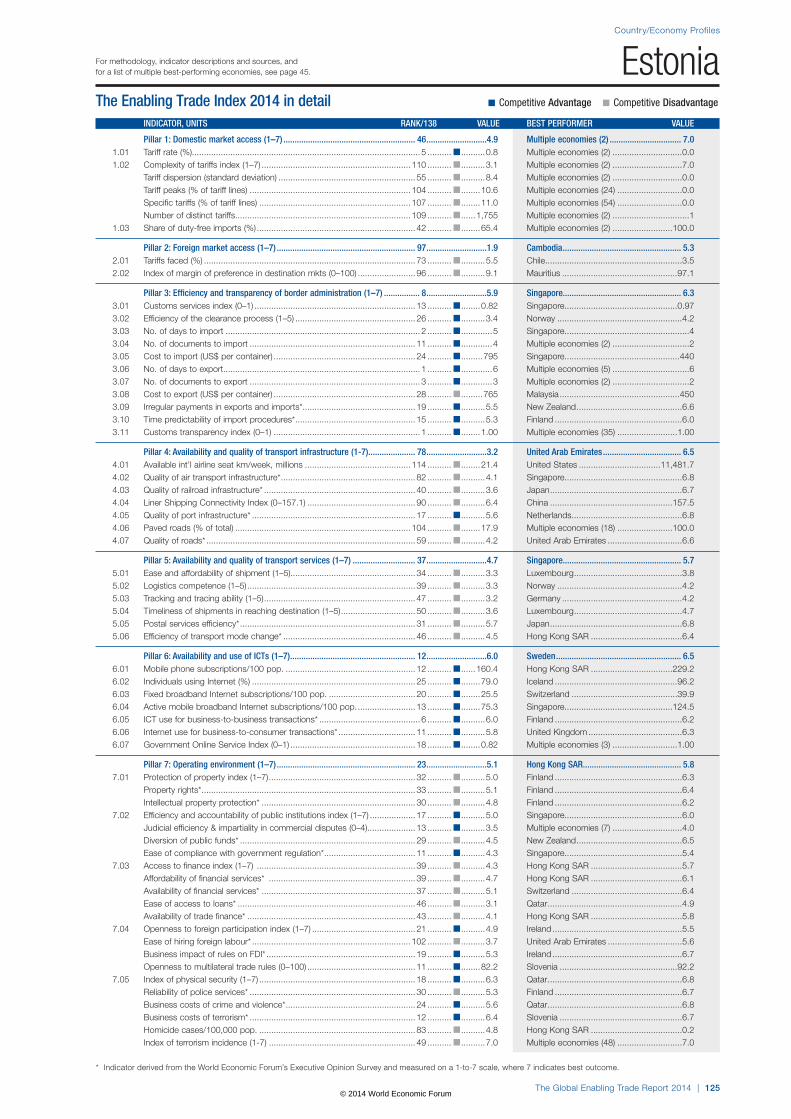
Country/Economy Profiles
The Global Enabling Trade Report 2014 | 125
* Indicator derived from the World Economic Forum’s Executive Opinion Survey and measured on a 1-to-7 scale, where 7 indicates best outcome.
The Enabling Trade Index 2014 in detail n Competitive Advantage n Competitive Disadvantage
For methodology, indicator descriptions and sources, and for a list of multiple best-performing economies, see page 45. Estonia
INDICATOR, UNITS RANK/138 VALUE BEST PERFORMER VALUE
Pillar 1: Domestic market access (1–7) ........................................................... 46 ...........................4.9 Multiple economies (2) ................................ 7.0 1.01 Tariff rate (%)............................................................................................... 5 .......... n ..........0.8 Multiple economies (2) .............................0.0 1.02 Complexity of tariffs index (1–7) .............................................................. 110 .......... n ..........3.1 Multiple economies (2) .............................7.0
Tariff dispersion (standard deviation) ......................................................... 55 .......... n ..........8.4 Multiple economies (2) .............................0.0Tariff peaks (% of tariff lines) ................................................................... 104 .......... n ........10.6 Multiple economies (24) ...........................0.0Specific tariffs (% of tariff lines) ............................................................... 107 .......... n ........11.0 Multiple economies (54) ...........................0.0Number of distinct tariffs ......................................................................... 109 .......... n ......1,755 Multiple economies (2) ................................1
1.03 Share of duty-free imports (%) .................................................................. 42 .......... n ........65.4 Multiple economies (2) .........................100.0
Pillar 2: Foreign market access (1–7) .............................................................. 97 ...........................1.9 Cambodia ..................................................... 5.3 2.01 Tariffs faced (%) ........................................................................................ 73 .......... n ..........5.5 Chile .........................................................3.5 2.02 Index of margin of preference in destination mkts (0–100) ........................ 96 .......... n ..........9.1 Mauritius ................................................97.1
Pillar 3: Efficiency and transparency of border administration (1–7) ................ 8 ...........................5.9 Singapore..................................................... 6.3 3.01 Customs services index (0–1) ................................................................... 13 .......... n ........0.82 Singapore...............................................0.97 3.02 Efficiency of the clearance process (1–5) .................................................. 26 .......... n ..........3.4 Norway ....................................................4.2 3.03 No. of days to import ................................................................................. 2 .......... n .............5 Singapore....................................................4 3.04 No. of documents to import ..................................................................... 11 .......... n .............4 Multiple economies (2) ................................2 3.05 Cost to import (US$ per container) ........................................................... 24 .......... n .........795 Singapore................................................440 3.06 No. of days to export.................................................................................. 1 .......... n .............6 Multiple economies (5) ................................6 3.07 No. of documents to export ....................................................................... 3 .......... n .............3 Multiple economies (2) ................................2 3.08 Cost to export (US$ per container) ........................................................... 28 .......... n .........765 Malaysia ..................................................450 3.09 Irregular payments in exports and imports*............................................... 19 .......... n ..........5.5 New Zealand ............................................6.6 3.10 Time predictability of import procedures* .................................................. 15 .......... n ..........5.3 Finland .....................................................6.0 3.11 Customs transparency index (0–1) ............................................................. 1 .......... n ........1.00 Multiple economies (35) .........................1.00
Pillar 4: Availability and quality of transport infrastructure (1-7) ..................... 78 ...........................3.2 United Arab Emirates ................................... 6.5 4.01 Available int’l airline seat km/week, millions ............................................ 114 .......... n ........21.4 United States ..................................11,481.7 4.02 Quality of air transport infrastructure* ........................................................ 82 .......... n ..........4.1 Singapore.................................................6.8 4.03 Quality of railroad infrastructure* ............................................................... 40 .......... n ..........3.6 Japan .......................................................6.7 4.04 Liner Shipping Connectivity Index (0–157.1) ............................................. 90 .......... n ..........6.4 China ...................................................157.5 4.05 Quality of port infrastructure* .................................................................... 17 .......... n ..........5.6 Netherlands ..............................................6.8 4.06 Paved roads (% of total) ......................................................................... 104 .......... n ........17.9 Multiple economies (18) .......................100.0 4.07 Quality of roads* ....................................................................................... 59 .......... n ..........4.2 United Arab Emirates ...............................6.6
Pillar 5: Availability and quality of transport services (1–7) ............................ 37 ...........................4.7 Singapore..................................................... 5.7 5.01 Ease and affordability of shipment (1–5).................................................... 34 .......... n ..........3.3 Luxembourg .............................................3.8 5.02 Logistics competence (1–5) ...................................................................... 39 .......... n ..........3.3 Norway ....................................................4.2 5.03 Tracking and tracing ability (1–5) ............................................................... 47 .......... n ..........3.2 Germany ..................................................4.2 5.04 Timeliness of shipments in reaching destination (1–5) ............................... 50 .......... n ..........3.6 Luxembourg .............................................4.7 5.05 Postal services efficiency* ......................................................................... 31 .......... n ..........5.7 Japan .......................................................6.8 5.06 Efficiency of transport mode change* ....................................................... 46 .......... n ..........4.5 Hong Kong SAR ......................................6.4
Pillar 6: Availability and use of ICTs (1–7) ........................................................ 12 ...........................6.0 Sweden ........................................................ 6.5 6.01 Mobile phone subscriptions/100 pop. ...................................................... 12 .......... n ......160.4 Hong Kong SAR ..................................229.2 6.02 Individuals using Internet (%) .................................................................... 25 .......... n ........79.0 Iceland ...................................................96.2 6.03 Fixed broadband Internet subscriptions/100 pop. .................................... 20 .......... n ........25.5 Switzerland ............................................39.9 6.04 Active mobile broadband Internet subscriptions/100 pop. ........................ 13 .......... n ........75.3 Singapore.............................................124.5 6.05 ICT use for business-to-business transactions* .......................................... 6 .......... n ..........6.0 Finland .....................................................6.2 6.06 Internet use for business-to-consumer transactions* ................................ 11 .......... n ..........5.8 United Kingdom .......................................6.3 6.07 Government Online Service Index (0–1) .................................................... 18 .......... n ........0.82 Multiple economies (3) ...........................1.00
Pillar 7: Operating environment (1–7) .............................................................. 23 ...........................5.1 Hong Kong SAR ............................................ 5.8 7.01 Protection of property index (1–7) ............................................................. 32 .......... n ..........5.0 Finland .....................................................6.3
Property rights* ......................................................................................... 33 .......... n ..........5.1 Finland .....................................................6.4Intellectual property protection* ................................................................ 30 .......... n ..........4.8 Finland .....................................................6.2
7.02 Efficiency and accountability of public institutions index (1–7) ................... 17 .......... n ..........5.0 Singapore.................................................6.0Judicial efficiency & impartiality in commercial disputes (0–4).................... 13 .......... n ..........3.5 Multiple economies (7) .............................4.0Diversion of public funds* ......................................................................... 29 .......... n ..........4.5 New Zealand ............................................6.5Ease of compliance with government regulation* ...................................... 11 .......... n ..........4.3 Singapore.................................................5.4
7.03 Access to finance index (1–7) .................................................................. 39 .......... n ..........4.3 Hong Kong SAR ......................................5.7Affordability of financial services* ............................................................. 39 .......... n ..........4.7 Hong Kong SAR ......................................6.1Availability of financial services* ................................................................ 37 .......... n ..........5.1 Switzerland ..............................................6.4Ease of access to loans* .......................................................................... 46 .......... n ..........3.1 Qatar ........................................................4.9Availability of trade finance* ...................................................................... 43 .......... n ..........4.1 Hong Kong SAR ......................................5.8
7.04 Openness to foreign participation index (1–7) ........................................... 21 .......... n ..........4.9 Ireland ......................................................5.5Ease of hiring foreign labour* .................................................................. 102 .......... n ..........3.7 United Arab Emirates ...............................5.6Business impact of rules on FDI* .............................................................. 19 .......... n ..........5.3 Ireland ......................................................6.7Openness to multilateral trade rules (0–100) ............................................. 11 .......... n ........82.2 Slovenia .................................................92.2
7.05 Index of physical security (1–7) ................................................................. 18 .......... n ..........6.3 Qatar ........................................................6.8Reliability of police services* ..................................................................... 30 .......... n ..........5.3 Finland .....................................................6.7Business costs of crime and violence* ...................................................... 24 .......... n ..........5.6 Qatar ........................................................6.8Business costs of terrorism* ..................................................................... 12 .......... n ..........6.4 Slovenia ...................................................6.7Homicide cases/100,000 pop. ................................................................. 83 .......... n ..........4.8 Hong Kong SAR ......................................0.2Index of terrorism incidence (1-7) ............................................................. 49 .......... n ..........7.0 Multiple economies (48) ...........................7.0
© 2014 World Economic Forum

Country/Economy Profiles
126 | The Global Enabling Trade Report 2014
* From the list of factors above, respondents were asked to select the five most problematic for trading in their country and to rank them between 1 (most problematic) and 5. The bars in the figure show the responses weighted according to their rankings.
For methodology, indicator descriptions and sources, and for a list of multiple best-performing economies, see page 45.
0 105 15 20 25 30
0 5 10 15 20 25 30
2
3
4
5
6
7
Operating environment
Availability & use of ICTs
Availability & quality of transport services
Availability & quality of transport infrastructure
Efficiency & transparency of border administration
Foreign market access
Domestic market access
1
Enabling Trade Index 2014 Rank Score (out of 138) (1–7)
Enabling Trade Index 2014 ...................118 ..... 3.2
Subindex A: Market access (25%) .................. 114 .......3.2Pillar 1: Domestic market access ................................... 124 .........3.4Pillar 2: Foreign market access ........................................54 .........2.9
Subindex B: Border administration (25%) ...... 110 .......3.4Pillar 3: Efficiency & transparency of border administration ................................................. 110 .........3.4
Subindex C: Infrastructure (25%) .................... 116 .......2.8Pillar 4: Availability & quality of transport infrastructure ...93 .........2.7Pillar 5: Availability & quality of transport services ...........86 ........ 3.8Pillar 6: Availability & use of ICTs ................................... 131 .........2.0
Subindex D: Operating environment (25%) .... 115 .......3.5Pillar 7: Operating environment ...................................... 115 ........ 3.5
Key indicators, 2012 Rank/138
Population (millions) ............................................................ 86.8 ........... 14GDP (US$ billions) ...............................................................42.5 ........... 78GDP per capita (US$) ....................................................... 490.0 ......... 134
Merchandise tradeTrade openness (imports+exports)/GDP ............................ 34.8 ......... 129Share of world trade (%) ..................................................... 0.04 ........... 96Total Exports (US$ billions) ................................................... 3.0 ......... 109Total Imports (US$ billions) ..................................................12.7 ........... 85
Value chain indicators, 2012Share (%) of merchandise trade Exports Imports
Capital goods ..................................................................... 0.9 ........22.5
Intermediate goods .......................................................... 69.1 ........44.2Food and beverages (industrial) ................................... 55.0 ...........7.4Industrial supplies (primary and processed) .................13.7 .........28.1Parts and accessories .................................................... 0.4 .......... 8.2Fuels and lubricants ....................................................... 0.0 .......... 0.5
Consumer goods .............................................................. 29.8 ........ 11.0Food and beverages (consumer) ...................................21.5 .......... 2.6Transport equipment and consumer goods ................... 8.3 .......... 8.4
Passenger motor cars ........................................................ 0.2 ..........2.2
Others .................................................................................. 0.0 ........20.2
The most problematic factors for trade, 2013Most problematic factors for exporting Score*
Difficulties in meeting quality/quantity requirements of buyers ..............................18.0Inappropriate production technology and skills .....................................................14.4Access to trade finance .........................................................................................12.4Identifying potential markets and buyers ...............................................................11.6Access to imported inputs at competitive prices ..................................................10.0Technical requirements and standards abroad .......................................................7.8High cost or delays caused by domestic transportation ........................................ 6.6Tariff barriers abroad ...............................................................................................6.1Corruption at foreign borders ................................................................................. 3.9High cost or delays caused by international transportation ................................... 3.6Burdensome procedures at foreign borders .......................................................... 3.5Rules of origin requirements abroad ....................................................................... 2.3
Most problematic factors for importing Score*
Tariffs .....................................................................................................................23.7Burdensome import procedures ...........................................................................23.1High cost or delays caused by domestic transportation .......................................13.9Corruption at the border ........................................................................................12.0Domestic technical requirements and standards ..................................................11.6High cost or delays caused by international transportation ................................... 6.9Inappropriate telecommunications infrastructure ................................................... 5.8Crime and theft ....................................................................................................... 2.8
Ethiopia
Sources: International Monetary Fund, World Bank, World Trade Organization, United Nations COMTRADE
Ethiopia Land-Locked, Least Developed Countries
Sub-Saharan Africa
© 2014 World Economic Forum

Country/Economy Profiles
The Global Enabling Trade Report 2014 | 127
* Indicator derived from the World Economic Forum’s Executive Opinion Survey and measured on a 1-to-7 scale, where 7 indicates best outcome.
The Enabling Trade Index 2014 in detail n Competitive Advantage n Competitive Disadvantage
For methodology, indicator descriptions and sources, and for a list of multiple best-performing economies, see page 45. Ethiopia
INDICATOR, UNITS RANK/138 VALUE BEST PERFORMER VALUE
Pillar 1: Domestic market access (1–7) ......................................................... 124 ...........................3.4 Multiple economies (2) ................................ 7.0 1.01 Tariff rate (%)........................................................................................... 124 .......... n ........12.7 Multiple economies (2) .............................0.0 1.02 Complexity of tariffs index (1–7) ................................................................ 37 .......... n ..........6.5 Multiple economies (2) .............................7.0
Tariff dispersion (standard deviation) ....................................................... 103 .......... n ........11.6 Multiple economies (2) .............................0.0Tariff peaks (% of tariff lines) ....................................................................... 1 .......... n ..........0.0 Multiple economies (24) ...........................0.0Specific tariffs (% of tariff lines) ................................................................... 1 .......... n ..........0.0 Multiple economies (54) ...........................0.0Number of distinct tariffs ........................................................................... 25 .......... n .............6 Multiple economies (2) ................................1
1.03 Share of duty-free imports (%) ................................................................ 119 .......... n ........13.4 Multiple economies (2) .........................100.0
Pillar 2: Foreign market access (1–7) .............................................................. 54 ...........................2.9 Cambodia ..................................................... 5.3 2.01 Tariffs faced (%) ........................................................................................ 24 .......... n ..........5.0 Chile .........................................................3.5 2.02 Index of margin of preference in destination mkts (0–100) ........................ 74 .......... n ........22.7 Mauritius ................................................97.1
Pillar 3: Efficiency and transparency of border administration (1–7) ............ 110 ...........................3.4 Singapore..................................................... 6.3 3.01 Customs services index (0–1) ................................................................... 87 .......... n ........0.44 Singapore...............................................0.97 3.02 Efficiency of the clearance process (1–5) .................................................. 97 .......... n ..........2.4 Norway ....................................................4.2 3.03 No. of days to import ............................................................................. 129 .......... n ...........44 Singapore....................................................4 3.04 No. of documents to import ................................................................... 115 .......... n ...........10 Multiple economies (2) ................................2 3.05 Cost to import (US$ per container) ......................................................... 122 .......... n ......2,760 Singapore................................................440 3.06 No. of days to export.............................................................................. 131 .......... n ...........44 Multiple economies (5) ................................6 3.07 No. of documents to export ..................................................................... 85 .......... n .............7 Multiple economies (2) ................................2 3.08 Cost to export (US$ per container) ......................................................... 118 .......... n ......2,180 Malaysia ..................................................450 3.09 Irregular payments in exports and imports*............................................... 88 .......... n ..........3.1 New Zealand ............................................6.6 3.10 Time predictability of import procedures* ................................................ 127 .......... n ..........2.8 Finland .....................................................6.0 3.11 Customs transparency index (0–1) ........................................................... 39 .......... n ........0.90 Multiple economies (35) .........................1.00
Pillar 4: Availability and quality of transport infrastructure (1-7) ..................... 93 ...........................2.7 United Arab Emirates ................................... 6.5 4.01 Available int’l airline seat km/week, millions .............................................. 54 .......... n ......247.6 United States ..................................11,481.7 4.02 Quality of air transport infrastructure* ........................................................ 40 .......... n ..........5.3 Singapore.................................................6.8 4.03 Quality of railroad infrastructure* ............................................................. 102 .......... n ..........1.5 Japan .......................................................6.7 4.04 Liner Shipping Connectivity Index (0–157.1) ............................................ n/a ........................n/a China ...................................................157.5 4.05 Quality of port infrastructure* .................................................................. 112 .......... n ..........3.1 Netherlands ..............................................6.8 4.06 Paved roads (% of total) ......................................................................... 117 .......... n ........13.7 Multiple economies (18) .......................100.0 4.07 Quality of roads* ....................................................................................... 63 .......... n ..........4.1 United Arab Emirates ...............................6.6
Pillar 5: Availability and quality of transport services (1–7) ............................ 86 ...........................3.8 Singapore..................................................... 5.7 5.01 Ease and affordability of shipment (1–5).................................................. 116 .......... n ..........2.5 Luxembourg .............................................3.8 5.02 Logistics competence (1–5) ...................................................................... 96 .......... n ..........2.6 Norway ....................................................4.2 5.03 Tracking and tracing ability (1–5) ............................................................... 93 .......... n ..........2.7 Germany ..................................................4.2 5.04 Timeliness of shipments in reaching destination (1–5) ............................... 80 .......... n ..........3.2 Luxembourg .............................................4.7 5.05 Postal services efficiency* ......................................................................... 68 .......... n ..........4.6 Japan .......................................................6.8 5.06 Efficiency of transport mode change* ....................................................... 85 .......... n ..........3.7 Hong Kong SAR ......................................6.4
Pillar 6: Availability and use of ICTs (1–7) ...................................................... 131 ...........................2.0 Sweden ........................................................ 6.5 6.01 Mobile phone subscriptions/100 pop. .................................................... 137 .......... n ........22.4 Hong Kong SAR ..................................229.2 6.02 Individuals using Internet (%) .................................................................. 135 .......... n ..........1.5 Iceland ...................................................96.2 6.03 Fixed broadband Internet subscriptions/100 pop. .................................. 134 .......... n ..........0.0 Switzerland ............................................39.9 6.04 Active mobile broadband Internet subscriptions/100 pop. ........................ 99 .......... n ..........4.0 Singapore.............................................124.5 6.05 ICT use for business-to-business transactions* ...................................... 132 .......... n ..........3.5 Finland .....................................................6.2 6.06 Internet use for business-to-consumer transactions* .............................. 136 .......... n ..........2.7 United Kingdom .......................................6.3 6.07 Government Online Service Index (0–1) .................................................... 75 .......... n ........0.47 Multiple economies (3) ...........................1.00
Pillar 7: Operating environment (1–7) ............................................................ 115 ...........................3.5 Hong Kong SAR ............................................ 5.8 7.01 Protection of property index (1–7) ............................................................. 85 .......... n ..........3.6 Finland .....................................................6.3
Property rights* ......................................................................................... 96 .......... n ..........3.7 Finland .....................................................6.4Intellectual property protection* ................................................................ 80 .......... n ..........3.5 Finland .....................................................6.2
7.02 Efficiency and accountability of public institutions index (1–7) ................... 72 .......... n ..........3.5 Singapore.................................................6.0Judicial efficiency & impartiality in commercial disputes (0–4).................... 63 .......... n ..........2.0 Multiple economies (7) .............................4.0Diversion of public funds* ......................................................................... 64 .......... n ..........3.2 New Zealand ............................................6.5Ease of compliance with government regulation* ...................................... 77 .......... n ..........3.4 Singapore.................................................5.4
7.03 Access to finance index (1–7) ................................................................ 117 .......... n ..........3.0 Hong Kong SAR ......................................5.7Affordability of financial services* ........................................................... 116 .......... n ..........3.4 Hong Kong SAR ......................................6.1Availability of financial services* .............................................................. 124 .......... n ..........3.4 Switzerland ..............................................6.4Ease of access to loans* ........................................................................ 115 .......... n ..........2.0 Qatar ........................................................4.9Availability of trade finance* ...................................................................... 99 .......... n ..........3.3 Hong Kong SAR ......................................5.8
7.04 Openness to foreign participation index (1–7) ......................................... 131 .......... n ..........3.0 Ireland ......................................................5.5Ease of hiring foreign labour* .................................................................. 113 .......... n ..........3.4 United Arab Emirates ...............................5.6Business impact of rules on FDI* .............................................................. 98 .......... n ..........4.1 Ireland ......................................................6.7Openness to multilateral trade rules (0–100) ........................................... 133 .......... n ........27.6 Slovenia .................................................92.2
7.05 Index of physical security (1–7) ............................................................... 108 .......... n ..........4.5 Qatar ........................................................6.8Reliability of police services* ..................................................................... 78 .......... n ..........3.9 Finland .....................................................6.7Business costs of crime and violence* ...................................................... 35 .......... n ..........5.4 Qatar ........................................................6.8Business costs of terrorism* ..................................................................... 70 .......... n ..........5.4 Slovenia ...................................................6.7Homicide cases/100,000 pop. ............................................................... 128 .......... n ........25.5 Hong Kong SAR ......................................0.2Index of terrorism incidence (1-7) ........................................................... 108 .......... n ..........6.7 Multiple economies (48) ...........................7.0
© 2014 World Economic Forum

Country/Economy Profiles
128 | The Global Enabling Trade Report 2014
* From the list of factors above, respondents were asked to select the five most problematic for trading in their country and to rank them between 1 (most problematic) and 5. The bars in the figure show the responses weighted according to their rankings.
For methodology, indicator descriptions and sources, and for a list of multiple best-performing economies, see page 45.
0 105 15 20 25 30
0 5 10 15 20 25 30
2
3
4
5
6
7
Operating environment
Availability & use of ICTs
Availability & quality of transport services
Availability & quality of transport infrastructure
Efficiency & transparency of border administration
Foreign market access
Domestic market access
1
Enabling Trade Index 2014 Rank Score (out of 138) (1–7)
Enabling Trade Index 2014 ...................... 5 ..... 5.2
Subindex A: Market access (25%) ....................75 .......3.4Pillar 1: Domestic market access .....................................46 .........4.9Pillar 2: Foreign market access ........................................97 .........1.9
Subindex B: Border administration (25%) ..........2 .......6.2Pillar 3: Efficiency & transparency of border administration .....................................................2 ........ 6.2
Subindex C: Infrastructure (25%) ...................... 14 .......5.5Pillar 4: Availability & quality of transport infrastructure ...20 ........ 4.8Pillar 5: Availability & quality of transport services ........... 17 .........5.4Pillar 6: Availability & use of ICTs .......................................3 ........ 6.4
Subindex D: Operating environment (25%) ........3 .......5.8Pillar 7: Operating environment ..........................................3 ........ 5.8
Key indicators, 2012 Rank/138
Population (millions) .............................................................. 5.4 ........... 97GDP (US$ billions) ............................................................. 247.6 ........... 44GDP per capita (US$) .................................................. 45,634.9 ........... 16
Merchandise tradeTrade openness (imports+exports)/GDP ............................ 59.5 ........... 80Share of world trade (%) ..................................................... 0.40 ........... 46Total Exports (US$ billions) ..................................................73.0 ........... 48Total Imports (US$ billions) ................................................. 76.2 ........... 40
Value chain indicators, 2012Share (%) of merchandise trade Exports Imports
Capital goods ................................................................... 20.8 ........ 14.9
Intermediate goods .......................................................... 60.0 ........58.0Food and beverages (industrial) ..................................... 0.6 ...........1.1Industrial supplies (primary and processed) .................47.9 ........ 29.4Parts and accessories ................................................... 11.1 ........ 10.3Fuels and lubricants ....................................................... 0.4 .........17.2
Consumer goods .................................................................7.0 ........ 18.1Food and beverages (consumer) .....................................2.0 .......... 5.5Transport equipment and consumer goods ................... 5.0 ........ 12.6
Passenger motor cars ........................................................ 0.7 ..........3.2
Others .................................................................................11.5 .......... 5.7
The most problematic factors for trade, 2013Most problematic factors for exporting Score*
Identifying potential markets and buyers .............................................................. 29.5High cost or delays caused by international transportation ..................................14.2Access to imported inputs at competitive prices .................................................. 11.1Access to trade finance .......................................................................................... 9.5Tariff barriers abroad ...............................................................................................7.0Burdensome procedures at foreign borders .......................................................... 6.3Difficulties in meeting quality/quantity requirements of buyers ............................... 5.8High cost or delays caused by domestic transportation ........................................ 4.6Technical requirements and standards abroad ...................................................... 4.2Corruption at foreign borders ................................................................................. 3.5Rules of origin requirements abroad ....................................................................... 3.0Inappropriate production technology and skills .......................................................1.4
Most problematic factors for importing Score*
High cost or delays caused by international transportation ................................. 30.4Domestic technical requirements and standards ..................................................18.1Burdensome import procedures ...........................................................................18.1Tariffs .....................................................................................................................13.5High cost or delays caused by domestic transportation ....................................... 11.7Inappropriate telecommunications infrastructure ................................................... 3.7Crime and theft ....................................................................................................... 2.3Corruption at the border ......................................................................................... 2.3
Finland
Sources: International Monetary Fund, World Bank, World Trade Organization, United Nations COMTRADE
Finland
Advanced economies
© 2014 World Economic Forum

Country/Economy Profiles
The Global Enabling Trade Report 2014 | 129
* Indicator derived from the World Economic Forum’s Executive Opinion Survey and measured on a 1-to-7 scale, where 7 indicates best outcome.
The Enabling Trade Index 2014 in detail n Competitive Advantage n Competitive Disadvantage
For methodology, indicator descriptions and sources, and for a list of multiple best-performing economies, see page 45. Finland
INDICATOR, UNITS RANK/138 VALUE BEST PERFORMER VALUE
Pillar 1: Domestic market access (1–7) ........................................................... 46 ...........................4.9 Multiple economies (2) ................................ 7.0 1.01 Tariff rate (%)............................................................................................... 5 .......... n ..........0.8 Multiple economies (2) .............................0.0 1.02 Complexity of tariffs index (1–7) .............................................................. 110 .......... n ..........3.1 Multiple economies (2) .............................7.0
Tariff dispersion (standard deviation) ......................................................... 55 .......... n ..........8.4 Multiple economies (2) .............................0.0Tariff peaks (% of tariff lines) ................................................................... 104 .......... n ........10.6 Multiple economies (24) ...........................0.0Specific tariffs (% of tariff lines) ............................................................... 107 .......... n ........11.0 Multiple economies (54) ...........................0.0Number of distinct tariffs ......................................................................... 109 .......... n ......1,755 Multiple economies (2) ................................1
1.03 Share of duty-free imports (%) .................................................................. 42 .......... n ........65.4 Multiple economies (2) .........................100.0
Pillar 2: Foreign market access (1–7) .............................................................. 97 ...........................1.9 Cambodia ..................................................... 5.3 2.01 Tariffs faced (%) ........................................................................................ 73 .......... n ..........5.5 Chile .........................................................3.5 2.02 Index of margin of preference in destination mkts (0–100) ........................ 96 .......... n ..........9.1 Mauritius ................................................97.1
Pillar 3: Efficiency and transparency of border administration (1–7) ................ 2 ...........................6.2 Singapore..................................................... 6.3 3.01 Customs services index (0–1) ..................................................................... 9 .......... n ........0.90 Singapore...............................................0.97 3.02 Efficiency of the clearance process (1–5) .................................................... 8 .......... n ..........3.9 Norway ....................................................4.2 3.03 No. of days to import ............................................................................... 10 .......... n .............7 Singapore....................................................4 3.04 No. of documents to import ..................................................................... 27 .......... n .............5 Multiple economies (2) ................................2 3.05 Cost to import (US$ per container) ............................................................. 8 .......... n .........625 Singapore................................................440 3.06 No. of days to export................................................................................ 17 .......... n .............9 Multiple economies (5) ................................6 3.07 No. of documents to export ..................................................................... 16 .......... n .............4 Multiple economies (2) ................................2 3.08 Cost to export (US$ per container) ........................................................... 10 .......... n .........615 Malaysia ..................................................450 3.09 Irregular payments in exports and imports*................................................. 2 .......... n ..........6.5 New Zealand ............................................6.6 3.10 Time predictability of import procedures* .................................................... 1 .......... n ..........6.0 Finland .....................................................6.0 3.11 Customs transparency index (0–1) ........................................................... 36 .......... n ........0.93 Multiple economies (35) .........................1.00
Pillar 4: Availability and quality of transport infrastructure (1-7) ..................... 20 ...........................4.8 United Arab Emirates ................................... 6.5 4.01 Available int’l airline seat km/week, millions .............................................. 46 .......... n ......363.1 United States ..................................11,481.7 4.02 Quality of air transport infrastructure* .......................................................... 6 .......... n ..........6.2 Singapore.................................................6.8 4.03 Quality of railroad infrastructure* ................................................................. 6 .......... n ..........5.9 Japan .......................................................6.7 4.04 Liner Shipping Connectivity Index (0–157.1) ............................................. 80 .......... n ..........9.3 China ...................................................157.5 4.05 Quality of port infrastructure* ...................................................................... 5 .......... n ..........6.4 Netherlands ..............................................6.8 4.06 Paved roads (% of total) ........................................................................... 57 .......... n ........65.3 Multiple economies (18) .......................100.0 4.07 Quality of roads* ......................................................................................... 9 .......... n ..........6.1 United Arab Emirates ...............................6.6
Pillar 5: Availability and quality of transport services (1–7) ............................ 17 ...........................5.4 Singapore..................................................... 5.7 5.01 Ease and affordability of shipment (1–5).................................................... 20 .......... n ..........3.5 Luxembourg .............................................3.8 5.02 Logistics competence (1–5) ...................................................................... 19 .......... n ..........3.7 Norway ....................................................4.2 5.03 Tracking and tracing ability (1–5) ............................................................... 39 .......... n ..........3.3 Germany ..................................................4.2 5.04 Timeliness of shipments in reaching destination (1–5) ............................... 38 .......... n ..........3.8 Luxembourg .............................................4.7 5.05 Postal services efficiency* ........................................................................... 3 .......... n ..........6.4 Japan .......................................................6.8 5.06 Efficiency of transport mode change* ......................................................... 4 .......... n ..........6.2 Hong Kong SAR ......................................6.4
Pillar 6: Availability and use of ICTs (1–7) .......................................................... 3 ...........................6.4 Sweden ........................................................ 6.5 6.01 Mobile phone subscriptions/100 pop. ........................................................ 8 .......... n ......172.3 Hong Kong SAR ..................................229.2 6.02 Individuals using Internet (%) ...................................................................... 7 .......... n ........91.0 Iceland ...................................................96.2 6.03 Fixed broadband Internet subscriptions/100 pop. .................................... 16 .......... n ........30.3 Switzerland ............................................39.9 6.04 Active mobile broadband Internet subscriptions/100 pop. .......................... 3 .......... n ......106.4 Singapore.............................................124.5 6.05 ICT use for business-to-business transactions* .......................................... 1 .......... n ..........6.2 Finland .....................................................6.2 6.06 Internet use for business-to-consumer transactions* ................................ 16 .......... n ..........5.6 United Kingdom .......................................6.3 6.07 Government Online Service Index (0–1) ...................................................... 7 .......... n ........0.88 Multiple economies (3) ...........................1.00
Pillar 7: Operating environment (1–7) ................................................................ 3 ...........................5.8 Hong Kong SAR ............................................ 5.8 7.01 Protection of property index (1–7) ............................................................... 1 .......... n ..........6.3 Finland .....................................................6.3
Property rights* ........................................................................................... 1 .......... n ..........6.4 Finland .....................................................6.4Intellectual property protection* .................................................................. 1 .......... n ..........6.2 Finland .....................................................6.2
7.02 Efficiency and accountability of public institutions index (1–7) ..................... 5 .......... n ..........5.5 Singapore.................................................6.0Judicial efficiency & impartiality in commercial disputes (0–4).................... 22 .......... n ..........3.0 Multiple economies (7) .............................4.0Diversion of public funds* ........................................................................... 4 .......... n ..........6.1 New Zealand ............................................6.5Ease of compliance with government regulation* ........................................ 4 .......... n ..........5.0 Singapore.................................................5.4
7.03 Access to finance index (1–7) .................................................................... 4 .......... n ..........5.4 Hong Kong SAR ......................................5.7Affordability of financial services* ............................................................... 6 .......... n ..........5.8 Hong Kong SAR ......................................6.1Availability of financial services* .................................................................. 8 .......... n ..........6.1 Switzerland ..............................................6.4Ease of access to loans* .......................................................................... 12 .......... n ..........4.2 Qatar ........................................................4.9Availability of trade finance* ........................................................................ 3 .......... n ..........5.6 Hong Kong SAR ......................................5.8
7.04 Openness to foreign participation index (1–7) ........................................... 16 .......... n ..........4.9 Ireland ......................................................5.5Ease of hiring foreign labour* .................................................................... 28 .......... n ..........4.5 United Arab Emirates ...............................5.6Business impact of rules on FDI* .............................................................. 32 .......... n ..........5.0 Ireland ......................................................6.7Openness to multilateral trade rules (0–100) ............................................. 25 .......... n ........77.8 Slovenia .................................................92.2
7.05 Index of physical security (1–7) ................................................................... 2 .......... n ..........6.7 Qatar ........................................................6.8Reliability of police services* ....................................................................... 1 .......... n ..........6.7 Finland .....................................................6.7Business costs of crime and violence* ........................................................ 3 .......... n ..........6.3 Qatar ........................................................6.8Business costs of terrorism* ....................................................................... 3 .......... n ..........6.7 Slovenia ...................................................6.7Homicide cases/100,000 pop. ................................................................. 52 .......... n ..........2.2 Hong Kong SAR ......................................0.2Index of terrorism incidence (1-7) ............................................................... 1 .......... n ..........7.0 Multiple economies (48) ...........................7.0
© 2014 World Economic Forum

Country/Economy Profiles
130 | The Global Enabling Trade Report 2014
* From the list of factors above, respondents were asked to select the five most problematic for trading in their country and to rank them between 1 (most problematic) and 5. The bars in the figure show the responses weighted according to their rankings.
For methodology, indicator descriptions and sources, and for a list of multiple best-performing economies, see page 45.
0 105 15 20 25 30
0 5 10 15 20 25 30
2
3
4
5
6
7
Operating environment
Availability & use of ICTs
Availability & quality of transport services
Availability & quality of transport infrastructure
Efficiency & transparency of border administration
Foreign market access
Domestic market access
1
Enabling Trade Index 2014 Rank Score (out of 138) (1–7)
Enabling Trade Index 2014 .................... 21 ..... 4.9
Subindex A: Market access (25%) ....................75 .......3.4Pillar 1: Domestic market access .....................................46 .........4.9Pillar 2: Foreign market access ........................................97 .........1.9
Subindex B: Border administration (25%) ........27 .......5.6Pillar 3: Efficiency & transparency of border administration ...................................................27 .........5.6
Subindex C: Infrastructure (25%) ........................9 .......5.8Pillar 4: Availability & quality of transport infrastructure .....4 ........ 6.3Pillar 5: Availability & quality of transport services ...........15 .........5.4Pillar 6: Availability & use of ICTs .....................................22 .........5.7
Subindex D: Operating environment (25%) ......30 .......4.9Pillar 7: Operating environment ........................................30 .........4.9
Key indicators, 2012 Rank/138
Population (millions) ............................................................ 63.4 ........... 21GDP (US$ billions) ..........................................................2,613.9 ............. 5GDP per capita (US$) ...................................................41,223.3 ........... 21
Merchandise tradeTrade openness (imports+exports)/GDP .............................47.6 ......... 106Share of world trade (%) ..................................................... 3.36 ............. 6Total Exports (US$ billions) ............................................... 568.9 ............. 6Total Imports (US$ billions) ................................................673.8 ............. 6
Value chain indicators, 2012Share (%) of merchandise trade Exports Imports
Capital goods ................................................................... 19.8 ........ 14.4
Intermediate goods ...........................................................47.1 ........52.2Food and beverages (industrial) ......................................2.7 .......... 1.0Industrial supplies (primary and processed) ................ 25.2 ........ 25.7Parts and accessories ................................................... 17.7 ........ 13.9Fuels and lubricants ........................................................1.6 .........11.6
Consumer goods .............................................................. 26.3 ........23.2Food and beverages (consumer) .................................... 8.8 .......... 6.3Transport equipment and consumer goods .................. 17.5 ........ 16.8
Passenger motor cars ........................................................ 3.7 .......... 4.6
Others .................................................................................. 3.0 .......... 5.7
The most problematic factors for trade, 2013Most problematic factors for exporting Score*
Tariff barriers abroad .............................................................................................19.3Burdensome procedures at foreign borders .........................................................14.3Identifying potential markets and buyers ...............................................................11.6Access to trade finance .........................................................................................11.3Technical requirements and standards abroad ...................................................... 9.6Rules of origin requirements abroad ........................................................................8.1Corruption at foreign borders ..................................................................................7.7Access to imported inputs at competitive prices ................................................... 6.2High cost or delays caused by domestic transportation ........................................ 4.3High cost or delays caused by international transportation ....................................4.1Inappropriate production technology and skills ...................................................... 2.0Difficulties in meeting quality/quantity requirements of buyers ................................1.4
Most problematic factors for importing Score*
Burdensome import procedures .......................................................................... 25.8Tariffs .................................................................................................................... 22.8Domestic technical requirements and standards ..................................................19.3High cost or delays caused by international transportation ..................................14.1High cost or delays caused by domestic transportation ........................................ 9.2Crime and theft ....................................................................................................... 4.4Corruption at the border ......................................................................................... 2.5Inappropriate telecommunications infrastructure ....................................................1.9
France
Sources: International Monetary Fund, World Bank, World Trade Organization, United Nations COMTRADE
France
Advanced economies
© 2014 World Economic Forum

Country/Economy Profiles
The Global Enabling Trade Report 2014 | 131
* Indicator derived from the World Economic Forum’s Executive Opinion Survey and measured on a 1-to-7 scale, where 7 indicates best outcome.
The Enabling Trade Index 2014 in detail n Competitive Advantage n Competitive Disadvantage
For methodology, indicator descriptions and sources, and for a list of multiple best-performing economies, see page 45. France
INDICATOR, UNITS RANK/138 VALUE BEST PERFORMER VALUE
Pillar 1: Domestic market access (1–7) ........................................................... 46 ...........................4.9 Multiple economies (2) ................................ 7.0 1.01 Tariff rate (%)............................................................................................... 5 .......... n ..........0.8 Multiple economies (2) .............................0.0 1.02 Complexity of tariffs index (1–7) .............................................................. 110 .......... n ..........3.1 Multiple economies (2) .............................7.0
Tariff dispersion (standard deviation) ......................................................... 55 .......... n ..........8.4 Multiple economies (2) .............................0.0Tariff peaks (% of tariff lines) ................................................................... 104 .......... n ........10.6 Multiple economies (24) ...........................0.0Specific tariffs (% of tariff lines) ............................................................... 107 .......... n ........11.0 Multiple economies (54) ...........................0.0Number of distinct tariffs ......................................................................... 109 .......... n ......1,755 Multiple economies (2) ................................1
1.03 Share of duty-free imports (%) .................................................................. 42 .......... n ........65.4 Multiple economies (2) .........................100.0
Pillar 2: Foreign market access (1–7) .............................................................. 97 ...........................1.9 Cambodia ..................................................... 5.3 2.01 Tariffs faced (%) ........................................................................................ 73 .......... n ..........5.5 Chile .........................................................3.5 2.02 Index of margin of preference in destination mkts (0–100) ........................ 96 .......... n ..........9.1 Mauritius ................................................97.1
Pillar 3: Efficiency and transparency of border administration (1–7) .............. 27 ...........................5.6 Singapore..................................................... 6.3 3.01 Customs services index (0–1) ................................................................... 24 .......... n ........0.75 Singapore...............................................0.97 3.02 Efficiency of the clearance process (1–5) .................................................. 18 .......... n ..........3.6 Norway ....................................................4.2 3.03 No. of days to import ............................................................................... 36 .......... n ...........11 Singapore....................................................4 3.04 No. of documents to import ....................................................................... 1 .......... n .............2 Multiple economies (2) ................................2 3.05 Cost to import (US$ per container) ........................................................... 79 .......... n ......1,445 Singapore................................................440 3.06 No. of days to export................................................................................ 24 .......... n ...........10 Multiple economies (5) ................................6 3.07 No. of documents to export ....................................................................... 1 .......... n .............2 Multiple economies (2) ................................2 3.08 Cost to export (US$ per container) ........................................................... 83 .......... n ......1,335 Malaysia ..................................................450 3.09 Irregular payments in exports and imports*............................................... 33 .......... n ..........5.0 New Zealand ............................................6.6 3.10 Time predictability of import procedures* .................................................. 29 .......... n ..........4.8 Finland .....................................................6.0 3.11 Customs transparency index (0–1) ........................................................... 39 .......... n ........0.90 Multiple economies (35) .........................1.00
Pillar 4: Availability and quality of transport infrastructure (1-7) ....................... 4 ...........................6.3 United Arab Emirates ................................... 6.5 4.01 Available int’l airline seat km/week, millions ................................................ 5 .......... n ...3,474.3 United States ..................................11,481.7 4.02 Quality of air transport infrastructure* ........................................................ 10 .......... n ..........6.1 Singapore.................................................6.8 4.03 Quality of railroad infrastructure* ................................................................. 4 .......... n ..........6.3 Japan .......................................................6.7 4.04 Liner Shipping Connectivity Index (0–157.1) ............................................. 11 .......... n ........74.9 China ...................................................157.5 4.05 Quality of port infrastructure* .................................................................... 24 .......... n ..........5.4 Netherlands ..............................................6.8 4.06 Paved roads (% of total) ............................................................................. 1 .......... n ......100.0 Multiple economies (18) .......................100.0 4.07 Quality of roads* ......................................................................................... 2 .......... n ..........6.4 United Arab Emirates ...............................6.6
Pillar 5: Availability and quality of transport services (1–7) ............................ 15 ...........................5.4 Singapore..................................................... 5.7 5.01 Ease and affordability of shipment (1–5)...................................................... 7 .......... n ..........3.7 Luxembourg .............................................3.8 5.02 Logistics competence (1–5) ...................................................................... 15 .......... n ..........3.8 Norway ....................................................4.2 5.03 Tracking and tracing ability (1–5) ............................................................... 12 .......... n ..........3.9 Germany ..................................................4.2 5.04 Timeliness of shipments in reaching destination (1–5) ............................... 13 .......... n ..........4.2 Luxembourg .............................................4.7 5.05 Postal services efficiency* ......................................................................... 19 .......... n ..........6.1 Japan .......................................................6.8 5.06 Efficiency of transport mode change* ....................................................... 29 .......... n ..........5.0 Hong Kong SAR ......................................6.4
Pillar 6: Availability and use of ICTs (1–7) ........................................................ 22 ...........................5.7 Sweden ........................................................ 6.5 6.01 Mobile phone subscriptions/100 pop. ...................................................... 90 .......... n ........97.4 Hong Kong SAR ..................................229.2 6.02 Individuals using Internet (%) .................................................................... 17 .......... n ........83.0 Iceland ...................................................96.2 6.03 Fixed broadband Internet subscriptions/100 pop. ...................................... 4 .......... n ........37.5 Switzerland ............................................39.9 6.04 Active mobile broadband Internet subscriptions/100 pop. ........................ 29 .......... n ........51.8 Singapore.............................................124.5 6.05 ICT use for business-to-business transactions* ........................................ 37 .......... n ..........5.5 Finland .....................................................6.2 6.06 Internet use for business-to-consumer transactions* ................................ 27 .......... n ..........5.3 United Kingdom .......................................6.3 6.07 Government Online Service Index (0–1) ...................................................... 8 .......... n ........0.88 Multiple economies (3) ...........................1.00
Pillar 7: Operating environment (1–7) .............................................................. 30 ...........................4.9 Hong Kong SAR ............................................ 5.8 7.01 Protection of property index (1–7) ............................................................. 16 .......... n ..........5.7 Finland .....................................................6.3
Property rights* ......................................................................................... 18 .......... n ..........5.7 Finland .....................................................6.4Intellectual property protection* ................................................................ 11 .......... n ..........5.7 Finland .....................................................6.2
7.02 Efficiency and accountability of public institutions index (1–7) ................... 38 .......... n ..........4.2 Singapore.................................................6.0Judicial efficiency & impartiality in commercial disputes (0–4).................... 26 .......... n ..........2.8 Multiple economies (7) .............................4.0Diversion of public funds* ......................................................................... 26 .......... n ..........4.8 New Zealand ............................................6.5Ease of compliance with government regulation* .................................... 120 .......... n ..........2.7 Singapore.................................................5.4
7.03 Access to finance index (1–7) .................................................................. 36 .......... n ..........4.3 Hong Kong SAR ......................................5.7Affordability of financial services* ............................................................. 34 .......... n ..........4.9 Hong Kong SAR ......................................6.1Availability of financial services* ................................................................ 33 .......... n ..........5.2 Switzerland ..............................................6.4Ease of access to loans* .......................................................................... 39 .......... n ..........3.2 Qatar ........................................................4.9Availability of trade finance* ...................................................................... 48 .......... n ..........4.0 Hong Kong SAR ......................................5.8
7.04 Openness to foreign participation index (1–7) ........................................... 54 .......... n ..........4.5 Ireland ......................................................5.5Ease of hiring foreign labour* .................................................................. 120 .......... n ..........3.3 United Arab Emirates ...............................5.6Business impact of rules on FDI* .............................................................. 70 .......... n ..........4.5 Ireland ......................................................6.7Openness to multilateral trade rules (0–100) ............................................. 18 .......... n ........81.1 Slovenia .................................................92.2
7.05 Index of physical security (1–7) ................................................................. 49 .......... n ..........5.8 Qatar ........................................................6.8Reliability of police services* ..................................................................... 32 .......... n ..........5.3 Finland .....................................................6.7Business costs of crime and violence* ...................................................... 57 .......... n ..........4.9 Qatar ........................................................6.8Business costs of terrorism* ..................................................................... 87 .......... n ..........5.1 Slovenia ...................................................6.7Homicide cases/100,000 pop. ................................................................. 35 .......... n ..........1.2 Hong Kong SAR ......................................0.2Index of terrorism incidence (1-7) ............................................................. 98 .......... n ..........6.9 Multiple economies (48) ...........................7.0
© 2014 World Economic Forum

Country/Economy Profiles
132 | The Global Enabling Trade Report 2014
* From the list of factors above, respondents were asked to select the five most problematic for trading in their country and to rank them between 1 (most problematic) and 5. The bars in the figure show the responses weighted according to their rankings.
For methodology, indicator descriptions and sources, and for a list of multiple best-performing economies, see page 45.
0 105 15 20 25 30
0 5 10 15 20 25 30
2
3
4
5
6
7
Operating environment
Availability & use of ICTs
Availability & quality of transport services
Availability & quality of transport infrastructure
Efficiency & transparency of border administration
Foreign market access
Domestic market access
1
Enabling Trade Index 2014 Rank Score (out of 138) (1–7)
Enabling Trade Index 2014 ...................122 ......3.1
Subindex A: Market access (25%) ..................134 .......2.5Pillar 1: Domestic market access ...................................132 ........ 3.0Pillar 2: Foreign market access ........................................96 .........1.9
Subindex B: Border administration (25%) ........99 .......3.7Pillar 3: Efficiency & transparency of border administration ...................................................99 .........3.7
Subindex C: Infrastructure (25%) .................... 124 .......2.7Pillar 4: Availability & quality of transport infrastructure .129 ........ 2.2Pillar 5: Availability & quality of transport services .........135 .........2.9Pillar 6: Availability & use of ICTs ...................................102 ........ 3.0
Subindex D: Operating environment (25%) ....107 .......3.6Pillar 7: Operating environment ...................................... 107 ........ 3.6
Key indicators, 2012 Rank/138
Population (millions) ...............................................................1.5 ......... 128GDP (US$ billions) ...............................................................18.4 ......... 101GDP per capita (US$) ...................................................11,942.2 ........... 52
Merchandise tradeTrade openness (imports+exports)/GDP ............................ 85.2 ........... 44Share of world trade (%) ..................................................... 0.04 ......... 100Total Exports (US$ billions) ....................................................9.7 ........... 83Total Imports (US$ billions) ................................................... 3.6 ......... 120
The most problematic factors for trade, 2013Most problematic factors for exporting Score*
High cost or delays caused by domestic transportation .......................................16.4High cost or delays caused by international transportation ..................................13.0Access to trade finance ......................................................................................... 11.1Inappropriate production technology and skills ...................................................... 9.9Burdensome procedures at foreign borders .......................................................... 9.3Difficulties in meeting quality/quantity requirements of buyers ................................7.3Access to imported inputs at competitive prices .................................................... 7.1Identifying potential markets and buyers ................................................................ 6.8Tariff barriers abroad .............................................................................................. 6.6Technical requirements and standards abroad ...................................................... 6.0Rules of origin requirements abroad ....................................................................... 3.5Corruption at foreign borders ..................................................................................3.1
Most problematic factors for importing Score*
Burdensome import procedures ...........................................................................24.0Tariffs .................................................................................................................... 23.3High cost or delays caused by international transportation ..................................18.9High cost or delays caused by domestic transportation .......................................12.8Corruption at the border ........................................................................................10.9Inappropriate telecommunications infrastructure ................................................... 4.2Domestic technical requirements and standards ................................................... 3.6Crime and theft ....................................................................................................... 2.2
Gabon
Sources: International Monetary Fund, World Bank, World Trade Organization, United Nations COMTRADE
Gabon
Sub-Saharan Africa
© 2014 World Economic Forum

Country/Economy Profiles
The Global Enabling Trade Report 2014 | 133
* Indicator derived from the World Economic Forum’s Executive Opinion Survey and measured on a 1-to-7 scale, where 7 indicates best outcome.
The Enabling Trade Index 2014 in detail n Competitive Advantage n Competitive Disadvantage
For methodology, indicator descriptions and sources, and for a list of multiple best-performing economies, see page 45. Gabon
INDICATOR, UNITS RANK/138 VALUE BEST PERFORMER VALUE
Pillar 1: Domestic market access (1–7) ......................................................... 132 ...........................3.0 Multiple economies (2) ................................ 7.0 1.01 Tariff rate (%)........................................................................................... 129 .......... n ........14.3 Multiple economies (2) .............................0.0 1.02 Complexity of tariffs index (1–7) ................................................................ 26 .......... n ..........6.6 Multiple economies (2) .............................7.0
Tariff dispersion (standard deviation) ......................................................... 91 .......... n ..........9.5 Multiple economies (2) .............................0.0Tariff peaks (% of tariff lines) ....................................................................... 1 .......... n ..........0.0 Multiple economies (24) ...........................0.0Specific tariffs (% of tariff lines) ................................................................... 1 .......... n ..........0.0 Multiple economies (54) ...........................0.0Number of distinct tariffs ........................................................................... 19 .......... n .............5 Multiple economies (2) ................................1
1.03 Share of duty-free imports (%) ................................................................ 130 .......... n ..........4.1 Multiple economies (2) .........................100.0
Pillar 2: Foreign market access (1–7) .............................................................. 96 ...........................1.9 Cambodia ..................................................... 5.3 2.01 Tariffs faced (%) ...................................................................................... 112 .......... n ..........5.6 Chile .........................................................3.5 2.02 Index of margin of preference in destination mkts (0–100) ........................ 86 .......... n ........15.9 Mauritius ................................................97.1
Pillar 3: Efficiency and transparency of border administration (1–7) .............. 99 ...........................3.7 Singapore..................................................... 6.3 3.01 Customs services index (0–1) ................................................................... 98 .......... n ........0.38 Singapore...............................................0.97 3.02 Efficiency of the clearance process (1–5) ................................................ 132 .......... n ..........2.0 Norway ....................................................4.2 3.03 No. of days to import ............................................................................... 88 .......... n ...........22 Singapore....................................................4 3.04 No. of documents to import ..................................................................... 82 .......... n .............8 Multiple economies (2) ................................2 3.05 Cost to import (US$ per container) ......................................................... 109 .......... n ......2,175 Singapore................................................440 3.06 No. of days to export................................................................................ 85 .......... n ...........20 Multiple economies (5) ................................6 3.07 No. of documents to export ..................................................................... 65 .......... n .............6 Multiple economies (2) ................................2 3.08 Cost to export (US$ per container) ......................................................... 116 .......... n ......2,045 Malaysia ..................................................450 3.09 Irregular payments in exports and imports*............................................... 69 .......... n ..........3.6 New Zealand ............................................6.6 3.10 Time predictability of import procedures* ................................................ 117 .......... n ..........3.1 Finland .....................................................6.0 3.11 Customs transparency index (0–1) ........................................................... 83 .......... n ........0.70 Multiple economies (35) .........................1.00
Pillar 4: Availability and quality of transport infrastructure (1-7) ................... 129 ...........................2.2 United Arab Emirates ................................... 6.5 4.01 Available int’l airline seat km/week, millions ............................................ 106 .......... n ........28.6 United States ..................................11,481.7 4.02 Quality of air transport infrastructure* ...................................................... 102 .......... n ..........3.6 Singapore.................................................6.8 4.03 Quality of railroad infrastructure* ............................................................... 72 .......... n ..........2.4 Japan .......................................................6.7 4.04 Liner Shipping Connectivity Index (0–157.1) ............................................. 81 .......... n ..........9.0 China ...................................................157.5 4.05 Quality of port infrastructure* .................................................................. 124 .......... n ..........2.7 Netherlands ..............................................6.8 4.06 Paved roads (% of total) ......................................................................... 122 .......... n ........12.0 Multiple economies (18) .......................100.0 4.07 Quality of roads* ..................................................................................... 131 .......... n ..........2.3 United Arab Emirates ...............................6.6
Pillar 5: Availability and quality of transport services (1–7) .......................... 135 ...........................2.9 Singapore..................................................... 5.7 5.01 Ease and affordability of shipment (1–5).................................................. 109 .......... n ..........2.6 Luxembourg .............................................3.8 5.02 Logistics competence (1–5) .................................................................... 127 .......... n ..........2.3 Norway ....................................................4.2 5.03 Tracking and tracing ability (1–5) ............................................................. 138 .......... n ..........1.9 Germany ..................................................4.2 5.04 Timeliness of shipments in reaching destination (1–5) ............................. 137 .......... n ..........2.3 Luxembourg .............................................4.7 5.05 Postal services efficiency* ....................................................................... 123 .......... n ..........2.8 Japan .......................................................6.8 5.06 Efficiency of transport mode change* ..................................................... 124 .......... n ..........2.8 Hong Kong SAR ......................................6.4
Pillar 6: Availability and use of ICTs (1–7) ...................................................... 102 ...........................3.0 Sweden ........................................................ 6.5 6.01 Mobile phone subscriptions/100 pop. ........................................................ 6 .......... n ......179.5 Hong Kong SAR ..................................229.2 6.02 Individuals using Internet (%) .................................................................. 117 .......... n ..........8.6 Iceland ...................................................96.2 6.03 Fixed broadband Internet subscriptions/100 pop. .................................. 111 .......... n ..........0.3 Switzerland ............................................39.9 6.04 Active mobile broadband Internet subscriptions/100 pop. ...................... 127 .......... n ..........0.0 Singapore.............................................124.5 6.05 ICT use for business-to-business transactions* ...................................... 115 .......... n ..........4.1 Finland .....................................................6.2 6.06 Internet use for business-to-consumer transactions* .............................. 127 .......... n ..........3.1 United Kingdom .......................................6.3 6.07 Government Online Service Index (0–1) .................................................. 126 .......... n ........0.19 Multiple economies (3) ...........................1.00
Pillar 7: Operating environment (1–7) ............................................................ 107 ...........................3.6 Hong Kong SAR ............................................ 5.8 7.01 Protection of property index (1–7) ............................................................. 96 .......... n ..........3.4 Finland .....................................................6.3
Property rights* ......................................................................................... 71 .......... n ..........4.1 Finland .....................................................6.4Intellectual property protection* .............................................................. 121 .......... n ..........2.6 Finland .....................................................6.2
7.02 Efficiency and accountability of public institutions index (1–7) ................. 109 .......... n ..........3.0 Singapore.................................................6.0Judicial efficiency & impartiality in commercial disputes (0–4).................. 113 .......... n ..........1.0 Multiple economies (7) .............................4.0Diversion of public funds* ......................................................................... 88 .......... n ..........2.8 New Zealand ............................................6.5Ease of compliance with government regulation* ...................................... 43 .......... n ..........3.7 Singapore.................................................5.4
7.03 Access to finance index (1–7) ................................................................ 112 .......... n ..........3.2 Hong Kong SAR ......................................5.7Affordability of financial services* ........................................................... 122 .......... n ..........3.3 Hong Kong SAR ......................................6.1Availability of financial services* .............................................................. 121 .......... n ..........3.5 Switzerland ..............................................6.4Ease of access to loans* .......................................................................... 75 .......... n ..........2.7 Qatar ........................................................4.9Availability of trade finance* .................................................................... 108 .......... n ..........3.1 Hong Kong SAR ......................................5.8
7.04 Openness to foreign participation index (1–7) ......................................... 115 .......... n ..........3.6 Ireland ......................................................5.5Ease of hiring foreign labour* .................................................................. 135 .......... n ..........2.7 United Arab Emirates ...............................5.6Business impact of rules on FDI* .............................................................. 76 .......... n ..........4.5 Ireland ......................................................6.7Openness to multilateral trade rules (0–100) ............................................. 98 .......... n ........55.5 Slovenia .................................................92.2
7.05 Index of physical security (1–7) ................................................................. 86 .......... n ..........5.0 Qatar ........................................................6.8Reliability of police services* ................................................................... 102 .......... n ..........3.5 Finland .....................................................6.7Business costs of crime and violence* ...................................................... 73 .......... n ..........4.6 Qatar ........................................................6.8Business costs of terrorism* ..................................................................... 59 .......... n ..........5.6 Slovenia ...................................................6.7Homicide cases/100,000 pop. ............................................................... 110 .......... n ........13.8 Hong Kong SAR ......................................0.2Index of terrorism incidence (1-7) ............................................................... 1 .......... n ..........7.0 Multiple economies (48) ...........................7.0
© 2014 World Economic Forum

Country/Economy Profiles
134 | The Global Enabling Trade Report 2014
* From the list of factors above, respondents were asked to select the five most problematic for trading in their country and to rank them between 1 (most problematic) and 5. The bars in the figure show the responses weighted according to their rankings.
For methodology, indicator descriptions and sources, and for a list of multiple best-performing economies, see page 45.
0 105 15 20 25 30
0 5 10 15 20 25 30
2
3
4
5
6
7
Operating environment
Availability & use of ICTs
Availability & quality of transport services
Availability & quality of transport infrastructure
Efficiency & transparency of border administration
Foreign market access
Domestic market access
1
Enabling Trade Index 2014 Rank Score (out of 138) (1–7)
Enabling Trade Index 2014 .................... 99 ..... 3.6
Subindex A: Market access (25%) ..................129 .......2.8Pillar 1: Domestic market access ...................................130 ........ 3.2Pillar 2: Foreign market access ........................................75 .........2.4
Subindex B: Border administration (25%) ........81 .......4.1Pillar 3: Efficiency & transparency of border administration ...................................................81 .........4.1
Subindex C: Infrastructure (25%) ......................99 .......3.1Pillar 4: Availability & quality of transport infrastructure ...83 ........ 3.0Pillar 5: Availability & quality of transport services ......... 110 ........ 3.5Pillar 6: Availability & use of ICTs ...................................109 .........2.8
Subindex D: Operating environment (25%) ......52 .......4.4Pillar 7: Operating environment ........................................52 .........4.4
Key indicators, 2012 Rank/138
Population (millions) ...............................................................1.8 ......... 127GDP (US$ billions) ................................................................ 0.9 ......... 138GDP per capita (US$) ........................................................497.3 ......... 133
Merchandise tradeTrade openness (imports+exports)/GDP .............................52.3 ........... 96Share of world trade (%) ..................................................... 0.00 ......... 138Total Exports (US$ billions) ....................................................0.1 ......... 138Total Imports (US$ billions) ................................................... 0.4 ......... 138
Value chain indicators, 2011Share (%) of merchandise trade Exports Imports
Capital goods ......................................................................1.5 .......... 7.0
Intermediate goods ...........................................................47.6 ........33.8Food and beverages (industrial) ................................... 30.9 ...........4.1Industrial supplies (primary and processed) .................16.3 ........ 25.2Parts and accessories .................................................... 0.4 .......... 4.4Fuels and lubricants ........................................................0.1 .......... 0.0
Consumer goods .............................................................. 50.9 ........32.5Food and beverages (consumer) .................................. 50.5 ........ 21.8Transport equipment and consumer goods ................... 0.4 ........ 10.6
Passenger motor cars ........................................................ 0.0 .......... 4.8
Others .................................................................................. 0.0 ........22.0
The most problematic factors for trade, 2013Most problematic factors for exporting Score*
Access to trade finance .........................................................................................18.9Identifying potential markets and buyers ...............................................................16.1Difficulties in meeting quality/quantity requirements of buyers ............................... 9.3Tariff barriers abroad .............................................................................................. 8.3Inappropriate production technology and skills .......................................................8.1High cost or delays caused by international transportation ....................................8.1Access to imported inputs at competitive prices .................................................... 7.1Technical requirements and standards abroad .......................................................7.0Burdensome procedures at foreign borders .......................................................... 6.0High cost or delays caused by domestic transportation ........................................ 4.9Corruption at foreign borders ................................................................................. 4.5Rules of origin requirements abroad ........................................................................1.7
Most problematic factors for importing Score*
Tariffs .................................................................................................................... 30.3Corruption at the border ........................................................................................15.0Burdensome import procedures ...........................................................................14.8High cost or delays caused by international transportation ..................................13.4Domestic technical requirements and standards ..................................................10.7High cost or delays caused by domestic transportation ........................................ 8.9Inappropriate telecommunications infrastructure ................................................... 4.8Crime and theft ........................................................................................................2.1
Gambia, The
Sources: International Monetary Fund, World Bank, World Trade Organization, United Nations COMTRADE
Gambia, The Least Developed Countries
Sub-Saharan Africa
© 2014 World Economic Forum

Country/Economy Profiles
The Global Enabling Trade Report 2014 | 135
* Indicator derived from the World Economic Forum’s Executive Opinion Survey and measured on a 1-to-7 scale, where 7 indicates best outcome.
The Enabling Trade Index 2014 in detail n Competitive Advantage n Competitive Disadvantage
For methodology, indicator descriptions and sources, and for a list of multiple best-performing economies, see page 45. Gambia, The
INDICATOR, UNITS RANK/138 VALUE BEST PERFORMER VALUE
Pillar 1: Domestic market access (1–7) ......................................................... 130 ...........................3.2 Multiple economies (2) ................................ 7.0 1.01 Tariff rate (%)........................................................................................... 127 .......... n ........13.7 Multiple economies (2) .............................0.0 1.02 Complexity of tariffs index (1–7) ................................................................ 17 .......... n ..........6.7 Multiple economies (2) .............................7.0
Tariff dispersion (standard deviation) ......................................................... 42 .......... n ..........7.5 Multiple economies (2) .............................0.0Tariff peaks (% of tariff lines) ....................................................................... 1 .......... n ..........0.0 Multiple economies (24) ...........................0.0Specific tariffs (% of tariff lines) ................................................................... 1 .......... n ..........0.0 Multiple economies (54) ...........................0.0Number of distinct tariffs ............................................................................. 5 .......... n .............4 Multiple economies (2) ................................1
1.03 Share of duty-free imports (%) ................................................................ 121 .......... n ..........9.2 Multiple economies (2) .........................100.0
Pillar 2: Foreign market access (1–7) .............................................................. 75 ...........................2.4 Cambodia ..................................................... 5.3 2.01 Tariffs faced (%) ........................................................................................ 41 .......... n ..........5.3 Chile .........................................................3.5 2.02 Index of margin of preference in destination mkts (0–100) ........................ 83 .......... n ........17.5 Mauritius ................................................97.1
Pillar 3: Efficiency and transparency of border administration (1–7) .............. 81 ...........................4.1 Singapore..................................................... 6.3 3.01 Customs services index (0–1) ................................................................... 79 .......... n ........0.51 Singapore...............................................0.97 3.02 Efficiency of the clearance process (1–5) ................................................ 128 .......... n ..........2.1 Norway ....................................................4.2 3.03 No. of days to import ............................................................................... 83 .......... n ...........21 Singapore....................................................4 3.04 No. of documents to import ..................................................................... 57 .......... n .............7 Multiple economies (2) ................................2 3.05 Cost to import (US$ per container) ........................................................... 31 .......... n .........895 Singapore................................................440 3.06 No. of days to export.............................................................................. 101 .......... n ...........23 Multiple economies (5) ................................6 3.07 No. of documents to export ..................................................................... 65 .......... n .............6 Multiple economies (2) ................................2 3.08 Cost to export (US$ per container) ........................................................... 71 .......... n ......1,190 Malaysia ..................................................450 3.09 Irregular payments in exports and imports*............................................... 70 .......... n ..........3.6 New Zealand ............................................6.6 3.10 Time predictability of import procedures* .................................................. 45 .......... n ..........4.3 Finland .....................................................6.0 3.11 Customs transparency index (0–1) ........................................................... 92 .......... n ........0.60 Multiple economies (35) .........................1.00
Pillar 4: Availability and quality of transport infrastructure (1-7) ..................... 83 ...........................3.0 United Arab Emirates ................................... 6.5 4.01 Available int’l airline seat km/week, millions ............................................ 125 .......... n ........14.5 United States ..................................11,481.7 4.02 Quality of air transport infrastructure* ........................................................ 58 .......... n ..........4.7 Singapore.................................................6.8 4.03 Quality of railroad infrastructure* .............................................................. n/a ........................n/a Japan .......................................................6.7 4.04 Liner Shipping Connectivity Index (0–157.1) ............................................. 92 .......... n ..........5.9 China ...................................................157.5 4.05 Quality of port infrastructure* .................................................................... 48 .......... n ..........4.6 Netherlands ..............................................6.8 4.06 Paved roads (% of total) ......................................................................... 100 .......... n ........19.3 Multiple economies (18) .......................100.0 4.07 Quality of roads* ....................................................................................... 56 .......... n ..........4.2 United Arab Emirates ...............................6.6
Pillar 5: Availability and quality of transport services (1–7) .......................... 110 ...........................3.5 Singapore..................................................... 5.7 5.01 Ease and affordability of shipment (1–5).................................................... 98 .......... n ..........2.7 Luxembourg .............................................3.8 5.02 Logistics competence (1–5) .................................................................... 129 .......... n ..........2.2 Norway ....................................................4.2 5.03 Tracking and tracing ability (1–5) ............................................................. 137 .......... n ..........2.0 Germany ..................................................4.2 5.04 Timeliness of shipments in reaching destination (1–5) ............................. 135 .......... n ..........2.5 Luxembourg .............................................4.7 5.05 Postal services efficiency* ......................................................................... 69 .......... n ..........4.6 Japan .......................................................6.8 5.06 Efficiency of transport mode change* ....................................................... 45 .......... n ..........4.5 Hong Kong SAR ......................................6.4
Pillar 6: Availability and use of ICTs (1–7) ...................................................... 109 ...........................2.8 Sweden ........................................................ 6.5 6.01 Mobile phone subscriptions/100 pop. .................................................... 103 .......... n ........85.2 Hong Kong SAR ..................................229.2 6.02 Individuals using Internet (%) .................................................................. 111 .......... n ........12.4 Iceland ...................................................96.2 6.03 Fixed broadband Internet subscriptions/100 pop. .................................. 127 .......... n ..........0.0 Switzerland ............................................39.9 6.04 Active mobile broadband Internet subscriptions/100 pop. ...................... 113 .......... n ..........1.2 Singapore.............................................124.5 6.05 ICT use for business-to-business transactions* ........................................ 75 .......... n ..........4.8 Finland .....................................................6.2 6.06 Internet use for business-to-consumer transactions* ................................ 81 .......... n ..........4.3 United Kingdom .......................................6.3 6.07 Government Online Service Index (0–1) .................................................. 106 .......... n ........0.32 Multiple economies (3) ...........................1.00
Pillar 7: Operating environment (1–7) .............................................................. 52 ...........................4.4 Hong Kong SAR ............................................ 5.8 7.01 Protection of property index (1–7) ............................................................. 47 .......... n ..........4.3 Finland .....................................................6.3
Property rights* ......................................................................................... 56 .......... n ..........4.4 Finland .....................................................6.4Intellectual property protection* ................................................................ 40 .......... n ..........4.2 Finland .....................................................6.2
7.02 Efficiency and accountability of public institutions index (1–7) ................... 37 .......... n ..........4.2 Singapore.................................................6.0Judicial efficiency & impartiality in commercial disputes (0–4)................... n/a ........................n/a Multiple economies (7) .............................4.0Diversion of public funds* ......................................................................... 38 .......... n ..........4.3 New Zealand ............................................6.5Ease of compliance with government regulation* ...................................... 18 .......... n ..........4.2 Singapore.................................................5.4
7.03 Access to finance index (1–7) .................................................................. 75 .......... n ..........3.7 Hong Kong SAR ......................................5.7Affordability of financial services* ............................................................. 53 .......... n ..........4.3 Hong Kong SAR ......................................6.1Availability of financial services* ................................................................ 78 .......... n ..........4.2 Switzerland ..............................................6.4Ease of access to loans* .......................................................................... 93 .......... n ..........2.5 Qatar ........................................................4.9Availability of trade finance* ...................................................................... 70 .......... n ..........3.8 Hong Kong SAR ......................................5.8
7.04 Openness to foreign participation index (1–7) ........................................... 90 .......... n ..........4.1 Ireland ......................................................5.5Ease of hiring foreign labour* .................................................................... 22 .......... n ..........4.6 United Arab Emirates ...............................5.6Business impact of rules on FDI* .............................................................. 35 .......... n ..........5.0 Ireland ......................................................6.7Openness to multilateral trade rules (0–100) ........................................... 122 .......... n ........42.5 Slovenia .................................................92.2
7.05 Index of physical security (1–7) ................................................................. 58 .......... n ..........5.6 Qatar ........................................................6.8Reliability of police services* ..................................................................... 48 .......... n ..........4.6 Finland .....................................................6.7Business costs of crime and violence* ...................................................... 34 .......... n ..........5.4 Qatar ........................................................6.8Business costs of terrorism* ..................................................................... 43 .......... n ..........5.9 Slovenia ...................................................6.7Homicide cases/100,000 pop. ............................................................... 105 .......... n ........10.8 Hong Kong SAR ......................................0.2Index of terrorism incidence (1-7) ............................................................... 1 .......... n ..........7.0 Multiple economies (48) ...........................7.0
© 2014 World Economic Forum

Country/Economy Profiles
136 | The Global Enabling Trade Report 2014
* From the list of factors above, respondents were asked to select the five most problematic for trading in their country and to rank them between 1 (most problematic) and 5. The bars in the figure show the responses weighted according to their rankings.
For methodology, indicator descriptions and sources, and for a list of multiple best-performing economies, see page 45.
0 105 15 20 25 30
0 5 10 15 20 25 30
2
3
4
5
6
7
Operating environment
Availability & use of ICTs
Availability & quality of transport services
Availability & quality of transport infrastructure
Efficiency & transparency of border administration
Foreign market access
Domestic market access
1
Enabling Trade Index 2014 Rank Score (out of 138) (1–7)
Enabling Trade Index 2014 .................... 36 ..... 4.5
Subindex A: Market access (25%) ....................13 .......4.6Pillar 1: Domestic market access .......................................7 ........ 6.0Pillar 2: Foreign market access ........................................49 ........ 3.2
Subindex B: Border administration (25%) ........35 .......5.2Pillar 3: Efficiency & transparency of border administration ...................................................35 ........ 5.2
Subindex C: Infrastructure (25%) ......................71 .......3.8Pillar 4: Availability & quality of transport infrastructure ...56 .........3.7Pillar 5: Availability & quality of transport services ...........99 ........ 3.6Pillar 6: Availability & use of ICTs .....................................68 .........4.0
Subindex D: Operating environment (25%) ......48 .......4.4Pillar 7: Operating environment ........................................48 .........4.4
Key indicators, 2012 Rank/138
Population (millions) .............................................................. 4.5 ......... 103GDP (US$ billions) ...............................................................15.8 ......... 103GDP per capita (US$) .....................................................3,519.6 ........... 91
Merchandise tradeTrade openness (imports+exports)/GDP ............................ 64.6 ........... 69Share of world trade (%) ..................................................... 0.03 ......... 107Total Exports (US$ billions) ....................................................2.4 ..........114Total Imports (US$ billions) ....................................................7.8 ......... 100
Value chain indicators, 2012Share (%) of merchandise trade Exports Imports
Capital goods ..................................................................... 3.5 ........ 15.8
Intermediate goods .......................................................... 66.3 ........39.5Food and beverages (industrial) ......................................5.7 .......... 5.0Industrial supplies (primary and processed) ................ 56.3 ........ 24.7Parts and accessories .....................................................1.6 .......... 5.5Fuels and lubricants ....................................................... 2.8 .......... 4.4
Consumer goods .............................................................. 29.0 ........ 24.0Food and beverages (consumer) ...................................21.4 .......... 8.3Transport equipment and consumer goods ....................7.7 ........ 15.7
Passenger motor cars .........................................................1.1 ..........8.5
Others ...................................................................................0.1 ........ 12.2
The most problematic factors for trade, 2013Most problematic factors for exporting Score*
Identifying potential markets and buyers ...............................................................19.8Difficulties in meeting quality/quantity requirements of buyers ..............................15.4Inappropriate production technology and skills .....................................................13.6Access to trade finance .........................................................................................13.5Technical requirements and standards abroad ...................................................... 9.8Access to imported inputs at competitive prices ....................................................7.2High cost or delays caused by domestic transportation ........................................ 4.4High cost or delays caused by international transportation ....................................4.1Rules of origin requirements abroad ....................................................................... 3.9Burdensome procedures at foreign borders .......................................................... 3.5Tariff barriers abroad .............................................................................................. 2.6Corruption at foreign borders ................................................................................. 2.2
Most problematic factors for importing Score*
High cost or delays caused by international transportation ..................................31.2High cost or delays caused by domestic transportation ...................................... 22.2Tariffs .....................................................................................................................18.8Burdensome import procedures ...........................................................................10.1Inappropriate telecommunications infrastructure ................................................... 9.5Domestic technical requirements and standards .................................................... 7.1Crime and theft ........................................................................................................0.7Corruption at the border ......................................................................................... 0.4
Georgia
Sources: International Monetary Fund, World Bank, World Trade Organization, United Nations COMTRADE
Georgia
Commonwealth of Independent States
© 2014 World Economic Forum

Country/Economy Profiles
The Global Enabling Trade Report 2014 | 137
* Indicator derived from the World Economic Forum’s Executive Opinion Survey and measured on a 1-to-7 scale, where 7 indicates best outcome.
The Enabling Trade Index 2014 in detail n Competitive Advantage n Competitive Disadvantage
For methodology, indicator descriptions and sources, and for a list of multiple best-performing economies, see page 45. Georgia
INDICATOR, UNITS RANK/138 VALUE BEST PERFORMER VALUE
Pillar 1: Domestic market access (1–7) ............................................................. 7 ...........................6.0 Multiple economies (2) ................................ 7.0 1.01 Tariff rate (%)............................................................................................. 32 .......... n ..........1.1 Multiple economies (2) .............................0.0 1.02 Complexity of tariffs index (1–7) ................................................................ 95 .......... n ..........4.8 Multiple economies (2) .............................7.0
Tariff dispersion (standard deviation) ......................................................... 84 .......... n ..........8.8 Multiple economies (2) .............................0.0Tariff peaks (% of tariff lines) ................................................................... 137 .......... n ........17.7 Multiple economies (24) ...........................0.0Specific tariffs (% of tariff lines) ................................................................. 84 .......... n ..........1.7 Multiple economies (54) ...........................0.0Number of distinct tariffs ........................................................................... 84 .......... n .........190 Multiple economies (2) ................................1
1.03 Share of duty-free imports (%) .................................................................... 8 .......... n ........91.9 Multiple economies (2) .........................100.0
Pillar 2: Foreign market access (1–7) .............................................................. 49 ...........................3.2 Cambodia ..................................................... 5.3 2.01 Tariffs faced (%) ........................................................................................ 56 .......... n ..........5.4 Chile .........................................................3.5 2.02 Index of margin of preference in destination mkts (0–100) ........................ 40 .......... n ........45.8 Mauritius ................................................97.1
Pillar 3: Efficiency and transparency of border administration (1–7) .............. 35 ...........................5.2 Singapore..................................................... 6.3 3.01 Customs services index (0–1) ................................................................... 18 .......... n ........0.80 Singapore...............................................0.97 3.02 Efficiency of the clearance process (1–5) ................................................ 120 .......... n ..........2.2 Norway ....................................................4.2 3.03 No. of days to import ............................................................................... 28 .......... n ...........10 Singapore....................................................4 3.04 No. of documents to import ..................................................................... 11 .......... n .............4 Multiple economies (2) ................................2 3.05 Cost to import (US$ per container) ........................................................... 91 .......... n ......1,595 Singapore................................................440 3.06 No. of days to export................................................................................ 17 .......... n .............9 Multiple economies (5) ................................6 3.07 No. of documents to export ..................................................................... 16 .......... n .............4 Multiple economies (2) ................................2 3.08 Cost to export (US$ per container) ........................................................... 86 .......... n ......1,355 Malaysia ..................................................450 3.09 Irregular payments in exports and imports*............................................... 17 .......... n ..........5.7 New Zealand ............................................6.6 3.10 Time predictability of import procedures* .................................................... 8 .......... n ..........5.4 Finland .....................................................6.0 3.11 Customs transparency index (0–1) ........................................................... 83 .......... n ........0.70 Multiple economies (35) .........................1.00
Pillar 4: Availability and quality of transport infrastructure (1-7) ..................... 56 ...........................3.7 United Arab Emirates ................................... 6.5 4.01 Available int’l airline seat km/week, millions ............................................ 103 .......... n ........39.1 United States ..................................11,481.7 4.02 Quality of air transport infrastructure* ........................................................ 79 .......... n ..........4.2 Singapore.................................................6.8 4.03 Quality of railroad infrastructure* ............................................................... 34 .......... n ..........3.9 Japan .......................................................6.7 4.04 Liner Shipping Connectivity Index (0–157.1) ........................................... 103 .......... n ..........4.2 China ...................................................157.5 4.05 Quality of port infrastructure* .................................................................... 62 .......... n ..........4.2 Netherlands ..............................................6.8 4.06 Paved roads (% of total) ........................................................................... 24 .......... n ........94.1 Multiple economies (18) .......................100.0 4.07 Quality of roads* ....................................................................................... 55 .......... n ..........4.2 United Arab Emirates ...............................6.6
Pillar 5: Availability and quality of transport services (1–7) ............................ 99 ...........................3.6 Singapore..................................................... 5.7 5.01 Ease and affordability of shipment (1–5).................................................. 130 .......... n ..........2.3 Luxembourg .............................................3.8 5.02 Logistics competence (1–5) .................................................................... 115 .......... n ..........2.4 Norway ....................................................4.2 5.03 Tracking and tracing ability (1–5) ............................................................... 99 .......... n ..........2.6 Germany ..................................................4.2 5.04 Timeliness of shipments in reaching destination (1–5) ............................... 89 .......... n ..........3.1 Luxembourg .............................................4.7 5.05 Postal services efficiency* ......................................................................... 94 .......... n ..........3.8 Japan .......................................................6.8 5.06 Efficiency of transport mode change* ....................................................... 59 .......... n ..........4.1 Hong Kong SAR ......................................6.4
Pillar 6: Availability and use of ICTs (1–7) ........................................................ 68 ...........................4.0 Sweden ........................................................ 6.5 6.01 Mobile phone subscriptions/100 pop. ...................................................... 73 .......... n ......107.8 Hong Kong SAR ..................................229.2 6.02 Individuals using Internet (%) .................................................................... 66 .......... n ........45.5 Iceland ...................................................96.2 6.03 Fixed broadband Internet subscriptions/100 pop. .................................... 62 .......... n ..........8.7 Switzerland ............................................39.9 6.04 Active mobile broadband Internet subscriptions/100 pop. ........................ 85 .......... n ..........8.0 Singapore.............................................124.5 6.05 ICT use for business-to-business transactions* ........................................ 88 .......... n ..........4.6 Finland .....................................................6.2 6.06 Internet use for business-to-consumer transactions* ................................ 94 .......... n ..........4.0 United Kingdom .......................................6.3 6.07 Government Online Service Index (0–1) .................................................... 42 .......... n ........0.60 Multiple economies (3) ...........................1.00
Pillar 7: Operating environment (1–7) .............................................................. 48 ...........................4.4 Hong Kong SAR ............................................ 5.8 7.01 Protection of property index (1–7) ........................................................... 114 .......... n ..........3.1 Finland .....................................................6.3
Property rights* ....................................................................................... 111 .......... n ..........3.4 Finland .....................................................6.4Intellectual property protection* .............................................................. 115 .......... n ..........2.7 Finland .....................................................6.2
7.02 Efficiency and accountability of public institutions index (1–7) ................... 25 .......... n ..........4.7 Singapore.................................................6.0Judicial efficiency & impartiality in commercial disputes (0–4).................... 26 .......... n ..........2.8 Multiple economies (7) .............................4.0Diversion of public funds* ......................................................................... 32 .......... n ..........4.5 New Zealand ............................................6.5Ease of compliance with government regulation* ...................................... 10 .......... n ..........4.4 Singapore.................................................5.4
7.03 Access to finance index (1–7) .................................................................. 91 .......... n ..........3.5 Hong Kong SAR ......................................5.7Affordability of financial services* ............................................................. 78 .......... n ..........4.0 Hong Kong SAR ......................................6.1Availability of financial services* ................................................................ 90 .......... n ..........4.0 Switzerland ..............................................6.4Ease of access to loans* .......................................................................... 92 .......... n ..........2.5 Qatar ........................................................4.9Availability of trade finance* ...................................................................... 91 .......... n ..........3.4 Hong Kong SAR ......................................5.8
7.04 Openness to foreign participation index (1–7) ............................................. 8 .......... n ..........5.0 Ireland ......................................................5.5Ease of hiring foreign labour* ...................................................................... 3 .......... n ..........5.4 United Arab Emirates ...............................5.6Business impact of rules on FDI* .............................................................. 47 .......... n ..........4.8 Ireland ......................................................6.7Openness to multilateral trade rules (0–100) ............................................. 44 .......... n ........72.3 Slovenia .................................................92.2
7.05 Index of physical security (1–7) ................................................................. 44 .......... n ..........5.9 Qatar ........................................................6.8Reliability of police services* ..................................................................... 35 .......... n ..........5.2 Finland .....................................................6.7Business costs of crime and violence* ...................................................... 51 .......... n ..........5.0 Qatar ........................................................6.8Business costs of terrorism* ..................................................................... 68 .......... n ..........5.4 Slovenia ...................................................6.7Homicide cases/100,000 pop. ................................................................. 59 .......... n ..........2.5 Hong Kong SAR ......................................0.2Index of terrorism incidence (1-7) ........................................................... 103 .......... n ..........6.8 Multiple economies (48) ...........................7.0
© 2014 World Economic Forum

Country/Economy Profiles
138 | The Global Enabling Trade Report 2014
* From the list of factors above, respondents were asked to select the five most problematic for trading in their country and to rank them between 1 (most problematic) and 5. The bars in the figure show the responses weighted according to their rankings.
For methodology, indicator descriptions and sources, and for a list of multiple best-performing economies, see page 45.
0 105 15 20 25 30
0 5 10 15 20 25 30
2
3
4
5
6
7
Operating environment
Availability & use of ICTs
Availability & quality of transport services
Availability & quality of transport infrastructure
Efficiency & transparency of border administration
Foreign market access
Domestic market access
1
Enabling Trade Index 2014 Rank Score (out of 138) (1–7)
Enabling Trade Index 2014 .....................10 ......5.1
Subindex A: Market access (25%) ....................75 .......3.4Pillar 1: Domestic market access .....................................46 .........4.9Pillar 2: Foreign market access ........................................97 .........1.9
Subindex B: Border administration (25%) ........13 .......5.8Pillar 3: Efficiency & transparency of border administration ...................................................13 ........ 5.8
Subindex C: Infrastructure (25%) ........................6 .......5.9Pillar 4: Availability & quality of transport infrastructure .....5 ........ 6.3Pillar 5: Availability & quality of transport services .............3 .........5.7Pillar 6: Availability & use of ICTs .....................................21 .........5.7
Subindex D: Operating environment (25%) ...... 12 .......5.4Pillar 7: Operating environment ........................................12 .........5.4
Key indicators, 2012 Rank/138
Population (millions) .............................................................81.9 ........... 16GDP (US$ billions) ......................................................... 3,429.5 ............. 4GDP per capita (US$) ...................................................41,865.5 ........... 20
Merchandise tradeTrade openness (imports+exports)/GDP .............................75.7 ........... 55Share of world trade (%) ..................................................... 6.96 ............. 3Total Exports (US$ billions) ............................................. 1,407.1 ............. 3Total Imports (US$ billions) ..............................................1,167.2 ............. 3
Value chain indicators, 2012Share (%) of merchandise trade Exports Imports
Capital goods ................................................................... 22.2 ........ 14.3
Intermediate goods .......................................................... 49.4 ........59.9Food and beverages (industrial) ..................................... 0.9 ...........1.7Industrial supplies (primary and processed) .................27.5 ........ 28.9Parts and accessories ...................................................19.5 ........ 16.8Fuels and lubricants ........................................................1.4 ........ 12.5
Consumer goods .............................................................. 16.2 ........ 19.0Food and beverages (consumer) .................................... 3.9 .......... 5.2Transport equipment and consumer goods ..................12.2 ........ 13.9
Passenger motor cars ...................................................... 10.9 .......... 3.6
Others ...................................................................................1.4 .......... 3.1
The most problematic factors for trade, 2013Most problematic factors for exporting Score*
Tariff barriers abroad .............................................................................................12.4Corruption at foreign borders ................................................................................11.6Identifying potential markets and buyers ...............................................................11.3Rules of origin requirements abroad ......................................................................11.2Burdensome procedures at foreign borders .........................................................11.2Technical requirements and standards abroad ..................................................... 11.1Access to trade finance .......................................................................................... 9.9High cost or delays caused by international transportation ................................... 6.3Access to imported inputs at competitive prices ....................................................6.1Difficulties in meeting quality/quantity requirements of buyers ............................... 3.8Inappropriate production technology and skills ...................................................... 2.9High cost or delays caused by domestic transportation ........................................ 2.2
Most problematic factors for importing Score*
Domestic technical requirements and standards ................................................. 20.4Tariffs .....................................................................................................................19.9Burdensome import procedures ...........................................................................18.5High cost or delays caused by international transportation ..................................15.4High cost or delays caused by domestic transportation .........................................7.9Crime and theft ........................................................................................................7.7Corruption at the border ......................................................................................... 5.3Inappropriate telecommunications infrastructure ................................................... 4.8
Germany
Sources: International Monetary Fund, World Bank, World Trade Organization, United Nations COMTRADE
Germany
Advanced economies
© 2014 World Economic Forum

Country/Economy Profiles
The Global Enabling Trade Report 2014 | 139
* Indicator derived from the World Economic Forum’s Executive Opinion Survey and measured on a 1-to-7 scale, where 7 indicates best outcome.
The Enabling Trade Index 2014 in detail n Competitive Advantage n Competitive Disadvantage
For methodology, indicator descriptions and sources, and for a list of multiple best-performing economies, see page 45. Germany
INDICATOR, UNITS RANK/138 VALUE BEST PERFORMER VALUE
Pillar 1: Domestic market access (1–7) ........................................................... 46 ...........................4.9 Multiple economies (2) ................................ 7.0 1.01 Tariff rate (%)............................................................................................... 5 .......... n ..........0.8 Multiple economies (2) .............................0.0 1.02 Complexity of tariffs index (1–7) .............................................................. 110 .......... n ..........3.1 Multiple economies (2) .............................7.0
Tariff dispersion (standard deviation) ......................................................... 55 .......... n ..........8.4 Multiple economies (2) .............................0.0Tariff peaks (% of tariff lines) ................................................................... 104 .......... n ........10.6 Multiple economies (24) ...........................0.0Specific tariffs (% of tariff lines) ............................................................... 107 .......... n ........11.0 Multiple economies (54) ...........................0.0Number of distinct tariffs ......................................................................... 109 .......... n ......1,755 Multiple economies (2) ................................1
1.03 Share of duty-free imports (%) .................................................................. 42 .......... n ........65.4 Multiple economies (2) .........................100.0
Pillar 2: Foreign market access (1–7) .............................................................. 97 ...........................1.9 Cambodia ..................................................... 5.3 2.01 Tariffs faced (%) ........................................................................................ 73 .......... n ..........5.5 Chile .........................................................3.5 2.02 Index of margin of preference in destination mkts (0–100) ........................ 96 .......... n ..........9.1 Mauritius ................................................97.1
Pillar 3: Efficiency and transparency of border administration (1–7) .............. 13 ...........................5.8 Singapore..................................................... 6.3 3.01 Customs services index (0–1) ................................................................... 12 .......... n ........0.83 Singapore...............................................0.97 3.02 Efficiency of the clearance process (1–5) .................................................... 2 .......... n ..........4.1 Norway ....................................................4.2 3.03 No. of days to import ............................................................................... 10 .......... n .............7 Singapore....................................................4 3.04 No. of documents to import ..................................................................... 11 .......... n .............4 Multiple economies (2) ................................2 3.05 Cost to import (US$ per container) ........................................................... 35 .......... n .........940 Singapore................................................440 3.06 No. of days to export................................................................................ 17 .......... n .............9 Multiple economies (5) ................................6 3.07 No. of documents to export ..................................................................... 16 .......... n .............4 Multiple economies (2) ................................2 3.08 Cost to export (US$ per container) ........................................................... 42 .......... n .........905 Malaysia ..................................................450 3.09 Irregular payments in exports and imports*............................................... 28 .......... n ..........5.2 New Zealand ............................................6.6 3.10 Time predictability of import procedures* .................................................. 31 .......... n ..........4.7 Finland .....................................................6.0 3.11 Customs transparency index (0–1) ............................................................. 1 .......... n ........1.00 Multiple economies (35) .........................1.00
Pillar 4: Availability and quality of transport infrastructure (1-7) ....................... 5 ...........................6.3 United Arab Emirates ................................... 6.5 4.01 Available int’l airline seat km/week, millions ................................................ 3 .......... n ...4,421.4 United States ..................................11,481.7 4.02 Quality of air transport infrastructure* .......................................................... 8 .......... n ..........6.1 Singapore.................................................6.8 4.03 Quality of railroad infrastructure* ................................................................. 7 .......... n ..........5.7 Japan .......................................................6.7 4.04 Liner Shipping Connectivity Index (0–157.1) ............................................... 7 .......... n ........88.6 China ...................................................157.5 4.05 Quality of port infrastructure* ...................................................................... 9 .......... n ..........5.8 Netherlands ..............................................6.8 4.06 Paved roads (% of total) ............................................................................. 1 .......... n ......100.0 Multiple economies (18) .......................100.0 4.07 Quality of roads* ....................................................................................... 11 .......... n ..........6.0 United Arab Emirates ...............................6.6
Pillar 5: Availability and quality of transport services (1–7) .............................. 3 ...........................5.7 Singapore..................................................... 5.7 5.01 Ease and affordability of shipment (1–5)...................................................... 4 .......... n ..........3.7 Luxembourg .............................................3.8 5.02 Logistics competence (1–5) ........................................................................ 3 .......... n ..........4.1 Norway ....................................................4.2 5.03 Tracking and tracing ability (1–5) ................................................................. 1 .......... n ..........4.2 Germany ..................................................4.2 5.04 Timeliness of shipments in reaching destination (1–5) ................................. 4 .......... n ..........4.4 Luxembourg .............................................4.7 5.05 Postal services efficiency* ......................................................................... 22 .......... n ..........6.0 Japan .......................................................6.8 5.06 Efficiency of transport mode change* ......................................................... 9 .......... n ..........5.8 Hong Kong SAR ......................................6.4
Pillar 6: Availability and use of ICTs (1–7) ........................................................ 21 ...........................5.7 Sweden ........................................................ 6.5 6.01 Mobile phone subscriptions/100 pop. ...................................................... 63 .......... n ......111.6 Hong Kong SAR ..................................229.2 6.02 Individuals using Internet (%) .................................................................... 16 .......... n ........84.0 Iceland ...................................................96.2 6.03 Fixed broadband Internet subscriptions/100 pop. ...................................... 9 .......... n ........33.7 Switzerland ............................................39.9 6.04 Active mobile broadband Internet subscriptions/100 pop. ........................ 40 .......... n ........40.7 Singapore.............................................124.5 6.05 ICT use for business-to-business transactions* ........................................ 20 .......... n ..........5.7 Finland .....................................................6.2 6.06 Internet use for business-to-consumer transactions* ................................ 14 .......... n ..........5.8 United Kingdom .......................................6.3 6.07 Government Online Service Index (0–1) .................................................... 24 .......... n ........0.75 Multiple economies (3) ...........................1.00
Pillar 7: Operating environment (1–7) .............................................................. 12 ...........................5.4 Hong Kong SAR ............................................ 5.8 7.01 Protection of property index (1–7) ............................................................. 13 .......... n ..........5.7 Finland .....................................................6.3
Property rights* ......................................................................................... 14 .......... n ..........5.8 Finland .....................................................6.4Intellectual property protection* ................................................................ 13 .......... n ..........5.6 Finland .....................................................6.2
7.02 Efficiency and accountability of public institutions index (1–7) ................... 10 .......... n ..........5.3 Singapore.................................................6.0Judicial efficiency & impartiality in commercial disputes (0–4)...................... 1 .......... n ..........4.0 Multiple economies (7) .............................4.0Diversion of public funds* ......................................................................... 16 .......... n ..........5.4 New Zealand ............................................6.5Ease of compliance with government regulation* ...................................... 51 .......... n ..........3.6 Singapore.................................................5.4
7.03 Access to finance index (1–7) .................................................................. 26 .......... n ..........4.7 Hong Kong SAR ......................................5.7Affordability of financial services* ............................................................. 19 .......... n ..........5.3 Hong Kong SAR ......................................6.1Availability of financial services* ................................................................ 17 .......... n ..........5.7 Switzerland ..............................................6.4Ease of access to loans* .......................................................................... 44 .......... n ..........3.2 Qatar ........................................................4.9Availability of trade finance* ...................................................................... 25 .......... n ..........4.6 Hong Kong SAR ......................................5.8
7.04 Openness to foreign participation index (1–7) ........................................... 32 .......... n ..........4.8 Ireland ......................................................5.5Ease of hiring foreign labour* .................................................................... 74 .......... n ..........4.1 United Arab Emirates ...............................5.6Business impact of rules on FDI* .............................................................. 50 .......... n ..........4.7 Ireland ......................................................6.7Openness to multilateral trade rules (0–100) ............................................. 17 .......... n ........81.2 Slovenia .................................................92.2
7.05 Index of physical security (1–7) ................................................................. 22 .......... n ..........6.2 Qatar ........................................................6.8Reliability of police services* ..................................................................... 17 .......... n ..........6.0 Finland .....................................................6.7Business costs of crime and violence* ...................................................... 25 .......... n ..........5.6 Qatar ........................................................6.8Business costs of terrorism* ..................................................................... 53 .......... n ..........5.7 Slovenia ...................................................6.7Homicide cases/100,000 pop. ................................................................. 14 .......... n ..........0.8 Hong Kong SAR ......................................0.2Index of terrorism incidence (1-7) ............................................................. 97 .......... n ..........6.9 Multiple economies (48) ...........................7.0
© 2014 World Economic Forum

Country/Economy Profiles
140 | The Global Enabling Trade Report 2014
* From the list of factors above, respondents were asked to select the five most problematic for trading in their country and to rank them between 1 (most problematic) and 5. The bars in the figure show the responses weighted according to their rankings.
For methodology, indicator descriptions and sources, and for a list of multiple best-performing economies, see page 45.
0 105 15 20 25 30
0 5 10 15 20 25 30
2
3
4
5
6
7
Operating environment
Availability & use of ICTs
Availability & quality of transport services
Availability & quality of transport infrastructure
Efficiency & transparency of border administration
Foreign market access
Domestic market access
1
Enabling Trade Index 2014 Rank Score (out of 138) (1–7)
Enabling Trade Index 2014 ...................102 ..... 3.6
Subindex A: Market access (25%) ..................122 .......3.0Pillar 1: Domestic market access ...................................106 .........4.0Pillar 2: Foreign market access ........................................95 .........2.0
Subindex B: Border administration (25%) ........83 .......4.1Pillar 3: Efficiency & transparency of border administration ...................................................83 .........4.1
Subindex C: Infrastructure (25%) ......................95 .......3.2Pillar 4: Availability & quality of transport infrastructure ...94 .........2.7Pillar 5: Availability & quality of transport services .........102 ........ 3.6Pillar 6: Availability & use of ICTs .....................................93 .........3.1
Subindex D: Operating environment (25%) ......71 .......4.1Pillar 7: Operating environment ........................................71 .........4.1
Key indicators, 2012 Rank/138
Population (millions) .............................................................24.9 ........... 43GDP (US$ billions) .............................................................. 40.4 ........... 82GDP per capita (US$) .....................................................1,622.2 ......... 105
Merchandise tradeTrade openness (imports+exports)/GDP .............................73.7 ........... 59Share of world trade (%) ..................................................... 0.08 ........... 77Total Exports (US$ billions) ..................................................13.0 ........... 76Total Imports (US$ billions) ..................................................18.0 ........... 77
Value chain indicators, 2012Share (%) of merchandise trade Exports Imports
Capital goods ..................................................................... 0.6 ........ 23.7
Intermediate goods .......................................................... 79.3 ........ 50.7Food and beverages (industrial) ....................................11.2 .......... 2.0Industrial supplies (primary and processed) ................ 44.3 ........ 36.5Parts and accessories .....................................................0.7 ........ 10.5Fuels and lubricants ..................................................... 23.2 ...........1.7
Consumer goods .............................................................. 19.0 .........17.3Food and beverages (consumer) ................................... 17.9 ........ 10.0Transport equipment and consumer goods ....................1.1 ...........7.3
Passenger motor cars ........................................................ 0.0 .......... 7.6
Others ...................................................................................1.1 .......... 0.6
The most problematic factors for trade, 2013Most problematic factors for exporting Score*
Access to trade finance ........................................................................................ 18.3Tariff barriers abroad .............................................................................................11.5High cost or delays caused by domestic transportation ....................................... 11.1Identifying potential markets and buyers ...............................................................10.8Technical requirements and standards abroad ...................................................... 8.4Burdensome procedures at foreign borders .......................................................... 8.4Access to imported inputs at competitive prices ................................................... 8.2Corruption at foreign borders ................................................................................. 6.3Difficulties in meeting quality/quantity requirements of buyers ............................... 6.0Inappropriate production technology and skills ...................................................... 5.8High cost or delays caused by international transportation ................................... 2.9Rules of origin requirements abroad ....................................................................... 2.4
Most problematic factors for importing Score*
Burdensome import procedures .......................................................................... 23.9Tariffs .....................................................................................................................21.7Corruption at the border ........................................................................................17.2Domestic technical requirements and standards ..................................................15.1High cost or delays caused by domestic transportation ........................................ 8.7Crime and theft ....................................................................................................... 8.0High cost or delays caused by international transportation ................................... 4.2Inappropriate telecommunications infrastructure ....................................................1.2
Ghana
Sources: International Monetary Fund, World Bank, World Trade Organization, United Nations COMTRADE
Ghana
Sub-Saharan Africa
© 2014 World Economic Forum

Country/Economy Profiles
The Global Enabling Trade Report 2014 | 141
* Indicator derived from the World Economic Forum’s Executive Opinion Survey and measured on a 1-to-7 scale, where 7 indicates best outcome.
The Enabling Trade Index 2014 in detail n Competitive Advantage n Competitive Disadvantage
For methodology, indicator descriptions and sources, and for a list of multiple best-performing economies, see page 45. Ghana
INDICATOR, UNITS RANK/138 VALUE BEST PERFORMER VALUE
Pillar 1: Domestic market access (1–7) ......................................................... 106 ...........................4.0 Multiple economies (2) ................................ 7.0 1.01 Tariff rate (%)........................................................................................... 103 .......... n ........10.4 Multiple economies (2) .............................0.0 1.02 Complexity of tariffs index (1–7) ................................................................ 11 .......... n ..........6.7 Multiple economies (2) .............................7.0
Tariff dispersion (standard deviation) ......................................................... 31 .......... n ..........6.9 Multiple economies (2) .............................0.0Tariff peaks (% of tariff lines) ....................................................................... 1 .......... n ..........0.0 Multiple economies (24) ...........................0.0Specific tariffs (% of tariff lines) ................................................................... 1 .......... n ..........0.0 Multiple economies (54) ...........................0.0Number of distinct tariffs ............................................................................. 5 .......... n .............4 Multiple economies (2) ................................1
1.03 Share of duty-free imports (%) ................................................................ 107 .......... n ........26.5 Multiple economies (2) .........................100.0
Pillar 2: Foreign market access (1–7) .............................................................. 95 ...........................2.0 Cambodia ..................................................... 5.3 2.01 Tariffs faced (%) ...................................................................................... 116 .......... n ..........5.7 Chile .........................................................3.5 2.02 Index of margin of preference in destination mkts (0–100) ........................ 77 .......... n ........21.2 Mauritius ................................................97.1
Pillar 3: Efficiency and transparency of border administration (1–7) .............. 83 ...........................4.1 Singapore..................................................... 6.3 3.01 Customs services index (0–1) ................................................................... 36 .......... n ........0.69 Singapore...............................................0.97 3.02 Efficiency of the clearance process (1–5) ................................................ 119 .......... n ..........2.2 Norway ....................................................4.2 3.03 No. of days to import ............................................................................. 126 .......... n ...........42 Singapore....................................................4 3.04 No. of documents to import ..................................................................... 57 .......... n .............7 Multiple economies (2) ................................2 3.05 Cost to import (US$ per container) ........................................................... 70 .......... n ......1,360 Singapore................................................440 3.06 No. of days to export................................................................................ 81 .......... n ...........19 Multiple economies (5) ................................6 3.07 No. of documents to export ..................................................................... 65 .......... n .............6 Multiple economies (2) ................................2 3.08 Cost to export (US$ per container) ........................................................... 37 .......... n .........875 Malaysia ..................................................450 3.09 Irregular payments in exports and imports*............................................. 105 .......... n ..........2.7 New Zealand ............................................6.6 3.10 Time predictability of import procedures* ................................................ 102 .......... n ..........3.4 Finland .....................................................6.0 3.11 Customs transparency index (0–1) ........................................................... 73 .......... n ........0.77 Multiple economies (35) .........................1.00
Pillar 4: Availability and quality of transport infrastructure (1-7) ..................... 94 ...........................2.7 United Arab Emirates ................................... 6.5 4.01 Available int’l airline seat km/week, millions .............................................. 79 .......... n ......101.8 United States ..................................11,481.7 4.02 Quality of air transport infrastructure* ........................................................ 74 .......... n ..........4.3 Singapore.................................................6.8 4.03 Quality of railroad infrastructure* ............................................................... 78 .......... n ..........2.1 Japan .......................................................6.7 4.04 Liner Shipping Connectivity Index (0–157.1) ............................................. 60 .......... n ........19.4 China ...................................................157.5 4.05 Quality of port infrastructure* .................................................................... 65 .......... n ..........4.2 Netherlands ..............................................6.8 4.06 Paved roads (% of total) ......................................................................... 121 .......... n ........12.6 Multiple economies (18) .......................100.0 4.07 Quality of roads* ....................................................................................... 64 .......... n ..........4.1 United Arab Emirates ...............................6.6
Pillar 5: Availability and quality of transport services (1–7) .......................... 102 ...........................3.6 Singapore..................................................... 5.7 5.01 Ease and affordability of shipment (1–5).................................................... 91 .......... n ..........2.7 Luxembourg .............................................3.8 5.02 Logistics competence (1–5) .................................................................... 117 .......... n ..........2.4 Norway ....................................................4.2 5.03 Tracking and tracing ability (1–5) ............................................................... 73 .......... n ..........2.9 Germany ..................................................4.2 5.04 Timeliness of shipments in reaching destination (1–5) ............................. 110 .......... n ..........2.9 Luxembourg .............................................4.7 5.05 Postal services efficiency* ......................................................................... 90 .......... n ..........3.9 Japan .......................................................6.8 5.06 Efficiency of transport mode change* ..................................................... 111 .......... n ..........3.2 Hong Kong SAR ......................................6.4
Pillar 6: Availability and use of ICTs (1–7) ........................................................ 93 ...........................3.1 Sweden ........................................................ 6.5 6.01 Mobile phone subscriptions/100 pop. ...................................................... 85 .......... n ......101.0 Hong Kong SAR ..................................229.2 6.02 Individuals using Internet (%) .................................................................... 99 .......... n ........17.1 Iceland ...................................................96.2 6.03 Fixed broadband Internet subscriptions/100 pop. .................................. 112 .......... n ..........0.3 Switzerland ............................................39.9 6.04 Active mobile broadband Internet subscriptions/100 pop. ........................ 46 .......... n ........33.5 Singapore.............................................124.5 6.05 ICT use for business-to-business transactions* ........................................ 96 .......... n ..........4.4 Finland .....................................................6.2 6.06 Internet use for business-to-consumer transactions* .............................. 109 .......... n ..........3.7 United Kingdom .......................................6.3 6.07 Government Online Service Index (0–1) .................................................. 112 .......... n ........0.30 Multiple economies (3) ...........................1.00
Pillar 7: Operating environment (1–7) .............................................................. 71 ...........................4.1 Hong Kong SAR ............................................ 5.8 7.01 Protection of property index (1–7) ............................................................. 58 .......... n ..........4.1 Finland .....................................................6.3
Property rights* ......................................................................................... 68 .......... n ..........4.2 Finland .....................................................6.4Intellectual property protection* ................................................................ 51 .......... n ..........3.9 Finland .....................................................6.2
7.02 Efficiency and accountability of public institutions index (1–7) ................... 45 .......... n ..........3.9 Singapore.................................................6.0Judicial efficiency & impartiality in commercial disputes (0–4).................... 26 .......... n ..........2.8 Multiple economies (7) .............................4.0Diversion of public funds* ......................................................................... 72 .......... n ..........3.1 New Zealand ............................................6.5Ease of compliance with government regulation* ...................................... 68 .......... n ..........3.5 Singapore.................................................5.4
7.03 Access to finance index (1–7) .................................................................. 76 .......... n ..........3.7 Hong Kong SAR ......................................5.7Affordability of financial services* ............................................................. 68 .......... n ..........4.1 Hong Kong SAR ......................................6.1Availability of financial services* ................................................................ 71 .......... n ..........4.4 Switzerland ..............................................6.4Ease of access to loans* .......................................................................... 97 .......... n ..........2.4 Qatar ........................................................4.9Availability of trade finance* ...................................................................... 74 .......... n ..........3.8 Hong Kong SAR ......................................5.8
7.04 Openness to foreign participation index (1–7) ........................................... 89 .......... n ..........4.1 Ireland ......................................................5.5Ease of hiring foreign labour* .................................................................. 106 .......... n ..........3.6 United Arab Emirates ...............................5.6Business impact of rules on FDI* .............................................................. 67 .......... n ..........4.6 Ireland ......................................................6.7Openness to multilateral trade rules (0–100) ............................................. 76 .......... n ........62.1 Slovenia .................................................92.2
7.05 Index of physical security (1–7) ................................................................. 95 .......... n ..........4.8 Qatar ........................................................6.8Reliability of police services* ..................................................................... 52 .......... n ..........4.5 Finland .....................................................6.7Business costs of crime and violence* ...................................................... 87 .......... n ..........4.2 Qatar ........................................................6.8Business costs of terrorism* ................................................................... 106 .......... n ..........4.6 Slovenia ...................................................6.7Homicide cases/100,000 pop. ............................................................... 114 .......... n ........15.7 Hong Kong SAR ......................................0.2Index of terrorism incidence (1-7) ............................................................... 1 .......... n ..........7.0 Multiple economies (48) ...........................7.0
© 2014 World Economic Forum

Country/Economy Profiles
142 | The Global Enabling Trade Report 2014
* From the list of factors above, respondents were asked to select the five most problematic for trading in their country and to rank them between 1 (most problematic) and 5. The bars in the figure show the responses weighted according to their rankings.
For methodology, indicator descriptions and sources, and for a list of multiple best-performing economies, see page 45.
0 105 15 20 25 30
0 5 10 15 20 25 30
2
3
4
5
6
7
Operating environment
Availability & use of ICTs
Availability & quality of transport services
Availability & quality of transport infrastructure
Efficiency & transparency of border administration
Foreign market access
Domestic market access
1
Enabling Trade Index 2014 Rank Score (out of 138) (1–7)
Enabling Trade Index 2014 .................... 67 ..... 4.0
Subindex A: Market access (25%) ....................75 .......3.4Pillar 1: Domestic market access .....................................46 .........4.9Pillar 2: Foreign market access ........................................97 .........1.9
Subindex B: Border administration (25%) ........59 .......4.6Pillar 3: Efficiency & transparency of border administration ...................................................59 .........4.6
Subindex C: Infrastructure (25%) ......................51 .......4.2Pillar 4: Availability & quality of transport infrastructure ...63 ........ 3.5Pillar 5: Availability & quality of transport services ...........54 ........ 4.3Pillar 6: Availability & use of ICTs .....................................46 ........ 4.8
Subindex D: Operating environment (25%) ......79 .......4.0Pillar 7: Operating environment ........................................79 .........4.0
Key indicators, 2012 Rank/138
Population (millions) .............................................................11.3 ........... 65GDP (US$ billions) .............................................................249.2 ........... 43GDP per capita (US$) ...................................................22,072.5 ........... 34
Merchandise tradeTrade openness (imports+exports)/GDP .............................37.9 ......... 126Share of world trade (%) ..................................................... 0.27 ........... 55Total Exports (US$ billions) ................................................. 35.5 ........... 60Total Imports (US$ billions) ................................................. 63.2 ........... 47
Value chain indicators, 2012Share (%) of merchandise trade Exports Imports
Capital goods ..................................................................... 4.3 ........ 10.2
Intermediate goods .......................................................... 32.1 ........ 57.6Food and beverages (industrial) ......................................1.3 ...........2.1Industrial supplies (primary and processed) ................ 26.0 .........19.1Parts and accessories .....................................................3.1 .......... 5.8Fuels and lubricants ........................................................1.6 ........ 30.7
Consumer goods .............................................................. 25.7 ........24.2Food and beverages (consumer) ...................................14.2 .......... 8.6Transport equipment and consumer goods .................. 11.4 ........ 15.6
Passenger motor cars ........................................................ 0.3 .......... 1.1
Others .................................................................................37.7 .......... 6.9
The most problematic factors for trade, 2013Most problematic factors for exporting Score*
Access to trade finance .........................................................................................24.6High cost or delays caused by domestic transportation .......................................10.8Identifying potential markets and buyers ...............................................................10.7Access to imported inputs at competitive prices ................................................... 9.0Inappropriate production technology and skills .......................................................7.8Burdensome procedures at foreign borders ...........................................................7.5Difficulties in meeting quality/quantity requirements of buyers ............................... 6.9Tariff barriers abroad .............................................................................................. 6.2Technical requirements and standards abroad ...................................................... 5.6High cost or delays caused by international transportation ................................... 4.6Corruption at foreign borders ................................................................................. 4.6Rules of origin requirements abroad ........................................................................1.5
Most problematic factors for importing Score*
Burdensome import procedures ...........................................................................27.7High cost or delays caused by international transportation ..................................16.5Tariffs .....................................................................................................................15.7High cost or delays caused by domestic transportation .......................................14.4Corruption at the border ......................................................................................... 8.8Domestic technical requirements and standards ................................................... 8.5Crime and theft ........................................................................................................5.7Inappropriate telecommunications infrastructure ................................................... 2.6
Greece
Sources: International Monetary Fund, World Bank, World Trade Organization, United Nations COMTRADE
Greece
Advanced economies
© 2014 World Economic Forum

Country/Economy Profiles
The Global Enabling Trade Report 2014 | 143
* Indicator derived from the World Economic Forum’s Executive Opinion Survey and measured on a 1-to-7 scale, where 7 indicates best outcome.
The Enabling Trade Index 2014 in detail n Competitive Advantage n Competitive Disadvantage
For methodology, indicator descriptions and sources, and for a list of multiple best-performing economies, see page 45. Greece
INDICATOR, UNITS RANK/138 VALUE BEST PERFORMER VALUE
Pillar 1: Domestic market access (1–7) ........................................................... 46 ...........................4.9 Multiple economies (2) ................................ 7.0 1.01 Tariff rate (%)............................................................................................... 5 .......... n ..........0.8 Multiple economies (2) .............................0.0 1.02 Complexity of tariffs index (1–7) .............................................................. 110 .......... n ..........3.1 Multiple economies (2) .............................7.0
Tariff dispersion (standard deviation) ......................................................... 55 .......... n ..........8.4 Multiple economies (2) .............................0.0Tariff peaks (% of tariff lines) ................................................................... 104 .......... n ........10.6 Multiple economies (24) ...........................0.0Specific tariffs (% of tariff lines) ............................................................... 107 .......... n ........11.0 Multiple economies (54) ...........................0.0Number of distinct tariffs ......................................................................... 109 .......... n ......1,755 Multiple economies (2) ................................1
1.03 Share of duty-free imports (%) .................................................................. 42 .......... n ........65.4 Multiple economies (2) .........................100.0
Pillar 2: Foreign market access (1–7) .............................................................. 97 ...........................1.9 Cambodia ..................................................... 5.3 2.01 Tariffs faced (%) ........................................................................................ 73 .......... n ..........5.5 Chile .........................................................3.5 2.02 Index of margin of preference in destination mkts (0–100) ........................ 96 .......... n ..........9.1 Mauritius ................................................97.1
Pillar 3: Efficiency and transparency of border administration (1–7) .............. 59 ...........................4.6 Singapore..................................................... 6.3 3.01 Customs services index (0–1) ................................................................... 67 .......... n ........0.57 Singapore...............................................0.97 3.02 Efficiency of the clearance process (1–5) .................................................. 28 .......... n ..........3.4 Norway ....................................................4.2 3.03 No. of days to import ............................................................................... 54 .......... n ...........15 Singapore....................................................4 3.04 No. of documents to import ..................................................................... 43 .......... n .............6 Multiple economies (2) ................................2 3.05 Cost to import (US$ per container) ........................................................... 52 .......... n ......1,135 Singapore................................................440 3.06 No. of days to export................................................................................ 63 .......... n ...........16 Multiple economies (5) ................................6 3.07 No. of documents to export ..................................................................... 16 .......... n .............4 Multiple economies (2) ................................2 3.08 Cost to export (US$ per container) ........................................................... 54 .......... n ......1,040 Malaysia ..................................................450 3.09 Irregular payments in exports and imports*............................................... 65 .......... n ..........3.8 New Zealand ............................................6.6 3.10 Time predictability of import procedures* .................................................. 56 .......... n ..........4.1 Finland .....................................................6.0 3.11 Customs transparency index (0–1) ........................................................... 92 .......... n ........0.60 Multiple economies (35) .........................1.00
Pillar 4: Availability and quality of transport infrastructure (1-7) ..................... 63 ...........................3.5 United Arab Emirates ................................... 6.5 4.01 Available int’l airline seat km/week, millions .............................................. 36 .......... n ......495.5 United States ..................................11,481.7 4.02 Quality of air transport infrastructure* ........................................................ 42 .......... n ..........5.3 Singapore.................................................6.8 4.03 Quality of railroad infrastructure* ............................................................... 60 .......... n ..........2.7 Japan .......................................................6.7 4.04 Liner Shipping Connectivity Index (0–157.1) ............................................. 24 .......... n ........45.4 China ...................................................157.5 4.05 Quality of port infrastructure* .................................................................... 52 .......... n ..........4.5 Netherlands ..............................................6.8 4.06 Paved roads (% of total) ........................................................................... 83 .......... n ........35.4 Multiple economies (18) .......................100.0 4.07 Quality of roads* ....................................................................................... 58 .......... n ..........4.2 United Arab Emirates ...............................6.6
Pillar 5: Availability and quality of transport services (1–7) ............................ 54 ...........................4.3 Singapore..................................................... 5.7 5.01 Ease and affordability of shipment (1–5).................................................... 64 .......... n ..........3.0 Luxembourg .............................................3.8 5.02 Logistics competence (1–5) ...................................................................... 40 .......... n ..........3.2 Norway ....................................................4.2 5.03 Tracking and tracing ability (1–5) ............................................................... 60 .......... n ..........3.0 Germany ..................................................4.2 5.04 Timeliness of shipments in reaching destination (1–5) ............................... 57 .......... n ..........3.5 Luxembourg .............................................4.7 5.05 Postal services efficiency* ......................................................................... 52 .......... n ..........4.9 Japan .......................................................6.8 5.06 Efficiency of transport mode change* ....................................................... 63 .......... n ..........4.0 Hong Kong SAR ......................................6.4
Pillar 6: Availability and use of ICTs (1–7) ........................................................ 46 ...........................4.8 Sweden ........................................................ 6.5 6.01 Mobile phone subscriptions/100 pop. ...................................................... 46 .......... n ......120.0 Hong Kong SAR ..................................229.2 6.02 Individuals using Internet (%) .................................................................... 50 .......... n ........56.0 Iceland ...................................................96.2 6.03 Fixed broadband Internet subscriptions/100 pop. .................................... 27 .......... n ........24.1 Switzerland ............................................39.9 6.04 Active mobile broadband Internet subscriptions/100 pop. ........................ 34 .......... n ........45.7 Singapore.............................................124.5 6.05 ICT use for business-to-business transactions* ...................................... 101 .......... n ..........4.4 Finland .....................................................6.2 6.06 Internet use for business-to-consumer transactions* ................................ 83 .......... n ..........4.2 United Kingdom .......................................6.3 6.07 Government Online Service Index (0–1) .................................................... 47 .......... n ........0.58 Multiple economies (3) ...........................1.00
Pillar 7: Operating environment (1–7) .............................................................. 79 ...........................4.0 Hong Kong SAR ............................................ 5.8 7.01 Protection of property index (1–7) ............................................................. 74 .......... n ..........3.8 Finland .....................................................6.3
Property rights* ......................................................................................... 81 .......... n ..........3.9 Finland .....................................................6.4Intellectual property protection* ................................................................ 65 .......... n ..........3.7 Finland .....................................................6.2
7.02 Efficiency and accountability of public institutions index (1–7) ................... 89 .......... n ..........3.4 Singapore.................................................6.0Judicial efficiency & impartiality in commercial disputes (0–4).................... 26 .......... n ..........2.8 Multiple economies (7) .............................4.0Diversion of public funds* ......................................................................... 95 .......... n ..........2.7 New Zealand ............................................6.5Ease of compliance with government regulation* .................................... 134 .......... n ..........2.2 Singapore.................................................5.4
7.03 Access to finance index (1–7) ................................................................ 121 .......... n ..........2.9 Hong Kong SAR ......................................5.7Affordability of financial services* ........................................................... 110 .......... n ..........3.6 Hong Kong SAR ......................................6.1Availability of financial services* .............................................................. 100 .......... n ..........3.8 Switzerland ..............................................6.4Ease of access to loans* ........................................................................ 136 .......... n ..........1.6 Qatar ........................................................4.9Availability of trade finance* .................................................................... 119 .......... n ..........2.7 Hong Kong SAR ......................................5.8
7.04 Openness to foreign participation index (1–7) ........................................... 70 .......... n ..........4.3 Ireland ......................................................5.5Ease of hiring foreign labour* .................................................................... 66 .......... n ..........4.1 United Arab Emirates ...............................5.6Business impact of rules on FDI* ............................................................ 131 .......... n ..........3.0 Ireland ......................................................6.7Openness to multilateral trade rules (0–100) ............................................... 7 .......... n ........83.9 Slovenia .................................................92.2
7.05 Index of physical security (1–7) ................................................................. 71 .......... n ..........5.5 Qatar ........................................................6.8Reliability of police services* ..................................................................... 71 .......... n ..........4.0 Finland .....................................................6.7Business costs of crime and violence* ...................................................... 67 .......... n ..........4.7 Qatar ........................................................6.8Business costs of terrorism* ..................................................................... 77 .......... n ..........5.3 Slovenia ...................................................6.7Homicide cases/100,000 pop. ................................................................. 45 .......... n ..........1.6 Hong Kong SAR ......................................0.2Index of terrorism incidence (1-7) ........................................................... 121 .......... n ..........6.3 Multiple economies (48) ...........................7.0
© 2014 World Economic Forum

Country/Economy Profiles
144 | The Global Enabling Trade Report 2014
* From the list of factors above, respondents were asked to select the five most problematic for trading in their country and to rank them between 1 (most problematic) and 5. The bars in the figure show the responses weighted according to their rankings.
For methodology, indicator descriptions and sources, and for a list of multiple best-performing economies, see page 45.
0 105 15 20 25 30
0 5 10 15 20 25 30
2
3
4
5
6
7
Operating environment
Availability & use of ICTs
Availability & quality of transport services
Availability & quality of transport infrastructure
Efficiency & transparency of border administration
Foreign market access
Domestic market access
1
Enabling Trade Index 2014 Rank Score (out of 138) (1–7)
Enabling Trade Index 2014 .................... 62 ......4.1
Subindex A: Market access (25%) .................... 12 .......4.6Pillar 1: Domestic market access .......................................8 ........ 6.0Pillar 2: Foreign market access ........................................47 ........ 3.2
Subindex B: Border administration (25%) ........61 .......4.6Pillar 3: Efficiency & transparency of border administration ...................................................61 .........4.6
Subindex C: Infrastructure (25%) ......................78 .......3.7Pillar 4: Availability & quality of transport infrastructure ...72 ........ 3.3Pillar 5: Availability & quality of transport services ...........70 .........4.0Pillar 6: Availability & use of ICTs .....................................86 .........3.7
Subindex D: Operating environment (25%) ......94 .......3.8Pillar 7: Operating environment ........................................94 ........ 3.8
Key indicators, 2012 Rank/138
Population (millions) .............................................................15.1 ........... 60GDP (US$ billions) .............................................................. 50.2 ........... 73GDP per capita (US$) .....................................................3,325.7 ........... 92
Merchandise tradeTrade openness (imports+exports)/GDP ............................ 53.4 ........... 94Share of world trade (%) ......................................................0.07 ........... 83Total Exports (US$ billions) ..................................................10.0 ........... 82Total Imports (US$ billions) .................................................. 17.0 ........... 82
Value chain indicators, 2012Share (%) of merchandise trade Exports Imports
Capital goods ..................................................................... 2.4 ........ 13.1
Intermediate goods .......................................................... 53.9 ........46.4Food and beverages (industrial) ....................................19.2 .......... 3.1Industrial supplies (primary and processed) ................ 30.5 ........ 34.9Parts and accessories .................................................... 0.5 .......... 6.1Fuels and lubricants ........................................................3.7 .......... 2.3
Consumer goods .............................................................. 43.5 ........20.9Food and beverages (consumer) ...................................21.3 ...........7.1Transport equipment and consumer goods ................. 22.2 ........ 13.8
Passenger motor cars .........................................................0.1 ..........2.4
Others ...................................................................................0.1 .........17.1
The most problematic factors for trade, 2013Most problematic factors for exporting Score*
High cost or delays caused by domestic transportation .......................................12.9Identifying potential markets and buyers ...............................................................12.1Inappropriate production technology and skills .....................................................10.4High cost or delays caused by international transportation ..................................10.0Difficulties in meeting quality/quantity requirements of buyers ............................... 9.2Technical requirements and standards abroad ...................................................... 8.6Access to trade finance ........................................................................................... 7.1Rules of origin requirements abroad ........................................................................7.0Burdensome procedures at foreign borders ...........................................................7.0Access to imported inputs at competitive prices ....................................................7.0Tariff barriers abroad .............................................................................................. 4.9Corruption at foreign borders ................................................................................. 3.7
Most problematic factors for importing Score*
Corruption at the border ....................................................................................... 22.6Crime and theft ...................................................................................................... 17.6Burdensome import procedures .......................................................................... 16.3High cost or delays caused by international transportation ..................................11.5High cost or delays caused by domestic transportation .......................................10.8Tariffs ...................................................................................................................... 9.6Domestic technical requirements and standards ................................................... 9.6Inappropriate telecommunications infrastructure ....................................................2.1
Guatemala
Sources: International Monetary Fund, World Bank, World Trade Organization, United Nations COMTRADE
Guatemala
Central America and Caribbean
© 2014 World Economic Forum

Country/Economy Profiles
The Global Enabling Trade Report 2014 | 145
* Indicator derived from the World Economic Forum’s Executive Opinion Survey and measured on a 1-to-7 scale, where 7 indicates best outcome.
The Enabling Trade Index 2014 in detail n Competitive Advantage n Competitive Disadvantage
For methodology, indicator descriptions and sources, and for a list of multiple best-performing economies, see page 45. Guatemala
INDICATOR, UNITS RANK/138 VALUE BEST PERFORMER VALUE
Pillar 1: Domestic market access (1–7) ............................................................. 8 ...........................6.0 Multiple economies (2) ................................ 7.0 1.01 Tariff rate (%)............................................................................................. 50 .......... n ..........3.9 Multiple economies (2) .............................0.0 1.02 Complexity of tariffs index (1–7) ................................................................ 20 .......... n ..........6.6 Multiple economies (2) .............................7.0
Tariff dispersion (standard deviation) ......................................................... 21 .......... n ..........6.4 Multiple economies (2) .............................0.0Tariff peaks (% of tariff lines) ..................................................................... 42 .......... n ..........0.8 Multiple economies (24) ...........................0.0Specific tariffs (% of tariff lines) ................................................................... 1 .......... n ..........0.0 Multiple economies (54) ...........................0.0Number of distinct tariffs ........................................................................... 35 .......... n .............9 Multiple economies (2) ................................1
1.03 Share of duty-free imports (%) .................................................................. 20 .......... n ........80.4 Multiple economies (2) .........................100.0
Pillar 2: Foreign market access (1–7) .............................................................. 47 ...........................3.2 Cambodia ..................................................... 5.3 2.01 Tariffs faced (%) ........................................................................................ 64 .......... n ..........5.4 Chile .........................................................3.5 2.02 Index of margin of preference in destination mkts (0–100) ........................ 33 .......... n ........48.7 Mauritius ................................................97.1
Pillar 3: Efficiency and transparency of border administration (1–7) .............. 61 ...........................4.6 Singapore..................................................... 6.3 3.01 Customs services index (0–1) ................................................................... 60 .......... n ........0.62 Singapore...............................................0.97 3.02 Efficiency of the clearance process (1–5) .................................................. 62 .......... n ..........2.8 Norway ....................................................4.2 3.03 No. of days to import ............................................................................... 64 .......... n ...........17 Singapore....................................................4 3.04 No. of documents to import ..................................................................... 57 .......... n .............7 Multiple economies (2) ................................2 3.05 Cost to import (US$ per container) ........................................................... 84 .......... n ......1,500 Singapore................................................440 3.06 No. of days to export................................................................................ 71 .......... n ...........17 Multiple economies (5) ................................6 3.07 No. of documents to export ................................................................... 108 .......... n .............8 Multiple economies (2) ................................2 3.08 Cost to export (US$ per container) ........................................................... 92 .......... n ......1,435 Malaysia ..................................................450 3.09 Irregular payments in exports and imports*............................................... 74 .......... n ..........3.5 New Zealand ............................................6.6 3.10 Time predictability of import procedures* .................................................. 69 .......... n ..........3.8 Finland .....................................................6.0 3.11 Customs transparency index (0–1) ............................................................. 1 .......... n ........1.00 Multiple economies (35) .........................1.00
Pillar 4: Availability and quality of transport infrastructure (1-7) ..................... 72 ...........................3.3 United Arab Emirates ................................... 6.5 4.01 Available int’l airline seat km/week, millions ............................................ 100 .......... n ........43.0 United States ..................................11,481.7 4.02 Quality of air transport infrastructure* ........................................................ 66 .......... n ..........4.5 Singapore.................................................6.8 4.03 Quality of railroad infrastructure* .............................................................. n/a ........................n/a Japan .......................................................6.7 4.04 Liner Shipping Connectivity Index (0–157.1) ............................................. 59 .......... n ........20.3 China ...................................................157.5 4.05 Quality of port infrastructure* .................................................................... 70 .......... n ..........4.1 Netherlands ..............................................6.8 4.06 Paved roads (% of total) ........................................................................... 59 .......... n ........59.1 Multiple economies (18) .......................100.0 4.07 Quality of roads* ....................................................................................... 82 .......... n ..........3.4 United Arab Emirates ...............................6.6
Pillar 5: Availability and quality of transport services (1–7) ............................ 70 ...........................4.0 Singapore..................................................... 5.7 5.01 Ease and affordability of shipment (1–5).................................................... 75 .......... n ..........2.9 Luxembourg .............................................3.8 5.02 Logistics competence (1–5) ...................................................................... 85 .......... n ..........2.7 Norway ....................................................4.2 5.03 Tracking and tracing ability (1–5) ............................................................... 90 .......... n ..........2.7 Germany ..................................................4.2 5.04 Timeliness of shipments in reaching destination (1–5) ............................... 71 .......... n ..........3.2 Luxembourg .............................................4.7 5.05 Postal services efficiency* ......................................................................... 49 .......... n ..........5.0 Japan .......................................................6.8 5.06 Efficiency of transport mode change* ....................................................... 81 .......... n ..........3.7 Hong Kong SAR ......................................6.4
Pillar 6: Availability and use of ICTs (1–7) ........................................................ 86 ...........................3.7 Sweden ........................................................ 6.5 6.01 Mobile phone subscriptions/100 pop. ...................................................... 28 .......... n ......137.8 Hong Kong SAR ..................................229.2 6.02 Individuals using Internet (%) .................................................................. 103 .......... n ........16.0 Iceland ...................................................96.2 6.03 Fixed broadband Internet subscriptions/100 pop. .................................... 91 .......... n ..........1.8 Switzerland ............................................39.9 6.04 Active mobile broadband Internet subscriptions/100 pop. ........................ 98 .......... n ..........4.5 Singapore.............................................124.5 6.05 ICT use for business-to-business transactions* ........................................ 51 .......... n ..........5.2 Finland .....................................................6.2 6.06 Internet use for business-to-consumer transactions* ................................ 54 .......... n ..........4.8 United Kingdom .......................................6.3 6.07 Government Online Service Index (0–1) .................................................... 76 .......... n ........0.46 Multiple economies (3) ...........................1.00
Pillar 7: Operating environment (1–7) .............................................................. 94 ...........................3.8 Hong Kong SAR ............................................ 5.8 7.01 Protection of property index (1–7) ............................................................. 97 .......... n ..........3.4 Finland .....................................................6.3
Property rights* ......................................................................................... 86 .......... n ..........3.8 Finland .....................................................6.4Intellectual property protection* .............................................................. 103 .......... n ..........2.9 Finland .....................................................6.2
7.02 Efficiency and accountability of public institutions index (1–7) ................... 96 .......... n ..........3.3 Singapore.................................................6.0Judicial efficiency & impartiality in commercial disputes (0–4).................... 63 .......... n ..........2.0 Multiple economies (7) .............................4.0Diversion of public funds* ....................................................................... 117 .......... n ..........2.3 New Zealand ............................................6.5Ease of compliance with government regulation* ...................................... 61 .......... n ..........3.5 Singapore.................................................5.4
7.03 Access to finance index (1–7) .................................................................. 31 .......... n ..........4.5 Hong Kong SAR ......................................5.7Affordability of financial services* ............................................................. 28 .......... n ..........5.0 Hong Kong SAR ......................................6.1Availability of financial services* ................................................................ 31 .......... n ..........5.3 Switzerland ..............................................6.4Ease of access to loans* .......................................................................... 49 .......... n ..........3.1 Qatar ........................................................4.9Availability of trade finance* ...................................................................... 29 .......... n ..........4.5 Hong Kong SAR ......................................5.8
7.04 Openness to foreign participation index (1–7) ........................................... 75 .......... n ..........4.2 Ireland ......................................................5.5Ease of hiring foreign labour* .................................................................... 50 .......... n ..........4.3 United Arab Emirates ...............................5.6Business impact of rules on FDI* .............................................................. 96 .......... n ..........4.2 Ireland ......................................................6.7Openness to multilateral trade rules (0–100) ............................................. 75 .......... n ........62.4 Slovenia .................................................92.2
7.05 Index of physical security (1–7) ............................................................... 131 .......... n ..........3.5 Qatar ........................................................6.8Reliability of police services* ................................................................... 126 .......... n ..........2.8 Finland .....................................................6.7Business costs of crime and violence* .................................................... 137 .......... n ..........2.0 Qatar ........................................................6.8Business costs of terrorism* ..................................................................... 95 .......... n ..........5.0 Slovenia ...................................................6.7Homicide cases/100,000 pop. ............................................................... 133 .......... n ........38.5 Hong Kong SAR ......................................0.2Index of terrorism incidence (1-7) ............................................................. 69 .......... n ..........7.0 Multiple economies (48) ...........................7.0
© 2014 World Economic Forum

Country/Economy Profiles
146 | The Global Enabling Trade Report 2014
* From the list of factors above, respondents were asked to select the five most problematic for trading in their country and to rank them between 1 (most problematic) and 5. The bars in the figure show the responses weighted according to their rankings.
For methodology, indicator descriptions and sources, and for a list of multiple best-performing economies, see page 45.
0 105 15 20 25 30
0 5 10 15 20 25 30
2
3
4
5
6
7
Operating environment
Availability & use of ICTs
Availability & quality of transport services
Availability & quality of transport infrastructure
Efficiency & transparency of border administration
Foreign market access
Domestic market access
1
Enabling Trade Index 2014 Rank Score (out of 138) (1–7)
Enabling Trade Index 2014 ...................135 ..... 2.9
Subindex A: Market access (25%) ..................131 .......2.8Pillar 1: Domestic market access ................................... 119 ........ 3.5Pillar 2: Foreign market access ........................................92 .........2.1
Subindex B: Border administration (25%) ......122 .......3.2Pillar 3: Efficiency & transparency of border administration .................................................122 ........ 3.2
Subindex C: Infrastructure (25%) ....................137 .......2.1Pillar 4: Availability & quality of transport infrastructure . 137 .........1.9Pillar 5: Availability & quality of transport services ......... 131 ........ 3.0Pillar 6: Availability & use of ICTs ...................................136 .........1.5
Subindex D: Operating environment (25%) ....129 .......3.3Pillar 7: Operating environment ......................................129 ........ 3.3
Key indicators, 2012 Rank/138
Population (millions) .............................................................10.9 ........... 67GDP (US$ billions) ................................................................ 5.6 ......... 129GDP per capita (US$) ........................................................518.9 ......... 132
Merchandise tradeTrade openness (imports+exports)/GDP .............................54.7 ........... 92Share of world trade (%) ......................................................0.01 ......... 130Total Exports (US$ billions) ....................................................1.3 ......... 128Total Imports (US$ billions) ................................................... 2.3 ......... 132
The most problematic factors for trade, 2013Most problematic factors for exporting Score*
Access to trade finance .........................................................................................19.6Inappropriate production technology and skills .....................................................12.7Burdensome procedures at foreign borders ......................................................... 11.1Identifying potential markets and buyers ...............................................................10.9High cost or delays caused by domestic transportation .......................................10.7Difficulties in meeting quality/quantity requirements of buyers ..............................10.1Technical requirements and standards abroad ...................................................... 6.5Access to imported inputs at competitive prices ................................................... 4.6High cost or delays caused by international transportation ................................... 4.0Corruption at foreign borders ................................................................................. 4.0Tariff barriers abroad .............................................................................................. 3.2Rules of origin requirements abroad ....................................................................... 2.4
Most problematic factors for importing Score*
Burdensome import procedures ...........................................................................24.3Corruption at the border ........................................................................................21.8Tariffs .....................................................................................................................20.1High cost or delays caused by international transportation ..................................10.9High cost or delays caused by domestic transportation .........................................8.1Inappropriate telecommunications infrastructure ................................................... 6.5Crime and theft ....................................................................................................... 6.2Domestic technical requirements and standards ....................................................2.1
Guinea
Sources: International Monetary Fund, World Bank, World Trade Organization, United Nations COMTRADE
Guinea Least Developed Countries
Sub-Saharan Africa
© 2014 World Economic Forum

Country/Economy Profiles
The Global Enabling Trade Report 2014 | 147
* Indicator derived from the World Economic Forum’s Executive Opinion Survey and measured on a 1-to-7 scale, where 7 indicates best outcome.
The Enabling Trade Index 2014 in detail n Competitive Advantage n Competitive Disadvantage
For methodology, indicator descriptions and sources, and for a list of multiple best-performing economies, see page 45. Guinea
INDICATOR, UNITS RANK/138 VALUE BEST PERFORMER VALUE
Pillar 1: Domestic market access (1–7) ......................................................... 119 ...........................3.5 Multiple economies (2) ................................ 7.0 1.01 Tariff rate (%)........................................................................................... 119 .......... n ........11.5 Multiple economies (2) .............................0.0 1.02 Complexity of tariffs index (1–7) ................................................................ 16 .......... n ..........6.7 Multiple economies (2) .............................7.0
Tariff dispersion (standard deviation) ......................................................... 35 .......... n ..........7.2 Multiple economies (2) .............................0.0Tariff peaks (% of tariff lines) ..................................................................... 28 .......... n ..........0.1 Multiple economies (24) ...........................0.0Specific tariffs (% of tariff lines) ................................................................... 1 .......... n ..........0.0 Multiple economies (54) ...........................0.0Number of distinct tariffs ........................................................................... 19 .......... n .............5 Multiple economies (2) ................................1
1.03 Share of duty-free imports (%) ................................................................ 126 .......... n ..........6.8 Multiple economies (2) .........................100.0
Pillar 2: Foreign market access (1–7) .............................................................. 92 ...........................2.1 Cambodia ..................................................... 5.3 2.01 Tariffs faced (%) ........................................................................................ 44 .......... n ..........5.3 Chile .........................................................3.5 2.02 Index of margin of preference in destination mkts (0–100) ...................... 125 .......... n ..........7.5 Mauritius ................................................97.1
Pillar 3: Efficiency and transparency of border administration (1–7) ............ 122 ...........................3.2 Singapore..................................................... 6.3 3.01 Customs services index (0–1) .................................................................. n/a ........................n/a Singapore...............................................0.97 3.02 Efficiency of the clearance process (1–5) ................................................ 109 .......... n ..........2.3 Norway ....................................................4.2 3.03 No. of days to import ............................................................................. 110 .......... n ...........31 Singapore....................................................4 3.04 No. of documents to import ................................................................... 101 .......... n .............9 Multiple economies (2) ................................2 3.05 Cost to import (US$ per container) ........................................................... 74 .......... n ......1,390 Singapore................................................440 3.06 No. of days to export.............................................................................. 126 .......... n ...........36 Multiple economies (5) ................................6 3.07 No. of documents to export ..................................................................... 85 .......... n .............7 Multiple economies (2) ................................2 3.08 Cost to export (US$ per container) ........................................................... 43 .......... n .........915 Malaysia ..................................................450 3.09 Irregular payments in exports and imports*............................................. 134 .......... n ..........2.0 New Zealand ............................................6.6 3.10 Time predictability of import procedures* ................................................ 115 .......... n ..........3.2 Finland .....................................................6.0 3.11 Customs transparency index (0–1) .......................................................... n/a ........................n/a Multiple economies (35) .........................1.00
Pillar 4: Availability and quality of transport infrastructure (1-7) ................... 137 ...........................1.9 United Arab Emirates ................................... 6.5 4.01 Available int’l airline seat km/week, millions ............................................ 130 .......... n ..........9.4 United States ..................................11,481.7 4.02 Quality of air transport infrastructure* ...................................................... 122 .......... n ..........3.0 Singapore.................................................6.8 4.03 Quality of railroad infrastructure* ............................................................. 104 .......... n ..........1.4 Japan .......................................................6.7 4.04 Liner Shipping Connectivity Index (0–157.1) ............................................. 84 .......... n ..........8.1 China ...................................................157.5 4.05 Quality of port infrastructure* .................................................................. 110 .......... n ..........3.2 Netherlands ..............................................6.8 4.06 Paved roads (% of total) ......................................................................... 127 .......... n ..........9.8 Multiple economies (18) .......................100.0 4.07 Quality of roads* ..................................................................................... 137 .......... n ..........1.9 United Arab Emirates ...............................6.6
Pillar 5: Availability and quality of transport services (1–7) .......................... 131 ...........................3.0 Singapore..................................................... 5.7 5.01 Ease and affordability of shipment (1–5).................................................. 119 .......... n ..........2.5 Luxembourg .............................................3.8 5.02 Logistics competence (1–5) .................................................................... 119 .......... n ..........2.3 Norway ....................................................4.2 5.03 Tracking and tracing ability (1–5) ............................................................. 119 .......... n ..........2.4 Germany ..................................................4.2 5.04 Timeliness of shipments in reaching destination (1–5) ............................... 88 .......... n ..........3.1 Luxembourg .............................................4.7 5.05 Postal services efficiency* ....................................................................... 130 .......... n ..........2.2 Japan .......................................................6.8 5.06 Efficiency of transport mode change* ..................................................... 135 .......... n ..........2.0 Hong Kong SAR ......................................6.4
Pillar 6: Availability and use of ICTs (1–7) ...................................................... 136 ...........................1.5 Sweden ........................................................ 6.5 6.01 Mobile phone subscriptions/100 pop. .................................................... 131 .......... n ........41.8 Hong Kong SAR ..................................229.2 6.02 Individuals using Internet (%) .................................................................. 134 .......... n ..........1.5 Iceland ...................................................96.2 6.03 Fixed broadband Internet subscriptions/100 pop. .................................. 135 .......... n ..........0.0 Switzerland ............................................39.9 6.04 Active mobile broadband Internet subscriptions/100 pop. ...................... 127 .......... n ..........0.0 Singapore.............................................124.5 6.05 ICT use for business-to-business transactions* ...................................... 116 .......... n ..........4.1 Finland .....................................................6.2 6.06 Internet use for business-to-consumer transactions* .............................. 126 .......... n ..........3.1 United Kingdom .......................................6.3 6.07 Government Online Service Index (0–1) .................................................. 135 .......... n ........0.00 Multiple economies (3) ...........................1.00
Pillar 7: Operating environment (1–7) ............................................................ 129 ...........................3.3 Hong Kong SAR ............................................ 5.8 7.01 Protection of property index (1–7) ........................................................... 131 .......... n ..........2.6 Finland .....................................................6.3
Property rights* ....................................................................................... 125 .......... n ..........3.0 Finland .....................................................6.4Intellectual property protection* .............................................................. 133 .......... n ..........2.2 Finland .....................................................6.2
7.02 Efficiency and accountability of public institutions index (1–7) ................. 104 .......... n ..........3.1 Singapore.................................................6.0Judicial efficiency & impartiality in commercial disputes (0–4).................. 100 .......... n ..........1.5 Multiple economies (7) .............................4.0Diversion of public funds* ....................................................................... 105 .......... n ..........2.5 New Zealand ............................................6.5Ease of compliance with government regulation* ...................................... 45 .......... n ..........3.7 Singapore.................................................5.4
7.03 Access to finance index (1–7) ................................................................ 127 .......... n ..........2.7 Hong Kong SAR ......................................5.7Affordability of financial services* ........................................................... 130 .......... n ..........3.0 Hong Kong SAR ......................................6.1Availability of financial services* .............................................................. 129 .......... n ..........3.1 Switzerland ..............................................6.4Ease of access to loans* ........................................................................ 110 .......... n ..........2.2 Qatar ........................................................4.9Availability of trade finance* .................................................................... 134 .......... n ..........2.4 Hong Kong SAR ......................................5.8
7.04 Openness to foreign participation index (1–7) ......................................... 103 .......... n ..........4.0 Ireland ......................................................5.5Ease of hiring foreign labour* .................................................................... 19 .......... n ..........4.7 United Arab Emirates ...............................5.6Business impact of rules on FDI* ............................................................ 107 .......... n ..........3.7 Ireland ......................................................6.7Openness to multilateral trade rules (0–100) ........................................... 107 .......... n ........53.5 Slovenia .................................................92.2
7.05 Index of physical security (1–7) ............................................................... 120 .......... n ..........4.1 Qatar ........................................................6.8Reliability of police services* ................................................................... 107 .......... n ..........3.2 Finland .....................................................6.7Business costs of crime and violence* .................................................... 114 .......... n ..........3.4 Qatar ........................................................6.8Business costs of terrorism* ..................................................................... 75 .......... n ..........5.3 Slovenia ...................................................6.7Homicide cases/100,000 pop. ............................................................... 124 .......... n ........22.5 Hong Kong SAR ......................................0.2Index of terrorism incidence (1-7) ............................................................... 1 .......... n ..........7.0 Multiple economies (48) ...........................7.0
© 2014 World Economic Forum

Country/Economy Profiles
148 | The Global Enabling Trade Report 2014
* From the list of factors above, respondents were asked to select the five most problematic for trading in their country and to rank them between 1 (most problematic) and 5. The bars in the figure show the responses weighted according to their rankings.
For methodology, indicator descriptions and sources, and for a list of multiple best-performing economies, see page 45.
0 105 15 20 25 30
0 5 10 15 20 25 30
2
3
4
5
6
7
Operating environment
Availability & use of ICTs
Availability & quality of transport services
Availability & quality of transport infrastructure
Efficiency & transparency of border administration
Foreign market access
Domestic market access
1
Enabling Trade Index 2014 Rank Score (out of 138) (1–7)
Enabling Trade Index 2014 ...................104 ..... 3.6
Subindex A: Market access (25%) ....................68 .......3.6Pillar 1: Domestic market access ................................... 111 ........ 3.8Pillar 2: Foreign market access ........................................40 ........ 3.3
Subindex B: Border administration (25%) ........88 .......3.9Pillar 3: Efficiency & transparency of border administration ...................................................88 ........ 3.9
Subindex C: Infrastructure (25%) .................... 114 .......2.9Pillar 4: Availability & quality of transport infrastructure . 118 .........2.4Pillar 5: Availability & quality of transport services .........109 ........ 3.5Pillar 6: Availability & use of ICTs ...................................108 .........2.8
Subindex D: Operating environment (25%) ......91 .......3.8Pillar 7: Operating environment ........................................91 ........ 3.8
Key indicators, 2012 Rank/138
Population (millions) .............................................................. 0.8 ......... 133GDP (US$ billions) ................................................................ 2.8 ......... 133GDP per capita (US$) ..................................................... 3,647.1 ........... 88
Merchandise tradeTrade openness (imports+exports)/GDP ........................... 112.3 ........... 23Share of world trade (%) ......................................................0.01 ......... 132Total Exports (US$ billions) ....................................................1.4 ......... 127Total Imports (US$ billions) ....................................................2.0 ......... 134
Value chain indicators, 2012Share (%) of merchandise trade Exports Imports
Capital goods ..................................................................... 4.3 ........20.4
Intermediate goods .......................................................... 82.4 ........32.8Food and beverages (industrial) ................................... 36.9 .......... 4.2Industrial supplies (primary and processed) ................ 45.4 ........ 19.6Parts and accessories .....................................................0.1 ...........7.9Fuels and lubricants ....................................................... 0.0 ...........1.1
Consumer goods .............................................................. 13.3 ........ 19.0Food and beverages (consumer) ...................................12.5 .......... 8.3Transport equipment and consumer goods ....................0.7 ........ 10.7
Passenger motor cars ........................................................ 0.0 ..........2.6
Others .................................................................................. 0.0 ........25.3
The most problematic factors for trade, 2013Most problematic factors for exporting Score*
Identifying potential markets and buyers ...............................................................21.7Difficulties in meeting quality/quantity requirements of buyers ..............................13.4Access to imported inputs at competitive prices ..................................................12.9High cost or delays caused by domestic transportation ........................................ 9.2Access to trade finance .......................................................................................... 9.0Inappropriate production technology and skills ...................................................... 8.5High cost or delays caused by international transportation ................................... 8.5Technical requirements and standards abroad .......................................................7.2Burdensome procedures at foreign borders .......................................................... 3.9Tariff barriers abroad .............................................................................................. 3.2Rules of origin requirements abroad ........................................................................1.6Corruption at foreign borders ..................................................................................0.7
Most problematic factors for importing Score*
Tariffs .....................................................................................................................26.1Burdensome import procedures ...........................................................................19.1Corruption at the border ........................................................................................15.1High cost or delays caused by international transportation ..................................14.0Crime and theft ....................................................................................................... 9.6Domestic technical requirements and standards ................................................... 8.3High cost or delays caused by domestic transportation ........................................ 5.8Inappropriate telecommunications infrastructure ................................................... 2.0
Guyana
Sources: International Monetary Fund, World Bank, World Trade Organization, United Nations COMTRADE
Guyana
South America
© 2014 World Economic Forum

Country/Economy Profiles
The Global Enabling Trade Report 2014 | 149
* Indicator derived from the World Economic Forum’s Executive Opinion Survey and measured on a 1-to-7 scale, where 7 indicates best outcome.
The Enabling Trade Index 2014 in detail n Competitive Advantage n Competitive Disadvantage
For methodology, indicator descriptions and sources, and for a list of multiple best-performing economies, see page 45. Guyana
INDICATOR, UNITS RANK/138 VALUE BEST PERFORMER VALUE
Pillar 1: Domestic market access (1–7) ......................................................... 111 ...........................3.8 Multiple economies (2) ................................ 7.0 1.01 Tariff rate (%)........................................................................................... 121 .......... n ........11.8 Multiple economies (2) .............................0.0 1.02 Complexity of tariffs index (1–7) ................................................................ 78 .......... n ..........5.6 Multiple economies (2) .............................7.0
Tariff dispersion (standard deviation) ....................................................... 113 .......... n ........12.5 Multiple economies (2) .............................0.0Tariff peaks (% of tariff lines) ..................................................................... 91 .......... n ..........8.9 Multiple economies (24) ...........................0.0Specific tariffs (% of tariff lines) ................................................................... 1 .......... n ..........0.0 Multiple economies (54) ...........................0.0Number of distinct tariffs ........................................................................... 44 .......... n ...........15 Multiple economies (2) ................................1
1.03 Share of duty-free imports (%) .................................................................. 91 .......... n ........44.9 Multiple economies (2) .........................100.0
Pillar 2: Foreign market access (1–7) .............................................................. 40 ...........................3.3 Cambodia ..................................................... 5.3 2.01 Tariffs faced (%) ...................................................................................... 117 .......... n ..........5.7 Chile .........................................................3.5 2.02 Index of margin of preference in destination mkts (0–100) .......................... 8 .......... n ........66.4 Mauritius ................................................97.1
Pillar 3: Efficiency and transparency of border administration (1–7) .............. 88 ...........................3.9 Singapore..................................................... 6.3 3.01 Customs services index (0–1) .................................................................. n/a ........................n/a Singapore...............................................0.97 3.02 Efficiency of the clearance process (1–5) .................................................. 94 .......... n ..........2.5 Norway ....................................................4.2 3.03 No. of days to import ............................................................................... 88 .......... n ...........22 Singapore....................................................4 3.04 No. of documents to import ..................................................................... 57 .......... n .............7 Multiple economies (2) ................................2 3.05 Cost to import (US$ per container) ........................................................... 15 .......... n .........720 Singapore................................................440 3.06 No. of days to export................................................................................ 81 .......... n ...........19 Multiple economies (5) ................................6 3.07 No. of documents to export ..................................................................... 65 .......... n .............6 Multiple economies (2) ................................2 3.08 Cost to export (US$ per container) ........................................................... 23 .......... n .........730 Malaysia ..................................................450 3.09 Irregular payments in exports and imports*............................................. 108 .......... n ..........2.6 New Zealand ............................................6.6 3.10 Time predictability of import procedures* .................................................. 98 .......... n ..........3.5 Finland .....................................................6.0 3.11 Customs transparency index (0–1) .......................................................... n/a ........................n/a Multiple economies (35) .........................1.00
Pillar 4: Availability and quality of transport infrastructure (1-7) ................... 118 ...........................2.4 United Arab Emirates ................................... 6.5 4.01 Available int’l airline seat km/week, millions ............................................ 128 .......... n ........11.0 United States ..................................11,481.7 4.02 Quality of air transport infrastructure* ........................................................ 93 .......... n ..........3.9 Singapore.................................................6.8 4.03 Quality of railroad infrastructure* .............................................................. n/a ........................n/a Japan .......................................................6.7 4.04 Liner Shipping Connectivity Index (0–157.1) ........................................... 102 .......... n ..........4.3 China ...................................................157.5 4.05 Quality of port infrastructure* .................................................................. 104 .......... n ..........3.4 Netherlands ..............................................6.8 4.06 Paved roads (% of total) ......................................................................... 134 .......... n ..........7.4 Multiple economies (18) .......................100.0 4.07 Quality of roads* ....................................................................................... 85 .......... n ..........3.4 United Arab Emirates ...............................6.6
Pillar 5: Availability and quality of transport services (1–7) .......................... 109 ...........................3.5 Singapore..................................................... 5.7 5.01 Ease and affordability of shipment (1–5).................................................. 121 .......... n ..........2.4 Luxembourg .............................................3.8 5.02 Logistics competence (1–5) .................................................................... 126 .......... n ..........2.3 Norway ....................................................4.2 5.03 Tracking and tracing ability (1–5) ............................................................. 112 .......... n ..........2.5 Germany ..................................................4.2 5.04 Timeliness of shipments in reaching destination (1–5) ............................. 124 .......... n ..........2.7 Luxembourg .............................................4.7 5.05 Postal services efficiency* ......................................................................... 88 .......... n ..........4.0 Japan .......................................................6.8 5.06 Efficiency of transport mode change* ....................................................... 54 .......... n ..........4.3 Hong Kong SAR ......................................6.4
Pillar 6: Availability and use of ICTs (1–7) ...................................................... 108 ...........................2.8 Sweden ........................................................ 6.5 6.01 Mobile phone subscriptions/100 pop. .................................................... 116 .......... n ........68.8 Hong Kong SAR ..................................229.2 6.02 Individuals using Internet (%) .................................................................... 86 .......... n ........33.0 Iceland ...................................................96.2 6.03 Fixed broadband Internet subscriptions/100 pop. .................................... 82 .......... n ..........3.7 Switzerland ............................................39.9 6.04 Active mobile broadband Internet subscriptions/100 pop. ...................... 127 .......... n ..........0.0 Singapore.............................................124.5 6.05 ICT use for business-to-business transactions* ........................................ 76 .......... n ..........4.8 Finland .....................................................6.2 6.06 Internet use for business-to-consumer transactions* ................................ 77 .......... n ..........4.4 United Kingdom .......................................6.3 6.07 Government Online Service Index (0–1) .................................................. 120 .......... n ........0.25 Multiple economies (3) ...........................1.00
Pillar 7: Operating environment (1–7) .............................................................. 91 ...........................3.8 Hong Kong SAR ............................................ 5.8 7.01 Protection of property index (1–7) ............................................................. 78 .......... n ..........3.7 Finland .....................................................6.3
Property rights* ......................................................................................... 83 .......... n ..........3.9 Finland .....................................................6.4Intellectual property protection* ................................................................ 79 .......... n ..........3.5 Finland .....................................................6.2
7.02 Efficiency and accountability of public institutions index (1–7) ................... 98 .......... n ..........3.3 Singapore.................................................6.0Judicial efficiency & impartiality in commercial disputes (0–4)................... n/a ........................n/a Multiple economies (7) .............................4.0Diversion of public funds* ......................................................................... 91 .......... n ..........2.7 New Zealand ............................................6.5Ease of compliance with government regulation* ...................................... 39 .......... n ..........3.8 Singapore.................................................5.4
7.03 Access to finance index (1–7) .................................................................. 49 .......... n ..........4.0 Hong Kong SAR ......................................5.7Affordability of financial services* ............................................................. 60 .......... n ..........4.2 Hong Kong SAR ......................................6.1Availability of financial services* ................................................................ 68 .......... n ..........4.5 Switzerland ..............................................6.4Ease of access to loans* .......................................................................... 43 .......... n ..........3.2 Qatar ........................................................4.9Availability of trade finance* ...................................................................... 41 .......... n ..........4.2 Hong Kong SAR ......................................5.8
7.04 Openness to foreign participation index (1–7) ......................................... 119 .......... n ..........3.6 Ireland ......................................................5.5Ease of hiring foreign labour* .................................................................... 43 .......... n ..........4.3 United Arab Emirates ...............................5.6Business impact of rules on FDI* .............................................................. 89 .......... n ..........4.3 Ireland ......................................................6.7Openness to multilateral trade rules (0–100) ........................................... 129 .......... n ........35.2 Slovenia .................................................92.2
7.05 Index of physical security (1–7) ............................................................... 110 .......... n ..........4.5 Qatar ........................................................6.8Reliability of police services* ................................................................... 124 .......... n ..........2.8 Finland .....................................................6.7Business costs of crime and violence* ...................................................... 96 .......... n ..........4.0 Qatar ........................................................6.8Business costs of terrorism* ..................................................................... 81 .......... n ..........5.2 Slovenia ...................................................6.7Homicide cases/100,000 pop. ............................................................... 117 .......... n ........17.2 Hong Kong SAR ......................................0.2Index of terrorism incidence (1-7) ............................................................... 1 .......... n ..........7.0 Multiple economies (48) ...........................7.0
© 2014 World Economic Forum
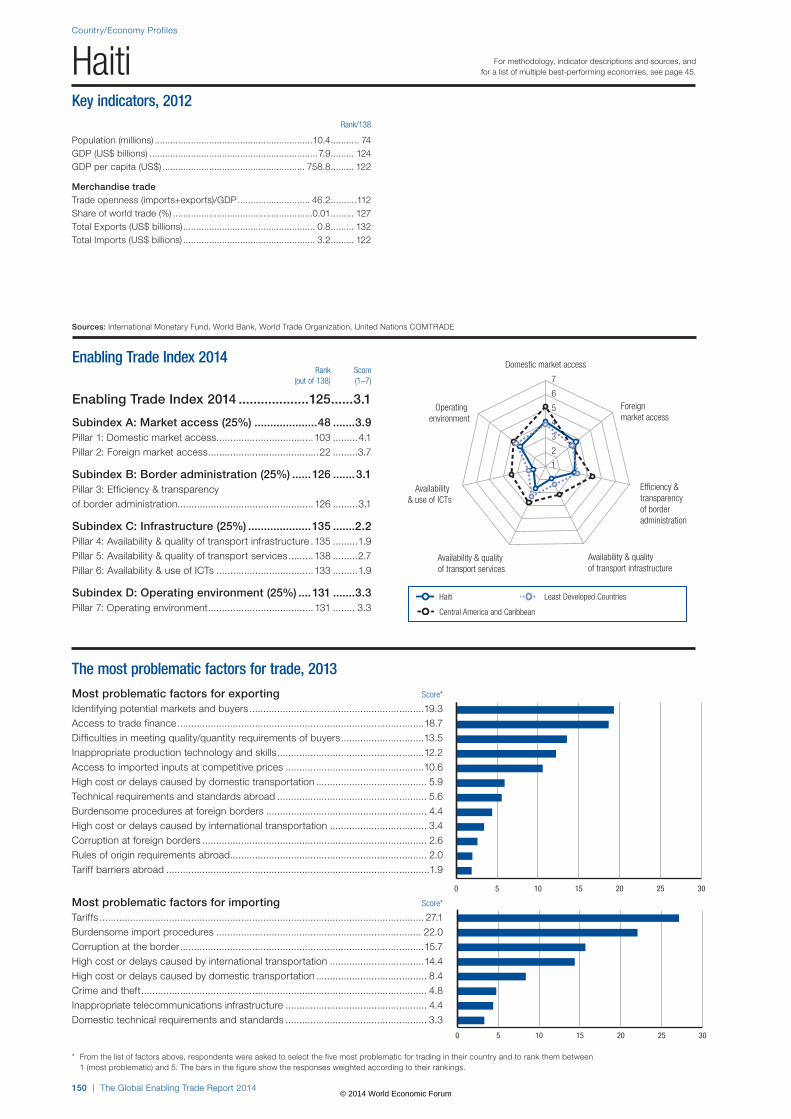
Country/Economy Profiles
150 | The Global Enabling Trade Report 2014
* From the list of factors above, respondents were asked to select the five most problematic for trading in their country and to rank them between 1 (most problematic) and 5. The bars in the figure show the responses weighted according to their rankings.
For methodology, indicator descriptions and sources, and for a list of multiple best-performing economies, see page 45.
0 105 15 20 25 30
0 5 10 15 20 25 30
2
3
4
5
6
7
Operating environment
Availability & use of ICTs
Availability & quality of transport services
Availability & quality of transport infrastructure
Efficiency & transparency of border administration
Foreign market access
Domestic market access
1
Enabling Trade Index 2014 Rank Score (out of 138) (1–7)
Enabling Trade Index 2014 ...................125 ......3.1
Subindex A: Market access (25%) ....................48 .......3.9Pillar 1: Domestic market access ...................................103 .........4.1Pillar 2: Foreign market access ........................................22 .........3.7
Subindex B: Border administration (25%) ......126 .......3.1Pillar 3: Efficiency & transparency of border administration ................................................. 126 .........3.1
Subindex C: Infrastructure (25%) ....................135 .......2.2Pillar 4: Availability & quality of transport infrastructure .135 .........1.9Pillar 5: Availability & quality of transport services .........138 .........2.7Pillar 6: Availability & use of ICTs ...................................133 .........1.9
Subindex D: Operating environment (25%) ....131 .......3.3Pillar 7: Operating environment ...................................... 131 ........ 3.3
Key indicators, 2012 Rank/138
Population (millions) .............................................................10.4 ........... 74GDP (US$ billions) .................................................................7.9 ......... 124GDP per capita (US$) ....................................................... 758.8 ......... 122
Merchandise tradeTrade openness (imports+exports)/GDP ............................ 46.2 ..........112Share of world trade (%) ......................................................0.01 ......... 127Total Exports (US$ billions) ................................................... 0.8 ......... 132Total Imports (US$ billions) ................................................... 3.2 ......... 122
The most problematic factors for trade, 2013Most problematic factors for exporting Score*
Identifying potential markets and buyers ...............................................................19.3Access to trade finance .........................................................................................18.7Difficulties in meeting quality/quantity requirements of buyers ..............................13.5Inappropriate production technology and skills .....................................................12.2Access to imported inputs at competitive prices ..................................................10.6High cost or delays caused by domestic transportation ........................................ 5.9Technical requirements and standards abroad ...................................................... 5.6Burdensome procedures at foreign borders .......................................................... 4.4High cost or delays caused by international transportation ................................... 3.4Corruption at foreign borders ................................................................................. 2.6Rules of origin requirements abroad ....................................................................... 2.0Tariff barriers abroad ...............................................................................................1.9
Most problematic factors for importing Score*
Tariffs ..................................................................................................................... 27.1Burdensome import procedures .......................................................................... 22.0Corruption at the border ........................................................................................15.7High cost or delays caused by international transportation ..................................14.4High cost or delays caused by domestic transportation ........................................ 8.4Crime and theft ....................................................................................................... 4.8Inappropriate telecommunications infrastructure ................................................... 4.4Domestic technical requirements and standards ................................................... 3.3
Haiti
Sources: International Monetary Fund, World Bank, World Trade Organization, United Nations COMTRADE
Haiti Least Developed Countries
Central America and Caribbean
© 2014 World Economic Forum
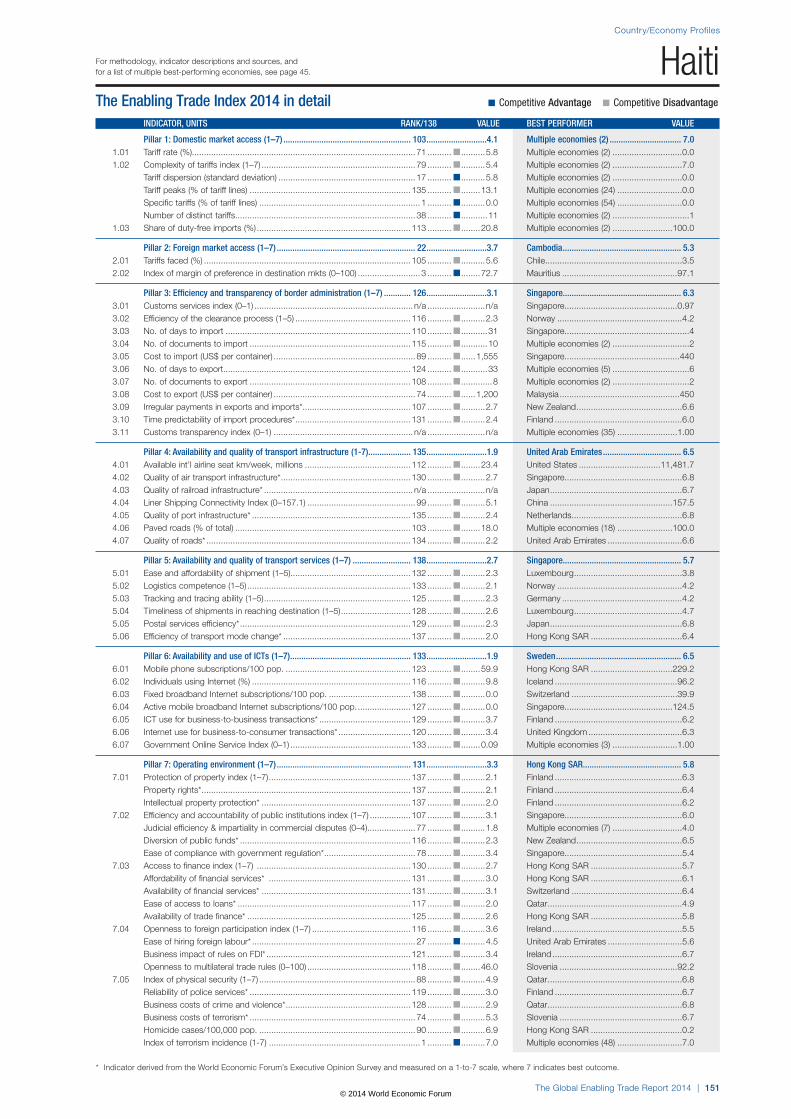
Country/Economy Profiles
The Global Enabling Trade Report 2014 | 151
* Indicator derived from the World Economic Forum’s Executive Opinion Survey and measured on a 1-to-7 scale, where 7 indicates best outcome.
The Enabling Trade Index 2014 in detail n Competitive Advantage n Competitive Disadvantage
For methodology, indicator descriptions and sources, and for a list of multiple best-performing economies, see page 45. Haiti
INDICATOR, UNITS RANK/138 VALUE BEST PERFORMER VALUE
Pillar 1: Domestic market access (1–7) ......................................................... 103 ...........................4.1 Multiple economies (2) ................................ 7.0 1.01 Tariff rate (%)............................................................................................. 71 .......... n ..........5.8 Multiple economies (2) .............................0.0 1.02 Complexity of tariffs index (1–7) ................................................................ 79 .......... n ..........5.4 Multiple economies (2) .............................7.0
Tariff dispersion (standard deviation) ......................................................... 17 .......... n ..........5.8 Multiple economies (2) .............................0.0Tariff peaks (% of tariff lines) ................................................................... 135 .......... n ........13.1 Multiple economies (24) ...........................0.0Specific tariffs (% of tariff lines) ................................................................... 1 .......... n ..........0.0 Multiple economies (54) ...........................0.0Number of distinct tariffs ........................................................................... 38 .......... n ...........11 Multiple economies (2) ................................1
1.03 Share of duty-free imports (%) ................................................................ 113 .......... n ........20.8 Multiple economies (2) .........................100.0
Pillar 2: Foreign market access (1–7) .............................................................. 22 ...........................3.7 Cambodia ..................................................... 5.3 2.01 Tariffs faced (%) ...................................................................................... 105 .......... n ..........5.6 Chile .........................................................3.5 2.02 Index of margin of preference in destination mkts (0–100) .......................... 3 .......... n ........72.7 Mauritius ................................................97.1
Pillar 3: Efficiency and transparency of border administration (1–7) ............ 126 ...........................3.1 Singapore..................................................... 6.3 3.01 Customs services index (0–1) .................................................................. n/a ........................n/a Singapore...............................................0.97 3.02 Efficiency of the clearance process (1–5) ................................................ 116 .......... n ..........2.3 Norway ....................................................4.2 3.03 No. of days to import ............................................................................. 110 .......... n ...........31 Singapore....................................................4 3.04 No. of documents to import ................................................................... 115 .......... n ...........10 Multiple economies (2) ................................2 3.05 Cost to import (US$ per container) ........................................................... 89 .......... n ......1,555 Singapore................................................440 3.06 No. of days to export.............................................................................. 124 .......... n ...........33 Multiple economies (5) ................................6 3.07 No. of documents to export ................................................................... 108 .......... n .............8 Multiple economies (2) ................................2 3.08 Cost to export (US$ per container) ........................................................... 74 .......... n ......1,200 Malaysia ..................................................450 3.09 Irregular payments in exports and imports*............................................. 107 .......... n ..........2.7 New Zealand ............................................6.6 3.10 Time predictability of import procedures* ................................................ 131 .......... n ..........2.4 Finland .....................................................6.0 3.11 Customs transparency index (0–1) .......................................................... n/a ........................n/a Multiple economies (35) .........................1.00
Pillar 4: Availability and quality of transport infrastructure (1-7) ................... 135 ...........................1.9 United Arab Emirates ................................... 6.5 4.01 Available int’l airline seat km/week, millions ............................................ 112 .......... n ........23.4 United States ..................................11,481.7 4.02 Quality of air transport infrastructure* ...................................................... 130 .......... n ..........2.7 Singapore.................................................6.8 4.03 Quality of railroad infrastructure* .............................................................. n/a ........................n/a Japan .......................................................6.7 4.04 Liner Shipping Connectivity Index (0–157.1) ............................................. 99 .......... n ..........5.1 China ...................................................157.5 4.05 Quality of port infrastructure* .................................................................. 135 .......... n ..........2.4 Netherlands ..............................................6.8 4.06 Paved roads (% of total) ......................................................................... 103 .......... n ........18.0 Multiple economies (18) .......................100.0 4.07 Quality of roads* ..................................................................................... 134 .......... n ..........2.2 United Arab Emirates ...............................6.6
Pillar 5: Availability and quality of transport services (1–7) .......................... 138 ...........................2.7 Singapore..................................................... 5.7 5.01 Ease and affordability of shipment (1–5).................................................. 132 .......... n ..........2.3 Luxembourg .............................................3.8 5.02 Logistics competence (1–5) .................................................................... 133 .......... n ..........2.1 Norway ....................................................4.2 5.03 Tracking and tracing ability (1–5) ............................................................. 125 .......... n ..........2.3 Germany ..................................................4.2 5.04 Timeliness of shipments in reaching destination (1–5) ............................. 128 .......... n ..........2.6 Luxembourg .............................................4.7 5.05 Postal services efficiency* ....................................................................... 129 .......... n ..........2.3 Japan .......................................................6.8 5.06 Efficiency of transport mode change* ..................................................... 137 .......... n ..........2.0 Hong Kong SAR ......................................6.4
Pillar 6: Availability and use of ICTs (1–7) ...................................................... 133 ...........................1.9 Sweden ........................................................ 6.5 6.01 Mobile phone subscriptions/100 pop. .................................................... 123 .......... n ........59.9 Hong Kong SAR ..................................229.2 6.02 Individuals using Internet (%) .................................................................. 116 .......... n ..........9.8 Iceland ...................................................96.2 6.03 Fixed broadband Internet subscriptions/100 pop. .................................. 138 .......... n ..........0.0 Switzerland ............................................39.9 6.04 Active mobile broadband Internet subscriptions/100 pop. ...................... 127 .......... n ..........0.0 Singapore.............................................124.5 6.05 ICT use for business-to-business transactions* ...................................... 129 .......... n ..........3.7 Finland .....................................................6.2 6.06 Internet use for business-to-consumer transactions* .............................. 120 .......... n ..........3.4 United Kingdom .......................................6.3 6.07 Government Online Service Index (0–1) .................................................. 133 .......... n ........0.09 Multiple economies (3) ...........................1.00
Pillar 7: Operating environment (1–7) ............................................................ 131 ...........................3.3 Hong Kong SAR ............................................ 5.8 7.01 Protection of property index (1–7) ........................................................... 137 .......... n ..........2.1 Finland .....................................................6.3
Property rights* ....................................................................................... 137 .......... n ..........2.1 Finland .....................................................6.4Intellectual property protection* .............................................................. 137 .......... n ..........2.0 Finland .....................................................6.2
7.02 Efficiency and accountability of public institutions index (1–7) ................. 107 .......... n ..........3.1 Singapore.................................................6.0Judicial efficiency & impartiality in commercial disputes (0–4).................... 77 .......... n ..........1.8 Multiple economies (7) .............................4.0Diversion of public funds* ....................................................................... 116 .......... n ..........2.3 New Zealand ............................................6.5Ease of compliance with government regulation* ...................................... 78 .......... n ..........3.4 Singapore.................................................5.4
7.03 Access to finance index (1–7) ................................................................ 130 .......... n ..........2.7 Hong Kong SAR ......................................5.7Affordability of financial services* ........................................................... 131 .......... n ..........3.0 Hong Kong SAR ......................................6.1Availability of financial services* .............................................................. 131 .......... n ..........3.1 Switzerland ..............................................6.4Ease of access to loans* ........................................................................ 117 .......... n ..........2.0 Qatar ........................................................4.9Availability of trade finance* .................................................................... 125 .......... n ..........2.6 Hong Kong SAR ......................................5.8
7.04 Openness to foreign participation index (1–7) ......................................... 116 .......... n ..........3.6 Ireland ......................................................5.5Ease of hiring foreign labour* .................................................................... 27 .......... n ..........4.5 United Arab Emirates ...............................5.6Business impact of rules on FDI* ............................................................ 121 .......... n ..........3.4 Ireland ......................................................6.7Openness to multilateral trade rules (0–100) ........................................... 118 .......... n ........46.0 Slovenia .................................................92.2
7.05 Index of physical security (1–7) ................................................................. 88 .......... n ..........4.9 Qatar ........................................................6.8Reliability of police services* ................................................................... 119 .......... n ..........3.0 Finland .....................................................6.7Business costs of crime and violence* .................................................... 128 .......... n ..........2.9 Qatar ........................................................6.8Business costs of terrorism* ..................................................................... 74 .......... n ..........5.3 Slovenia ...................................................6.7Homicide cases/100,000 pop. ................................................................. 90 .......... n ..........6.9 Hong Kong SAR ......................................0.2Index of terrorism incidence (1-7) ............................................................... 1 .......... n ..........7.0 Multiple economies (48) ...........................7.0
© 2014 World Economic Forum

Country/Economy Profiles
152 | The Global Enabling Trade Report 2014
* From the list of factors above, respondents were asked to select the five most problematic for trading in their country and to rank them between 1 (most problematic) and 5. The bars in the figure show the responses weighted according to their rankings.
For methodology, indicator descriptions and sources, and for a list of multiple best-performing economies, see page 45.
0 105 15 20 25 30
0 5 10 15 20 25 30
2
3
4
5
6
7
Operating environment
Availability & use of ICTs
Availability & quality of transport services
Availability & quality of transport infrastructure
Efficiency & transparency of border administration
Foreign market access
Domestic market access
1
Enabling Trade Index 2014 Rank Score (out of 138) (1–7)
Enabling Trade Index 2014 .................... 85 ..... 3.8
Subindex A: Market access (25%) ....................10 .......4.6Pillar 1: Domestic market access ..................................... 17 .........5.7Pillar 2: Foreign market access ........................................27 ........ 3.6
Subindex B: Border administration (25%) ........82 .......4.1Pillar 3: Efficiency & transparency of border administration ...................................................82 .........4.1
Subindex C: Infrastructure (25%) ....................106 .......3.0Pillar 4: Availability & quality of transport infrastructure .104 .........2.6Pillar 5: Availability & quality of transport services ......... 118 ........ 3.3Pillar 6: Availability & use of ICTs .....................................98 ........ 3.0
Subindex D: Operating environment (25%) ....120 .......3.5Pillar 7: Operating environment ......................................120 ........ 3.5
Key indicators, 2012 Rank/138
Population (millions) ...............................................................7.9 ........... 84GDP (US$ billions) ...............................................................18.5 ......... 100GDP per capita (US$) .....................................................2,331.2 ......... 100
Merchandise tradeTrade openness (imports+exports)/GDP .......................... 106.3 ........... 28Share of world trade (%) ..................................................... 0.05 ........... 91Total Exports (US$ billions) ....................................................7.9 ........... 91Total Imports (US$ billions) ..................................................11.2 ........... 90
Value chain indicators, 2012Share (%) of merchandise trade Exports Imports
Capital goods ..................................................................... 1.8 ........ 12.1
Intermediate goods ...........................................................77.3 ........36.0Food and beverages (industrial) ....................................32.4 .......... 2.8Industrial supplies (primary and processed) ................ 38.7 .........27.5Parts and accessories .................................................... 2.3 .......... 4.9Fuels and lubricants ....................................................... 3.9 .......... 0.8
Consumer goods .............................................................. 20.6 ........25.8Food and beverages (consumer) ...................................14.9 .......... 9.5Transport equipment and consumer goods ................... 5.6 ........ 16.2
Passenger motor cars ........................................................ 0.2 .......... 1.7
Others .................................................................................. 0.2 ........ 24.4
The most problematic factors for trade, 2013Most problematic factors for exporting Score*
Access to trade finance .........................................................................................12.4Identifying potential markets and buyers ...............................................................12.1Inappropriate production technology and skills .....................................................11.9Access to imported inputs at competitive prices ..................................................11.3Difficulties in meeting quality/quantity requirements of buyers ..............................10.9High cost or delays caused by domestic transportation ........................................ 8.9High cost or delays caused by international transportation ................................... 8.4Burdensome procedures at foreign borders .......................................................... 8.3Technical requirements and standards abroad ...................................................... 8.0Rules of origin requirements abroad ....................................................................... 4.8Tariff barriers abroad .............................................................................................. 2.5Corruption at foreign borders ................................................................................. 0.6
Most problematic factors for importing Score*
Corruption at the border ........................................................................................21.2Burdensome import procedures .......................................................................... 20.3Tariffs .....................................................................................................................15.9High cost or delays caused by international transportation .................................. 11.7Crime and theft ...................................................................................................... 11.7High cost or delays caused by domestic transportation .......................................10.4Domestic technical requirements and standards ................................................... 5.5Inappropriate telecommunications infrastructure ................................................... 3.3
Honduras
Sources: International Monetary Fund, World Bank, World Trade Organization, United Nations COMTRADE
Honduras
Central America and Caribbean
© 2014 World Economic Forum

Country/Economy Profiles
The Global Enabling Trade Report 2014 | 153
* Indicator derived from the World Economic Forum’s Executive Opinion Survey and measured on a 1-to-7 scale, where 7 indicates best outcome.
The Enabling Trade Index 2014 in detail n Competitive Advantage n Competitive Disadvantage
For methodology, indicator descriptions and sources, and for a list of multiple best-performing economies, see page 45. Honduras
INDICATOR, UNITS RANK/138 VALUE BEST PERFORMER VALUE
Pillar 1: Domestic market access (1–7) ........................................................... 17 ...........................5.7 Multiple economies (2) ................................ 7.0 1.01 Tariff rate (%)............................................................................................. 60 .......... n ..........4.6 Multiple economies (2) .............................0.0 1.02 Complexity of tariffs index (1–7) ................................................................ 22 .......... n ..........6.6 Multiple economies (2) .............................7.0
Tariff dispersion (standard deviation) ......................................................... 24 .......... n ..........6.7 Multiple economies (2) .............................0.0Tariff peaks (% of tariff lines) ..................................................................... 43 .......... n ..........0.8 Multiple economies (24) ...........................0.0Specific tariffs (% of tariff lines) ................................................................... 1 .......... n ..........0.0 Multiple economies (54) ...........................0.0Number of distinct tariffs ........................................................................... 40 .......... n ...........12 Multiple economies (2) ................................1
1.03 Share of duty-free imports (%) .................................................................. 33 .......... n ........69.4 Multiple economies (2) .........................100.0
Pillar 2: Foreign market access (1–7) .............................................................. 27 ...........................3.6 Cambodia ..................................................... 5.3 2.01 Tariffs faced (%) ........................................................................................ 65 .......... n ..........5.4 Chile .........................................................3.5 2.02 Index of margin of preference in destination mkts (0–100) .......................... 9 .......... n ........62.7 Mauritius ................................................97.1
Pillar 3: Efficiency and transparency of border administration (1–7) .............. 82 ...........................4.1 Singapore..................................................... 6.3 3.01 Customs services index (0–1) ................................................................... 74 .......... n ........0.52 Singapore...............................................0.97 3.02 Efficiency of the clearance process (1–5) .................................................. 66 .......... n ..........2.7 Norway ....................................................4.2 3.03 No. of days to import ............................................................................... 60 .......... n ...........16 Singapore....................................................4 3.04 No. of documents to import ..................................................................... 57 .......... n .............7 Multiple economies (2) ................................2 3.05 Cost to import (US$ per container) ........................................................... 84 .......... n ......1,500 Singapore................................................440 3.06 No. of days to export................................................................................ 41 .......... n ...........12 Multiple economies (5) ................................6 3.07 No. of documents to export ..................................................................... 40 .......... n .............5 Multiple economies (2) ................................2 3.08 Cost to export (US$ per container) ........................................................... 85 .......... n ......1,345 Malaysia ..................................................450 3.09 Irregular payments in exports and imports*............................................... 80 .......... n ..........3.3 New Zealand ............................................6.6 3.10 Time predictability of import procedures* ................................................ 124 .......... n ..........3.0 Finland .....................................................6.0 3.11 Customs transparency index (0–1) ........................................................... 92 .......... n ........0.60 Multiple economies (35) .........................1.00
Pillar 4: Availability and quality of transport infrastructure (1-7) ................... 104 ...........................2.6 United Arab Emirates ................................... 6.5 4.01 Available int’l airline seat km/week, millions ............................................ 109 .......... n ........25.2 United States ..................................11,481.7 4.02 Quality of air transport infrastructure* ........................................................ 91 .......... n ..........4.0 Singapore.................................................6.8 4.03 Quality of railroad infrastructure* .............................................................. n/a ........................n/a Japan .......................................................6.7 4.04 Liner Shipping Connectivity Index (0–157.1) ............................................. 78 .......... n ........10.7 China ...................................................157.5 4.05 Quality of port infrastructure* .................................................................... 80 .......... n ..........3.9 Netherlands ..............................................6.8 4.06 Paved roads (% of total) ........................................................................... 95 .......... n ........22.8 Multiple economies (18) .......................100.0 4.07 Quality of roads* ..................................................................................... 105 .......... n ..........2.9 United Arab Emirates ...............................6.6
Pillar 5: Availability and quality of transport services (1–7) .......................... 118 ...........................3.3 Singapore..................................................... 5.7 5.01 Ease and affordability of shipment (1–5).................................................... 85 .......... n ..........2.8 Luxembourg .............................................3.8 5.02 Logistics competence (1–5) .................................................................... 111 .......... n ..........2.5 Norway ....................................................4.2 5.03 Tracking and tracing ability (1–5) ............................................................... 98 .......... n ..........2.6 Germany ..................................................4.2 5.04 Timeliness of shipments in reaching destination (1–5) ............................. 117 .......... n ..........2.8 Luxembourg .............................................4.7 5.05 Postal services efficiency* ....................................................................... 125 .......... n ..........2.7 Japan .......................................................6.8 5.06 Efficiency of transport mode change* ..................................................... 100 .......... n ..........3.4 Hong Kong SAR ......................................6.4
Pillar 6: Availability and use of ICTs (1–7) ........................................................ 98 ...........................3.0 Sweden ........................................................ 6.5 6.01 Mobile phone subscriptions/100 pop. ...................................................... 94 .......... n ........92.9 Hong Kong SAR ..................................229.2 6.02 Individuals using Internet (%) .................................................................... 97 .......... n ........18.1 Iceland ...................................................96.2 6.03 Fixed broadband Internet subscriptions/100 pop. .................................. 103 .......... n ..........0.8 Switzerland ............................................39.9 6.04 Active mobile broadband Internet subscriptions/100 pop. ........................ 84 .......... n ..........8.6 Singapore.............................................124.5 6.05 ICT use for business-to-business transactions* ........................................ 87 .......... n ..........4.6 Finland .....................................................6.2 6.06 Internet use for business-to-consumer transactions* ................................ 90 .......... n ..........4.1 United Kingdom .......................................6.3 6.07 Government Online Service Index (0–1) .................................................... 92 .......... n ........0.38 Multiple economies (3) ...........................1.00
Pillar 7: Operating environment (1–7) ............................................................ 120 ...........................3.5 Hong Kong SAR ............................................ 5.8 7.01 Protection of property index (1–7) ........................................................... 103 .......... n ..........3.2 Finland .....................................................6.3
Property rights* ....................................................................................... 112 .......... n ..........3.4 Finland .....................................................6.4Intellectual property protection* ................................................................ 96 .......... n ..........3.1 Finland .....................................................6.2
7.02 Efficiency and accountability of public institutions index (1–7) ................. 112 .......... n ..........2.9 Singapore.................................................6.0Judicial efficiency & impartiality in commercial disputes (0–4).................... 77 .......... n ..........1.8 Multiple economies (7) .............................4.0Diversion of public funds* ....................................................................... 126 .......... n ..........2.2 New Zealand ............................................6.5Ease of compliance with government regulation* .................................... 101 .......... n ..........3.0 Singapore.................................................5.4
7.03 Access to finance index (1–7) .................................................................. 58 .......... n ..........3.9 Hong Kong SAR ......................................5.7Affordability of financial services* ............................................................. 62 .......... n ..........4.2 Hong Kong SAR ......................................6.1Availability of financial services* ................................................................ 45 .......... n ..........5.0 Switzerland ..............................................6.4Ease of access to loans* .......................................................................... 81 .......... n ..........2.7 Qatar ........................................................4.9Availability of trade finance* ...................................................................... 73 .......... n ..........3.8 Hong Kong SAR ......................................5.8
7.04 Openness to foreign participation index (1–7) ......................................... 106 .......... n ..........3.9 Ireland ......................................................5.5Ease of hiring foreign labour* .................................................................... 51 .......... n ..........4.3 United Arab Emirates ...............................5.6Business impact of rules on FDI* ............................................................ 109 .......... n ..........3.6 Ireland ......................................................6.7Openness to multilateral trade rules (0–100) ............................................. 92 .......... n ........57.8 Slovenia .................................................92.2
7.05 Index of physical security (1–7) ............................................................... 134 .......... n ..........3.3 Qatar ........................................................6.8Reliability of police services* ................................................................... 132 .......... n ..........2.4 Finland .....................................................6.7Business costs of crime and violence* .................................................... 138 .......... n ..........1.9 Qatar ........................................................6.8Business costs of terrorism* ................................................................... 117 .......... n ..........4.3 Slovenia ...................................................6.7Homicide cases/100,000 pop. ............................................................... 138 .......... n ........91.6 Hong Kong SAR ......................................0.2Index of terrorism incidence (1-7) ............................................................... 1 .......... n ..........7.0 Multiple economies (48) ...........................7.0
© 2014 World Economic Forum

Country/Economy Profiles
154 | The Global Enabling Trade Report 2014
* From the list of factors above, respondents were asked to select the five most problematic for trading in their country and to rank them between 1 (most problematic) and 5. The bars in the figure show the responses weighted according to their rankings.
For methodology, indicator descriptions and sources, and for a list of multiple best-performing economies, see page 45.
0 105 15 20 25 30
0 5 10 15 20 25 30
2
3
4
5
6
7
Operating environment
Availability & use of ICTs
Availability & quality of transport services
Availability & quality of transport infrastructure
Efficiency & transparency of border administration
Foreign market access
Domestic market access
1
Enabling Trade Index 2014 Rank Score (out of 138) (1–7)
Enabling Trade Index 2014 ...................... 2 ..... 5.5
Subindex A: Market access (25%) ....................37 .......4.1Pillar 1: Domestic market access .......................................1 .........7.0Pillar 2: Foreign market access ......................................135 .........1.2
Subindex B: Border administration (25%) ........ 11 .......5.8Pillar 3: Efficiency & transparency of border administration ................................................... 11 ........ 5.8
Subindex C: Infrastructure (25%) ........................2 .......6.0Pillar 4: Availability & quality of transport infrastructure .....3 ........ 6.5Pillar 5: Availability & quality of transport services .............5 .........5.7Pillar 6: Availability & use of ICTs ..................................... 11 ........ 6.0
Subindex D: Operating environment (25%) ........1 .......5.8Pillar 7: Operating environment ..........................................1 ........ 5.8
Key indicators, 2012 Rank/138
Population (millions) ...............................................................7.2 ........... 88GDP (US$ billions) ............................................................ 263.3 ........... 39GDP per capita (US$) .................................................. 36,676.3 ........... 24
Merchandise tradeTrade openness (imports+exports)/GDP ...........................397.9 ............. 1Share of world trade (%) ..................................................... 2.83 ............. 9Total Exports (US$ billions) ............................................... 492.9 ........... 10Total Imports (US$ billions) ............................................... 553.5 ............. 8
Value chain indicators, 2012Share (%) of merchandise trade Exports Imports
Capital goods ..................................................................... 2.6 ........ 18.5
Intermediate goods .......................................................... 84.0 ........ 59.7Food and beverages (industrial) ......................................0.1 .......... 0.2Industrial supplies (primary and processed) .................79.7 ........ 24.4Parts and accessories .................................................... 3.6 ........ 34.5Fuels and lubricants ....................................................... 0.6 .......... 0.5
Consumer goods .............................................................. 13.0 ........ 18.6Food and beverages (consumer) .....................................1.7 .......... 3.6Transport equipment and consumer goods ..................11.3 ........ 15.0
Passenger motor cars ........................................................ 0.0 .......... 0.5
Others .................................................................................. 0.5 ..........2.8
The most problematic factors for trade, 2013Most problematic factors for exporting Score*
Burdensome procedures at foreign borders .........................................................13.7Technical requirements and standards abroad .....................................................13.1Tariff barriers abroad ............................................................................................. 11.1Identifying potential markets and buyers ............................................................... 11.1Rules of origin requirements abroad ......................................................................10.3Access to imported inputs at competitive prices ................................................... 8.5Corruption at foreign borders ..................................................................................7.4Inappropriate production technology and skills ...................................................... 6.8High cost or delays caused by international transportation ................................... 6.4Difficulties in meeting quality/quantity requirements of buyers ............................... 6.2High cost or delays caused by domestic transportation ........................................ 3.0Access to trade finance .......................................................................................... 2.4
Most problematic factors for importing Score*
High cost or delays caused by international transportation ................................. 29.9Domestic technical requirements and standards ................................................. 16.3Burdensome import procedures ...........................................................................15.4High cost or delays caused by domestic transportation .......................................14.8Tariffs .......................................................................................................................7.4Inappropriate telecommunications infrastructure ....................................................7.4Crime and theft ....................................................................................................... 5.0Corruption at the border ......................................................................................... 3.8
Hong Kong SAR
Sources: International Monetary Fund, World Bank, World Trade Organization, United Nations COMTRADE
Hong Kong SAR
Advanced economies
© 2014 World Economic Forum

Country/Economy Profiles
The Global Enabling Trade Report 2014 | 155
* Indicator derived from the World Economic Forum’s Executive Opinion Survey and measured on a 1-to-7 scale, where 7 indicates best outcome.
The Enabling Trade Index 2014 in detail n Competitive Advantage n Competitive Disadvantage
For methodology, indicator descriptions and sources, and for a list of multiple best-performing economies, see page 45. Hong Kong SAR
INDICATOR, UNITS RANK/138 VALUE BEST PERFORMER VALUE
Pillar 1: Domestic market access (1–7) ............................................................. 1 ...........................7.0 Multiple economies (2) ................................ 7.0 1.01 Tariff rate (%)............................................................................................... 1 .......... n ..........0.0 Multiple economies (2) .............................0.0 1.02 Complexity of tariffs index (1–7) .................................................................. 1 .......... n ..........7.0 Multiple economies (2) .............................7.0
Tariff dispersion (standard deviation) ........................................................... 1 .......... n ..........0.0 Multiple economies (2) .............................0.0Tariff peaks (% of tariff lines) ....................................................................... 1 .......... n ..........0.0 Multiple economies (24) ...........................0.0Specific tariffs (% of tariff lines) ................................................................... 1 .......... n ..........0.0 Multiple economies (54) ...........................0.0Number of distinct tariffs ............................................................................. 1 .......... n .............1 Multiple economies (2) ................................1
1.03 Share of duty-free imports (%) .................................................................... 1 .......... n ......100.0 Multiple economies (2) .........................100.0
Pillar 2: Foreign market access (1–7) ............................................................ 135 ...........................1.2 Cambodia ..................................................... 5.3 2.01 Tariffs faced (%) ...................................................................................... 134 .......... n ..........6.0 Chile .........................................................3.5 2.02 Index of margin of preference in destination mkts (0–100) ...................... 130 .......... n ..........4.3 Mauritius ................................................97.1
Pillar 3: Efficiency and transparency of border administration (1–7) .............. 11 ...........................5.8 Singapore..................................................... 6.3 3.01 Customs services index (0–1) ................................................................... 56 .......... n ........0.63 Singapore...............................................0.97 3.02 Efficiency of the clearance process (1–5) .................................................. 17 .......... n ..........3.7 Norway ....................................................4.2 3.03 No. of days to import ................................................................................. 2 .......... n .............5 Singapore....................................................4 3.04 No. of documents to import ....................................................................... 3 .......... n .............3 Multiple economies (2) ................................2 3.05 Cost to import (US$ per container) ............................................................. 3 .......... n .........565 Singapore................................................440 3.06 No. of days to export.................................................................................. 1 .......... n .............6 Multiple economies (5) ................................6 3.07 No. of documents to export ....................................................................... 3 .......... n .............3 Multiple economies (2) ................................2 3.08 Cost to export (US$ per container) ............................................................. 4 .......... n .........590 Malaysia ..................................................450 3.09 Irregular payments in exports and imports*............................................... 13 .......... n ..........5.9 New Zealand ............................................6.6 3.10 Time predictability of import procedures* .................................................... 2 .......... n ..........6.0 Finland .....................................................6.0 3.11 Customs transparency index (0–1) ........................................................... 59 .......... n ........0.80 Multiple economies (35) .........................1.00
Pillar 4: Availability and quality of transport infrastructure (1-7) ....................... 3 ...........................6.5 United Arab Emirates ................................... 6.5 4.01 Available int’l airline seat km/week, millions .............................................. 11 .......... n ...2,371.9 United States ..................................11,481.7 4.02 Quality of air transport infrastructure* .......................................................... 2 .......... n ..........6.7 Singapore.................................................6.8 4.03 Quality of railroad infrastructure* ................................................................. 3 .......... n ..........6.5 Japan .......................................................6.7 4.04 Liner Shipping Connectivity Index (0–157.1) ............................................... 2 .......... n ......116.6 China ...................................................157.5 4.05 Quality of port infrastructure* ...................................................................... 3 .......... n ..........6.6 Netherlands ..............................................6.8 4.06 Paved roads (% of total) ............................................................................. 1 .......... n ......100.0 Multiple economies (18) .......................100.0 4.07 Quality of roads* ......................................................................................... 5 .......... n ..........6.2 United Arab Emirates ...............................6.6
Pillar 5: Availability and quality of transport services (1–7) .............................. 5 ...........................5.7 Singapore..................................................... 5.7 5.01 Ease and affordability of shipment (1–5).................................................... 14 .......... n ..........3.6 Luxembourg .............................................3.8 5.02 Logistics competence (1–5) ...................................................................... 13 .......... n ..........3.8 Norway ....................................................4.2 5.03 Tracking and tracing ability (1–5) ............................................................... 13 .......... n ..........3.9 Germany ..................................................4.2 5.04 Timeliness of shipments in reaching destination (1–5) ............................... 18 .......... n ..........4.1 Luxembourg .............................................4.7 5.05 Postal services efficiency* ........................................................................... 2 .......... n ..........6.5 Japan .......................................................6.8 5.06 Efficiency of transport mode change* ......................................................... 1 .......... n ..........6.4 Hong Kong SAR ......................................6.4
Pillar 6: Availability and use of ICTs (1–7) ........................................................ 11 ...........................6.0 Sweden ........................................................ 6.5 6.01 Mobile phone subscriptions/100 pop. ........................................................ 1 .......... n ......229.2 Hong Kong SAR ..................................229.2 6.02 Individuals using Internet (%) .................................................................... 32 .......... n ........72.8 Iceland ...................................................96.2 6.03 Fixed broadband Internet subscriptions/100 pop. .................................... 15 .......... n ........31.2 Switzerland ............................................39.9 6.04 Active mobile broadband Internet subscriptions/100 pop. ........................ 10 .......... n ........82.8 Singapore.............................................124.5 6.05 ICT use for business-to-business transactions* ........................................ 18 .......... n ..........5.8 Finland .....................................................6.2 6.06 Internet use for business-to-consumer transactions* ................................ 19 .......... n ..........5.5 United Kingdom .......................................6.3 6.07 Government Online Service Index (0–1) ................................................... n/a ........................n/a Multiple economies (3) ...........................1.00
Pillar 7: Operating environment (1–7) ................................................................ 1 ...........................5.8 Hong Kong SAR ............................................ 5.8 7.01 Protection of property index (1–7) ............................................................... 8 .......... n ..........5.9 Finland .....................................................6.3
Property rights* ........................................................................................... 5 .......... n ..........6.1 Finland .....................................................6.4Intellectual property protection* .................................................................. 9 .......... n ..........5.7 Finland .....................................................6.2
7.02 Efficiency and accountability of public institutions index (1–7) ..................... 2 .......... n ..........5.9 Singapore.................................................6.0Judicial efficiency & impartiality in commercial disputes (0–4)...................... 1 .......... n ..........4.0 Multiple economies (7) .............................4.0Diversion of public funds* ......................................................................... 11 .......... n ..........5.8 New Zealand ............................................6.5Ease of compliance with government regulation* ........................................ 5 .......... n ..........4.9 Singapore.................................................5.4
7.03 Access to finance index (1–7) .................................................................... 1 .......... n ..........5.7 Hong Kong SAR ......................................5.7Affordability of financial services* ............................................................... 1 .......... n ..........6.1 Hong Kong SAR ......................................6.1Availability of financial services* .................................................................. 3 .......... n ..........6.3 Switzerland ..............................................6.4Ease of access to loans* ............................................................................ 2 .......... n ..........4.7 Qatar ........................................................4.9Availability of trade finance* ........................................................................ 1 .......... n ..........5.8 Hong Kong SAR ......................................5.8
7.04 Openness to foreign participation index (1–7) ............................................. 2 .......... n ..........5.3 Ireland ......................................................5.5Ease of hiring foreign labour* .................................................................... 23 .......... n ..........4.6 United Arab Emirates ...............................5.6Business impact of rules on FDI* ................................................................ 3 .......... n ..........6.1 Ireland ......................................................6.7Openness to multilateral trade rules (0–100) ............................................ n/a ........................n/a Slovenia .................................................92.2
7.05 Index of physical security (1–7) ................................................................. 13 .......... n ..........6.3 Qatar ........................................................6.8Reliability of police services* ....................................................................... 4 .......... n ..........6.3 Finland .....................................................6.7Business costs of crime and violence* ...................................................... 21 .......... n ..........5.7 Qatar ........................................................6.8Business costs of terrorism* ..................................................................... 57 .......... n ..........5.7 Slovenia ...................................................6.7Homicide cases/100,000 pop. ................................................................... 1 .......... n ..........0.2 Hong Kong SAR ......................................0.2Index of terrorism incidence (1-7) ............................................................... 1 .......... n ..........7.0 Multiple economies (48) ...........................7.0
© 2014 World Economic Forum
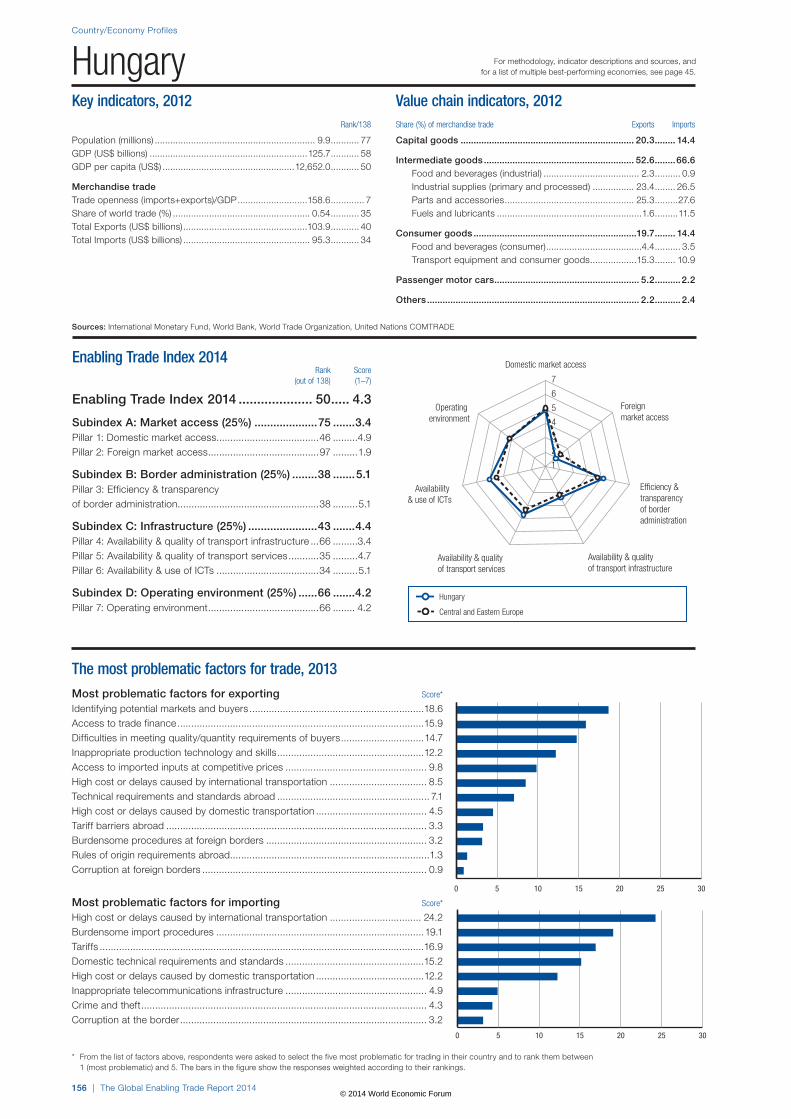
Country/Economy Profiles
156 | The Global Enabling Trade Report 2014
* From the list of factors above, respondents were asked to select the five most problematic for trading in their country and to rank them between 1 (most problematic) and 5. The bars in the figure show the responses weighted according to their rankings.
For methodology, indicator descriptions and sources, and for a list of multiple best-performing economies, see page 45.
0 105 15 20 25 30
0 5 10 15 20 25 30
2
3
4
5
6
7
Operating environment
Availability & use of ICTs
Availability & quality of transport services
Availability & quality of transport infrastructure
Efficiency & transparency of border administration
Foreign market access
Domestic market access
1
Enabling Trade Index 2014 Rank Score (out of 138) (1–7)
Enabling Trade Index 2014 .................... 50 ..... 4.3
Subindex A: Market access (25%) ....................75 .......3.4Pillar 1: Domestic market access .....................................46 .........4.9Pillar 2: Foreign market access ........................................97 .........1.9
Subindex B: Border administration (25%) ........38 .......5.1Pillar 3: Efficiency & transparency of border administration ...................................................38 .........5.1
Subindex C: Infrastructure (25%) ......................43 .......4.4Pillar 4: Availability & quality of transport infrastructure ...66 .........3.4Pillar 5: Availability & quality of transport services ...........35 .........4.7Pillar 6: Availability & use of ICTs .....................................34 .........5.1
Subindex D: Operating environment (25%) ......66 .......4.2Pillar 7: Operating environment ........................................66 ........ 4.2
Key indicators, 2012 Rank/138
Population (millions) .............................................................. 9.9 ........... 77GDP (US$ billions) .............................................................125.7 ........... 58GDP per capita (US$) ...................................................12,652.0 ........... 50
Merchandise tradeTrade openness (imports+exports)/GDP ...........................158.6 ............. 7Share of world trade (%) ..................................................... 0.54 ........... 35Total Exports (US$ billions) ................................................103.9 ........... 40Total Imports (US$ billions) ................................................. 95.3 ........... 34
Value chain indicators, 2012Share (%) of merchandise trade Exports Imports
Capital goods ................................................................... 20.3 ........ 14.4
Intermediate goods .......................................................... 52.6 ........66.6Food and beverages (industrial) ..................................... 2.3 .......... 0.9Industrial supplies (primary and processed) ................ 23.4 ........ 26.5Parts and accessories .................................................. 25.3 .........27.6Fuels and lubricants ........................................................1.6 .........11.5
Consumer goods ...............................................................19.7 ........ 14.4Food and beverages (consumer) .....................................4.4 .......... 3.5Transport equipment and consumer goods ..................15.3 ........ 10.9
Passenger motor cars ........................................................ 5.2 ..........2.2
Others .................................................................................. 2.2 ..........2.4
The most problematic factors for trade, 2013Most problematic factors for exporting Score*
Identifying potential markets and buyers ...............................................................18.6Access to trade finance .........................................................................................15.9Difficulties in meeting quality/quantity requirements of buyers ..............................14.7Inappropriate production technology and skills .....................................................12.2Access to imported inputs at competitive prices ................................................... 9.8High cost or delays caused by international transportation ................................... 8.5Technical requirements and standards abroad ....................................................... 7.1High cost or delays caused by domestic transportation ........................................ 4.5Tariff barriers abroad .............................................................................................. 3.3Burdensome procedures at foreign borders .......................................................... 3.2Rules of origin requirements abroad ........................................................................1.3Corruption at foreign borders ................................................................................. 0.9
Most problematic factors for importing Score*
High cost or delays caused by international transportation ................................. 24.2Burdensome import procedures ...........................................................................19.1Tariffs .....................................................................................................................16.9Domestic technical requirements and standards ..................................................15.2High cost or delays caused by domestic transportation .......................................12.2Inappropriate telecommunications infrastructure ................................................... 4.9Crime and theft ....................................................................................................... 4.3Corruption at the border ......................................................................................... 3.2
Hungary
Sources: International Monetary Fund, World Bank, World Trade Organization, United Nations COMTRADE
Hungary
Central and Eastern Europe
© 2014 World Economic Forum

Country/Economy Profiles
The Global Enabling Trade Report 2014 | 157
* Indicator derived from the World Economic Forum’s Executive Opinion Survey and measured on a 1-to-7 scale, where 7 indicates best outcome.
The Enabling Trade Index 2014 in detail n Competitive Advantage n Competitive Disadvantage
For methodology, indicator descriptions and sources, and for a list of multiple best-performing economies, see page 45. Hungary
INDICATOR, UNITS RANK/138 VALUE BEST PERFORMER VALUE
Pillar 1: Domestic market access (1–7) ........................................................... 46 ...........................4.9 Multiple economies (2) ................................ 7.0 1.01 Tariff rate (%)............................................................................................... 5 .......... n ..........0.8 Multiple economies (2) .............................0.0 1.02 Complexity of tariffs index (1–7) .............................................................. 110 .......... n ..........3.1 Multiple economies (2) .............................7.0
Tariff dispersion (standard deviation) ......................................................... 55 .......... n ..........8.4 Multiple economies (2) .............................0.0Tariff peaks (% of tariff lines) ................................................................... 104 .......... n ........10.6 Multiple economies (24) ...........................0.0Specific tariffs (% of tariff lines) ............................................................... 107 .......... n ........11.0 Multiple economies (54) ...........................0.0Number of distinct tariffs ......................................................................... 109 .......... n ......1,755 Multiple economies (2) ................................1
1.03 Share of duty-free imports (%) .................................................................. 42 .......... n ........65.4 Multiple economies (2) .........................100.0
Pillar 2: Foreign market access (1–7) .............................................................. 97 ...........................1.9 Cambodia ..................................................... 5.3 2.01 Tariffs faced (%) ........................................................................................ 73 .......... n ..........5.5 Chile .........................................................3.5 2.02 Index of margin of preference in destination mkts (0–100) ........................ 96 .......... n ..........9.1 Mauritius ................................................97.1
Pillar 3: Efficiency and transparency of border administration (1–7) .............. 38 ...........................5.1 Singapore..................................................... 6.3 3.01 Customs services index (0–1) .................................................................. n/a ........................n/a Singapore...............................................0.97 3.02 Efficiency of the clearance process (1–5) .................................................. 47 .......... n ..........3.0 Norway ....................................................4.2 3.03 No. of days to import ............................................................................... 78 .......... n ...........19 Singapore....................................................4 3.04 No. of documents to import ..................................................................... 43 .......... n .............6 Multiple economies (2) ................................2 3.05 Cost to import (US$ per container) ........................................................... 29 .......... n .........845 Singapore................................................440 3.06 No. of days to export................................................................................ 71 .......... n ...........17 Multiple economies (5) ................................6 3.07 No. of documents to export ..................................................................... 65 .......... n .............6 Multiple economies (2) ................................2 3.08 Cost to export (US$ per container) ........................................................... 38 .......... n .........885 Malaysia ..................................................450 3.09 Irregular payments in exports and imports*............................................... 47 .......... n ..........4.3 New Zealand ............................................6.6 3.10 Time predictability of import procedures* .................................................. 26 .......... n ..........4.9 Finland .....................................................6.0 3.11 Customs transparency index (0–1) ............................................................. 1 .......... n ........1.00 Multiple economies (35) .........................1.00
Pillar 4: Availability and quality of transport infrastructure (1-7) ..................... 66 ...........................3.4 United Arab Emirates ................................... 6.5 4.01 Available int’l airline seat km/week, millions .............................................. 75 .......... n ......122.5 United States ..................................11,481.7 4.02 Quality of air transport infrastructure* ........................................................ 94 .......... n ..........3.9 Singapore.................................................6.8 4.03 Quality of railroad infrastructure* ............................................................... 39 .......... n ..........3.6 Japan .......................................................6.7 4.04 Liner Shipping Connectivity Index (0–157.1) ............................................ n/a ........................n/a China ...................................................157.5 4.05 Quality of port infrastructure* .................................................................... 77 .......... n ..........3.9 Netherlands ..............................................6.8 4.06 Paved roads (% of total) ........................................................................... 80 .......... n ........38.1 Multiple economies (18) .......................100.0 4.07 Quality of roads* ....................................................................................... 66 .......... n ..........4.0 United Arab Emirates ...............................6.6
Pillar 5: Availability and quality of transport services (1–7) ............................ 35 ...........................4.7 Singapore..................................................... 5.7 5.01 Ease and affordability of shipment (1–5).................................................... 32 .......... n ..........3.4 Luxembourg .............................................3.8 5.02 Logistics competence (1–5) ...................................................................... 37 .......... n ..........3.3 Norway ....................................................4.2 5.03 Tracking and tracing ability (1–5) ............................................................... 15 .......... n ..........3.8 Germany ..................................................4.2 5.04 Timeliness of shipments in reaching destination (1–5) ............................... 20 .......... n ..........4.1 Luxembourg .............................................4.7 5.05 Postal services efficiency* ......................................................................... 60 .......... n ..........4.7 Japan .......................................................6.8 5.06 Efficiency of transport mode change* ....................................................... 79 .......... n ..........3.8 Hong Kong SAR ......................................6.4
Pillar 6: Availability and use of ICTs (1–7) ........................................................ 34 ...........................5.1 Sweden ........................................................ 6.5 6.01 Mobile phone subscriptions/100 pop. ...................................................... 56 .......... n ......116.1 Hong Kong SAR ..................................229.2 6.02 Individuals using Internet (%) .................................................................... 33 .......... n ........72.0 Iceland ...................................................96.2 6.03 Fixed broadband Internet subscriptions/100 pop. .................................... 30 .......... n ........22.9 Switzerland ............................................39.9 6.04 Active mobile broadband Internet subscriptions/100 pop. ........................ 64 .......... n ........23.0 Singapore.............................................124.5 6.05 ICT use for business-to-business transactions* ........................................ 41 .......... n ..........5.3 Finland .....................................................6.2 6.06 Internet use for business-to-consumer transactions* ................................ 51 .......... n ..........4.9 United Kingdom .......................................6.3 6.07 Government Online Service Index (0–1) .................................................... 31 .......... n ........0.69 Multiple economies (3) ...........................1.00
Pillar 7: Operating environment (1–7) .............................................................. 66 ...........................4.2 Hong Kong SAR ............................................ 5.8 7.01 Protection of property index (1–7) ............................................................. 75 .......... n ..........3.8 Finland .....................................................6.3
Property rights* ......................................................................................... 95 .......... n ..........3.7 Finland .....................................................6.4Intellectual property protection* ................................................................ 53 .......... n ..........3.9 Finland .....................................................6.2
7.02 Efficiency and accountability of public institutions index (1–7) ................. 115 .......... n ..........2.9 Singapore.................................................6.0Judicial efficiency & impartiality in commercial disputes (0–4).................... 77 .......... n ..........1.8 Multiple economies (7) .............................4.0Diversion of public funds* ....................................................................... 100 .......... n ..........2.6 New Zealand ............................................6.5Ease of compliance with government regulation* .................................... 130 .......... n ..........2.4 Singapore.................................................5.4
7.03 Access to finance index (1–7) ................................................................ 107 .......... n ..........3.2 Hong Kong SAR ......................................5.7Affordability of financial services* ........................................................... 103 .......... n ..........3.7 Hong Kong SAR ......................................6.1Availability of financial services* ................................................................ 62 .......... n ..........4.6 Switzerland ..............................................6.4Ease of access to loans* ........................................................................ 114 .......... n ..........2.1 Qatar ........................................................4.9Availability of trade finance* .................................................................... 127 .......... n ..........2.6 Hong Kong SAR ......................................5.8
7.04 Openness to foreign participation index (1–7) ............................................. 4 .......... n ..........5.3 Ireland ......................................................5.5Ease of hiring foreign labour* ...................................................................... 4 .......... n ..........5.3 United Arab Emirates ...............................5.6Business impact of rules on FDI* .............................................................. 95 .......... n ..........4.2 Ireland ......................................................6.7Openness to multilateral trade rules (0–100) ............................................... 2 .......... n ........89.4 Slovenia .................................................92.2
7.05 Index of physical security (1–7) ................................................................. 43 .......... n ..........5.9 Qatar ........................................................6.8Reliability of police services* ..................................................................... 66 .......... n ..........4.2 Finland .....................................................6.7Business costs of crime and violence* ...................................................... 60 .......... n ..........4.9 Qatar ........................................................6.8Business costs of terrorism* ..................................................................... 10 .......... n ..........6.4 Slovenia ...................................................6.7Homicide cases/100,000 pop. ................................................................. 40 .......... n ..........1.4 Hong Kong SAR ......................................0.2Index of terrorism incidence (1-7) ............................................................... 1 .......... n ..........7.0 Multiple economies (48) ...........................7.0
© 2014 World Economic Forum

Country/Economy Profiles
158 | The Global Enabling Trade Report 2014
* From the list of factors above, respondents were asked to select the five most problematic for trading in their country and to rank them between 1 (most problematic) and 5. The bars in the figure show the responses weighted according to their rankings.
For methodology, indicator descriptions and sources, and for a list of multiple best-performing economies, see page 45.
0 105 15 20 25 30
0 5 10 15 20 25 30
2
3
4
5
6
7
Operating environment
Availability & use of ICTs
Availability & quality of transport services
Availability & quality of transport infrastructure
Efficiency & transparency of border administration
Foreign market access
Domestic market access
1
Enabling Trade Index 2014 Rank Score (out of 138) (1–7)
Enabling Trade Index 2014 .................... 22 ..... 4.9
Subindex A: Market access (25%) ....................21 .......4.3Pillar 1: Domestic market access .....................................21 ........ 5.5Pillar 2: Foreign market access ........................................46 ........ 3.2
Subindex B: Border administration (25%) ........24 .......5.6Pillar 3: Efficiency & transparency of border administration ...................................................24 .........5.6
Subindex C: Infrastructure (25%) ......................30 .......4.8Pillar 4: Availability & quality of transport infrastructure ...50 ........ 3.8Pillar 5: Availability & quality of transport services ...........28 .........5.0Pillar 6: Availability & use of ICTs .....................................20 .........5.7
Subindex D: Operating environment (25%) ......31 .......4.8Pillar 7: Operating environment ........................................31 ........ 4.8
Key indicators, 2012 Rank/138
Population (millions) .............................................................. 0.3 ......... 138GDP (US$ billions) ...............................................................13.7 ......... 109GDP per capita (US$) ...................................................42,725.0 ........... 19
Merchandise tradeTrade openness (imports+exports)/GDP .............................72.0 ........... 62Share of world trade (%) ..................................................... 0.03 ......... 108Total Exports (US$ billions) ....................................................5.1 ......... 100Total Imports (US$ billions) ................................................... 4.8 ..........117
Value chain indicators, 2012Share (%) of merchandise trade Exports Imports
Capital goods ..................................................................... 3.6 ........ 14.7
Intermediate goods ...........................................................51.4 ........46.5Food and beverages (industrial) ......................................2.1 .......... 1.6Industrial supplies (primary and processed) .................47.8 ........ 29.2Parts and accessories .....................................................1.5 ........ 14.8Fuels and lubricants ....................................................... 0.0 .......... 0.9
Consumer goods .............................................................. 42.7 ........ 21.0Food and beverages (consumer) .................................. 38.7 ...........7.7Transport equipment and consumer goods ................... 4.0 ........ 13.4
Passenger motor cars ........................................................ 0.3 .......... 3.7
Others .................................................................................. 2.0 ........ 14.0
The most problematic factors for trade, 2013Most problematic factors for exporting Score*
High cost or delays caused by international transportation .................................. 17.9Identifying potential markets and buyers ............................................................... 17.5Access to trade finance .........................................................................................17.2Access to imported inputs at competitive prices ....................................................9.7Tariff barriers abroad ...............................................................................................7.5High cost or delays caused by domestic transportation ........................................ 6.7Burdensome procedures at foreign borders .......................................................... 5.9Difficulties in meeting quality/quantity requirements of buyers ............................... 5.3Rules of origin requirements abroad ....................................................................... 4.3Technical requirements and standards abroad ...................................................... 3.6Inappropriate production technology and skills ...................................................... 3.4Corruption at foreign borders ..................................................................................1.1
Most problematic factors for importing Score*
Tariffs .....................................................................................................................27.5High cost or delays caused by international transportation ..................................24.9Burdensome import procedures ...........................................................................21.5High cost or delays caused by domestic transportation .......................................12.3Domestic technical requirements and standards ..................................................11.0Inappropriate telecommunications infrastructure ....................................................1.7Crime and theft ....................................................................................................... 0.8Corruption at the border ......................................................................................... 0.4
Iceland
Sources: International Monetary Fund, World Bank, World Trade Organization, United Nations COMTRADE
Iceland
Advanced economies
© 2014 World Economic Forum

Country/Economy Profiles
The Global Enabling Trade Report 2014 | 159
* Indicator derived from the World Economic Forum’s Executive Opinion Survey and measured on a 1-to-7 scale, where 7 indicates best outcome.
The Enabling Trade Index 2014 in detail n Competitive Advantage n Competitive Disadvantage
For methodology, indicator descriptions and sources, and for a list of multiple best-performing economies, see page 45. Iceland
INDICATOR, UNITS RANK/138 VALUE BEST PERFORMER VALUE
Pillar 1: Domestic market access (1–7) ........................................................... 21 ...........................5.5 Multiple economies (2) ................................ 7.0 1.01 Tariff rate (%)............................................................................................. 44 .......... n ..........3.2 Multiple economies (2) .............................0.0 1.02 Complexity of tariffs index (1–7) .............................................................. 102 .......... n ..........4.3 Multiple economies (2) .............................7.0
Tariff dispersion (standard deviation) ....................................................... 132 .......... n ........26.9 Multiple economies (2) .............................0.0Tariff peaks (% of tariff lines) ..................................................................... 88 .......... n ..........7.9 Multiple economies (24) ...........................0.0Specific tariffs (% of tariff lines) ................................................................. 97 .......... n ..........4.5 Multiple economies (54) ...........................0.0Number of distinct tariffs ........................................................................... 99 .......... n .........405 Multiple economies (2) ................................1
1.03 Share of duty-free imports (%) .................................................................... 9 .......... n ........91.7 Multiple economies (2) .........................100.0
Pillar 2: Foreign market access (1–7) .............................................................. 46 ...........................3.2 Cambodia ..................................................... 5.3 2.01 Tariffs faced (%) ........................................................................................ 49 .......... n ..........5.3 Chile .........................................................3.5 2.02 Index of margin of preference in destination mkts (0–100) ........................ 42 .......... n ........44.6 Mauritius ................................................97.1
Pillar 3: Efficiency and transparency of border administration (1–7) .............. 24 ...........................5.6 Singapore..................................................... 6.3 3.01 Customs services index (0–1) ................................................................... 36 .......... n ........0.69 Singapore...............................................0.97 3.02 Efficiency of the clearance process (1–5) .................................................. 22 .......... n ..........3.5 Norway ....................................................4.2 3.03 No. of days to import ............................................................................... 21 .......... n .............9 Singapore....................................................4 3.04 No. of documents to import ..................................................................... 11 .......... n .............4 Multiple economies (2) ................................2 3.05 Cost to import (US$ per container) ........................................................... 94 .......... n ......1,620 Singapore................................................440 3.06 No. of days to export................................................................................ 24 .......... n ...........10 Multiple economies (5) ................................6 3.07 No. of documents to export ..................................................................... 16 .......... n .............4 Multiple economies (2) ................................2 3.08 Cost to export (US$ per container) ........................................................... 99 .......... n ......1,530 Malaysia ..................................................450 3.09 Irregular payments in exports and imports*................................................. 5 .......... n ..........6.2 New Zealand ............................................6.6 3.10 Time predictability of import procedures* .................................................... 6 .......... n ..........5.5 Finland .....................................................6.0 3.11 Customs transparency index (0–1) ........................................................... 39 .......... n ........0.90 Multiple economies (35) .........................1.00
Pillar 4: Availability and quality of transport infrastructure (1-7) ..................... 50 ...........................3.8 United Arab Emirates ................................... 6.5 4.01 Available int’l airline seat km/week, millions .............................................. 76 .......... n ......120.8 United States ..................................11,481.7 4.02 Quality of air transport infrastructure* ........................................................ 13 .......... n ..........6.0 Singapore.................................................6.8 4.03 Quality of railroad infrastructure* .............................................................. n/a ........................n/a Japan .......................................................6.7 4.04 Liner Shipping Connectivity Index (0–157.1) ........................................... 100 .......... n ..........4.7 China ...................................................157.5 4.05 Quality of port infrastructure* ...................................................................... 8 .......... n ..........6.0 Netherlands ..............................................6.8 4.06 Paved roads (% of total) ........................................................................... 77 .......... n ........39.9 Multiple economies (18) .......................100.0 4.07 Quality of roads* ....................................................................................... 33 .......... n ..........5.0 United Arab Emirates ...............................6.6
Pillar 5: Availability and quality of transport services (1–7) ............................ 28 ...........................5.0 Singapore..................................................... 5.7 5.01 Ease and affordability of shipment (1–5).................................................... 49 .......... n ..........3.2 Luxembourg .............................................3.8 5.02 Logistics competence (1–5) ...................................................................... 34 .......... n ..........3.5 Norway ....................................................4.2 5.03 Tracking and tracing ability (1–5) ............................................................... 35 .......... n ..........3.4 Germany ..................................................4.2 5.04 Timeliness of shipments in reaching destination (1–5) ............................... 56 .......... n ..........3.5 Luxembourg .............................................4.7 5.05 Postal services efficiency* ........................................................................... 8 .......... n ..........6.3 Japan .......................................................6.8 5.06 Efficiency of transport mode change* ....................................................... 10 .......... n ..........5.7 Hong Kong SAR ......................................6.4
Pillar 6: Availability and use of ICTs (1–7) ........................................................ 20 ...........................5.7 Sweden ........................................................ 6.5 6.01 Mobile phone subscriptions/100 pop. ...................................................... 72 .......... n ......108.1 Hong Kong SAR ..................................229.2 6.02 Individuals using Internet (%) ...................................................................... 1 .......... n ........96.2 Iceland ...................................................96.2 6.03 Fixed broadband Internet subscriptions/100 pop. ...................................... 7 .......... n ........34.3 Switzerland ............................................39.9 6.04 Active mobile broadband Internet subscriptions/100 pop. ........................ 16 .......... n ........70.4 Singapore.............................................124.5 6.05 ICT use for business-to-business transactions* ........................................ 22 .......... n ..........5.7 Finland .....................................................6.2 6.06 Internet use for business-to-consumer transactions* ................................ 28 .......... n ..........5.3 United Kingdom .......................................6.3 6.07 Government Online Service Index (0–1) .................................................... 52 .......... n ........0.54 Multiple economies (3) ...........................1.00
Pillar 7: Operating environment (1–7) .............................................................. 31 ...........................4.8 Hong Kong SAR ............................................ 5.8 7.01 Protection of property index (1–7) ............................................................. 30 .......... n ..........5.0 Finland .....................................................6.3
Property rights* ......................................................................................... 31 .......... n ..........5.2 Finland .....................................................6.4Intellectual property protection* ................................................................ 28 .......... n ..........4.8 Finland .....................................................6.2
7.02 Efficiency and accountability of public institutions index (1–7) ................... 15 .......... n ..........5.1 Singapore.................................................6.0Judicial efficiency & impartiality in commercial disputes (0–4).................... 13 .......... n ..........3.5 Multiple economies (7) .............................4.0Diversion of public funds* ......................................................................... 21 .......... n ..........5.1 New Zealand ............................................6.5Ease of compliance with government regulation* ...................................... 27 .......... n ..........3.9 Singapore.................................................5.4
7.03 Access to finance index (1–7) .................................................................. 81 .......... n ..........3.6 Hong Kong SAR ......................................5.7Affordability of financial services* ............................................................. 95 .......... n ..........3.7 Hong Kong SAR ......................................6.1Availability of financial services* ................................................................ 91 .......... n ..........4.0 Switzerland ..............................................6.4Ease of access to loans* .......................................................................... 69 .......... n ..........2.8 Qatar ........................................................4.9Availability of trade finance* ...................................................................... 65 .......... n ..........3.9 Hong Kong SAR ......................................5.8
7.04 Openness to foreign participation index (1–7) ......................................... 107 .......... n ..........3.9 Ireland ......................................................5.5Ease of hiring foreign labour* .................................................................... 24 .......... n ..........4.5 United Arab Emirates ...............................5.6Business impact of rules on FDI* ............................................................ 134 .......... n ..........2.7 Ireland ......................................................6.7Openness to multilateral trade rules (0–100) ............................................. 64 .......... n ........64.8 Slovenia .................................................92.2
7.05 Index of physical security (1–7) ................................................................... 4 .......... n ..........6.6 Qatar ........................................................6.8Reliability of police services* ....................................................................... 9 .......... n ..........6.1 Finland .....................................................6.7Business costs of crime and violence* ........................................................ 8 .......... n ..........6.1 Qatar ........................................................6.8Business costs of terrorism* ....................................................................... 5 .......... n ..........6.6 Slovenia ...................................................6.7Homicide cases/100,000 pop. ................................................................. 23 .......... n ..........0.9 Hong Kong SAR ......................................0.2Index of terrorism incidence (1-7) ............................................................. 49 .......... n ..........7.0 Multiple economies (48) ...........................7.0
© 2014 World Economic Forum

Country/Economy Profiles
160 | The Global Enabling Trade Report 2014
* From the list of factors above, respondents were asked to select the five most problematic for trading in their country and to rank them between 1 (most problematic) and 5. The bars in the figure show the responses weighted according to their rankings.
For methodology, indicator descriptions and sources, and for a list of multiple best-performing economies, see page 45.
0 105 15 20 25 30
0 5 10 15 20 25 30
2
3
4
5
6
7
Operating environment
Availability & use of ICTs
Availability & quality of transport services
Availability & quality of transport infrastructure
Efficiency & transparency of border administration
Foreign market access
Domestic market access
1
Enabling Trade Index 2014 Rank Score (out of 138) (1–7)
Enabling Trade Index 2014 .................... 96 ..... 3.6
Subindex A: Market access (25%) ..................136 .......2.4Pillar 1: Domestic market access ...................................135 .........2.9Pillar 2: Foreign market access ........................................94 .........2.0
Subindex B: Border administration (25%) ........ 74 .......4.2Pillar 3: Efficiency & transparency of border administration ................................................... 74 ........ 4.2
Subindex C: Infrastructure (25%) ......................67 .......3.8Pillar 4: Availability & quality of transport infrastructure ...34 ........ 4.3Pillar 5: Availability & quality of transport services ...........57 ........ 4.3Pillar 6: Availability & use of ICTs ...................................104 .........2.9
Subindex D: Operating environment (25%) ......73 .......4.1Pillar 7: Operating environment ........................................73 .........4.1
Key indicators, 2012 Rank/138
Population (millions) ........................................................1,227.2 ............. 2GDP (US$ billions) .......................................................... 1,841.7 ........... 10GDP per capita (US$) .................................................... 1,500.8 ......... 106
Merchandise tradeTrade openness (imports+exports)/GDP .............................42.5 ..........119Share of world trade (%) ...................................................... 2.12 ........... 15Total Exports (US$ billions) ............................................... 294.2 ........... 19Total Imports (US$ billions) ............................................... 489.7 ........... 10
Value chain indicators, 2012Share (%) of merchandise trade Exports Imports
Capital goods ..................................................................... 6.3 .......... 9.3
Intermediate goods .......................................................... 46.6 ........85.0Food and beverages (industrial) ......................................1.9 .......... 0.8Industrial supplies (primary and processed) ................ 38.0 ........ 39.0Parts and accessories .................................................... 6.5 ...........7.6Fuels and lubricants ....................................................... 0.2 .........37.6
Consumer goods ...............................................................27.1 .......... 4.4Food and beverages (consumer) .................................... 6.8 ...........1.1Transport equipment and consumer goods ................. 20.3 .......... 3.3
Passenger motor cars .........................................................1.5 .......... 0.1
Others ................................................................................ 18.5 .......... 1.2
The most problematic factors for trade, 2013Most problematic factors for exporting Score*
Access to imported inputs at competitive prices ..................................................13.7High cost or delays caused by domestic transportation .......................................12.8Technical requirements and standards abroad .....................................................10.0Difficulties in meeting quality/quantity requirements of buyers ............................... 9.4Burdensome procedures at foreign borders ...........................................................9.1Tariff barriers abroad .............................................................................................. 8.4Identifying potential markets and buyers ................................................................ 8.2Corruption at foreign borders ..................................................................................7.6High cost or delays caused by international transportation ................................... 6.2Inappropriate production technology and skills ...................................................... 6.0Access to trade finance ...........................................................................................5.7Rules of origin requirements abroad ....................................................................... 3.0
Most problematic factors for importing Score*
Burdensome import procedures ...........................................................................23.7Tariffs .....................................................................................................................21.4Corruption at the border ........................................................................................15.5High cost or delays caused by domestic transportation .......................................14.0High cost or delays caused by international transportation ................................... 9.3Domestic technical requirements and standards .................................................... 7.1Crime and theft ........................................................................................................6.1Inappropriate telecommunications infrastructure ................................................... 2.9
India
Sources: International Monetary Fund, World Bank, World Trade Organization, United Nations COMTRADE
India
Developing Asia
© 2014 World Economic Forum
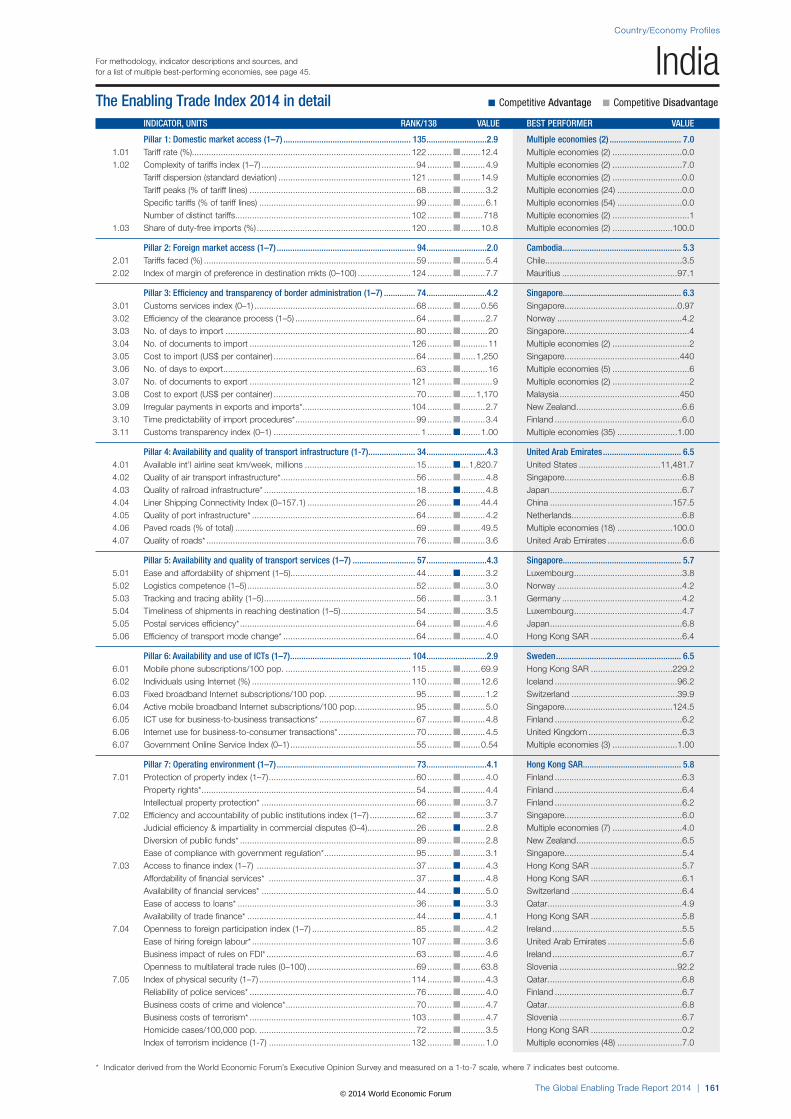
Country/Economy Profiles
The Global Enabling Trade Report 2014 | 161
* Indicator derived from the World Economic Forum’s Executive Opinion Survey and measured on a 1-to-7 scale, where 7 indicates best outcome.
The Enabling Trade Index 2014 in detail n Competitive Advantage n Competitive Disadvantage
For methodology, indicator descriptions and sources, and for a list of multiple best-performing economies, see page 45. India
INDICATOR, UNITS RANK/138 VALUE BEST PERFORMER VALUE
Pillar 1: Domestic market access (1–7) ......................................................... 135 ...........................2.9 Multiple economies (2) ................................ 7.0 1.01 Tariff rate (%)........................................................................................... 122 .......... n ........12.4 Multiple economies (2) .............................0.0 1.02 Complexity of tariffs index (1–7) ................................................................ 94 .......... n ..........4.9 Multiple economies (2) .............................7.0
Tariff dispersion (standard deviation) ....................................................... 121 .......... n ........14.9 Multiple economies (2) .............................0.0Tariff peaks (% of tariff lines) ..................................................................... 68 .......... n ..........3.2 Multiple economies (24) ...........................0.0Specific tariffs (% of tariff lines) ................................................................. 99 .......... n ..........6.1 Multiple economies (54) ...........................0.0Number of distinct tariffs ......................................................................... 102 .......... n .........718 Multiple economies (2) ................................1
1.03 Share of duty-free imports (%) ................................................................ 120 .......... n ........10.8 Multiple economies (2) .........................100.0
Pillar 2: Foreign market access (1–7) .............................................................. 94 ...........................2.0 Cambodia ..................................................... 5.3 2.01 Tariffs faced (%) ........................................................................................ 59 .......... n ..........5.4 Chile .........................................................3.5 2.02 Index of margin of preference in destination mkts (0–100) ...................... 124 .......... n ..........7.7 Mauritius ................................................97.1
Pillar 3: Efficiency and transparency of border administration (1–7) .............. 74 ...........................4.2 Singapore..................................................... 6.3 3.01 Customs services index (0–1) ................................................................... 68 .......... n ........0.56 Singapore...............................................0.97 3.02 Efficiency of the clearance process (1–5) .................................................. 64 .......... n ..........2.7 Norway ....................................................4.2 3.03 No. of days to import ............................................................................... 80 .......... n ...........20 Singapore....................................................4 3.04 No. of documents to import ................................................................... 126 .......... n ...........11 Multiple economies (2) ................................2 3.05 Cost to import (US$ per container) ........................................................... 64 .......... n ......1,250 Singapore................................................440 3.06 No. of days to export................................................................................ 63 .......... n ...........16 Multiple economies (5) ................................6 3.07 No. of documents to export ................................................................... 121 .......... n .............9 Multiple economies (2) ................................2 3.08 Cost to export (US$ per container) ........................................................... 70 .......... n ......1,170 Malaysia ..................................................450 3.09 Irregular payments in exports and imports*............................................. 104 .......... n ..........2.7 New Zealand ............................................6.6 3.10 Time predictability of import procedures* .................................................. 99 .......... n ..........3.4 Finland .....................................................6.0 3.11 Customs transparency index (0–1) ............................................................. 1 .......... n ........1.00 Multiple economies (35) .........................1.00
Pillar 4: Availability and quality of transport infrastructure (1-7) ..................... 34 ...........................4.3 United Arab Emirates ................................... 6.5 4.01 Available int’l airline seat km/week, millions .............................................. 15 .......... n ...1,820.7 United States ..................................11,481.7 4.02 Quality of air transport infrastructure* ........................................................ 56 .......... n ..........4.8 Singapore.................................................6.8 4.03 Quality of railroad infrastructure* ............................................................... 18 .......... n ..........4.8 Japan .......................................................6.7 4.04 Liner Shipping Connectivity Index (0–157.1) ............................................. 26 .......... n ........44.4 China ...................................................157.5 4.05 Quality of port infrastructure* .................................................................... 64 .......... n ..........4.2 Netherlands ..............................................6.8 4.06 Paved roads (% of total) ........................................................................... 69 .......... n ........49.5 Multiple economies (18) .......................100.0 4.07 Quality of roads* ....................................................................................... 76 .......... n ..........3.6 United Arab Emirates ...............................6.6
Pillar 5: Availability and quality of transport services (1–7) ............................ 57 ...........................4.3 Singapore..................................................... 5.7 5.01 Ease and affordability of shipment (1–5).................................................... 44 .......... n ..........3.2 Luxembourg .............................................3.8 5.02 Logistics competence (1–5) ...................................................................... 52 .......... n ..........3.0 Norway ....................................................4.2 5.03 Tracking and tracing ability (1–5) ............................................................... 56 .......... n ..........3.1 Germany ..................................................4.2 5.04 Timeliness of shipments in reaching destination (1–5) ............................... 54 .......... n ..........3.5 Luxembourg .............................................4.7 5.05 Postal services efficiency* ......................................................................... 64 .......... n ..........4.6 Japan .......................................................6.8 5.06 Efficiency of transport mode change* ....................................................... 64 .......... n ..........4.0 Hong Kong SAR ......................................6.4
Pillar 6: Availability and use of ICTs (1–7) ...................................................... 104 ...........................2.9 Sweden ........................................................ 6.5 6.01 Mobile phone subscriptions/100 pop. .................................................... 115 .......... n ........69.9 Hong Kong SAR ..................................229.2 6.02 Individuals using Internet (%) .................................................................. 110 .......... n ........12.6 Iceland ...................................................96.2 6.03 Fixed broadband Internet subscriptions/100 pop. .................................... 95 .......... n ..........1.2 Switzerland ............................................39.9 6.04 Active mobile broadband Internet subscriptions/100 pop. ........................ 95 .......... n ..........5.0 Singapore.............................................124.5 6.05 ICT use for business-to-business transactions* ........................................ 67 .......... n ..........4.8 Finland .....................................................6.2 6.06 Internet use for business-to-consumer transactions* ................................ 70 .......... n ..........4.5 United Kingdom .......................................6.3 6.07 Government Online Service Index (0–1) .................................................... 55 .......... n ........0.54 Multiple economies (3) ...........................1.00
Pillar 7: Operating environment (1–7) .............................................................. 73 ...........................4.1 Hong Kong SAR ............................................ 5.8 7.01 Protection of property index (1–7) ............................................................. 60 .......... n ..........4.0 Finland .....................................................6.3
Property rights* ......................................................................................... 54 .......... n ..........4.4 Finland .....................................................6.4Intellectual property protection* ................................................................ 66 .......... n ..........3.7 Finland .....................................................6.2
7.02 Efficiency and accountability of public institutions index (1–7) ................... 62 .......... n ..........3.7 Singapore.................................................6.0Judicial efficiency & impartiality in commercial disputes (0–4).................... 26 .......... n ..........2.8 Multiple economies (7) .............................4.0Diversion of public funds* ......................................................................... 89 .......... n ..........2.8 New Zealand ............................................6.5Ease of compliance with government regulation* ...................................... 95 .......... n ..........3.1 Singapore.................................................5.4
7.03 Access to finance index (1–7) .................................................................. 37 .......... n ..........4.3 Hong Kong SAR ......................................5.7Affordability of financial services* ............................................................. 37 .......... n ..........4.8 Hong Kong SAR ......................................6.1Availability of financial services* ................................................................ 44 .......... n ..........5.0 Switzerland ..............................................6.4Ease of access to loans* .......................................................................... 36 .......... n ..........3.3 Qatar ........................................................4.9Availability of trade finance* ...................................................................... 44 .......... n ..........4.1 Hong Kong SAR ......................................5.8
7.04 Openness to foreign participation index (1–7) ........................................... 85 .......... n ..........4.2 Ireland ......................................................5.5Ease of hiring foreign labour* .................................................................. 107 .......... n ..........3.6 United Arab Emirates ...............................5.6Business impact of rules on FDI* .............................................................. 63 .......... n ..........4.6 Ireland ......................................................6.7Openness to multilateral trade rules (0–100) ............................................. 69 .......... n ........63.8 Slovenia .................................................92.2
7.05 Index of physical security (1–7) ............................................................... 114 .......... n ..........4.3 Qatar ........................................................6.8Reliability of police services* ..................................................................... 76 .......... n ..........4.0 Finland .....................................................6.7Business costs of crime and violence* ...................................................... 70 .......... n ..........4.7 Qatar ........................................................6.8Business costs of terrorism* ................................................................... 103 .......... n ..........4.7 Slovenia ...................................................6.7Homicide cases/100,000 pop. ................................................................. 72 .......... n ..........3.5 Hong Kong SAR ......................................0.2Index of terrorism incidence (1-7) ........................................................... 132 .......... n ..........1.0 Multiple economies (48) ...........................7.0
© 2014 World Economic Forum
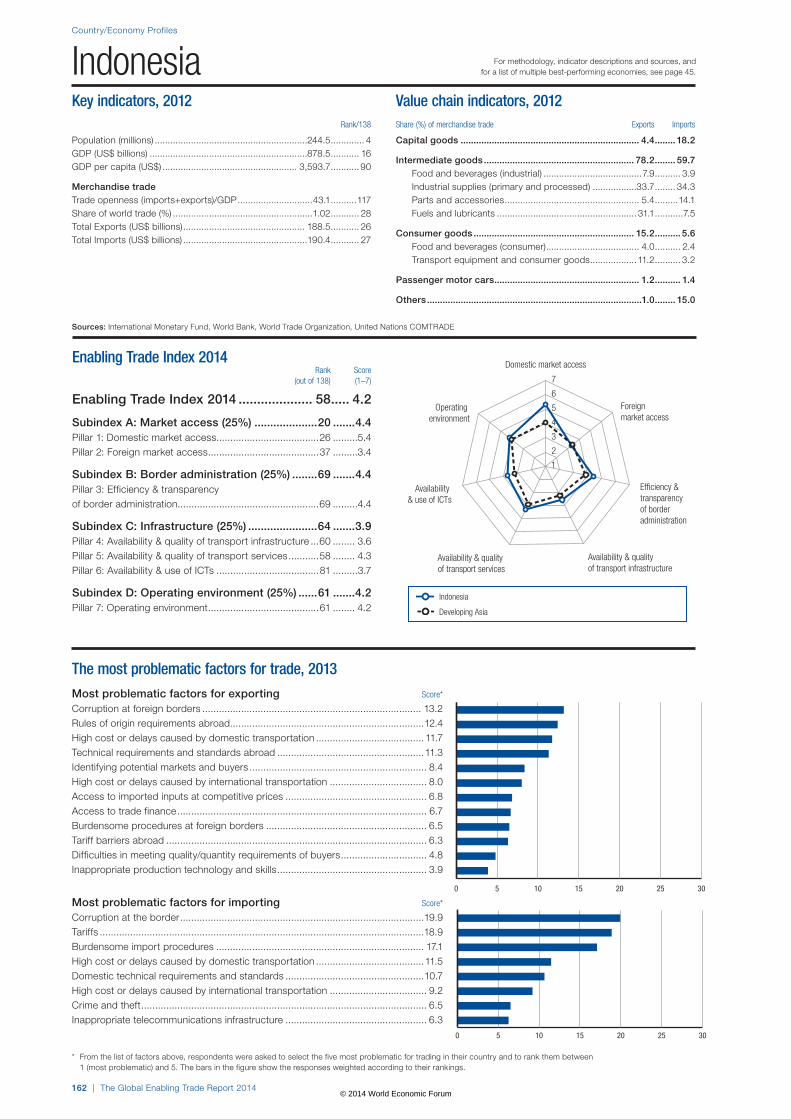
Country/Economy Profiles
162 | The Global Enabling Trade Report 2014
* From the list of factors above, respondents were asked to select the five most problematic for trading in their country and to rank them between 1 (most problematic) and 5. The bars in the figure show the responses weighted according to their rankings.
For methodology, indicator descriptions and sources, and for a list of multiple best-performing economies, see page 45.
0 105 15 20 25 30
0 5 10 15 20 25 30
2
3
4
5
6
7
Operating environment
Availability & use of ICTs
Availability & quality of transport services
Availability & quality of transport infrastructure
Efficiency & transparency of border administration
Foreign market access
Domestic market access
1
Enabling Trade Index 2014 Rank Score (out of 138) (1–7)
Enabling Trade Index 2014 .................... 58 ..... 4.2
Subindex A: Market access (25%) ....................20 .......4.4Pillar 1: Domestic market access .....................................26 .........5.4Pillar 2: Foreign market access ........................................37 .........3.4
Subindex B: Border administration (25%) ........69 .......4.4Pillar 3: Efficiency & transparency of border administration ...................................................69 .........4.4
Subindex C: Infrastructure (25%) ......................64 .......3.9Pillar 4: Availability & quality of transport infrastructure ...60 ........ 3.6Pillar 5: Availability & quality of transport services ...........58 ........ 4.3Pillar 6: Availability & use of ICTs .....................................81 .........3.7
Subindex D: Operating environment (25%) ......61 .......4.2Pillar 7: Operating environment ........................................61 ........ 4.2
Key indicators, 2012 Rank/138
Population (millions) ...........................................................244.5 ............. 4GDP (US$ billions) .............................................................878.5 ........... 16GDP per capita (US$) .................................................... 3,593.7 ........... 90
Merchandise tradeTrade openness (imports+exports)/GDP .............................43.1 ..........117Share of world trade (%) ......................................................1.02 ........... 28Total Exports (US$ billions) ............................................... 188.5 ........... 26Total Imports (US$ billions) ................................................190.4 ........... 27
Value chain indicators, 2012Share (%) of merchandise trade Exports Imports
Capital goods ..................................................................... 4.4 ........ 18.2
Intermediate goods .......................................................... 78.2 ........ 59.7Food and beverages (industrial) ......................................7.9 .......... 3.9Industrial supplies (primary and processed) .................33.7 ........ 34.3Parts and accessories .................................................... 5.4 .........14.1Fuels and lubricants ...................................................... 31.1 ...........7.5
Consumer goods .............................................................. 15.2 .......... 5.6Food and beverages (consumer) .................................... 4.0 .......... 2.4Transport equipment and consumer goods ..................11.2 .......... 3.2
Passenger motor cars ........................................................ 1.2 .......... 1.4
Others ...................................................................................1.0 ........ 15.0
The most problematic factors for trade, 2013Most problematic factors for exporting Score*
Corruption at foreign borders ............................................................................... 13.2Rules of origin requirements abroad ......................................................................12.4High cost or delays caused by domestic transportation ....................................... 11.7Technical requirements and standards abroad .....................................................11.3Identifying potential markets and buyers ................................................................ 8.4High cost or delays caused by international transportation ................................... 8.0Access to imported inputs at competitive prices ................................................... 6.8Access to trade finance .......................................................................................... 6.7Burdensome procedures at foreign borders .......................................................... 6.5Tariff barriers abroad .............................................................................................. 6.3Difficulties in meeting quality/quantity requirements of buyers ............................... 4.8Inappropriate production technology and skills ...................................................... 3.9
Most problematic factors for importing Score*
Corruption at the border ........................................................................................19.9Tariffs .....................................................................................................................18.9Burdensome import procedures ........................................................................... 17.1High cost or delays caused by domestic transportation .......................................11.5Domestic technical requirements and standards ..................................................10.7High cost or delays caused by international transportation ................................... 9.2Crime and theft ....................................................................................................... 6.5Inappropriate telecommunications infrastructure ................................................... 6.3
Indonesia
Sources: International Monetary Fund, World Bank, World Trade Organization, United Nations COMTRADE
Indonesia
Developing Asia
© 2014 World Economic Forum

Country/Economy Profiles
The Global Enabling Trade Report 2014 | 163
* Indicator derived from the World Economic Forum’s Executive Opinion Survey and measured on a 1-to-7 scale, where 7 indicates best outcome.
The Enabling Trade Index 2014 in detail n Competitive Advantage n Competitive Disadvantage
For methodology, indicator descriptions and sources, and for a list of multiple best-performing economies, see page 45. Indonesia
INDICATOR, UNITS RANK/138 VALUE BEST PERFORMER VALUE
Pillar 1: Domestic market access (1–7) ........................................................... 26 ...........................5.4 Multiple economies (2) ................................ 7.0 1.01 Tariff rate (%)............................................................................................. 62 .......... n ..........4.6 Multiple economies (2) .............................0.0 1.02 Complexity of tariffs index (1–7) ................................................................ 61 .......... n ..........6.2 Multiple economies (2) .............................7.0
Tariff dispersion (standard deviation) ......................................................... 94 .......... n ..........9.8 Multiple economies (2) .............................0.0Tariff peaks (% of tariff lines) ..................................................................... 59 .......... n ..........2.2 Multiple economies (24) ...........................0.0Specific tariffs (% of tariff lines) ................................................................. 79 .......... n ..........0.7 Multiple economies (54) ...........................0.0Number of distinct tariffs ........................................................................... 75 .......... n ...........76 Multiple economies (2) ................................1
1.03 Share of duty-free imports (%) .................................................................. 74 .......... n ........61.2 Multiple economies (2) .........................100.0
Pillar 2: Foreign market access (1–7) .............................................................. 37 ...........................3.4 Cambodia ..................................................... 5.3 2.01 Tariffs faced (%) .......................................................................................... 8 .......... n ..........4.4 Chile .........................................................3.5 2.02 Index of margin of preference in destination mkts (0–100) ........................ 87 .......... n ........15.3 Mauritius ................................................97.1
Pillar 3: Efficiency and transparency of border administration (1–7) .............. 69 ...........................4.4 Singapore..................................................... 6.3 3.01 Customs services index (0–1) ................................................................... 24 .......... n ........0.75 Singapore...............................................0.97 3.02 Efficiency of the clearance process (1–5) .................................................. 53 .......... n ..........2.9 Norway ....................................................4.2 3.03 No. of days to import ............................................................................... 90 .......... n ...........23 Singapore....................................................4 3.04 No. of documents to import ..................................................................... 82 .......... n .............8 Multiple economies (2) ................................2 3.05 Cost to import (US$ per container) ............................................................. 9 .......... n .........660 Singapore................................................440 3.06 No. of days to export................................................................................ 71 .......... n ...........17 Multiple economies (5) ................................6 3.07 No. of documents to export ..................................................................... 16 .......... n .............4 Multiple economies (2) ................................2 3.08 Cost to export (US$ per container) ........................................................... 10 .......... n .........615 Malaysia ..................................................450 3.09 Irregular payments in exports and imports*............................................... 86 .......... n ..........3.1 New Zealand ............................................6.6 3.10 Time predictability of import procedures* .................................................. 70 .......... n ..........3.8 Finland .....................................................6.0 3.11 Customs transparency index (0–1) ......................................................... 101 .......... n ........0.53 Multiple economies (35) .........................1.00
Pillar 4: Availability and quality of transport infrastructure (1-7) ..................... 60 ...........................3.6 United Arab Emirates ................................... 6.5 4.01 Available int’l airline seat km/week, millions .............................................. 28 .......... n ......805.3 United States ..................................11,481.7 4.02 Quality of air transport infrastructure* ........................................................ 63 .......... n ..........4.5 Singapore.................................................6.8 4.03 Quality of railroad infrastructure* ............................................................... 42 .......... n ..........3.5 Japan .......................................................6.7 4.04 Liner Shipping Connectivity Index (0–157.1) ............................................. 47 .......... n ........27.4 China ...................................................157.5 4.05 Quality of port infrastructure* .................................................................... 82 .......... n ..........3.9 Netherlands ..............................................6.8 4.06 Paved roads (% of total) ........................................................................... 62 .......... n ........56.9 Multiple economies (18) .......................100.0 4.07 Quality of roads* ....................................................................................... 70 .......... n ..........3.7 United Arab Emirates ...............................6.6
Pillar 5: Availability and quality of transport services (1–7) ............................ 58 ...........................4.3 Singapore..................................................... 5.7 5.01 Ease and affordability of shipment (1–5).................................................... 73 .......... n ..........2.9 Luxembourg .............................................3.8 5.02 Logistics competence (1–5) ...................................................................... 41 .......... n ..........3.2 Norway ....................................................4.2 5.03 Tracking and tracing ability (1–5) ............................................................... 57 .......... n ..........3.1 Germany ..................................................4.2 5.04 Timeliness of shipments in reaching destination (1–5) ............................... 51 .......... n ..........3.5 Luxembourg .............................................4.7 5.05 Postal services efficiency* ......................................................................... 56 .......... n ..........4.9 Japan .......................................................6.8 5.06 Efficiency of transport mode change* ....................................................... 71 .......... n ..........4.0 Hong Kong SAR ......................................6.4
Pillar 6: Availability and use of ICTs (1–7) ........................................................ 81 ...........................3.7 Sweden ........................................................ 6.5 6.01 Mobile phone subscriptions/100 pop. ...................................................... 58 .......... n ......114.2 Hong Kong SAR ..................................229.2 6.02 Individuals using Internet (%) .................................................................. 104 .......... n ........15.4 Iceland ...................................................96.2 6.03 Fixed broadband Internet subscriptions/100 pop. .................................... 96 .......... n ..........1.2 Switzerland ............................................39.9 6.04 Active mobile broadband Internet subscriptions/100 pop. ........................ 52 .......... n ........31.6 Singapore.............................................124.5 6.05 ICT use for business-to-business transactions* ........................................ 61 .......... n ..........4.9 Finland .....................................................6.2 6.06 Internet use for business-to-consumer transactions* ................................ 31 .......... n ..........5.2 United Kingdom .......................................6.3 6.07 Government Online Service Index (0–1) .................................................... 67 .......... n ........0.50 Multiple economies (3) ...........................1.00
Pillar 7: Operating environment (1–7) .............................................................. 61 ...........................4.2 Hong Kong SAR ............................................ 5.8 7.01 Protection of property index (1–7) ............................................................. 63 .......... n ..........4.0 Finland .....................................................6.3
Property rights* ......................................................................................... 73 .......... n ..........4.1 Finland .....................................................6.4Intellectual property protection* ................................................................ 50 .......... n ..........3.9 Finland .....................................................6.2
7.02 Efficiency and accountability of public institutions index (1–7) ................... 63 .......... n ..........3.6 Singapore.................................................6.0Judicial efficiency & impartiality in commercial disputes (0–4).................... 77 .......... n ..........1.8 Multiple economies (7) .............................4.0Diversion of public funds* ......................................................................... 55 .......... n ..........3.4 New Zealand ............................................6.5Ease of compliance with government regulation* ...................................... 28 .......... n ..........3.9 Singapore.................................................5.4
7.03 Access to finance index (1–7) .................................................................. 33 .......... n ..........4.4 Hong Kong SAR ......................................5.7Affordability of financial services* ............................................................. 41 .......... n ..........4.6 Hong Kong SAR ......................................6.1Availability of financial services* ................................................................ 49 .......... n ..........4.9 Switzerland ..............................................6.4Ease of access to loans* .......................................................................... 16 .......... n ..........3.9 Qatar ........................................................4.9Availability of trade finance* ...................................................................... 34 .......... n ..........4.3 Hong Kong SAR ......................................5.8
7.04 Openness to foreign participation index (1–7) ......................................... 105 .......... n ..........3.9 Ireland ......................................................5.5Ease of hiring foreign labour* .................................................................... 33 .......... n ..........4.4 United Arab Emirates ...............................5.6Business impact of rules on FDI* .............................................................. 57 .......... n ..........4.6 Ireland ......................................................6.7Openness to multilateral trade rules (0–100) ........................................... 120 .......... n ........43.3 Slovenia .................................................92.2
7.05 Index of physical security (1–7) ................................................................. 80 .......... n ..........5.2 Qatar ........................................................6.8Reliability of police services* ..................................................................... 73 .......... n ..........4.0 Finland .....................................................6.7Business costs of crime and violence* ...................................................... 81 .......... n ..........4.4 Qatar ........................................................6.8Business costs of terrorism* ................................................................... 109 .......... n ..........4.6 Slovenia ...................................................6.7Homicide cases/100,000 pop. ................................................................... 6 .......... n ..........0.6 Hong Kong SAR ......................................0.2Index of terrorism incidence (1-7) ........................................................... 123 .......... n ..........6.1 Multiple economies (48) ...........................7.0
© 2014 World Economic Forum

Country/Economy Profiles
164 | The Global Enabling Trade Report 2014
* From the list of factors above, respondents were asked to select the five most problematic for trading in their country and to rank them between 1 (most problematic) and 5. The bars in the figure show the responses weighted according to their rankings.
For methodology, indicator descriptions and sources, and for a list of multiple best-performing economies, see page 45.
0 105 15 20 25 30
0 5 10 15 20 25 30
2
3
4
5
6
7
Operating environment
Availability & use of ICTs
Availability & quality of transport services
Availability & quality of transport infrastructure
Efficiency & transparency of border administration
Foreign market access
Domestic market access
1
Enabling Trade Index 2014 Rank Score (out of 138) (1–7)
Enabling Trade Index 2014 ...................131 ..... 3.0
Subindex A: Market access (25%) ..................138 .......1.9Pillar 1: Domestic market access ...................................138 .........2.4Pillar 2: Foreign market access ......................................133 .........1.4
Subindex B: Border administration (25%) ...... 119 .......3.3Pillar 3: Efficiency & transparency of border administration ................................................. 119 ........ 3.3
Subindex C: Infrastructure (25%) ......................92 .......3.4Pillar 4: Availability & quality of transport infrastructure ...65 ........ 3.5Pillar 5: Availability & quality of transport services ...........90 .........3.7Pillar 6: Availability & use of ICTs ...................................103 .........2.9
Subindex D: Operating environment (25%) ....125 .......3.4Pillar 7: Operating environment ...................................... 125 .........3.4
Key indicators, 2012 Rank/138
Population (millions) .............................................................76.1 ........... 17GDP (US$ billions) ............................................................ 548.6 ........... 21GDP per capita (US$) ..................................................... 7,207.2 ........... 66
Merchandise tradeTrade openness (imports+exports)/GDP, 2011 ....................37.4 ......... 127Share of world trade (%) ..................................................... 0.44 ........... 40Total Exports (US$ billions) ................................................104.0 ........... 39Total Imports (US$ billions) .................................................. 57.1 ........... 51
Value chain indicators, 2011Share (%) of merchandise trade Exports Imports
Capital goods ..................................................................... 0.5 ........ 21.1
Intermediate goods .......................................................... 92.2 ........ 63.1Food and beverages (industrial) ..................................... 0.2 .......... 5.7Industrial supplies (primary and processed) .................13.9 ........ 43.1Parts and accessories .................................................... 0.4 ........ 12.9Fuels and lubricants ......................................................77.7 .......... 1.4
Consumer goods ................................................................ 6.2 ........ 13.9Food and beverages (consumer) .................................... 3.9 .......... 6.9Transport equipment and consumer goods ................... 2.3 ...........7.1
Passenger motor cars ........................................................ 0.2 .......... 1.5
Others .................................................................................. 0.9 .......... 0.4
The most problematic factors for trade, 2013Most problematic factors for exporting Score*
Identifying potential markets and buyers ...............................................................19.4Access to trade finance .........................................................................................19.1Inappropriate production technology and skills .....................................................12.2Access to imported inputs at competitive prices ..................................................11.5Difficulties in meeting quality/quantity requirements of buyers ................................9.1Technical requirements and standards abroad .......................................................5.1Tariff barriers abroad .............................................................................................. 4.9High cost or delays caused by international transportation ................................... 4.6Rules of origin requirements abroad ....................................................................... 4.5Burdensome procedures at foreign borders .......................................................... 4.0High cost or delays caused by domestic transportation ........................................ 3.9Corruption at foreign borders ..................................................................................1.7
Most problematic factors for importing Score*
Burdensome import procedures .......................................................................... 26.8Tariffs .................................................................................................................... 26.6Domestic technical requirements and standards ..................................................15.2High cost or delays caused by international transportation ..................................10.3Corruption at the border ..........................................................................................8.1High cost or delays caused by domestic transportation .........................................6.1Crime and theft ....................................................................................................... 3.9Inappropriate telecommunications infrastructure ....................................................3.1
Iran, Islamic Rep.
Sources: International Monetary Fund, World Bank, World Trade Organization, United Nations COMTRADE
Iran, Islamic Rep.
Middle East, North Africa, and Pakistan
© 2014 World Economic Forum

Country/Economy Profiles
The Global Enabling Trade Report 2014 | 165
* Indicator derived from the World Economic Forum’s Executive Opinion Survey and measured on a 1-to-7 scale, where 7 indicates best outcome.
The Enabling Trade Index 2014 in detail n Competitive Advantage n Competitive Disadvantage
For methodology, indicator descriptions and sources, and for a list of multiple best-performing economies, see page 45. Iran, Islamic Rep.
INDICATOR, UNITS RANK/138 VALUE BEST PERFORMER VALUE
Pillar 1: Domestic market access (1–7) ......................................................... 138 ...........................2.4 Multiple economies (2) ................................ 7.0 1.01 Tariff rate (%)........................................................................................... 138 .......... n ........27.1 Multiple economies (2) .............................0.0 1.02 Complexity of tariffs index (1–7) ................................................................ 85 .......... n ..........5.2 Multiple economies (2) .............................7.0
Tariff dispersion (standard deviation) ....................................................... 134 .......... n ........28.4 Multiple economies (2) .............................0.0Tariff peaks (% of tariff lines) ..................................................................... 78 .......... n ..........6.0 Multiple economies (24) ...........................0.0Specific tariffs (% of tariff lines) ................................................................... 1 .......... n ..........0.0 Multiple economies (54) ...........................0.0Number of distinct tariffs ........................................................................... 65 .......... n ...........24 Multiple economies (2) ................................1
1.03 Share of duty-free imports (%) ................................................................ 137 .......... n ..........0.0 Multiple economies (2) .........................100.0
Pillar 2: Foreign market access (1–7) ............................................................ 133 ...........................1.4 Cambodia ..................................................... 5.3 2.01 Tariffs faced (%) ...................................................................................... 121 .......... n ..........5.8 Chile .........................................................3.5 2.02 Index of margin of preference in destination mkts (0–100) ...................... 135 .......... n ..........1.8 Mauritius ................................................97.1
Pillar 3: Efficiency and transparency of border administration (1–7) ............ 119 ...........................3.3 Singapore..................................................... 6.3 3.01 Customs services index (0–1) .................................................................. n/a ........................n/a Singapore...............................................0.97 3.02 Efficiency of the clearance process (1–5) ................................................ 123 .......... n ..........2.2 Norway ....................................................4.2 3.03 No. of days to import ............................................................................. 121 .......... n ...........37 Singapore....................................................4 3.04 No. of documents to import ................................................................... 115 .......... n ...........10 Multiple economies (2) ................................2 3.05 Cost to import (US$ per container) ......................................................... 106 .......... n ......2,100 Singapore................................................440 3.06 No. of days to export.............................................................................. 105 .......... n ...........25 Multiple economies (5) ................................6 3.07 No. of documents to export ..................................................................... 85 .......... n .............7 Multiple economies (2) ................................2 3.08 Cost to export (US$ per container) ........................................................... 96 .......... n ......1,470 Malaysia ..................................................450 3.09 Irregular payments in exports and imports*............................................... 82 .......... n ..........3.3 New Zealand ............................................6.6 3.10 Time predictability of import procedures* ................................................ 122 .......... n ..........3.0 Finland .....................................................6.0 3.11 Customs transparency index (0–1) .......................................................... n/a ........................n/a Multiple economies (35) .........................1.00
Pillar 4: Availability and quality of transport infrastructure (1-7) ..................... 65 ...........................3.5 United Arab Emirates ................................... 6.5 4.01 Available int’l airline seat km/week, millions .............................................. 73 .......... n ......125.2 United States ..................................11,481.7 4.02 Quality of air transport infrastructure* ...................................................... 114 .......... n ..........3.3 Singapore.................................................6.8 4.03 Quality of railroad infrastructure* ............................................................... 44 .......... n ..........3.5 Japan .......................................................6.7 4.04 Liner Shipping Connectivity Index (0–157.1) ............................................. 56 .......... n ........21.3 China ...................................................157.5 4.05 Quality of port infrastructure* .................................................................... 72 .......... n ..........4.1 Netherlands ..............................................6.8 4.06 Paved roads (% of total) ........................................................................... 42 .......... n ........80.6 Multiple economies (18) .......................100.0 4.07 Quality of roads* ....................................................................................... 61 .......... n ..........4.1 United Arab Emirates ...............................6.6
Pillar 5: Availability and quality of transport services (1–7) ............................ 90 ...........................3.7 Singapore..................................................... 5.7 5.01 Ease and affordability of shipment (1–5).................................................. 117 .......... n ..........2.5 Luxembourg .............................................3.8 5.02 Logistics competence (1–5) ...................................................................... 88 .......... n ..........2.7 Norway ....................................................4.2 5.03 Tracking and tracing ability (1–5) ............................................................. 110 .......... n ..........2.5 Germany ..................................................4.2 5.04 Timeliness of shipments in reaching destination (1–5) ............................. 126 .......... n ..........2.7 Luxembourg .............................................4.7 5.05 Postal services efficiency* ......................................................................... 63 .......... n ..........4.6 Japan .......................................................6.8 5.06 Efficiency of transport mode change* ....................................................... 56 .......... n ..........4.2 Hong Kong SAR ......................................6.4
Pillar 6: Availability and use of ICTs (1–7) ...................................................... 103 ...........................2.9 Sweden ........................................................ 6.5 6.01 Mobile phone subscriptions/100 pop. .................................................... 110 .......... n ........76.1 Hong Kong SAR ..................................229.2 6.02 Individuals using Internet (%) .................................................................... 91 .......... n ........26.0 Iceland ...................................................96.2 6.03 Fixed broadband Internet subscriptions/100 pop. .................................... 79 .......... n ..........4.0 Switzerland ............................................39.9 6.04 Active mobile broadband Internet subscriptions/100 pop. ...................... 117 .......... n ..........0.4 Singapore.............................................124.5 6.05 ICT use for business-to-business transactions* ...................................... 130 .......... n ..........3.7 Finland .....................................................6.2 6.06 Internet use for business-to-consumer transactions* .............................. 114 .......... n ..........3.5 United Kingdom .......................................6.3 6.07 Government Online Service Index (0–1) .................................................... 70 .......... n ........0.49 Multiple economies (3) ...........................1.00
Pillar 7: Operating environment (1–7) ............................................................ 125 ...........................3.4 Hong Kong SAR ............................................ 5.8 7.01 Protection of property index (1–7) ............................................................. 86 .......... n ..........3.5 Finland .....................................................6.3
Property rights* ......................................................................................... 61 .......... n ..........4.3 Finland .....................................................6.4Intellectual property protection* .............................................................. 113 .......... n ..........2.8 Finland .....................................................6.2
7.02 Efficiency and accountability of public institutions index (1–7) ................. 124 .......... n ..........2.7 Singapore.................................................6.0Judicial efficiency & impartiality in commercial disputes (0–4).................. 120 .......... n ..........0.8 Multiple economies (7) .............................4.0Diversion of public funds* ......................................................................... 69 .......... n ..........3.2 New Zealand ............................................6.5Ease of compliance with government regulation* .................................... 113 .......... n ..........2.8 Singapore.................................................5.4
7.03 Access to finance index (1–7) ................................................................ 132 .......... n ..........2.6 Hong Kong SAR ......................................5.7Affordability of financial services* ........................................................... 126 .......... n ..........3.1 Hong Kong SAR ......................................6.1Availability of financial services* .............................................................. 128 .......... n ..........3.1 Switzerland ..............................................6.4Ease of access to loans* ........................................................................ 138 .......... n ..........1.5 Qatar ........................................................4.9Availability of trade finance* .................................................................... 126 .......... n ..........2.6 Hong Kong SAR ......................................5.8
7.04 Openness to foreign participation index (1–7) ......................................... 130 .......... n ..........3.0 Ireland ......................................................5.5Ease of hiring foreign labour* .................................................................. 132 .......... n ..........2.8 United Arab Emirates ...............................5.6Business impact of rules on FDI* ............................................................ 126 .......... n ..........3.2 Ireland ......................................................6.7Openness to multilateral trade rules (0–100) ........................................... 117 .......... n ........47.1 Slovenia .................................................92.2
7.05 Index of physical security (1–7) ................................................................. 87 .......... n ..........5.0 Qatar ........................................................6.8Reliability of police services* ..................................................................... 61 .......... n ..........4.3 Finland .....................................................6.7Business costs of crime and violence* ...................................................... 88 .......... n ..........4.2 Qatar ........................................................6.8Business costs of terrorism* ................................................................... 107 .......... n ..........4.6 Slovenia ...................................................6.7Homicide cases/100,000 pop. ................................................................. 64 .......... n ..........3.0 Hong Kong SAR ......................................0.2Index of terrorism incidence (1-7) ........................................................... 128 .......... n ..........4.9 Multiple economies (48) ...........................7.0
© 2014 World Economic Forum
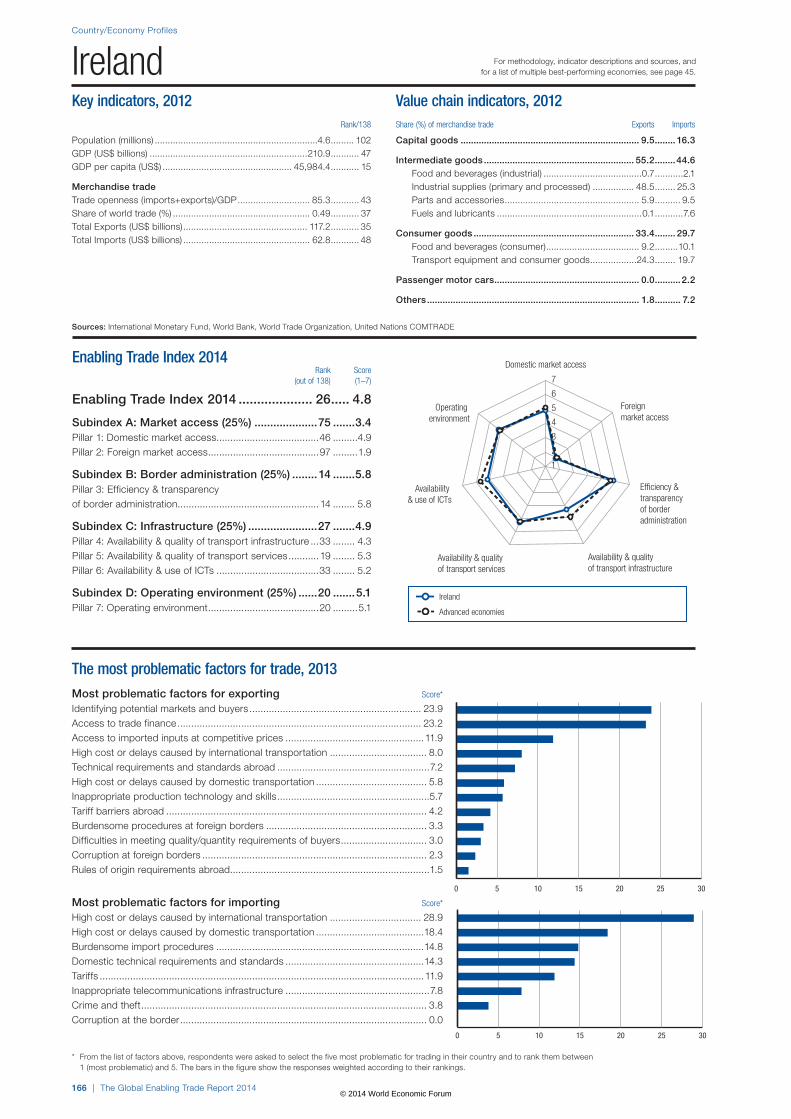
Country/Economy Profiles
166 | The Global Enabling Trade Report 2014
* From the list of factors above, respondents were asked to select the five most problematic for trading in their country and to rank them between 1 (most problematic) and 5. The bars in the figure show the responses weighted according to their rankings.
For methodology, indicator descriptions and sources, and for a list of multiple best-performing economies, see page 45.
0 105 15 20 25 30
0 5 10 15 20 25 30
2
3
4
5
6
7
Operating environment
Availability & use of ICTs
Availability & quality of transport services
Availability & quality of transport infrastructure
Efficiency & transparency of border administration
Foreign market access
Domestic market access
1
Enabling Trade Index 2014 Rank Score (out of 138) (1–7)
Enabling Trade Index 2014 .................... 26 ..... 4.8
Subindex A: Market access (25%) ....................75 .......3.4Pillar 1: Domestic market access .....................................46 .........4.9Pillar 2: Foreign market access ........................................97 .........1.9
Subindex B: Border administration (25%) ........ 14 .......5.8Pillar 3: Efficiency & transparency of border administration ................................................... 14 ........ 5.8
Subindex C: Infrastructure (25%) ......................27 .......4.9Pillar 4: Availability & quality of transport infrastructure ...33 ........ 4.3Pillar 5: Availability & quality of transport services ...........19 ........ 5.3Pillar 6: Availability & use of ICTs .....................................33 ........ 5.2
Subindex D: Operating environment (25%) ......20 .......5.1Pillar 7: Operating environment ........................................20 .........5.1
Key indicators, 2012 Rank/138
Population (millions) ...............................................................4.6 ......... 102GDP (US$ billions) .............................................................210.9 ........... 47GDP per capita (US$) .................................................. 45,984.4 ........... 15
Merchandise tradeTrade openness (imports+exports)/GDP ............................ 85.3 ........... 43Share of world trade (%) ..................................................... 0.49 ........... 37Total Exports (US$ billions) ................................................ 117.2 ........... 35Total Imports (US$ billions) ................................................. 62.8 ........... 48
Value chain indicators, 2012Share (%) of merchandise trade Exports Imports
Capital goods ..................................................................... 9.5 ........ 16.3
Intermediate goods .......................................................... 55.2 ........44.6Food and beverages (industrial) ......................................0.7 ...........2.1Industrial supplies (primary and processed) ................ 48.5 ........ 25.3Parts and accessories .................................................... 5.9 .......... 9.5Fuels and lubricants ........................................................0.1 ...........7.6
Consumer goods .............................................................. 33.4 ........ 29.7Food and beverages (consumer) .................................... 9.2 .........10.1Transport equipment and consumer goods ..................24.3 ........ 19.7
Passenger motor cars ........................................................ 0.0 ..........2.2
Others .................................................................................. 1.8 .......... 7.2
The most problematic factors for trade, 2013Most problematic factors for exporting Score*
Identifying potential markets and buyers .............................................................. 23.9Access to trade finance ........................................................................................ 23.2Access to imported inputs at competitive prices ..................................................11.9High cost or delays caused by international transportation ................................... 8.0Technical requirements and standards abroad .......................................................7.2High cost or delays caused by domestic transportation ........................................ 5.8Inappropriate production technology and skills .......................................................5.7Tariff barriers abroad .............................................................................................. 4.2Burdensome procedures at foreign borders .......................................................... 3.3Difficulties in meeting quality/quantity requirements of buyers ............................... 3.0Corruption at foreign borders ................................................................................. 2.3Rules of origin requirements abroad ........................................................................1.5
Most problematic factors for importing Score*
High cost or delays caused by international transportation ................................. 28.9High cost or delays caused by domestic transportation .......................................18.4Burdensome import procedures ...........................................................................14.8Domestic technical requirements and standards ..................................................14.3Tariffs .....................................................................................................................11.9Inappropriate telecommunications infrastructure ....................................................7.8Crime and theft ....................................................................................................... 3.8Corruption at the border ......................................................................................... 0.0
Ireland
Sources: International Monetary Fund, World Bank, World Trade Organization, United Nations COMTRADE
Ireland
Advanced economies
© 2014 World Economic Forum

Country/Economy Profiles
The Global Enabling Trade Report 2014 | 167
* Indicator derived from the World Economic Forum’s Executive Opinion Survey and measured on a 1-to-7 scale, where 7 indicates best outcome.
The Enabling Trade Index 2014 in detail n Competitive Advantage n Competitive Disadvantage
For methodology, indicator descriptions and sources, and for a list of multiple best-performing economies, see page 45. Ireland
INDICATOR, UNITS RANK/138 VALUE BEST PERFORMER VALUE
Pillar 1: Domestic market access (1–7) ........................................................... 46 ...........................4.9 Multiple economies (2) ................................ 7.0 1.01 Tariff rate (%)............................................................................................... 5 .......... n ..........0.8 Multiple economies (2) .............................0.0 1.02 Complexity of tariffs index (1–7) .............................................................. 110 .......... n ..........3.1 Multiple economies (2) .............................7.0
Tariff dispersion (standard deviation) ......................................................... 55 .......... n ..........8.4 Multiple economies (2) .............................0.0Tariff peaks (% of tariff lines) ................................................................... 104 .......... n ........10.6 Multiple economies (24) ...........................0.0Specific tariffs (% of tariff lines) ............................................................... 107 .......... n ........11.0 Multiple economies (54) ...........................0.0Number of distinct tariffs ......................................................................... 109 .......... n ......1,755 Multiple economies (2) ................................1
1.03 Share of duty-free imports (%) .................................................................. 42 .......... n ........65.4 Multiple economies (2) .........................100.0
Pillar 2: Foreign market access (1–7) .............................................................. 97 ...........................1.9 Cambodia ..................................................... 5.3 2.01 Tariffs faced (%) ........................................................................................ 73 .......... n ..........5.5 Chile .........................................................3.5 2.02 Index of margin of preference in destination mkts (0–100) ........................ 96 .......... n ..........9.1 Mauritius ................................................97.1
Pillar 3: Efficiency and transparency of border administration (1–7) .............. 14 ...........................5.8 Singapore..................................................... 6.3 3.01 Customs services index (0–1) ................................................................... 34 .......... n ........0.70 Singapore...............................................0.97 3.02 Efficiency of the clearance process (1–5) .................................................. 12 .......... n ..........3.8 Norway ....................................................4.2 3.03 No. of days to import ............................................................................... 28 .......... n ...........10 Singapore....................................................4 3.04 No. of documents to import ....................................................................... 1 .......... n .............2 Multiple economies (2) ................................2 3.05 Cost to import (US$ per container) ........................................................... 51 .......... n ......1,121 Singapore................................................440 3.06 No. of days to export.................................................................................. 9 .......... n .............8 Multiple economies (5) ................................6 3.07 No. of documents to export ....................................................................... 1 .......... n .............2 Multiple economies (2) ................................2 3.08 Cost to export (US$ per container) ........................................................... 69 .......... n ......1,160 Malaysia ..................................................450 3.09 Irregular payments in exports and imports*................................................. 9 .......... n ..........6.1 New Zealand ............................................6.6 3.10 Time predictability of import procedures* .................................................. 12 .......... n ..........5.3 Finland .....................................................6.0 3.11 Customs transparency index (0–1) ........................................................... 55 .......... n ........0.88 Multiple economies (35) .........................1.00
Pillar 4: Availability and quality of transport infrastructure (1-7) ..................... 33 ...........................4.3 United Arab Emirates ................................... 6.5 4.01 Available int’l airline seat km/week, millions .............................................. 39 .......... n ......438.3 United States ..................................11,481.7 4.02 Quality of air transport infrastructure* ........................................................ 30 .......... n ..........5.6 Singapore.................................................6.8 4.03 Quality of railroad infrastructure* ............................................................... 33 .......... n ..........4.1 Japan .......................................................6.7 4.04 Liner Shipping Connectivity Index (0–157.1) ............................................. 72 .......... n ........12.7 China ...................................................157.5 4.05 Quality of port infrastructure* .................................................................... 31 .......... n ..........5.2 Netherlands ..............................................6.8 4.06 Paved roads (% of total) ............................................................................. 1 .......... n ......100.0 Multiple economies (18) .......................100.0 4.07 Quality of roads* ....................................................................................... 29 .......... n ..........5.3 United Arab Emirates ...............................6.6
Pillar 5: Availability and quality of transport services (1–7) ............................ 19 ...........................5.3 Singapore..................................................... 5.7 5.01 Ease and affordability of shipment (1–5).................................................... 27 .......... n ..........3.4 Luxembourg .............................................3.8 5.02 Logistics competence (1–5) ........................................................................ 9 .......... n ..........3.9 Norway ....................................................4.2 5.03 Tracking and tracing ability (1–5) ................................................................. 3 .......... n ..........4.1 Germany ..................................................4.2 5.04 Timeliness of shipments in reaching destination (1–5) ............................... 16 .......... n ..........4.1 Luxembourg .............................................4.7 5.05 Postal services efficiency* ......................................................................... 25 .......... n ..........5.9 Japan .......................................................6.8 5.06 Efficiency of transport mode change* ....................................................... 44 .......... n ..........4.5 Hong Kong SAR ......................................6.4
Pillar 6: Availability and use of ICTs (1–7) ........................................................ 33 ...........................5.2 Sweden ........................................................ 6.5 6.01 Mobile phone subscriptions/100 pop. ...................................................... 74 .......... n ......107.2 Hong Kong SAR ..................................229.2 6.02 Individuals using Internet (%) .................................................................... 25 .......... n ........79.0 Iceland ...................................................96.2 6.03 Fixed broadband Internet subscriptions/100 pop. .................................... 31 .......... n ........22.7 Switzerland ............................................39.9 6.04 Active mobile broadband Internet subscriptions/100 pop. ........................ 18 .......... n ........64.3 Singapore.............................................124.5 6.05 ICT use for business-to-business transactions* ........................................ 33 .......... n ..........5.5 Finland .....................................................6.2 6.06 Internet use for business-to-consumer transactions* ................................ 33 .......... n ..........5.1 United Kingdom .......................................6.3 6.07 Government Online Service Index (0–1) .................................................... 55 .......... n ........0.54 Multiple economies (3) ...........................1.00
Pillar 7: Operating environment (1–7) .............................................................. 20 ...........................5.1 Hong Kong SAR ............................................ 5.8 7.01 Protection of property index (1–7) ............................................................. 17 .......... n ..........5.6 Finland .....................................................6.3
Property rights* ......................................................................................... 17 .......... n ..........5.7 Finland .....................................................6.4Intellectual property protection* ................................................................ 18 .......... n ..........5.4 Finland .....................................................6.2
7.02 Efficiency and accountability of public institutions index (1–7) ................... 20 .......... n ..........4.9 Singapore.................................................6.0Judicial efficiency & impartiality in commercial disputes (0–4).................... 26 .......... n ..........2.8 Multiple economies (7) .............................4.0Diversion of public funds* ......................................................................... 14 .......... n ..........5.6 New Zealand ............................................6.5Ease of compliance with government regulation* ...................................... 26 .......... n ..........3.9 Singapore.................................................5.4
7.03 Access to finance index (1–7) .................................................................. 93 .......... n ..........3.4 Hong Kong SAR ......................................5.7Affordability of financial services* ............................................................. 59 .......... n ..........4.2 Hong Kong SAR ......................................6.1Availability of financial services* ................................................................ 64 .......... n ..........4.6 Switzerland ..............................................6.4Ease of access to loans* ........................................................................ 118 .......... n ..........1.9 Qatar ........................................................4.9Availability of trade finance* .................................................................... 110 .......... n ..........3.1 Hong Kong SAR ......................................5.8
7.04 Openness to foreign participation index (1–7) ............................................. 1 .......... n ..........5.5 Ireland ......................................................5.5Ease of hiring foreign labour* ...................................................................... 9 .......... n ..........5.0 United Arab Emirates ...............................5.6Business impact of rules on FDI* ................................................................ 1 .......... n ..........6.7 Ireland ......................................................6.7Openness to multilateral trade rules (0–100) ............................................. 42 .......... n ........72.5 Slovenia .................................................92.2
7.05 Index of physical security (1–7) ................................................................. 16 .......... n ..........6.3 Qatar ........................................................6.8Reliability of police services* ....................................................................... 8 .......... n ..........6.1 Finland .....................................................6.7Business costs of crime and violence* ...................................................... 30 .......... n ..........5.5 Qatar ........................................................6.8Business costs of terrorism* ..................................................................... 33 .......... n ..........6.1 Slovenia ...................................................6.7Homicide cases/100,000 pop. ................................................................. 24 .......... n ..........0.9 Hong Kong SAR ......................................0.2Index of terrorism incidence (1-7) ........................................................... 105 .......... n ..........6.8 Multiple economies (48) ...........................7.0
© 2014 World Economic Forum

Country/Economy Profiles
168 | The Global Enabling Trade Report 2014
* From the list of factors above, respondents were asked to select the five most problematic for trading in their country and to rank them between 1 (most problematic) and 5. The bars in the figure show the responses weighted according to their rankings.
For methodology, indicator descriptions and sources, and for a list of multiple best-performing economies, see page 45.
0 105 15 20 25 30
0 5 10 15 20 25 30
2
3
4
5
6
7
Operating environment
Availability & use of ICTs
Availability & quality of transport services
Availability & quality of transport infrastructure
Efficiency & transparency of border administration
Foreign market access
Domestic market access
1
Enabling Trade Index 2014 Rank Score (out of 138) (1–7)
Enabling Trade Index 2014 .................... 32 ......4.7
Subindex A: Market access (25%) ....................49 .......3.9Pillar 1: Domestic market access .....................................29 ........ 5.3Pillar 2: Foreign market access ........................................73 .........2.4
Subindex B: Border administration (25%) ........29 .......5.4Pillar 3: Efficiency & transparency of border administration ...................................................29 .........5.4
Subindex C: Infrastructure (25%) ......................33 .......4.8Pillar 4: Availability & quality of transport infrastructure ...40 .........4.0Pillar 5: Availability & quality of transport services ...........33 ........ 4.8Pillar 6: Availability & use of ICTs .....................................24 .........5.6
Subindex D: Operating environment (25%) ......40 .......4.5Pillar 7: Operating environment ........................................40 ........ 4.5
Key indicators, 2012 Rank/138
Population (millions) ...............................................................7.7 ........... 85GDP (US$ billions) .............................................................257.5 ........... 40GDP per capita (US$) ...................................................33,432.7 ........... 25
Merchandise tradeTrade openness (imports+exports)/GDP, 2011 ....................59.1 ........... 81Share of world trade (%) ..................................................... 0.37 ........... 48Total Exports (US$ billions) ..................................................63.1 ........... 51Total Imports (US$ billions) ..................................................75.4 ........... 41
Value chain indicators, 2012Share (%) of merchandise trade Exports Imports
Capital goods ................................................................... 13.9 ........ 15.2
Intermediate goods .......................................................... 66.2 ........59.9Food and beverages (industrial) ..................................... 0.2 .......... 2.3Industrial supplies (primary and processed) ................ 50.2 ........ 31.9Parts and accessories ...................................................15.8 ........ 10.2Fuels and lubricants ....................................................... 0.0 ........ 15.5
Consumer goods ...............................................................17.5 ........ 14.3Food and beverages (consumer) .....................................2.9 .......... 3.5Transport equipment and consumer goods ..................14.6 ........ 10.8
Passenger motor cars ........................................................ 0.0 .......... 4.0
Others .................................................................................. 2.3 .......... 6.6
The most problematic factors for trade, 2013Most problematic factors for exporting Score*
Identifying potential markets and buyers ...............................................................13.5Access to imported inputs at competitive prices ..................................................13.4High cost or delays caused by domestic transportation .......................................13.0Tariff barriers abroad .............................................................................................10.4Access to trade finance ...........................................................................................9.7Technical requirements and standards abroad .......................................................9.1Rules of origin requirements abroad ........................................................................7.5High cost or delays caused by international transportation ................................... 6.8Burdensome procedures at foreign borders .......................................................... 5.3Difficulties in meeting quality/quantity requirements of buyers ................................5.1Inappropriate production technology and skills ...................................................... 3.7Corruption at foreign borders ................................................................................. 2.4
Most problematic factors for importing Score*
Burdensome import procedures ...........................................................................24.3Tariffs .....................................................................................................................21.8Domestic technical requirements and standards ..................................................18.0High cost or delays caused by international transportation ................................. 16.8High cost or delays caused by domestic transportation .......................................11.8Corruption at the border ......................................................................................... 3.9Inappropriate telecommunications infrastructure ....................................................1.7Crime and theft ........................................................................................................1.7
Israel
Sources: International Monetary Fund, World Bank, World Trade Organization, United Nations COMTRADE
Israel
Advanced economies
© 2014 World Economic Forum

Country/Economy Profiles
The Global Enabling Trade Report 2014 | 169
* Indicator derived from the World Economic Forum’s Executive Opinion Survey and measured on a 1-to-7 scale, where 7 indicates best outcome.
The Enabling Trade Index 2014 in detail n Competitive Advantage n Competitive Disadvantage
For methodology, indicator descriptions and sources, and for a list of multiple best-performing economies, see page 45. Israel
INDICATOR, UNITS RANK/138 VALUE BEST PERFORMER VALUE
Pillar 1: Domestic market access (1–7) ........................................................... 29 ...........................5.3 Multiple economies (2) ................................ 7.0 1.01 Tariff rate (%)............................................................................................. 52 .......... n ..........4.1 Multiple economies (2) .............................0.0 1.02 Complexity of tariffs index (1–7) ................................................................ 96 .......... n ..........4.8 Multiple economies (2) .............................7.0
Tariff dispersion (standard deviation) ....................................................... 117 .......... n ........13.4 Multiple economies (2) .............................0.0Tariff peaks (% of tariff lines) ..................................................................... 74 .......... n ..........5.2 Multiple economies (24) ...........................0.0Specific tariffs (% of tariff lines) ............................................................... 103 .......... n ..........6.7 Multiple economies (54) ...........................0.0Number of distinct tariffs ......................................................................... 101 .......... n .........618 Multiple economies (2) ................................1
1.03 Share of duty-free imports (%) .................................................................. 19 .......... n ........80.8 Multiple economies (2) .........................100.0
Pillar 2: Foreign market access (1–7) .............................................................. 73 ...........................2.4 Cambodia ..................................................... 5.3 2.01 Tariffs faced (%) ........................................................................................ 66 .......... n ..........5.4 Chile .........................................................3.5 2.02 Index of margin of preference in destination mkts (0–100) ........................ 70 .......... n ........24.8 Mauritius ................................................97.1
Pillar 3: Efficiency and transparency of border administration (1–7) .............. 29 ...........................5.4 Singapore..................................................... 6.3 3.01 Customs services index (0–1) ................................................................... 17 .......... n ........0.81 Singapore...............................................0.97 3.02 Efficiency of the clearance process (1–5) .................................................. 43 .......... n ..........3.1 Norway ....................................................4.2 3.03 No. of days to import ............................................................................... 28 .......... n ...........10 Singapore....................................................4 3.04 No. of documents to import ..................................................................... 11 .......... n .............4 Multiple economies (2) ................................2 3.05 Cost to import (US$ per container) ............................................................. 3 .......... n .........565 Singapore................................................440 3.06 No. of days to export................................................................................ 24 .......... n ...........10 Multiple economies (5) ................................6 3.07 No. of documents to export ..................................................................... 16 .......... n .............4 Multiple economies (2) ................................2 3.08 Cost to export (US$ per container) ........................................................... 12 .......... n .........620 Malaysia ..................................................450 3.09 Irregular payments in exports and imports*............................................... 25 .......... n ..........5.3 New Zealand ............................................6.6 3.10 Time predictability of import procedures* .................................................. 64 .......... n ..........3.9 Finland .....................................................6.0 3.11 Customs transparency index (0–1) ........................................................... 56 .......... n ........0.83 Multiple economies (35) .........................1.00
Pillar 4: Availability and quality of transport infrastructure (1-7) ..................... 40 ...........................4.0 United Arab Emirates ................................... 6.5 4.01 Available int’l airline seat km/week, millions .............................................. 35 .......... n ......497.5 United States ..................................11,481.7 4.02 Quality of air transport infrastructure* ........................................................ 49 .......... n ..........5.0 Singapore.................................................6.8 4.03 Quality of railroad infrastructure* ............................................................... 49 .......... n ..........3.2 Japan .......................................................6.7 4.04 Liner Shipping Connectivity Index (0–157.1) ............................................. 43 .......... n ........32.4 China ...................................................157.5 4.05 Quality of port infrastructure* .................................................................... 83 .......... n ..........3.8 Netherlands ..............................................6.8 4.06 Paved roads (% of total) ............................................................................. 1 .......... n ......100.0 Multiple economies (18) .......................100.0 4.07 Quality of roads* ....................................................................................... 36 .......... n ..........5.0 United Arab Emirates ...............................6.6
Pillar 5: Availability and quality of transport services (1–7) ............................ 33 ...........................4.8 Singapore..................................................... 5.7 5.01 Ease and affordability of shipment (1–5).................................................... 93 .......... n ..........2.7 Luxembourg .............................................3.8 5.02 Logistics competence (1–5) ...................................................................... 36 .......... n ..........3.4 Norway ....................................................4.2 5.03 Tracking and tracing ability (1–5) ............................................................... 46 .......... n ..........3.2 Germany ..................................................4.2 5.04 Timeliness of shipments in reaching destination (1–5) ............................... 12 .......... n ..........4.2 Luxembourg .............................................4.7 5.05 Postal services efficiency* ......................................................................... 30 .......... n ..........5.7 Japan .......................................................6.8 5.06 Efficiency of transport mode change* ....................................................... 38 .......... n ..........4.7 Hong Kong SAR ......................................6.4
Pillar 6: Availability and use of ICTs (1–7) ........................................................ 24 ...........................5.6 Sweden ........................................................ 6.5 6.01 Mobile phone subscriptions/100 pop. ...................................................... 45 .......... n ......120.7 Hong Kong SAR ..................................229.2 6.02 Individuals using Internet (%) .................................................................... 31 .......... n ........73.4 Iceland ...................................................96.2 6.03 Fixed broadband Internet subscriptions/100 pop. .................................... 22 .......... n ........25.3 Switzerland ............................................39.9 6.04 Active mobile broadband Internet subscriptions/100 pop. ........................ 26 .......... n ........53.0 Singapore.............................................124.5 6.05 ICT use for business-to-business transactions* ........................................ 39 .......... n ..........5.3 Finland .....................................................6.2 6.06 Internet use for business-to-consumer transactions* ................................ 23 .......... n ..........5.4 United Kingdom .......................................6.3 6.07 Government Online Service Index (0–1) .................................................... 15 .......... n ........0.85 Multiple economies (3) ...........................1.00
Pillar 7: Operating environment (1–7) .............................................................. 40 ...........................4.5 Hong Kong SAR ............................................ 5.8 7.01 Protection of property index (1–7) ............................................................. 34 .......... n ..........4.8 Finland .....................................................6.3
Property rights* ......................................................................................... 38 .......... n ..........5.0 Finland .....................................................6.4Intellectual property protection* ................................................................ 33 .......... n ..........4.6 Finland .....................................................6.2
7.02 Efficiency and accountability of public institutions index (1–7) ................... 24 .......... n ..........4.7 Singapore.................................................6.0Judicial efficiency & impartiality in commercial disputes (0–4)...................... 8 .......... n ..........3.8 Multiple economies (7) .............................4.0Diversion of public funds* ......................................................................... 31 .......... n ..........4.5 New Zealand ............................................6.5Ease of compliance with government regulation* .................................... 100 .......... n ..........3.0 Singapore.................................................5.4
7.03 Access to finance index (1–7) .................................................................. 50 .......... n ..........4.0 Hong Kong SAR ......................................5.7Affordability of financial services* ............................................................. 70 .......... n ..........4.1 Hong Kong SAR ......................................6.1Availability of financial services* ................................................................ 41 .......... n ..........5.0 Switzerland ..............................................6.4Ease of access to loans* .......................................................................... 63 .......... n ..........2.9 Qatar ........................................................4.9Availability of trade finance* ...................................................................... 47 .......... n ..........4.0 Hong Kong SAR ......................................5.8
7.04 Openness to foreign participation index (1–7) ......................................... 102 .......... n ..........4.0 Ireland ......................................................5.5Ease of hiring foreign labour* .................................................................. 134 .......... n ..........2.8 United Arab Emirates ...............................5.6Business impact of rules on FDI* .............................................................. 26 .......... n ..........5.1 Ireland ......................................................6.7Openness to multilateral trade rules (0–100) ............................................. 82 .......... n ........60.3 Slovenia .................................................92.2
7.05 Index of physical security (1–7) ................................................................. 82 .......... n ..........5.2 Qatar ........................................................6.8Reliability of police services* ..................................................................... 53 .......... n ..........4.5 Finland .....................................................6.7Business costs of crime and violence* ...................................................... 49 .......... n ..........5.1 Qatar ........................................................6.8Business costs of terrorism* ................................................................... 126 .......... n ..........3.9 Slovenia ...................................................6.7Homicide cases/100,000 pop. ................................................................. 51 .......... n ..........2.0 Hong Kong SAR ......................................0.2Index of terrorism incidence (1-7) ........................................................... 126 .......... n ..........5.5 Multiple economies (48) ...........................7.0
© 2014 World Economic Forum

Country/Economy Profiles
170 | The Global Enabling Trade Report 2014
* From the list of factors above, respondents were asked to select the five most problematic for trading in their country and to rank them between 1 (most problematic) and 5. The bars in the figure show the responses weighted according to their rankings.
For methodology, indicator descriptions and sources, and for a list of multiple best-performing economies, see page 45.
0 105 15 20 25 30
0 5 10 15 20 25 30
2
3
4
5
6
7
Operating environment
Availability & use of ICTs
Availability & quality of transport services
Availability & quality of transport infrastructure
Efficiency & transparency of border administration
Foreign market access
Domestic market access
1
Enabling Trade Index 2014 Rank Score (out of 138) (1–7)
Enabling Trade Index 2014 .....................47 ..... 4.3
Subindex A: Market access (25%) ....................75 .......3.4Pillar 1: Domestic market access .....................................46 .........4.9Pillar 2: Foreign market access ........................................97 .........1.9
Subindex B: Border administration (25%) ........47 .......4.9Pillar 3: Efficiency & transparency of border administration ...................................................47 .........4.9
Subindex C: Infrastructure (25%) ......................32 .......4.8Pillar 4: Availability & quality of transport infrastructure ...22 ........ 4.8Pillar 5: Availability & quality of transport services ...........34 ........ 4.8Pillar 6: Availability & use of ICTs .....................................45 .........4.9
Subindex D: Operating environment (25%) ......65 .......4.2Pillar 7: Operating environment ........................................65 ........ 4.2
Key indicators, 2012 Rank/138
Population (millions) ............................................................ 60.8 ........... 23GDP (US$ billions) .......................................................... 2,014.1 ............. 9GDP per capita (US$) ................................................... 33,115.0 ........... 26
Merchandise tradeTrade openness (imports+exports)/GDP ............................ 49.0 ......... 103Share of world trade (%) ......................................................2.67 ........... 10Total Exports (US$ billions) ............................................... 500.7 ............. 9Total Imports (US$ billions) ............................................... 486.6 ............11
Value chain indicators, 2012Share (%) of merchandise trade Exports Imports
Capital goods ....................................................................17.6 .......... 9.7
Intermediate goods .......................................................... 46.8 ........63.3Food and beverages (industrial) ..................................... 0.4 .......... 1.9Industrial supplies (primary and processed) .................30.1 ........ 31.3Parts and accessories ...................................................15.9 .......... 9.7Fuels and lubricants ....................................................... 0.4 ........ 20.4
Consumer goods .............................................................. 29.4 ........20.4Food and beverages (consumer) .....................................7.3 .......... 6.2Transport equipment and consumer goods ..................22.1 ........ 14.2
Passenger motor cars .........................................................1.9 ..........4.2
Others .................................................................................. 4.3 ..........2.4
The most problematic factors for trade, 2013Most problematic factors for exporting Score*
Access to trade finance .........................................................................................18.9Identifying potential markets and buyers ...............................................................15.5Access to imported inputs at competitive prices ..................................................13.9Inappropriate production technology and skills .......................................................9.1High cost or delays caused by domestic transportation .........................................9.1Technical requirements and standards abroad ...................................................... 6.5Burdensome procedures at foreign borders .......................................................... 5.8Tariff barriers abroad ...............................................................................................5.1Corruption at foreign borders ..................................................................................5.1Difficulties in meeting quality/quantity requirements of buyers ................................4.1Rules of origin requirements abroad ....................................................................... 3.7High cost or delays caused by international transportation ....................................3.1
Most problematic factors for importing Score*
Burdensome import procedures ...........................................................................19.5Tariffs .................................................................................................................... 16.8High cost or delays caused by domestic transportation .......................................15.9Domestic technical requirements and standards ..................................................15.2Inappropriate telecommunications infrastructure ..................................................11.4High cost or delays caused by international transportation ..................................10.1Crime and theft ....................................................................................................... 8.4Corruption at the border ..........................................................................................2.7
Italy
Sources: International Monetary Fund, World Bank, World Trade Organization, United Nations COMTRADE
Italy
Advanced economies
© 2014 World Economic Forum
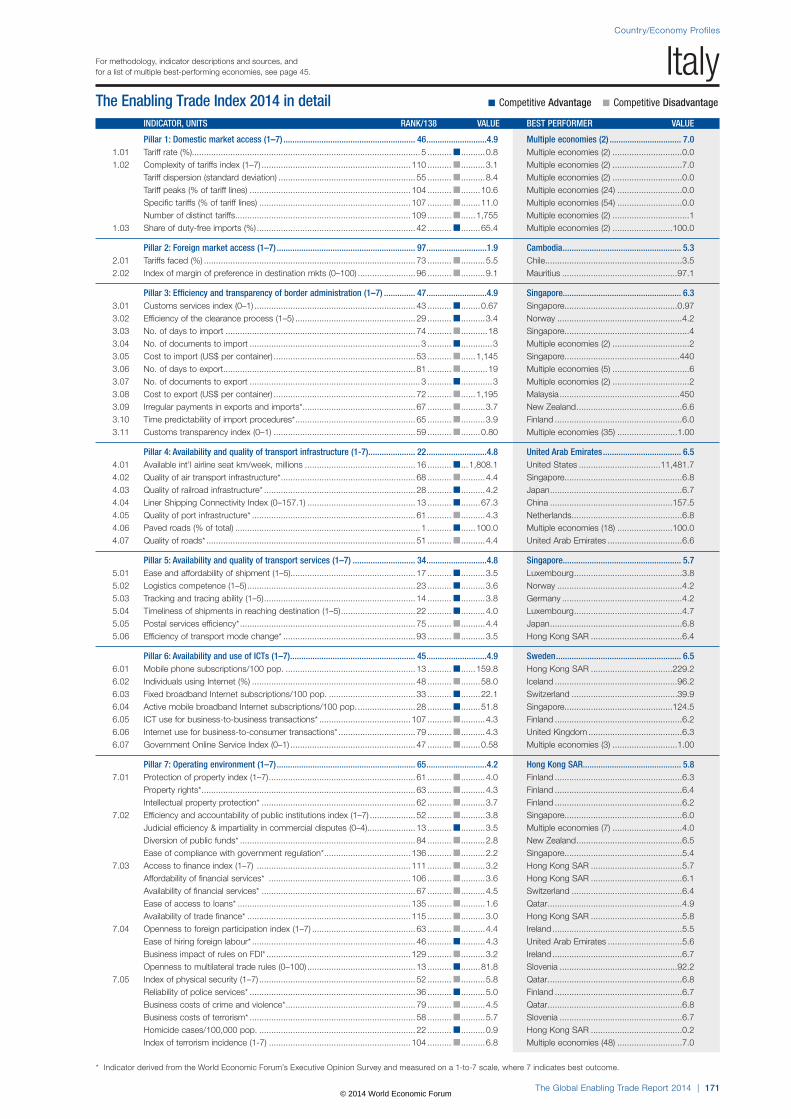
Country/Economy Profiles
The Global Enabling Trade Report 2014 | 171
* Indicator derived from the World Economic Forum’s Executive Opinion Survey and measured on a 1-to-7 scale, where 7 indicates best outcome.
The Enabling Trade Index 2014 in detail n Competitive Advantage n Competitive Disadvantage
For methodology, indicator descriptions and sources, and for a list of multiple best-performing economies, see page 45. Italy
INDICATOR, UNITS RANK/138 VALUE BEST PERFORMER VALUE
Pillar 1: Domestic market access (1–7) ........................................................... 46 ...........................4.9 Multiple economies (2) ................................ 7.0 1.01 Tariff rate (%)............................................................................................... 5 .......... n ..........0.8 Multiple economies (2) .............................0.0 1.02 Complexity of tariffs index (1–7) .............................................................. 110 .......... n ..........3.1 Multiple economies (2) .............................7.0
Tariff dispersion (standard deviation) ......................................................... 55 .......... n ..........8.4 Multiple economies (2) .............................0.0Tariff peaks (% of tariff lines) ................................................................... 104 .......... n ........10.6 Multiple economies (24) ...........................0.0Specific tariffs (% of tariff lines) ............................................................... 107 .......... n ........11.0 Multiple economies (54) ...........................0.0Number of distinct tariffs ......................................................................... 109 .......... n ......1,755 Multiple economies (2) ................................1
1.03 Share of duty-free imports (%) .................................................................. 42 .......... n ........65.4 Multiple economies (2) .........................100.0
Pillar 2: Foreign market access (1–7) .............................................................. 97 ...........................1.9 Cambodia ..................................................... 5.3 2.01 Tariffs faced (%) ........................................................................................ 73 .......... n ..........5.5 Chile .........................................................3.5 2.02 Index of margin of preference in destination mkts (0–100) ........................ 96 .......... n ..........9.1 Mauritius ................................................97.1
Pillar 3: Efficiency and transparency of border administration (1–7) .............. 47 ...........................4.9 Singapore..................................................... 6.3 3.01 Customs services index (0–1) ................................................................... 43 .......... n ........0.67 Singapore...............................................0.97 3.02 Efficiency of the clearance process (1–5) .................................................. 29 .......... n ..........3.4 Norway ....................................................4.2 3.03 No. of days to import ............................................................................... 74 .......... n ...........18 Singapore....................................................4 3.04 No. of documents to import ....................................................................... 3 .......... n .............3 Multiple economies (2) ................................2 3.05 Cost to import (US$ per container) ........................................................... 53 .......... n ......1,145 Singapore................................................440 3.06 No. of days to export................................................................................ 81 .......... n ...........19 Multiple economies (5) ................................6 3.07 No. of documents to export ....................................................................... 3 .......... n .............3 Multiple economies (2) ................................2 3.08 Cost to export (US$ per container) ........................................................... 72 .......... n ......1,195 Malaysia ..................................................450 3.09 Irregular payments in exports and imports*............................................... 67 .......... n ..........3.7 New Zealand ............................................6.6 3.10 Time predictability of import procedures* .................................................. 65 .......... n ..........3.9 Finland .....................................................6.0 3.11 Customs transparency index (0–1) ........................................................... 59 .......... n ........0.80 Multiple economies (35) .........................1.00
Pillar 4: Availability and quality of transport infrastructure (1-7) ..................... 22 ...........................4.8 United Arab Emirates ................................... 6.5 4.01 Available int’l airline seat km/week, millions .............................................. 16 .......... n ...1,808.1 United States ..................................11,481.7 4.02 Quality of air transport infrastructure* ........................................................ 68 .......... n ..........4.4 Singapore.................................................6.8 4.03 Quality of railroad infrastructure* ............................................................... 28 .......... n ..........4.2 Japan .......................................................6.7 4.04 Liner Shipping Connectivity Index (0–157.1) ............................................. 13 .......... n ........67.3 China ...................................................157.5 4.05 Quality of port infrastructure* .................................................................... 61 .......... n ..........4.3 Netherlands ..............................................6.8 4.06 Paved roads (% of total) ............................................................................. 1 .......... n ......100.0 Multiple economies (18) .......................100.0 4.07 Quality of roads* ....................................................................................... 51 .......... n ..........4.4 United Arab Emirates ...............................6.6
Pillar 5: Availability and quality of transport services (1–7) ............................ 34 ...........................4.8 Singapore..................................................... 5.7 5.01 Ease and affordability of shipment (1–5).................................................... 17 .......... n ..........3.5 Luxembourg .............................................3.8 5.02 Logistics competence (1–5) ...................................................................... 23 .......... n ..........3.6 Norway ....................................................4.2 5.03 Tracking and tracing ability (1–5) ............................................................... 14 .......... n ..........3.8 Germany ..................................................4.2 5.04 Timeliness of shipments in reaching destination (1–5) ............................... 22 .......... n ..........4.0 Luxembourg .............................................4.7 5.05 Postal services efficiency* ......................................................................... 75 .......... n ..........4.4 Japan .......................................................6.8 5.06 Efficiency of transport mode change* ....................................................... 93 .......... n ..........3.5 Hong Kong SAR ......................................6.4
Pillar 6: Availability and use of ICTs (1–7) ........................................................ 45 ...........................4.9 Sweden ........................................................ 6.5 6.01 Mobile phone subscriptions/100 pop. ...................................................... 13 .......... n ......159.8 Hong Kong SAR ..................................229.2 6.02 Individuals using Internet (%) .................................................................... 48 .......... n ........58.0 Iceland ...................................................96.2 6.03 Fixed broadband Internet subscriptions/100 pop. .................................... 33 .......... n ........22.1 Switzerland ............................................39.9 6.04 Active mobile broadband Internet subscriptions/100 pop. ........................ 28 .......... n ........51.8 Singapore.............................................124.5 6.05 ICT use for business-to-business transactions* ...................................... 107 .......... n ..........4.3 Finland .....................................................6.2 6.06 Internet use for business-to-consumer transactions* ................................ 79 .......... n ..........4.3 United Kingdom .......................................6.3 6.07 Government Online Service Index (0–1) .................................................... 47 .......... n ........0.58 Multiple economies (3) ...........................1.00
Pillar 7: Operating environment (1–7) .............................................................. 65 ...........................4.2 Hong Kong SAR ............................................ 5.8 7.01 Protection of property index (1–7) ............................................................. 61 .......... n ..........4.0 Finland .....................................................6.3
Property rights* ......................................................................................... 63 .......... n ..........4.3 Finland .....................................................6.4Intellectual property protection* ................................................................ 62 .......... n ..........3.7 Finland .....................................................6.2
7.02 Efficiency and accountability of public institutions index (1–7) ................... 52 .......... n ..........3.8 Singapore.................................................6.0Judicial efficiency & impartiality in commercial disputes (0–4).................... 13 .......... n ..........3.5 Multiple economies (7) .............................4.0Diversion of public funds* ......................................................................... 84 .......... n ..........2.8 New Zealand ............................................6.5Ease of compliance with government regulation* .................................... 136 .......... n ..........2.2 Singapore.................................................5.4
7.03 Access to finance index (1–7) ................................................................ 111 .......... n ..........3.2 Hong Kong SAR ......................................5.7Affordability of financial services* ........................................................... 106 .......... n ..........3.6 Hong Kong SAR ......................................6.1Availability of financial services* ................................................................ 67 .......... n ..........4.5 Switzerland ..............................................6.4Ease of access to loans* ........................................................................ 135 .......... n ..........1.6 Qatar ........................................................4.9Availability of trade finance* .................................................................... 115 .......... n ..........3.0 Hong Kong SAR ......................................5.8
7.04 Openness to foreign participation index (1–7) ........................................... 63 .......... n ..........4.4 Ireland ......................................................5.5Ease of hiring foreign labour* .................................................................... 46 .......... n ..........4.3 United Arab Emirates ...............................5.6Business impact of rules on FDI* ............................................................ 129 .......... n ..........3.2 Ireland ......................................................6.7Openness to multilateral trade rules (0–100) ............................................. 13 .......... n ........81.8 Slovenia .................................................92.2
7.05 Index of physical security (1–7) ................................................................. 52 .......... n ..........5.8 Qatar ........................................................6.8Reliability of police services* ..................................................................... 36 .......... n ..........5.0 Finland .....................................................6.7Business costs of crime and violence* ...................................................... 79 .......... n ..........4.5 Qatar ........................................................6.8Business costs of terrorism* ..................................................................... 58 .......... n ..........5.7 Slovenia ...................................................6.7Homicide cases/100,000 pop. ................................................................. 22 .......... n ..........0.9 Hong Kong SAR ......................................0.2Index of terrorism incidence (1-7) ........................................................... 104 .......... n ..........6.8 Multiple economies (48) ...........................7.0
© 2014 World Economic Forum

Country/Economy Profiles
172 | The Global Enabling Trade Report 2014
* From the list of factors above, respondents were asked to select the five most problematic for trading in their country and to rank them between 1 (most problematic) and 5. The bars in the figure show the responses weighted according to their rankings.
For methodology, indicator descriptions and sources, and for a list of multiple best-performing economies, see page 45.
0 105 15 20 25 30
0 5 10 15 20 25 30
2
3
4
5
6
7
Operating environment
Availability & use of ICTs
Availability & quality of transport services
Availability & quality of transport infrastructure
Efficiency & transparency of border administration
Foreign market access
Domestic market access
1
Enabling Trade Index 2014 Rank Score (out of 138) (1–7)
Enabling Trade Index 2014 .................... 80 ..... 3.9
Subindex A: Market access (25%) ....................58 .......3.8Pillar 1: Domestic market access .....................................93 .........4.4Pillar 2: Foreign market access ........................................45 ........ 3.2
Subindex B: Border administration (25%) ........76 .......4.2Pillar 3: Efficiency & transparency of border administration ...................................................76 ........ 4.2
Subindex C: Infrastructure (25%) ......................75 .......3.7Pillar 4: Availability & quality of transport infrastructure ...46 ........ 3.9Pillar 5: Availability & quality of transport services ...........81 ........ 3.9Pillar 6: Availability & use of ICTs .....................................91 .........3.4
Subindex D: Operating environment (25%) ......92 .......3.8Pillar 7: Operating environment ........................................92 ........ 3.8
Key indicators, 2012 Rank/138
Population (millions) .............................................................. 2.8 ..........119GDP (US$ billions) ...............................................................14.8 ......... 104GDP per capita (US$) .................................................... 5,358.3 ........... 78
Merchandise tradeTrade openness (imports+exports)/GDP ............................ 55.9 ........... 90Share of world trade (%) ..................................................... 0.02 ..........113Total Exports (US$ billions) ....................................................1.7 ......... 123Total Imports (US$ billions) ................................................... 6.6 ......... 106
Value chain indicators, 2012Share (%) of merchandise trade Exports Imports
Capital goods ..................................................................... 0.0 .......... 6.6
Intermediate goods .......................................................... 63.9 ........46.6Food and beverages (industrial) ..................................... 8.6 .......... 3.6Industrial supplies (primary and processed) ................ 53.8 ........ 23.0Parts and accessories .....................................................0.1 .......... 4.2Fuels and lubricants ........................................................1.4 ........ 15.8
Consumer goods .............................................................. 13.9 ........22.2Food and beverages (consumer) ...................................13.1 .........11.0Transport equipment and consumer goods ................... 0.8 .........11.2
Passenger motor cars ........................................................ 0.0 ..........3.5
Others ................................................................................ 22.2 ........ 21.1
The most problematic factors for trade, 2013Most problematic factors for exporting Score*
Access to imported inputs at competitive prices ..................................................16.6Access to trade finance .........................................................................................15.5Identifying potential markets and buyers ...............................................................14.3Difficulties in meeting quality/quantity requirements of buyers ..............................10.1Inappropriate production technology and skills ...................................................... 8.8Burdensome procedures at foreign borders ...........................................................7.3High cost or delays caused by domestic transportation ......................................... 7.1Technical requirements and standards abroad ...................................................... 6.0Tariff barriers abroad .............................................................................................. 5.8Rules of origin requirements abroad ....................................................................... 4.3High cost or delays caused by international transportation ................................... 3.0Corruption at foreign borders ..................................................................................1.5
Most problematic factors for importing Score*
Tariffs ..................................................................................................................... 27.1Burdensome import procedures .......................................................................... 25.3Corruption at the border ........................................................................................12.2Domestic technical requirements and standards ..................................................11.3Crime and theft ....................................................................................................... 8.8High cost or delays caused by international transportation ................................... 8.2High cost or delays caused by domestic transportation .........................................4.7Inappropriate telecommunications infrastructure ................................................... 2.4
Jamaica
Sources: International Monetary Fund, World Bank, World Trade Organization, United Nations COMTRADE
Jamaica
Central America and Caribbean
© 2014 World Economic Forum

Country/Economy Profiles
The Global Enabling Trade Report 2014 | 173
* Indicator derived from the World Economic Forum’s Executive Opinion Survey and measured on a 1-to-7 scale, where 7 indicates best outcome.
The Enabling Trade Index 2014 in detail n Competitive Advantage n Competitive Disadvantage
For methodology, indicator descriptions and sources, and for a list of multiple best-performing economies, see page 45. Jamaica
INDICATOR, UNITS RANK/138 VALUE BEST PERFORMER VALUE
Pillar 1: Domestic market access (1–7) ........................................................... 93 ...........................4.4 Multiple economies (2) ................................ 7.0 1.01 Tariff rate (%)............................................................................................. 92 .......... n ..........8.6 Multiple economies (2) .............................0.0 1.02 Complexity of tariffs index (1–7) ................................................................ 81 .......... n ..........5.4 Multiple economies (2) .............................7.0
Tariff dispersion (standard deviation) ....................................................... 109 .......... n ........11.9 Multiple economies (2) .............................0.0Tariff peaks (% of tariff lines) ................................................................... 131 .......... n ........11.0 Multiple economies (24) ...........................0.0Specific tariffs (% of tariff lines) ................................................................... 1 .......... n ..........0.0 Multiple economies (54) ...........................0.0Number of distinct tariffs ........................................................................... 38 .......... n ...........11 Multiple economies (2) ................................1
1.03 Share of duty-free imports (%) .................................................................. 86 .......... n ........52.1 Multiple economies (2) .........................100.0
Pillar 2: Foreign market access (1–7) .............................................................. 45 ...........................3.2 Cambodia ..................................................... 5.3 2.01 Tariffs faced (%) ...................................................................................... 118 .......... n ..........5.7 Chile .........................................................3.5 2.02 Index of margin of preference in destination mkts (0–100) ........................ 11 .......... n ........62.0 Mauritius ................................................97.1
Pillar 3: Efficiency and transparency of border administration (1–7) .............. 76 ...........................4.2 Singapore..................................................... 6.3 3.01 Customs services index (0–1) ................................................................... 64 .......... n ........0.58 Singapore...............................................0.97 3.02 Efficiency of the clearance process (1–5) .................................................. 52 .......... n ..........2.9 Norway ....................................................4.2 3.03 No. of days to import ............................................................................... 64 .......... n ...........17 Singapore....................................................4 3.04 No. of documents to import ..................................................................... 57 .......... n .............7 Multiple economies (2) ................................2 3.05 Cost to import (US$ per container) ......................................................... 107 .......... n ......2,130 Singapore................................................440 3.06 No. of days to export................................................................................ 85 .......... n ...........20 Multiple economies (5) ................................6 3.07 No. of documents to export ..................................................................... 65 .......... n .............6 Multiple economies (2) ................................2 3.08 Cost to export (US$ per container) ........................................................... 99 .......... n ......1,530 Malaysia ..................................................450 3.09 Irregular payments in exports and imports*............................................... 93 .......... n ..........3.0 New Zealand ............................................6.6 3.10 Time predictability of import procedures* .................................................. 71 .......... n ..........3.8 Finland .....................................................6.0 3.11 Customs transparency index (0–1) ........................................................... 83 .......... n ........0.70 Multiple economies (35) .........................1.00
Pillar 4: Availability and quality of transport infrastructure (1-7) ..................... 46 ...........................3.9 United Arab Emirates ................................... 6.5 4.01 Available int’l airline seat km/week, millions .............................................. 71 .......... n ......138.6 United States ..................................11,481.7 4.02 Quality of air transport infrastructure* ........................................................ 43 .......... n ..........5.2 Singapore.................................................6.8 4.03 Quality of railroad infrastructure* .............................................................. n/a ........................n/a Japan .......................................................6.7 4.04 Liner Shipping Connectivity Index (0–157.1) ............................................. 51 .......... n ........25.3 China ...................................................157.5 4.05 Quality of port infrastructure* .................................................................... 37 .......... n ..........5.1 Netherlands ..............................................6.8 4.06 Paved roads (% of total) ........................................................................... 49 .......... n ........73.3 Multiple economies (18) .......................100.0 4.07 Quality of roads* ....................................................................................... 78 .......... n ..........3.6 United Arab Emirates ...............................6.6
Pillar 5: Availability and quality of transport services (1–7) ............................ 81 ...........................3.9 Singapore..................................................... 5.7 5.01 Ease and affordability of shipment (1–5).................................................... 86 .......... n ..........2.8 Luxembourg .............................................3.8 5.02 Logistics competence (1–5) ...................................................................... 82 .......... n ..........2.7 Norway ....................................................4.2 5.03 Tracking and tracing ability (1–5) ............................................................... 87 .......... n ..........2.7 Germany ..................................................4.2 5.04 Timeliness of shipments in reaching destination (1–5) ............................... 85 .......... n ..........3.1 Luxembourg .............................................4.7 5.05 Postal services efficiency* ......................................................................... 87 .......... n ..........4.0 Japan .......................................................6.8 5.06 Efficiency of transport mode change* ....................................................... 60 .......... n ..........4.1 Hong Kong SAR ......................................6.4
Pillar 6: Availability and use of ICTs (1–7) ........................................................ 91 ...........................3.4 Sweden ........................................................ 6.5 6.01 Mobile phone subscriptions/100 pop. ...................................................... 91 .......... n ........96.3 Hong Kong SAR ..................................229.2 6.02 Individuals using Internet (%) .................................................................... 65 .......... n ........46.5 Iceland ...................................................96.2 6.03 Fixed broadband Internet subscriptions/100 pop. .................................... 78 .......... n ..........4.3 Switzerland ............................................39.9 6.04 Active mobile broadband Internet subscriptions/100 pop. ...................... 110 .......... n ..........1.6 Singapore.............................................124.5 6.05 ICT use for business-to-business transactions* ........................................ 72 .......... n ..........4.8 Finland .....................................................6.2 6.06 Internet use for business-to-consumer transactions* ................................ 93 .......... n ..........4.0 United Kingdom .......................................6.3 6.07 Government Online Service Index (0–1) .................................................. 111 .......... n ........0.31 Multiple economies (3) ...........................1.00
Pillar 7: Operating environment (1–7) .............................................................. 92 ...........................3.8 Hong Kong SAR ............................................ 5.8 7.01 Protection of property index (1–7) ............................................................. 68 .......... n ..........3.9 Finland .....................................................6.3
Property rights* ......................................................................................... 60 .......... n ..........4.3 Finland .....................................................6.4Intellectual property protection* ................................................................ 78 .......... n ..........3.5 Finland .....................................................6.2
7.02 Efficiency and accountability of public institutions index (1–7) ................... 74 .......... n ..........3.5 Singapore.................................................6.0Judicial efficiency & impartiality in commercial disputes (0–4).................... 44 .......... n ..........2.5 Multiple economies (7) .............................4.0Diversion of public funds* ......................................................................... 80 .......... n ..........3.0 New Zealand ............................................6.5Ease of compliance with government regulation* .................................... 116 .......... n ..........2.8 Singapore.................................................5.4
7.03 Access to finance index (1–7) .................................................................. 80 .......... n ..........3.6 Hong Kong SAR ......................................5.7Affordability of financial services* ............................................................. 71 .......... n ..........4.1 Hong Kong SAR ......................................6.1Availability of financial services* ................................................................ 52 .......... n ..........4.8 Switzerland ..............................................6.4Ease of access to loans* ........................................................................ 119 .......... n ..........1.9 Qatar ........................................................4.9Availability of trade finance* ...................................................................... 89 .......... n ..........3.5 Hong Kong SAR ......................................5.8
7.04 Openness to foreign participation index (1–7) ......................................... 104 .......... n ..........4.0 Ireland ......................................................5.5Ease of hiring foreign labour* .................................................................... 94 .......... n ..........3.8 United Arab Emirates ...............................5.6Business impact of rules on FDI* .............................................................. 78 .......... n ..........4.4 Ireland ......................................................6.7Openness to multilateral trade rules (0–100) ........................................... 102 .......... n ........54.8 Slovenia .................................................92.2
7.05 Index of physical security (1–7) ............................................................... 125 .......... n ..........4.0 Qatar ........................................................6.8Reliability of police services* ..................................................................... 96 .......... n ..........3.7 Finland .....................................................6.7Business costs of crime and violence* .................................................... 135 .......... n ..........2.3 Qatar ........................................................6.8Business costs of terrorism* ..................................................................... 40 .......... n ..........6.0 Slovenia ...................................................6.7Homicide cases/100,000 pop. ............................................................... 134 .......... n ........41.2 Hong Kong SAR ......................................0.2Index of terrorism incidence (1-7) ............................................................... 1 .......... n ..........7.0 Multiple economies (48) ...........................7.0
© 2014 World Economic Forum

Country/Economy Profiles
174 | The Global Enabling Trade Report 2014
* From the list of factors above, respondents were asked to select the five most problematic for trading in their country and to rank them between 1 (most problematic) and 5. The bars in the figure show the responses weighted according to their rankings.
For methodology, indicator descriptions and sources, and for a list of multiple best-performing economies, see page 45.
0 105 15 20 25 30
0 5 10 15 20 25 30
2
3
4
5
6
7
Operating environment
Availability & use of ICTs
Availability & quality of transport services
Availability & quality of transport infrastructure
Efficiency & transparency of border administration
Foreign market access
Domestic market access
1
Enabling Trade Index 2014 Rank Score (out of 138) (1–7)
Enabling Trade Index 2014 .....................13 ......5.1
Subindex A: Market access (25%) .................. 111 .......3.2Pillar 1: Domestic market access .....................................28 ........ 5.3Pillar 2: Foreign market access ......................................138 ......... 1.1
Subindex B: Border administration (25%) ..........5 .......6.0Pillar 3: Efficiency & transparency of border administration .....................................................5 ........ 6.0
Subindex C: Infrastructure (25%) ........................5 .......5.9Pillar 4: Availability & quality of transport infrastructure .....7 ........ 6.0Pillar 5: Availability & quality of transport services .............4 .........5.7Pillar 6: Availability & use of ICTs .....................................10 ........ 6.0
Subindex D: Operating environment (25%) ......22 .......5.1Pillar 7: Operating environment ........................................22 .........5.1
Key indicators, 2012 Rank/138
Population (millions) ........................................................... 127.6 ........... 10GDP (US$ billions) ......................................................... 5,960.3 ............. 3GDP per capita (US$) ...................................................46,706.7 ........... 12
Merchandise tradeTrade openness (imports+exports)/GDP ............................ 28.3 ......... 136Share of world trade (%) ..................................................... 4.55 ............. 4Total Exports (US$ billions) ............................................... 798.6 ............. 4Total Imports (US$ billions) ............................................... 885.8 ............. 4
Value chain indicators, 2012Share (%) of merchandise trade Exports Imports
Capital goods ................................................................... 24.7 ........ 11.0
Intermediate goods .......................................................... 56.8 ........64.4Food and beverages (industrial) ..................................... 0.0 .......... 1.5Industrial supplies (primary and processed) .................27.4 ........ 22.4Parts and accessories .................................................. 29.2 .......... 9.4Fuels and lubricants ....................................................... 0.2 ........ 31.0
Consumer goods ................................................................ 4.3 ........ 19.9Food and beverages (consumer) .................................... 0.5 .......... 5.8Transport equipment and consumer goods ................... 3.8 .........14.1
Passenger motor cars ...................................................... 12.8 .......... 1.2
Others ...................................................................................1.5 ..........3.5
The most problematic factors for trade, 2013Most problematic factors for exporting Score*
Tariff barriers abroad .............................................................................................19.1Identifying potential markets and buyers .............................................................. 13.2Technical requirements and standards abroad .....................................................12.8Access to imported inputs at competitive prices ..................................................12.5Burdensome procedures at foreign borders .........................................................10.1Rules of origin requirements abroad ....................................................................... 9.6High cost or delays caused by international transportation ....................................7.3High cost or delays caused by domestic transportation ........................................ 4.2Difficulties in meeting quality/quantity requirements of buyers ............................... 3.9Corruption at foreign borders ................................................................................. 3.9Inappropriate production technology and skills ...................................................... 2.6Access to trade finance .......................................................................................... 0.8
Most problematic factors for importing Score*
Tariffs .................................................................................................................... 26.5Burdensome import procedures .......................................................................... 22.4Domestic technical requirements and standards ..................................................19.7High cost or delays caused by international transportation ..................................15.8High cost or delays caused by domestic transportation .......................................12.9Inappropriate telecommunications infrastructure ................................................... 2.0Crime and theft ....................................................................................................... 0.5Corruption at the border ......................................................................................... 0.2
Japan
Sources: International Monetary Fund, World Bank, World Trade Organization, United Nations COMTRADE
Japan
Advanced economies
© 2014 World Economic Forum

Country/Economy Profiles
The Global Enabling Trade Report 2014 | 175
* Indicator derived from the World Economic Forum’s Executive Opinion Survey and measured on a 1-to-7 scale, where 7 indicates best outcome.
The Enabling Trade Index 2014 in detail n Competitive Advantage n Competitive Disadvantage
For methodology, indicator descriptions and sources, and for a list of multiple best-performing economies, see page 45. Japan
INDICATOR, UNITS RANK/138 VALUE BEST PERFORMER VALUE
Pillar 1: Domestic market access (1–7) ........................................................... 28 ...........................5.3 Multiple economies (2) ................................ 7.0 1.01 Tariff rate (%)............................................................................................. 36 .......... n ..........2.2 Multiple economies (2) .............................0.0 1.02 Complexity of tariffs index (1–7) .............................................................. 103 .......... n ..........4.2 Multiple economies (2) .............................7.0
Tariff dispersion (standard deviation) ....................................................... 115 .......... n ........12.9 Multiple economies (2) .............................0.0Tariff peaks (% of tariff lines) ................................................................... 100 .......... n ........10.1 Multiple economies (24) ...........................0.0Specific tariffs (% of tariff lines) ............................................................... 100 .......... n ..........6.3 Multiple economies (54) ...........................0.0Number of distinct tariffs ......................................................................... 104 .......... n .........769 Multiple economies (2) ................................1
1.03 Share of duty-free imports (%) .................................................................. 26 .......... n ........77.8 Multiple economies (2) .........................100.0
Pillar 2: Foreign market access (1–7) ............................................................ 138 ...........................1.1 Cambodia ..................................................... 5.3 2.01 Tariffs faced (%) ...................................................................................... 133 .......... n ..........6.0 Chile .........................................................3.5 2.02 Index of margin of preference in destination mkts (0–100) ...................... 138 .......... n ..........0.4 Mauritius ................................................97.1
Pillar 3: Efficiency and transparency of border administration (1–7) ................ 5 ...........................6.0 Singapore..................................................... 6.3 3.01 Customs services index (0–1) ..................................................................... 2 .......... n ........0.93 Singapore...............................................0.97 3.02 Efficiency of the clearance process (1–5) .................................................. 14 .......... n ..........3.8 Norway ....................................................4.2 3.03 No. of days to import ............................................................................... 36 .......... n ...........11 Singapore....................................................4 3.04 No. of documents to import ..................................................................... 27 .......... n .............5 Multiple economies (2) ................................2 3.05 Cost to import (US$ per container) ........................................................... 37 .......... n .........970 Singapore................................................440 3.06 No. of days to export................................................................................ 35 .......... n ...........11 Multiple economies (5) ................................6 3.07 No. of documents to export ....................................................................... 3 .......... n .............3 Multiple economies (2) ................................2 3.08 Cost to export (US$ per container) ........................................................... 40 .......... n .........890 Malaysia ..................................................450 3.09 Irregular payments in exports and imports*............................................... 10 .......... n ..........6.0 New Zealand ............................................6.6 3.10 Time predictability of import procedures* .................................................... 7 .......... n ..........5.4 Finland .....................................................6.0 3.11 Customs transparency index (0–1) ............................................................. 1 .......... n ........1.00 Multiple economies (35) .........................1.00
Pillar 4: Availability and quality of transport infrastructure (1-7) ....................... 7 ...........................6.0 United Arab Emirates ................................... 6.5 4.01 Available int’l airline seat km/week, millions ................................................ 7 .......... n ...3,319.1 United States ..................................11,481.7 4.02 Quality of air transport infrastructure* ........................................................ 35 .......... n ..........5.4 Singapore.................................................6.8 4.03 Quality of railroad infrastructure* ................................................................. 1 .......... n ..........6.7 Japan .......................................................6.7 4.04 Liner Shipping Connectivity Index (0–157.1) ............................................. 15 .......... n ........65.7 China ...................................................157.5 4.05 Quality of port infrastructure* .................................................................... 28 .......... n ..........5.2 Netherlands ..............................................6.8 4.06 Paved roads (% of total) ........................................................................... 43 .......... n ........80.4 Multiple economies (18) .......................100.0 4.07 Quality of roads* ....................................................................................... 12 .......... n ..........6.0 United Arab Emirates ...............................6.6
Pillar 5: Availability and quality of transport services (1–7) .............................. 4 ...........................5.7 Singapore..................................................... 5.7 5.01 Ease and affordability of shipment (1–5).................................................... 19 .......... n ..........3.5 Luxembourg .............................................3.8 5.02 Logistics competence (1–5) ...................................................................... 11 .......... n ..........3.9 Norway ....................................................4.2 5.03 Tracking and tracing ability (1–5) ................................................................. 9 .......... n ..........4.0 Germany ..................................................4.2 5.04 Timeliness of shipments in reaching destination (1–5) ............................... 10 .......... n ..........4.2 Luxembourg .............................................4.7 5.05 Postal services efficiency* ........................................................................... 1 .......... n ..........6.8 Japan .......................................................6.8 5.06 Efficiency of transport mode change* ......................................................... 7 .......... n ..........6.0 Hong Kong SAR ......................................6.4
Pillar 6: Availability and use of ICTs (1–7) ........................................................ 10 ...........................6.0 Sweden ........................................................ 6.5 6.01 Mobile phone subscriptions/100 pop. ...................................................... 65 .......... n ......110.9 Hong Kong SAR ..................................229.2 6.02 Individuals using Internet (%) .................................................................... 24 .......... n ........79.1 Iceland ...................................................96.2 6.03 Fixed broadband Internet subscriptions/100 pop. .................................... 19 .......... n ........27.7 Switzerland ............................................39.9 6.04 Active mobile broadband Internet subscriptions/100 pop. .......................... 2 .......... n ......115.1 Singapore.............................................124.5 6.05 ICT use for business-to-business transactions* .......................................... 7 .......... n ..........6.0 Finland .....................................................6.2 6.06 Internet use for business-to-consumer transactions* .................................. 6 .......... n ..........6.0 United Kingdom .......................................6.3 6.07 Government Online Service Index (0–1) ...................................................... 9 .......... n ........0.86 Multiple economies (3) ...........................1.00
Pillar 7: Operating environment (1–7) .............................................................. 22 ...........................5.1 Hong Kong SAR ............................................ 5.8 7.01 Protection of property index (1–7) ............................................................. 11 .......... n ..........5.8 Finland .....................................................6.3
Property rights* ......................................................................................... 15 .......... n ..........5.8 Finland .....................................................6.4Intellectual property protection* ................................................................ 10 .......... n ..........5.7 Finland .....................................................6.2
7.02 Efficiency and accountability of public institutions index (1–7) ................... 26 .......... n ..........4.6 Singapore.................................................6.0Judicial efficiency & impartiality in commercial disputes (0–4).................... 26 .......... n ..........2.8 Multiple economies (7) .............................4.0Diversion of public funds* ......................................................................... 17 .......... n ..........5.4 New Zealand ............................................6.5Ease of compliance with government regulation* ...................................... 75 .......... n ..........3.4 Singapore.................................................5.4
7.03 Access to finance index (1–7) .................................................................. 22 .......... n ..........4.8 Hong Kong SAR ......................................5.7Affordability of financial services* ............................................................. 24 .......... n ..........5.2 Hong Kong SAR ......................................6.1Availability of financial services* ................................................................ 30 .......... n ..........5.3 Switzerland ..............................................6.4Ease of access to loans* .......................................................................... 31 .......... n ..........3.4 Qatar ........................................................4.9Availability of trade finance* ........................................................................ 7 .......... n ..........5.3 Hong Kong SAR ......................................5.8
7.04 Openness to foreign participation index (1–7) ........................................... 66 .......... n ..........4.3 Ireland ......................................................5.5Ease of hiring foreign labour* .................................................................. 109 .......... n ..........3.6 United Arab Emirates ...............................5.6Business impact of rules on FDI* .............................................................. 46 .......... n ..........4.8 Ireland ......................................................6.7Openness to multilateral trade rules (0–100) ............................................. 57 .......... n ........67.9 Slovenia .................................................92.2
7.05 Index of physical security (1–7) ................................................................. 33 .......... n ..........6.0 Qatar ........................................................6.8Reliability of police services* ..................................................................... 23 .......... n ..........5.8 Finland .....................................................6.7Business costs of crime and violence* ...................................................... 42 .......... n ..........5.2 Qatar ........................................................6.8Business costs of terrorism* ..................................................................... 82 .......... n ..........5.2 Slovenia ...................................................6.7Homicide cases/100,000 pop. ................................................................... 3 .......... n ..........0.3 Hong Kong SAR ......................................0.2Index of terrorism incidence (1-7) ............................................................... 1 .......... n ..........7.0 Multiple economies (48) ...........................7.0
© 2014 World Economic Forum

Country/Economy Profiles
176 | The Global Enabling Trade Report 2014
* From the list of factors above, respondents were asked to select the five most problematic for trading in their country and to rank them between 1 (most problematic) and 5. The bars in the figure show the responses weighted according to their rankings.
For methodology, indicator descriptions and sources, and for a list of multiple best-performing economies, see page 45.
0 105 15 20 25 30
0 5 10 15 20 25 30
2
3
4
5
6
7
Operating environment
Availability & use of ICTs
Availability & quality of transport services
Availability & quality of transport infrastructure
Efficiency & transparency of border administration
Foreign market access
Domestic market access
1
Enabling Trade Index 2014 Rank Score (out of 138) (1–7)
Enabling Trade Index 2014 .................... 40 ..... 4.4
Subindex A: Market access (25%) ....................43 .......4.0Pillar 1: Domestic market access .....................................96 ........ 4.3Pillar 2: Foreign market access ........................................24 ........ 3.6
Subindex B: Border administration (25%) ........39 .......5.1Pillar 3: Efficiency & transparency of border administration ...................................................39 .........5.1
Subindex C: Infrastructure (25%) ......................59 .......3.9Pillar 4: Availability & quality of transport infrastructure ...54 .........3.7Pillar 5: Availability & quality of transport services ...........62 ........ 4.2Pillar 6: Availability & use of ICTs .....................................67 .........4.0
Subindex D: Operating environment (25%) ......35 .......4.6Pillar 7: Operating environment ........................................35 .........4.6
Key indicators, 2012 Rank/138
Population (millions) .............................................................. 6.4 ........... 92GDP (US$ billions) ...............................................................31.2 ........... 86GDP per capita (US$) .....................................................4,878.8 ........... 80
Merchandise tradeTrade openness (imports+exports)/GDP .............................91.5 ........... 33Share of world trade (%) ..................................................... 0.08 ........... 80Total Exports (US$ billions) ....................................................7.9 ........... 92Total Imports (US$ billions) ..................................................20.7 ........... 74
Value chain indicators, 2012Share (%) of merchandise trade Exports Imports
Capital goods ..................................................................... 2.9 ..........8.2
Intermediate goods ...........................................................51.5 ........52.6Food and beverages (industrial) ......................................2.4 .......... 5.2Industrial supplies (primary and processed) ................ 48.4 ........ 26.1Parts and accessories .................................................... 0.5 .......... 5.2Fuels and lubricants ....................................................... 0.2 .........16.1
Consumer goods .............................................................. 45.5 ........ 19.2Food and beverages (consumer) ...................................14.9 .......... 9.8Transport equipment and consumer goods ..................30.7 .......... 9.5
Passenger motor cars ........................................................ 0.0 ..........3.2
Others ...................................................................................0.1 ........ 16.8
The most problematic factors for trade, 2013Most problematic factors for exporting Score*
Identifying potential markets and buyers ...............................................................15.0Access to imported inputs at competitive prices ..................................................11.9Access to trade finance .........................................................................................11.2Difficulties in meeting quality/quantity requirements of buyers ............................. 10.2Technical requirements and standards abroad ...................................................... 9.5Inappropriate production technology and skills ...................................................... 8.9High cost or delays caused by domestic transportation ........................................ 8.6Rules of origin requirements abroad ........................................................................ 7.1High cost or delays caused by international transportation ................................... 6.9Tariff barriers abroad .............................................................................................. 6.4Burdensome procedures at foreign borders .......................................................... 4.2
Most problematic factors for importing Score*
Tariffs .....................................................................................................................24.9Burdensome import procedures ...........................................................................21.8High cost or delays caused by international transportation ................................. 16.3Domestic technical requirements and standards ..................................................12.9High cost or delays caused by domestic transportation .......................................10.1Corruption at the border ......................................................................................... 9.5Inappropriate telecommunications infrastructure ................................................... 2.5Crime and theft ....................................................................................................... 2.0
Jordan
Sources: International Monetary Fund, World Bank, World Trade Organization, United Nations COMTRADE
Jordan
Middle East, North Africa, and Pakistan
© 2014 World Economic Forum

Country/Economy Profiles
The Global Enabling Trade Report 2014 | 177
* Indicator derived from the World Economic Forum’s Executive Opinion Survey and measured on a 1-to-7 scale, where 7 indicates best outcome.
The Enabling Trade Index 2014 in detail n Competitive Advantage n Competitive Disadvantage
For methodology, indicator descriptions and sources, and for a list of multiple best-performing economies, see page 45. Jordan
INDICATOR, UNITS RANK/138 VALUE BEST PERFORMER VALUE
Pillar 1: Domestic market access (1–7) ........................................................... 96 ...........................4.3 Multiple economies (2) ................................ 7.0 1.01 Tariff rate (%)........................................................................................... 104 .......... n ........10.5 Multiple economies (2) .............................0.0 1.02 Complexity of tariffs index (1–7) ................................................................ 56 .......... n ..........6.3 Multiple economies (2) .............................7.0
Tariff dispersion (standard deviation) ....................................................... 120 .......... n ........14.5 Multiple economies (2) .............................0.0Tariff peaks (% of tariff lines) ..................................................................... 38 .......... n ..........0.5 Multiple economies (24) ...........................0.0Specific tariffs (% of tariff lines) ................................................................. 58 .......... n ..........0.1 Multiple economies (54) ...........................0.0Number of distinct tariffs ........................................................................... 68 .......... n ...........30 Multiple economies (2) ................................1
1.03 Share of duty-free imports (%) .................................................................. 88 .......... n ........48.3 Multiple economies (2) .........................100.0
Pillar 2: Foreign market access (1–7) .............................................................. 24 ...........................3.6 Cambodia ..................................................... 5.3 2.01 Tariffs faced (%) ........................................................................................ 26 .......... n ..........5.0 Chile .........................................................3.5 2.02 Index of margin of preference in destination mkts (0–100) ........................ 31 .......... n ........49.0 Mauritius ................................................97.1
Pillar 3: Efficiency and transparency of border administration (1–7) .............. 39 ...........................5.1 Singapore..................................................... 6.3 3.01 Customs services index (0–1) ................................................................... 62 .......... n ........0.62 Singapore...............................................0.97 3.02 Efficiency of the clearance process (1–5) .................................................. 78 .......... n ..........2.6 Norway ....................................................4.2 3.03 No. of days to import ............................................................................... 54 .......... n ...........15 Singapore....................................................4 3.04 No. of documents to import ..................................................................... 57 .......... n .............7 Multiple economies (2) ................................2 3.05 Cost to import (US$ per container) ........................................................... 61 .......... n ......1,235 Singapore................................................440 3.06 No. of days to export................................................................................ 48 .......... n ...........13 Multiple economies (5) ................................6 3.07 No. of documents to export ..................................................................... 40 .......... n .............5 Multiple economies (2) ................................2 3.08 Cost to export (US$ per container) ........................................................... 33 .......... n .........825 Malaysia ..................................................450 3.09 Irregular payments in exports and imports*............................................... 37 .......... n ..........4.8 New Zealand ............................................6.6 3.10 Time predictability of import procedures* ................................................. n/a ........................n/a Finland .....................................................6.0 3.11 Customs transparency index (0–1) ............................................................. 1 .......... n ........1.00 Multiple economies (35) .........................1.00
Pillar 4: Availability and quality of transport infrastructure (1-7) ..................... 54 ...........................3.7 United Arab Emirates ................................... 6.5 4.01 Available int’l airline seat km/week, millions .............................................. 62 .......... n ......181.1 United States ..................................11,481.7 4.02 Quality of air transport infrastructure* ........................................................ 34 .......... n ..........5.5 Singapore.................................................6.8 4.03 Quality of railroad infrastructure* ............................................................... 82 .......... n ..........2.0 Japan .......................................................6.7 4.04 Liner Shipping Connectivity Index (0–157.1) ............................................. 53 .......... n ........22.7 China ...................................................157.5 4.05 Quality of port infrastructure* .................................................................... 53 .......... n ..........4.5 Netherlands ..............................................6.8 4.06 Paved roads (% of total) ............................................................................. 1 .......... n ......100.0 Multiple economies (18) .......................100.0 4.07 Quality of roads* ....................................................................................... 42 .......... n ..........4.8 United Arab Emirates ...............................6.6
Pillar 5: Availability and quality of transport services (1–7) ............................ 62 ...........................4.2 Singapore..................................................... 5.7 5.01 Ease and affordability of shipment (1–5).................................................... 66 .......... n ..........3.0 Luxembourg .............................................3.8 5.02 Logistics competence (1–5) ...................................................................... 60 .......... n ..........2.9 Norway ....................................................4.2 5.03 Tracking and tracing ability (1–5) ............................................................... 93 .......... n ..........2.7 Germany ..................................................4.2 5.04 Timeliness of shipments in reaching destination (1–5) ............................... 61 .......... n ..........3.5 Luxembourg .............................................4.7 5.05 Postal services efficiency* ........................................................................ n/a ........................n/a Japan .......................................................6.8 5.06 Efficiency of transport mode change* ....................................................... 37 .......... n ..........4.7 Hong Kong SAR ......................................6.4
Pillar 6: Availability and use of ICTs (1–7) ........................................................ 67 ...........................4.0 Sweden ........................................................ 6.5 6.01 Mobile phone subscriptions/100 pop. ...................................................... 35 .......... n ......128.2 Hong Kong SAR ..................................229.2 6.02 Individuals using Internet (%) .................................................................... 76 .......... n ........41.0 Iceland ...................................................96.2 6.03 Fixed broadband Internet subscriptions/100 pop. .................................... 85 .......... n ..........2.8 Switzerland ............................................39.9 6.04 Active mobile broadband Internet subscriptions/100 pop. ........................ 81 .......... n ..........9.9 Singapore.............................................124.5 6.05 ICT use for business-to-business transactions* ........................................ 44 .......... n ..........5.3 Finland .....................................................6.2 6.06 Internet use for business-to-consumer transactions* ................................ 43 .......... n ..........4.9 United Kingdom .......................................6.3 6.07 Government Online Service Index (0–1) .................................................... 91 .......... n ........0.39 Multiple economies (3) ...........................1.00
Pillar 7: Operating environment (1–7) .............................................................. 35 ...........................4.6 Hong Kong SAR ............................................ 5.8 7.01 Protection of property index (1–7) ............................................................. 33 .......... n ..........4.9 Finland .....................................................6.3
Property rights* ......................................................................................... 27 .......... n ..........5.3 Finland .....................................................6.4Intellectual property protection* ................................................................ 35 .......... n ..........4.6 Finland .....................................................6.2
7.02 Efficiency and accountability of public institutions index (1–7) ................... 50 .......... n ..........3.8 Singapore.................................................6.0Judicial efficiency & impartiality in commercial disputes (0–4).................... 77 .......... n ..........1.8 Multiple economies (7) .............................4.0Diversion of public funds* ......................................................................... 44 .......... n ..........3.9 New Zealand ............................................6.5Ease of compliance with government regulation* ...................................... 32 .......... n ..........3.8 Singapore.................................................5.4
7.03 Access to finance index (1–7) .................................................................. 46 .......... n ..........4.1 Hong Kong SAR ......................................5.7Affordability of financial services* ............................................................. 47 .......... n ..........4.4 Hong Kong SAR ......................................6.1Availability of financial services* ................................................................ 65 .......... n ..........4.6 Switzerland ..............................................6.4Ease of access to loans* .......................................................................... 32 .......... n ..........3.3 Qatar ........................................................4.9Availability of trade finance* ...................................................................... 45 .......... n ..........4.1 Hong Kong SAR ......................................5.8
7.04 Openness to foreign participation index (1–7) ........................................... 83 .......... n ..........4.2 Ireland ......................................................5.5Ease of hiring foreign labour* .................................................................... 95 .......... n ..........3.8 United Arab Emirates ...............................5.6Business impact of rules on FDI* .............................................................. 68 .......... n ..........4.6 Ireland ......................................................6.7Openness to multilateral trade rules (0–100) ............................................. 78 .......... n ........61.6 Slovenia .................................................92.2
7.05 Index of physical security (1–7) ................................................................. 23 .......... n ..........6.2 Qatar ........................................................6.8Reliability of police services* ..................................................................... 27 .......... n ..........5.5 Finland .....................................................6.7Business costs of crime and violence* ...................................................... 15 .......... n ..........5.9 Qatar ........................................................6.8Business costs of terrorism* ..................................................................... 50 .......... n ..........5.8 Slovenia ...................................................6.7Homicide cases/100,000 pop. ................................................................. 48 .......... n ..........1.8 Hong Kong SAR ......................................0.2Index of terrorism incidence (1-7) ............................................................. 94 .......... n ..........6.9 Multiple economies (48) ...........................7.0
© 2014 World Economic Forum

Country/Economy Profiles
178 | The Global Enabling Trade Report 2014
* From the list of factors above, respondents were asked to select the five most problematic for trading in their country and to rank them between 1 (most problematic) and 5. The bars in the figure show the responses weighted according to their rankings.
For methodology, indicator descriptions and sources, and for a list of multiple best-performing economies, see page 45.
0 105 15 20 25 30
0 5 10 15 20 25 30
2
3
4
5
6
7
Operating environment
Availability & use of ICTs
Availability & quality of transport services
Availability & quality of transport infrastructure
Efficiency & transparency of border administration
Foreign market access
Domestic market access
1
Enabling Trade Index 2014 Rank Score (out of 138) (1–7)
Enabling Trade Index 2014 .................... 94 ......3.7
Subindex A: Market access (25%) ..................108 .......3.2Pillar 1: Domestic market access ................................... 112 ........ 3.8Pillar 2: Foreign market access ........................................59 .........2.7
Subindex B: Border administration (25%) ......127 .......3.0Pillar 3: Efficiency & transparency of border administration ................................................. 127 ........ 3.0
Subindex C: Infrastructure (25%) ......................53 .......4.2Pillar 4: Availability & quality of transport infrastructure ...61 ........ 3.6Pillar 5: Availability & quality of transport services ...........65 .........4.1Pillar 6: Availability & use of ICTs .....................................42 .........4.9
Subindex D: Operating environment (25%) ......67 .......4.2Pillar 7: Operating environment ........................................67 ........ 4.2
Key indicators, 2012 Rank/138
Population (millions) .............................................................16.9 ........... 55GDP (US$ billions) .............................................................202.7 ........... 49GDP per capita (US$) ...................................................11,983.0 ........... 51
Merchandise tradeTrade openness (imports+exports)/GDP .............................67.8 ........... 64Share of world trade (%) ..................................................... 0.37 ........... 49Total Exports (US$ billions) ................................................. 92.3 ........... 42Total Imports (US$ billions) ................................................. 44.5 ........... 55
Value chain indicators, 2012Share (%) of merchandise trade Exports Imports
Capital goods ......................................................................1.0 ........25.8
Intermediate goods .......................................................... 94.7 ........ 47.2Food and beverages (industrial) ......................................2.6 .......... 0.8Industrial supplies (primary and processed) ................ 25.5 ........ 28.8Parts and accessories .................................................... 0.4 ........ 10.4Fuels and lubricants ..................................................... 66.3 ...........7.2
Consumer goods ................................................................ 0.7 ........20.5Food and beverages (consumer) .................................... 0.4 ...........7.5Transport equipment and consumer goods ................... 0.4 ........ 12.9
Passenger motor cars ........................................................ 0.0 .......... 3.1
Others .................................................................................. 3.5 .......... 3.4
The most problematic factors for trade, 2013Most problematic factors for exporting Score*
High cost or delays caused by domestic transportation .......................................12.9Inappropriate production technology and skills ..................................................... 11.1Difficulties in meeting quality/quantity requirements of buyers ............................... 9.9Corruption at foreign borders ................................................................................. 9.9Access to imported inputs at competitive prices ................................................... 9.0Technical requirements and standards abroad ...................................................... 8.5Identifying potential markets and buyers .................................................................7.8High cost or delays caused by international transportation ....................................7.7Burdensome procedures at foreign borders ...........................................................7.6Tariff barriers abroad .............................................................................................. 5.9Access to trade finance .......................................................................................... 5.3Rules of origin requirements abroad ....................................................................... 4.4
Most problematic factors for importing Score*
Corruption at the border ........................................................................................18.4Burdensome import procedures ...........................................................................16.9Tariffs .....................................................................................................................16.6High cost or delays caused by international transportation ..................................14.8Crime and theft ......................................................................................................10.5Domestic technical requirements and standards ................................................... 9.5High cost or delays caused by domestic transportation .........................................9.1Inappropriate telecommunications infrastructure ................................................... 4.3
Kazakhstan
Sources: International Monetary Fund, World Bank, World Trade Organization, United Nations COMTRADE
Kazakhstan Land-Locked Developing Countries
Commonwealth of Independent States
© 2014 World Economic Forum

Country/Economy Profiles
The Global Enabling Trade Report 2014 | 179
* Indicator derived from the World Economic Forum’s Executive Opinion Survey and measured on a 1-to-7 scale, where 7 indicates best outcome.
The Enabling Trade Index 2014 in detail n Competitive Advantage n Competitive Disadvantage
For methodology, indicator descriptions and sources, and for a list of multiple best-performing economies, see page 45. Kazakhstan
INDICATOR, UNITS RANK/138 VALUE BEST PERFORMER VALUE
Pillar 1: Domestic market access (1–7) ......................................................... 112 ...........................3.8 Multiple economies (2) ................................ 7.0 1.01 Tariff rate (%)............................................................................................. 99 .......... n ..........9.4 Multiple economies (2) .............................0.0 1.02 Complexity of tariffs index (1–7) .............................................................. 109 .......... n ..........3.4 Multiple economies (2) .............................7.0
Tariff dispersion (standard deviation) ......................................................... 89 .......... n ..........9.1 Multiple economies (2) .............................0.0Tariff peaks (% of tariff lines) ..................................................................... 65 .......... n ..........2.9 Multiple economies (24) ...........................0.0Specific tariffs (% of tariff lines) ............................................................... 136 .......... n ........15.7 Multiple economies (54) ...........................0.0Number of distinct tariffs ......................................................................... 136 .......... n ......1,786 Multiple economies (2) ................................1
1.03 Share of duty-free imports (%) .................................................................. 73 .......... n ........62.2 Multiple economies (2) .........................100.0
Pillar 2: Foreign market access (1–7) .............................................................. 59 ...........................2.7 Cambodia ..................................................... 5.3 2.01 Tariffs faced (%) ........................................................................................ 68 .......... n ..........5.4 Chile .........................................................3.5 2.02 Index of margin of preference in destination mkts (0–100) ........................ 58 .......... n ........33.9 Mauritius ................................................97.1
Pillar 3: Efficiency and transparency of border administration (1–7) ............ 127 ...........................3.0 Singapore..................................................... 6.3 3.01 Customs services index (0–1) ................................................................. 110 .......... n ........0.25 Singapore...............................................0.97 3.02 Efficiency of the clearance process (1–5) ................................................ 111 .......... n ..........2.3 Norway ....................................................4.2 3.03 No. of days to import ............................................................................. 134 .......... n ...........69 Singapore....................................................4 3.04 No. of documents to import ................................................................... 134 .......... n ...........12 Multiple economies (2) ................................2 3.05 Cost to import (US$ per container) ......................................................... 134 .......... n ......4,865 Singapore................................................440 3.06 No. of days to export.............................................................................. 138 .......... n ...........81 Multiple economies (5) ................................6 3.07 No. of documents to export ................................................................... 130 .......... n ...........10 Multiple economies (2) ................................2 3.08 Cost to export (US$ per container) ......................................................... 137 .......... n ......4,885 Malaysia ..................................................450 3.09 Irregular payments in exports and imports*............................................... 63 .......... n ..........3.8 New Zealand ............................................6.6 3.10 Time predictability of import procedures* .................................................. 60 .......... n ..........4.0 Finland .....................................................6.0 3.11 Customs transparency index (0–1) ........................................................... 73 .......... n ........0.77 Multiple economies (35) .........................1.00
Pillar 4: Availability and quality of transport infrastructure (1-7) ..................... 61 ...........................3.6 United Arab Emirates ................................... 6.5 4.01 Available int’l airline seat km/week, millions .............................................. 70 .......... n ......144.6 United States ..................................11,481.7 4.02 Quality of air transport infrastructure* ........................................................ 84 .......... n ..........4.1 Singapore.................................................6.8 4.03 Quality of railroad infrastructure* ............................................................... 26 .......... n ..........4.4 Japan .......................................................6.7 4.04 Liner Shipping Connectivity Index (0–157.1) ............................................ n/a ........................n/a China ...................................................157.5 4.05 Quality of port infrastructure* .................................................................. 126 .......... n ..........2.7 Netherlands ..............................................6.8 4.06 Paved roads (% of total) ........................................................................... 32 .......... n ........89.5 Multiple economies (18) .......................100.0 4.07 Quality of roads* ..................................................................................... 108 .......... n ..........2.8 United Arab Emirates ...............................6.6
Pillar 5: Availability and quality of transport services (1–7) ............................ 65 ...........................4.1 Singapore..................................................... 5.7 5.01 Ease and affordability of shipment (1–5).................................................... 97 .......... n ..........2.7 Luxembourg .............................................3.8 5.02 Logistics competence (1–5) ...................................................................... 81 .......... n ..........2.7 Norway ....................................................4.2 5.03 Tracking and tracing ability (1–5) ............................................................... 80 .......... n ..........2.8 Germany ..................................................4.2 5.04 Timeliness of shipments in reaching destination (1–5) ............................... 72 .......... n ..........3.2 Luxembourg .............................................4.7 5.05 Postal services efficiency* ......................................................................... 54 .......... n ..........4.9 Japan .......................................................6.8 5.06 Efficiency of transport mode change* ....................................................... 52 .......... n ..........4.4 Hong Kong SAR ......................................6.4
Pillar 6: Availability and use of ICTs (1–7) ........................................................ 42 ...........................4.9 Sweden ........................................................ 6.5 6.01 Mobile phone subscriptions/100 pop. ........................................................ 3 .......... n ......185.8 Hong Kong SAR ..................................229.2 6.02 Individuals using Internet (%) .................................................................... 58 .......... n ........53.3 Iceland ...................................................96.2 6.03 Fixed broadband Internet subscriptions/100 pop. .................................... 58 .......... n ..........9.8 Switzerland ............................................39.9 6.04 Active mobile broadband Internet subscriptions/100 pop. ........................ 38 .......... n ........42.3 Singapore.............................................124.5 6.05 ICT use for business-to-business transactions* ........................................ 65 .......... n ..........4.9 Finland .....................................................6.2 6.06 Internet use for business-to-consumer transactions* ................................ 57 .......... n ..........4.8 United Kingdom .......................................6.3 6.07 Government Online Service Index (0–1) .................................................... 21 .......... n ........0.78 Multiple economies (3) ...........................1.00
Pillar 7: Operating environment (1–7) .............................................................. 67 ...........................4.2 Hong Kong SAR ............................................ 5.8 7.01 Protection of property index (1–7) ............................................................. 66 .......... n ..........3.9 Finland .....................................................6.3
Property rights* ......................................................................................... 64 .......... n ..........4.3 Finland .....................................................6.4Intellectual property protection* ................................................................ 68 .......... n ..........3.6 Finland .....................................................6.2
7.02 Efficiency and accountability of public institutions index (1–7) ................... 82 .......... n ..........3.4 Singapore.................................................6.0Judicial efficiency & impartiality in commercial disputes (0–4).................. 100 .......... n ..........1.5 Multiple economies (7) .............................4.0Diversion of public funds* ......................................................................... 59 .......... n ..........3.3 New Zealand ............................................6.5Ease of compliance with government regulation* ...................................... 49 .......... n ..........3.7 Singapore.................................................5.4
7.03 Access to finance index (1–7) .................................................................. 59 .......... n ..........3.9 Hong Kong SAR ......................................5.7Affordability of financial services* ............................................................. 54 .......... n ..........4.3 Hong Kong SAR ......................................6.1Availability of financial services* ................................................................ 57 .......... n ..........4.6 Switzerland ..............................................6.4Ease of access to loans* .......................................................................... 58 .......... n ..........2.9 Qatar ........................................................4.9Availability of trade finance* ...................................................................... 72 .......... n ..........3.8 Hong Kong SAR ......................................5.8
7.04 Openness to foreign participation index (1–7) ........................................... 72 .......... n ..........4.3 Ireland ......................................................5.5Ease of hiring foreign labour* .................................................................... 57 .......... n ..........4.2 United Arab Emirates ...............................5.6Business impact of rules on FDI* .............................................................. 84 .......... n ..........4.4 Ireland ......................................................6.7Openness to multilateral trade rules (0–100) ............................................. 73 .......... n ........62.5 Slovenia .................................................92.2
7.05 Index of physical security (1–7) ................................................................. 67 .......... n ..........5.5 Qatar ........................................................6.8Reliability of police services* ..................................................................... 82 .......... n ..........3.9 Finland .....................................................6.7Business costs of crime and violence* ...................................................... 43 .......... n ..........5.2 Qatar ........................................................6.8Business costs of terrorism* ..................................................................... 63 .......... n ..........5.5 Slovenia ...................................................6.7Homicide cases/100,000 pop. ................................................................. 98 .......... n ..........8.8 Hong Kong SAR ......................................0.2Index of terrorism incidence (1-7) ............................................................. 93 .......... n ..........6.9 Multiple economies (48) ...........................7.0
© 2014 World Economic Forum

Country/Economy Profiles
180 | The Global Enabling Trade Report 2014
* From the list of factors above, respondents were asked to select the five most problematic for trading in their country and to rank them between 1 (most problematic) and 5. The bars in the figure show the responses weighted according to their rankings.
For methodology, indicator descriptions and sources, and for a list of multiple best-performing economies, see page 45.
0 105 15 20 25 30
0 5 10 15 20 25 30
2
3
4
5
6
7
Operating environment
Availability & use of ICTs
Availability & quality of transport services
Availability & quality of transport infrastructure
Efficiency & transparency of border administration
Foreign market access
Domestic market access
1
Enabling Trade Index 2014 Rank Score (out of 138) (1–7)
Enabling Trade Index 2014 .................... 90 ......3.7
Subindex A: Market access (25%) ....................42 .......4.0Pillar 1: Domestic market access .....................................84 .........4.6Pillar 2: Foreign market access ........................................38 ........ 3.3
Subindex B: Border administration (25%) ......101 .......3.6Pillar 3: Efficiency & transparency of border administration ................................................. 101 ........ 3.6
Subindex C: Infrastructure (25%) ......................93 .......3.3Pillar 4: Availability & quality of transport infrastructure ...85 .........2.9Pillar 5: Availability & quality of transport services ...........64 .........4.1Pillar 6: Availability & use of ICTs .....................................99 ........ 3.0
Subindex D: Operating environment (25%) ......89 .......3.9Pillar 7: Operating environment ........................................89 ........ 3.9
Key indicators, 2012 Rank/138
Population (millions) .............................................................42.1 ........... 30GDP (US$ billions) ...............................................................40.7 ........... 81GDP per capita (US$) ....................................................... 966.6 ..........118
Merchandise tradeTrade openness (imports+exports)/GDP ............................ 60.2 ........... 79Share of world trade (%) ..................................................... 0.06 ........... 85Total Exports (US$ billions) ....................................................6.1 ........... 94Total Imports (US$ billions) ..................................................16.3 ........... 83
Value chain indicators, 2010Share (%) of merchandise trade Exports Imports
Capital goods ..................................................................... 3.9 ........22.4
Intermediate goods .......................................................... 33.6 ........49.5Food and beverages (industrial) ......................................7.2 .......... 3.3Industrial supplies (primary and processed) .................25.0 ........ 31.5Parts and accessories .....................................................1.2 .......... 6.5Fuels and lubricants ........................................................0.1 .......... 8.2
Consumer goods .............................................................. 58.3 ........ 11.5Food and beverages (consumer) .................................. 36.8 .......... 3.7Transport equipment and consumer goods ..................21.5 ...........7.8
Passenger motor cars ........................................................ 0.2 ..........2.9
Others .................................................................................. 4.0 ........ 13.8
The most problematic factors for trade, 2013Most problematic factors for exporting Score*
Access to trade finance .........................................................................................13.5Identifying potential markets and buyers ...............................................................13.3Corruption at foreign borders ................................................................................12.0Burdensome procedures at foreign borders .........................................................10.3High cost or delays caused by domestic transportation ........................................ 9.8Tariff barriers abroad ...............................................................................................7.2Inappropriate production technology and skills .......................................................7.2Difficulties in meeting quality/quantity requirements of buyers ................................7.0Technical requirements and standards abroad .......................................................5.1Rules of origin requirements abroad ....................................................................... 5.0High cost or delays caused by international transportation ................................... 5.0Access to imported inputs at competitive prices ................................................... 4.5
Most problematic factors for importing Score*
Corruption at the border ........................................................................................21.8Tariffs .................................................................................................................... 20.8Burdensome import procedures ...........................................................................16.7Crime and theft ......................................................................................................10.0High cost or delays caused by domestic transportation ........................................ 9.2Domestic technical requirements and standards ................................................... 8.8High cost or delays caused by international transportation ................................... 6.9Inappropriate telecommunications infrastructure ................................................... 5.8
Kenya
Sources: International Monetary Fund, World Bank, World Trade Organization, United Nations COMTRADE
Kenya
Sub-Saharan Africa
© 2014 World Economic Forum

Country/Economy Profiles
The Global Enabling Trade Report 2014 | 181
* Indicator derived from the World Economic Forum’s Executive Opinion Survey and measured on a 1-to-7 scale, where 7 indicates best outcome.
The Enabling Trade Index 2014 in detail n Competitive Advantage n Competitive Disadvantage
For methodology, indicator descriptions and sources, and for a list of multiple best-performing economies, see page 45. Kenya
INDICATOR, UNITS RANK/138 VALUE BEST PERFORMER VALUE
Pillar 1: Domestic market access (1–7) ........................................................... 84 ...........................4.6 Multiple economies (2) ................................ 7.0 1.01 Tariff rate (%)............................................................................................. 96 .......... n ..........8.8 Multiple economies (2) .............................0.0 1.02 Complexity of tariffs index (1–7) ................................................................ 46 .......... n ..........6.4 Multiple economies (2) .............................7.0
Tariff dispersion (standard deviation) ....................................................... 104 .......... n ........11.7 Multiple economies (2) .............................0.0Tariff peaks (% of tariff lines) ..................................................................... 44 .......... n ..........0.8 Multiple economies (24) ...........................0.0Specific tariffs (% of tariff lines) ................................................................. 61 .......... n ..........0.2 Multiple economies (54) ...........................0.0Number of distinct tariffs ........................................................................... 52 .......... n ...........19 Multiple economies (2) ................................1
1.03 Share of duty-free imports (%) .................................................................. 87 .......... n ........51.2 Multiple economies (2) .........................100.0
Pillar 2: Foreign market access (1–7) .............................................................. 38 ...........................3.3 Cambodia ..................................................... 5.3 2.01 Tariffs faced (%) ...................................................................................... 107 .......... n ..........5.6 Chile .........................................................3.5 2.02 Index of margin of preference in destination mkts (0–100) ........................ 14 .......... n ........60.8 Mauritius ................................................97.1
Pillar 3: Efficiency and transparency of border administration (1–7) ............ 101 ...........................3.6 Singapore..................................................... 6.3 3.01 Customs services index (0–1) ................................................................... 76 .......... n ........0.51 Singapore...............................................0.97 3.02 Efficiency of the clearance process (1–5) ................................................ 134 .......... n ..........2.0 Norway ....................................................4.2 3.03 No. of days to import ............................................................................... 99 .......... n ...........26 Singapore....................................................4 3.04 No. of documents to import ................................................................... 101 .......... n .............9 Multiple economies (2) ................................2 3.05 Cost to import (US$ per container) ......................................................... 116 .......... n ......2,350 Singapore................................................440 3.06 No. of days to export.............................................................................. 110 .......... n ...........26 Multiple economies (5) ................................6 3.07 No. of documents to export ................................................................... 108 .......... n .............8 Multiple economies (2) ................................2 3.08 Cost to export (US$ per container) ......................................................... 121 .......... n ......2,255 Malaysia ..................................................450 3.09 Irregular payments in exports and imports*............................................. 102 .......... n ..........2.7 New Zealand ............................................6.6 3.10 Time predictability of import procedures* .................................................. 85 .......... n ..........3.6 Finland .....................................................6.0 3.11 Customs transparency index (0–1) ........................................................... 73 .......... n ........0.77 Multiple economies (35) .........................1.00
Pillar 4: Availability and quality of transport infrastructure (1-7) ..................... 85 ...........................2.9 United Arab Emirates ................................... 6.5 4.01 Available int’l airline seat km/week, millions .............................................. 53 .......... n ......251.9 United States ..................................11,481.7 4.02 Quality of air transport infrastructure* ........................................................ 57 .......... n ..........4.7 Singapore.................................................6.8 4.03 Quality of railroad infrastructure* ............................................................... 67 .......... n ..........2.5 Japan .......................................................6.7 4.04 Liner Shipping Connectivity Index (0–157.1) ............................................. 74 .......... n ........11.4 China ...................................................157.5 4.05 Quality of port infrastructure* .................................................................... 71 .......... n ..........4.1 Netherlands ..............................................6.8 4.06 Paved roads (% of total) ......................................................................... 115 .......... n ........14.3 Multiple economies (18) .......................100.0 4.07 Quality of roads* ....................................................................................... 62 .......... n ..........4.1 United Arab Emirates ...............................6.6
Pillar 5: Availability and quality of transport services (1–7) ............................ 64 ...........................4.1 Singapore..................................................... 5.7 5.01 Ease and affordability of shipment (1–5).................................................... 50 .......... n ..........3.2 Luxembourg .............................................3.8 5.02 Logistics competence (1–5) ...................................................................... 89 .......... n ..........2.7 Norway ....................................................4.2 5.03 Tracking and tracing ability (1–5) ............................................................... 59 .......... n ..........3.0 Germany ..................................................4.2 5.04 Timeliness of shipments in reaching destination (1–5) ............................... 45 .......... n ..........3.6 Luxembourg .............................................4.7 5.05 Postal services efficiency* ......................................................................... 83 .......... n ..........4.1 Japan .......................................................6.8 5.06 Efficiency of transport mode change* ....................................................... 66 .......... n ..........4.0 Hong Kong SAR ......................................6.4
Pillar 6: Availability and use of ICTs (1–7) ........................................................ 99 ...........................3.0 Sweden ........................................................ 6.5 6.01 Mobile phone subscriptions/100 pop. .................................................... 114 .......... n ........71.2 Hong Kong SAR ..................................229.2 6.02 Individuals using Internet (%) .................................................................... 88 .......... n ........32.1 Iceland ...................................................96.2 6.03 Fixed broadband Internet subscriptions/100 pop. .................................. 120 .......... n ..........0.1 Switzerland ............................................39.9 6.04 Active mobile broadband Internet subscriptions/100 pop. ...................... 107 .......... n ..........2.2 Singapore.............................................124.5 6.05 ICT use for business-to-business transactions* ........................................ 56 .......... n ..........5.0 Finland .....................................................6.2 6.06 Internet use for business-to-consumer transactions* ................................ 65 .......... n ..........4.6 United Kingdom .......................................6.3 6.07 Government Online Service Index (0–1) .................................................... 84 .......... n ........0.43 Multiple economies (3) ...........................1.00
Pillar 7: Operating environment (1–7) .............................................................. 89 ...........................3.9 Hong Kong SAR ............................................ 5.8 7.01 Protection of property index (1–7) ............................................................. 79 .......... n ..........3.7 Finland .....................................................6.3
Property rights* ......................................................................................... 80 .......... n ..........3.9 Finland .....................................................6.4Intellectual property protection* ................................................................ 81 .......... n ..........3.4 Finland .....................................................6.2
7.02 Efficiency and accountability of public institutions index (1–7) ................... 79 .......... n ..........3.4 Singapore.................................................6.0Judicial efficiency & impartiality in commercial disputes (0–4).................... 77 .......... n ..........1.8 Multiple economies (7) .............................4.0Diversion of public funds* ......................................................................... 78 .......... n ..........3.0 New Zealand ............................................6.5Ease of compliance with government regulation* ...................................... 55 .......... n ..........3.6 Singapore.................................................5.4
7.03 Access to finance index (1–7) .................................................................. 52 .......... n ..........4.0 Hong Kong SAR ......................................5.7Affordability of financial services* ............................................................. 64 .......... n ..........4.1 Hong Kong SAR ......................................6.1Availability of financial services* ................................................................ 54 .......... n ..........4.8 Switzerland ..............................................6.4Ease of access to loans* .......................................................................... 42 .......... n ..........3.2 Qatar ........................................................4.9Availability of trade finance* ...................................................................... 78 .......... n ..........3.7 Hong Kong SAR ......................................5.8
7.04 Openness to foreign participation index (1–7) ........................................... 77 .......... n ..........4.2 Ireland ......................................................5.5Ease of hiring foreign labour* .................................................................... 78 .......... n ..........4.0 United Arab Emirates ...............................5.6Business impact of rules on FDI* .............................................................. 93 .......... n ..........4.2 Ireland ......................................................6.7Openness to multilateral trade rules (0–100) ............................................. 64 .......... n ........64.8 Slovenia .................................................92.2
7.05 Index of physical security (1–7) ............................................................... 117 .......... n ..........4.1 Qatar ........................................................6.8Reliability of police services* ..................................................................... 93 .......... n ..........3.7 Finland .....................................................6.7Business costs of crime and violence* .................................................... 118 .......... n ..........3.4 Qatar ........................................................6.8Business costs of terrorism* ................................................................... 130 .......... n ..........3.6 Slovenia ...................................................6.7Homicide cases/100,000 pop. ................................................................. 87 .......... n ..........6.3 Hong Kong SAR ......................................0.2Index of terrorism incidence (1-7) ........................................................... 130 .......... n ..........3.5 Multiple economies (48) ...........................7.0
© 2014 World Economic Forum

Country/Economy Profiles
182 | The Global Enabling Trade Report 2014
* From the list of factors above, respondents were asked to select the five most problematic for trading in their country and to rank them between 1 (most problematic) and 5. The bars in the figure show the responses weighted according to their rankings.
For methodology, indicator descriptions and sources, and for a list of multiple best-performing economies, see page 45.
0 105 15 20 25 30
0 5 10 15 20 25 30
2
3
4
5
6
7
Operating environment
Availability & use of ICTs
Availability & quality of transport services
Availability & quality of transport infrastructure
Efficiency & transparency of border administration
Foreign market access
Domestic market access
1
Enabling Trade Index 2014 Rank Score (out of 138) (1–7)
Enabling Trade Index 2014 .................... 30 ......4.7
Subindex A: Market access (25%) ..................120 .......3.1Pillar 1: Domestic market access ...................................104 .........4.1Pillar 2: Foreign market access ........................................93 .........2.0
Subindex B: Border administration (25%) ........19 .......5.7Pillar 3: Efficiency & transparency of border administration ...................................................19 .........5.7
Subindex C: Infrastructure (25%) ........................7 .......5.8Pillar 4: Availability & quality of transport infrastructure ... 11 .........5.7Pillar 5: Availability & quality of transport services ...........18 .........5.4Pillar 6: Availability & use of ICTs .......................................6 ........ 6.4
Subindex D: Operating environment (25%) ......55 .......4.3Pillar 7: Operating environment ........................................55 ........ 4.3
Key indicators, 2012 Rank/138
Population (millions) ............................................................ 50.0 ........... 25GDP (US$ billions) .......................................................... 1,129.5 ........... 15GDP per capita (US$) .................................................. 22,588.9 ........... 32
Merchandise tradeTrade openness (imports+exports)/GDP ............................ 94.5 ........... 32Share of world trade (%) ..................................................... 2.88 ............. 8Total Exports (US$ billions) ................................................547.9 ............. 7Total Imports (US$ billions) ................................................519.6 ............. 9
Value chain indicators, 2012Share (%) of merchandise trade Exports Imports
Capital goods ................................................................... 24.7 ........ 11.3
Intermediate goods .......................................................... 53.3 ........ 75.3Food and beverages (industrial) ..................................... 0.0 .......... 1.3Industrial supplies (primary and processed) .................27.8 ........ 29.2Parts and accessories ...................................................25.4 ........ 14.3Fuels and lubricants ........................................................0.1 ........ 30.5
Consumer goods ................................................................ 4.2 .......... 7.5Food and beverages (consumer) .....................................1.0 .......... 2.5Transport equipment and consumer goods ................... 3.2 .......... 5.0
Passenger motor cars .........................................................7.7 .......... 0.9
Others .................................................................................10.1 .......... 5.0
The most problematic factors for trade, 2013Most problematic factors for exporting Score*
Identifying potential markets and buyers ...............................................................19.8Access to imported inputs at competitive prices ..................................................15.4Technical requirements and standards abroad .....................................................11.9Access to trade finance .........................................................................................10.0Difficulties in meeting quality/quantity requirements of buyers ............................... 8.5Burdensome procedures at foreign borders ...........................................................7.7High cost or delays caused by international transportation ....................................7.0Tariff barriers abroad .............................................................................................. 6.0High cost or delays caused by domestic transportation ........................................ 4.4Inappropriate production technology and skills .......................................................4.1Rules of origin requirements abroad ....................................................................... 2.8Corruption at foreign borders ................................................................................. 2.3
Most problematic factors for importing Score*
Burdensome import procedures .......................................................................... 25.2Tariffs .....................................................................................................................21.7High cost or delays caused by international transportation ..................................16.9Domestic technical requirements and standards ..................................................16.7High cost or delays caused by domestic transportation .......................................10.3Inappropriate telecommunications infrastructure ................................................... 5.0Corruption at the border ......................................................................................... 3.8Crime and theft ....................................................................................................... 0.4
Korea, Rep.
Sources: International Monetary Fund, World Bank, World Trade Organization, United Nations COMTRADE
Korea, Rep.
Advanced economies
© 2014 World Economic Forum
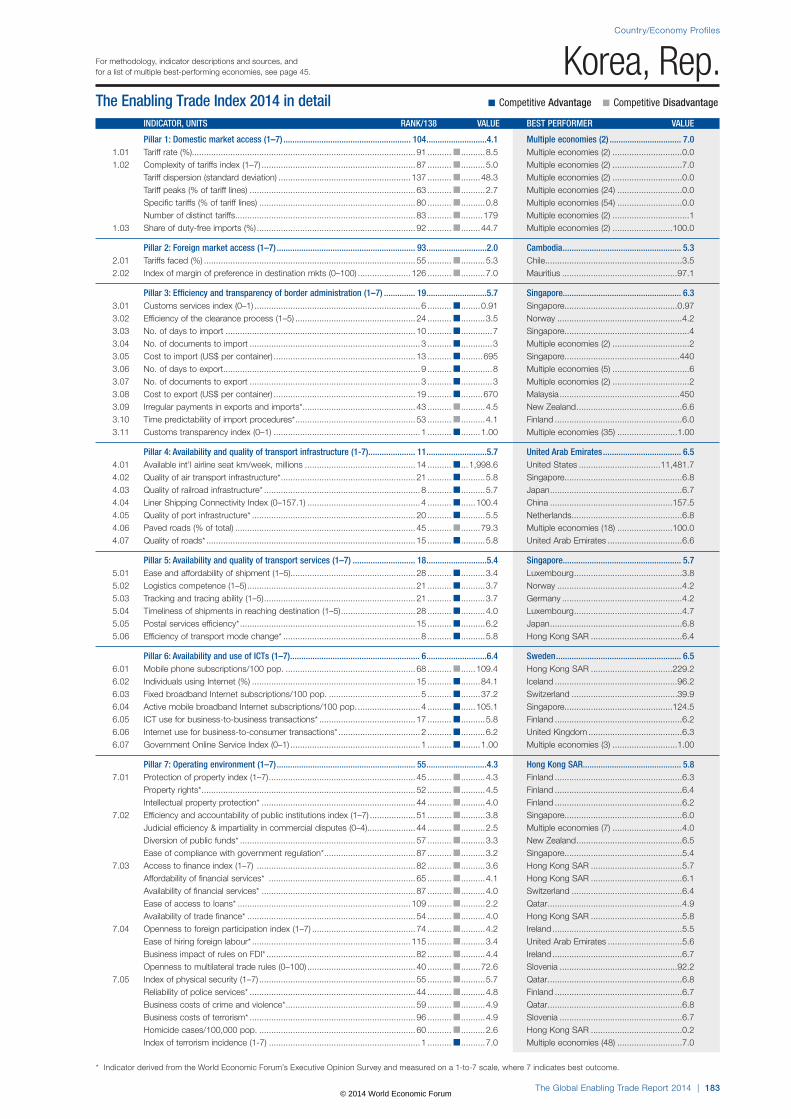
Country/Economy Profiles
The Global Enabling Trade Report 2014 | 183
* Indicator derived from the World Economic Forum’s Executive Opinion Survey and measured on a 1-to-7 scale, where 7 indicates best outcome.
The Enabling Trade Index 2014 in detail n Competitive Advantage n Competitive Disadvantage
For methodology, indicator descriptions and sources, and for a list of multiple best-performing economies, see page 45. Korea, Rep.
INDICATOR, UNITS RANK/138 VALUE BEST PERFORMER VALUE
Pillar 1: Domestic market access (1–7) ......................................................... 104 ...........................4.1 Multiple economies (2) ................................ 7.0 1.01 Tariff rate (%)............................................................................................. 91 .......... n ..........8.5 Multiple economies (2) .............................0.0 1.02 Complexity of tariffs index (1–7) ................................................................ 87 .......... n ..........5.0 Multiple economies (2) .............................7.0
Tariff dispersion (standard deviation) ....................................................... 137 .......... n ........48.3 Multiple economies (2) .............................0.0Tariff peaks (% of tariff lines) ..................................................................... 63 .......... n ..........2.7 Multiple economies (24) ...........................0.0Specific tariffs (% of tariff lines) ................................................................. 80 .......... n ..........0.8 Multiple economies (54) ...........................0.0Number of distinct tariffs ........................................................................... 83 .......... n .........179 Multiple economies (2) ................................1
1.03 Share of duty-free imports (%) .................................................................. 92 .......... n ........44.7 Multiple economies (2) .........................100.0
Pillar 2: Foreign market access (1–7) .............................................................. 93 ...........................2.0 Cambodia ..................................................... 5.3 2.01 Tariffs faced (%) ........................................................................................ 55 .......... n ..........5.3 Chile .........................................................3.5 2.02 Index of margin of preference in destination mkts (0–100) ...................... 126 .......... n ..........7.0 Mauritius ................................................97.1
Pillar 3: Efficiency and transparency of border administration (1–7) .............. 19 ...........................5.7 Singapore..................................................... 6.3 3.01 Customs services index (0–1) ..................................................................... 6 .......... n ........0.91 Singapore...............................................0.97 3.02 Efficiency of the clearance process (1–5) .................................................. 24 .......... n ..........3.5 Norway ....................................................4.2 3.03 No. of days to import ............................................................................... 10 .......... n .............7 Singapore....................................................4 3.04 No. of documents to import ....................................................................... 3 .......... n .............3 Multiple economies (2) ................................2 3.05 Cost to import (US$ per container) ........................................................... 13 .......... n .........695 Singapore................................................440 3.06 No. of days to export.................................................................................. 9 .......... n .............8 Multiple economies (5) ................................6 3.07 No. of documents to export ....................................................................... 3 .......... n .............3 Multiple economies (2) ................................2 3.08 Cost to export (US$ per container) ........................................................... 19 .......... n .........670 Malaysia ..................................................450 3.09 Irregular payments in exports and imports*............................................... 43 .......... n ..........4.5 New Zealand ............................................6.6 3.10 Time predictability of import procedures* .................................................. 53 .......... n ..........4.1 Finland .....................................................6.0 3.11 Customs transparency index (0–1) ............................................................. 1 .......... n ........1.00 Multiple economies (35) .........................1.00
Pillar 4: Availability and quality of transport infrastructure (1-7) ..................... 11 ...........................5.7 United Arab Emirates ................................... 6.5 4.01 Available int’l airline seat km/week, millions .............................................. 14 .......... n ...1,998.6 United States ..................................11,481.7 4.02 Quality of air transport infrastructure* ........................................................ 21 .......... n ..........5.8 Singapore.................................................6.8 4.03 Quality of railroad infrastructure* ................................................................. 8 .......... n ..........5.7 Japan .......................................................6.7 4.04 Liner Shipping Connectivity Index (0–157.1) ............................................... 4 .......... n ......100.4 China ...................................................157.5 4.05 Quality of port infrastructure* .................................................................... 20 .......... n ..........5.5 Netherlands ..............................................6.8 4.06 Paved roads (% of total) ........................................................................... 45 .......... n ........79.3 Multiple economies (18) .......................100.0 4.07 Quality of roads* ....................................................................................... 15 .......... n ..........5.8 United Arab Emirates ...............................6.6
Pillar 5: Availability and quality of transport services (1–7) ............................ 18 ...........................5.4 Singapore..................................................... 5.7 5.01 Ease and affordability of shipment (1–5).................................................... 28 .......... n ..........3.4 Luxembourg .............................................3.8 5.02 Logistics competence (1–5) ...................................................................... 21 .......... n ..........3.7 Norway ....................................................4.2 5.03 Tracking and tracing ability (1–5) ............................................................... 21 .......... n ..........3.7 Germany ..................................................4.2 5.04 Timeliness of shipments in reaching destination (1–5) ............................... 28 .......... n ..........4.0 Luxembourg .............................................4.7 5.05 Postal services efficiency* ......................................................................... 15 .......... n ..........6.2 Japan .......................................................6.8 5.06 Efficiency of transport mode change* ......................................................... 8 .......... n ..........5.8 Hong Kong SAR ......................................6.4
Pillar 6: Availability and use of ICTs (1–7) .......................................................... 6 ...........................6.4 Sweden ........................................................ 6.5 6.01 Mobile phone subscriptions/100 pop. ...................................................... 68 .......... n ......109.4 Hong Kong SAR ..................................229.2 6.02 Individuals using Internet (%) .................................................................... 15 .......... n ........84.1 Iceland ...................................................96.2 6.03 Fixed broadband Internet subscriptions/100 pop. ...................................... 5 .......... n ........37.2 Switzerland ............................................39.9 6.04 Active mobile broadband Internet subscriptions/100 pop. .......................... 4 .......... n ......105.1 Singapore.............................................124.5 6.05 ICT use for business-to-business transactions* ........................................ 17 .......... n ..........5.8 Finland .....................................................6.2 6.06 Internet use for business-to-consumer transactions* .................................. 2 .......... n ..........6.2 United Kingdom .......................................6.3 6.07 Government Online Service Index (0–1) ...................................................... 1 .......... n ........1.00 Multiple economies (3) ...........................1.00
Pillar 7: Operating environment (1–7) .............................................................. 55 ...........................4.3 Hong Kong SAR ............................................ 5.8 7.01 Protection of property index (1–7) ............................................................. 45 .......... n ..........4.3 Finland .....................................................6.3
Property rights* ......................................................................................... 52 .......... n ..........4.5 Finland .....................................................6.4Intellectual property protection* ................................................................ 44 .......... n ..........4.0 Finland .....................................................6.2
7.02 Efficiency and accountability of public institutions index (1–7) ................... 51 .......... n ..........3.8 Singapore.................................................6.0Judicial efficiency & impartiality in commercial disputes (0–4).................... 44 .......... n ..........2.5 Multiple economies (7) .............................4.0Diversion of public funds* ......................................................................... 57 .......... n ..........3.3 New Zealand ............................................6.5Ease of compliance with government regulation* ...................................... 87 .......... n ..........3.2 Singapore.................................................5.4
7.03 Access to finance index (1–7) .................................................................. 82 .......... n ..........3.6 Hong Kong SAR ......................................5.7Affordability of financial services* ............................................................. 65 .......... n ..........4.1 Hong Kong SAR ......................................6.1Availability of financial services* ................................................................ 87 .......... n ..........4.0 Switzerland ..............................................6.4Ease of access to loans* ........................................................................ 109 .......... n ..........2.2 Qatar ........................................................4.9Availability of trade finance* ...................................................................... 54 .......... n ..........4.0 Hong Kong SAR ......................................5.8
7.04 Openness to foreign participation index (1–7) ........................................... 74 .......... n ..........4.2 Ireland ......................................................5.5Ease of hiring foreign labour* .................................................................. 115 .......... n ..........3.4 United Arab Emirates ...............................5.6Business impact of rules on FDI* .............................................................. 82 .......... n ..........4.4 Ireland ......................................................6.7Openness to multilateral trade rules (0–100) ............................................. 40 .......... n ........72.6 Slovenia .................................................92.2
7.05 Index of physical security (1–7) ................................................................. 55 .......... n ..........5.7 Qatar ........................................................6.8Reliability of police services* ..................................................................... 44 .......... n ..........4.8 Finland .....................................................6.7Business costs of crime and violence* ...................................................... 59 .......... n ..........4.9 Qatar ........................................................6.8Business costs of terrorism* ..................................................................... 96 .......... n ..........4.9 Slovenia ...................................................6.7Homicide cases/100,000 pop. ................................................................. 60 .......... n ..........2.6 Hong Kong SAR ......................................0.2Index of terrorism incidence (1-7) ............................................................... 1 .......... n ..........7.0 Multiple economies (48) ...........................7.0
© 2014 World Economic Forum

Country/Economy Profiles
184 | The Global Enabling Trade Report 2014
* From the list of factors above, respondents were asked to select the five most problematic for trading in their country and to rank them between 1 (most problematic) and 5. The bars in the figure show the responses weighted according to their rankings.
For methodology, indicator descriptions and sources, and for a list of multiple best-performing economies, see page 45.
0 105 15 20 25 30
0 5 10 15 20 25 30
2
3
4
5
6
7
Operating environment
Availability & use of ICTs
Availability & quality of transport services
Availability & quality of transport infrastructure
Efficiency & transparency of border administration
Foreign market access
Domestic market access
1
Enabling Trade Index 2014 Rank Score (out of 138) (1–7)
Enabling Trade Index 2014 .....................74 ..... 4.0
Subindex A: Market access (25%) .................. 113 .......3.2Pillar 1: Domestic market access .....................................88 ........ 4.5Pillar 2: Foreign market access ...................................... 126 .........1.8
Subindex B: Border administration (25%) ........66 .......4.5Pillar 3: Efficiency & transparency of border administration ...................................................66 ........ 4.5
Subindex C: Infrastructure (25%) ......................57 .......4.1Pillar 4: Availability & quality of transport infrastructure ...57 ........ 3.6Pillar 5: Availability & quality of transport services ...........75 ........ 3.9Pillar 6: Availability & use of ICTs .....................................51 .........4.6
Subindex D: Operating environment (25%) ......63 .......4.2Pillar 7: Operating environment ........................................63 ........ 4.2
Key indicators, 2012 Rank/138
Population (millions) .............................................................. 3.8 ......... 109GDP (US$ billions) .............................................................184.5 ........... 53GDP per capita (US$) ...................................................48,761.2 ............11
Merchandise tradeTrade openness (imports+exports)/GDP, 2011 ....................73.1 ........... 61Share of world trade (%) ..................................................... 0.39 ........... 47Total Exports (US$ billions) ................................................118.5 ........... 34Total Imports (US$ billions) ..................................................25.9 ........... 66
The most problematic factors for trade, 2013Most problematic factors for exporting Score*
Access to trade finance ........................................................................................ 20.8Inappropriate production technology and skills .....................................................16.5Difficulties in meeting quality/quantity requirements of buyers ..............................11.3Access to imported inputs at competitive prices ..................................................11.3Identifying potential markets and buyers ...............................................................10.8Burdensome procedures at foreign borders .......................................................... 9.5Rules of origin requirements abroad ....................................................................... 6.5High cost or delays caused by domestic transportation ........................................ 6.5High cost or delays caused by international transportation ................................... 3.5Tariff barriers abroad ...............................................................................................1.3Corruption at foreign borders ..................................................................................1.3Technical requirements and standards abroad ...................................................... 0.9
Most problematic factors for importing Score*
Burdensome import procedures .......................................................................... 23.4High cost or delays caused by international transportation ..................................18.9Domestic technical requirements and standards ................................................. 18.2Tariffs .....................................................................................................................15.7Corruption at the border ..........................................................................................7.7High cost or delays caused by domestic transportation ........................................ 6.3Inappropriate telecommunications infrastructure ................................................... 4.9Crime and theft ....................................................................................................... 4.9
Kuwait
Sources: International Monetary Fund, World Bank, World Trade Organization, United Nations COMTRADE
Kuwait
Middle East, North Africa, and Pakistan
© 2014 World Economic Forum

Country/Economy Profiles
The Global Enabling Trade Report 2014 | 185
* Indicator derived from the World Economic Forum’s Executive Opinion Survey and measured on a 1-to-7 scale, where 7 indicates best outcome.
The Enabling Trade Index 2014 in detail n Competitive Advantage n Competitive Disadvantage
For methodology, indicator descriptions and sources, and for a list of multiple best-performing economies, see page 45. Kuwait
INDICATOR, UNITS RANK/138 VALUE BEST PERFORMER VALUE
Pillar 1: Domestic market access (1–7) ........................................................... 88 ...........................4.5 Multiple economies (2) ................................ 7.0 1.01 Tariff rate (%)............................................................................................. 57 .......... n ..........4.4 Multiple economies (2) .............................0.0 1.02 Complexity of tariffs index (1–7) ................................................................ 58 .......... n ..........6.2 Multiple economies (2) .............................7.0
Tariff dispersion (standard deviation) ....................................................... 124 .......... n ........16.1 Multiple economies (2) .............................0.0Tariff peaks (% of tariff lines) ..................................................................... 30 .......... n ..........0.3 Multiple economies (24) ...........................0.0Specific tariffs (% of tariff lines) ................................................................. 64 .......... n ..........0.3 Multiple economies (54) ...........................0.0Number of distinct tariffs ........................................................................... 59 .......... n ...........22 Multiple economies (2) ................................1
1.03 Share of duty-free imports (%) ................................................................ 114 .......... n ........19.4 Multiple economies (2) .........................100.0
Pillar 2: Foreign market access (1–7) ............................................................ 126 ...........................1.8 Cambodia ..................................................... 5.3 2.01 Tariffs faced (%) ........................................................................................ 70 .......... n ..........5.4 Chile .........................................................3.5 2.02 Index of margin of preference in destination mkts (0–100) ...................... 129 .......... n ..........4.5 Mauritius ................................................97.1
Pillar 3: Efficiency and transparency of border administration (1–7) .............. 66 ...........................4.5 Singapore..................................................... 6.3 3.01 Customs services index (0–1) ................................................................... 31 .......... n ........0.71 Singapore...............................................0.97 3.02 Efficiency of the clearance process (1–5) .................................................. 67 .......... n ..........2.7 Norway ....................................................4.2 3.03 No. of days to import ............................................................................... 78 .......... n ...........19 Singapore....................................................4 3.04 No. of documents to import ................................................................... 115 .......... n ...........10 Multiple economies (2) ................................2 3.05 Cost to import (US$ per container) ........................................................... 64 .......... n ......1,250 Singapore................................................440 3.06 No. of days to export................................................................................ 63 .......... n ...........16 Multiple economies (5) ................................6 3.07 No. of documents to export ..................................................................... 85 .......... n .............7 Multiple economies (2) ................................2 3.08 Cost to export (US$ per container) ........................................................... 60 .......... n ......1,085 Malaysia ..................................................450 3.09 Irregular payments in exports and imports*............................................... 57 .......... n ..........3.9 New Zealand ............................................6.6 3.10 Time predictability of import procedures* .................................................. 75 .......... n ..........3.8 Finland .....................................................6.0 3.11 Customs transparency index (0–1) ........................................................... 59 .......... n ........0.80 Multiple economies (35) .........................1.00
Pillar 4: Availability and quality of transport infrastructure (1-7) ..................... 57 ...........................3.6 United Arab Emirates ................................... 6.5 4.01 Available int’l airline seat km/week, millions .............................................. 56 .......... n ......230.9 United States ..................................11,481.7 4.02 Quality of air transport infrastructure* ........................................................ 88 .......... n ..........4.0 Singapore.................................................6.8 4.03 Quality of railroad infrastructure* .............................................................. n/a ........................n/a Japan .......................................................6.7 4.04 Liner Shipping Connectivity Index (0–157.1) ............................................. 87 .......... n ..........7.1 China ...................................................157.5 4.05 Quality of port infrastructure* .................................................................... 68 .......... n ..........4.1 Netherlands ..............................................6.8 4.06 Paved roads (% of total) ........................................................................... 38 .......... n ........85.0 Multiple economies (18) .......................100.0 4.07 Quality of roads* ....................................................................................... 41 .......... n ..........4.8 United Arab Emirates ...............................6.6
Pillar 5: Availability and quality of transport services (1–7) ............................ 75 ...........................3.9 Singapore..................................................... 5.7 5.01 Ease and affordability of shipment (1–5).................................................... 89 .......... n ..........2.8 Luxembourg .............................................3.8 5.02 Logistics competence (1–5) ...................................................................... 59 .......... n ..........3.0 Norway ....................................................4.2 5.03 Tracking and tracing ability (1–5) ............................................................... 50 .......... n ..........3.2 Germany ..................................................4.2 5.04 Timeliness of shipments in reaching destination (1–5) ............................... 63 .......... n ..........3.4 Luxembourg .............................................4.7 5.05 Postal services efficiency* ....................................................................... 127 .......... n ..........2.6 Japan .......................................................6.8 5.06 Efficiency of transport mode change* ....................................................... 47 .......... n ..........4.5 Hong Kong SAR ......................................6.4
Pillar 6: Availability and use of ICTs (1–7) ........................................................ 51 ...........................4.6 Sweden ........................................................ 6.5 6.01 Mobile phone subscriptions/100 pop. ...................................................... 15 .......... n ......156.9 Hong Kong SAR ..................................229.2 6.02 Individuals using Internet (%) .................................................................... 23 .......... n ........79.2 Iceland ...................................................96.2 6.03 Fixed broadband Internet subscriptions/100 pop. .................................... 94 .......... n ..........1.4 Switzerland ............................................39.9 6.04 Active mobile broadband Internet subscriptions/100 pop. ....................... n/a ........................n/a Singapore.............................................124.5 6.05 ICT use for business-to-business transactions* ........................................ 59 .......... n ..........4.9 Finland .....................................................6.2 6.06 Internet use for business-to-consumer transactions* ................................ 68 .......... n ..........4.5 United Kingdom .......................................6.3 6.07 Government Online Service Index (0–1) .................................................... 46 .......... n ........0.58 Multiple economies (3) ...........................1.00
Pillar 7: Operating environment (1–7) .............................................................. 63 ...........................4.2 Hong Kong SAR ............................................ 5.8 7.01 Protection of property index (1–7) ............................................................. 43 .......... n ..........4.4 Finland .....................................................6.3
Property rights* ......................................................................................... 37 .......... n ..........5.0 Finland .....................................................6.4Intellectual property protection* ................................................................ 57 .......... n ..........3.8 Finland .....................................................6.2
7.02 Efficiency and accountability of public institutions index (1–7) ................... 88 .......... n ..........3.4 Singapore.................................................6.0Judicial efficiency & impartiality in commercial disputes (0–4).................... 55 .......... n ..........2.3 Multiple economies (7) .............................4.0Diversion of public funds* ......................................................................... 54 .......... n ..........3.5 New Zealand ............................................6.5Ease of compliance with government regulation* .................................... 135 .......... n ..........2.2 Singapore.................................................5.4
7.03 Access to finance index (1–7) .................................................................. 55 .......... n ..........3.9 Hong Kong SAR ......................................5.7Affordability of financial services* ............................................................. 51 .......... n ..........4.3 Hong Kong SAR ......................................6.1Availability of financial services* ................................................................ 70 .......... n ..........4.4 Switzerland ..............................................6.4Ease of access to loans* .......................................................................... 71 .......... n ..........2.8 Qatar ........................................................4.9Availability of trade finance* ...................................................................... 42 .......... n ..........4.2 Hong Kong SAR ......................................5.8
7.04 Openness to foreign participation index (1–7) ......................................... 123 .......... n ..........3.4 Ireland ......................................................5.5Ease of hiring foreign labour* .................................................................... 56 .......... n ..........4.2 United Arab Emirates ...............................5.6Business impact of rules on FDI* ............................................................ 133 .......... n ..........2.9 Ireland ......................................................6.7Openness to multilateral trade rules (0–100) ........................................... 116 .......... n ........47.9 Slovenia .................................................92.2
7.05 Index of physical security (1–7) ................................................................. 29 .......... n ..........6.1 Qatar ........................................................6.8Reliability of police services* ..................................................................... 43 .......... n ..........4.8 Finland .....................................................6.7Business costs of crime and violence* ...................................................... 13 .......... n ..........5.9 Qatar ........................................................6.8Business costs of terrorism* ..................................................................... 54 .......... n ..........5.7 Slovenia ...................................................6.7Homicide cases/100,000 pop. ................................................................. 53 .......... n ..........2.2 Hong Kong SAR ......................................0.2Index of terrorism incidence (1-7) ............................................................. 49 .......... n ..........7.0 Multiple economies (48) ...........................7.0
© 2014 World Economic Forum

Country/Economy Profiles
186 | The Global Enabling Trade Report 2014
* From the list of factors above, respondents were asked to select the five most problematic for trading in their country and to rank them between 1 (most problematic) and 5. The bars in the figure show the responses weighted according to their rankings.
For methodology, indicator descriptions and sources, and for a list of multiple best-performing economies, see page 45.
0 105 15 20 25 30
0 5 10 15 20 25 30
2
3
4
5
6
7
Operating environment
Availability & use of ICTs
Availability & quality of transport services
Availability & quality of transport infrastructure
Efficiency & transparency of border administration
Foreign market access
Domestic market access
1
Enabling Trade Index 2014 Rank Score (out of 138) (1–7)
Enabling Trade Index 2014 ...................109 ..... 3.5
Subindex A: Market access (25%) ....................32 .......4.2Pillar 1: Domestic market access .....................................82 .........4.7Pillar 2: Foreign market access ........................................19 ........ 3.8
Subindex B: Border administration (25%) ...... 118 .......3.3Pillar 3: Efficiency & transparency of border administration ................................................. 118 ........ 3.3
Subindex C: Infrastructure (25%) ....................104 .......3.0Pillar 4: Availability & quality of transport infrastructure .105 .........2.6Pillar 5: Availability & quality of transport services ......... 128 .........3.1Pillar 6: Availability & use of ICTs .....................................90 .........3.4
Subindex D: Operating environment (25%) ....121 .......3.4Pillar 7: Operating environment ...................................... 121 .........3.4
Key indicators, 2012 Rank/138
Population (millions) .............................................................. 5.6 ........... 95GDP (US$ billions) ................................................................ 6.5 ......... 128GDP per capita (US$) ..................................................... 1,158.5 ..........114
Merchandise tradeTrade openness (imports+exports)/GDP ........................... 112.3 ........... 22Share of world trade (%) ..................................................... 0.02 ..........117Total Exports (US$ billions) ....................................................1.9 ......... 121Total Imports (US$ billions) ................................................... 5.4 ..........113
Value chain indicators, 2012Share (%) of merchandise trade Exports Imports
Capital goods ..................................................................... 2.2 ........ 14.9
Intermediate goods .......................................................... 62.2 ........34.5Food and beverages (industrial) ..................................... 0.9 .......... 2.7Industrial supplies (primary and processed) .................56.1 ........ 23.4Parts and accessories .................................................... 0.9 .......... 5.9Fuels and lubricants ....................................................... 4.3 .......... 2.5
Consumer goods ...............................................................27.3 ........26.0Food and beverages (consumer) ...................................13.3 .......... 9.8Transport equipment and consumer goods ..................14.0 ........ 16.2
Passenger motor cars ........................................................ 0.2 .......... 5.6
Others ...................................................................................8.1 ........ 19.0
The most problematic factors for trade, 2013Most problematic factors for exporting Score*
Corruption at foreign borders ................................................................................15.3Burdensome procedures at foreign borders ........................................................ 13.2Inappropriate production technology and skills .....................................................11.0Tariff barriers abroad .............................................................................................10.8Technical requirements and standards abroad .....................................................10.5Identifying potential markets and buyers ................................................................ 9.3Difficulties in meeting quality/quantity requirements of buyers ............................... 8.4Access to imported inputs at competitive prices ....................................................7.0High cost or delays caused by international transportation ................................... 5.0Access to trade finance .......................................................................................... 4.9Rules of origin requirements abroad ....................................................................... 2.4High cost or delays caused by domestic transportation ........................................ 2.4
Most problematic factors for importing Score*
Corruption at the border ....................................................................................... 23.5Tariffs .................................................................................................................... 16.3Burdensome import procedures ...........................................................................15.1Crime and theft ......................................................................................................13.3High cost or delays caused by international transportation ..................................12.2Domestic technical requirements and standards ................................................... 8.6Inappropriate telecommunications infrastructure ................................................... 6.6High cost or delays caused by domestic transportation ........................................ 4.3
Kyrgyz Republic
Sources: International Monetary Fund, World Bank, World Trade Organization, United Nations COMTRADE
Kyrgyz Republic Land-Locked Developing Countries
Commonwealth of Independent States
© 2014 World Economic Forum
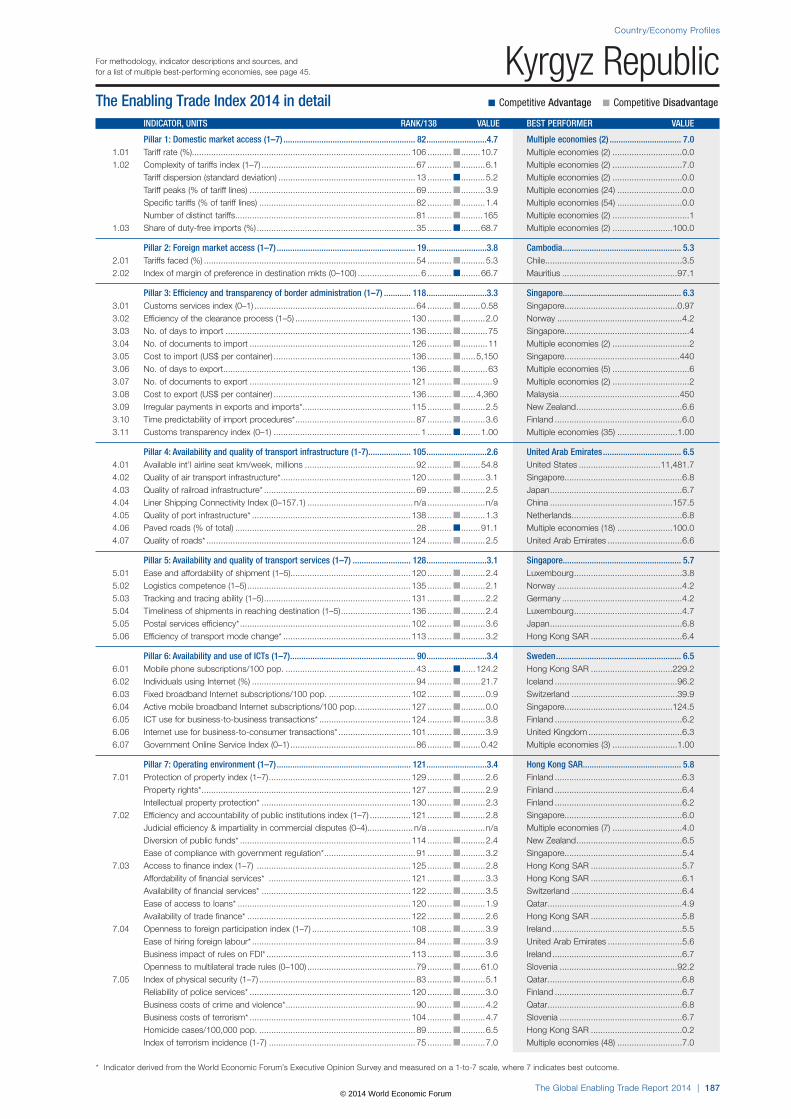
Country/Economy Profiles
The Global Enabling Trade Report 2014 | 187
* Indicator derived from the World Economic Forum’s Executive Opinion Survey and measured on a 1-to-7 scale, where 7 indicates best outcome.
The Enabling Trade Index 2014 in detail n Competitive Advantage n Competitive Disadvantage
For methodology, indicator descriptions and sources, and for a list of multiple best-performing economies, see page 45. Kyrgyz Republic
INDICATOR, UNITS RANK/138 VALUE BEST PERFORMER VALUE
Pillar 1: Domestic market access (1–7) ........................................................... 82 ...........................4.7 Multiple economies (2) ................................ 7.0 1.01 Tariff rate (%)........................................................................................... 106 .......... n ........10.7 Multiple economies (2) .............................0.0 1.02 Complexity of tariffs index (1–7) ................................................................ 67 .......... n ..........6.1 Multiple economies (2) .............................7.0
Tariff dispersion (standard deviation) ......................................................... 13 .......... n ..........5.2 Multiple economies (2) .............................0.0Tariff peaks (% of tariff lines) ..................................................................... 69 .......... n ..........3.9 Multiple economies (24) ...........................0.0Specific tariffs (% of tariff lines) ................................................................. 82 .......... n ..........1.4 Multiple economies (54) ...........................0.0Number of distinct tariffs ........................................................................... 81 .......... n .........165 Multiple economies (2) ................................1
1.03 Share of duty-free imports (%) .................................................................. 35 .......... n ........68.7 Multiple economies (2) .........................100.0
Pillar 2: Foreign market access (1–7) .............................................................. 19 ...........................3.8 Cambodia ..................................................... 5.3 2.01 Tariffs faced (%) ........................................................................................ 54 .......... n ..........5.3 Chile .........................................................3.5 2.02 Index of margin of preference in destination mkts (0–100) .......................... 6 .......... n ........66.7 Mauritius ................................................97.1
Pillar 3: Efficiency and transparency of border administration (1–7) ............ 118 ...........................3.3 Singapore..................................................... 6.3 3.01 Customs services index (0–1) ................................................................... 64 .......... n ........0.58 Singapore...............................................0.97 3.02 Efficiency of the clearance process (1–5) ................................................ 130 .......... n ..........2.0 Norway ....................................................4.2 3.03 No. of days to import ............................................................................. 136 .......... n ...........75 Singapore....................................................4 3.04 No. of documents to import ................................................................... 126 .......... n ...........11 Multiple economies (2) ................................2 3.05 Cost to import (US$ per container) ......................................................... 136 .......... n ......5,150 Singapore................................................440 3.06 No. of days to export.............................................................................. 136 .......... n ...........63 Multiple economies (5) ................................6 3.07 No. of documents to export ................................................................... 121 .......... n .............9 Multiple economies (2) ................................2 3.08 Cost to export (US$ per container) ......................................................... 136 .......... n ......4,360 Malaysia ..................................................450 3.09 Irregular payments in exports and imports*............................................. 115 .......... n ..........2.5 New Zealand ............................................6.6 3.10 Time predictability of import procedures* .................................................. 87 .......... n ..........3.6 Finland .....................................................6.0 3.11 Customs transparency index (0–1) ............................................................. 1 .......... n ........1.00 Multiple economies (35) .........................1.00
Pillar 4: Availability and quality of transport infrastructure (1-7) ................... 105 ...........................2.6 United Arab Emirates ................................... 6.5 4.01 Available int’l airline seat km/week, millions .............................................. 92 .......... n ........54.8 United States ..................................11,481.7 4.02 Quality of air transport infrastructure* ...................................................... 120 .......... n ..........3.1 Singapore.................................................6.8 4.03 Quality of railroad infrastructure* ............................................................... 69 .......... n ..........2.5 Japan .......................................................6.7 4.04 Liner Shipping Connectivity Index (0–157.1) ............................................ n/a ........................n/a China ...................................................157.5 4.05 Quality of port infrastructure* .................................................................. 138 .......... n ..........1.3 Netherlands ..............................................6.8 4.06 Paved roads (% of total) ........................................................................... 28 .......... n ........91.1 Multiple economies (18) .......................100.0 4.07 Quality of roads* ..................................................................................... 124 .......... n ..........2.5 United Arab Emirates ...............................6.6
Pillar 5: Availability and quality of transport services (1–7) .......................... 128 ...........................3.1 Singapore..................................................... 5.7 5.01 Ease and affordability of shipment (1–5).................................................. 120 .......... n ..........2.4 Luxembourg .............................................3.8 5.02 Logistics competence (1–5) .................................................................... 135 .......... n ..........2.1 Norway ....................................................4.2 5.03 Tracking and tracing ability (1–5) ............................................................. 131 .......... n ..........2.2 Germany ..................................................4.2 5.04 Timeliness of shipments in reaching destination (1–5) ............................. 136 .......... n ..........2.4 Luxembourg .............................................4.7 5.05 Postal services efficiency* ....................................................................... 102 .......... n ..........3.6 Japan .......................................................6.8 5.06 Efficiency of transport mode change* ..................................................... 113 .......... n ..........3.2 Hong Kong SAR ......................................6.4
Pillar 6: Availability and use of ICTs (1–7) ........................................................ 90 ...........................3.4 Sweden ........................................................ 6.5 6.01 Mobile phone subscriptions/100 pop. ...................................................... 43 .......... n ......124.2 Hong Kong SAR ..................................229.2 6.02 Individuals using Internet (%) .................................................................... 94 .......... n ........21.7 Iceland ...................................................96.2 6.03 Fixed broadband Internet subscriptions/100 pop. .................................. 102 .......... n ..........0.9 Switzerland ............................................39.9 6.04 Active mobile broadband Internet subscriptions/100 pop. ...................... 127 .......... n ..........0.0 Singapore.............................................124.5 6.05 ICT use for business-to-business transactions* ...................................... 124 .......... n ..........3.8 Finland .....................................................6.2 6.06 Internet use for business-to-consumer transactions* .............................. 101 .......... n ..........3.9 United Kingdom .......................................6.3 6.07 Government Online Service Index (0–1) .................................................... 86 .......... n ........0.42 Multiple economies (3) ...........................1.00
Pillar 7: Operating environment (1–7) ............................................................ 121 ...........................3.4 Hong Kong SAR ............................................ 5.8 7.01 Protection of property index (1–7) ........................................................... 129 .......... n ..........2.6 Finland .....................................................6.3
Property rights* ....................................................................................... 127 .......... n ..........2.9 Finland .....................................................6.4Intellectual property protection* .............................................................. 130 .......... n ..........2.3 Finland .....................................................6.2
7.02 Efficiency and accountability of public institutions index (1–7) ................. 121 .......... n ..........2.8 Singapore.................................................6.0Judicial efficiency & impartiality in commercial disputes (0–4)................... n/a ........................n/a Multiple economies (7) .............................4.0Diversion of public funds* ....................................................................... 114 .......... n ..........2.4 New Zealand ............................................6.5Ease of compliance with government regulation* ...................................... 91 .......... n ..........3.2 Singapore.................................................5.4
7.03 Access to finance index (1–7) ................................................................ 125 .......... n ..........2.8 Hong Kong SAR ......................................5.7Affordability of financial services* ........................................................... 121 .......... n ..........3.3 Hong Kong SAR ......................................6.1Availability of financial services* .............................................................. 122 .......... n ..........3.5 Switzerland ..............................................6.4Ease of access to loans* ........................................................................ 120 .......... n ..........1.9 Qatar ........................................................4.9Availability of trade finance* .................................................................... 122 .......... n ..........2.6 Hong Kong SAR ......................................5.8
7.04 Openness to foreign participation index (1–7) ......................................... 108 .......... n ..........3.9 Ireland ......................................................5.5Ease of hiring foreign labour* .................................................................... 84 .......... n ..........3.9 United Arab Emirates ...............................5.6Business impact of rules on FDI* ............................................................ 113 .......... n ..........3.6 Ireland ......................................................6.7Openness to multilateral trade rules (0–100) ............................................. 79 .......... n ........61.0 Slovenia .................................................92.2
7.05 Index of physical security (1–7) ................................................................. 83 .......... n ..........5.1 Qatar ........................................................6.8Reliability of police services* ................................................................... 120 .......... n ..........3.0 Finland .....................................................6.7Business costs of crime and violence* ...................................................... 90 .......... n ..........4.2 Qatar ........................................................6.8Business costs of terrorism* ................................................................... 104 .......... n ..........4.7 Slovenia ...................................................6.7Homicide cases/100,000 pop. ................................................................. 89 .......... n ..........6.5 Hong Kong SAR ......................................0.2Index of terrorism incidence (1-7) ............................................................. 75 .......... n ..........7.0 Multiple economies (48) ...........................7.0
© 2014 World Economic Forum

Country/Economy Profiles
188 | The Global Enabling Trade Report 2014
* From the list of factors above, respondents were asked to select the five most problematic for trading in their country and to rank them between 1 (most problematic) and 5. The bars in the figure show the responses weighted according to their rankings.
For methodology, indicator descriptions and sources, and for a list of multiple best-performing economies, see page 45.
0 105 15 20 25 30
0 5 10 15 20 25 30
2
3
4
5
6
7
Operating environment
Availability & use of ICTs
Availability & quality of transport services
Availability & quality of transport infrastructure
Efficiency & transparency of border administration
Foreign market access
Domestic market access
1
Enabling Trade Index 2014 Rank Score (out of 138) (1–7)
Enabling Trade Index 2014 .................... 98 ..... 3.6
Subindex A: Market access (25%) ....................39 .......4.1Pillar 1: Domestic market access ................................... 121 .........3.4Pillar 2: Foreign market access ..........................................4 .........4.7
Subindex B: Border administration (25%) ...... 114 .......3.4Pillar 3: Efficiency & transparency of border administration ................................................. 114 .........3.4
Subindex C: Infrastructure (25%) .................... 115 .......2.9Pillar 4: Availability & quality of transport infrastructure ...91 .........2.8Pillar 5: Availability & quality of transport services ......... 107 ........ 3.5Pillar 6: Availability & use of ICTs ...................................122 .........2.3
Subindex D: Operating environment (25%) ......68 .......4.2Pillar 7: Operating environment ........................................68 ........ 4.2
Key indicators, 2012 Rank/138
Population (millions) .............................................................. 6.6 ........... 90GDP (US$ billions) ................................................................ 9.2 ......... 122GDP per capita (US$) .....................................................1,379.9 ......... 108
Merchandise tradeTrade openness (imports+exports)/GDP ............................ 54.8 ........... 91Share of world trade (%) ......................................................0.01 ......... 125Total Exports (US$ billions) ................................................... 2.3 ..........116Total Imports (US$ billions) ....................................................2.5 ......... 129
The most problematic factors for trade, 2013Most problematic factors for exporting Score*
Identifying potential markets and buyers .............................................................. 22.5Difficulties in meeting quality/quantity requirements of buyers ..............................12.6Inappropriate production technology and skills .....................................................11.6Access to trade finance .......................................................................................... 9.6Access to imported inputs at competitive prices ................................................... 8.9High cost or delays caused by international transportation ....................................7.9High cost or delays caused by domestic transportation ........................................ 6.4Burdensome procedures at foreign borders .......................................................... 5.4Technical requirements and standards abroad ...................................................... 5.2Corruption at foreign borders ................................................................................. 4.2Tariff barriers abroad .............................................................................................. 3.7Rules of origin requirements abroad ....................................................................... 2.0
Most problematic factors for importing Score*
Tariffs .................................................................................................................... 20.5Burdensome import procedures ........................................................................... 17.9Corruption at the border ........................................................................................15.8High cost or delays caused by international transportation ..................................14.3Inappropriate telecommunications infrastructure ..................................................11.9Domestic technical requirements and standards ..................................................11.0High cost or delays caused by domestic transportation ........................................ 8.4Crime and theft ....................................................................................................... 0.2
Lao PDR
Sources: International Monetary Fund, World Bank, World Trade Organization, United Nations COMTRADE
Lao PDR Land-Locked, Least Developed Countries
Developing Asia
© 2014 World Economic Forum

Country/Economy Profiles
The Global Enabling Trade Report 2014 | 189
* Indicator derived from the World Economic Forum’s Executive Opinion Survey and measured on a 1-to-7 scale, where 7 indicates best outcome.
The Enabling Trade Index 2014 in detail n Competitive Advantage n Competitive Disadvantage
For methodology, indicator descriptions and sources, and for a list of multiple best-performing economies, see page 45. Lao PDR
INDICATOR, UNITS RANK/138 VALUE BEST PERFORMER VALUE
Pillar 1: Domestic market access (1–7) ......................................................... 121 ...........................3.4 Multiple economies (2) ................................ 7.0 1.01 Tariff rate (%)............................................................................................. 89 .......... n ..........8.5 Multiple economies (2) .............................0.0 1.02 Complexity of tariffs index (1–7) ................................................................ 75 .......... n ..........5.6 Multiple economies (2) .............................7.0
Tariff dispersion (standard deviation) ......................................................... 51 .......... n ..........8.1 Multiple economies (2) .............................0.0Tariff peaks (% of tariff lines) ..................................................................... 99 .......... n ........10.1 Multiple economies (24) ...........................0.0Specific tariffs (% of tariff lines) ................................................................... 1 .......... n ..........0.0 Multiple economies (54) ...........................0.0Number of distinct tariffs ........................................................................... 28 .......... n .............7 Multiple economies (2) ................................1
1.03 Share of duty-free imports (%) ................................................................ 134 .......... n ..........1.4 Multiple economies (2) .........................100.0
Pillar 2: Foreign market access (1–7) ................................................................ 4 ...........................4.7 Cambodia ..................................................... 5.3 2.01 Tariffs faced (%) .......................................................................................... 3 .......... n ..........3.8 Chile .........................................................3.5 2.02 Index of margin of preference in destination mkts (0–100) ........................ 57 .......... n ........34.5 Mauritius ................................................97.1
Pillar 3: Efficiency and transparency of border administration (1–7) ............ 114 ...........................3.4 Singapore..................................................... 6.3 3.01 Customs services index (0–1) .................................................................. n/a ........................n/a Singapore...............................................0.97 3.02 Efficiency of the clearance process (1–5) .................................................. 95 .......... n ..........2.4 Norway ....................................................4.2 3.03 No. of days to import ............................................................................... 99 .......... n ...........26 Singapore....................................................4 3.04 No. of documents to import ................................................................... 115 .......... n ...........10 Multiple economies (2) ................................2 3.05 Cost to import (US$ per container) ......................................................... 103 .......... n ......1,910 Singapore................................................440 3.06 No. of days to export.............................................................................. 101 .......... n ...........23 Multiple economies (5) ................................6 3.07 No. of documents to export ................................................................... 130 .......... n ...........10 Multiple economies (2) ................................2 3.08 Cost to export (US$ per container) ......................................................... 114 .......... n ......1,950 Malaysia ..................................................450 3.09 Irregular payments in exports and imports*............................................. 101 .......... n ..........2.8 New Zealand ............................................6.6 3.10 Time predictability of import procedures* .................................................. 66 .......... n ..........3.9 Finland .....................................................6.0 3.11 Customs transparency index (0–1) .......................................................... n/a ........................n/a Multiple economies (35) .........................1.00
Pillar 4: Availability and quality of transport infrastructure (1-7) ..................... 91 ...........................2.8 United Arab Emirates ................................... 6.5 4.01 Available int’l airline seat km/week, millions ............................................ 122 .......... n ........17.6 United States ..................................11,481.7 4.02 Quality of air transport infrastructure* ........................................................ 71 .......... n ..........4.3 Singapore.................................................6.8 4.03 Quality of railroad infrastructure* .............................................................. n/a ........................n/a Japan .......................................................6.7 4.04 Liner Shipping Connectivity Index (0–157.1) ............................................ n/a ........................n/a China ...................................................157.5 4.05 Quality of port infrastructure* .................................................................. 128 .......... n ..........2.6 Netherlands ..............................................6.8 4.06 Paved roads (% of total) ......................................................................... 117 .......... n ........13.7 Multiple economies (18) .......................100.0 4.07 Quality of roads* ....................................................................................... 60 .......... n ..........4.2 United Arab Emirates ...............................6.6
Pillar 5: Availability and quality of transport services (1–7) .......................... 107 ...........................3.5 Singapore..................................................... 5.7 5.01 Ease and affordability of shipment (1–5).................................................. 115 .......... n ..........2.5 Luxembourg .............................................3.8 5.02 Logistics competence (1–5) .................................................................... 124 .......... n ..........2.3 Norway ....................................................4.2 5.03 Tracking and tracing ability (1–5) ............................................................. 132 .......... n ..........2.2 Germany ..................................................4.2 5.04 Timeliness of shipments in reaching destination (1–5) ............................. 127 .......... n ..........2.7 Luxembourg .............................................4.7 5.05 Postal services efficiency* ......................................................................... 58 .......... n ..........4.8 Japan .......................................................6.8 5.06 Efficiency of transport mode change* ....................................................... 70 .......... n ..........4.0 Hong Kong SAR ......................................6.4
Pillar 6: Availability and use of ICTs (1–7) ...................................................... 122 ...........................2.3 Sweden ........................................................ 6.5 6.01 Mobile phone subscriptions/100 pop. .................................................... 119 .......... n ........64.7 Hong Kong SAR ..................................229.2 6.02 Individuals using Internet (%) .................................................................. 114 .......... n ........10.7 Iceland ...................................................96.2 6.03 Fixed broadband Internet subscriptions/100 pop. .................................. 117 .......... n ..........0.1 Switzerland ............................................39.9 6.04 Active mobile broadband Internet subscriptions/100 pop. ...................... 108 .......... n ..........2.1 Singapore.............................................124.5 6.05 ICT use for business-to-business transactions* ........................................ 93 .......... n ..........4.5 Finland .....................................................6.2 6.06 Internet use for business-to-consumer transactions* ................................ 92 .......... n ..........4.1 United Kingdom .......................................6.3 6.07 Government Online Service Index (0–1) .................................................. 123 .......... n ........0.22 Multiple economies (3) ...........................1.00
Pillar 7: Operating environment (1–7) .............................................................. 68 ...........................4.2 Hong Kong SAR ............................................ 5.8 7.01 Protection of property index (1–7) ............................................................. 71 .......... n ..........3.8 Finland .....................................................6.3
Property rights* ......................................................................................... 79 .......... n ..........3.9 Finland .....................................................6.4Intellectual property protection* ................................................................ 59 .......... n ..........3.8 Finland .....................................................6.2
7.02 Efficiency and accountability of public institutions index (1–7) ................... 80 .......... n ..........3.4 Singapore.................................................6.0Judicial efficiency & impartiality in commercial disputes (0–4).................. 106 .......... n ..........1.3 Multiple economies (7) .............................4.0Diversion of public funds* ......................................................................... 49 .......... n ..........3.7 New Zealand ............................................6.5Ease of compliance with government regulation* ...................................... 50 .......... n ..........3.7 Singapore.................................................5.4
7.03 Access to finance index (1–7) .................................................................. 53 .......... n ..........4.0 Hong Kong SAR ......................................5.7Affordability of financial services* ............................................................. 43 .......... n ..........4.5 Hong Kong SAR ......................................6.1Availability of financial services* ................................................................ 74 .......... n ..........4.4 Switzerland ..............................................6.4Ease of access to loans* .......................................................................... 38 .......... n ..........3.3 Qatar ........................................................4.9Availability of trade finance* ...................................................................... 77 .......... n ..........3.7 Hong Kong SAR ......................................5.8
7.04 Openness to foreign participation index (1–7) ......................................... 109 .......... n ..........3.8 Ireland ......................................................5.5Ease of hiring foreign labour* .................................................................... 81 .......... n ..........3.9 United Arab Emirates ...............................5.6Business impact of rules on FDI* .............................................................. 31 .......... n ..........5.0 Ireland ......................................................6.7Openness to multilateral trade rules (0–100) ........................................... 126 .......... n ........38.9 Slovenia .................................................92.2
7.05 Index of physical security (1–7) ................................................................. 53 .......... n ..........5.8 Qatar ........................................................6.8Reliability of police services* ..................................................................... 62 .......... n ..........4.3 Finland .....................................................6.7Business costs of crime and violence* ...................................................... 54 .......... n ..........5.0 Qatar ........................................................6.8Business costs of terrorism* ..................................................................... 65 .......... n ..........5.5 Slovenia ...................................................6.7Homicide cases/100,000 pop. ................................................................. 80 .......... n ..........4.6 Hong Kong SAR ......................................0.2Index of terrorism incidence (1-7) ............................................................. 49 .......... n ..........7.0 Multiple economies (48) ...........................7.0
© 2014 World Economic Forum

Country/Economy Profiles
190 | The Global Enabling Trade Report 2014
* From the list of factors above, respondents were asked to select the five most problematic for trading in their country and to rank them between 1 (most problematic) and 5. The bars in the figure show the responses weighted according to their rankings.
For methodology, indicator descriptions and sources, and for a list of multiple best-performing economies, see page 45.
0 105 15 20 25 30
0 5 10 15 20 25 30
2
3
4
5
6
7
Operating environment
Availability & use of ICTs
Availability & quality of transport services
Availability & quality of transport infrastructure
Efficiency & transparency of border administration
Foreign market access
Domestic market access
1
Enabling Trade Index 2014 Rank Score (out of 138) (1–7)
Enabling Trade Index 2014 .....................41 ..... 4.4
Subindex A: Market access (25%) ....................75 .......3.4Pillar 1: Domestic market access .....................................46 .........4.9Pillar 2: Foreign market access ........................................97 .........1.9
Subindex B: Border administration (25%) ........30 .......5.3Pillar 3: Efficiency & transparency of border administration ...................................................30 ........ 5.3
Subindex C: Infrastructure (25%) ......................41 .......4.4Pillar 4: Availability & quality of transport infrastructure ...73 ........ 3.3Pillar 5: Availability & quality of transport services ...........32 ........ 4.8Pillar 6: Availability & use of ICTs .....................................32 ........ 5.2
Subindex D: Operating environment (25%) ......44 .......4.5Pillar 7: Operating environment ........................................44 ........ 4.5
Key indicators, 2012 Rank/138
Population (millions) ...............................................................2.0 ......... 124GDP (US$ billions) .............................................................. 28.4 ........... 87GDP per capita (US$) .................................................. 13,899.9 ........... 45
Merchandise tradeTrade openness (imports+exports)/GDP .......................... 109.2 ........... 24Share of world trade (%) ..................................................... 0.08 ........... 76Total Exports (US$ billions) .................................................. 14.1 ........... 75Total Imports (US$ billions) .................................................. 17.2 ........... 81
Value chain indicators, 2012Share (%) of merchandise trade Exports Imports
Capital goods ..................................................................... 9.6 ........ 15.4
Intermediate goods .......................................................... 56.4 ........ 44.1Food and beverages (industrial) ......................................7.2 .......... 2.3Industrial supplies (primary and processed) ................ 40.3 ........ 28.0Parts and accessories .................................................... 5.9 ...........7.4Fuels and lubricants ....................................................... 3.0 .......... 6.4
Consumer goods .............................................................. 26.3 ........25.5Food and beverages (consumer) ...................................12.3 ........ 10.4Transport equipment and consumer goods ..................14.0 .........15.1
Passenger motor cars ........................................................ 2.1 .......... 3.1
Others .................................................................................. 5.6 ........ 11.9
The most problematic factors for trade, 2013Most problematic factors for exporting Score*
Identifying potential markets and buyers ............................................................... 17.6Access to trade finance .........................................................................................12.4Difficulties in meeting quality/quantity requirements of buyers ..............................11.6Access to imported inputs at competitive prices ..................................................10.9Inappropriate production technology and skills ...................................................... 8.6Technical requirements and standards abroad .......................................................7.8Burdensome procedures at foreign borders ...........................................................7.4Tariff barriers abroad .............................................................................................. 6.6Corruption at foreign borders ................................................................................. 5.0High cost or delays caused by international transportation ................................... 4.5Rules of origin requirements abroad ....................................................................... 4.0High cost or delays caused by domestic transportation ........................................ 3.6
Most problematic factors for importing Score*
Domestic technical requirements and standards ..................................................21.5Burdensome import procedures ...........................................................................19.9High cost or delays caused by international transportation ..................................18.7Tariffs ..................................................................................................................... 17.8High cost or delays caused by domestic transportation ........................................ 9.5Corruption at the border ..........................................................................................7.9Inappropriate telecommunications infrastructure ................................................... 2.4Crime and theft ....................................................................................................... 2.3
Latvia
Sources: International Monetary Fund, World Bank, World Trade Organization, United Nations COMTRADE
Latvia
Central and Eastern Europe
© 2014 World Economic Forum
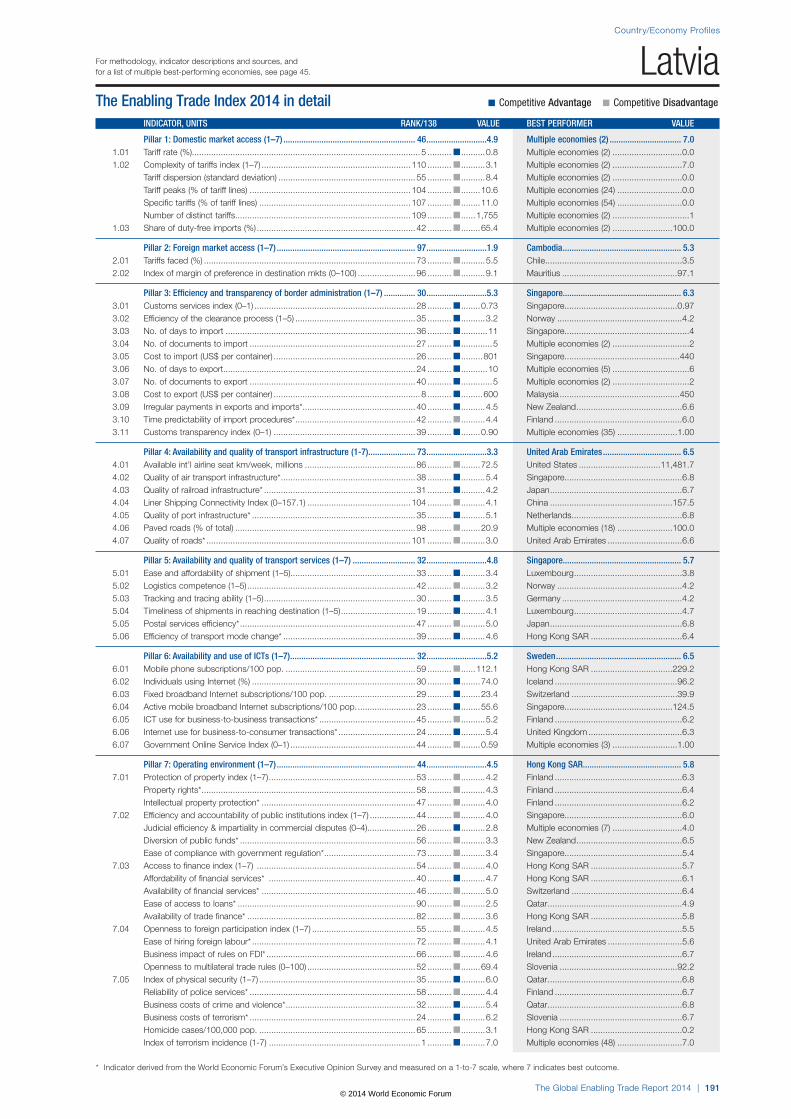
Country/Economy Profiles
The Global Enabling Trade Report 2014 | 191
* Indicator derived from the World Economic Forum’s Executive Opinion Survey and measured on a 1-to-7 scale, where 7 indicates best outcome.
The Enabling Trade Index 2014 in detail n Competitive Advantage n Competitive Disadvantage
For methodology, indicator descriptions and sources, and for a list of multiple best-performing economies, see page 45. Latvia
INDICATOR, UNITS RANK/138 VALUE BEST PERFORMER VALUE
Pillar 1: Domestic market access (1–7) ........................................................... 46 ...........................4.9 Multiple economies (2) ................................ 7.0 1.01 Tariff rate (%)............................................................................................... 5 .......... n ..........0.8 Multiple economies (2) .............................0.0 1.02 Complexity of tariffs index (1–7) .............................................................. 110 .......... n ..........3.1 Multiple economies (2) .............................7.0
Tariff dispersion (standard deviation) ......................................................... 55 .......... n ..........8.4 Multiple economies (2) .............................0.0Tariff peaks (% of tariff lines) ................................................................... 104 .......... n ........10.6 Multiple economies (24) ...........................0.0Specific tariffs (% of tariff lines) ............................................................... 107 .......... n ........11.0 Multiple economies (54) ...........................0.0Number of distinct tariffs ......................................................................... 109 .......... n ......1,755 Multiple economies (2) ................................1
1.03 Share of duty-free imports (%) .................................................................. 42 .......... n ........65.4 Multiple economies (2) .........................100.0
Pillar 2: Foreign market access (1–7) .............................................................. 97 ...........................1.9 Cambodia ..................................................... 5.3 2.01 Tariffs faced (%) ........................................................................................ 73 .......... n ..........5.5 Chile .........................................................3.5 2.02 Index of margin of preference in destination mkts (0–100) ........................ 96 .......... n ..........9.1 Mauritius ................................................97.1
Pillar 3: Efficiency and transparency of border administration (1–7) .............. 30 ...........................5.3 Singapore..................................................... 6.3 3.01 Customs services index (0–1) ................................................................... 28 .......... n ........0.73 Singapore...............................................0.97 3.02 Efficiency of the clearance process (1–5) .................................................. 35 .......... n ..........3.2 Norway ....................................................4.2 3.03 No. of days to import ............................................................................... 36 .......... n ...........11 Singapore....................................................4 3.04 No. of documents to import ..................................................................... 27 .......... n .............5 Multiple economies (2) ................................2 3.05 Cost to import (US$ per container) ........................................................... 26 .......... n .........801 Singapore................................................440 3.06 No. of days to export................................................................................ 24 .......... n ...........10 Multiple economies (5) ................................6 3.07 No. of documents to export ..................................................................... 40 .......... n .............5 Multiple economies (2) ................................2 3.08 Cost to export (US$ per container) ............................................................. 8 .......... n .........600 Malaysia ..................................................450 3.09 Irregular payments in exports and imports*............................................... 40 .......... n ..........4.5 New Zealand ............................................6.6 3.10 Time predictability of import procedures* .................................................. 42 .......... n ..........4.4 Finland .....................................................6.0 3.11 Customs transparency index (0–1) ........................................................... 39 .......... n ........0.90 Multiple economies (35) .........................1.00
Pillar 4: Availability and quality of transport infrastructure (1-7) ..................... 73 ...........................3.3 United Arab Emirates ................................... 6.5 4.01 Available int’l airline seat km/week, millions .............................................. 86 .......... n ........72.5 United States ..................................11,481.7 4.02 Quality of air transport infrastructure* ........................................................ 38 .......... n ..........5.4 Singapore.................................................6.8 4.03 Quality of railroad infrastructure* ............................................................... 31 .......... n ..........4.2 Japan .......................................................6.7 4.04 Liner Shipping Connectivity Index (0–157.1) ........................................... 104 .......... n ..........4.1 China ...................................................157.5 4.05 Quality of port infrastructure* .................................................................... 35 .......... n ..........5.1 Netherlands ..............................................6.8 4.06 Paved roads (% of total) ........................................................................... 98 .......... n ........20.9 Multiple economies (18) .......................100.0 4.07 Quality of roads* ..................................................................................... 101 .......... n ..........3.0 United Arab Emirates ...............................6.6
Pillar 5: Availability and quality of transport services (1–7) ............................ 32 ...........................4.8 Singapore..................................................... 5.7 5.01 Ease and affordability of shipment (1–5).................................................... 33 .......... n ..........3.4 Luxembourg .............................................3.8 5.02 Logistics competence (1–5) ...................................................................... 42 .......... n ..........3.2 Norway ....................................................4.2 5.03 Tracking and tracing ability (1–5) ............................................................... 30 .......... n ..........3.5 Germany ..................................................4.2 5.04 Timeliness of shipments in reaching destination (1–5) ............................... 19 .......... n ..........4.1 Luxembourg .............................................4.7 5.05 Postal services efficiency* ......................................................................... 47 .......... n ..........5.0 Japan .......................................................6.8 5.06 Efficiency of transport mode change* ....................................................... 39 .......... n ..........4.6 Hong Kong SAR ......................................6.4
Pillar 6: Availability and use of ICTs (1–7) ........................................................ 32 ...........................5.2 Sweden ........................................................ 6.5 6.01 Mobile phone subscriptions/100 pop. ...................................................... 59 .......... n ......112.1 Hong Kong SAR ..................................229.2 6.02 Individuals using Internet (%) .................................................................... 30 .......... n ........74.0 Iceland ...................................................96.2 6.03 Fixed broadband Internet subscriptions/100 pop. .................................... 29 .......... n ........23.4 Switzerland ............................................39.9 6.04 Active mobile broadband Internet subscriptions/100 pop. ........................ 23 .......... n ........55.6 Singapore.............................................124.5 6.05 ICT use for business-to-business transactions* ........................................ 45 .......... n ..........5.2 Finland .....................................................6.2 6.06 Internet use for business-to-consumer transactions* ................................ 24 .......... n ..........5.4 United Kingdom .......................................6.3 6.07 Government Online Service Index (0–1) .................................................... 44 .......... n ........0.59 Multiple economies (3) ...........................1.00
Pillar 7: Operating environment (1–7) .............................................................. 44 ...........................4.5 Hong Kong SAR ............................................ 5.8 7.01 Protection of property index (1–7) ............................................................. 53 .......... n ..........4.2 Finland .....................................................6.3
Property rights* ......................................................................................... 58 .......... n ..........4.3 Finland .....................................................6.4Intellectual property protection* ................................................................ 47 .......... n ..........4.0 Finland .....................................................6.2
7.02 Efficiency and accountability of public institutions index (1–7) ................... 44 .......... n ..........4.0 Singapore.................................................6.0Judicial efficiency & impartiality in commercial disputes (0–4).................... 26 .......... n ..........2.8 Multiple economies (7) .............................4.0Diversion of public funds* ......................................................................... 56 .......... n ..........3.3 New Zealand ............................................6.5Ease of compliance with government regulation* ...................................... 73 .......... n ..........3.4 Singapore.................................................5.4
7.03 Access to finance index (1–7) .................................................................. 54 .......... n ..........4.0 Hong Kong SAR ......................................5.7Affordability of financial services* ............................................................. 40 .......... n ..........4.7 Hong Kong SAR ......................................6.1Availability of financial services* ................................................................ 46 .......... n ..........5.0 Switzerland ..............................................6.4Ease of access to loans* .......................................................................... 90 .......... n ..........2.5 Qatar ........................................................4.9Availability of trade finance* ...................................................................... 82 .......... n ..........3.6 Hong Kong SAR ......................................5.8
7.04 Openness to foreign participation index (1–7) ........................................... 55 .......... n ..........4.5 Ireland ......................................................5.5Ease of hiring foreign labour* .................................................................... 72 .......... n ..........4.1 United Arab Emirates ...............................5.6Business impact of rules on FDI* .............................................................. 66 .......... n ..........4.6 Ireland ......................................................6.7Openness to multilateral trade rules (0–100) ............................................. 52 .......... n ........69.4 Slovenia .................................................92.2
7.05 Index of physical security (1–7) ................................................................. 35 .......... n ..........6.0 Qatar ........................................................6.8Reliability of police services* ..................................................................... 58 .......... n ..........4.4 Finland .....................................................6.7Business costs of crime and violence* ...................................................... 32 .......... n ..........5.4 Qatar ........................................................6.8Business costs of terrorism* ..................................................................... 24 .......... n ..........6.2 Slovenia ...................................................6.7Homicide cases/100,000 pop. ................................................................. 65 .......... n ..........3.1 Hong Kong SAR ......................................0.2Index of terrorism incidence (1-7) ............................................................... 1 .......... n ..........7.0 Multiple economies (48) ...........................7.0
© 2014 World Economic Forum
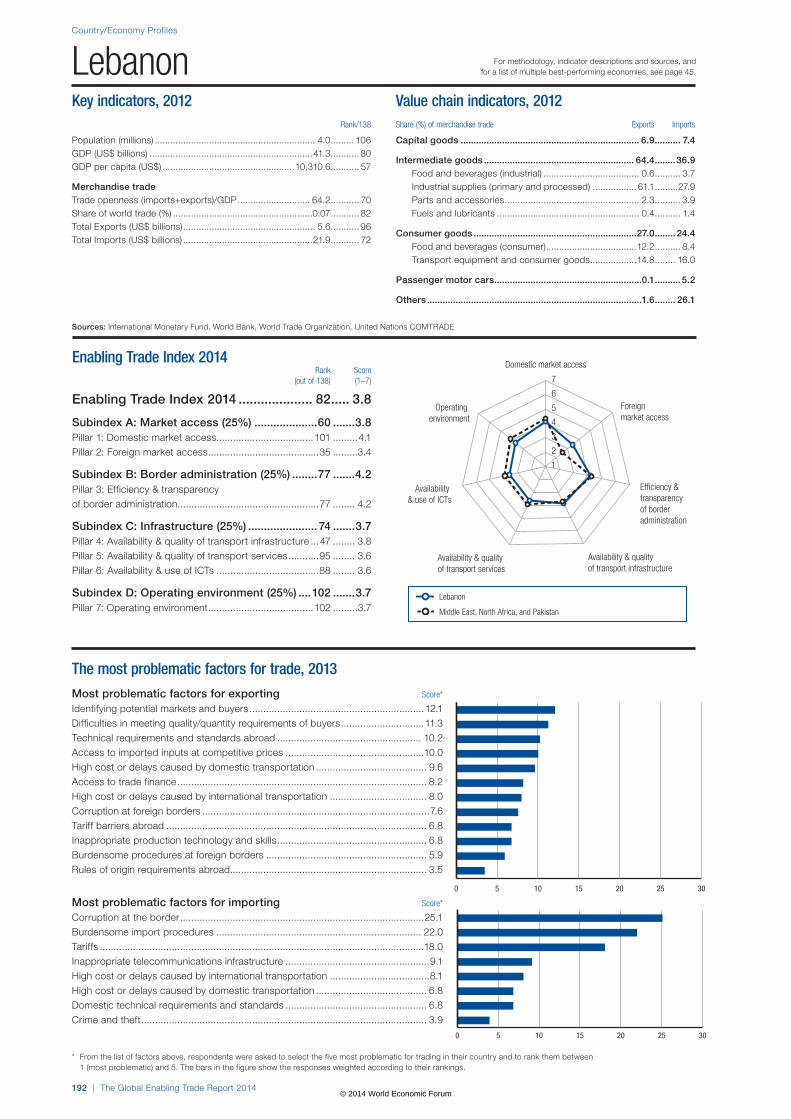
Country/Economy Profiles
192 | The Global Enabling Trade Report 2014
* From the list of factors above, respondents were asked to select the five most problematic for trading in their country and to rank them between 1 (most problematic) and 5. The bars in the figure show the responses weighted according to their rankings.
For methodology, indicator descriptions and sources, and for a list of multiple best-performing economies, see page 45.
0 105 15 20 25 30
0 5 10 15 20 25 30
2
3
4
5
6
7
Operating environment
Availability & use of ICTs
Availability & quality of transport services
Availability & quality of transport infrastructure
Efficiency & transparency of border administration
Foreign market access
Domestic market access
1
Enabling Trade Index 2014 Rank Score (out of 138) (1–7)
Enabling Trade Index 2014 .................... 82 ..... 3.8
Subindex A: Market access (25%) ....................60 .......3.8Pillar 1: Domestic market access ................................... 101 .........4.1Pillar 2: Foreign market access ........................................35 .........3.4
Subindex B: Border administration (25%) ........77 .......4.2Pillar 3: Efficiency & transparency of border administration ...................................................77 ........ 4.2
Subindex C: Infrastructure (25%) ...................... 74 .......3.7Pillar 4: Availability & quality of transport infrastructure ...47 ........ 3.8Pillar 5: Availability & quality of transport services ...........95 ........ 3.6Pillar 6: Availability & use of ICTs .....................................88 ........ 3.6
Subindex D: Operating environment (25%) ....102 .......3.7Pillar 7: Operating environment ......................................102 .........3.7
Key indicators, 2012 Rank/138
Population (millions) .............................................................. 4.0 ......... 106GDP (US$ billions) ...............................................................41.3 ........... 80GDP per capita (US$) ...................................................10,310.6 ........... 57
Merchandise tradeTrade openness (imports+exports)/GDP ............................ 64.2 ........... 70Share of world trade (%) ......................................................0.07 ........... 82Total Exports (US$ billions) ................................................... 5.6 ........... 96Total Imports (US$ billions) ..................................................21.9 ........... 72
Value chain indicators, 2012Share (%) of merchandise trade Exports Imports
Capital goods ..................................................................... 6.9 .......... 7.4
Intermediate goods .......................................................... 64.4 ........36.9Food and beverages (industrial) ..................................... 0.6 .......... 3.7Industrial supplies (primary and processed) ................. 61.1 .........27.9Parts and accessories .................................................... 2.3 .......... 3.9Fuels and lubricants ....................................................... 0.4 .......... 1.4
Consumer goods ...............................................................27.0 ........ 24.4Food and beverages (consumer) ...................................12.2 .......... 8.4Transport equipment and consumer goods ..................14.8 ........ 16.0
Passenger motor cars .........................................................0.1 ..........5.2
Others ...................................................................................1.6 ........ 26.1
The most problematic factors for trade, 2013Most problematic factors for exporting Score*
Identifying potential markets and buyers ...............................................................12.1Difficulties in meeting quality/quantity requirements of buyers ..............................11.3Technical requirements and standards abroad .................................................... 10.2Access to imported inputs at competitive prices ..................................................10.0High cost or delays caused by domestic transportation ........................................ 9.6Access to trade finance .......................................................................................... 8.2High cost or delays caused by international transportation ................................... 8.0Corruption at foreign borders ..................................................................................7.6Tariff barriers abroad .............................................................................................. 6.8Inappropriate production technology and skills ...................................................... 6.8Burdensome procedures at foreign borders .......................................................... 5.9Rules of origin requirements abroad ....................................................................... 3.5
Most problematic factors for importing Score*
Corruption at the border ........................................................................................25.1Burdensome import procedures .......................................................................... 22.0Tariffs .....................................................................................................................18.0Inappropriate telecommunications infrastructure ....................................................9.1High cost or delays caused by international transportation ....................................8.1High cost or delays caused by domestic transportation ........................................ 6.8Domestic technical requirements and standards ................................................... 6.8Crime and theft ....................................................................................................... 3.9
Lebanon
Sources: International Monetary Fund, World Bank, World Trade Organization, United Nations COMTRADE
Lebanon
Middle East, North Africa, and Pakistan
© 2014 World Economic Forum

Country/Economy Profiles
The Global Enabling Trade Report 2014 | 193
* Indicator derived from the World Economic Forum’s Executive Opinion Survey and measured on a 1-to-7 scale, where 7 indicates best outcome.
The Enabling Trade Index 2014 in detail n Competitive Advantage n Competitive Disadvantage
For methodology, indicator descriptions and sources, and for a list of multiple best-performing economies, see page 45. Lebanon
INDICATOR, UNITS RANK/138 VALUE BEST PERFORMER VALUE
Pillar 1: Domestic market access (1–7) ......................................................... 101 ...........................4.1 Multiple economies (2) ................................ 7.0 1.01 Tariff rate (%)............................................................................................. 75 .......... n ..........6.1 Multiple economies (2) .............................0.0 1.02 Complexity of tariffs index (1–7) .............................................................. 100 .......... n ..........4.6 Multiple economies (2) .............................7.0
Tariff dispersion (standard deviation) ....................................................... 116 .......... n ........13.2 Multiple economies (2) .............................0.0Tariff peaks (% of tariff lines) ..................................................................... 92 .......... n ..........9.4 Multiple economies (24) ...........................0.0Specific tariffs (% of tariff lines) ............................................................... 101 .......... n ..........6.4 Multiple economies (54) ...........................0.0Number of distinct tariffs ........................................................................... 97 .......... n .........378 Multiple economies (2) ................................1
1.03 Share of duty-free imports (%) .................................................................. 96 .......... n ........38.3 Multiple economies (2) .........................100.0
Pillar 2: Foreign market access (1–7) .............................................................. 35 ...........................3.4 Cambodia ..................................................... 5.3 2.01 Tariffs faced (%) ........................................................................................ 45 .......... n ..........5.3 Chile .........................................................3.5 2.02 Index of margin of preference in destination mkts (0–100) ........................ 27 .......... n ........51.1 Mauritius ................................................97.1
Pillar 3: Efficiency and transparency of border administration (1–7) .............. 77 ...........................4.2 Singapore..................................................... 6.3 3.01 Customs services index (0–1) ................................................................... 55 .......... n ........0.63 Singapore...............................................0.97 3.02 Efficiency of the clearance process (1–5) ................................................ 113 .......... n ..........2.3 Norway ....................................................4.2 3.03 No. of days to import ............................................................................. 106 .......... n ...........30 Singapore....................................................4 3.04 No. of documents to import ..................................................................... 57 .......... n .............7 Multiple economies (2) ................................2 3.05 Cost to import (US$ per container) ........................................................... 71 .......... n ......1,365 Singapore................................................440 3.06 No. of days to export................................................................................ 96 .......... n ...........22 Multiple economies (5) ................................6 3.07 No. of documents to export ..................................................................... 16 .......... n .............4 Multiple economies (2) ................................2 3.08 Cost to export (US$ per container) ........................................................... 59 .......... n ......1,080 Malaysia ..................................................450 3.09 Irregular payments in exports and imports*............................................. 125 .......... n ..........2.2 New Zealand ............................................6.6 3.10 Time predictability of import procedures* ................................................ 107 .......... n ..........3.3 Finland .....................................................6.0 3.11 Customs transparency index (0–1) ........................................................... 39 .......... n ........0.90 Multiple economies (35) .........................1.00
Pillar 4: Availability and quality of transport infrastructure (1-7) ..................... 47 ...........................3.8 United Arab Emirates ................................... 6.5 4.01 Available int’l airline seat km/week, millions .............................................. 69 .......... n ......148.8 United States ..................................11,481.7 4.02 Quality of air transport infrastructure* ........................................................ 50 .......... n ..........4.9 Singapore.................................................6.8 4.03 Quality of railroad infrastructure* .............................................................. n/a ........................n/a Japan .......................................................6.7 4.04 Liner Shipping Connectivity Index (0–157.1) ............................................. 28 .......... n ........43.2 China ...................................................157.5 4.05 Quality of port infrastructure* .................................................................... 59 .......... n ..........4.3 Netherlands ..............................................6.8 4.06 Paved roads (% of total) ........................................................................... 39 .......... n ........84.9 Multiple economies (18) .......................100.0 4.07 Quality of roads* ..................................................................................... 114 .......... n ..........2.7 United Arab Emirates ...............................6.6
Pillar 5: Availability and quality of transport services (1–7) ............................ 95 ...........................3.6 Singapore..................................................... 5.7 5.01 Ease and affordability of shipment (1–5).................................................. 114 .......... n ..........2.5 Luxembourg .............................................3.8 5.02 Logistics competence (1–5) ...................................................................... 66 .......... n ..........2.9 Norway ....................................................4.2 5.03 Tracking and tracing ability (1–5) ............................................................... 44 .......... n ..........3.2 Germany ..................................................4.2 5.04 Timeliness of shipments in reaching destination (1–5) ............................. 106 .......... n ..........2.9 Luxembourg .............................................4.7 5.05 Postal services efficiency* ......................................................................... 95 .......... n ..........3.8 Japan .......................................................6.8 5.06 Efficiency of transport mode change* ..................................................... 129 .......... n ..........2.7 Hong Kong SAR ......................................6.4
Pillar 6: Availability and use of ICTs (1–7) ........................................................ 88 ...........................3.6 Sweden ........................................................ 6.5 6.01 Mobile phone subscriptions/100 pop. .................................................... 107 .......... n ........80.8 Hong Kong SAR ..................................229.2 6.02 Individuals using Internet (%) .................................................................... 45 .......... n ........61.3 Iceland ...................................................96.2 6.03 Fixed broadband Internet subscriptions/100 pop. .................................... 59 .......... n ..........9.7 Switzerland ............................................39.9 6.04 Active mobile broadband Internet subscriptions/100 pop. ........................ 58 .......... n ........27.7 Singapore.............................................124.5 6.05 ICT use for business-to-business transactions* ...................................... 127 .......... n ..........3.7 Finland .....................................................6.2 6.06 Internet use for business-to-consumer transactions* .............................. 132 .......... n ..........3.0 United Kingdom .......................................6.3 6.07 Government Online Service Index (0–1) .................................................... 73 .......... n ........0.48 Multiple economies (3) ...........................1.00
Pillar 7: Operating environment (1–7) ............................................................ 102 ...........................3.7 Hong Kong SAR ............................................ 5.8 7.01 Protection of property index (1–7) ........................................................... 107 .......... n ..........3.2 Finland .....................................................6.3
Property rights* ......................................................................................... 78 .......... n ..........3.9 Finland .....................................................6.4Intellectual property protection* .............................................................. 126 .......... n ..........2.4 Finland .....................................................6.2
7.02 Efficiency and accountability of public institutions index (1–7) ................. 125 .......... n ..........2.7 Singapore.................................................6.0Judicial efficiency & impartiality in commercial disputes (0–4).................. 106 .......... n ..........1.3 Multiple economies (7) .............................4.0Diversion of public funds* ....................................................................... 124 .......... n ..........2.2 New Zealand ............................................6.5Ease of compliance with government regulation* .................................... 106 .......... n ..........2.9 Singapore.................................................5.4
7.03 Access to finance index (1–7) .................................................................. 48 .......... n ..........4.0 Hong Kong SAR ......................................5.7Affordability of financial services* ............................................................. 52 .......... n ..........4.3 Hong Kong SAR ......................................6.1Availability of financial services* ................................................................ 59 .......... n ..........4.6 Switzerland ..............................................6.4Ease of access to loans* .......................................................................... 59 .......... n ..........2.9 Qatar ........................................................4.9Availability of trade finance* ...................................................................... 36 .......... n ..........4.3 Hong Kong SAR ......................................5.8
7.04 Openness to foreign participation index (1–7) ......................................... 113 .......... n ..........3.7 Ireland ......................................................5.5Ease of hiring foreign labour* .................................................................. 123 .......... n ..........3.2 United Arab Emirates ...............................5.6Business impact of rules on FDI* ............................................................ 104 .......... n ..........3.9 Ireland ......................................................6.7Openness to multilateral trade rules (0–100) ............................................. 91 .......... n ........58.7 Slovenia .................................................92.2
7.05 Index of physical security (1–7) ................................................................. 98 .......... n ..........4.8 Qatar ........................................................6.8Reliability of police services* ................................................................... 110 .......... n ..........3.2 Finland .....................................................6.7Business costs of crime and violence* ...................................................... 89 .......... n ..........4.2 Qatar ........................................................6.8Business costs of terrorism* ................................................................... 131 .......... n ..........3.2 Slovenia ...................................................6.7Homicide cases/100,000 pop. ................................................................. 55 .......... n ..........2.2 Hong Kong SAR ......................................0.2Index of terrorism incidence (1-7) ........................................................... 118 .......... n ..........6.4 Multiple economies (48) ...........................7.0
© 2014 World Economic Forum

Country/Economy Profiles
194 | The Global Enabling Trade Report 2014
* From the list of factors above, respondents were asked to select the five most problematic for trading in their country and to rank them between 1 (most problematic) and 5. The bars in the figure show the responses weighted according to their rankings.
For methodology, indicator descriptions and sources, and for a list of multiple best-performing economies, see page 45.
0 105 15 20 25 30
0 5 10 15 20 25 30
2
3
4
5
6
7
Operating environment
Availability & use of ICTs
Availability & quality of transport services
Availability & quality of transport infrastructure
Efficiency & transparency of border administration
Foreign market access
Domestic market access
1
Enabling Trade Index 2014 Rank Score (out of 138) (1–7)
Enabling Trade Index 2014 ...................108 ..... 3.5
Subindex A: Market access (25%) ....................47 .......3.9Pillar 1: Domestic market access ...................................102 .........4.1Pillar 2: Foreign market access ........................................23 .........3.7
Subindex B: Border administration (25%) ......104 .......3.6Pillar 3: Efficiency & transparency of border administration .................................................104 ........ 3.6
Subindex C: Infrastructure (25%) .................... 117 .......2.8Pillar 4: Availability & quality of transport infrastructure ...97 .........2.7Pillar 5: Availability & quality of transport services .........120 ........ 3.3Pillar 6: Availability & use of ICTs ................................... 119 .........2.4
Subindex D: Operating environment (25%) ......98 .......3.7Pillar 7: Operating environment ........................................98 .........3.7
Key indicators, 2012 Rank/138
Population (millions) ...............................................................1.9 ......... 125GDP (US$ billions) .................................................................2.5 ......... 135GDP per capita (US$) .....................................................1,294.3 ..........110
Merchandise tradeTrade openness (imports+exports)/GDP ...........................151.2 ........... 10Share of world trade (%) ......................................................0.01 ......... 129Total Exports (US$ billions) ....................................................1.1 ......... 130Total Imports (US$ billions) ....................................................2.6 ......... 128
The most problematic factors for trade, 2013Most problematic factors for exporting Score*
Access to trade finance ........................................................................................ 22.5Identifying potential markets and buyers ...............................................................11.4Difficulties in meeting quality/quantity requirements of buyers ..............................10.3Corruption at foreign borders ................................................................................. 9.5Inappropriate production technology and skills ...................................................... 8.0Burdensome procedures at foreign borders ...........................................................7.6Rules of origin requirements abroad ....................................................................... 6.7Tariff barriers abroad .............................................................................................. 6.5Access to imported inputs at competitive prices ................................................... 6.3High cost or delays caused by international transportation ................................... 4.8High cost or delays caused by domestic transportation ........................................ 4.6Technical requirements and standards abroad .......................................................1.9
Most problematic factors for importing Score*
Corruption at the border ........................................................................................19.6Burdensome import procedures ...........................................................................19.2Inappropriate telecommunications infrastructure ..................................................16.1Tariffs .....................................................................................................................12.4High cost or delays caused by international transportation ................................. 10.2Crime and theft ....................................................................................................... 9.0Domestic technical requirements and standards ................................................... 6.9High cost or delays caused by domestic transportation ........................................ 6.6
Lesotho
Sources: International Monetary Fund, World Bank, World Trade Organization, United Nations COMTRADE
Lesotho Land-Locked, Least Developed Countries
Sub-Saharan Africa
© 2014 World Economic Forum

Country/Economy Profiles
The Global Enabling Trade Report 2014 | 195
* Indicator derived from the World Economic Forum’s Executive Opinion Survey and measured on a 1-to-7 scale, where 7 indicates best outcome.
The Enabling Trade Index 2014 in detail n Competitive Advantage n Competitive Disadvantage
For methodology, indicator descriptions and sources, and for a list of multiple best-performing economies, see page 45. Lesotho
INDICATOR, UNITS RANK/138 VALUE BEST PERFORMER VALUE
Pillar 1: Domestic market access (1–7) ......................................................... 102 ...........................4.1 Multiple economies (2) ................................ 7.0 1.01 Tariff rate (%)............................................................................................. 76 .......... n ..........6.1 Multiple economies (2) .............................0.0 1.02 Complexity of tariffs index (1–7) ................................................................ 90 .......... n ..........4.9 Multiple economies (2) .............................7.0
Tariff dispersion (standard deviation) ....................................................... 101 .......... n ........11.6 Multiple economies (2) .............................0.0Tariff peaks (% of tariff lines) ..................................................................... 95 .......... n ..........9.7 Multiple economies (24) ...........................0.0Specific tariffs (% of tariff lines) ................................................................. 90 .......... n ..........3.8 Multiple economies (54) ...........................0.0Number of distinct tariffs ........................................................................... 90 .......... n .........309 Multiple economies (2) ................................1
1.03 Share of duty-free imports (%) ................................................................ 100 .......... n ........32.1 Multiple economies (2) .........................100.0
Pillar 2: Foreign market access (1–7) .............................................................. 23 ...........................3.7 Cambodia ..................................................... 5.3 2.01 Tariffs faced (%) ........................................................................................ 69 .......... n ..........5.4 Chile .........................................................3.5 2.02 Index of margin of preference in destination mkts (0–100) .......................... 5 .......... n ........67.2 Mauritius ................................................97.1
Pillar 3: Efficiency and transparency of border administration (1–7) ............ 104 ...........................3.6 Singapore..................................................... 6.3 3.01 Customs services index (0–1) .................................................................. n/a ........................n/a Singapore...............................................0.97 3.02 Efficiency of the clearance process (1–5) ................................................ 118 .......... n ..........2.2 Norway ....................................................4.2 3.03 No. of days to import ............................................................................. 114 .......... n ...........33 Singapore....................................................4 3.04 No. of documents to import ..................................................................... 57 .......... n .............7 Multiple economies (2) ................................2 3.05 Cost to import (US$ per container) ......................................................... 104 .......... n ......1,945 Singapore................................................440 3.06 No. of days to export.............................................................................. 120 .......... n ...........31 Multiple economies (5) ................................6 3.07 No. of documents to export ..................................................................... 85 .......... n .............7 Multiple economies (2) ................................2 3.08 Cost to export (US$ per container) ......................................................... 107 .......... n ......1,695 Malaysia ..................................................450 3.09 Irregular payments in exports and imports*............................................... 71 .......... n ..........3.6 New Zealand ............................................6.6 3.10 Time predictability of import procedures* .................................................. 72 .......... n ..........3.8 Finland .....................................................6.0 3.11 Customs transparency index (0–1) .......................................................... n/a ........................n/a Multiple economies (35) .........................1.00
Pillar 4: Availability and quality of transport infrastructure (1-7) ..................... 97 ...........................2.7 United Arab Emirates ................................... 6.5 4.01 Available int’l airline seat km/week, millions ............................................ 138 .......... n ..........0.3 United States ..................................11,481.7 4.02 Quality of air transport infrastructure* ...................................................... 135 .......... n ..........2.3 Singapore.................................................6.8 4.03 Quality of railroad infrastructure* .............................................................. n/a ........................n/a Japan .......................................................6.7 4.04 Liner Shipping Connectivity Index (0–157.1) ............................................ n/a ........................n/a China ...................................................157.5 4.05 Quality of port infrastructure* .................................................................. 118 .......... n ..........2.9 Netherlands ..............................................6.8 4.06 Paved roads (% of total) ........................................................................... 66 .......... n ........53.0 Multiple economies (18) .......................100.0 4.07 Quality of roads* ..................................................................................... 106 .......... n ..........2.9 United Arab Emirates ...............................6.6
Pillar 5: Availability and quality of transport services (1–7) .......................... 120 ...........................3.3 Singapore..................................................... 5.7 5.01 Ease and affordability of shipment (1–5).................................................. 118 .......... n ..........2.5 Luxembourg .............................................3.8 5.02 Logistics competence (1–5) .................................................................... 128 .......... n ..........2.2 Norway ....................................................4.2 5.03 Tracking and tracing ability (1–5) ............................................................. 123 .......... n ..........2.4 Germany ..................................................4.2 5.04 Timeliness of shipments in reaching destination (1–5) ............................. 129 .......... n ..........2.6 Luxembourg .............................................4.7 5.05 Postal services efficiency* ......................................................................... 81 .......... n ..........4.2 Japan .......................................................6.8 5.06 Efficiency of transport mode change* ..................................................... 107 .......... n ..........3.3 Hong Kong SAR ......................................6.4
Pillar 6: Availability and use of ICTs (1–7) ...................................................... 119 ...........................2.4 Sweden ........................................................ 6.5 6.01 Mobile phone subscriptions/100 pop. .................................................... 112 .......... n ........75.3 Hong Kong SAR ..................................229.2 6.02 Individuals using Internet (%) .................................................................. 124 .......... n ..........4.6 Iceland ...................................................96.2 6.03 Fixed broadband Internet subscriptions/100 pop. .................................. 123 .......... n ..........0.1 Switzerland ............................................39.9 6.04 Active mobile broadband Internet subscriptions/100 pop. ........................ 87 .......... n ..........7.4 Singapore.............................................124.5 6.05 ICT use for business-to-business transactions* ...................................... 134 .......... n ..........3.5 Finland .....................................................6.2 6.06 Internet use for business-to-consumer transactions* .............................. 129 .......... n ..........3.1 United Kingdom .......................................6.3 6.07 Government Online Service Index (0–1) .................................................. 112 .......... n ........0.30 Multiple economies (3) ...........................1.00
Pillar 7: Operating environment (1–7) .............................................................. 98 ...........................3.7 Hong Kong SAR ............................................ 5.8 7.01 Protection of property index (1–7) ........................................................... 100 .......... n ..........3.3 Finland .....................................................6.3
Property rights* ....................................................................................... 116 .......... n ..........3.3 Finland .....................................................6.4Intellectual property protection* ................................................................ 85 .......... n ..........3.3 Finland .....................................................6.2
7.02 Efficiency and accountability of public institutions index (1–7) ................... 73 .......... n ..........3.5 Singapore.................................................6.0Judicial efficiency & impartiality in commercial disputes (0–4)................... n/a ........................n/a Multiple economies (7) .............................4.0Diversion of public funds* ......................................................................... 60 .......... n ..........3.3 New Zealand ............................................6.5Ease of compliance with government regulation* ...................................... 38 .......... n ..........3.8 Singapore.................................................5.4
7.03 Access to finance index (1–7) ................................................................ 100 .......... n ..........3.4 Hong Kong SAR ......................................5.7Affordability of financial services* ........................................................... 114 .......... n ..........3.5 Hong Kong SAR ......................................6.1Availability of financial services* .............................................................. 123 .......... n ..........3.4 Switzerland ..............................................6.4Ease of access to loans* .......................................................................... 48 .......... n ..........3.1 Qatar ........................................................4.9Availability of trade finance* ...................................................................... 93 .......... n ..........3.4 Hong Kong SAR ......................................5.8
7.04 Openness to foreign participation index (1–7) ........................................... 65 .......... n ..........4.3 Ireland ......................................................5.5Ease of hiring foreign labour* .................................................................... 71 .......... n ..........4.1 United Arab Emirates ...............................5.6Business impact of rules on FDI* .............................................................. 23 .......... n ..........5.1 Ireland ......................................................6.7Openness to multilateral trade rules (0–100) ............................................. 96 .......... n ........56.1 Slovenia .................................................92.2
7.05 Index of physical security (1–7) ............................................................... 119 .......... n ..........4.1 Qatar ........................................................6.8Reliability of police services* ..................................................................... 85 .......... n ..........3.9 Finland .....................................................6.7Business costs of crime and violence* .................................................... 112 .......... n ..........3.5 Qatar ........................................................6.8Business costs of terrorism* ..................................................................... 71 .......... n ..........5.4 Slovenia ...................................................6.7Homicide cases/100,000 pop. ............................................................... 131 .......... n ........35.2 Hong Kong SAR ......................................0.2Index of terrorism incidence (1-7) ............................................................... 1 .......... n ..........7.0 Multiple economies (48) ...........................7.0
© 2014 World Economic Forum

Country/Economy Profiles
196 | The Global Enabling Trade Report 2014
* From the list of factors above, respondents were asked to select the five most problematic for trading in their country and to rank them between 1 (most problematic) and 5. The bars in the figure show the responses weighted according to their rankings.
For methodology, indicator descriptions and sources, and for a list of multiple best-performing economies, see page 45.
0 105 15 20 25 30
0 5 10 15 20 25 30
2
3
4
5
6
7
Operating environment
Availability & use of ICTs
Availability & quality of transport services
Availability & quality of transport infrastructure
Efficiency & transparency of border administration
Foreign market access
Domestic market access
1
Enabling Trade Index 2014 Rank Score (out of 138) (1–7)
Enabling Trade Index 2014 ...................126 ......3.1
Subindex A: Market access (25%) ..................137 .......2.2Pillar 1: Domestic market access ...................................129 ........ 3.3Pillar 2: Foreign market access ......................................136 ......... 1.1
Subindex B: Border administration (25%) ........95 .......3.7Pillar 3: Efficiency & transparency of border administration ...................................................95 .........3.7
Subindex C: Infrastructure (25%) ....................130 .......2.5Pillar 4: Availability & quality of transport infrastructure .132 .........2.1Pillar 5: Availability & quality of transport services ......... 117 .........3.4Pillar 6: Availability & use of ICTs ...................................132 .........2.0
Subindex D: Operating environment (25%) ......78 .......4.0Pillar 7: Operating environment ........................................78 .........4.0
Key indicators, 2012 Rank/138
Population (millions) .............................................................. 4.0 ......... 107GDP (US$ billions) .................................................................1.7 ......... 137GDP per capita (US$) ....................................................... 436.0 ......... 136
Merchandise tradeTrade openness (imports+exports)/GDP ............................ 86.3 ........... 39Share of world trade (%) ..................................................... 0.00 ......... 136Total Exports (US$ billions) ................................................... 0.5 ......... 136Total Imports (US$ billions) ....................................................1.1 ......... 136
The most problematic factors for trade, 2013Most problematic factors for exporting Score*
High cost or delays caused by domestic transportation .......................................19.3Difficulties in meeting quality/quantity requirements of buyers ..............................16.9Identifying potential markets and buyers ...............................................................11.9Inappropriate production technology and skills .....................................................11.5Access to trade finance .........................................................................................11.5Access to imported inputs at competitive prices ................................................... 8.2Technical requirements and standards abroad ...................................................... 5.3Corruption at foreign borders ..................................................................................4.1High cost or delays caused by international transportation ................................... 3.7Rules of origin requirements abroad ....................................................................... 3.3Tariff barriers abroad ...............................................................................................2.1Burdensome procedures at foreign borders ...........................................................2.1
Most problematic factors for importing Score*
Corruption at the border ....................................................................................... 22.6Burdensome import procedures .......................................................................... 22.5Tariffs .....................................................................................................................18.0Crime and theft ......................................................................................................13.3High cost or delays caused by domestic transportation .......................................10.6High cost or delays caused by international transportation ................................... 5.2Domestic technical requirements and standards ................................................... 5.2Inappropriate telecommunications infrastructure ................................................... 2.5
Liberia
Sources: International Monetary Fund, World Bank, World Trade Organization, United Nations COMTRADE
Liberia Least Developed Countries
Sub-Saharan Africa
© 2014 World Economic Forum

Country/Economy Profiles
The Global Enabling Trade Report 2014 | 197
* Indicator derived from the World Economic Forum’s Executive Opinion Survey and measured on a 1-to-7 scale, where 7 indicates best outcome.
The Enabling Trade Index 2014 in detail n Competitive Advantage n Competitive Disadvantage
For methodology, indicator descriptions and sources, and for a list of multiple best-performing economies, see page 45. Liberia
INDICATOR, UNITS RANK/138 VALUE BEST PERFORMER VALUE
Pillar 1: Domestic market access (1–7) ......................................................... 129 ...........................3.3 Multiple economies (2) ................................ 7.0 1.01 Tariff rate (%)........................................................................................... 113 .......... n ........10.9 Multiple economies (2) .............................0.0 1.02 Complexity of tariffs index (1–7) ................................................................ 55 .......... n ..........6.3 Multiple economies (2) .............................7.0
Tariff dispersion (standard deviation) ......................................................... 37 .......... n ..........7.3 Multiple economies (2) .............................0.0Tariff peaks (% of tariff lines) ..................................................................... 55 .......... n ..........1.2 Multiple economies (24) ...........................0.0Specific tariffs (% of tariff lines) ................................................................. 86 .......... n ..........1.8 Multiple economies (54) ...........................0.0Number of distinct tariffs ........................................................................... 79 .......... n .........121 Multiple economies (2) ................................1
1.03 Share of duty-free imports (%) ................................................................ 136 .......... n ..........0.0 Multiple economies (2) .........................100.0
Pillar 2: Foreign market access (1–7) ............................................................ 136 ...........................1.1 Cambodia ..................................................... 5.3 2.01 Tariffs faced (%) ...................................................................................... 138 .......... n ........13.4 Chile .........................................................3.5 2.02 Index of margin of preference in destination mkts (0–100) ...................... 128 .......... n ..........4.6 Mauritius ................................................97.1
Pillar 3: Efficiency and transparency of border administration (1–7) .............. 95 ...........................3.7 Singapore..................................................... 6.3 3.01 Customs services index (0–1) ................................................................... 91 .......... n ........0.42 Singapore...............................................0.97 3.02 Efficiency of the clearance process (1–5) .................................................. 81 .......... n ..........2.6 Norway ....................................................4.2 3.03 No. of days to import ............................................................................. 104 .......... n ...........28 Singapore....................................................4 3.04 No. of documents to import ................................................................... 134 .......... n ...........12 Multiple economies (2) ................................2 3.05 Cost to import (US$ per container) ........................................................... 67 .......... n ......1,320 Singapore................................................440 3.06 No. of days to export................................................................................ 59 .......... n ...........15 Multiple economies (5) ................................6 3.07 No. of documents to export ................................................................... 130 .......... n ...........10 Multiple economies (2) ................................2 3.08 Cost to export (US$ per container) ........................................................... 76 .......... n ......1,220 Malaysia ..................................................450 3.09 Irregular payments in exports and imports*............................................... 99 .......... n ..........2.9 New Zealand ............................................6.6 3.10 Time predictability of import procedures* .................................................. 95 .......... n ..........3.5 Finland .....................................................6.0 3.11 Customs transparency index (0–1) ........................................................... 83 .......... n ........0.70 Multiple economies (35) .........................1.00
Pillar 4: Availability and quality of transport infrastructure (1-7) ................... 132 ...........................2.1 United Arab Emirates ................................... 6.5 4.01 Available int’l airline seat km/week, millions ............................................ 134 .......... n ..........5.0 United States ..................................11,481.7 4.02 Quality of air transport infrastructure* ...................................................... 119 .......... n ..........3.1 Singapore.................................................6.8 4.03 Quality of railroad infrastructure* ............................................................... 88 .......... n ..........2.0 Japan .......................................................6.7 4.04 Liner Shipping Connectivity Index (0–157.1) ............................................. 94 .......... n ..........5.9 China ...................................................157.5 4.05 Quality of port infrastructure* .................................................................. 108 .......... n ..........3.4 Netherlands ..............................................6.8 4.06 Paved roads (% of total) ......................................................................... 136 .......... n ..........6.2 Multiple economies (18) .......................100.0 4.07 Quality of roads* ..................................................................................... 104 .......... n ..........2.9 United Arab Emirates ...............................6.6
Pillar 5: Availability and quality of transport services (1–7) .......................... 117 ...........................3.4 Singapore..................................................... 5.7 5.01 Ease and affordability of shipment (1–5).................................................. 110 .......... n ..........2.6 Luxembourg .............................................3.8 5.02 Logistics competence (1–5) ...................................................................... 71 .......... n ..........2.9 Norway ....................................................4.2 5.03 Tracking and tracing ability (1–5) ............................................................. 102 .......... n ..........2.6 Germany ..................................................4.2 5.04 Timeliness of shipments in reaching destination (1–5) ............................. 131 .......... n ..........2.6 Luxembourg .............................................4.7 5.05 Postal services efficiency* ....................................................................... 112 .......... n ..........3.3 Japan .......................................................6.8 5.06 Efficiency of transport mode change* ..................................................... 114 .......... n ..........3.1 Hong Kong SAR ......................................6.4
Pillar 6: Availability and use of ICTs (1–7) ...................................................... 132 ...........................2.0 Sweden ........................................................ 6.5 6.01 Mobile phone subscriptions/100 pop. .................................................... 126 .......... n ........57.1 Hong Kong SAR ..................................229.2 6.02 Individuals using Internet (%) .................................................................. 128 .......... n ..........3.8 Iceland ...................................................96.2 6.03 Fixed broadband Internet subscriptions/100 pop. .................................. 137 .......... n ..........0.0 Switzerland ............................................39.9 6.04 Active mobile broadband Internet subscriptions/100 pop. ...................... 125 .......... n ..........0.0 Singapore.............................................124.5 6.05 ICT use for business-to-business transactions* ...................................... 123 .......... n ..........3.9 Finland .....................................................6.2 6.06 Internet use for business-to-consumer transactions* .............................. 124 .......... n ..........3.3 United Kingdom .......................................6.3 6.07 Government Online Service Index (0–1) .................................................. 126 .......... n ........0.19 Multiple economies (3) ...........................1.00
Pillar 7: Operating environment (1–7) .............................................................. 78 ...........................4.0 Hong Kong SAR ............................................ 5.8 7.01 Protection of property index (1–7) ............................................................. 76 .......... n ..........3.7 Finland .....................................................6.3
Property rights* ......................................................................................... 92 .......... n ..........3.8 Finland .....................................................6.4Intellectual property protection* ................................................................ 63 .......... n ..........3.7 Finland .....................................................6.2
7.02 Efficiency and accountability of public institutions index (1–7) ................... 70 .......... n ..........3.6 Singapore.................................................6.0Judicial efficiency & impartiality in commercial disputes (0–4).................. 106 .......... n ..........1.3 Multiple economies (7) .............................4.0Diversion of public funds* ......................................................................... 52 .......... n ..........3.6 New Zealand ............................................6.5Ease of compliance with government regulation* ...................................... 21 .......... n ..........4.1 Singapore.................................................5.4
7.03 Access to finance index (1–7) ................................................................ 101 .......... n ..........3.3 Hong Kong SAR ......................................5.7Affordability of financial services* ........................................................... 101 .......... n ..........3.7 Hong Kong SAR ......................................6.1Availability of financial services* .............................................................. 107 .......... n ..........3.8 Switzerland ..............................................6.4Ease of access to loans* .......................................................................... 87 .......... n ..........2.5 Qatar ........................................................4.9Availability of trade finance* ...................................................................... 95 .......... n ..........3.4 Hong Kong SAR ......................................5.8
7.04 Openness to foreign participation index (1–7) ........................................... 78 .......... n ..........4.2 Ireland ......................................................5.5Ease of hiring foreign labour* .................................................................... 61 .......... n ..........4.2 United Arab Emirates ...............................5.6Business impact of rules on FDI* .............................................................. 81 .......... n ..........4.4 Ireland ......................................................6.7Openness to multilateral trade rules (0–100) ............................................. 80 .......... n ........60.5 Slovenia .................................................92.2
7.05 Index of physical security (1–7) ................................................................. 85 .......... n ..........5.1 Qatar ........................................................6.8Reliability of police services* ..................................................................... 95 .......... n ..........3.7 Finland .....................................................6.7Business costs of crime and violence* ...................................................... 92 .......... n ..........4.2 Qatar ........................................................6.8Business costs of terrorism* ..................................................................... 88 .......... n ..........5.0 Slovenia ...................................................6.7Homicide cases/100,000 pop. ............................................................... 102 .......... n ........10.1 Hong Kong SAR ......................................0.2Index of terrorism incidence (1-7) ............................................................. 49 .......... n ..........7.0 Multiple economies (48) ...........................7.0
© 2014 World Economic Forum

Country/Economy Profiles
198 | The Global Enabling Trade Report 2014
* From the list of factors above, respondents were asked to select the five most problematic for trading in their country and to rank them between 1 (most problematic) and 5. The bars in the figure show the responses weighted according to their rankings.
For methodology, indicator descriptions and sources, and for a list of multiple best-performing economies, see page 45.
0 105 15 20 25 30
0 5 10 15 20 25 30
2
3
4
5
6
7
Operating environment
Availability & use of ICTs
Availability & quality of transport services
Availability & quality of transport infrastructure
Efficiency & transparency of border administration
Foreign market access
Domestic market access
1
Enabling Trade Index 2014 Rank Score (out of 138) (1–7)
Enabling Trade Index 2014 ...................106 ..... 3.5
Subindex A: Market access (25%) ......................5 .......4.8Pillar 1: Domestic market access .......................................1 .........7.0Pillar 2: Foreign market access ........................................66 .........2.6
Subindex B: Border administration (25%) ...... 113 .......3.4Pillar 3: Efficiency & transparency of border administration ................................................. 113 .........3.4
Subindex C: Infrastructure (25%) .................... 118 .......2.8Pillar 4: Availability & quality of transport infrastructure .109 .........2.6Pillar 5: Availability & quality of transport services ......... 137 .........2.8Pillar 6: Availability & use of ICTs ...................................100 ........ 3.0
Subindex D: Operating environment (25%) ....132 .......3.1Pillar 7: Operating environment ......................................132 .........3.1
Key indicators, 2012 Rank/138
Population (millions) .............................................................. 6.4 ........... 91GDP (US$ billions) ...............................................................81.9 ........... 64GDP per capita (US$) ................................................... 12,777.8 ........... 48
Merchandise tradeTrade openness (imports+exports)/GDP, 2009 ...................79.9 ........... 52Share of world trade (%) ..................................................... 0.23 ........... 59Total Exports (US$ billions) ................................................. 62.2 ........... 52Total Imports (US$ billions) ................................................. 23.0 ........... 71
The most problematic factors for trade, 2013Most problematic factors for exporting Score*
Inappropriate production technology and skills .....................................................16.5Access to trade finance .........................................................................................12.9Difficulties in meeting quality/quantity requirements of buyers ............................... 9.8Technical requirements and standards abroad ...................................................... 9.6High cost or delays caused by domestic transportation ........................................ 8.7Burdensome procedures at foreign borders ...........................................................7.9Identifying potential markets and buyers .................................................................7.7Rules of origin requirements abroad ........................................................................7.5Tariff barriers abroad .............................................................................................. 5.3Access to imported inputs at competitive prices ....................................................5.1High cost or delays caused by international transportation ................................... 5.0Corruption at foreign borders ................................................................................. 3.9
Most problematic factors for importing Score*
Burdensome import procedures ...........................................................................24.9Corruption at the border ....................................................................................... 18.3Tariffs .....................................................................................................................13.0Inappropriate telecommunications infrastructure ..................................................13.0High cost or delays caused by international transportation ..................................11.5High cost or delays caused by domestic transportation ...................................... 10.2Domestic technical requirements and standards ................................................... 5.4Crime and theft ....................................................................................................... 3.6
Libya
Sources: International Monetary Fund, World Bank, World Trade Organization, United Nations COMTRADE
Libya
Middle East, North Africa, and Pakistan
© 2014 World Economic Forum

Country/Economy Profiles
The Global Enabling Trade Report 2014 | 199
* Indicator derived from the World Economic Forum’s Executive Opinion Survey and measured on a 1-to-7 scale, where 7 indicates best outcome.
The Enabling Trade Index 2014 in detail n Competitive Advantage n Competitive Disadvantage
For methodology, indicator descriptions and sources, and for a list of multiple best-performing economies, see page 45. Libya
INDICATOR, UNITS RANK/138 VALUE BEST PERFORMER VALUE
Pillar 1: Domestic market access (1–7) ............................................................. 1 ...........................7.0 Multiple economies (2) ................................ 7.0 1.01 Tariff rate (%)............................................................................................... 1 .......... n ..........0.0 Multiple economies (2) .............................0.0 1.02 Complexity of tariffs index (1–7) .................................................................. 1 .......... n ..........7.0 Multiple economies (2) .............................7.0
Tariff dispersion (standard deviation) ........................................................... 1 .......... n ..........0.0 Multiple economies (2) .............................0.0Tariff peaks (% of tariff lines) ....................................................................... 1 .......... n ..........0.0 Multiple economies (24) ...........................0.0Specific tariffs (% of tariff lines) ................................................................... 1 .......... n ..........0.0 Multiple economies (54) ...........................0.0Number of distinct tariffs ............................................................................. 1 .......... n .............1 Multiple economies (2) ................................1
1.03 Share of duty-free imports (%) .................................................................... 1 .......... n ......100.0 Multiple economies (2) .........................100.0
Pillar 2: Foreign market access (1–7) .............................................................. 66 ...........................2.6 Cambodia ..................................................... 5.3 2.01 Tariffs faced (%) ........................................................................................ 63 .......... n ..........5.4 Chile .........................................................3.5 2.02 Index of margin of preference in destination mkts (0–100) ........................ 66 .......... n ........27.9 Mauritius ................................................97.1
Pillar 3: Efficiency and transparency of border administration (1–7) ............ 113 ...........................3.4 Singapore..................................................... 6.3 3.01 Customs services index (0–1) .................................................................. n/a ........................n/a Singapore...............................................0.97 3.02 Efficiency of the clearance process (1–5) .................................................. 98 .......... n ..........2.4 Norway ....................................................4.2 3.03 No. of days to import ............................................................................. 121 .......... n ...........37 Singapore....................................................4 3.04 No. of documents to import ................................................................... 101 .......... n .............9 Multiple economies (2) ................................2 3.05 Cost to import (US$ per container) ......................................................... 111 .......... n ......2,255 Singapore................................................440 3.06 No. of days to export.............................................................................. 101 .......... n ...........23 Multiple economies (5) ................................6 3.07 No. of documents to export ..................................................................... 85 .......... n .............7 Multiple economies (2) ................................2 3.08 Cost to export (US$ per container) ........................................................... 66 .......... n ......1,140 Malaysia ..................................................450 3.09 Irregular payments in exports and imports*............................................... 95 .......... n ..........2.9 New Zealand ............................................6.6 3.10 Time predictability of import procedures* ................................................ 120 .......... n ..........3.0 Finland .....................................................6.0 3.11 Customs transparency index (0–1) .......................................................... n/a ........................n/a Multiple economies (35) .........................1.00
Pillar 4: Availability and quality of transport infrastructure (1-7) ................... 109 ...........................2.6 United Arab Emirates ................................... 6.5 4.01 Available int’l airline seat km/week, millions .............................................. 89 .......... n ........69.3 United States ..................................11,481.7 4.02 Quality of air transport infrastructure* ...................................................... 128 .......... n ..........2.9 Singapore.................................................6.8 4.03 Quality of railroad infrastructure* .............................................................. n/a ........................n/a Japan .......................................................6.7 4.04 Liner Shipping Connectivity Index (0–157.1) ............................................. 86 .......... n ..........7.3 China ...................................................157.5 4.05 Quality of port infrastructure* .................................................................. 115 .......... n ..........3.0 Netherlands ..............................................6.8 4.06 Paved roads (% of total) ........................................................................... 61 .......... n ........57.2 Multiple economies (18) .......................100.0 4.07 Quality of roads* ..................................................................................... 125 .......... n ..........2.5 United Arab Emirates ...............................6.6
Pillar 5: Availability and quality of transport services (1–7) .......................... 137 ...........................2.8 Singapore..................................................... 5.7 5.01 Ease and affordability of shipment (1–5).................................................. 131 .......... n ..........2.3 Luxembourg .............................................3.8 5.02 Logistics competence (1–5) .................................................................... 125 .......... n ..........2.3 Norway ....................................................4.2 5.03 Tracking and tracing ability (1–5) ............................................................... 77 .......... n ..........2.9 Germany ..................................................4.2 5.04 Timeliness of shipments in reaching destination (1–5) ............................. 111 .......... n ..........2.9 Luxembourg .............................................4.7 5.05 Postal services efficiency* ....................................................................... 134 .......... n ..........1.2 Japan .......................................................6.8 5.06 Efficiency of transport mode change* ..................................................... 136 .......... n ..........2.0 Hong Kong SAR ......................................6.4
Pillar 6: Availability and use of ICTs (1–7) ...................................................... 100 ...........................3.0 Sweden ........................................................ 6.5 6.01 Mobile phone subscriptions/100 pop. ...................................................... 16 .......... n ......155.8 Hong Kong SAR ..................................229.2 6.02 Individuals using Internet (%) ................................................................... n/a ........................n/a Iceland ...................................................96.2 6.03 Fixed broadband Internet subscriptions/100 pop. .................................... 99 .......... n ..........1.1 Switzerland ............................................39.9 6.04 Active mobile broadband Internet subscriptions/100 pop. ....................... n/a ........................n/a Singapore.............................................124.5 6.05 ICT use for business-to-business transactions* ...................................... 133 .......... n ..........3.5 Finland .....................................................6.2 6.06 Internet use for business-to-consumer transactions* .............................. 134 .......... n ..........2.7 United Kingdom .......................................6.3 6.07 Government Online Service Index (0–1) .................................................. 135 .......... n ........0.00 Multiple economies (3) ...........................1.00
Pillar 7: Operating environment (1–7) ............................................................ 132 ...........................3.1 Hong Kong SAR ............................................ 5.8 7.01 Protection of property index (1–7) ........................................................... 124 .......... n ..........2.8 Finland .....................................................6.3
Property rights* ....................................................................................... 107 .......... n ..........3.4 Finland .....................................................6.4Intellectual property protection* .............................................................. 136 .......... n ..........2.2 Finland .....................................................6.2
7.02 Efficiency and accountability of public institutions index (1–7) ................. 130 .......... n ..........2.6 Singapore.................................................6.0Judicial efficiency & impartiality in commercial disputes (0–4).................. 113 .......... n ..........1.0 Multiple economies (7) .............................4.0Diversion of public funds* ....................................................................... 108 .......... n ..........2.4 New Zealand ............................................6.5Ease of compliance with government regulation* .................................... 111 .......... n ..........2.9 Singapore.................................................5.4
7.03 Access to finance index (1–7) ................................................................ 136 .......... n ..........2.3 Hong Kong SAR ......................................5.7Affordability of financial services* ........................................................... 138 .......... n ..........2.3 Hong Kong SAR ......................................6.1Availability of financial services* .............................................................. 137 .......... n ..........2.5 Switzerland ..............................................6.4Ease of access to loans* ........................................................................ 121 .......... n ..........1.9 Qatar ........................................................4.9Availability of trade finance* .................................................................... 130 .......... n ..........2.6 Hong Kong SAR ......................................5.8
7.04 Openness to foreign participation index (1–7) ......................................... 133 .......... n ..........3.0 Ireland ......................................................5.5Ease of hiring foreign labour* .................................................................. 110 .......... n ..........3.5 United Arab Emirates ...............................5.6Business impact of rules on FDI* ............................................................ 125 .......... n ..........3.3 Ireland ......................................................6.7Openness to multilateral trade rules (0–100) ........................................... 130 .......... n ........35.1 Slovenia .................................................92.2
7.05 Index of physical security (1–7) ................................................................. 91 .......... n ..........4.9 Qatar ........................................................6.8Reliability of police services* ................................................................... 130 .......... n ..........2.7 Finland .....................................................6.7Business costs of crime and violence* ...................................................... 83 .......... n ..........4.3 Qatar ........................................................6.8Business costs of terrorism* ................................................................... 122 .......... n ..........4.1 Slovenia ...................................................6.7Homicide cases/100,000 pop. ................................................................. 63 .......... n ..........2.9 Hong Kong SAR ......................................0.2Index of terrorism incidence (1-7) ........................................................... 119 .......... n ..........6.4 Multiple economies (48) ...........................7.0
© 2014 World Economic Forum
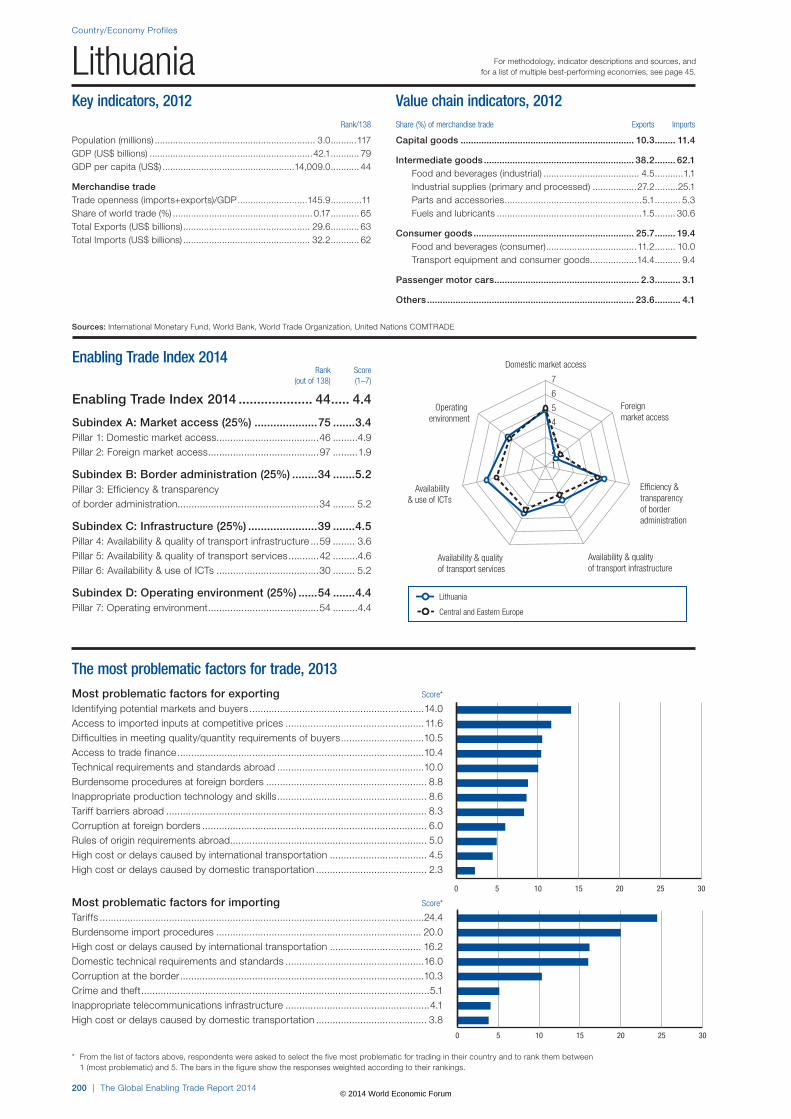
Country/Economy Profiles
200 | The Global Enabling Trade Report 2014
* From the list of factors above, respondents were asked to select the five most problematic for trading in their country and to rank them between 1 (most problematic) and 5. The bars in the figure show the responses weighted according to their rankings.
For methodology, indicator descriptions and sources, and for a list of multiple best-performing economies, see page 45.
0 105 15 20 25 30
0 5 10 15 20 25 30
2
3
4
5
6
7
Operating environment
Availability & use of ICTs
Availability & quality of transport services
Availability & quality of transport infrastructure
Efficiency & transparency of border administration
Foreign market access
Domestic market access
1
Enabling Trade Index 2014 Rank Score (out of 138) (1–7)
Enabling Trade Index 2014 .................... 44 ..... 4.4
Subindex A: Market access (25%) ....................75 .......3.4Pillar 1: Domestic market access .....................................46 .........4.9Pillar 2: Foreign market access ........................................97 .........1.9
Subindex B: Border administration (25%) ........34 .......5.2Pillar 3: Efficiency & transparency of border administration ...................................................34 ........ 5.2
Subindex C: Infrastructure (25%) ......................39 .......4.5Pillar 4: Availability & quality of transport infrastructure ...59 ........ 3.6Pillar 5: Availability & quality of transport services ...........42 .........4.6Pillar 6: Availability & use of ICTs .....................................30 ........ 5.2
Subindex D: Operating environment (25%) ......54 .......4.4Pillar 7: Operating environment ........................................54 .........4.4
Key indicators, 2012 Rank/138
Population (millions) .............................................................. 3.0 ..........117GDP (US$ billions) ...............................................................42.1 ........... 79GDP per capita (US$) ...................................................14,009.0 ........... 44
Merchandise tradeTrade openness (imports+exports)/GDP ...........................145.9 ............11Share of world trade (%) ...................................................... 0.17 ........... 65Total Exports (US$ billions) ................................................. 29.6 ........... 63Total Imports (US$ billions) ................................................. 32.2 ........... 62
Value chain indicators, 2012Share (%) of merchandise trade Exports Imports
Capital goods ................................................................... 10.3 ........ 11.4
Intermediate goods .......................................................... 38.2 ........ 62.1Food and beverages (industrial) ..................................... 4.5 ...........1.1Industrial supplies (primary and processed) .................27.2 .........25.1Parts and accessories .....................................................5.1 .......... 5.3Fuels and lubricants ........................................................1.5 ........ 30.6
Consumer goods .............................................................. 25.7 ........ 19.4Food and beverages (consumer) ...................................11.2 ........ 10.0Transport equipment and consumer goods ..................14.4 .......... 9.4
Passenger motor cars ........................................................ 2.3 .......... 3.1
Others ................................................................................ 23.6 .......... 4.1
The most problematic factors for trade, 2013Most problematic factors for exporting Score*
Identifying potential markets and buyers ...............................................................14.0Access to imported inputs at competitive prices ..................................................11.6Difficulties in meeting quality/quantity requirements of buyers ..............................10.5Access to trade finance .........................................................................................10.4Technical requirements and standards abroad .....................................................10.0Burdensome procedures at foreign borders .......................................................... 8.8Inappropriate production technology and skills ...................................................... 8.6Tariff barriers abroad .............................................................................................. 8.3Corruption at foreign borders ................................................................................. 6.0Rules of origin requirements abroad ....................................................................... 5.0High cost or delays caused by international transportation ................................... 4.5High cost or delays caused by domestic transportation ........................................ 2.3
Most problematic factors for importing Score*
Tariffs .....................................................................................................................24.4Burdensome import procedures .......................................................................... 20.0High cost or delays caused by international transportation ................................. 16.2Domestic technical requirements and standards ..................................................16.0Corruption at the border ........................................................................................10.3Crime and theft ........................................................................................................5.1Inappropriate telecommunications infrastructure ....................................................4.1High cost or delays caused by domestic transportation ........................................ 3.8
Lithuania
Sources: International Monetary Fund, World Bank, World Trade Organization, United Nations COMTRADE
Lithuania
Central and Eastern Europe
© 2014 World Economic Forum
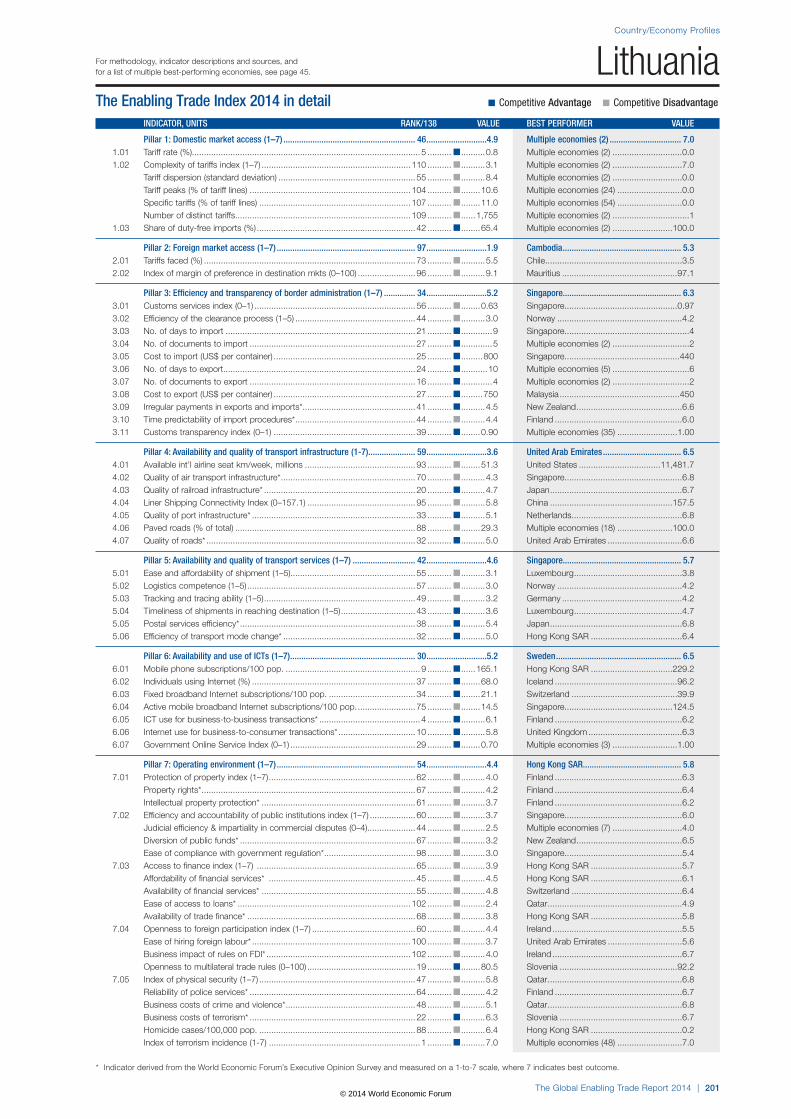
Country/Economy Profiles
The Global Enabling Trade Report 2014 | 201
* Indicator derived from the World Economic Forum’s Executive Opinion Survey and measured on a 1-to-7 scale, where 7 indicates best outcome.
The Enabling Trade Index 2014 in detail n Competitive Advantage n Competitive Disadvantage
For methodology, indicator descriptions and sources, and for a list of multiple best-performing economies, see page 45. Lithuania
INDICATOR, UNITS RANK/138 VALUE BEST PERFORMER VALUE
Pillar 1: Domestic market access (1–7) ........................................................... 46 ...........................4.9 Multiple economies (2) ................................ 7.0 1.01 Tariff rate (%)............................................................................................... 5 .......... n ..........0.8 Multiple economies (2) .............................0.0 1.02 Complexity of tariffs index (1–7) .............................................................. 110 .......... n ..........3.1 Multiple economies (2) .............................7.0
Tariff dispersion (standard deviation) ......................................................... 55 .......... n ..........8.4 Multiple economies (2) .............................0.0Tariff peaks (% of tariff lines) ................................................................... 104 .......... n ........10.6 Multiple economies (24) ...........................0.0Specific tariffs (% of tariff lines) ............................................................... 107 .......... n ........11.0 Multiple economies (54) ...........................0.0Number of distinct tariffs ......................................................................... 109 .......... n ......1,755 Multiple economies (2) ................................1
1.03 Share of duty-free imports (%) .................................................................. 42 .......... n ........65.4 Multiple economies (2) .........................100.0
Pillar 2: Foreign market access (1–7) .............................................................. 97 ...........................1.9 Cambodia ..................................................... 5.3 2.01 Tariffs faced (%) ........................................................................................ 73 .......... n ..........5.5 Chile .........................................................3.5 2.02 Index of margin of preference in destination mkts (0–100) ........................ 96 .......... n ..........9.1 Mauritius ................................................97.1
Pillar 3: Efficiency and transparency of border administration (1–7) .............. 34 ...........................5.2 Singapore..................................................... 6.3 3.01 Customs services index (0–1) ................................................................... 56 .......... n ........0.63 Singapore...............................................0.97 3.02 Efficiency of the clearance process (1–5) .................................................. 44 .......... n ..........3.0 Norway ....................................................4.2 3.03 No. of days to import ............................................................................... 21 .......... n .............9 Singapore....................................................4 3.04 No. of documents to import ..................................................................... 27 .......... n .............5 Multiple economies (2) ................................2 3.05 Cost to import (US$ per container) ........................................................... 25 .......... n .........800 Singapore................................................440 3.06 No. of days to export................................................................................ 24 .......... n ...........10 Multiple economies (5) ................................6 3.07 No. of documents to export ..................................................................... 16 .......... n .............4 Multiple economies (2) ................................2 3.08 Cost to export (US$ per container) ........................................................... 27 .......... n .........750 Malaysia ..................................................450 3.09 Irregular payments in exports and imports*............................................... 41 .......... n ..........4.5 New Zealand ............................................6.6 3.10 Time predictability of import procedures* .................................................. 44 .......... n ..........4.4 Finland .....................................................6.0 3.11 Customs transparency index (0–1) ........................................................... 39 .......... n ........0.90 Multiple economies (35) .........................1.00
Pillar 4: Availability and quality of transport infrastructure (1-7) ..................... 59 ...........................3.6 United Arab Emirates ................................... 6.5 4.01 Available int’l airline seat km/week, millions .............................................. 93 .......... n ........51.3 United States ..................................11,481.7 4.02 Quality of air transport infrastructure* ........................................................ 70 .......... n ..........4.3 Singapore.................................................6.8 4.03 Quality of railroad infrastructure* ............................................................... 20 .......... n ..........4.7 Japan .......................................................6.7 4.04 Liner Shipping Connectivity Index (0–157.1) ............................................. 95 .......... n ..........5.8 China ...................................................157.5 4.05 Quality of port infrastructure* .................................................................... 33 .......... n ..........5.1 Netherlands ..............................................6.8 4.06 Paved roads (% of total) ........................................................................... 88 .......... n ........29.3 Multiple economies (18) .......................100.0 4.07 Quality of roads* ....................................................................................... 32 .......... n ..........5.0 United Arab Emirates ...............................6.6
Pillar 5: Availability and quality of transport services (1–7) ............................ 42 ...........................4.6 Singapore..................................................... 5.7 5.01 Ease and affordability of shipment (1–5).................................................... 55 .......... n ..........3.1 Luxembourg .............................................3.8 5.02 Logistics competence (1–5) ...................................................................... 57 .......... n ..........3.0 Norway ....................................................4.2 5.03 Tracking and tracing ability (1–5) ............................................................... 49 .......... n ..........3.2 Germany ..................................................4.2 5.04 Timeliness of shipments in reaching destination (1–5) ............................... 43 .......... n ..........3.6 Luxembourg .............................................4.7 5.05 Postal services efficiency* ......................................................................... 38 .......... n ..........5.4 Japan .......................................................6.8 5.06 Efficiency of transport mode change* ....................................................... 32 .......... n ..........5.0 Hong Kong SAR ......................................6.4
Pillar 6: Availability and use of ICTs (1–7) ........................................................ 30 ...........................5.2 Sweden ........................................................ 6.5 6.01 Mobile phone subscriptions/100 pop. ........................................................ 9 .......... n ......165.1 Hong Kong SAR ..................................229.2 6.02 Individuals using Internet (%) .................................................................... 37 .......... n ........68.0 Iceland ...................................................96.2 6.03 Fixed broadband Internet subscriptions/100 pop. .................................... 34 .......... n ........21.1 Switzerland ............................................39.9 6.04 Active mobile broadband Internet subscriptions/100 pop. ........................ 75 .......... n ........14.5 Singapore.............................................124.5 6.05 ICT use for business-to-business transactions* .......................................... 4 .......... n ..........6.1 Finland .....................................................6.2 6.06 Internet use for business-to-consumer transactions* ................................ 10 .......... n ..........5.8 United Kingdom .......................................6.3 6.07 Government Online Service Index (0–1) .................................................... 29 .......... n ........0.70 Multiple economies (3) ...........................1.00
Pillar 7: Operating environment (1–7) .............................................................. 54 ...........................4.4 Hong Kong SAR ............................................ 5.8 7.01 Protection of property index (1–7) ............................................................. 62 .......... n ..........4.0 Finland .....................................................6.3
Property rights* ......................................................................................... 67 .......... n ..........4.2 Finland .....................................................6.4Intellectual property protection* ................................................................ 61 .......... n ..........3.7 Finland .....................................................6.2
7.02 Efficiency and accountability of public institutions index (1–7) ................... 60 .......... n ..........3.7 Singapore.................................................6.0Judicial efficiency & impartiality in commercial disputes (0–4).................... 44 .......... n ..........2.5 Multiple economies (7) .............................4.0Diversion of public funds* ......................................................................... 67 .......... n ..........3.2 New Zealand ............................................6.5Ease of compliance with government regulation* ...................................... 98 .......... n ..........3.0 Singapore.................................................5.4
7.03 Access to finance index (1–7) .................................................................. 65 .......... n ..........3.9 Hong Kong SAR ......................................5.7Affordability of financial services* ............................................................. 45 .......... n ..........4.5 Hong Kong SAR ......................................6.1Availability of financial services* ................................................................ 55 .......... n ..........4.8 Switzerland ..............................................6.4Ease of access to loans* ........................................................................ 102 .......... n ..........2.4 Qatar ........................................................4.9Availability of trade finance* ...................................................................... 68 .......... n ..........3.8 Hong Kong SAR ......................................5.8
7.04 Openness to foreign participation index (1–7) ........................................... 60 .......... n ..........4.4 Ireland ......................................................5.5Ease of hiring foreign labour* .................................................................. 100 .......... n ..........3.7 United Arab Emirates ...............................5.6Business impact of rules on FDI* ............................................................ 102 .......... n ..........4.0 Ireland ......................................................6.7Openness to multilateral trade rules (0–100) ............................................. 19 .......... n ........80.5 Slovenia .................................................92.2
7.05 Index of physical security (1–7) ................................................................. 47 .......... n ..........5.8 Qatar ........................................................6.8Reliability of police services* ..................................................................... 64 .......... n ..........4.2 Finland .....................................................6.7Business costs of crime and violence* ...................................................... 48 .......... n ..........5.1 Qatar ........................................................6.8Business costs of terrorism* ..................................................................... 22 .......... n ..........6.3 Slovenia ...................................................6.7Homicide cases/100,000 pop. ................................................................. 88 .......... n ..........6.4 Hong Kong SAR ......................................0.2Index of terrorism incidence (1-7) ............................................................... 1 .......... n ..........7.0 Multiple economies (48) ...........................7.0
© 2014 World Economic Forum

Country/Economy Profiles
202 | The Global Enabling Trade Report 2014
* From the list of factors above, respondents were asked to select the five most problematic for trading in their country and to rank them between 1 (most problematic) and 5. The bars in the figure show the responses weighted according to their rankings.
For methodology, indicator descriptions and sources, and for a list of multiple best-performing economies, see page 45.
0 105 15 20 25 30
0 5 10 15 20 25 30
2
3
4
5
6
7
Operating environment
Availability & use of ICTs
Availability & quality of transport services
Availability & quality of transport infrastructure
Efficiency & transparency of border administration
Foreign market access
Domestic market access
1
Enabling Trade Index 2014 Rank Score (out of 138) (1–7)
Enabling Trade Index 2014 .....................11 ......5.1
Subindex A: Market access (25%) ....................75 .......3.4Pillar 1: Domestic market access .....................................46 .........4.9Pillar 2: Foreign market access ........................................97 .........1.9
Subindex B: Border administration (25%) ........15 .......5.8Pillar 3: Efficiency & transparency of border administration ...................................................15 ........ 5.8
Subindex C: Infrastructure (25%) ......................13 .......5.6Pillar 4: Availability & quality of transport infrastructure ... 17 .........5.0Pillar 5: Availability & quality of transport services ...........10 .........5.6Pillar 6: Availability & use of ICTs .......................................9 .........6.1
Subindex D: Operating environment (25%) ........6 .......5.6Pillar 7: Operating environment ..........................................6 .........5.6
Key indicators, 2012 Rank/138
Population (millions) .............................................................. 0.5 ......... 136GDP (US$ billions) ............................................................... 57.1 ........... 69GDP per capita (US$) ................................................ 106,406.4 ............. 1
Merchandise tradeTrade openness (imports+exports)/GDP .............................81.8 ........... 48Share of world trade (%) ......................................................0.13 ........... 69Total Exports (US$ billions) ..................................................19.4 ........... 71Total Imports (US$ billions) ..................................................27.6 ........... 65
Value chain indicators, 2012Share (%) of merchandise trade Exports Imports
Capital goods ..................................................................... 8.9 ........ 16.7
Intermediate goods .......................................................... 73.3 ........ 41.9Food and beverages (industrial) ......................................1.0 .......... 0.5Industrial supplies (primary and processed) ................ 54.9 ........ 32.8Parts and accessories ...................................................16.6 .......... 8.5Fuels and lubricants ....................................................... 0.9 .......... 0.2
Consumer goods .............................................................. 14.5 ........20.8Food and beverages (consumer) .................................... 6.9 .......... 8.8Transport equipment and consumer goods ....................7.6 ........ 12.0
Passenger motor cars ........................................................ 3.2 ..........8.2
Others ...................................................................................0.1 ........ 12.4
The most problematic factors for trade, 2013Most problematic factors for exporting Score*
Identifying potential markets and buyers ............................................................... 17.7Access to imported inputs at competitive prices ..................................................13.1Burdensome procedures at foreign borders .........................................................10.6Tariff barriers abroad .............................................................................................10.4Rules of origin requirements abroad ....................................................................... 9.4Corruption at foreign borders ................................................................................. 8.5High cost or delays caused by international transportation ....................................7.7Access to trade finance .......................................................................................... 6.9Technical requirements and standards abroad ...................................................... 5.8Inappropriate production technology and skills ...................................................... 3.5Difficulties in meeting quality/quantity requirements of buyers ............................... 3.3High cost or delays caused by domestic transportation ........................................ 2.9
Most problematic factors for importing Score*
Burdensome import procedures .......................................................................... 25.6High cost or delays caused by international transportation ................................. 23.2Tariffs .....................................................................................................................20.7Domestic technical requirements and standards ................................................. 20.3High cost or delays caused by domestic transportation ........................................ 4.9Crime and theft ....................................................................................................... 2.4Corruption at the border ..........................................................................................1.6Inappropriate telecommunications infrastructure ....................................................1.2
Luxembourg
Sources: International Monetary Fund, World Bank, World Trade Organization, United Nations COMTRADE
Luxembourg
Advanced economies
© 2014 World Economic Forum

Country/Economy Profiles
The Global Enabling Trade Report 2014 | 203
* Indicator derived from the World Economic Forum’s Executive Opinion Survey and measured on a 1-to-7 scale, where 7 indicates best outcome.
The Enabling Trade Index 2014 in detail n Competitive Advantage n Competitive Disadvantage
For methodology, indicator descriptions and sources, and for a list of multiple best-performing economies, see page 45. Luxembourg
INDICATOR, UNITS RANK/138 VALUE BEST PERFORMER VALUE
Pillar 1: Domestic market access (1–7) ........................................................... 46 ...........................4.9 Multiple economies (2) ................................ 7.0 1.01 Tariff rate (%)............................................................................................... 5 .......... n ..........0.8 Multiple economies (2) .............................0.0 1.02 Complexity of tariffs index (1–7) .............................................................. 110 .......... n ..........3.1 Multiple economies (2) .............................7.0
Tariff dispersion (standard deviation) ......................................................... 55 .......... n ..........8.4 Multiple economies (2) .............................0.0Tariff peaks (% of tariff lines) ................................................................... 104 .......... n ........10.6 Multiple economies (24) ...........................0.0Specific tariffs (% of tariff lines) ............................................................... 107 .......... n ........11.0 Multiple economies (54) ...........................0.0Number of distinct tariffs ......................................................................... 109 .......... n ......1,755 Multiple economies (2) ................................1
1.03 Share of duty-free imports (%) .................................................................. 42 .......... n ........65.4 Multiple economies (2) .........................100.0
Pillar 2: Foreign market access (1–7) .............................................................. 97 ...........................1.9 Cambodia ..................................................... 5.3 2.01 Tariffs faced (%) ........................................................................................ 73 .......... n ..........5.5 Chile .........................................................3.5 2.02 Index of margin of preference in destination mkts (0–100) ........................ 96 .......... n ..........9.1 Mauritius ................................................97.1
Pillar 3: Efficiency and transparency of border administration (1–7) .............. 15 ...........................5.8 Singapore..................................................... 6.3 3.01 Customs services index (0–1) ................................................................... 43 .......... n ........0.67 Singapore...............................................0.97 3.02 Efficiency of the clearance process (1–5) .................................................. 10 .......... n ..........3.8 Norway ....................................................4.2 3.03 No. of days to import ............................................................................... 10 .......... n .............7 Singapore....................................................4 3.04 No. of documents to import ..................................................................... 11 .......... n .............4 Multiple economies (2) ................................2 3.05 Cost to import (US$ per container) ........................................................... 76 .......... n ......1,420 Singapore................................................440 3.06 No. of days to export.................................................................................. 9 .......... n .............8 Multiple economies (5) ................................6 3.07 No. of documents to export ..................................................................... 40 .......... n .............5 Multiple economies (2) ................................2 3.08 Cost to export (US$ per container) ........................................................... 91 .......... n ......1,425 Malaysia ..................................................450 3.09 Irregular payments in exports and imports*................................................. 7 .......... n ..........6.2 New Zealand ............................................6.6 3.10 Time predictability of import procedures* .................................................... 4 .......... n ..........5.6 Finland .....................................................6.0 3.11 Customs transparency index (0–1) ............................................................. 1 .......... n ........1.00 Multiple economies (35) .........................1.00
Pillar 4: Availability and quality of transport infrastructure (1-7) ..................... 17 ...........................5.0 United Arab Emirates ................................... 6.5 4.01 Available int’l airline seat km/week, millions ............................................ 108 .......... n ........25.3 United States ..................................11,481.7 4.02 Quality of air transport infrastructure* ........................................................ 28 .......... n ..........5.6 Singapore.................................................6.8 4.03 Quality of railroad infrastructure* ............................................................... 12 .......... n ..........5.0 Japan .......................................................6.7 4.04 Liner Shipping Connectivity Index (0–157.1) ............................................ n/a ........................n/a China ...................................................157.5 4.05 Quality of port infrastructure* .................................................................... 25 .......... n ..........5.4 Netherlands ..............................................6.8 4.06 Paved roads (% of total) ............................................................................. 1 .......... n ......100.0 Multiple economies (18) .......................100.0 4.07 Quality of roads* ....................................................................................... 16 .......... n ..........5.8 United Arab Emirates ...............................6.6
Pillar 5: Availability and quality of transport services (1–7) ............................ 10 ...........................5.6 Singapore..................................................... 5.7 5.01 Ease and affordability of shipment (1–5)...................................................... 1 .......... n ..........3.8 Luxembourg .............................................3.8 5.02 Logistics competence (1–5) ...................................................................... 14 .......... n ..........3.8 Norway ....................................................4.2 5.03 Tracking and tracing ability (1–5) ............................................................... 22 .......... n ..........3.7 Germany ..................................................4.2 5.04 Timeliness of shipments in reaching destination (1–5) ................................. 1 .......... n ..........4.7 Luxembourg .............................................4.7 5.05 Postal services efficiency* ........................................................................... 9 .......... n ..........6.3 Japan .......................................................6.8 5.06 Efficiency of transport mode change* ....................................................... 30 .......... n ..........5.0 Hong Kong SAR ......................................6.4
Pillar 6: Availability and use of ICTs (1–7) .......................................................... 9 ...........................6.1 Sweden ........................................................ 6.5 6.01 Mobile phone subscriptions/100 pop. ...................................................... 24 .......... n ......145.4 Hong Kong SAR ..................................229.2 6.02 Individuals using Internet (%) ...................................................................... 6 .......... n ........92.0 Iceland ...................................................96.2 6.03 Fixed broadband Internet subscriptions/100 pop. .................................... 12 .......... n ........32.4 Switzerland ............................................39.9 6.04 Active mobile broadband Internet subscriptions/100 pop. ........................ 12 .......... n ........80.6 Singapore.............................................124.5 6.05 ICT use for business-to-business transactions* ........................................ 15 .......... n ..........5.9 Finland .....................................................6.2 6.06 Internet use for business-to-consumer transactions* ................................ 26 .......... n ..........5.3 United Kingdom .......................................6.3 6.07 Government Online Service Index (0–1) .................................................... 29 .......... n ........0.70 Multiple economies (3) ...........................1.00
Pillar 7: Operating environment (1–7) ................................................................ 6 ...........................5.6 Hong Kong SAR ............................................ 5.8 7.01 Protection of property index (1–7) ............................................................... 6 .......... n ..........6.0 Finland .....................................................6.3
Property rights* ........................................................................................... 7 .......... n ..........6.0 Finland .....................................................6.4Intellectual property protection* .................................................................. 6 .......... n ..........5.9 Finland .....................................................6.2
7.02 Efficiency and accountability of public institutions index (1–7) ................... 16 .......... n ..........5.1 Singapore.................................................6.0Judicial efficiency & impartiality in commercial disputes (0–4)................... n/a ........................n/a Multiple economies (7) .............................4.0Diversion of public funds* ........................................................................... 7 .......... n ..........6.0 New Zealand ............................................6.5Ease of compliance with government regulation* ...................................... 17 .......... n ..........4.2 Singapore.................................................5.4
7.03 Access to finance index (1–7) .................................................................... 5 .......... n ..........5.3 Hong Kong SAR ......................................5.7Affordability of financial services* ............................................................... 2 .......... n ..........6.0 Hong Kong SAR ......................................6.1Availability of financial services* .................................................................. 4 .......... n ..........6.1 Switzerland ..............................................6.4Ease of access to loans* .......................................................................... 13 .......... n ..........4.2 Qatar ........................................................4.9Availability of trade finance* ...................................................................... 15 .......... n ..........5.0 Hong Kong SAR ......................................5.8
7.04 Openness to foreign participation index (1–7) ............................................. 3 .......... n ..........5.3 Ireland ......................................................5.5Ease of hiring foreign labour* ...................................................................... 8 .......... n ..........5.0 United Arab Emirates ...............................5.6Business impact of rules on FDI* ................................................................ 4 .......... n ..........5.8 Ireland ......................................................6.7Openness to multilateral trade rules (0–100) ............................................. 36 .......... n ........75.1 Slovenia .................................................92.2
7.05 Index of physical security (1–7) ................................................................... 7 .......... n ..........6.5 Qatar ........................................................6.8Reliability of police services* ..................................................................... 15 .......... n ..........6.0 Finland .....................................................6.7Business costs of crime and violence* ........................................................ 5 .......... n ..........6.3 Qatar ........................................................6.8Business costs of terrorism* ..................................................................... 18 .......... n ..........6.3 Slovenia ...................................................6.7Homicide cases/100,000 pop. ................................................................... 9 .......... n ..........0.8 Hong Kong SAR ......................................0.2Index of terrorism incidence (1-7) ............................................................... 1 .......... n ..........7.0 Multiple economies (48) ...........................7.0
© 2014 World Economic Forum

Country/Economy Profiles
204 | The Global Enabling Trade Report 2014
* From the list of factors above, respondents were asked to select the five most problematic for trading in their country and to rank them between 1 (most problematic) and 5. The bars in the figure show the responses weighted according to their rankings.
For methodology, indicator descriptions and sources, and for a list of multiple best-performing economies, see page 45.
0 105 15 20 25 30
0 5 10 15 20 25 30
2
3
4
5
6
7
Operating environment
Availability & use of ICTs
Availability & quality of transport services
Availability & quality of transport infrastructure
Efficiency & transparency of border administration
Foreign market access
Domestic market access
1
Enabling Trade Index 2014 Rank Score (out of 138) (1–7)
Enabling Trade Index 2014 .................... 63 ......4.1
Subindex A: Market access (25%) ....................28 .......4.3Pillar 1: Domestic market access .....................................23 ........ 5.5Pillar 2: Foreign market access ........................................50 .........3.1
Subindex B: Border administration (25%) ........85 .......4.0Pillar 3: Efficiency & transparency of border administration ...................................................85 .........4.0
Subindex C: Infrastructure (25%) ......................80 .......3.6Pillar 4: Availability & quality of transport infrastructure ...82 ........ 3.0Pillar 5: Availability & quality of transport services .........100 ........ 3.6Pillar 6: Availability & use of ICTs .....................................58 ........ 4.3
Subindex D: Operating environment (25%) ......43 .......4.5Pillar 7: Operating environment ........................................43 ........ 4.5
Key indicators, 2012 Rank/138
Population (millions) ...............................................................2.1 ......... 121GDP (US$ billions) ................................................................ 9.6 ......... 121GDP per capita (US$) .....................................................4,660.1 ........... 81
Merchandise tradeTrade openness (imports+exports)/GDP .......................... 108.8 ........... 25Share of world trade (%) ..................................................... 0.03 ......... 105Total Exports (US$ billions) ................................................... 4.0 ......... 107Total Imports (US$ billions) ................................................... 6.5 ......... 107
Value chain indicators, 2012Share (%) of merchandise trade Exports Imports
Capital goods ..................................................................... 6.0 .......... 9.0
Intermediate goods .......................................................... 56.4 ........ 60.1Food and beverages (industrial) ......................................0.7 .......... 2.4Industrial supplies (primary and processed) ................. 51.1 ........ 43.0Parts and accessories .................................................... 3.4 .......... 4.7Fuels and lubricants ........................................................1.2 ........ 10.0
Consumer goods .............................................................. 32.6 .........17.9Food and beverages (consumer) ...................................10.2 .......... 8.4Transport equipment and consumer goods ..................22.4 .......... 9.5
Passenger motor cars ........................................................ 0.0 .......... 2.1
Others .................................................................................. 4.9 ........ 10.8
The most problematic factors for trade, 2013Most problematic factors for exporting Score*
Identifying potential markets and buyers ...............................................................14.7Access to trade finance .........................................................................................11.6Technical requirements and standards abroad .....................................................10.4Difficulties in meeting quality/quantity requirements of buyers ..............................10.4Access to imported inputs at competitive prices ................................................... 9.0Inappropriate production technology and skills ...................................................... 8.8Burdensome procedures at foreign borders .......................................................... 8.4High cost or delays caused by domestic transportation ........................................ 6.8High cost or delays caused by international transportation ................................... 6.6Rules of origin requirements abroad ....................................................................... 5.5Tariff barriers abroad .............................................................................................. 4.2Corruption at foreign borders ................................................................................. 3.6
Most problematic factors for importing Score*
Burdensome import procedures ...........................................................................20.1High cost or delays caused by international transportation .................................. 17.9Tariffs .....................................................................................................................15.3High cost or delays caused by domestic transportation .......................................13.9Domestic technical requirements and standards ................................................. 13.2Corruption at the border ........................................................................................12.0Inappropriate telecommunications infrastructure ................................................... 4.8Crime and theft ....................................................................................................... 2.8
Macedonia, FYR
Sources: International Monetary Fund, World Bank, World Trade Organization, United Nations COMTRADE
Macedonia, FYR Land-Locked Developing Countries
Central and Eastern Europe
© 2014 World Economic Forum

Country/Economy Profiles
The Global Enabling Trade Report 2014 | 205
* Indicator derived from the World Economic Forum’s Executive Opinion Survey and measured on a 1-to-7 scale, where 7 indicates best outcome.
The Enabling Trade Index 2014 in detail n Competitive Advantage n Competitive Disadvantage
For methodology, indicator descriptions and sources, and for a list of multiple best-performing economies, see page 45. Macedonia, FYR
INDICATOR, UNITS RANK/138 VALUE BEST PERFORMER VALUE
Pillar 1: Domestic market access (1–7) ........................................................... 23 ...........................5.5 Multiple economies (2) ................................ 7.0 1.01 Tariff rate (%)............................................................................................. 69 .......... n ..........5.3 Multiple economies (2) .............................0.0 1.02 Complexity of tariffs index (1–7) ................................................................ 84 .......... n ..........5.2 Multiple economies (2) .............................7.0
Tariff dispersion (standard deviation) ......................................................... 83 .......... n ..........8.6 Multiple economies (2) .............................0.0Tariff peaks (% of tariff lines) ..................................................................... 89 .......... n ..........8.0 Multiple economies (24) ...........................0.0Specific tariffs (% of tariff lines) ................................................................. 89 .......... n ..........3.2 Multiple economies (54) ...........................0.0Number of distinct tariffs ........................................................................... 96 .......... n .........343 Multiple economies (2) ................................1
1.03 Share of duty-free imports (%) .................................................................. 12 .......... n ........88.1 Multiple economies (2) .........................100.0
Pillar 2: Foreign market access (1–7) .............................................................. 50 ...........................3.1 Cambodia ..................................................... 5.3 2.01 Tariffs faced (%) ...................................................................................... 119 .......... n ..........5.7 Chile .........................................................3.5 2.02 Index of margin of preference in destination mkts (0–100) ........................ 16 .......... n ........58.0 Mauritius ................................................97.1
Pillar 3: Efficiency and transparency of border administration (1–7) .............. 85 ...........................4.0 Singapore..................................................... 6.3 3.01 Customs services index (0–1) ................................................................. 111 .......... n ........0.23 Singapore...............................................0.97 3.02 Efficiency of the clearance process (1–5) ................................................ 107 .......... n ..........2.4 Norway ....................................................4.2 3.03 No. of days to import ............................................................................... 36 .......... n ...........11 Singapore....................................................4 3.04 No. of documents to import ..................................................................... 82 .......... n .............8 Multiple economies (2) ................................2 3.05 Cost to import (US$ per container) ........................................................... 73 .......... n ......1,380 Singapore................................................440 3.06 No. of days to export................................................................................ 41 .......... n ...........12 Multiple economies (5) ................................6 3.07 No. of documents to export ..................................................................... 65 .......... n .............6 Multiple economies (2) ................................2 3.08 Cost to export (US$ per container) ........................................................... 88 .......... n ......1,376 Malaysia ..................................................450 3.09 Irregular payments in exports and imports*............................................... 42 .......... n ..........4.5 New Zealand ............................................6.6 3.10 Time predictability of import procedures* .................................................. 51 .......... n ..........4.2 Finland .....................................................6.0 3.11 Customs transparency index (0–1) ......................................................... 102 .......... n ........0.50 Multiple economies (35) .........................1.00
Pillar 4: Availability and quality of transport infrastructure (1-7) ..................... 82 ...........................3.0 United Arab Emirates ................................... 6.5 4.01 Available int’l airline seat km/week, millions ............................................ 126 .......... n ........13.1 United States ..................................11,481.7 4.02 Quality of air transport infrastructure* ........................................................ 73 .......... n ..........4.3 Singapore.................................................6.8 4.03 Quality of railroad infrastructure* ............................................................... 91 .......... n ..........1.9 Japan .......................................................6.7 4.04 Liner Shipping Connectivity Index (0–157.1) ............................................ n/a ........................n/a China ...................................................157.5 4.05 Quality of port infrastructure* .................................................................... 84 .......... n ..........3.8 Netherlands ..............................................6.8 4.06 Paved roads (% of total) ........................................................................... 60 .......... n ........57.6 Multiple economies (18) .......................100.0 4.07 Quality of roads* ..................................................................................... 102 .......... n ..........3.0 United Arab Emirates ...............................6.6
Pillar 5: Availability and quality of transport services (1–7) .......................... 100 ...........................3.6 Singapore..................................................... 5.7 5.01 Ease and affordability of shipment (1–5).................................................. 124 .......... n ..........2.4 Luxembourg .............................................3.8 5.02 Logistics competence (1–5) .................................................................... 105 .......... n ..........2.5 Norway ....................................................4.2 5.03 Tracking and tracing ability (1–5) ............................................................. 114 .......... n ..........2.5 Germany ..................................................4.2 5.04 Timeliness of shipments in reaching destination (1–5) ............................. 114 .......... n ..........2.8 Luxembourg .............................................4.7 5.05 Postal services efficiency* ......................................................................... 67 .......... n ..........4.6 Japan .......................................................6.8 5.06 Efficiency of transport mode change* ....................................................... 82 .......... n ..........3.7 Hong Kong SAR ......................................6.4
Pillar 6: Availability and use of ICTs (1–7) ........................................................ 58 ...........................4.3 Sweden ........................................................ 6.5 6.01 Mobile phone subscriptions/100 pop. ...................................................... 77 .......... n ......106.2 Hong Kong SAR ..................................229.2 6.02 Individuals using Internet (%) .................................................................... 42 .......... n ........63.1 Iceland ...................................................96.2 6.03 Fixed broadband Internet subscriptions/100 pop. .................................... 45 .......... n ........13.7 Switzerland ............................................39.9 6.04 Active mobile broadband Internet subscriptions/100 pop. ........................ 62 .......... n ........24.0 Singapore.............................................124.5 6.05 ICT use for business-to-business transactions* ........................................ 55 .......... n ..........5.0 Finland .....................................................6.2 6.06 Internet use for business-to-consumer transactions* ................................ 82 .......... n ..........4.3 United Kingdom .......................................6.3 6.07 Government Online Service Index (0–1) .................................................... 82 .......... n ........0.45 Multiple economies (3) ...........................1.00
Pillar 7: Operating environment (1–7) .............................................................. 43 ...........................4.5 Hong Kong SAR ............................................ 5.8 7.01 Protection of property index (1–7) ............................................................. 52 .......... n ..........4.2 Finland .....................................................6.3
Property rights* ......................................................................................... 53 .......... n ..........4.5 Finland .....................................................6.4Intellectual property protection* ................................................................ 49 .......... n ..........3.9 Finland .....................................................6.2
7.02 Efficiency and accountability of public institutions index (1–7) ................... 48 .......... n ..........3.8 Singapore.................................................6.0Judicial efficiency & impartiality in commercial disputes (0–4)................... n/a ........................n/a Multiple economies (7) .............................4.0Diversion of public funds* ......................................................................... 45 .......... n ..........3.8 New Zealand ............................................6.5Ease of compliance with government regulation* ...................................... 34 .......... n ..........3.8 Singapore.................................................5.4
7.03 Access to finance index (1–7) .................................................................. 69 .......... n ..........3.8 Hong Kong SAR ......................................5.7Affordability of financial services* ............................................................. 79 .......... n ..........4.0 Hong Kong SAR ......................................6.1Availability of financial services* ................................................................ 77 .......... n ..........4.3 Switzerland ..............................................6.4Ease of access to loans* .......................................................................... 60 .......... n ..........2.9 Qatar ........................................................4.9Availability of trade finance* ...................................................................... 58 .......... n ..........4.0 Hong Kong SAR ......................................5.8
7.04 Openness to foreign participation index (1–7) ........................................... 11 .......... n ..........5.0 Ireland ......................................................5.5Ease of hiring foreign labour* .................................................................... 41 .......... n ..........4.4 United Arab Emirates ...............................5.6Business impact of rules on FDI* .............................................................. 41 .......... n ..........4.9 Ireland ......................................................6.7Openness to multilateral trade rules (0–100) ............................................. 10 .......... n ........82.7 Slovenia .................................................92.2
7.05 Index of physical security (1–7) ................................................................. 50 .......... n ..........5.8 Qatar ........................................................6.8Reliability of police services* ..................................................................... 57 .......... n ..........4.4 Finland .....................................................6.7Business costs of crime and violence* ...................................................... 58 .......... n ..........4.9 Qatar ........................................................6.8Business costs of terrorism* ..................................................................... 55 .......... n ..........5.7 Slovenia ...................................................6.7Homicide cases/100,000 pop. ................................................................. 41 .......... n ..........1.5 Hong Kong SAR ......................................0.2Index of terrorism incidence (1-7) ............................................................. 71 .......... n ..........7.0 Multiple economies (48) ...........................7.0
© 2014 World Economic Forum

Country/Economy Profiles
206 | The Global Enabling Trade Report 2014
* From the list of factors above, respondents were asked to select the five most problematic for trading in their country and to rank them between 1 (most problematic) and 5. The bars in the figure show the responses weighted according to their rankings.
For methodology, indicator descriptions and sources, and for a list of multiple best-performing economies, see page 45.
0 105 15 20 25 30
0 5 10 15 20 25 30
2
3
4
5
6
7
Operating environment
Availability & use of ICTs
Availability & quality of transport services
Availability & quality of transport infrastructure
Efficiency & transparency of border administration
Foreign market access
Domestic market access
1
Enabling Trade Index 2014 Rank Score (out of 138) (1–7)
Enabling Trade Index 2014 ...................103 ..... 3.6
Subindex A: Market access (25%) ....................24 .......4.3Pillar 1: Domestic market access .....................................91 .........4.4Pillar 2: Foreign market access ..........................................8 ........ 4.2
Subindex B: Border administration (25%) ........91 .......3.8Pillar 3: Efficiency & transparency of border administration ...................................................91 ........ 3.8
Subindex C: Infrastructure (25%) ....................129 .......2.5Pillar 4: Availability & quality of transport infrastructure . 124 .........2.3Pillar 5: Availability & quality of transport services .........123 ........ 3.2Pillar 6: Availability & use of ICTs ...................................130 .........2.0
Subindex D: Operating environment (25%) .... 117 .......3.5Pillar 7: Operating environment ...................................... 117 ........ 3.5
Key indicators, 2012 Rank/138
Population (millions) .............................................................22.4 ........... 48GDP (US$ billions) ...............................................................10.1 ..........118GDP per capita (US$) ........................................................451.5 ......... 135
Merchandise tradeTrade openness (imports+exports)/GDP ............................ 45.6 ..........113Share of world trade (%) ......................................................0.01 ......... 126Total Exports (US$ billions) ....................................................1.5 ......... 124Total Imports (US$ billions) ....................................................3.1 ......... 124
Value chain indicators, 2012Share (%) of merchandise trade Exports Imports
Capital goods ..................................................................... 0.8 ........ 12.0
Intermediate goods .......................................................... 34.0 ........ 47.5Food and beverages (industrial) ..................................... 3.5 .......... 5.0Industrial supplies (primary and processed) .................30.1 ........ 34.2Parts and accessories .................................................... 0.3 .......... 6.6Fuels and lubricants ....................................................... 0.0 ...........1.7
Consumer goods .............................................................. 58.4 ........ 15.9Food and beverages (consumer) ...................................29.1 .......... 8.1Transport equipment and consumer goods ................. 29.3 ...........7.7
Passenger motor cars ........................................................ 0.0 .......... 3.1
Others .................................................................................. 6.8 ........ 21.5
The most problematic factors for trade, 2013Most problematic factors for exporting Score*
Identifying potential markets and buyers ...............................................................15.4Access to trade finance .........................................................................................15.1Difficulties in meeting quality/quantity requirements of buyers ............................. 13.2Inappropriate production technology and skills ...................................................... 9.3Burdensome procedures at foreign borders .......................................................... 8.3Technical requirements and standards abroad .......................................................7.7Access to imported inputs at competitive prices ....................................................7.6High cost or delays caused by international transportation ................................... 6.7High cost or delays caused by domestic transportation .........................................5.7Corruption at foreign borders ................................................................................. 5.0Rules of origin requirements abroad ....................................................................... 4.2Tariff barriers abroad ...............................................................................................1.8
Most problematic factors for importing Score*
Tariffs .....................................................................................................................19.7Burdensome import procedures ...........................................................................19.1Corruption at the border ........................................................................................18.0High cost or delays caused by international transportation ..................................13.3Crime and theft ......................................................................................................12.1High cost or delays caused by domestic transportation .........................................7.8Inappropriate telecommunications infrastructure ................................................... 5.5Domestic technical requirements and standards ................................................... 4.4
Madagascar
Sources: International Monetary Fund, World Bank, World Trade Organization, United Nations COMTRADE
Madagascar Least Developed Countries
Sub-Saharan Africa
© 2014 World Economic Forum

Country/Economy Profiles
The Global Enabling Trade Report 2014 | 207
* Indicator derived from the World Economic Forum’s Executive Opinion Survey and measured on a 1-to-7 scale, where 7 indicates best outcome.
The Enabling Trade Index 2014 in detail n Competitive Advantage n Competitive Disadvantage
For methodology, indicator descriptions and sources, and for a list of multiple best-performing economies, see page 45. Madagascar
INDICATOR, UNITS RANK/138 VALUE BEST PERFORMER VALUE
Pillar 1: Domestic market access (1–7) ........................................................... 91 ...........................4.4 Multiple economies (2) ................................ 7.0 1.01 Tariff rate (%)............................................................................................. 88 .......... n ..........8.0 Multiple economies (2) .............................0.0 1.02 Complexity of tariffs index (1–7) ................................................................ 12 .......... n ..........6.7 Multiple economies (2) .............................7.0
Tariff dispersion (standard deviation) ......................................................... 32 .......... n ..........7.0 Multiple economies (2) .............................0.0Tariff peaks (% of tariff lines) ....................................................................... 1 .......... n ..........0.0 Multiple economies (24) ...........................0.0Specific tariffs (% of tariff lines) ................................................................... 1 .......... n ..........0.0 Multiple economies (54) ...........................0.0Number of distinct tariffs ............................................................................. 5 .......... n .............4 Multiple economies (2) ................................1
1.03 Share of duty-free imports (%) ................................................................ 105 .......... n ........28.3 Multiple economies (2) .........................100.0
Pillar 2: Foreign market access (1–7) ................................................................ 8 ...........................4.2 Cambodia ..................................................... 5.3 2.01 Tariffs faced (%) ........................................................................................ 16 .......... n ..........4.9 Chile .........................................................3.5 2.02 Index of margin of preference in destination mkts (0–100) ........................ 10 .......... n ........62.2 Mauritius ................................................97.1
Pillar 3: Efficiency and transparency of border administration (1–7) .............. 91 ...........................3.8 Singapore..................................................... 6.3 3.01 Customs services index (0–1) ................................................................... 88 .......... n ........0.44 Singapore...............................................0.97 3.02 Efficiency of the clearance process (1–5) ................................................ 129 .......... n ..........2.1 Norway ....................................................4.2 3.03 No. of days to import ............................................................................... 83 .......... n ...........21 Singapore....................................................4 3.04 No. of documents to import ................................................................... 101 .......... n .............9 Multiple economies (2) ................................2 3.05 Cost to import (US$ per container) ........................................................... 89 .......... n ......1,555 Singapore................................................440 3.06 No. of days to export................................................................................ 96 .......... n ...........22 Multiple economies (5) ................................6 3.07 No. of documents to export ..................................................................... 40 .......... n .............5 Multiple economies (2) ................................2 3.08 Cost to export (US$ per container) ........................................................... 72 .......... n ......1,195 Malaysia ..................................................450 3.09 Irregular payments in exports and imports*............................................. 113 .......... n ..........2.6 New Zealand ............................................6.6 3.10 Time predictability of import procedures* ................................................ 104 .......... n ..........3.3 Finland .....................................................6.0 3.11 Customs transparency index (0–1) ........................................................... 73 .......... n ........0.77 Multiple economies (35) .........................1.00
Pillar 4: Availability and quality of transport infrastructure (1-7) ................... 124 ...........................2.3 United Arab Emirates ................................... 6.5 4.01 Available int’l airline seat km/week, millions ............................................ 102 .......... n ........39.9 United States ..................................11,481.7 4.02 Quality of air transport infrastructure* ........................................................ 98 .......... n ..........3.6 Singapore.................................................6.8 4.03 Quality of railroad infrastructure* ............................................................... 86 .......... n ..........2.0 Japan .......................................................6.7 4.04 Liner Shipping Connectivity Index (0–157.1) ............................................. 73 .......... n ........11.9 China ...................................................157.5 4.05 Quality of port infrastructure* .................................................................... 96 .......... n ..........3.5 Netherlands ..............................................6.8 4.06 Paved roads (% of total) ......................................................................... 108 .......... n ........16.3 Multiple economies (18) .......................100.0 4.07 Quality of roads* ..................................................................................... 120 .......... n ..........2.6 United Arab Emirates ...............................6.6
Pillar 5: Availability and quality of transport services (1–7) .......................... 123 ...........................3.2 Singapore..................................................... 5.7 5.01 Ease and affordability of shipment (1–5).................................................. 125 .......... n ..........2.4 Luxembourg .............................................3.8 5.02 Logistics competence (1–5) .................................................................... 122 .......... n ..........2.3 Norway ....................................................4.2 5.03 Tracking and tracing ability (1–5) ............................................................. 126 .......... n ..........2.3 Germany ..................................................4.2 5.04 Timeliness of shipments in reaching destination (1–5) ............................... 90 .......... n ..........3.1 Luxembourg .............................................4.7 5.05 Postal services efficiency* ....................................................................... 115 .......... n ..........3.2 Japan .......................................................6.8 5.06 Efficiency of transport mode change* ..................................................... 117 .......... n ..........3.1 Hong Kong SAR ......................................6.4
Pillar 6: Availability and use of ICTs (1–7) ...................................................... 130 ...........................2.0 Sweden ........................................................ 6.5 6.01 Mobile phone subscriptions/100 pop. .................................................... 132 .......... n ........39.4 Hong Kong SAR ..................................229.2 6.02 Individuals using Internet (%) .................................................................. 133 .......... n ..........2.1 Iceland ...................................................96.2 6.03 Fixed broadband Internet subscriptions/100 pop. .................................. 126 .......... n ..........0.0 Switzerland ............................................39.9 6.04 Active mobile broadband Internet subscriptions/100 pop. ...................... 122 .......... n ..........0.1 Singapore.............................................124.5 6.05 ICT use for business-to-business transactions* ...................................... 105 .......... n ..........4.4 Finland .....................................................6.2 6.06 Internet use for business-to-consumer transactions* ................................ 97 .......... n ..........4.0 United Kingdom .......................................6.3 6.07 Government Online Service Index (0–1) .................................................. 106 .......... n ........0.32 Multiple economies (3) ...........................1.00
Pillar 7: Operating environment (1–7) ............................................................ 117 ...........................3.5 Hong Kong SAR ............................................ 5.8 7.01 Protection of property index (1–7) ........................................................... 121 .......... n ..........2.9 Finland .....................................................6.3
Property rights* ....................................................................................... 126 .......... n ..........2.9 Finland .....................................................6.4Intellectual property protection* .............................................................. 100 .......... n ..........2.9 Finland .....................................................6.2
7.02 Efficiency and accountability of public institutions index (1–7) ................. 131 .......... n ..........2.6 Singapore.................................................6.0Judicial efficiency & impartiality in commercial disputes (0–4).................. 120 .......... n ..........0.8 Multiple economies (7) .............................4.0Diversion of public funds* ....................................................................... 122 .......... n ..........2.3 New Zealand ............................................6.5Ease of compliance with government regulation* ...................................... 85 .......... n ..........3.3 Singapore.................................................5.4
7.03 Access to finance index (1–7) ................................................................ 110 .......... n ..........3.2 Hong Kong SAR ......................................5.7Affordability of financial services* ........................................................... 124 .......... n ..........3.2 Hong Kong SAR ......................................6.1Availability of financial services* .............................................................. 117 .......... n ..........3.6 Switzerland ..............................................6.4Ease of access to loans* .......................................................................... 77 .......... n ..........2.7 Qatar ........................................................4.9Availability of trade finance* .................................................................... 104 .......... n ..........3.2 Hong Kong SAR ......................................5.8
7.04 Openness to foreign participation index (1–7) ........................................... 86 .......... n ..........4.2 Ireland ......................................................5.5Ease of hiring foreign labour* .................................................................... 75 .......... n ..........4.1 United Arab Emirates ...............................5.6Business impact of rules on FDI* ............................................................ 101 .......... n ..........4.0 Ireland ......................................................6.7Openness to multilateral trade rules (0–100) ............................................. 64 .......... n ........64.8 Slovenia .................................................92.2
7.05 Index of physical security (1–7) ................................................................. 97 .......... n ..........4.8 Qatar ........................................................6.8Reliability of police services* ................................................................... 128 .......... n ..........2.8 Finland .....................................................6.7Business costs of crime and violence* .................................................... 111 .......... n ..........3.5 Qatar ........................................................6.8Business costs of terrorism* ................................................................... 101 .......... n ..........4.8 Slovenia ...................................................6.7Homicide cases/100,000 pop. ................................................................. 95 .......... n ..........8.1 Hong Kong SAR ......................................0.2Index of terrorism incidence (1-7) ............................................................. 74 .......... n ..........7.0 Multiple economies (48) ...........................7.0
© 2014 World Economic Forum

Country/Economy Profiles
208 | The Global Enabling Trade Report 2014
* From the list of factors above, respondents were asked to select the five most problematic for trading in their country and to rank them between 1 (most problematic) and 5. The bars in the figure show the responses weighted according to their rankings.
For methodology, indicator descriptions and sources, and for a list of multiple best-performing economies, see page 45.
0 105 15 20 25 30
0 5 10 15 20 25 30
2
3
4
5
6
7
Operating environment
Availability & use of ICTs
Availability & quality of transport services
Availability & quality of transport infrastructure
Efficiency & transparency of border administration
Foreign market access
Domestic market access
1
Enabling Trade Index 2014 Rank Score (out of 138) (1–7)
Enabling Trade Index 2014 ...................112 ..... 3.5
Subindex A: Market access (25%) ....................15 .......4.5Pillar 1: Domestic market access .....................................45 .........4.9Pillar 2: Foreign market access ........................................ 11 .........4.1
Subindex B: Border administration (25%) ......130 .......3.0Pillar 3: Efficiency & transparency of border administration .................................................130 ........ 3.0
Subindex C: Infrastructure (25%) ....................121 .......2.7Pillar 4: Availability & quality of transport infrastructure .100 .........2.7Pillar 5: Availability & quality of transport services ...........94 ........ 3.6Pillar 6: Availability & use of ICTs ...................................134 .........1.9
Subindex D: Operating environment (25%) ....108 .......3.6Pillar 7: Operating environment ......................................108 ........ 3.6
Key indicators, 2012 Rank/138
Population (millions) .............................................................16.6 ........... 57GDP (US$ billions) ................................................................ 4.2 ......... 131GDP per capita (US$) ........................................................251.0 ......... 138
Merchandise tradeTrade openness (imports+exports)/GDP ............................ 85.6 ........... 42Share of world trade (%) ......................................................0.01 ......... 128Total Exports (US$ billions) ....................................................1.2 ......... 129Total Imports (US$ billions) ....................................................2.7 ......... 127
Value chain indicators, 2011Share (%) of merchandise trade Exports Imports
Capital goods ..................................................................... 2.4 .........17.4
Intermediate goods .......................................................... 81.8 ........54.6Food and beverages (industrial) ....................................18.2 .......... 6.4Industrial supplies (primary and processed) ................ 63.2 ........ 42.8Parts and accessories .................................................... 0.3 .......... 5.3Fuels and lubricants ........................................................0.1 ...........0.1
Consumer goods ...............................................................14.4 .........17.6Food and beverages (consumer) ...................................11.5 .......... 2.0Transport equipment and consumer goods ....................2.9 ........ 15.7
Passenger motor cars .........................................................0.1 .......... 2.0
Others ...................................................................................1.3 .......... 8.4
The most problematic factors for trade, 2013Most problematic factors for exporting Score*
Access to trade finance .........................................................................................14.1High cost or delays caused by domestic transportation .......................................12.8Identifying potential markets and buyers ...............................................................12.5Difficulties in meeting quality/quantity requirements of buyers ..............................11.8High cost or delays caused by international transportation ................................... 9.3Inappropriate production technology and skills .......................................................7.9Corruption at foreign borders .................................................................................. 7.1Access to imported inputs at competitive prices ................................................... 6.6Burdensome procedures at foreign borders ...........................................................5.7Tariff barriers abroad .............................................................................................. 4.2Technical requirements and standards abroad .......................................................4.1Rules of origin requirements abroad ....................................................................... 3.9
Most problematic factors for importing Score*
Tariffs .....................................................................................................................22.7Corruption at the border ....................................................................................... 18.2Burdensome import procedures ........................................................................... 17.4High cost or delays caused by international transportation ..................................15.2High cost or delays caused by domestic transportation ........................................ 8.3Crime and theft ........................................................................................................7.6Inappropriate telecommunications infrastructure ................................................... 5.8Domestic technical requirements and standards ....................................................4.7
Malawi
Sources: International Monetary Fund, World Bank, World Trade Organization, United Nations COMTRADE
Malawi Land-Locked, Least Developed Countries
Sub-Saharan Africa
© 2014 World Economic Forum

Country/Economy Profiles
The Global Enabling Trade Report 2014 | 209
* Indicator derived from the World Economic Forum’s Executive Opinion Survey and measured on a 1-to-7 scale, where 7 indicates best outcome.
The Enabling Trade Index 2014 in detail n Competitive Advantage n Competitive Disadvantage
For methodology, indicator descriptions and sources, and for a list of multiple best-performing economies, see page 45. Malawi
INDICATOR, UNITS RANK/138 VALUE BEST PERFORMER VALUE
Pillar 1: Domestic market access (1–7) ........................................................... 45 ...........................4.9 Multiple economies (2) ................................ 7.0 1.01 Tariff rate (%)........................................................................................... 101 .......... n ..........9.7 Multiple economies (2) .............................0.0 1.02 Complexity of tariffs index (1–7) ................................................................ 39 .......... n ..........6.5 Multiple economies (2) .............................7.0
Tariff dispersion (standard deviation) ....................................................... 110 .......... n ........12.0 Multiple economies (2) .............................0.0Tariff peaks (% of tariff lines) ..................................................................... 27 .......... n ..........0.1 Multiple economies (24) ...........................0.0Specific tariffs (% of tariff lines) ................................................................... 1 .......... n ..........0.0 Multiple economies (54) ...........................0.0Number of distinct tariffs ........................................................................... 35 .......... n .............9 Multiple economies (2) ................................1
1.03 Share of duty-free imports (%) .................................................................. 36 .......... n ........68.2 Multiple economies (2) .........................100.0
Pillar 2: Foreign market access (1–7) .............................................................. 11 ...........................4.1 Cambodia ..................................................... 5.3 2.01 Tariffs faced (%) ........................................................................................ 31 .......... n ..........5.1 Chile .........................................................3.5 2.02 Index of margin of preference in destination mkts (0–100) .......................... 4 .......... n ........67.6 Mauritius ................................................97.1
Pillar 3: Efficiency and transparency of border administration (1–7) ............ 130 ...........................3.0 Singapore..................................................... 6.3 3.01 Customs services index (0–1) .................................................................. n/a ........................n/a Singapore...............................................0.97 3.02 Efficiency of the clearance process (1–5) .................................................. 61 .......... n ..........2.8 Norway ....................................................4.2 3.03 No. of days to import ............................................................................. 127 .......... n ...........43 Singapore....................................................4 3.04 No. of documents to import ................................................................... 126 .......... n ...........11 Multiple economies (2) ................................2 3.05 Cost to import (US$ per container) ......................................................... 124 .......... n ......2,870 Singapore................................................440 3.06 No. of days to export.............................................................................. 125 .......... n ...........34 Multiple economies (5) ................................6 3.07 No. of documents to export ................................................................... 130 .......... n ...........10 Multiple economies (2) ................................2 3.08 Cost to export (US$ per container) ......................................................... 117 .......... n ......2,175 Malaysia ..................................................450 3.09 Irregular payments in exports and imports*............................................. 100 .......... n ..........2.9 New Zealand ............................................6.6 3.10 Time predictability of import procedures* .................................................. 84 .......... n ..........3.6 Finland .....................................................6.0 3.11 Customs transparency index (0–1) .......................................................... n/a ........................n/a Multiple economies (35) .........................1.00
Pillar 4: Availability and quality of transport infrastructure (1-7) ................... 100 ...........................2.7 United Arab Emirates ................................... 6.5 4.01 Available int’l airline seat km/week, millions ............................................ 133 .......... n ..........5.8 United States ..................................11,481.7 4.02 Quality of air transport infrastructure* ...................................................... 129 .......... n ..........2.9 Singapore.................................................6.8 4.03 Quality of railroad infrastructure* ............................................................... 89 .......... n ..........1.9 Japan .......................................................6.7 4.04 Liner Shipping Connectivity Index (0–157.1) ............................................ n/a ........................n/a China ...................................................157.5 4.05 Quality of port infrastructure* .................................................................. 109 .......... n ..........3.3 Netherlands ..............................................6.8 4.06 Paved roads (% of total) ........................................................................... 73 .......... n ........45.0 Multiple economies (18) .......................100.0 4.07 Quality of roads* ....................................................................................... 88 .......... n ..........3.3 United Arab Emirates ...............................6.6
Pillar 5: Availability and quality of transport services (1–7) ............................ 94 ...........................3.6 Singapore..................................................... 5.7 5.01 Ease and affordability of shipment (1–5).................................................. 105 .......... n ..........2.6 Luxembourg .............................................3.8 5.02 Logistics competence (1–5) ...................................................................... 70 .......... n ..........2.9 Norway ....................................................4.2 5.03 Tracking and tracing ability (1–5) ............................................................... 97 .......... n ..........2.6 Germany ..................................................4.2 5.04 Timeliness of shipments in reaching destination (1–5) ............................. 100 .......... n ..........3.0 Luxembourg .............................................4.7 5.05 Postal services efficiency* ......................................................................... 92 .......... n ..........3.9 Japan .......................................................6.8 5.06 Efficiency of transport mode change* ..................................................... 103 .......... n ..........3.4 Hong Kong SAR ......................................6.4
Pillar 6: Availability and use of ICTs (1–7) ...................................................... 134 ...........................1.9 Sweden ........................................................ 6.5 6.01 Mobile phone subscriptions/100 pop. .................................................... 135 .......... n ........29.2 Hong Kong SAR ..................................229.2 6.02 Individuals using Internet (%) .................................................................. 125 .......... n ..........4.4 Iceland ...................................................96.2 6.03 Fixed broadband Internet subscriptions/100 pop. .................................. 133 .......... n ..........0.0 Switzerland ............................................39.9 6.04 Active mobile broadband Internet subscriptions/100 pop. ...................... 102 .......... n ..........3.5 Singapore.............................................124.5 6.05 ICT use for business-to-business transactions* ...................................... 104 .......... n ..........4.4 Finland .....................................................6.2 6.06 Internet use for business-to-consumer transactions* .............................. 118 .......... n ..........3.4 United Kingdom .......................................6.3 6.07 Government Online Service Index (0–1) .................................................. 123 .......... n ........0.22 Multiple economies (3) ...........................1.00
Pillar 7: Operating environment (1–7) ............................................................ 108 ...........................3.6 Hong Kong SAR ............................................ 5.8 7.01 Protection of property index (1–7) ............................................................. 82 .......... n ..........3.6 Finland .....................................................6.3
Property rights* ......................................................................................... 88 .......... n ..........3.8 Finland .....................................................6.4Intellectual property protection* ................................................................ 83 .......... n ..........3.4 Finland .....................................................6.2
7.02 Efficiency and accountability of public institutions index (1–7) ................... 78 .......... n ..........3.4 Singapore.................................................6.0Judicial efficiency & impartiality in commercial disputes (0–4)................... n/a ........................n/a Multiple economies (7) .............................4.0Diversion of public funds* ......................................................................... 71 .......... n ..........3.1 New Zealand ............................................6.5Ease of compliance with government regulation* ...................................... 44 .......... n ..........3.7 Singapore.................................................5.4
7.03 Access to finance index (1–7) ................................................................ 106 .......... n ..........3.2 Hong Kong SAR ......................................5.7Affordability of financial services* ........................................................... 113 .......... n ..........3.5 Hong Kong SAR ......................................6.1Availability of financial services* .............................................................. 109 .......... n ..........3.7 Switzerland ..............................................6.4Ease of access to loans* .......................................................................... 86 .......... n ..........2.6 Qatar ........................................................4.9Availability of trade finance* .................................................................... 111 .......... n ..........3.1 Hong Kong SAR ......................................5.8
7.04 Openness to foreign participation index (1–7) ......................................... 118 .......... n ..........3.6 Ireland ......................................................5.5Ease of hiring foreign labour* .................................................................... 83 .......... n ..........3.9 United Arab Emirates ...............................5.6Business impact of rules on FDI* .............................................................. 99 .......... n ..........4.1 Ireland ......................................................6.7Openness to multilateral trade rules (0–100) ........................................... 120 .......... n ........43.3 Slovenia .................................................92.2
7.05 Index of physical security (1–7) ............................................................... 113 .......... n ..........4.3 Qatar ........................................................6.8Reliability of police services* ..................................................................... 79 .......... n ..........3.9 Finland .....................................................6.7Business costs of crime and violence* .................................................... 103 .......... n ..........3.9 Qatar ........................................................6.8Business costs of terrorism* ..................................................................... 56 .......... n ..........5.7 Slovenia ...................................................6.7Homicide cases/100,000 pop. ............................................................... 132 .......... n ........36.0 Hong Kong SAR ......................................0.2Index of terrorism incidence (1-7) ............................................................... 1 .......... n ..........7.0 Multiple economies (48) ...........................7.0
© 2014 World Economic Forum

Country/Economy Profiles
210 | The Global Enabling Trade Report 2014
* From the list of factors above, respondents were asked to select the five most problematic for trading in their country and to rank them between 1 (most problematic) and 5. The bars in the figure show the responses weighted according to their rankings.
For methodology, indicator descriptions and sources, and for a list of multiple best-performing economies, see page 45.
0 105 15 20 25 30
0 5 10 15 20 25 30
2
3
4
5
6
7
Operating environment
Availability & use of ICTs
Availability & quality of transport services
Availability & quality of transport infrastructure
Efficiency & transparency of border administration
Foreign market access
Domestic market access
1
Enabling Trade Index 2014 Rank Score (out of 138) (1–7)
Enabling Trade Index 2014 .................... 25 ..... 4.8
Subindex A: Market access (25%) ....................40 .......4.0Pillar 1: Domestic market access .....................................75 ........ 4.8Pillar 2: Foreign market access ........................................42 ........ 3.3
Subindex B: Border administration (25%) ........33 .......5.2Pillar 3: Efficiency & transparency of border administration ...................................................33 ........ 5.2
Subindex C: Infrastructure (25%) ......................23 .......5.1Pillar 4: Availability & quality of transport infrastructure ... 14 ........ 5.3Pillar 5: Availability & quality of transport services ...........26 .........5.1Pillar 6: Availability & use of ICTs .....................................38 .........5.0
Subindex D: Operating environment (25%) ......27 .......5.0Pillar 7: Operating environment ........................................27 .........5.0
Key indicators, 2012 Rank/138
Population (millions) ............................................................ 29.5 ........... 39GDP (US$ billions) ............................................................ 304.7 ........... 35GDP per capita (US$) .................................................. 10,344.9 ........... 56
Merchandise tradeTrade openness (imports+exports)/GDP ...........................139.7 ........... 13Share of world trade (%) ...................................................... 1.15 ........... 24Total Exports (US$ billions) ................................................227.4 ........... 24Total Imports (US$ billions) ................................................196.6 ........... 25
Value chain indicators, 2012Share (%) of merchandise trade Exports Imports
Capital goods ................................................................... 12.9 ........ 16.6
Intermediate goods .......................................................... 68.1 ........65.5Food and beverages (industrial) ......................................7.0 .......... 2.8Industrial supplies (primary and processed) ................ 22.8 ........ 28.4Parts and accessories ...................................................25.0 .........28.1Fuels and lubricants ......................................................13.3 .......... 6.1
Consumer goods ...............................................................12.1 .......... 8.4Food and beverages (consumer) .....................................2.4 .......... 3.5Transport equipment and consumer goods ....................9.7 .......... 4.9
Passenger motor cars .........................................................0.1 .......... 1.5
Others .................................................................................. 6.8 .......... 8.0
The most problematic factors for trade, 2013Most problematic factors for exporting Score*
Identifying potential markets and buyers ...............................................................12.9Access to imported inputs at competitive prices ................................................. 10.2Technical requirements and standards abroad ...................................................... 9.6Tariff barriers abroad .............................................................................................. 9.6Burdensome procedures at foreign borders .......................................................... 8.6Difficulties in meeting quality/quantity requirements of buyers ............................... 8.5Rules of origin requirements abroad ....................................................................... 8.3Inappropriate production technology and skills ...................................................... 8.2High cost or delays caused by domestic transportation ........................................ 6.7Corruption at foreign borders ................................................................................. 6.7High cost or delays caused by international transportation ................................... 5.5Access to trade finance ...........................................................................................5.1
Most problematic factors for importing Score*
Tariffs .....................................................................................................................20.1Burdensome import procedures ...........................................................................18.0Domestic technical requirements and standards ..................................................13.1High cost or delays caused by international transportation ..................................12.9Corruption at the border ........................................................................................ 11.1High cost or delays caused by domestic transportation .......................................10.6Crime and theft ....................................................................................................... 8.3Inappropriate telecommunications infrastructure ................................................... 6.0
Malaysia
Sources: International Monetary Fund, World Bank, World Trade Organization, United Nations COMTRADE
Malaysia
Developing Asia
© 2014 World Economic Forum

Country/Economy Profiles
The Global Enabling Trade Report 2014 | 211
* Indicator derived from the World Economic Forum’s Executive Opinion Survey and measured on a 1-to-7 scale, where 7 indicates best outcome.
The Enabling Trade Index 2014 in detail n Competitive Advantage n Competitive Disadvantage
For methodology, indicator descriptions and sources, and for a list of multiple best-performing economies, see page 45. Malaysia
INDICATOR, UNITS RANK/138 VALUE BEST PERFORMER VALUE
Pillar 1: Domestic market access (1–7) ........................................................... 75 ...........................4.8 Multiple economies (2) ................................ 7.0 1.01 Tariff rate (%)............................................................................................. 78 .......... n ..........6.2 Multiple economies (2) .............................0.0 1.02 Complexity of tariffs index (1–7) .............................................................. 101 .......... n ..........4.3 Multiple economies (2) .............................7.0
Tariff dispersion (standard deviation) ....................................................... 130 .......... n ........24.3 Multiple economies (2) .............................0.0Tariff peaks (% of tariff lines) ................................................................... 138 .......... n ........19.2 Multiple economies (24) ...........................0.0Specific tariffs (% of tariff lines) ................................................................. 78 .......... n ..........0.7 Multiple economies (54) ...........................0.0Number of distinct tariffs ........................................................................... 77 .......... n ...........91 Multiple economies (2) ................................1
1.03 Share of duty-free imports (%) .................................................................. 29 .......... n ........75.7 Multiple economies (2) .........................100.0
Pillar 2: Foreign market access (1–7) .............................................................. 42 ...........................3.3 Cambodia ..................................................... 5.3 2.01 Tariffs faced (%) ........................................................................................ 10 .......... n ..........4.5 Chile .........................................................3.5 2.02 Index of margin of preference in destination mkts (0–100) ........................ 84 .......... n ........16.5 Mauritius ................................................97.1
Pillar 3: Efficiency and transparency of border administration (1–7) .............. 33 ...........................5.2 Singapore..................................................... 6.3 3.01 Customs services index (0–1) ................................................................... 84 .......... n ........0.47 Singapore...............................................0.97 3.02 Efficiency of the clearance process (1–5) .................................................. 27 .......... n ..........3.4 Norway ....................................................4.2 3.03 No. of days to import ............................................................................... 16 .......... n .............8 Singapore....................................................4 3.04 No. of documents to import ..................................................................... 11 .......... n .............4 Multiple economies (2) ................................2 3.05 Cost to import (US$ per container) ............................................................. 2 .......... n .........485 Singapore................................................440 3.06 No. of days to export................................................................................ 35 .......... n ...........11 Multiple economies (5) ................................6 3.07 No. of documents to export ..................................................................... 16 .......... n .............4 Multiple economies (2) ................................2 3.08 Cost to export (US$ per container) ............................................................. 1 .......... n .........450 Malaysia ..................................................450 3.09 Irregular payments in exports and imports*............................................... 44 .......... n ..........4.4 New Zealand ............................................6.6 3.10 Time predictability of import procedures* .................................................. 23 .......... n ..........5.0 Finland .....................................................6.0 3.11 Customs transparency index (0–1) ........................................................... 59 .......... n ........0.80 Multiple economies (35) .........................1.00
Pillar 4: Availability and quality of transport infrastructure (1-7) ..................... 14 ...........................5.3 United Arab Emirates ................................... 6.5 4.01 Available int’l airline seat km/week, millions .............................................. 21 .......... n ...1,266.9 United States ..................................11,481.7 4.02 Quality of air transport infrastructure* ........................................................ 19 .......... n ..........5.8 Singapore.................................................6.8 4.03 Quality of railroad infrastructure* ............................................................... 17 .......... n ..........4.8 Japan .......................................................6.7 4.04 Liner Shipping Connectivity Index (0–157.1) ............................................... 5 .......... n ........98.2 China ...................................................157.5 4.05 Quality of port infrastructure* .................................................................... 23 .......... n ..........5.4 Netherlands ..............................................6.8 4.06 Paved roads (% of total) ........................................................................... 44 .......... n ........80.4 Multiple economies (18) .......................100.0 4.07 Quality of roads* ....................................................................................... 23 .......... n ..........5.4 United Arab Emirates ...............................6.6
Pillar 5: Availability and quality of transport services (1–7) ............................ 26 ...........................5.1 Singapore..................................................... 5.7 5.01 Ease and affordability of shipment (1–5).................................................... 10 .......... n ..........3.6 Luxembourg .............................................3.8 5.02 Logistics competence (1–5) ...................................................................... 32 .......... n ..........3.5 Norway ....................................................4.2 5.03 Tracking and tracing ability (1–5) ............................................................... 23 .......... n ..........3.6 Germany ..................................................4.2 5.04 Timeliness of shipments in reaching destination (1–5) ............................... 31 .......... n ..........3.9 Luxembourg .............................................4.7 5.05 Postal services efficiency* ......................................................................... 34 .......... n ..........5.6 Japan .......................................................6.8 5.06 Efficiency of transport mode change* ....................................................... 22 .......... n ..........5.2 Hong Kong SAR ......................................6.4
Pillar 6: Availability and use of ICTs (1–7) ........................................................ 38 ...........................5.0 Sweden ........................................................ 6.5 6.01 Mobile phone subscriptions/100 pop. ...................................................... 25 .......... n ......141.3 Hong Kong SAR ..................................229.2 6.02 Individuals using Internet (%) .................................................................... 38 .......... n ........65.8 Iceland ...................................................96.2 6.03 Fixed broadband Internet subscriptions/100 pop. .................................... 64 .......... n ..........8.4 Switzerland ............................................39.9 6.04 Active mobile broadband Internet subscriptions/100 pop. ........................ 78 .......... n ........11.3 Singapore.............................................124.5 6.05 ICT use for business-to-business transactions* ........................................ 28 .......... n ..........5.6 Finland .....................................................6.2 6.06 Internet use for business-to-consumer transactions* ................................ 22 .......... n ..........5.4 United Kingdom .......................................6.3 6.07 Government Online Service Index (0–1) .................................................... 20 .......... n ........0.79 Multiple economies (3) ...........................1.00
Pillar 7: Operating environment (1–7) .............................................................. 27 ...........................5.0 Hong Kong SAR ............................................ 5.8 7.01 Protection of property index (1–7) ............................................................. 29 .......... n ..........5.0 Finland .....................................................6.3
Property rights* ......................................................................................... 30 .......... n ..........5.2 Finland .....................................................6.4Intellectual property protection* ................................................................ 29 .......... n ..........4.8 Finland .....................................................6.2
7.02 Efficiency and accountability of public institutions index (1–7) ................... 28 .......... n ..........4.5 Singapore.................................................6.0Judicial efficiency & impartiality in commercial disputes (0–4).................... 44 .......... n ..........2.5 Multiple economies (7) .............................4.0Diversion of public funds* ......................................................................... 39 .......... n ..........4.2 New Zealand ............................................6.5Ease of compliance with government regulation* ........................................ 8 .......... n ..........4.6 Singapore.................................................5.4
7.03 Access to finance index (1–7) .................................................................. 12 .......... n ..........5.1 Hong Kong SAR ......................................5.7Affordability of financial services* ............................................................. 15 .......... n ..........5.4 Hong Kong SAR ......................................6.1Availability of financial services* ................................................................ 22 .......... n ..........5.5 Switzerland ..............................................6.4Ease of access to loans* ............................................................................ 5 .......... n ..........4.4 Qatar ........................................................4.9Availability of trade finance* ...................................................................... 12 .......... n ..........5.1 Hong Kong SAR ......................................5.8
7.04 Openness to foreign participation index (1–7) ........................................... 41 .......... n ..........4.6 Ireland ......................................................5.5Ease of hiring foreign labour* .................................................................... 29 .......... n ..........4.5 United Arab Emirates ...............................5.6Business impact of rules on FDI* .............................................................. 14 .......... n ..........5.4 Ireland ......................................................6.7Openness to multilateral trade rules (0–100) ............................................. 85 .......... n ........59.8 Slovenia .................................................92.2
7.05 Index of physical security (1–7) ................................................................. 54 .......... n ..........5.8 Qatar ........................................................6.8Reliability of police services* ..................................................................... 40 .......... n ..........4.9 Finland .....................................................6.7Business costs of crime and violence* ...................................................... 74 .......... n ..........4.6 Qatar ........................................................6.8Business costs of terrorism* ..................................................................... 76 .......... n ..........5.3 Slovenia ...................................................6.7Homicide cases/100,000 pop. ................................................................. 57 .......... n ..........2.3 Hong Kong SAR ......................................0.2Index of terrorism incidence (1-7) ............................................................. 80 .......... n ..........7.0 Multiple economies (48) ...........................7.0
© 2014 World Economic Forum

Country/Economy Profiles
212 | The Global Enabling Trade Report 2014
* From the list of factors above, respondents were asked to select the five most problematic for trading in their country and to rank them between 1 (most problematic) and 5. The bars in the figure show the responses weighted according to their rankings.
For methodology, indicator descriptions and sources, and for a list of multiple best-performing economies, see page 45.
0 105 15 20 25 30
0 5 10 15 20 25 30
2
3
4
5
6
7
Operating environment
Availability & use of ICTs
Availability & quality of transport services
Availability & quality of transport infrastructure
Efficiency & transparency of border administration
Foreign market access
Domestic market access
1
Enabling Trade Index 2014 Rank Score (out of 138) (1–7)
Enabling Trade Index 2014 ...................123 ......3.1
Subindex A: Market access (25%) .................. 116 .......3.1Pillar 1: Domestic market access ...................................105 .........4.1Pillar 2: Foreign market access ........................................90 ........ 2.2
Subindex B: Border administration (25%) ......132 .......2.7Pillar 3: Efficiency & transparency of border administration .................................................132 .........2.7
Subindex C: Infrastructure (25%) ......................98 .......3.1Pillar 4: Availability & quality of transport infrastructure ...84 ........ 3.0Pillar 5: Availability & quality of transport services ......... 111 ........ 3.5Pillar 6: Availability & use of ICTs ...................................106 .........2.8
Subindex D: Operating environment (25%) .... 118 .......3.5Pillar 7: Operating environment ...................................... 118 ........ 3.5
Key indicators, 2012 Rank/138
Population (millions) .............................................................16.3 ........... 58GDP (US$ billions) ...............................................................10.3 ..........116GDP per capita (US$) ........................................................631.3 ......... 129
Merchandise tradeTrade openness (imports+exports)/GDP ............................ 49.5 ......... 100Share of world trade (%) ......................................................0.01 ......... 124Total Exports (US$ billions) ................................................... 2.2 ..........118Total Imports (US$ billions) ....................................................2.9 ......... 125
Value chain indicators, 2012Share (%) of merchandise trade Exports Imports
Capital goods ..................................................................... 3.9 ........ 11.4
Intermediate goods .......................................................... 94.9 ........40.5Food and beverages (industrial) ......................................1.7 .......... 3.4Industrial supplies (primary and processed) .................92.7 ........ 26.8Parts and accessories .................................................... 0.4 .......... 9.8Fuels and lubricants ....................................................... 0.0 .......... 0.4
Consumer goods ................................................................ 1.2 ........ 18.8Food and beverages (consumer) .....................................1.0 .......... 8.7Transport equipment and consumer goods ................... 0.3 ........ 10.0
Passenger motor cars ........................................................ 0.0 .......... 1.5
Others .................................................................................. 0.0 ........ 27.9
The most problematic factors for trade, 2013Most problematic factors for exporting Score*
Identifying potential markets and buyers ...............................................................20.1Access to trade finance .........................................................................................17.2Difficulties in meeting quality/quantity requirements of buyers ..............................11.8Burdensome procedures at foreign borders .........................................................10.7Inappropriate production technology and skills ....................................................... 7.1Access to imported inputs at competitive prices ................................................... 6.3Corruption at foreign borders ..................................................................................6.1Tariff barriers abroad .............................................................................................. 6.0High cost or delays caused by domestic transportation ........................................ 4.9High cost or delays caused by international transportation ................................... 4.5Technical requirements and standards abroad ...................................................... 3.6Rules of origin requirements abroad ........................................................................1.8
Most problematic factors for importing Score*
Tariffs .................................................................................................................... 25.3Burdensome import procedures ........................................................................... 21.1Corruption at the border ....................................................................................... 20.9High cost or delays caused by international transportation ....................................9.1High cost or delays caused by domestic transportation .........................................8.1Crime and theft ........................................................................................................8.1Domestic technical requirements and standards ................................................... 3.9Inappropriate telecommunications infrastructure ................................................... 3.4
Mali
Sources: International Monetary Fund, World Bank, World Trade Organization, United Nations COMTRADE
Mali Land-Locked, Least Developed Countries
Sub-Saharan Africa
© 2014 World Economic Forum

Country/Economy Profiles
The Global Enabling Trade Report 2014 | 213
* Indicator derived from the World Economic Forum’s Executive Opinion Survey and measured on a 1-to-7 scale, where 7 indicates best outcome.
The Enabling Trade Index 2014 in detail n Competitive Advantage n Competitive Disadvantage
For methodology, indicator descriptions and sources, and for a list of multiple best-performing economies, see page 45. Mali
INDICATOR, UNITS RANK/138 VALUE BEST PERFORMER VALUE
Pillar 1: Domestic market access (1–7) ......................................................... 105 ...........................4.1 Multiple economies (2) ................................ 7.0 1.01 Tariff rate (%)........................................................................................... 109 .......... n ........10.8 Multiple economies (2) .............................0.0 1.02 Complexity of tariffs index (1–7) .................................................................. 6 .......... n ..........6.7 Multiple economies (2) .............................7.0
Tariff dispersion (standard deviation) ......................................................... 26 .......... n ..........6.8 Multiple economies (2) .............................0.0Tariff peaks (% of tariff lines) ....................................................................... 1 .......... n ..........0.0 Multiple economies (24) ...........................0.0Specific tariffs (% of tariff lines) ................................................................... 1 .......... n ..........0.0 Multiple economies (54) ...........................0.0Number of distinct tariffs ............................................................................. 5 .......... n .............4 Multiple economies (2) ................................1
1.03 Share of duty-free imports (%) ................................................................ 103 .......... n ........30.1 Multiple economies (2) .........................100.0
Pillar 2: Foreign market access (1–7) .............................................................. 90 ...........................2.2 Cambodia ..................................................... 5.3 2.01 Tariffs faced (%) ........................................................................................ 47 .......... n ..........5.3 Chile .........................................................3.5 2.02 Index of margin of preference in destination mkts (0–100) ........................ 93 .......... n ........11.1 Mauritius ................................................97.1
Pillar 3: Efficiency and transparency of border administration (1–7) ............ 132 ...........................2.7 Singapore..................................................... 6.3 3.01 Customs services index (0–1) .................................................................. n/a ........................n/a Singapore...............................................0.97 3.02 Efficiency of the clearance process (1–5) ................................................ 127 .......... n ..........2.1 Norway ....................................................4.2 3.03 No. of days to import ............................................................................. 113 .......... n ...........32 Singapore....................................................4 3.04 No. of documents to import ................................................................... 115 .......... n ...........10 Multiple economies (2) ................................2 3.05 Cost to import (US$ per container) ......................................................... 131 .......... n ......4,405 Singapore................................................440 3.06 No. of days to export.............................................................................. 110 .......... n ...........26 Multiple economies (5) ................................6 3.07 No. of documents to export ..................................................................... 65 .......... n .............6 Multiple economies (2) ................................2 3.08 Cost to export (US$ per container) ......................................................... 124 .......... n ......2,440 Malaysia ..................................................450 3.09 Irregular payments in exports and imports*............................................. 138 .......... n ..........1.7 New Zealand ............................................6.6 3.10 Time predictability of import procedures* .................................................. 86 .......... n ..........3.6 Finland .....................................................6.0 3.11 Customs transparency index (0–1) .......................................................... n/a ........................n/a Multiple economies (35) .........................1.00
Pillar 4: Availability and quality of transport infrastructure (1-7) ..................... 84 ...........................3.0 United Arab Emirates ................................... 6.5 4.01 Available int’l airline seat km/week, millions ............................................ 118 .......... n ........20.7 United States ..................................11,481.7 4.02 Quality of air transport infrastructure* ........................................................ 81 .......... n ..........4.1 Singapore.................................................6.8 4.03 Quality of railroad infrastructure* ............................................................... 73 .......... n ..........2.4 Japan .......................................................6.7 4.04 Liner Shipping Connectivity Index (0–157.1) ............................................ n/a ........................n/a China ...................................................157.5 4.05 Quality of port infrastructure* .................................................................... 76 .......... n ..........4.0 Netherlands ..............................................6.8 4.06 Paved roads (% of total) ........................................................................... 92 .......... n ........24.6 Multiple economies (18) .......................100.0 4.07 Quality of roads* ....................................................................................... 81 .......... n ..........3.5 United Arab Emirates ...............................6.6
Pillar 5: Availability and quality of transport services (1–7) .......................... 111 ...........................3.5 Singapore..................................................... 5.7 5.01 Ease and affordability of shipment (1–5).................................................... 82 .......... n ..........2.8 Luxembourg .............................................3.8 5.02 Logistics competence (1–5) .................................................................... 131 .......... n ..........2.2 Norway ....................................................4.2 5.03 Tracking and tracing ability (1–5) ............................................................... 89 .......... n ..........2.7 Germany ..................................................4.2 5.04 Timeliness of shipments in reaching destination (1–5) ............................. 104 .......... n ..........2.9 Luxembourg .............................................4.7 5.05 Postal services efficiency* ....................................................................... 116 .......... n ..........3.2 Japan .......................................................6.8 5.06 Efficiency of transport mode change* ....................................................... 83 .......... n ..........3.7 Hong Kong SAR ......................................6.4
Pillar 6: Availability and use of ICTs (1–7) ...................................................... 106 ...........................2.8 Sweden ........................................................ 6.5 6.01 Mobile phone subscriptions/100 pop. ...................................................... 87 .......... n ........98.4 Hong Kong SAR ..................................229.2 6.02 Individuals using Internet (%) .................................................................. 131 .......... n ..........2.2 Iceland ...................................................96.2 6.03 Fixed broadband Internet subscriptions/100 pop. .................................. 129 .......... n ..........0.0 Switzerland ............................................39.9 6.04 Active mobile broadband Internet subscriptions/100 pop. ...................... 115 .......... n ..........0.7 Singapore.............................................124.5 6.05 ICT use for business-to-business transactions* ........................................ 81 .......... n ..........4.7 Finland .....................................................6.2 6.06 Internet use for business-to-consumer transactions* .............................. 111 .......... n ..........3.6 United Kingdom .......................................6.3 6.07 Government Online Service Index (0–1) .................................................. 106 .......... n ........0.32 Multiple economies (3) ...........................1.00
Pillar 7: Operating environment (1–7) ............................................................ 118 ...........................3.5 Hong Kong SAR ............................................ 5.8 7.01 Protection of property index (1–7) ........................................................... 117 .......... n ..........3.0 Finland .....................................................6.3
Property rights* ....................................................................................... 117 .......... n ..........3.3 Finland .....................................................6.4Intellectual property protection* .............................................................. 118 .......... n ..........2.7 Finland .....................................................6.2
7.02 Efficiency and accountability of public institutions index (1–7) ................. 123 .......... n ..........2.7 Singapore.................................................6.0Judicial efficiency & impartiality in commercial disputes (0–4).................. 113 .......... n ..........1.0 Multiple economies (7) .............................4.0Diversion of public funds* ....................................................................... 120 .......... n ..........2.3 New Zealand ............................................6.5Ease of compliance with government regulation* ...................................... 81 .......... n ..........3.4 Singapore.................................................5.4
7.03 Access to finance index (1–7) ................................................................ 104 .......... n ..........3.3 Hong Kong SAR ......................................5.7Affordability of financial services* ............................................................. 97 .......... n ..........3.7 Hong Kong SAR ......................................6.1Availability of financial services* .............................................................. 118 .......... n ..........3.6 Switzerland ..............................................6.4Ease of access to loans* .......................................................................... 70 .......... n ..........2.8 Qatar ........................................................4.9Availability of trade finance* .................................................................... 105 .......... n ..........3.2 Hong Kong SAR ......................................5.8
7.04 Openness to foreign participation index (1–7) ........................................... 84 .......... n ..........4.2 Ireland ......................................................5.5Ease of hiring foreign labour* .................................................................... 36 .......... n ..........4.4 United Arab Emirates ...............................5.6Business impact of rules on FDI* ............................................................ 103 .......... n ..........3.9 Ireland ......................................................6.7Openness to multilateral trade rules (0–100) ............................................. 77 .......... n ........61.8 Slovenia .................................................92.2
7.05 Index of physical security (1–7) ............................................................... 109 .......... n ..........4.5 Qatar ........................................................6.8Reliability of police services* ................................................................... 103 .......... n ..........3.5 Finland .....................................................6.7Business costs of crime and violence* .................................................... 119 .......... n ..........3.3 Qatar ........................................................6.8Business costs of terrorism* ................................................................... 133 .......... n ..........2.9 Slovenia ...................................................6.7Homicide cases/100,000 pop. ................................................................. 94 .......... n ..........8.0 Hong Kong SAR ......................................0.2Index of terrorism incidence (1-7) ........................................................... 109 .......... n ..........6.7 Multiple economies (48) ...........................7.0
© 2014 World Economic Forum

Country/Economy Profiles
214 | The Global Enabling Trade Report 2014
* From the list of factors above, respondents were asked to select the five most problematic for trading in their country and to rank them between 1 (most problematic) and 5. The bars in the figure show the responses weighted according to their rankings.
For methodology, indicator descriptions and sources, and for a list of multiple best-performing economies, see page 45.
0 105 15 20 25 30
0 5 10 15 20 25 30
2
3
4
5
6
7
Operating environment
Availability & use of ICTs
Availability & quality of transport services
Availability & quality of transport infrastructure
Efficiency & transparency of border administration
Foreign market access
Domestic market access
1
Enabling Trade Index 2014 Rank Score (out of 138) (1–7)
Enabling Trade Index 2014 .................... 34 ..... 4.6
Subindex A: Market access (25%) ....................75 .......3.4Pillar 1: Domestic market access .....................................46 .........4.9Pillar 2: Foreign market access ........................................97 .........1.9
Subindex B: Border administration (25%) ........32 .......5.2Pillar 3: Efficiency & transparency of border administration ...................................................32 ........ 5.2
Subindex C: Infrastructure (25%) ......................31 .......4.8Pillar 4: Availability & quality of transport infrastructure ...29 .........4.4Pillar 5: Availability & quality of transport services ...........40 .........4.6Pillar 6: Availability & use of ICTs .....................................27 .........5.4
Subindex D: Operating environment (25%) ......26 .......5.0Pillar 7: Operating environment ........................................26 .........5.0
Key indicators, 2012 Rank/138
Population (millions) .............................................................. 0.4 ......... 137GDP (US$ billions) ................................................................ 8.8 ......... 123GDP per capita (US$) .................................................. 20,998.4 ........... 35
Merchandise tradeTrade openness (imports+exports)/GDP ...........................115.9 ........... 21Share of world trade (%) ..................................................... 0.03 ......... 104Total Exports (US$ billions) ................................................... 4.3 ......... 104Total Imports (US$ billions) ................................................... 6.6 ......... 105
Value chain indicators, 2012Share (%) of merchandise trade Exports Imports
Capital goods ..................................................................... 4.2 .......... 6.0
Intermediate goods .......................................................... 33.7 ........ 27.3Food and beverages (industrial) ..................................... 0.5 .......... 0.9Industrial supplies (primary and processed) .................. 6.3 .........11.8Parts and accessories .................................................. 26.9 ........ 14.2Fuels and lubricants ....................................................... 0.0 .......... 0.4
Consumer goods .............................................................. 16.5 ........20.9Food and beverages (consumer) .................................... 3.8 ...........7.2Transport equipment and consumer goods ..................12.7 ........ 13.7
Passenger motor cars ........................................................ 0.3 .......... 1.1
Others ................................................................................ 45.3 ........44.9
The most problematic factors for trade, 2013Most problematic factors for exporting Score*
Identifying potential markets and buyers ...............................................................16.7High cost or delays caused by international transportation ..................................14.6Access to imported inputs at competitive prices ..................................................14.2Difficulties in meeting quality/quantity requirements of buyers ............................. 10.2Access to trade finance .......................................................................................... 9.3High cost or delays caused by domestic transportation ........................................ 8.3Inappropriate production technology and skills .......................................................5.7Technical requirements and standards abroad ...................................................... 5.5Rules of origin requirements abroad ........................................................................5.1Burdensome procedures at foreign borders .......................................................... 4.3Tariff barriers abroad .............................................................................................. 3.5Corruption at foreign borders ................................................................................. 2.6
Most problematic factors for importing Score*
High cost or delays caused by international transportation ................................. 29.4Burdensome import procedures ...........................................................................21.4Tariffs .....................................................................................................................15.2High cost or delays caused by domestic transportation .......................................13.5Domestic technical requirements and standards ..................................................11.2Crime and theft ....................................................................................................... 4.0Corruption at the border ......................................................................................... 2.8Inappropriate telecommunications infrastructure ................................................... 2.6
Malta
Sources: International Monetary Fund, World Bank, World Trade Organization, United Nations COMTRADE
Malta
Advanced economies
© 2014 World Economic Forum
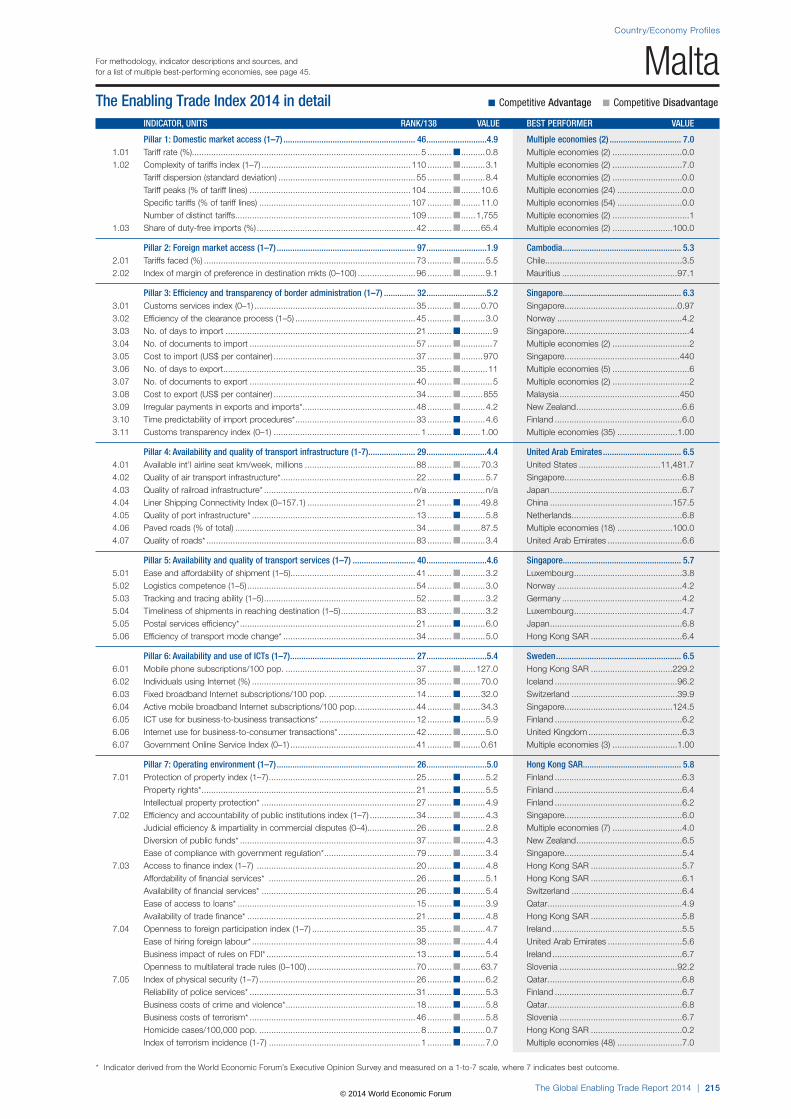
Country/Economy Profiles
The Global Enabling Trade Report 2014 | 215
* Indicator derived from the World Economic Forum’s Executive Opinion Survey and measured on a 1-to-7 scale, where 7 indicates best outcome.
The Enabling Trade Index 2014 in detail n Competitive Advantage n Competitive Disadvantage
For methodology, indicator descriptions and sources, and for a list of multiple best-performing economies, see page 45. Malta
INDICATOR, UNITS RANK/138 VALUE BEST PERFORMER VALUE
Pillar 1: Domestic market access (1–7) ........................................................... 46 ...........................4.9 Multiple economies (2) ................................ 7.0 1.01 Tariff rate (%)............................................................................................... 5 .......... n ..........0.8 Multiple economies (2) .............................0.0 1.02 Complexity of tariffs index (1–7) .............................................................. 110 .......... n ..........3.1 Multiple economies (2) .............................7.0
Tariff dispersion (standard deviation) ......................................................... 55 .......... n ..........8.4 Multiple economies (2) .............................0.0Tariff peaks (% of tariff lines) ................................................................... 104 .......... n ........10.6 Multiple economies (24) ...........................0.0Specific tariffs (% of tariff lines) ............................................................... 107 .......... n ........11.0 Multiple economies (54) ...........................0.0Number of distinct tariffs ......................................................................... 109 .......... n ......1,755 Multiple economies (2) ................................1
1.03 Share of duty-free imports (%) .................................................................. 42 .......... n ........65.4 Multiple economies (2) .........................100.0
Pillar 2: Foreign market access (1–7) .............................................................. 97 ...........................1.9 Cambodia ..................................................... 5.3 2.01 Tariffs faced (%) ........................................................................................ 73 .......... n ..........5.5 Chile .........................................................3.5 2.02 Index of margin of preference in destination mkts (0–100) ........................ 96 .......... n ..........9.1 Mauritius ................................................97.1
Pillar 3: Efficiency and transparency of border administration (1–7) .............. 32 ...........................5.2 Singapore..................................................... 6.3 3.01 Customs services index (0–1) ................................................................... 35 .......... n ........0.70 Singapore...............................................0.97 3.02 Efficiency of the clearance process (1–5) .................................................. 45 .......... n ..........3.0 Norway ....................................................4.2 3.03 No. of days to import ............................................................................... 21 .......... n .............9 Singapore....................................................4 3.04 No. of documents to import ..................................................................... 57 .......... n .............7 Multiple economies (2) ................................2 3.05 Cost to import (US$ per container) ........................................................... 37 .......... n .........970 Singapore................................................440 3.06 No. of days to export................................................................................ 35 .......... n ...........11 Multiple economies (5) ................................6 3.07 No. of documents to export ..................................................................... 40 .......... n .............5 Multiple economies (2) ................................2 3.08 Cost to export (US$ per container) ........................................................... 34 .......... n .........855 Malaysia ..................................................450 3.09 Irregular payments in exports and imports*............................................... 48 .......... n ..........4.2 New Zealand ............................................6.6 3.10 Time predictability of import procedures* .................................................. 33 .......... n ..........4.6 Finland .....................................................6.0 3.11 Customs transparency index (0–1) ............................................................. 1 .......... n ........1.00 Multiple economies (35) .........................1.00
Pillar 4: Availability and quality of transport infrastructure (1-7) ..................... 29 ...........................4.4 United Arab Emirates ................................... 6.5 4.01 Available int’l airline seat km/week, millions .............................................. 88 .......... n ........70.3 United States ..................................11,481.7 4.02 Quality of air transport infrastructure* ........................................................ 22 .......... n ..........5.7 Singapore.................................................6.8 4.03 Quality of railroad infrastructure* .............................................................. n/a ........................n/a Japan .......................................................6.7 4.04 Liner Shipping Connectivity Index (0–157.1) ............................................. 21 .......... n ........49.8 China ...................................................157.5 4.05 Quality of port infrastructure* .................................................................... 13 .......... n ..........5.8 Netherlands ..............................................6.8 4.06 Paved roads (% of total) ........................................................................... 34 .......... n ........87.5 Multiple economies (18) .......................100.0 4.07 Quality of roads* ....................................................................................... 83 .......... n ..........3.4 United Arab Emirates ...............................6.6
Pillar 5: Availability and quality of transport services (1–7) ............................ 40 ...........................4.6 Singapore..................................................... 5.7 5.01 Ease and affordability of shipment (1–5).................................................... 41 .......... n ..........3.2 Luxembourg .............................................3.8 5.02 Logistics competence (1–5) ...................................................................... 54 .......... n ..........3.0 Norway ....................................................4.2 5.03 Tracking and tracing ability (1–5) ............................................................... 52 .......... n ..........3.2 Germany ..................................................4.2 5.04 Timeliness of shipments in reaching destination (1–5) ............................... 83 .......... n ..........3.2 Luxembourg .............................................4.7 5.05 Postal services efficiency* ......................................................................... 21 .......... n ..........6.0 Japan .......................................................6.8 5.06 Efficiency of transport mode change* ....................................................... 34 .......... n ..........5.0 Hong Kong SAR ......................................6.4
Pillar 6: Availability and use of ICTs (1–7) ........................................................ 27 ...........................5.4 Sweden ........................................................ 6.5 6.01 Mobile phone subscriptions/100 pop. ...................................................... 37 .......... n ......127.0 Hong Kong SAR ..................................229.2 6.02 Individuals using Internet (%) .................................................................... 35 .......... n ........70.0 Iceland ...................................................96.2 6.03 Fixed broadband Internet subscriptions/100 pop. .................................... 14 .......... n ........32.0 Switzerland ............................................39.9 6.04 Active mobile broadband Internet subscriptions/100 pop. ........................ 44 .......... n ........34.3 Singapore.............................................124.5 6.05 ICT use for business-to-business transactions* ........................................ 12 .......... n ..........5.9 Finland .....................................................6.2 6.06 Internet use for business-to-consumer transactions* ................................ 42 .......... n ..........5.0 United Kingdom .......................................6.3 6.07 Government Online Service Index (0–1) .................................................... 41 .......... n ........0.61 Multiple economies (3) ...........................1.00
Pillar 7: Operating environment (1–7) .............................................................. 26 ...........................5.0 Hong Kong SAR ............................................ 5.8 7.01 Protection of property index (1–7) ............................................................. 25 .......... n ..........5.2 Finland .....................................................6.3
Property rights* ......................................................................................... 21 .......... n ..........5.5 Finland .....................................................6.4Intellectual property protection* ................................................................ 27 .......... n ..........4.9 Finland .....................................................6.2
7.02 Efficiency and accountability of public institutions index (1–7) ................... 34 .......... n ..........4.3 Singapore.................................................6.0Judicial efficiency & impartiality in commercial disputes (0–4).................... 26 .......... n ..........2.8 Multiple economies (7) .............................4.0Diversion of public funds* ......................................................................... 37 .......... n ..........4.3 New Zealand ............................................6.5Ease of compliance with government regulation* ...................................... 79 .......... n ..........3.4 Singapore.................................................5.4
7.03 Access to finance index (1–7) .................................................................. 20 .......... n ..........4.8 Hong Kong SAR ......................................5.7Affordability of financial services* ............................................................. 26 .......... n ..........5.1 Hong Kong SAR ......................................6.1Availability of financial services* ................................................................ 26 .......... n ..........5.4 Switzerland ..............................................6.4Ease of access to loans* .......................................................................... 15 .......... n ..........3.9 Qatar ........................................................4.9Availability of trade finance* ...................................................................... 21 .......... n ..........4.8 Hong Kong SAR ......................................5.8
7.04 Openness to foreign participation index (1–7) ........................................... 35 .......... n ..........4.7 Ireland ......................................................5.5Ease of hiring foreign labour* .................................................................... 38 .......... n ..........4.4 United Arab Emirates ...............................5.6Business impact of rules on FDI* .............................................................. 13 .......... n ..........5.4 Ireland ......................................................6.7Openness to multilateral trade rules (0–100) ............................................. 70 .......... n ........63.7 Slovenia .................................................92.2
7.05 Index of physical security (1–7) ................................................................. 26 .......... n ..........6.2 Qatar ........................................................6.8Reliability of police services* ..................................................................... 31 .......... n ..........5.3 Finland .....................................................6.7Business costs of crime and violence* ...................................................... 18 .......... n ..........5.8 Qatar ........................................................6.8Business costs of terrorism* ..................................................................... 46 .......... n ..........5.8 Slovenia ...................................................6.7Homicide cases/100,000 pop. ................................................................... 8 .......... n ..........0.7 Hong Kong SAR ......................................0.2Index of terrorism incidence (1-7) ............................................................... 1 .......... n ..........7.0 Multiple economies (48) ...........................7.0
© 2014 World Economic Forum

Country/Economy Profiles
216 | The Global Enabling Trade Report 2014
* From the list of factors above, respondents were asked to select the five most problematic for trading in their country and to rank them between 1 (most problematic) and 5. The bars in the figure show the responses weighted according to their rankings.
For methodology, indicator descriptions and sources, and for a list of multiple best-performing economies, see page 45.
0 105 15 20 25 30
0 5 10 15 20 25 30
2
3
4
5
6
7
Operating environment
Availability & use of ICTs
Availability & quality of transport services
Availability & quality of transport infrastructure
Efficiency & transparency of border administration
Foreign market access
Domestic market access
1
Enabling Trade Index 2014 Rank Score (out of 138) (1–7)
Enabling Trade Index 2014 ...................129 ..... 3.0
Subindex A: Market access (25%) ..................106 .......3.3Pillar 1: Domestic market access ................................... 118 ........ 3.5Pillar 2: Foreign market access ........................................52 ........ 3.0
Subindex B: Border administration (25%) ......128 .......3.0Pillar 3: Efficiency & transparency of border administration ................................................. 128 ........ 3.0
Subindex C: Infrastructure (25%) ....................128 .......2.5Pillar 4: Availability & quality of transport infrastructure .130 .........2.1Pillar 5: Availability & quality of transport services .........136 .........2.8Pillar 6: Availability & use of ICTs ................................... 113 .........2.6
Subindex D: Operating environment (25%) ....127 .......3.3Pillar 7: Operating environment ...................................... 127 ........ 3.3
Key indicators, 2012 Rank/138
Population (millions) .............................................................. 3.6 ..........111GDP (US$ billions) ................................................................ 3.9 ......... 132GDP per capita (US$) .....................................................1,085.7 ..........115
Merchandise tradeTrade openness (imports+exports)/GDP ...........................126.2 ........... 17Share of world trade (%) ..................................................... 0.02 ......... 121Total Exports (US$ billions) ....................................................2.6 ..........112Total Imports (US$ billions) ................................................... 3.2 ......... 121
Value chain indicators, 2012Share (%) of merchandise trade Exports Imports
Capital goods ..................................................................... 0.0 ........ 16.4
Intermediate goods .......................................................... 75.4 ........45.3Food and beverages (industrial) ..................................... 0.2 ...........7.3Industrial supplies (primary and processed) ................ 64.8 ........ 16.7Parts and accessories .................................................... 0.0 ........ 19.6Fuels and lubricants ......................................................10.3 .......... 1.6
Consumer goods .............................................................. 21.8 ........ 10.1Food and beverages (consumer) ...................................21.8 .......... 6.4Transport equipment and consumer goods ................... 0.0 .......... 3.7
Passenger motor cars ........................................................ 0.0 .......... 3.6
Others .................................................................................. 2.8 ........ 24.6
The most problematic factors for trade, 2013Most problematic factors for exporting Score*
Access to trade finance .........................................................................................19.4Identifying potential markets and buyers ...............................................................15.2High cost or delays caused by international transportation ..................................15.2High cost or delays caused by domestic transportation .......................................10.9Tariff barriers abroad ...............................................................................................7.9Corruption at foreign borders ................................................................................. 6.7Burdensome procedures at foreign borders .......................................................... 6.7Inappropriate production technology and skills ...................................................... 5.5Access to imported inputs at competitive prices ................................................... 4.8Difficulties in meeting quality/quantity requirements of buyers ............................... 3.6Technical requirements and standards abroad ...................................................... 2.4Rules of origin requirements abroad ........................................................................1.8
Most problematic factors for importing Score*
High cost or delays caused by international transportation ................................. 26.2Corruption at the border ........................................................................................24.4Burdensome import procedures .......................................................................... 18.3Tariffs .....................................................................................................................11.6High cost or delays caused by domestic transportation .......................................10.4Inappropriate telecommunications infrastructure ....................................................7.3Domestic technical requirements and standards ....................................................1.8Crime and theft ....................................................................................................... 0.0
Mauritania
Sources: International Monetary Fund, World Bank, World Trade Organization, United Nations COMTRADE
Mauritania Least Developed Countries
Middle East, North Africa, and Pakistan
© 2014 World Economic Forum

Country/Economy Profiles
The Global Enabling Trade Report 2014 | 217
* Indicator derived from the World Economic Forum’s Executive Opinion Survey and measured on a 1-to-7 scale, where 7 indicates best outcome.
The Enabling Trade Index 2014 in detail n Competitive Advantage n Competitive Disadvantage
For methodology, indicator descriptions and sources, and for a list of multiple best-performing economies, see page 45. Mauritania
INDICATOR, UNITS RANK/138 VALUE BEST PERFORMER VALUE
Pillar 1: Domestic market access (1–7) ......................................................... 118 ...........................3.5 Multiple economies (2) ................................ 7.0 1.01 Tariff rate (%)........................................................................................... 115 .......... n ........11.1 Multiple economies (2) .............................0.0 1.02 Complexity of tariffs index (1–7) ................................................................ 15 .......... n ..........6.7 Multiple economies (2) .............................7.0
Tariff dispersion (standard deviation) ......................................................... 39 .......... n ..........7.3 Multiple economies (2) .............................0.0Tariff peaks (% of tariff lines) ....................................................................... 1 .......... n ..........0.0 Multiple economies (24) ...........................0.0Specific tariffs (% of tariff lines) ................................................................... 1 .......... n ..........0.0 Multiple economies (54) ...........................0.0Number of distinct tariffs ............................................................................. 5 .......... n .............4 Multiple economies (2) ................................1
1.03 Share of duty-free imports (%) ................................................................ 128 .......... n ..........4.4 Multiple economies (2) .........................100.0
Pillar 2: Foreign market access (1–7) .............................................................. 52 ...........................3.0 Cambodia ..................................................... 5.3 2.01 Tariffs faced (%) ........................................................................................ 50 .......... n ..........5.3 Chile .........................................................3.5 2.02 Index of margin of preference in destination mkts (0–100) ........................ 49 .......... n ........39.2 Mauritius ................................................97.1
Pillar 3: Efficiency and transparency of border administration (1–7) ............ 128 ...........................3.0 Singapore..................................................... 6.3 3.01 Customs services index (0–1) .................................................................. n/a ........................n/a Singapore...............................................0.97 3.02 Efficiency of the clearance process (1–5) ................................................ 135 .......... n ..........1.9 Norway ....................................................4.2 3.03 No. of days to import ............................................................................. 123 .......... n ...........38 Singapore....................................................4 3.04 No. of documents to import ..................................................................... 82 .......... n .............8 Multiple economies (2) ................................2 3.05 Cost to import (US$ per container) ........................................................... 88 .......... n ......1,523 Singapore................................................440 3.06 No. of days to export.............................................................................. 120 .......... n ...........31 Multiple economies (5) ................................6 3.07 No. of documents to export ................................................................... 108 .......... n .............8 Multiple economies (2) ................................2 3.08 Cost to export (US$ per container) ......................................................... 104 .......... n ......1,640 Malaysia ..................................................450 3.09 Irregular payments in exports and imports*............................................. 120 .......... n ..........2.4 New Zealand ............................................6.6 3.10 Time predictability of import procedures* ................................................ 118 .......... n ..........3.1 Finland .....................................................6.0 3.11 Customs transparency index (0–1) .......................................................... n/a ........................n/a Multiple economies (35) .........................1.00
Pillar 4: Availability and quality of transport infrastructure (1-7) ................... 130 ...........................2.1 United Arab Emirates ................................... 6.5 4.01 Available int’l airline seat km/week, millions ............................................ 129 .......... n ........10.2 United States ..................................11,481.7 4.02 Quality of air transport infrastructure* ...................................................... 134 .......... n ..........2.3 Singapore.................................................6.8 4.03 Quality of railroad infrastructure* ............................................................... 84 .......... n ..........2.0 Japan .......................................................6.7 4.04 Liner Shipping Connectivity Index (0–157.1) ............................................. 89 .......... n ..........6.5 China ...................................................157.5 4.05 Quality of port infrastructure* .................................................................. 117 .......... n ..........2.9 Netherlands ..............................................6.8 4.06 Paved roads (% of total) ........................................................................... 87 .......... n ........29.7 Multiple economies (18) .......................100.0 4.07 Quality of roads* ..................................................................................... 115 .......... n ..........2.7 United Arab Emirates ...............................6.6
Pillar 5: Availability and quality of transport services (1–7) .......................... 136 ...........................2.8 Singapore..................................................... 5.7 5.01 Ease and affordability of shipment (1–5).................................................. 138 .......... n ..........2.1 Luxembourg .............................................3.8 5.02 Logistics competence (1–5) .................................................................... 138 .......... n ..........2.1 Norway ....................................................4.2 5.03 Tracking and tracing ability (1–5) ............................................................. 128 .......... n ..........2.2 Germany ..................................................4.2 5.04 Timeliness of shipments in reaching destination (1–5) ............................. 122 .......... n ..........2.8 Luxembourg .............................................4.7 5.05 Postal services efficiency* ....................................................................... 128 .......... n ..........2.4 Japan .......................................................6.8 5.06 Efficiency of transport mode change* ..................................................... 123 .......... n ..........2.9 Hong Kong SAR ......................................6.4
Pillar 6: Availability and use of ICTs (1–7) ...................................................... 113 ...........................2.6 Sweden ........................................................ 6.5 6.01 Mobile phone subscriptions/100 pop. ...................................................... 78 .......... n ......106.0 Hong Kong SAR ..................................229.2 6.02 Individuals using Internet (%) .................................................................. 121 .......... n ..........5.4 Iceland ...................................................96.2 6.03 Fixed broadband Internet subscriptions/100 pop. .................................. 114 .......... n ..........0.2 Switzerland ............................................39.9 6.04 Active mobile broadband Internet subscriptions/100 pop. ...................... 104 .......... n ..........3.1 Singapore.............................................124.5 6.05 ICT use for business-to-business transactions* ........................................ 82 .......... n ..........4.7 Finland .....................................................6.2 6.06 Internet use for business-to-consumer transactions* .............................. 128 .......... n ..........3.1 United Kingdom .......................................6.3 6.07 Government Online Service Index (0–1) .................................................. 134 .......... n ........0.08 Multiple economies (3) ...........................1.00
Pillar 7: Operating environment (1–7) ............................................................ 127 ...........................3.3 Hong Kong SAR ............................................ 5.8 7.01 Protection of property index (1–7) ........................................................... 128 .......... n ..........2.6 Finland .....................................................6.3
Property rights* ....................................................................................... 129 .......... n ..........2.8 Finland .....................................................6.4Intellectual property protection* .............................................................. 122 .......... n ..........2.5 Finland .....................................................6.2
7.02 Efficiency and accountability of public institutions index (1–7) ................. 106 .......... n ..........3.1 Singapore.................................................6.0Judicial efficiency & impartiality in commercial disputes (0–4).................... 77 .......... n ..........1.8 Multiple economies (7) .............................4.0Diversion of public funds* ....................................................................... 111 .......... n ..........2.4 New Zealand ............................................6.5Ease of compliance with government regulation* ...................................... 83 .......... n ..........3.3 Singapore.................................................5.4
7.03 Access to finance index (1–7) ................................................................ 128 .......... n ..........2.7 Hong Kong SAR ......................................5.7Affordability of financial services* ........................................................... 127 .......... n ..........3.1 Hong Kong SAR ......................................6.1Availability of financial services* .............................................................. 130 .......... n ..........3.1 Switzerland ..............................................6.4Ease of access to loans* ........................................................................ 123 .......... n ..........1.9 Qatar ........................................................4.9Availability of trade finance* .................................................................... 124 .......... n ..........2.6 Hong Kong SAR ......................................5.8
7.04 Openness to foreign participation index (1–7) ......................................... 124 .......... n ..........3.3 Ireland ......................................................5.5Ease of hiring foreign labour* .................................................................. 124 .......... n ..........3.2 United Arab Emirates ...............................5.6Business impact of rules on FDI* ............................................................ 114 .......... n ..........3.5 Ireland ......................................................6.7Openness to multilateral trade rules (0–100) ........................................... 112 .......... n ........49.9 Slovenia .................................................92.2
7.05 Index of physical security (1–7) ................................................................. 96 .......... n ..........4.8 Qatar ........................................................6.8Reliability of police services* ................................................................... 118 .......... n ..........3.0 Finland .....................................................6.7Business costs of crime and violence* ...................................................... 37 .......... n ..........5.3 Qatar ........................................................6.8Business costs of terrorism* ..................................................................... 99 .......... n ..........4.8 Slovenia ...................................................6.7Homicide cases/100,000 pop. ............................................................... 112 .......... n ........14.7 Hong Kong SAR ......................................0.2Index of terrorism incidence (1-7) ............................................................. 86 .......... n ..........7.0 Multiple economies (48) ...........................7.0
© 2014 World Economic Forum

Country/Economy Profiles
218 | The Global Enabling Trade Report 2014
* From the list of factors above, respondents were asked to select the five most problematic for trading in their country and to rank them between 1 (most problematic) and 5. The bars in the figure show the responses weighted according to their rankings.
For methodology, indicator descriptions and sources, and for a list of multiple best-performing economies, see page 45.
0 105 15 20 25 30
0 5 10 15 20 25 30
2
3
4
5
6
7
Operating environment
Availability & use of ICTs
Availability & quality of transport services
Availability & quality of transport infrastructure
Efficiency & transparency of border administration
Foreign market access
Domestic market access
1
Enabling Trade Index 2014 Rank Score (out of 138) (1–7)
Enabling Trade Index 2014 .................... 29 ......4.7
Subindex A: Market access (25%) ......................3 .......5.3Pillar 1: Domestic market access .......................................4 .........6.1Pillar 2: Foreign market access ..........................................5 ........ 4.5
Subindex B: Border administration (25%) ........53 .......4.7Pillar 3: Efficiency & transparency of border administration ...................................................53 .........4.7
Subindex C: Infrastructure (25%) ......................56 .......4.1Pillar 4: Availability & quality of transport infrastructure ...37 ........ 4.2Pillar 5: Availability & quality of transport services ...........67 .........4.0Pillar 6: Availability & use of ICTs .....................................66 .........4.1
Subindex D: Operating environment (25%) ......32 .......4.8Pillar 7: Operating environment ........................................32 ........ 4.8
Key indicators, 2012 Rank/138
Population (millions) ...............................................................1.3 ......... 130GDP (US$ billions) ...............................................................11.5 ..........113GDP per capita (US$) .................................................... 8,850.2 ........... 61
Merchandise tradeTrade openness (imports+exports)/GDP .............................74.8 ........... 57Share of world trade (%) ..................................................... 0.02 ..........115Total Exports (US$ billions) ....................................................2.7 ..........111Total Imports (US$ billions) ................................................... 5.4 ..........114
Value chain indicators, 2012Share (%) of merchandise trade Exports Imports
Capital goods ......................................................................1.0 ........ 11.3
Intermediate goods .......................................................... 20.3 ........39.4Food and beverages (industrial) ..................................... 6.9 .......... 3.9Industrial supplies (primary and processed) .................13.2 .........27.1Parts and accessories .................................................... 0.2 .......... 5.5Fuels and lubricants ....................................................... 0.0 .......... 2.9
Consumer goods .............................................................. 78.7 ........28.5Food and beverages (consumer) ...................................28.7 .........15.1Transport equipment and consumer goods ................. 50.0 ........ 13.4
Passenger motor cars ........................................................ 0.0 ..........3.2
Others .................................................................................. 0.0 .........17.7
The most problematic factors for trade, 2013Most problematic factors for exporting Score*
Identifying potential markets and buyers .............................................................. 20.9High cost or delays caused by international transportation ..................................12.6Access to imported inputs at competitive prices ..................................................12.5Access to trade finance ......................................................................................... 11.1Inappropriate production technology and skills .......................................................8.1Technical requirements and standards abroad .......................................................7.8Burdensome procedures at foreign borders ........................................................... 7.1Tariff barriers abroad .............................................................................................. 5.4Difficulties in meeting quality/quantity requirements of buyers ............................... 5.2Rules of origin requirements abroad ....................................................................... 3.3High cost or delays caused by domestic transportation .........................................3.1Corruption at foreign borders ..................................................................................3.1
Most problematic factors for importing Score*
High cost or delays caused by international transportation ..................................21.6Burdensome import procedures ...........................................................................20.7Tariffs .....................................................................................................................19.3Domestic technical requirements and standards ..................................................14.3Corruption at the border ..........................................................................................7.8Inappropriate telecommunications infrastructure ................................................... 6.7High cost or delays caused by domestic transportation ........................................ 6.3Crime and theft ....................................................................................................... 3.2
Mauritius
Sources: International Monetary Fund, World Bank, World Trade Organization, United Nations COMTRADE
Mauritius
Sub-Saharan Africa
© 2014 World Economic Forum

Country/Economy Profiles
The Global Enabling Trade Report 2014 | 219
* Indicator derived from the World Economic Forum’s Executive Opinion Survey and measured on a 1-to-7 scale, where 7 indicates best outcome.
The Enabling Trade Index 2014 in detail n Competitive Advantage n Competitive Disadvantage
For methodology, indicator descriptions and sources, and for a list of multiple best-performing economies, see page 45. Mauritius
INDICATOR, UNITS RANK/138 VALUE BEST PERFORMER VALUE
Pillar 1: Domestic market access (1–7) ............................................................. 4 ...........................6.1 Multiple economies (2) ................................ 7.0 1.01 Tariff rate (%)............................................................................................... 4 .......... n ..........0.8 Multiple economies (2) .............................0.0 1.02 Complexity of tariffs index (1–7) ................................................................ 86 .......... n ..........5.1 Multiple economies (2) .............................7.0
Tariff dispersion (standard deviation) ........................................................... 9 .......... n ..........4.0 Multiple economies (2) .............................0.0Tariff peaks (% of tariff lines) ................................................................... 102 .......... n ........10.3 Multiple economies (24) ...........................0.0Specific tariffs (% of tariff lines) ................................................................. 98 .......... n ..........4.8 Multiple economies (54) ...........................0.0Number of distinct tariffs ........................................................................... 89 .......... n .........308 Multiple economies (2) ................................1
1.03 Share of duty-free imports (%) .................................................................... 7 .......... n ........93.1 Multiple economies (2) .........................100.0
Pillar 2: Foreign market access (1–7) ................................................................ 5 ...........................4.5 Cambodia ..................................................... 5.3 2.01 Tariffs faced (%) ...................................................................................... 103 .......... n ..........5.5 Chile .........................................................3.5 2.02 Index of margin of preference in destination mkts (0–100) .......................... 1 .......... n ........97.1 Mauritius ................................................97.1
Pillar 3: Efficiency and transparency of border administration (1–7) .............. 53 ...........................4.7 Singapore..................................................... 6.3 3.01 Customs services index (0–1) .................................................................. n/a ........................n/a Singapore...............................................0.97 3.02 Efficiency of the clearance process (1–5) ................................................ 116 .......... n ..........2.3 Norway ....................................................4.2 3.03 No. of days to import ............................................................................... 28 .......... n ...........10 Singapore....................................................4 3.04 No. of documents to import ..................................................................... 27 .......... n .............5 Multiple economies (2) ................................2 3.05 Cost to import (US$ per container) ........................................................... 14 .......... n .........710 Singapore................................................440 3.06 No. of days to export................................................................................ 24 .......... n ...........10 Multiple economies (5) ................................6 3.07 No. of documents to export ..................................................................... 16 .......... n .............4 Multiple economies (2) ................................2 3.08 Cost to export (US$ per container) ........................................................... 21 .......... n .........675 Malaysia ..................................................450 3.09 Irregular payments in exports and imports*............................................... 52 .......... n ..........4.0 New Zealand ............................................6.6 3.10 Time predictability of import procedures* .................................................. 36 .......... n ..........4.5 Finland .....................................................6.0 3.11 Customs transparency index (0–1) .......................................................... n/a ........................n/a Multiple economies (35) .........................1.00
Pillar 4: Availability and quality of transport infrastructure (1-7) ..................... 37 ...........................4.2 United Arab Emirates ................................... 6.5 4.01 Available int’l airline seat km/week, millions .............................................. 67 .......... n ......159.9 United States ..................................11,481.7 4.02 Quality of air transport infrastructure* ........................................................ 48 .......... n ..........5.0 Singapore.................................................6.8 4.03 Quality of railroad infrastructure* .............................................................. n/a ........................n/a Japan .......................................................6.7 4.04 Liner Shipping Connectivity Index (0–157.1) ............................................. 52 .......... n ........24.7 China ...................................................157.5 4.05 Quality of port infrastructure* .................................................................... 41 .......... n ..........4.9 Netherlands ..............................................6.8 4.06 Paved roads (% of total) ........................................................................... 22 .......... n ........98.0 Multiple economies (18) .......................100.0 4.07 Quality of roads* ....................................................................................... 48 .......... n ..........4.5 United Arab Emirates ...............................6.6
Pillar 5: Availability and quality of transport services (1–7) ............................ 67 ...........................4.0 Singapore..................................................... 5.7 5.01 Ease and affordability of shipment (1–5).................................................. 106 .......... n ..........2.6 Luxembourg .............................................3.8 5.02 Logistics competence (1–5) .................................................................... 109 .......... n ..........2.5 Norway ....................................................4.2 5.03 Tracking and tracing ability (1–5) ............................................................. 124 .......... n ..........2.3 Germany ..................................................4.2 5.04 Timeliness of shipments in reaching destination (1–5) ............................. 108 .......... n ..........2.9 Luxembourg .............................................4.7 5.05 Postal services efficiency* ......................................................................... 28 .......... n ..........5.8 Japan .......................................................6.8 5.06 Efficiency of transport mode change* ....................................................... 31 .......... n ..........5.0 Hong Kong SAR ......................................6.4
Pillar 6: Availability and use of ICTs (1–7) ........................................................ 66 ...........................4.1 Sweden ........................................................ 6.5 6.01 Mobile phone subscriptions/100 pop. ...................................................... 49 .......... n ......119.9 Hong Kong SAR ..................................229.2 6.02 Individuals using Internet (%) .................................................................... 75 .......... n ........41.4 Iceland ...................................................96.2 6.03 Fixed broadband Internet subscriptions/100 pop. .................................... 51 .......... n ........11.2 Switzerland ............................................39.9 6.04 Active mobile broadband Internet subscriptions/100 pop. ........................ 65 .......... n ........22.8 Singapore.............................................124.5 6.05 ICT use for business-to-business transactions* ........................................ 58 .......... n ..........5.0 Finland .....................................................6.2 6.06 Internet use for business-to-consumer transactions* ................................ 95 .......... n ..........4.0 United Kingdom .......................................6.3 6.07 Government Online Service Index (0–1) .................................................... 84 .......... n ........0.43 Multiple economies (3) ...........................1.00
Pillar 7: Operating environment (1–7) .............................................................. 32 ...........................4.8 Hong Kong SAR ............................................ 5.8 7.01 Protection of property index (1–7) ............................................................. 39 .......... n ..........4.5 Finland .....................................................6.3
Property rights* ......................................................................................... 36 .......... n ..........5.1 Finland .....................................................6.4Intellectual property protection* ................................................................ 45 .......... n ..........4.0 Finland .....................................................6.2
7.02 Efficiency and accountability of public institutions index (1–7) ................... 35 .......... n ..........4.3 Singapore.................................................6.0Judicial efficiency & impartiality in commercial disputes (0–4).................... 26 .......... n ..........2.8 Multiple economies (7) .............................4.0Diversion of public funds* ......................................................................... 46 .......... n ..........3.8 New Zealand ............................................6.5Ease of compliance with government regulation* ...................................... 31 .......... n ..........3.8 Singapore.................................................5.4
7.03 Access to finance index (1–7) .................................................................. 30 .......... n ..........4.5 Hong Kong SAR ......................................5.7Affordability of financial services* ............................................................. 33 .......... n ..........4.9 Hong Kong SAR ......................................6.1Availability of financial services* ................................................................ 32 .......... n ..........5.2 Switzerland ..............................................6.4Ease of access to loans* .......................................................................... 25 .......... n ..........3.5 Qatar ........................................................4.9Availability of trade finance* ...................................................................... 32 .......... n ..........4.4 Hong Kong SAR ......................................5.8
7.04 Openness to foreign participation index (1–7) ........................................... 30 .......... n ..........4.8 Ireland ......................................................5.5Ease of hiring foreign labour* .................................................................... 63 .......... n ..........4.2 United Arab Emirates ...............................5.6Business impact of rules on FDI* ................................................................ 9 .......... n ..........5.6 Ireland ......................................................6.7Openness to multilateral trade rules (0–100) ............................................. 53 .......... n ........69.1 Slovenia .................................................92.2
7.05 Index of physical security (1–7) ................................................................. 34 .......... n ..........6.0 Qatar ........................................................6.8Reliability of police services* ..................................................................... 50 .......... n ..........4.6 Finland .....................................................6.7Business costs of crime and violence* ...................................................... 45 .......... n ..........5.2 Qatar ........................................................6.8Business costs of terrorism* ..................................................................... 19 .......... n ..........6.3 Slovenia ...................................................6.7Homicide cases/100,000 pop. ................................................................. 71 .......... n ..........3.4 Hong Kong SAR ......................................0.2Index of terrorism incidence (1-7) ............................................................... 1 .......... n ..........7.0 Multiple economies (48) ...........................7.0
© 2014 World Economic Forum

Country/Economy Profiles
220 | The Global Enabling Trade Report 2014
* From the list of factors above, respondents were asked to select the five most problematic for trading in their country and to rank them between 1 (most problematic) and 5. The bars in the figure show the responses weighted according to their rankings.
For methodology, indicator descriptions and sources, and for a list of multiple best-performing economies, see page 45.
0 105 15 20 25 30
0 5 10 15 20 25 30
2
3
4
5
6
7
Operating environment
Availability & use of ICTs
Availability & quality of transport services
Availability & quality of transport infrastructure
Efficiency & transparency of border administration
Foreign market access
Domestic market access
1
Enabling Trade Index 2014 Rank Score (out of 138) (1–7)
Enabling Trade Index 2014 .................... 61 ......4.1
Subindex A: Market access (25%) ....................18 .......4.4Pillar 1: Domestic market access .....................................33 ........ 5.2Pillar 2: Foreign market access ........................................29 ........ 3.5
Subindex B: Border administration (25%) ........62 .......4.6Pillar 3: Efficiency & transparency of border administration ...................................................62 .........4.6
Subindex C: Infrastructure (25%) ......................63 .......3.9Pillar 4: Availability & quality of transport infrastructure ...58 ........ 3.6Pillar 5: Availability & quality of transport services ...........59 ........ 4.2Pillar 6: Availability & use of ICTs .....................................73 ........ 3.8
Subindex D: Operating environment (25%) ......97 .......3.8Pillar 7: Operating environment ........................................97 ........ 3.8
Key indicators, 2012 Rank/138
Population (millions) ............................................................117.1 ............11GDP (US$ billions) ...........................................................1,177.4 ........... 14GDP per capita (US$) .................................................. 10,058.5 ........... 58
Merchandise tradeTrade openness (imports+exports)/GDP ............................ 63.8 ........... 72Share of world trade (%) ..................................................... 2.03 ........... 16Total Exports (US$ billions) ................................................370.8 ........... 16Total Imports (US$ billions) ............................................... 380.5 ........... 14
Value chain indicators, 2012Share (%) of merchandise trade Exports Imports
Capital goods ................................................................... 23.9 .........17.9
Intermediate goods .......................................................... 50.0 ........ 61.9Food and beverages (industrial) ......................................0.7 .......... 1.9Industrial supplies (primary and processed) .................19.0 ........ 29.3Parts and accessories ................................................... 17.6 ........ 29.2Fuels and lubricants ......................................................12.9 .......... 1.5
Consumer goods .............................................................. 16.8 ........ 10.5Food and beverages (consumer) .................................... 4.9 .......... 3.0Transport equipment and consumer goods ..................11.8 ...........7.5
Passenger motor cars ........................................................ 8.0 .......... 2.1
Others ...................................................................................1.4 .......... 7.6
The most problematic factors for trade, 2013Most problematic factors for exporting Score*
Identifying potential markets and buyers ...............................................................13.1Access to trade finance .........................................................................................12.9Technical requirements and standards abroad .....................................................10.0High cost or delays caused by domestic transportation ........................................ 9.3Inappropriate production technology and skills .......................................................7.9Tariff barriers abroad ...............................................................................................7.5Access to imported inputs at competitive prices ....................................................7.5Burdensome procedures at foreign borders ...........................................................7.3Difficulties in meeting quality/quantity requirements of buyers ............................... 6.8Rules of origin requirements abroad ....................................................................... 6.8High cost or delays caused by international transportation ................................... 5.5Corruption at foreign borders ................................................................................. 5.4
Most problematic factors for importing Score*
Burdensome import procedures ...........................................................................19.0Corruption at the border ........................................................................................15.4Tariffs .....................................................................................................................14.6Crime and theft ......................................................................................................14.2High cost or delays caused by international transportation .................................. 11.1Domestic technical requirements and standards ..................................................11.0High cost or delays caused by domestic transportation ........................................ 8.7Inappropriate telecommunications infrastructure ................................................... 5.9
Mexico
Sources: International Monetary Fund, World Bank, World Trade Organization, United Nations COMTRADE
Mexico
Central America and Caribbean
© 2014 World Economic Forum

Country/Economy Profiles
The Global Enabling Trade Report 2014 | 221
* Indicator derived from the World Economic Forum’s Executive Opinion Survey and measured on a 1-to-7 scale, where 7 indicates best outcome.
The Enabling Trade Index 2014 in detail n Competitive Advantage n Competitive Disadvantage
For methodology, indicator descriptions and sources, and for a list of multiple best-performing economies, see page 45. Mexico
INDICATOR, UNITS RANK/138 VALUE BEST PERFORMER VALUE
Pillar 1: Domestic market access (1–7) ........................................................... 33 ...........................5.2 Multiple economies (2) ................................ 7.0 1.01 Tariff rate (%)............................................................................................. 90 .......... n ..........8.5 Multiple economies (2) .............................0.0 1.02 Complexity of tariffs index (1–7) ................................................................ 70 .......... n ..........5.9 Multiple economies (2) .............................7.0
Tariff dispersion (standard deviation) ....................................................... 123 .......... n ........15.8 Multiple economies (2) .............................0.0Tariff peaks (% of tariff lines) ..................................................................... 62 .......... n ..........2.6 Multiple economies (24) ...........................0.0Specific tariffs (% of tariff lines) ................................................................. 73 .......... n ..........0.5 Multiple economies (54) ...........................0.0Number of distinct tariffs ........................................................................... 76 .......... n ...........87 Multiple economies (2) ................................1
1.03 Share of duty-free imports (%) .................................................................. 16 .......... n ........83.7 Multiple economies (2) .........................100.0
Pillar 2: Foreign market access (1–7) .............................................................. 29 ...........................3.5 Cambodia ..................................................... 5.3 2.01 Tariffs faced (%) ........................................................................................ 28 .......... n ..........5.1 Chile .........................................................3.5 2.02 Index of margin of preference in destination mkts (0–100) ........................ 37 .......... n ........47.8 Mauritius ................................................97.1
Pillar 3: Efficiency and transparency of border administration (1–7) .............. 62 ...........................4.6 Singapore..................................................... 6.3 3.01 Customs services index (0–1) ................................................................... 95 .......... n ........0.40 Singapore...............................................0.97 3.02 Efficiency of the clearance process (1–5) .................................................. 69 .......... n ..........2.7 Norway ....................................................4.2 3.03 No. of days to import ............................................................................... 36 .......... n ...........11 Singapore....................................................4 3.04 No. of documents to import ..................................................................... 11 .......... n .............4 Multiple economies (2) ................................2 3.05 Cost to import (US$ per container) ........................................................... 97 .......... n ......1,740 Singapore................................................440 3.06 No. of days to export................................................................................ 35 .......... n ...........11 Multiple economies (5) ................................6 3.07 No. of documents to export ..................................................................... 16 .......... n .............4 Multiple economies (2) ................................2 3.08 Cost to export (US$ per container) ........................................................... 94 .......... n ......1,450 Malaysia ..................................................450 3.09 Irregular payments in exports and imports*............................................... 72 .......... n ..........3.6 New Zealand ............................................6.6 3.10 Time predictability of import procedures* .................................................. 61 .......... n ..........3.9 Finland .....................................................6.0 3.11 Customs transparency index (0–1) ........................................................... 39 .......... n ........0.90 Multiple economies (35) .........................1.00
Pillar 4: Availability and quality of transport infrastructure (1-7) ..................... 58 ...........................3.6 United Arab Emirates ................................... 6.5 4.01 Available int’l airline seat km/week, millions .............................................. 22 .......... n ...1,056.8 United States ..................................11,481.7 4.02 Quality of air transport infrastructure* ........................................................ 59 .......... n ..........4.7 Singapore.................................................6.8 4.03 Quality of railroad infrastructure* ............................................................... 57 .......... n ..........2.8 Japan .......................................................6.7 4.04 Liner Shipping Connectivity Index (0–157.1) ............................................. 32 .......... n ........41.8 China ...................................................157.5 4.05 Quality of port infrastructure* .................................................................... 57 .......... n ..........4.4 Netherlands ..............................................6.8 4.06 Paved roads (% of total) ........................................................................... 81 .......... n ........36.4 Multiple economies (18) .......................100.0 4.07 Quality of roads* ....................................................................................... 47 .......... n ..........4.6 United Arab Emirates ...............................6.6
Pillar 5: Availability and quality of transport services (1–7) ............................ 59 ...........................4.2 Singapore..................................................... 5.7 5.01 Ease and affordability of shipment (1–5).................................................... 46 .......... n ..........3.2 Luxembourg .............................................3.8 5.02 Logistics competence (1–5) ...................................................................... 47 .......... n ..........3.1 Norway ....................................................4.2 5.03 Tracking and tracing ability (1–5) ............................................................... 55 .......... n ..........3.1 Germany ..................................................4.2 5.04 Timeliness of shipments in reaching destination (1–5) ............................... 47 .......... n ..........3.6 Luxembourg .............................................4.7 5.05 Postal services efficiency* ....................................................................... 100 .......... n ..........3.7 Japan .......................................................6.8 5.06 Efficiency of transport mode change* ....................................................... 61 .......... n ..........4.1 Hong Kong SAR ......................................6.4
Pillar 6: Availability and use of ICTs (1–7) ........................................................ 73 ...........................3.8 Sweden ........................................................ 6.5 6.01 Mobile phone subscriptions/100 pop. .................................................... 106 .......... n ........83.4 Hong Kong SAR ..................................229.2 6.02 Individuals using Internet (%) .................................................................... 80 .......... n ........38.4 Iceland ...................................................96.2 6.03 Fixed broadband Internet subscriptions/100 pop. .................................... 55 .......... n ........10.5 Switzerland ............................................39.9 6.04 Active mobile broadband Internet subscriptions/100 pop. ........................ 82 .......... n ..........9.3 Singapore.............................................124.5 6.05 ICT use for business-to-business transactions* ........................................ 62 .......... n ..........4.9 Finland .....................................................6.2 6.06 Internet use for business-to-consumer transactions* ................................ 74 .......... n ..........4.4 United Kingdom .......................................6.3 6.07 Government Online Service Index (0–1) .................................................... 28 .......... n ........0.73 Multiple economies (3) ...........................1.00
Pillar 7: Operating environment (1–7) .............................................................. 97 ...........................3.8 Hong Kong SAR ............................................ 5.8 7.01 Protection of property index (1–7) ............................................................. 69 .......... n ..........3.9 Finland .....................................................6.3
Property rights* ......................................................................................... 70 .......... n ..........4.2 Finland .....................................................6.4Intellectual property protection* ................................................................ 72 .......... n ..........3.6 Finland .....................................................6.2
7.02 Efficiency and accountability of public institutions index (1–7) ................. 128 .......... n ..........2.6 Singapore.................................................6.0Judicial efficiency & impartiality in commercial disputes (0–4).................. 120 .......... n ..........0.8 Multiple economies (7) .............................4.0Diversion of public funds* ......................................................................... 96 .......... n ..........2.7 New Zealand ............................................6.5Ease of compliance with government regulation* .................................... 102 .......... n ..........3.0 Singapore.................................................5.4
7.03 Access to finance index (1–7) .................................................................. 74 .......... n ..........3.7 Hong Kong SAR ......................................5.7Affordability of financial services* ............................................................. 80 .......... n ..........4.0 Hong Kong SAR ......................................6.1Availability of financial services* ................................................................ 58 .......... n ..........4.6 Switzerland ..............................................6.4Ease of access to loans* .......................................................................... 88 .......... n ..........2.5 Qatar ........................................................4.9Availability of trade finance* ...................................................................... 75 .......... n ..........3.8 Hong Kong SAR ......................................5.8
7.04 Openness to foreign participation index (1–7) ........................................... 31 .......... n ..........4.8 Ireland ......................................................5.5Ease of hiring foreign labour* .................................................................... 52 .......... n ..........4.3 United Arab Emirates ...............................5.6Business impact of rules on FDI* .............................................................. 44 .......... n ..........4.8 Ireland ......................................................6.7Openness to multilateral trade rules (0–100) ............................................. 26 .......... n ........77.5 Slovenia .................................................92.2
7.05 Index of physical security (1–7) ............................................................... 130 .......... n ..........3.8 Qatar ........................................................6.8Reliability of police services* ................................................................... 116 .......... n ..........3.0 Finland .....................................................6.7Business costs of crime and violence* .................................................... 130 .......... n ..........2.8 Qatar ........................................................6.8Business costs of terrorism* ................................................................... 100 .......... n ..........4.8 Slovenia ...................................................6.7Homicide cases/100,000 pop. ............................................................... 125 .......... n ........23.7 Hong Kong SAR ......................................0.2Index of terrorism incidence (1-7) ........................................................... 102 .......... n ..........6.8 Multiple economies (48) ...........................7.0
© 2014 World Economic Forum

Country/Economy Profiles
222 | The Global Enabling Trade Report 2014
* From the list of factors above, respondents were asked to select the five most problematic for trading in their country and to rank them between 1 (most problematic) and 5. The bars in the figure show the responses weighted according to their rankings.
For methodology, indicator descriptions and sources, and for a list of multiple best-performing economies, see page 45.
0 105 15 20 25 30
0 5 10 15 20 25 30
2
3
4
5
6
7
Operating environment
Availability & use of ICTs
Availability & quality of transport services
Availability & quality of transport infrastructure
Efficiency & transparency of border administration
Foreign market access
Domestic market access
1
Enabling Trade Index 2014 Rank Score (out of 138) (1–7)
Enabling Trade Index 2014 .................... 92 ......3.7
Subindex A: Market access (25%) ....................27 .......4.3Pillar 1: Domestic market access .....................................38 .........5.0Pillar 2: Foreign market access ........................................33 ........ 3.5
Subindex B: Border administration (25%) ...... 116 .......3.3Pillar 3: Efficiency & transparency of border administration ................................................. 116 ........ 3.3
Subindex C: Infrastructure (25%) ......................87 .......3.5Pillar 4: Availability & quality of transport infrastructure ...86 .........2.9Pillar 5: Availability & quality of transport services ...........91 .........3.7Pillar 6: Availability & use of ICTs .....................................77 ........ 3.8
Subindex D: Operating environment (25%) ....100 .......3.7Pillar 7: Operating environment ......................................100 .........3.7
Key indicators, 2012 Rank/138
Population (millions) .............................................................. 3.6 ..........112GDP (US$ billions) .................................................................7.3 ......... 126GDP per capita (US$) .....................................................2,037.3 ......... 101
Merchandise tradeTrade openness (imports+exports)/GDP ...........................101.7 ........... 29Share of world trade (%) ..................................................... 0.02 ..........116Total Exports (US$ billions) ................................................... 2.2 ..........119Total Imports (US$ billions) ................................................... 5.2 ..........115
Value chain indicators, 2012Share (%) of merchandise trade Exports Imports
Capital goods ..................................................................... 5.3 ........ 12.3
Intermediate goods .......................................................... 42.1 ........ 41.8Food and beverages (industrial) ....................................10.2 .......... 1.9Industrial supplies (primary and processed) ................ 29.8 ........ 31.8Parts and accessories .....................................................2.1 .......... 6.1Fuels and lubricants ....................................................... 0.0 ...........2.1
Consumer goods .............................................................. 52.2 ........ 31.2Food and beverages (consumer) ...................................37.3 ........ 10.9Transport equipment and consumer goods ..................14.9 ........ 20.3
Passenger motor cars .........................................................0.1 ..........2.4
Others .................................................................................. 0.3 ........ 12.4
The most problematic factors for trade, 2013Most problematic factors for exporting Score*
Identifying potential markets and buyers ...............................................................16.7Inappropriate production technology and skills .....................................................12.0Access to imported inputs at competitive prices ..................................................11.8Difficulties in meeting quality/quantity requirements of buyers ..............................11.6Technical requirements and standards abroad .....................................................11.2Access to trade finance .......................................................................................... 9.9Burdensome procedures at foreign borders .......................................................... 5.8High cost or delays caused by international transportation ................................... 5.4Tariff barriers abroad .............................................................................................. 4.8Corruption at foreign borders ..................................................................................4.1High cost or delays caused by domestic transportation ........................................ 3.5Rules of origin requirements abroad ....................................................................... 3.2
Most problematic factors for importing Score*
Burdensome import procedures .......................................................................... 23.0Tariffs .....................................................................................................................21.8Corruption at the border ........................................................................................21.7High cost or delays caused by international transportation ..................................11.2Domestic technical requirements and standards ..................................................11.0High cost or delays caused by domestic transportation ........................................ 4.6Crime and theft ........................................................................................................4.1Inappropriate telecommunications infrastructure ................................................... 2.5
Moldova
Sources: International Monetary Fund, World Bank, World Trade Organization, United Nations COMTRADE
Moldova Land-Locked Developing Countries
Commonwealth of Independent States
© 2014 World Economic Forum

Country/Economy Profiles
The Global Enabling Trade Report 2014 | 223
* Indicator derived from the World Economic Forum’s Executive Opinion Survey and measured on a 1-to-7 scale, where 7 indicates best outcome.
The Enabling Trade Index 2014 in detail n Competitive Advantage n Competitive Disadvantage
For methodology, indicator descriptions and sources, and for a list of multiple best-performing economies, see page 45. Moldova
INDICATOR, UNITS RANK/138 VALUE BEST PERFORMER VALUE
Pillar 1: Domestic market access (1–7) ........................................................... 38 ...........................5.0 Multiple economies (2) ................................ 7.0 1.01 Tariff rate (%)............................................................................................. 55 .......... n ..........4.2 Multiple economies (2) .............................0.0 1.02 Complexity of tariffs index (1–7) ................................................................ 93 .......... n ..........4.9 Multiple economies (2) .............................7.0
Tariff dispersion (standard deviation) ......................................................... 15 .......... n ..........5.5 Multiple economies (2) .............................0.0Tariff peaks (% of tariff lines) ................................................................... 132 .......... n ........11.9 Multiple economies (24) ...........................0.0Specific tariffs (% of tariff lines) ................................................................. 96 .......... n ..........3.9 Multiple economies (54) ...........................0.0Number of distinct tariffs ........................................................................... 98 .......... n .........404 Multiple economies (2) ................................1
1.03 Share of duty-free imports (%) .................................................................. 41 .......... n ........65.4 Multiple economies (2) .........................100.0
Pillar 2: Foreign market access (1–7) .............................................................. 33 ...........................3.5 Cambodia ..................................................... 5.3 2.01 Tariffs faced (%) ........................................................................................ 57 .......... n ..........5.4 Chile .........................................................3.5 2.02 Index of margin of preference in destination mkts (0–100) ........................ 18 .......... n ........57.3 Mauritius ................................................97.1
Pillar 3: Efficiency and transparency of border administration (1–7) ............ 116 ...........................3.3 Singapore..................................................... 6.3 3.01 Customs services index (0–1) .................................................................. n/a ........................n/a Singapore...............................................0.97 3.02 Efficiency of the clearance process (1–5) .................................................. 93 .......... n ..........2.5 Norway ....................................................4.2 3.03 No. of days to import ............................................................................. 118 .......... n ...........35 Singapore....................................................4 3.04 No. of documents to import ..................................................................... 82 .......... n .............8 Multiple economies (2) ................................2 3.05 Cost to import (US$ per container) ......................................................... 101 .......... n ......1,870 Singapore................................................440 3.06 No. of days to export.............................................................................. 122 .......... n ...........32 Multiple economies (5) ................................6 3.07 No. of documents to export ..................................................................... 85 .......... n .............7 Multiple economies (2) ................................2 3.08 Cost to export (US$ per container) ......................................................... 102 .......... n ......1,545 Malaysia ..................................................450 3.09 Irregular payments in exports and imports*............................................. 110 .......... n ..........2.6 New Zealand ............................................6.6 3.10 Time predictability of import procedures* ................................................ 100 .......... n ..........3.4 Finland .....................................................6.0 3.11 Customs transparency index (0–1) .......................................................... n/a ........................n/a Multiple economies (35) .........................1.00
Pillar 4: Availability and quality of transport infrastructure (1-7) ..................... 86 ...........................2.9 United Arab Emirates ................................... 6.5 4.01 Available int’l airline seat km/week, millions ............................................ 120 .......... n ........18.9 United States ..................................11,481.7 4.02 Quality of air transport infrastructure* ...................................................... 108 .......... n ..........3.5 Singapore.................................................6.8 4.03 Quality of railroad infrastructure* ............................................................... 63 .......... n ..........2.6 Japan .......................................................6.7 4.04 Liner Shipping Connectivity Index (0–157.1) ............................................ n/a ........................n/a China ...................................................157.5 4.05 Quality of port infrastructure* .................................................................. 129 .......... n ..........2.6 Netherlands ..............................................6.8 4.06 Paved roads (% of total) ........................................................................... 36 .......... n ........86.2 Multiple economies (18) .......................100.0 4.07 Quality of roads* ..................................................................................... 138 .......... n ..........1.7 United Arab Emirates ...............................6.6
Pillar 5: Availability and quality of transport services (1–7) ............................ 91 ...........................3.7 Singapore..................................................... 5.7 5.01 Ease and affordability of shipment (1–5).................................................... 52 .......... n ..........3.1 Luxembourg .............................................3.8 5.02 Logistics competence (1–5) .................................................................... 114 .......... n ..........2.4 Norway ....................................................4.2 5.03 Tracking and tracing ability (1–5) ............................................................. 122 .......... n ..........2.4 Germany ..................................................4.2 5.04 Timeliness of shipments in reaching destination (1–5) ............................. 107 .......... n ..........2.9 Luxembourg .............................................4.7 5.05 Postal services efficiency* ......................................................................... 70 .......... n ..........4.5 Japan .......................................................6.8 5.06 Efficiency of transport mode change* ....................................................... 96 .......... n ..........3.5 Hong Kong SAR ......................................6.4
Pillar 6: Availability and use of ICTs (1–7) ........................................................ 77 ...........................3.8 Sweden ........................................................ 6.5 6.01 Mobile phone subscriptions/100 pop. ...................................................... 82 .......... n ......102.0 Hong Kong SAR ..................................229.2 6.02 Individuals using Internet (%) .................................................................... 72 .......... n ........43.4 Iceland ...................................................96.2 6.03 Fixed broadband Internet subscriptions/100 pop. .................................... 50 .......... n ........11.9 Switzerland ............................................39.9 6.04 Active mobile broadband Internet subscriptions/100 pop. ........................ 94 .......... n ..........5.1 Singapore.............................................124.5 6.05 ICT use for business-to-business transactions* ........................................ 94 .......... n ..........4.5 Finland .....................................................6.2 6.06 Internet use for business-to-consumer transactions* ................................ 91 .......... n ..........4.1 United Kingdom .......................................6.3 6.07 Government Online Service Index (0–1) .................................................... 61 .......... n ........0.52 Multiple economies (3) ...........................1.00
Pillar 7: Operating environment (1–7) ............................................................ 100 ...........................3.7 Hong Kong SAR ............................................ 5.8 7.01 Protection of property index (1–7) ........................................................... 120 .......... n ..........2.9 Finland .....................................................6.3
Property rights* ....................................................................................... 122 .......... n ..........3.2 Finland .....................................................6.4Intellectual property protection* .............................................................. 116 .......... n ..........2.7 Finland .....................................................6.2
7.02 Efficiency and accountability of public institutions index (1–7) ................. 129 .......... n ..........2.6 Singapore.................................................6.0Judicial efficiency & impartiality in commercial disputes (0–4)................... n/a ........................n/a Multiple economies (7) .............................4.0Diversion of public funds* ....................................................................... 113 .......... n ..........2.4 New Zealand ............................................6.5Ease of compliance with government regulation* .................................... 112 .......... n ..........2.8 Singapore.................................................5.4
7.03 Access to finance index (1–7) ................................................................ 109 .......... n ..........3.2 Hong Kong SAR ......................................5.7Affordability of financial services* ........................................................... 107 .......... n ..........3.6 Hong Kong SAR ......................................6.1Availability of financial services* .............................................................. 111 .......... n ..........3.7 Switzerland ..............................................6.4Ease of access to loans* .......................................................................... 98 .......... n ..........2.4 Qatar ........................................................4.9Availability of trade finance* .................................................................... 113 .......... n ..........3.0 Hong Kong SAR ......................................5.8
7.04 Openness to foreign participation index (1–7) ........................................... 69 .......... n ..........4.3 Ireland ......................................................5.5Ease of hiring foreign labour* .................................................................... 82 .......... n ..........3.9 United Arab Emirates ...............................5.6Business impact of rules on FDI* ............................................................ 105 .......... n ..........3.9 Ireland ......................................................6.7Openness to multilateral trade rules (0–100) ............................................. 38 .......... n ........74.8 Slovenia .................................................92.2
7.05 Index of physical security (1–7) ................................................................. 69 .......... n ..........5.5 Qatar ........................................................6.8Reliability of police services* ................................................................... 114 .......... n ..........3.0 Finland .....................................................6.7Business costs of crime and violence* ...................................................... 53 .......... n ..........5.0 Qatar ........................................................6.8Business costs of terrorism* ....................................................................... 9 .......... n ..........6.4 Slovenia ...................................................6.7Homicide cases/100,000 pop. ................................................................. 96 .......... n ..........8.6 Hong Kong SAR ......................................0.2Index of terrorism incidence (1-7) ............................................................. 49 .......... n ..........7.0 Multiple economies (48) ...........................7.0
© 2014 World Economic Forum

Country/Economy Profiles
224 | The Global Enabling Trade Report 2014
* From the list of factors above, respondents were asked to select the five most problematic for trading in their country and to rank them between 1 (most problematic) and 5. The bars in the figure show the responses weighted according to their rankings.
For methodology, indicator descriptions and sources, and for a list of multiple best-performing economies, see page 45.
0 105 15 20 25 30
0 5 10 15 20 25 30
2
3
4
5
6
7
Operating environment
Availability & use of ICTs
Availability & quality of transport services
Availability & quality of transport infrastructure
Efficiency & transparency of border administration
Foreign market access
Domestic market access
1
Enabling Trade Index 2014 Rank Score (out of 138) (1–7)
Enabling Trade Index 2014 ...................130 ..... 3.0
Subindex A: Market access (25%) ..................126 .......2.9Pillar 1: Domestic market access .....................................92 .........4.4Pillar 2: Foreign market access ......................................132 .........1.4
Subindex B: Border administration (25%) ......137 .......2.4Pillar 3: Efficiency & transparency of border administration ................................................. 137 .........2.4
Subindex C: Infrastructure (25%) ....................103 .......3.0Pillar 4: Availability & quality of transport infrastructure . 125 .........2.3Pillar 5: Availability & quality of transport services .........129 ........ 3.0Pillar 6: Availability & use of ICTs .....................................78 ........ 3.8
Subindex D: Operating environment (25%) ....105 .......3.7Pillar 7: Operating environment ......................................105 .........3.7
Key indicators, 2012 Rank/138
Population (millions) .............................................................. 2.8 ..........118GDP (US$ billions) ...............................................................10.3 ..........117GDP per capita (US$) .....................................................3,627.2 ........... 89
Merchandise tradeTrade openness (imports+exports)/GDP .......................... 108.3 ........... 27Share of world trade (%) ..................................................... 0.03 ......... 102Total Exports (US$ billions) ....................................................4.4 ......... 103Total Imports (US$ billions) ....................................................6.7 ......... 104
The most problematic factors for trade, 2013Most problematic factors for exporting Score*
Inappropriate production technology and skills .....................................................15.4Technical requirements and standards abroad .....................................................15.0Difficulties in meeting quality/quantity requirements of buyers .............................. 11.1Identifying potential markets and buyers ...............................................................10.6High cost or delays caused by international transportation ................................... 8.9High cost or delays caused by domestic transportation ........................................ 8.7Access to trade finance ...........................................................................................7.0Rules of origin requirements abroad ....................................................................... 6.9Burdensome procedures at foreign borders ...........................................................5.1Access to imported inputs at competitive prices ................................................... 4.9Corruption at foreign borders ................................................................................. 3.2Tariff barriers abroad ...............................................................................................3.1
Most problematic factors for importing Score*
Burdensome import procedures ...........................................................................18.1High cost or delays caused by international transportation ..................................18.0Tariffs .....................................................................................................................15.7Corruption at the border ........................................................................................15.6High cost or delays caused by domestic transportation .......................................14.9Domestic technical requirements and standards ................................................... 9.2Inappropriate telecommunications infrastructure ................................................... 6.6Crime and theft ........................................................................................................1.9
Mongolia
Sources: International Monetary Fund, World Bank, World Trade Organization, United Nations COMTRADE
Mongolia Land-Locked Developing Countries
Developing Asia
© 2014 World Economic Forum

Country/Economy Profiles
The Global Enabling Trade Report 2014 | 225
* Indicator derived from the World Economic Forum’s Executive Opinion Survey and measured on a 1-to-7 scale, where 7 indicates best outcome.
The Enabling Trade Index 2014 in detail n Competitive Advantage n Competitive Disadvantage
For methodology, indicator descriptions and sources, and for a list of multiple best-performing economies, see page 45. Mongolia
INDICATOR, UNITS RANK/138 VALUE BEST PERFORMER VALUE
Pillar 1: Domestic market access (1–7) ........................................................... 92 ...........................4.4 Multiple economies (2) ................................ 7.0 1.01 Tariff rate (%)............................................................................................. 63 .......... n ..........4.6 Multiple economies (2) .............................0.0 1.02 Complexity of tariffs index (1–7) .................................................................. 4 .......... n ..........6.9 Multiple economies (2) .............................7.0
Tariff dispersion (standard deviation) ........................................................... 4 .......... n ..........0.7 Multiple economies (2) .............................0.0Tariff peaks (% of tariff lines) ..................................................................... 29 .......... n ..........0.2 Multiple economies (24) ...........................0.0Specific tariffs (% of tariff lines) ................................................................... 1 .......... n ..........0.0 Multiple economies (54) ...........................0.0Number of distinct tariffs ............................................................................. 5 .......... n .............4 Multiple economies (2) ................................1
1.03 Share of duty-free imports (%) ................................................................ 133 .......... n ..........1.4 Multiple economies (2) .........................100.0
Pillar 2: Foreign market access (1–7) ............................................................ 132 ...........................1.4 Cambodia ..................................................... 5.3 2.01 Tariffs faced (%) ...................................................................................... 124 .......... n ..........5.8 Chile .........................................................3.5 2.02 Index of margin of preference in destination mkts (0–100) ...................... 133 .......... n ..........3.2 Mauritius ................................................97.1
Pillar 3: Efficiency and transparency of border administration (1–7) ............ 137 ...........................2.4 Singapore..................................................... 6.3 3.01 Customs services index (0–1) .................................................................. n/a ........................n/a Singapore...............................................0.97 3.02 Efficiency of the clearance process (1–5) ................................................ 121 .......... n ..........2.2 Norway ....................................................4.2 3.03 No. of days to import ............................................................................. 133 .......... n ...........50 Singapore....................................................4 3.04 No. of documents to import ................................................................... 137 .......... n ...........13 Multiple economies (2) ................................2 3.05 Cost to import (US$ per container) ......................................................... 125 .......... n ......2,950 Singapore................................................440 3.06 No. of days to export.............................................................................. 133 .......... n ...........49 Multiple economies (5) ................................6 3.07 No. of documents to export ................................................................... 136 .......... n ...........11 Multiple economies (2) ................................2 3.08 Cost to export (US$ per container) ......................................................... 127 .......... n ......2,745 Malaysia ..................................................450 3.09 Irregular payments in exports and imports*............................................... 83 .......... n ..........3.3 New Zealand ............................................6.6 3.10 Time predictability of import procedures* ................................................ 121 .......... n ..........3.0 Finland .....................................................6.0 3.11 Customs transparency index (0–1) .......................................................... n/a ........................n/a Multiple economies (35) .........................1.00
Pillar 4: Availability and quality of transport infrastructure (1-7) ................... 125 ...........................2.3 United Arab Emirates ................................... 6.5 4.01 Available int’l airline seat km/week, millions ............................................ 110 .......... n ........24.8 United States ..................................11,481.7 4.02 Quality of air transport infrastructure* ...................................................... 118 .......... n ..........3.2 Singapore.................................................6.8 4.03 Quality of railroad infrastructure* ............................................................... 62 .......... n ..........2.6 Japan .......................................................6.7 4.04 Liner Shipping Connectivity Index (0–157.1) ............................................ n/a ........................n/a China ...................................................157.5 4.05 Quality of port infrastructure* .................................................................. 131 .......... n ..........2.6 Netherlands ..............................................6.8 4.06 Paved roads (% of total) ......................................................................... 128 .......... n ..........9.7 Multiple economies (18) .......................100.0 4.07 Quality of roads* ..................................................................................... 132 .......... n ..........2.3 United Arab Emirates ...............................6.6
Pillar 5: Availability and quality of transport services (1–7) .......................... 129 ...........................3.0 Singapore..................................................... 5.7 5.01 Ease and affordability of shipment (1–5).................................................. 107 .......... n ..........2.6 Luxembourg .............................................3.8 5.02 Logistics competence (1–5) .................................................................... 121 .......... n ..........2.3 Norway ....................................................4.2 5.03 Tracking and tracing ability (1–5) ............................................................. 134 .......... n ..........2.1 Germany ..................................................4.2 5.04 Timeliness of shipments in reaching destination (1–5) ............................. 134 .......... n ..........2.5 Luxembourg .............................................4.7 5.05 Postal services efficiency* ....................................................................... 121 .......... n ..........3.0 Japan .......................................................6.8 5.06 Efficiency of transport mode change* ..................................................... 121 .......... n ..........2.9 Hong Kong SAR ......................................6.4
Pillar 6: Availability and use of ICTs (1–7) ........................................................ 78 ...........................3.8 Sweden ........................................................ 6.5 6.01 Mobile phone subscriptions/100 pop. ...................................................... 44 .......... n ......120.7 Hong Kong SAR ..................................229.2 6.02 Individuals using Internet (%) .................................................................. 102 .......... n ........16.4 Iceland ...................................................96.2 6.03 Fixed broadband Internet subscriptions/100 pop. .................................... 81 .......... n ..........3.8 Switzerland ............................................39.9 6.04 Active mobile broadband Internet subscriptions/100 pop. ........................ 71 .......... n ........18.2 Singapore.............................................124.5 6.05 ICT use for business-to-business transactions* ........................................ 84 .......... n ..........4.6 Finland .....................................................6.2 6.06 Internet use for business-to-consumer transactions* ................................ 78 .......... n ..........4.3 United Kingdom .......................................6.3 6.07 Government Online Service Index (0–1) .................................................... 44 .......... n ........0.59 Multiple economies (3) ...........................1.00
Pillar 7: Operating environment (1–7) ............................................................ 105 ...........................3.7 Hong Kong SAR ............................................ 5.8 7.01 Protection of property index (1–7) ........................................................... 116 .......... n ..........3.0 Finland .....................................................6.3
Property rights* ....................................................................................... 101 .......... n ..........3.6 Finland .....................................................6.4Intellectual property protection* .............................................................. 124 .......... n ..........2.5 Finland .....................................................6.2
7.02 Efficiency and accountability of public institutions index (1–7) ................. 118 .......... n ..........2.8 Singapore.................................................6.0Judicial efficiency & impartiality in commercial disputes (0–4).................. 100 .......... n ..........1.5 Multiple economies (7) .............................4.0Diversion of public funds* ....................................................................... 110 .......... n ..........2.4 New Zealand ............................................6.5Ease of compliance with government regulation* .................................... 109 .......... n ..........2.9 Singapore.................................................5.4
7.03 Access to finance index (1–7) ................................................................ 118 .......... n ..........3.0 Hong Kong SAR ......................................5.7Affordability of financial services* ........................................................... 108 .......... n ..........3.6 Hong Kong SAR ......................................6.1Availability of financial services* .............................................................. 115 .......... n ..........3.6 Switzerland ..............................................6.4Ease of access to loans* ........................................................................ 132 .......... n ..........1.7 Qatar ........................................................4.9Availability of trade finance* .................................................................... 109 .......... n ..........3.1 Hong Kong SAR ......................................5.8
7.04 Openness to foreign participation index (1–7) ......................................... 100 .......... n ..........4.0 Ireland ......................................................5.5Ease of hiring foreign labour* .................................................................. 121 .......... n ..........3.3 United Arab Emirates ...............................5.6Business impact of rules on FDI* ............................................................ 100 .......... n ..........4.1 Ireland ......................................................6.7Openness to multilateral trade rules (0–100) ............................................. 56 .......... n ........68.1 Slovenia .................................................92.2
7.05 Index of physical security (1–7) ................................................................. 76 .......... n ..........5.4 Qatar ........................................................6.8Reliability of police services* ..................................................................... 91 .......... n ..........3.7 Finland .....................................................6.7Business costs of crime and violence* ...................................................... 64 .......... n ..........4.7 Qatar ........................................................6.8Business costs of terrorism* ..................................................................... 45 .......... n ..........5.8 Slovenia ...................................................6.7Homicide cases/100,000 pop. ................................................................. 99 .......... n ..........9.5 Hong Kong SAR ......................................0.2Index of terrorism incidence (1-7) ............................................................... 1 .......... n ..........7.0 Multiple economies (48) ...........................7.0
© 2014 World Economic Forum

Country/Economy Profiles
226 | The Global Enabling Trade Report 2014
* From the list of factors above, respondents were asked to select the five most problematic for trading in their country and to rank them between 1 (most problematic) and 5. The bars in the figure show the responses weighted according to their rankings.
For methodology, indicator descriptions and sources, and for a list of multiple best-performing economies, see page 45.
0 105 15 20 25 30
0 5 10 15 20 25 30
2
3
4
5
6
7
Operating environment
Availability & use of ICTs
Availability & quality of transport services
Availability & quality of transport infrastructure
Efficiency & transparency of border administration
Foreign market access
Domestic market access
1
Enabling Trade Index 2014 Rank Score (out of 138) (1–7)
Enabling Trade Index 2014 .................... 49 ..... 4.3
Subindex A: Market access (25%) ....................33 .......4.2Pillar 1: Domestic market access .....................................15 .........5.7Pillar 2: Foreign market access ........................................60 .........2.7
Subindex B: Border administration (25%) ........54 .......4.7Pillar 3: Efficiency & transparency of border administration ...................................................54 .........4.7
Subindex C: Infrastructure (25%) ......................65 .......3.9Pillar 4: Availability & quality of transport infrastructure ...81 .........3.1Pillar 5: Availability & quality of transport services ...........66 .........4.1Pillar 6: Availability & use of ICTs .....................................52 ........ 4.5
Subindex D: Operating environment (25%) ......51 .......4.4Pillar 7: Operating environment ........................................51 .........4.4
Key indicators, 2012 Rank/138
Population (millions) .............................................................. 0.6 ......... 135GDP (US$ billions) ................................................................ 4.2 ......... 130GDP per capita (US$) .....................................................6,777.6 ........... 69
Merchandise tradeTrade openness (imports+exports)/GDP ............................ 66.4 ........... 67Share of world trade (%) ......................................................0.01 ......... 134Total Exports (US$ billions) ................................................... 0.5 ......... 135Total Imports (US$ billions) ................................................... 2.3 ......... 131
The most problematic factors for trade, 2013Most problematic factors for exporting Score*
Access to trade finance .........................................................................................16.6Inappropriate production technology and skills .....................................................12.6Identifying potential markets and buyers ...............................................................12.0Technical requirements and standards abroad .....................................................11.8Difficulties in meeting quality/quantity requirements of buyers ..............................11.0Access to imported inputs at competitive prices ..................................................10.9Rules of origin requirements abroad ....................................................................... 6.0High cost or delays caused by international transportation ................................... 5.4Burdensome procedures at foreign borders .......................................................... 4.3Tariff barriers abroad .............................................................................................. 4.2High cost or delays caused by domestic transportation ........................................ 3.3Corruption at foreign borders ..................................................................................1.7
Most problematic factors for importing Score*
Tariffs .....................................................................................................................23.7Burdensome import procedures ...........................................................................22.7High cost or delays caused by international transportation ..................................11.6Corruption at the border ........................................................................................11.0High cost or delays caused by domestic transportation .......................................10.5Domestic technical requirements and standards ................................................... 9.9Inappropriate telecommunications infrastructure ....................................................7.3Crime and theft ....................................................................................................... 3.2
Montenegro
Sources: International Monetary Fund, World Bank, World Trade Organization, United Nations COMTRADE
Montenegro
Central and Eastern Europe
© 2014 World Economic Forum

Country/Economy Profiles
The Global Enabling Trade Report 2014 | 227
* Indicator derived from the World Economic Forum’s Executive Opinion Survey and measured on a 1-to-7 scale, where 7 indicates best outcome.
The Enabling Trade Index 2014 in detail n Competitive Advantage n Competitive Disadvantage
For methodology, indicator descriptions and sources, and for a list of multiple best-performing economies, see page 45. Montenegro
INDICATOR, UNITS RANK/138 VALUE BEST PERFORMER VALUE
Pillar 1: Domestic market access (1–7) ........................................................... 15 ...........................5.7 Multiple economies (2) ................................ 7.0 1.01 Tariff rate (%)............................................................................................. 42 .......... n ..........3.0 Multiple economies (2) .............................0.0 1.02 Complexity of tariffs index (1–7) ................................................................ 88 .......... n ..........5.0 Multiple economies (2) .............................7.0
Tariff dispersion (standard deviation) ......................................................... 18 .......... n ..........6.1 Multiple economies (2) .............................0.0Tariff peaks (% of tariff lines) ................................................................... 134 .......... n ........12.3 Multiple economies (24) ...........................0.0Specific tariffs (% of tariff lines) ................................................................. 88 .......... n ..........2.8 Multiple economies (54) ...........................0.0Number of distinct tariffs ........................................................................... 95 .......... n .........339 Multiple economies (2) ................................1
1.03 Share of duty-free imports (%) .................................................................. 13 .......... n ........87.5 Multiple economies (2) .........................100.0
Pillar 2: Foreign market access (1–7) .............................................................. 60 ...........................2.7 Cambodia ..................................................... 5.3 2.01 Tariffs faced (%) ...................................................................................... 129 .......... n ..........5.9 Chile .........................................................3.5 2.02 Index of margin of preference in destination mkts (0–100) ........................ 26 .......... n ........51.6 Mauritius ................................................97.1
Pillar 3: Efficiency and transparency of border administration (1–7) .............. 54 ...........................4.7 Singapore..................................................... 6.3 3.01 Customs services index (0–1) ................................................................... 70 .......... n ........0.54 Singapore...............................................0.97 3.02 Efficiency of the clearance process (1–5) .................................................. 59 .......... n ..........2.8 Norway ....................................................4.2 3.03 No. of days to import ............................................................................... 47 .......... n ...........14 Singapore....................................................4 3.04 No. of documents to import ..................................................................... 27 .......... n .............5 Multiple economies (2) ................................2 3.05 Cost to import (US$ per container) ........................................................... 42 .......... n .........985 Singapore................................................440 3.06 No. of days to export................................................................................ 56 .......... n ...........14 Multiple economies (5) ................................6 3.07 No. of documents to export ..................................................................... 65 .......... n .............6 Multiple economies (2) ................................2 3.08 Cost to export (US$ per container) ........................................................... 48 .......... n .........985 Malaysia ..................................................450 3.09 Irregular payments in exports and imports*............................................... 53 .......... n ..........4.0 New Zealand ............................................6.6 3.10 Time predictability of import procedures* .................................................. 76 .......... n ..........3.8 Finland .....................................................6.0 3.11 Customs transparency index (0–1) ........................................................... 39 .......... n ........0.90 Multiple economies (35) .........................1.00
Pillar 4: Availability and quality of transport infrastructure (1-7) ..................... 81 ...........................3.1 United Arab Emirates ................................... 6.5 4.01 Available int’l airline seat km/week, millions ............................................ 113 .......... n ........21.6 United States ..................................11,481.7 4.02 Quality of air transport infrastructure* ........................................................ 77 .......... n ..........4.2 Singapore.................................................6.8 4.03 Quality of railroad infrastructure* ............................................................... 54 .......... n ..........3.0 Japan .......................................................6.7 4.04 Liner Shipping Connectivity Index (0–157.1) ........................................... 106 .......... n ..........2.4 China ...................................................157.5 4.05 Quality of port infrastructure* .................................................................... 79 .......... n ..........3.9 Netherlands ..............................................6.8 4.06 Paved roads (% of total) ........................................................................... 54 .......... n ........69.1 Multiple economies (18) .......................100.0 4.07 Quality of roads* ....................................................................................... 87 .......... n ..........3.3 United Arab Emirates ...............................6.6
Pillar 5: Availability and quality of transport services (1–7) ............................ 66 ...........................4.1 Singapore..................................................... 5.7 5.01 Ease and affordability of shipment (1–5).................................................... 51 .......... n ..........3.1 Luxembourg .............................................3.8 5.02 Logistics competence (1–5) .................................................................... 113 .......... n ..........2.5 Norway ....................................................4.2 5.03 Tracking and tracing ability (1–5) ............................................................... 83 .......... n ..........2.8 Germany ..................................................4.2 5.04 Timeliness of shipments in reaching destination (1–5) ............................... 75 .......... n ..........3.2 Luxembourg .............................................4.7 5.05 Postal services efficiency* ......................................................................... 66 .......... n ..........4.6 Japan .......................................................6.8 5.06 Efficiency of transport mode change* ....................................................... 48 .......... n ..........4.4 Hong Kong SAR ......................................6.4
Pillar 6: Availability and use of ICTs (1–7) ........................................................ 52 ...........................4.5 Sweden ........................................................ 6.5 6.01 Mobile phone subscriptions/100 pop. ........................................................ 5 .......... n ......181.3 Hong Kong SAR ..................................229.2 6.02 Individuals using Internet (%) .................................................................... 49 .......... n ........56.8 Iceland ...................................................96.2 6.03 Fixed broadband Internet subscriptions/100 pop. .................................... 63 .......... n ..........8.4 Switzerland ............................................39.9 6.04 Active mobile broadband Internet subscriptions/100 pop. ........................ 59 .......... n ........27.5 Singapore.............................................124.5 6.05 ICT use for business-to-business transactions* ........................................ 68 .......... n ..........4.8 Finland .....................................................6.2 6.06 Internet use for business-to-consumer transactions* ................................ 66 .......... n ..........4.6 United Kingdom .......................................6.3 6.07 Government Online Service Index (0–1) .................................................... 64 .......... n ........0.51 Multiple economies (3) ...........................1.00
Pillar 7: Operating environment (1–7) .............................................................. 51 ...........................4.4 Hong Kong SAR ............................................ 5.8 7.01 Protection of property index (1–7) ............................................................. 67 .......... n ..........3.9 Finland .....................................................6.3
Property rights* ......................................................................................... 69 .......... n ..........4.2 Finland .....................................................6.4Intellectual property protection* ................................................................ 71 .......... n ..........3.6 Finland .....................................................6.2
7.02 Efficiency and accountability of public institutions index (1–7) ................... 47 .......... n ..........3.8 Singapore.................................................6.0Judicial efficiency & impartiality in commercial disputes (0–4)................... n/a ........................n/a Multiple economies (7) .............................4.0Diversion of public funds* ......................................................................... 40 .......... n ..........4.1 New Zealand ............................................6.5Ease of compliance with government regulation* ...................................... 54 .......... n ..........3.6 Singapore.................................................5.4
7.03 Access to finance index (1–7) .................................................................. 70 .......... n ..........3.8 Hong Kong SAR ......................................5.7Affordability of financial services* ............................................................. 74 .......... n ..........4.1 Hong Kong SAR ......................................6.1Availability of financial services* ................................................................ 81 .......... n ..........4.2 Switzerland ..............................................6.4Ease of access to loans* .......................................................................... 33 .......... n ..........3.3 Qatar ........................................................4.9Availability of trade finance* ...................................................................... 86 .......... n ..........3.6 Hong Kong SAR ......................................5.8
7.04 Openness to foreign participation index (1–7) ........................................... 53 .......... n ..........4.5 Ireland ......................................................5.5Ease of hiring foreign labour* .................................................................... 45 .......... n ..........4.3 United Arab Emirates ...............................5.6Business impact of rules on FDI* .............................................................. 73 .......... n ..........4.5 Ireland ......................................................6.7Openness to multilateral trade rules (0–100) ............................................. 51 .......... n ........69.6 Slovenia .................................................92.2
7.05 Index of physical security (1–7) ................................................................. 37 .......... n ..........6.0 Qatar ........................................................6.8Reliability of police services* ..................................................................... 47 .......... n ..........4.7 Finland .....................................................6.7Business costs of crime and violence* ...................................................... 46 .......... n ..........5.2 Qatar ........................................................6.8Business costs of terrorism* ..................................................................... 37 .......... n ..........6.1 Slovenia ...................................................6.7Homicide cases/100,000 pop. ................................................................. 74 .......... n ..........3.6 Hong Kong SAR ......................................0.2Index of terrorism incidence (1-7) ............................................................... 1 .......... n ..........7.0 Multiple economies (48) ...........................7.0
© 2014 World Economic Forum