input costs and net returns trends for arkansas field ... costs and net returns trends for arkansas...
TRANSCRIPT

Input Costs and Net Returns Trends for
Arkansas Field Crops, 2000-2017
Input Costs and Net Returns Trends for
Arkansas Field Crops, 2000-2017
June 2017
Archie Flanders
Extension Economist
University of Arkansas System Division of Agriculture
Northeast Research and Extension Center
Keiser, AR
For questions and comments related to this report contact 870-526-2199 ext. 108 or
University of Arkansas, United States Department of Agriculture and County Governments
Cooperating. The Division of Agriculture offers its programs to all eligible persons regardless of
race, color, national origin, religion, gender, age, disability, marital or veteran status, or any other
legally protected status, and is an Affirmative Action/Equal Opportunity Employer.
Table of Contents
Section Page
Introduction 1
Input Costs for 2017 Field Crop Production 1
Net Returns Projections for 2017 Field Crop Production
4
Trends, 2000-2017
Reences 5
Figure 1. Cotton Costs, 2000-2017 6
Figure 2. Cotton Returns, 2000-2017 6
Figure 3. Corn Costs, 2000-2017 7
Figure 4. Corn Returns, 2000-2017 7
Figure 5. Soybean Costs, 2000-2017 8
Figure 6. Soybean Returns, 2000-2017 8
88
Figure 7. Rice Costs, 2000-2017 9
Figure 8. Rice Returns, 2000-2017 9
88
Figure 9. Grain Sorghum Costs, 2000-2017 10
Figure 10. Grain Sorghum Returns, 2000-2017 10
88
Figure 11. Wheat Costs, 2000-2017 11
Figure 12. Wheat Returns, 2000-2017 11
88
References 12
88
Input Costs and Net Returns Trends for Arkansas Field Crops, 2000-2017
Relative prices among inputs are determinants of potential profitability for field crop
production. Input price increases for inputs with extensive application levels in a crop will
decrease profits relatively more for that crop than for crops with less extensive application levels
of identical inputs. Input costs per unit of crop output is a useful measure for gauging
profitability potential in relation to expected commodity prices. This report presents estimates of
costs per acre for typical Arkansas methods of crop production, as well as trends in input prices
and net returns for field crops.
Input Costs for 2017 Field Crop Production
Input prices applied to field rates of usage determine production costs. Crop enterprise
budgets developed by the University of Arkansas Cooperative Extension Service include
estimated costs per acre for field crops (University of Arkansas System 2017). Budget costs
represent the most generalized production practices for three irrigation scenarios: 1) surface, 2)
center pivot, and 3) non-irrigated. For this report, aggregated 2017 production functions are
developed for field crops as weighted averages of crop enterprise budgets. Weighted average
crop enterprise budgets are presented in Table 1. Input prices were updated in March 2017 so
that costs are representative of the spring 2017 planting period. Irrigation energy costs are
weighted by irrigation type, as well as diesel or electric power source (USDA-NASS 2015a;
USDA-NASS 2015b). Rice weights are percentages of seed type planted based on information
from Extension specialists.
Value of cottonseed sold as a by-product is assumed equal to all post-harvest costs. Thus, post-
harvest costs are excluded from operating costs for cotton. Cotton has the greatest operating
costs in Table 1 of $549.43/acre. With post-harvest costs excluded for cotton, rice has the second
greatest operating costs of $516.90/acre. Wheat has the lowest operating costs of $219.99/acre.
Fixed costs are greatest for cotton with $175.26/acre and lowest for wheat with $51.43/acre.
Adding fixed costs and operating costs leads to cotton having the greatest total production costs
of $724.69/acre. Rice total costs of $624.33/acre in Table 1 include building levees, but costs do
not include any other activities related to land forming. Costs for land rent are not included in
Table 1.
Operating costs in Table 1 consists of production inputs, repairs and other fees, and post-harvest
expenses. Table 2 summarizes total costs with the three categories for operating costs.
Production inputs include seeds, fertilizers, chemicals, custom applications, diesel fuel,
electricity, supplies, surveying levees, and labor. Cotton has the greatest costs of production
inputs with $549.43/acre. Production inputs are lowest for wheat with $203.50/acre.
Expected yields for 2017 are calculated as trend line Arkansas yields (USDA-NASS 2017).
Dividing total costs by expected yields results in total costs per yield unit in Table 2. For
example, corn prices received above $3.25/bu. represent revenue greater than total production
costs, excluding land costs.
1

Table 1. Weighted Average Crop Enterprise Budgets, per Acre, Arkansas Field Crops, 2017
Expense Cotton Corn Soybean Rice Sorghum Wheat
Seed, Includes All Fees 123.50 111.84 72.60 81.51 19.30 32.00
Nitrogen 32.17 74.61 0.00 49.50 32.49 37.92
Phosphate (P2O5) 11.62 24.46 16.30 16.30 24.46 8.15
Potash (K2O) 13.78 21.75 14.50 14.50 21.75 9.67
Other Nutrients 8.56 23.38 0.00 8.83 0.00 4.27
Herbicide 109.85 51.56 85.37 46.88 48.15 26.70
Insecticide 78.69 0.00 18.75 3.75 11.91 0.00
Other Chemicals 24.14 0.00 14.88 15.00 0.00 14.33
Custom Chemical & Fertilizer Applications 11.91 5.95 14.00 45.36 3.01 28.00
Diesel Fuel, Pre-Post Harvest 10.93 7.05 7.41 8.07 6.40 5.36
Repairs and Maintenance, Pre-Post Harvest 11.62 7.49 8.31 6.57 6.41 5.40
Diesel Fuel, Harvest 10.75 5.70 3.70 6.65 4.75 4.75
Repairs and Maintenance, Harvest 18.10 9.98 5.49 11.88 7.10 7.10
Irrigation Energy Cost 20.99 24.48 17.98 55.36 8.84 0.00
Irrigation System Repairs & Maintenance 3.09 3.61 2.65 5.59 1.30 0.00
Supplies (ex. polypipe, other) 2.57 2.57 2.21 0.00 1.30 0.00
Other Inputs, Levee Gates 0.00 0.00 0.00 0.70 0.00 0.00
Labor, Field Activities 23.45 11.36 9.65 12.51 9.39 7.81
Scouting/Consultant Fee 10.00 6.00 7.00 8.00 6.00 0.00
Boll Weevil Eradication Fee 4.00 0.00 0.00 0.00 0.00 0.00
Crop Insurance 8.41 13.00 7.21 10.00 13.00 7.85
Interest, Annual Rate for 6 Months 11.30 8.50 6.47 8.55 4.74 4.19
Cotton: Hauling, Ginning; Grain: Drying 116.80 34.81 0.00 67.20 0.00 0.00
Cotton: Warehousing; Other: Hauling 46.72 45.80 12.85 31.92 23.00 15.90
Promotions, Boards, Classing 11.39 1.83 2.26 2.27 0.92 0.59
Operating Costs1,2 549.43 495.75 329.59 516.90 254.20 219.99
Pre-Harvest and Harvest Machinery 146.75 72.17 64.17 73.74 63.03 48.98
Irrigation Equipment 21.17 24.10 18.14 30.01 9.22 0.00
Miscellaneous Overhead3 7.34 3.61 3.21 3.69 3.15 2.45
Fixed Costs 175.26 99.88 85.52 107.43 75.40 51.43
Total Costs4 724.69 595.63 415.11 624.33 329.61 271.42 1Value of cottonseed sold assumed equal to cotton post-harvest expenses. 2Cottonseed value deducted from cotton post-harvest expenses. 3Estimated as percentage of pre-harvest and harvest machinery. 4Does not include land cost.
2

Table 2. Summary of Weighted Average Crop Enterprise Budgets, per Acre, 2017
Expense Category Cotton Corn Soybean Rice Sorghum Wheat
Production Inputs 482.91 364.73 277.35 364.93 191.74 178.96
Repairs & Other Fees 66.52 48.58 37.12 50.59 38.54 24.54
Total Production Expenses 549.43 413.31 314.48 415.51 230.28 203.50
Post-Harvest Expenses1 0.00 82.44 15.11 101.39 23.92 16.49
Total Operating Expenses2 549.43 495.75 329.59 516.90 254.20 219.99
Fixed Costs 175.26 99.88 85.52 107.43 75.40 51.43
Total Costs3 724.69 595.63 415.11 624.33 329.61 271.42
Unit Cost4,5 0.62 3.25 8.72 3.72 3.58 4.31 1Value of cottonseed sold assumed equal to cotton post-harvest expenses. 2Cottonseed value deducted from cotton post-harvest expenses. 3Does not include land cost. 4Total costs per lb. for cotton, all other are total cost per bu. 5Trend line yield is applied.
Production inputs are presented by input type in Table 3. Chemicals are the greatest cost for
cotton and soybeans. For cotton, chemicals are 44% of production input costs. Chemicals are
43% of production input costs for soybeans. Fertilizers are the greatest production input costs for
corn (40%), rice (24%), sorghum (41%), and wheat (34%). Seed cost for cotton is $123.50/acre
which is 26% of production inputs. Seed cost for corn is $111.84 which is 31% of production
inputs. Seed cost for soybean production is 26% of production inputs and 22% for rice. Diesel
and electricity costs are greatest for rice due to energy requirements for irrigation. The capital
intensive nature of crop production is indicated by the relatively low labor cost for all crops in
Table 3.
Table 3. Production Input Costs Details, Percent of Total Production Inputs, per Acre, 2017
Input Cotton Corn Soybean Rice Sorghum Wheat
Seed 123.50 111.84 72.60 81.51 19.30 32.00
Percent 26 31 26 22 10 18
Fertilizers 66.12 144.20 30.80 89.14 78.69 60.01
Percent 14 40 11 24 41 34
Chemicals 212.68 51.56 119.00 65.63 60.06 41.03
Percent 44 14 43 18 31 23
Diesel & Electricity 42.67 37.24 29.09 70.08 19.99 10.11
Percent 9 10 10 19 10 6
Labor, Field Activities 23.45 11.36 9.65 12.51 9.39 7.81
Percent 5 3 3 3 5 4
Custom Work, Supplies, Other 14.49 8.53 16.21 46.06 4.31 28.00
Percent 3 2 6 13 2 16
Total Production Inputs1 482.91 364.73 277.35 364.93 191.74 178.96
Percent1 100 100 100 100 100 100 1Totals may not sum due to rounding.
3

Net Returns Projections for 2017 Field Crop Production
Crop enterprise budgets developed by the University of Arkansas Cooperative Extension
Service include estimated costs per acre for field crops (University of Arkansas System 2017.)
Input prices applied to field rates of usage determine production costs. Budget costs represent the
most generalized production practices for three irrigation scenarios: 1) surface, 2) center pivot,
and 3) non-irrigated. For this report, aggregated 2017 production functions are developed for
field crops as weighted averages of crop enterprise budgets. Irrigation energy costs are weighted
by irrigation type, as well as diesel or electric power source. Rice weights are percentages of
seed type planted based on information from Extension specialists. Table 4 presents average net
returns with state average 2017 trend line yields and expected commodity prices received
determined by USDA forecasts for 2017 price and historical differences between annual U.S.
prices and Arkansas prices (USDA-WASDE 2017; USDA-NASS 2017).
Table 4. Weighted Average Net Returns, per Acre, Arkansas Field Crops, 2017
Revenue and Expenses Cotton Corn Soybean Rice Sorghum Wheat
Average Yield1: Cotton (lbs.), Other (bu.) 1,168 183 47.6 168 92 59
Price Received2 0.670 3.70 9.50 4.95 3.20 4.25
Sell Seed3 174.91
Operating Costs4 549.43 495.75 329.59 516.90 254.20 219.99
Returns to Operating Costs 233.13 182.09 122.61 314.70 40.20 30.33
Fixed Costs 175.26 99.88 85.52 107.43 75.40 51.43
Total Costs5 724.69 595.63 415.11 624.33 329.61 271.42
Net Returns to Land & Management 57.87 82.21 37.09 207.27 -35.21 -21.09 12017 yield is trend line yield. 2Price based on U.S. forecast and historical Arkansas difference; Cotton price is for lint only. 3Value of cottonseed sold assumed equal to cotton post-harvest expenses. 4Cottonseed value deducted from cotton post-harvest expenses. 5Does not include land cost.
Net returns to land and management in 2017 are projected greatest for rice with $207.27 per acre.
Corn has the second greatest net returns with $82.21 per acre. Soybean projected net returns are
$37.09 per acre. Cotton net returns of $57.87 per acre are for lint only and do not include
cottonseed rebate value potentially greater than post-harvest expenses.
Table 4 is weighted net returns for surface irrigation, pivot irrigation, and non-irrigated
production and excludes land costs. Most acreage in Arkansas field crop production is rented on
the basis of cash rent per acre or share rent as a percentage of revenue. Rental arrangements vary
widely and are influenced by productivity that is determined by yield potential. Yields for
irrigated acreage represented in crop enterprise budgets are greater than state average yields and
correspond to land that is typically rented for a 25% share rental rate. Table 5 presents costs and
returns for Arkansas surface irrigated acreage with a 25% share rent. Price of cotton in Table 5
includes a $0.05/lb. premium for value of cottonseed. As a comparison to results in Table 2 for
state average corn cost per bushel without land cost that is $3.25/bu., Table 5 indicates that cost
for irrigated corn production including land is $3.82/bu.
4

Table 5. 2017 Net Returns Projection, per Acre, Surface Irrigation
Receipts Cotton Corn Sorghum Soybean Rice
Hybrid
Rice
Yield (cotton-lb, other-bu) 1,200 210 115 60 170 190 1Price ($/yield unit) 0.72 3.70 3.20 9.50 4.95 4.95
Grower Share, % 75% 75% 75% 75% 75% 75%
Crop Revenue 648.00 582.75 276.00 427.50 631.13 705.38 2Gin Rebate/Bale
Operating Expenses
Input Costs 478.52 368.99 210.05 278.23 331.31 408.63
Other Operating Expenses 89.50 58.93 49.75 47.13 60.48 62.10
Total Out-of-Pocket Expenses 568.02 427.92 259.80 325.36 391.79 470.73
Post-harvest Expenses 180.00 94.50 29.90 19.05 102.60 114.67
3Net Operating Expenses 568.02 522.42 289.70 344.41 494.39 585.40
Cash Land Rent 0.00 0.00 0.00 0.00 0.00 0.00
4Returns to Operating Expenses 79.98 60.33 -13.70 83.09 136.74 119.98
Fixed Costs 162.21 84.80 72.07 77.19 94.07 94.07
5Total Specified Expenses 730.23 607.22 361.77 421.60 588.46 679.47
4Returns to Specified Expenses -82.23 -24.47 -85.77 5.90 42.67 25.91
Operating Expenses/yield unit 0.47 2.49 2.52 5.74 2.91 3.08
Total Expenses5/yield unit 0.61 2.89 3.15 7.03 3.46 3.58
Land Expense/acre 216.00 194.25 92.00 142.50 210.38 235.13
Land Expense/yield unit 0.18 0.93 0.80 2.38 1.24 1.24
Total Cost/yield unit, including land 0.79 3.82 3.95 9.40 4.70 4.81 1Cotton: includes value of cottonseed, net of post-harvest expenses 2Gin rebate is set equal to post-harvest expenses. 3Gin rebate deducted from post-harvest expenses. 4Share rent and cash land rent are deducted from crop revenue. 5Does not include management or other expenses and fees not associated with production.
Trend in Costs and Returns for 2000-2017
Historical trends in Arkansas costs of production are estimated by applying annual costs of
production reported for regions most closely associated with Arkansas production characteristics
(USDA-ERS 2017). These annual costs account for input price changes, as well as changes in
production technology. Annual Arkansas yields and prices received are reported by the National
Agricultural Statistics Service (USDA-NASS 2017). Trends in costs of production and returns
are presented in Figure 1 through Figure 12.
5

Figure 1. Arkansas Cotton Costs, 2000-20171 12017 yield for post-harvest costs is trend line forecast
Figure 2. Arkansas Cotton Returns1, 2000-20172 1Market receipts for lint only 22017 yield is trend line forecast
400
450
500
550
600
650
700
750
800
2000 2005 2010 2015
$/A
cre
YearProduction Costs Total Costs
-350
-300
-250
-200
-150
-100
-50
0
50
100
150
200
250
300
350
2000 2005 2010 2015
$/A
cre
YearReturns to Operating Costs Returns to Total Specified Costs
6

Figure 3. Arkansas Corn Costs, 2000-20171 12017 yield for post-harvest costs is trend line forecast
Figure 4. Arkansas Corn Returns1, 2000-20172 1Market receipts only 22017 yield is trend line forecast
200
250
300
350
400
450
500
550
600
650
700
2000 2005 2010 2015
$/A
cre
YearProduction Costs Total Variable Costs Total Costs
-200
-100
0
100
200
300
400
500
600
700
2000 2005 2010 2015
$/A
cre
YearReturns to Operating Costs Returns to Total Specified Costs
7
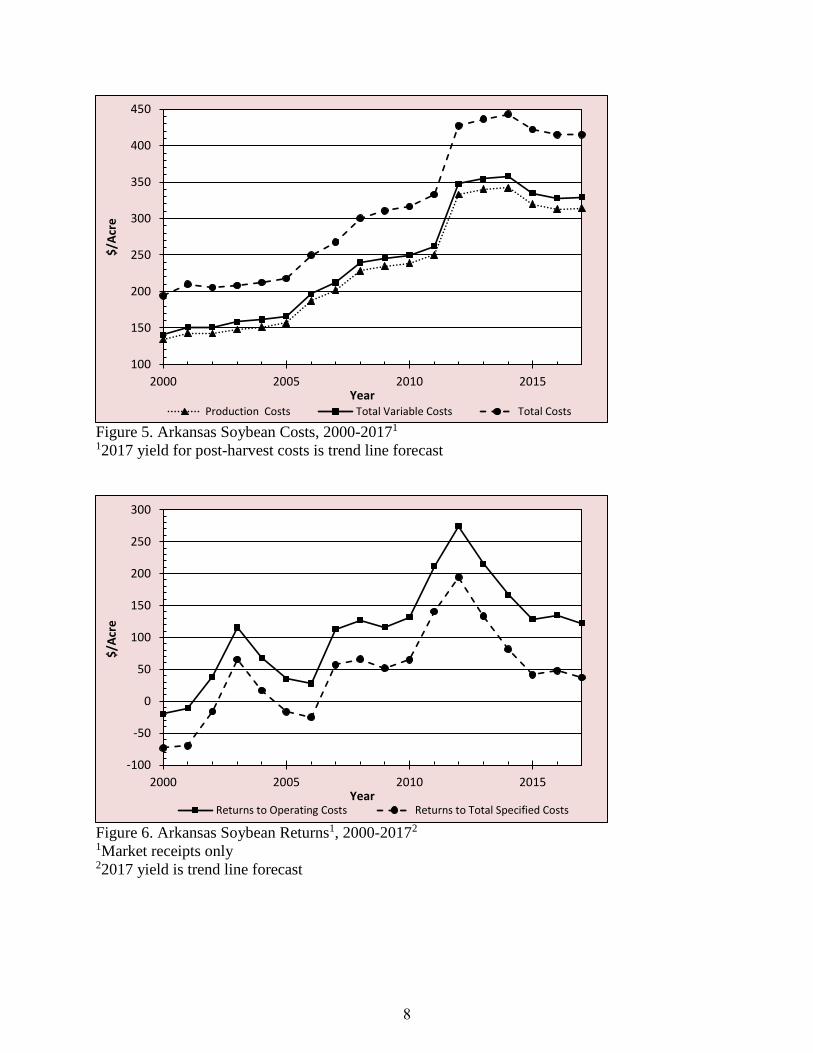
Figure 5. Arkansas Soybean Costs, 2000-20171 12017 yield for post-harvest costs is trend line forecast
Figure 6. Arkansas Soybean Returns1, 2000-20172 1Market receipts only 22017 yield is trend line forecast
100
150
200
250
300
350
400
450
2000 2005 2010 2015
$/A
cre
YearProduction Costs Total Variable Costs Total Costs
-100
-50
0
50
100
150
200
250
300
2000 2005 2010 2015
$/A
cre
YearReturns to Operating Costs Returns to Total Specified Costs
8

Figure 7. Arkansas Rice Costs, 2000-20171 12017 yield for post-harvest costs is trend line forecast
Figure 8. Arkansas Rice Returns1, 2000-20172 1Market receipts only 22017 yield is trend line forecast
200
250
300
350
400
450
500
550
600
650
700
2000 2005 2010 2015
$/A
cre
YearProduction Costs Total Variable Costs Total Costs
-200
-100
0
100
200
300
400
500
600
2000 2005 2010 2015
$/A
cre
YearReturns to Operating Costs Returns to Total Specified Costs
9

Figure 9. Arkansas Grain Sorghum Costs, 2000-20171 12017 yield for post-harvest costs is trend line forecast
Figure 10. Arkansas Grain Sorghum Returns1, 2000-20172 1Market receipts only 22017 yield is trend line forecast
150
200
250
300
350
400
2000 2005 2010 2015
$/A
cre
YearProduction Costs Total Variable Costs Total Costs
-200
-150
-100
-50
0
50
100
150
200
250
2000 2005 2010 2015
$/A
cre
YearReturns to Operating Costs Returns to Total Specified Costs
10

Figure 11. Arkansas Wheat Costs, 2000-20171 12017 yield for post-harvest costs is trend line forecast
Figure 12. Arkansas Wheat Returns1, 2000-20172 1Market receipts only 22017 yield is trend line forecast
50
100
150
200
250
300
350
2000 2005 2010 2015
$/A
cre
YearProduction Costs Total Variable Costs Total Costs
-100
-50
0
50
100
150
200
2000 2005 2010 2015
$/A
cre
YearReturns to Operating Costs Returns to Total Specified Costs
11

References
USDA-Economic Research Service (ERS). 2017. Commodity Costs and Returns, USDA-ERS,
Washington, DC. Available online at http://www.ers.usda.gov/
USDA-National Agricultural Statistics Service (NASS). 2015a. 2012 Census of Agriculture,
USDA-NASS, Washington, DC. Available online at
http://www.agcensus.usda.gov/Publications/2012/Full_Report/Volume_1,_Chapter_2_US_State
_Level/
USDA-National Agricultural Statistics Service (NASS). 2015b. 2013 Farm and Ranch Irrigation
Survey, USDA-NASS, Washington, DC. Available online at http://www.nass.usda.gov/
USDA-National Agricultural Statistics Service (NASS). 2017. U.S. & All States Data-Crops,
USDA-NASS, Washington, DC. Available online at http://www.nass.usda.gov/
USDA-World Agricultural Supply and Demand Estimates (WASDE). 2017. World Agricultural
Supply and Demand Estimates, USDA-WASDE, WASDE-566, Washington, D.C., June 9, 2017.
Internet Site: http://www.usda.gov/oce/commodity/wasde/
University of Arkansas System. 2017. “2017 Crop Enterprise Budgets,” Division of Agriculture,
Cooperative Extension Service, Little Rock, AR, March 2017.
12