inpex corporation financial results - ir webcasting · inpex corporation financial results for the...
TRANSCRIPT

INPEX CORPORATION
Financial Resultsfor the year ended March 31, 2017May 15, 2017
1
Agenda
Corporate Overview
Outlook
Financial Results for the year ended March 31, 2017
Consolidated Financial Forecastsfor the year ending March 31, 2018

2
Cautionary Statement
This presentation includes forward-looking information that reflects the plans and expectations of the Company. Such forward-looking information is based on the current assumptions and judgments of the Company in light of the information currently available to it, and involves known and unknown risks, uncertainties, and other factors. Such risks, uncertainties and other factors may cause the Company’s performance, achievements or financial position to be materially different from any future results, performance, achievements or financial position expressed or implied by such forward-looking information. Such risks, uncertainties and other factors include, without limitation:
Price volatility and change in demand in crude oil and natural gas
Foreign exchange rate volatility
Change in costs and other expenses pertaining to exploration, development and production
The Company undertakes no obligation to publicly update or revise the disclosure of information in this presentation (including forward-looking information) after the date of this presentation.

Corporate Overview
Toshiaki Kitamura
Representative Director, President & CEO

4
FY 2017/03 Financial Results PresentationHighlights
■ Financial Resultsand Forecasts
- Financial Results (FY2017/03)• Net sales ¥874.4 billion (13.4% decrease YoY)• Net income ¥46.1 billion (175.2% increase YoY)
- Financial Forecasts (FY2018/03)• Net sales ¥844.0 billion (Forecast)• Net income ¥47.0 billion (Forecast)
■ Net Production - FY2017/03 Results: 521 thousand BOED (1.4% increase YoY)
■ Proved Reserves - FY2017/03 Results: 3.30 billion BOE (1.2% increase YoY)
■ Key Projects
- Ichthys LNG Project:• CPF sailed away. Following the arrival of the CPF and the FPSO,
installation and commissioning work will be undertaken and production from the wellhead will commence.
• Thereafter, the Ichthys LNG Project will begin production of condensate, LNG and LPG in sequence during the current fiscal year.
- Kashagan Oil Field: Production restarted; first batch of crude oil dispatched in October 2016.
- Natural Gas Business in Japan: Natural gas sales in FY2018/03 estimated to be 2,120 million m3

5
Continuous Enhancement of E&P Activities
Conducted exploratory drilling offshore Shimane and Yamaguchi prefectures, Japan (June - October) Reached final investment decision to develop Tangguh LNG Expansion Project, Indonesia (July) Awarded exploration license for Block 3 in Mexican sector of northern Gulf of Mexico(December) Entering development and production phase at oil field in Irkutsk, Russia (December) Signed heads of agreement with Rosneft Oil Company, Russia (in relation to cooperation on joint
exploration, development and production of hydrocarbons at license block offshore Russia) (December)
Agreed in principle on extension of joint development of Satah and Umm Al Dalkh oil fields offshore Abu Dhabi, United Arab Emirates (January)
Succeeded in oil discovery at onshore exploration Block 10, Iraq (February)
Strengthening Gas Supply Chain
Commenced partial (July) and full operations (October) of Toyama Line, Japan
Agreed to sales contracts with three additional city gas companies based on Heads of Agreement with Chubu Electric on joint business operation to supply wholesale electricity (September)
Reinforcement of Renewable Energy Initiatives
Commenced drilling survey in geothermal project in Fukushima Prefecture, Japan (June) Commenced commercial operations of first unit of Sarulla Geothermal Independent Power Producer
(IPP) Project in Indonesia (March)
FY 2017/03 Corporate Highlights
Note: Months in parentheses indicate timing of press release.

6
Ichthys LNG ProjectOverview
Current progress: Commissioning work in progress on the main facilities Production to start up sequentially during the current fiscal
year, product shipments following thereafter
Production Plan: Production period: approx. 40 years⇒ The project will
maintain peak production for approx. 20 years Approx. 8.9 million t/y of LNG⇒ Production capacity
increased from 8.4 million t/y to 8.9 million t/y (approx. 6% increase)
Approx. 1.65 million t/y of LPG⇒ Production capacity expected to increase by approx. 4% from 1.6 million t/y
Approx. 100,000 bbl/d of condensate (at peak)
Proved reserves Approx. 930 million BOE (based on INPEX’s participating
interest of 62.245%)
Participating interests held in multiple blocks in the vicinity of the Ichthys Field contributing to future gas production potential
Marketing Secured LNG SPAs covering 8.4 million t/y of LNG Reached an agreement in principle on the sale of the entire
volume of INPEX’s share of LPG etc.Onshore facility1st Train (April 2017)

7
Ichthys LNG ProjectOffshore facilities / Production wells ①
Key milestones (2016~)Milestone Achieved
Installation of subsea flow lines completed
Installation of subsea productionfacilities completed
CPF sail away
FPSO sail away
CPF / FPSO mooring
Production start-up
※CPF: Central Processing FacilityFPSO: Floating Production Storage and Offloading
CPFの出航(2017年4月)
CPF sail away (April 2017)

8
Ichthys LNG ProjectOffshore facilities / Productions wells ②
Naming ceremonies for CPF and FPSO held in February 2017
CPF sailed away from construction site in Geoje, South Korea in April 2017
CPF scheduled to be towed to the Ichthys Field over a period of approximately one and a half months
Installation of subsea production facilities completed in January 2017 (Production manifold, umbilical cable, etc.)
Subsea installation (January 2017)Naming ceremonies for CPF / FPSO
(February 2017)

9
Ichthys LNG ProjectOnshore facilities ①
Key Milestones (2016~)
Milestone Achieved
Construction of product loadingjetty completed
Construction and delivery of all 230modules completed
Pipelay of gas export pipeline(onshore part) completed / Ready todeliver gas
Hydrostatic testing on all producttanks completed
Start-up of power generators
LNG Plant ready for gas intake
Commencement of feed gas intakeand start-up of production of allproducts
Pipelay of gas export pipeline(November 2016)
Construction of tanks (April 2017)
10
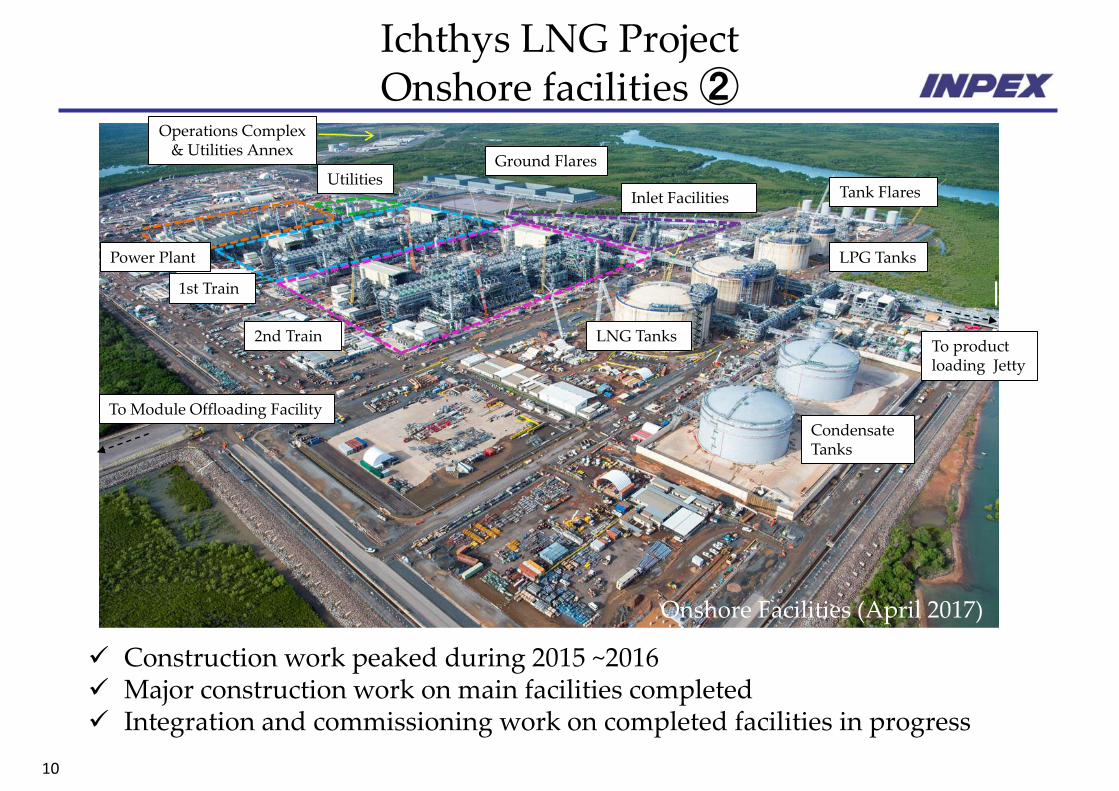
Onshore Facilities (April 2017)
Construction work peaked during 2015 ~2016 Major construction work on main facilities completed Integration and commissioning work on completed facilities in progress
LNG Tanks
Condensate Tanks
To product loading Jetty
LPG Tanks
Tank Flares
Ground FlaresUtilities
Operations Complex & Utilities Annex
1st Train
2nd Train
Inlet Facilities
Power Plant
Ichthys LNG ProjectOnshore facilities ②
To Module Offloading Facility
11
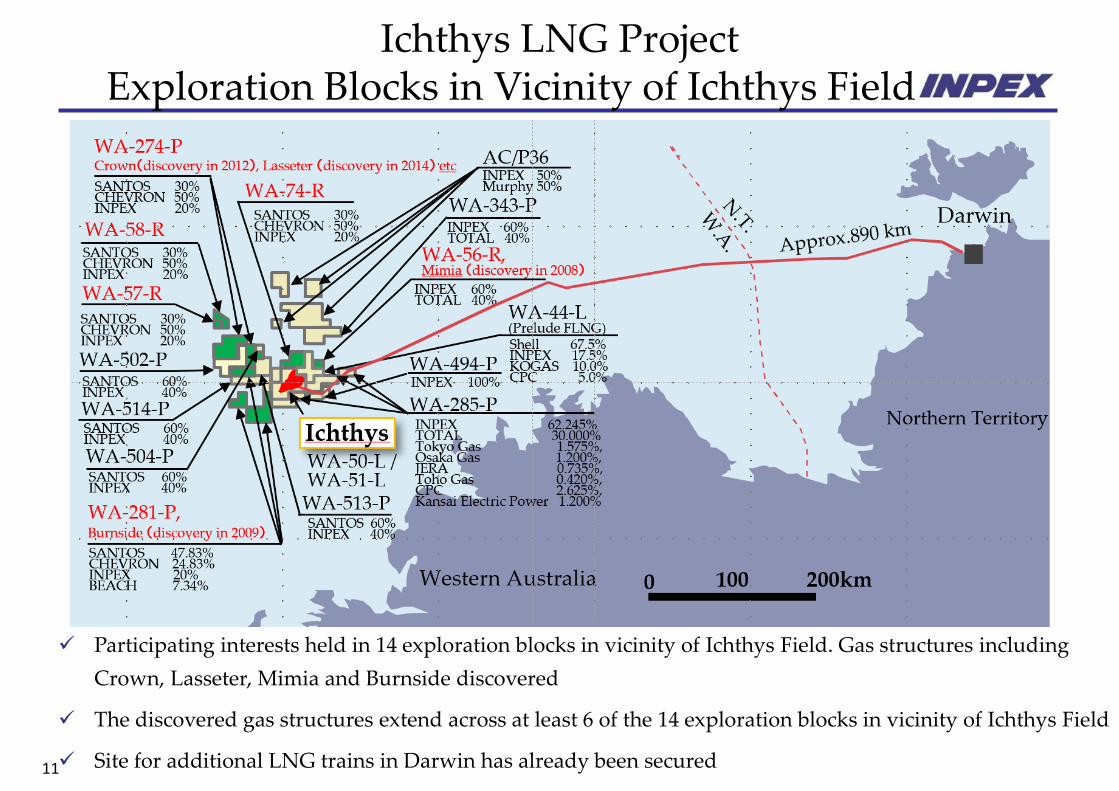
Participating interests held in 14 exploration blocks in vicinity of Ichthys Field. Gas structures including
Crown, Lasseter, Mimia and Burnside discovered
The discovered gas structures extend across at least 6 of the 14 exploration blocks in vicinity of Ichthys Field
Site for additional LNG trains in Darwin has already been secured
Ichthys LNG ProjectExploration Blocks in Vicinity of Ichthys Field

12
Abadi LNG Project
Location of Masela BlockAbadi Gas Field (image)
0 10km
Mitaka NakanoUeno
Shibuya
Kawasaki
Chiba
Tsudanuma
Machida
Tachikawa
Hachioji
Fussa
Omiya
Ikebukuro
Matsudo
Kashiwa
Ichikawa
Minamikoshigaya
Yokohama
SouthWest
South
West
North
Shibuya
Noborito
ShinjukuTokyo
INPEX aims for an early realization of the project and is currently engaged in
constructive discussions with the Indonesian government on the optimal development
of the Abadi Gas Field, with an eye to begin pre-FEED work.

13
ナダ
Topics for FY 2017/03
●Production project
Exploration project
Progress of the existing projects (Results in the second half of FY 2017/03)
Russian Federation:Zapadno-Yaraktinsky Block
Entering development and production phase in December 2016
The United Mexican States: Block 3, Perdido Fold Belt, Mexican Gulf of Mexico Awarded exploration license
in December 2016 Participating Interest:
33.3333%(Operator: Chevron)
Republic of Iraq: Onshore Exploration Block 10 Discovered oil deposits through
exploratory well drilling Participating Interest : 40%
(Operator: Lukoil)
United Arab Emirates: Satah and Umm Al Dalkh Oil Fields Offshore Abu Dhabi Agreed in principle on extension of joint
development in December 2016 (25-year extension from 8 March 2018 to 31 December 2042)
Participating Interest: Satah Oil Field 40%Umm Al Dalkh Oil Field 12% (to discussterms including increasing INPEX’s participating interest from 12% to 40%)
(Operator: ADNOC)
Republic of Kazakhstan:Kashagan Oil Field Commenced
dispatch of crude oil from onshore plant in October 2016
Participating Interest : 7.56%
(Operator:NCOC (North Caspian Operating Company))
●

14
Natural Gas Business in Japanand Initiatives on Renewable Energy
Domestic natural gas business
Toyama Line completed in June 2016. Commenced
supply of natural gas to Nissan Chemical Industries,
Nihonkai Gas and Asahi Soft Drinks.
Established Domestic Energy Supply & Marketing
Division to further strengthen natural gas business
operations in Japan effective April 2017.
Natural Gas Sales
FY 2017/03: approx. 1,910 million m3
FY 2018/03 (estimated): approx. 2,120 million m3
Indonesia: Sarulla Geothermal Independent Power Producer (IPP) Project
Power plant with maximum capacity of 330MW, the world’s largest single-contract geothermal power project
Commenced commercial operations of 1st unit in March 2017, targeting phased ramp-up with 2nd and 3rd units
Geothermal power generation business
Sarulla Geothermal IPP Project

15
Net Production* (FY 2017/03)
* The production volume of crude oil and natural gas under the production sharing contracts entered into by the INPEX Group corresponds to the net economic take of the INPEX Group.
5% 5%
36% 31%
6%6%
48% 52%
4% 5%514 521
0
100
200
300
400
500
600
Mar. 16 Mar. 17
(Th
ou
san
dB
OE
D)
Japan Asia/OceaniaEurasia Middle East/AfricaAmericas

16
24.7years
17.4 years
Reserves to
production ratio****
2,188 2,532 2,434
3,264 3,304
1,907
1,945 1,610
1,705 1,389
0
1,000
2,000
3,000
4,000
5,000
6,000
Mar.' 13 Mar.' 14 Mar.' 15 Mar.' 16 Mar.' 17M
illi
on
BO
E
Proved Reserves Probable Reserves** ***
Production Cost, Proved + Probable Reserves* and Reserve Indices
4,095
4,477
4,044
4,970
* The reserves cover most INPEX Group projects including equity method affiliates. The reserves of theprojects for which a large amount of investment is expected and which should materially affect thecompany’s future results are evaluated by DeGolyer & MacNaughton, and the others are evaluated internally.The reserves for Mar.’17 in this presentation are provisional results.
** The proved reserves are evaluated in accordance with SEC regulations. When probabilistic methods areemployed, there should be at least a 90% probability that the quantities actually recovered will equal orexceed the estimated proved reserves.
*** The probable reserves are evaluated in accordance with SPE/WPC/AAPG/SPEE guidelines (SPE-PRMS)approved in March 2007. When probabilistic methods are employed, there should be at least a 50%probability that the quantities actually recovered will equal or exceed the sum of estimated proved andprobable reserves. Probable reserves do not offer a guarantee of the production of total reserves during afuture production period with the same certainty as proved reserves.
**** Reserves to production ratio = Reserves as of March 31, 2017 / Production for the year ended March 31, 2017***** Reserve Replacement Ratio = Proved reserves increase including acquisition / production in the fiscal year
4,693
100%
321%
246%
0%
100%
200%
300%
400%
Mar. '15 Mar. '16 Mar. '17
Reserve Replacement Ratio (3-year average)*****
Production Cost per BOE (Excl. Royalty))
11.2
7.86.1
0.0
3.0
6.0
9.0
12.0
15.0
Mar. '15 Mar. '16 Mar. '17
US
$/B
OE

Outlook
Toshiaki Kitamura
Representative Director, President & CEO

18
Actual and Planned Investments
22.6 37.2 27.9 51.8 10.5 1.0
53.9 71.0 72.6 39.3 16.1 8.0
576.6
854.7 929.0
880.0
578.5 606.0
653.1
962.9
1,029.7 971.2
605.2 615.0
0
100
200
300
400
500
600
700
800
900
1,000
1,100
1,200
Mar.'13
(Actual)
Mar.'14
(Actual)
Mar.'15
(Actual)
Mar.'16
(Actual)
Mar.'17
(Actual)
Mar.'18
(Estimate)
Mar.'19
(Provisional*3)
Development*1 Exploration Other capital expenditures*2
(Billions of Yen)
273 371 255 432 98 10
650 709 662 327 149 70
6,954
8,532 8,464
7,325
5,338 5,510
7,877
9,612 9,381
8,084
5,585 5,590
0
1,000
2,000
3,000
4,000
5,000
6,000
7,000
8,000
9,000
10,000
11,000
12,000
Mar.'13
(Actual)
Mar.'14
(Actual)
Mar.'15
(Actual)
Mar.'16
(Actual)
Mar.'17
(Actual)
Mar.'18
(Estimate)
Mar.'19
(Provisional*3)
(Millions of US$ )
Exploration Other capital expenditures
Actual and planned investments in Yen(Billions of Yen)
Actual and planned investments in US$ (Millions of US$)
*1 Includes investments in Ichthys downstream business*2 Mainly investments in Naoetsu LNG Terminal and domestic pipeline network
*3 Provisional amounts including Development, Exploration and Other capital expenditures
Development

19
521
577
0
100
200
300
400
500
600
700
800
900
1,000
Mar. '17 Mar. '18 E Mar. '19 E Mar. '20 E Mar. '21 E Mar. '22 E
Th
ou
san
d B
OE
D
Japan Asia/Oceania Eurasia Middle East/Africa Americas
52%
31%
Net Production* Volume Projection
(Actual)Early 2020s
600 - 700
507
5%
6%
5%
Note: Assumed Brent oil price for net production projection : $50/bbl
* The production volume of crude oil and natural gas under the production sharing contracts entered into by INPEX Group corresponds to the net economic take of the Group.
** The production volume projection of crude oil and natural gas after Mar.’17 may change due to the price of oil and gas and situation of project.
Following the Ichthys start-up etc., the total production volume from existing projects will reach approximately 600 to 700 thousand BOED
Target for the 2020s1 million BOED

20
Key initiatives from FY2013 based on Medium- to Long-Term Vision and Future Outlook
Indonesia
US Gulf of Mexico
Participation / Extension of Project
Final Investment Decision
Commencement of ProductionMar 2013 Mar 2014 Mar 2015 Mar 2016 Mar 2017 Mar 2018(E)
Kazakhstan・Commenced oil production from Kashagan Oil Field
・Acquired participating interest in ADCO Onshore Concession・Extended Concession Agreement for Upper Zakum Oil Field・Agreed in principle on extension of joint development of Satah and Umm Al Dalkhoil fields・Commenced oil production from Umm Lulu and Nasr oil fieldsbegan production
・Acquired participating interest in Angola Block 14・Commenced oil production from Lianzi Field
Dividend(Yen per share
on annual basis)
17.5 18.0 18.0 18.0 18.0
Total Investment
(Billions of yen)
Production Cost(excl. royalty,
USD/boe)
653.1
962.91,029.7
971.2
605.2
Mar 2019~
9.09.8 11.2
7.8
6.1
・Acquired participating interest in Lucius project and commenced oil production
・Completed Naoetsu LNG Terminal・Completed Toyama line
・Commenced gas production from Ruby Gas Field in Sebuku Block・Made Final Investment Decision to expand Tangguh LNG Project・Joined the Sarulla IPP Project and commenced commercial operations
・Acquired participating interest in Prelude FLNG Project・Commenced oil production from Coniston Oil Field
Corporate Strategy
Medium- to Long-Term Vision
Response to
Oil Price Downturn
Corporate Strategy
post Ichthys Start-up
615.0
18.0(※beginning of term)
Kazakhstan
United Arab Emirates
Angola
Japan
Australia

Financial Results for the year ended March 31, 2017
Masahiro Murayama
Director, Senior Managing Executive Officer
Senior Vice President, Finance & Accounting

22
Highlights of the Consolidated Financial Resultsfor the year ended March 31, 2017
Apr. ‘15 - Mar. ‘16 Apr. ‘16 - Mar. ‘17 Change %Change
Net sales (Billions of yen) 1,009.5 874.4 (135.1) (13.4%)
Crude oil sales 679.2 617.1 (62.0) (9.1%)
Natural gas sales (including LPG) 316.7 242.5 (74.1) (23.4%)
Others 13.5 14.6 1.0 8.1%
Operating income (Billions of yen) 390.1 336.4 (53.6) (13.8%)
Ordinary income (Billions of yen) 374.7 333.8 (40.8) (10.9%)
Net income attributable to
owners of parent (Billions of yen)16.7 46.1 29.3 175.2%
Net income per share (Yen) 11.49 31.61 20.12 175.2%
Average number of INPEX shares issued and outstanding during the year ended March 31, 2017: 1,460,357,146
Average crude oil price (Brent) ($/bbl) 48.73 49.88 1.15 2.4%
Average exchange rate (¥/$) 120.15 108.38 11.77 yenappreciation
9.8% yenappreciation

23
Crude Oil Sales
Sales volume (thousand bbl) 117,227 122,207 4,980 4.2%
Average unit price of overseas production ($/bbl)
47.95 46.41 (1.54) (3.2%)
Average unit price of domestic production (¥/kl) 38,259 35,997 (2,262) (5.9%)
Average exchange rate (¥/$) 120.74 108.6712.07 yen
appreciation
10.0% yen
appreciation
Apr. ‘15 - Mar. ’16 Apr. ‘16 - Mar. ’17 Change %Change
Net sales (Billions of yen) 679.2 617.1 (62.0) (9.1%)
Sales volume by region
(thousand bbl)Apr. ‘15 - Mar. ’16 Apr. ‘16 - Mar. ’17 Change %Change
Japan741
(117.8 thousand kl)
900(143.0 thousand kl)
159(+25.3 thousand kl)
21.4%
Asia & Oceania 13,505 12,246 (1,259) (9.3%)
Eurasia (Europe & NIS) 11,666 11,336 (331) (2.8%)
Middle East & Africa 89,486 95,495 6,009 6.7%
Americas 1,829 2,230 401 21.9%
Total 117,227 122,207 4,980 4.2%
24
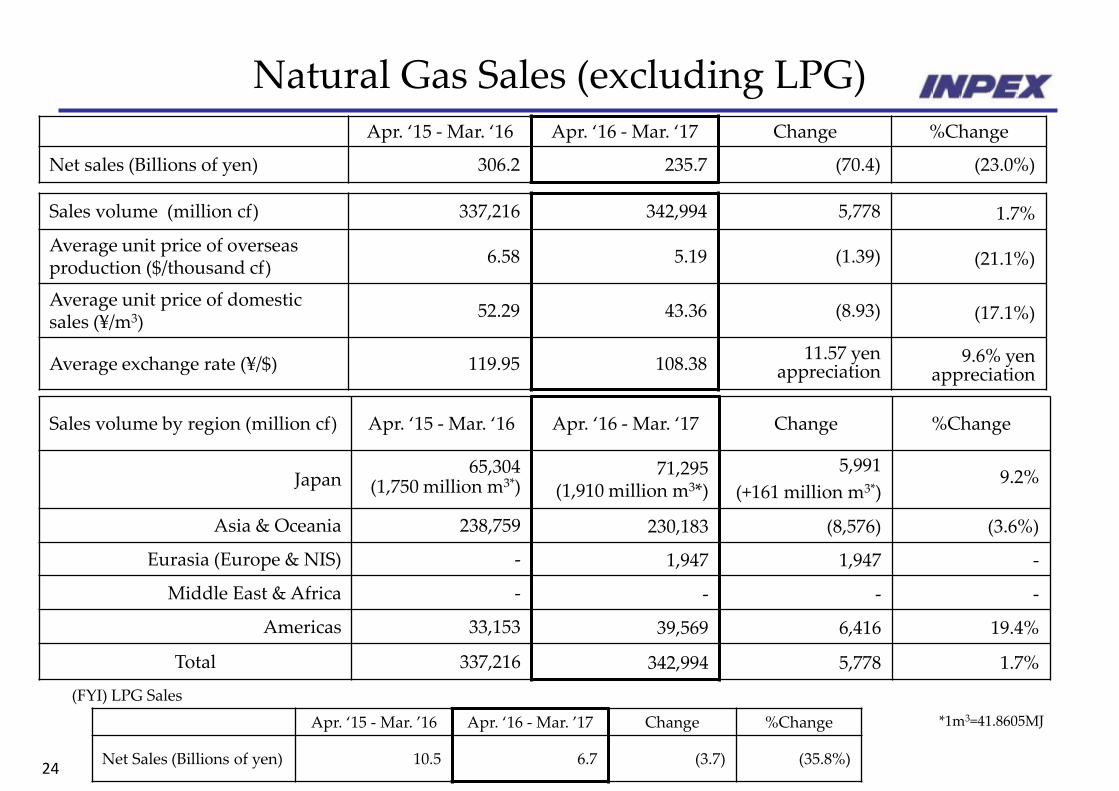
Natural Gas Sales (excluding LPG)
Sales volume (million cf) 337,216 342,994 5,778 1.7%
Average unit price of overseas production ($/thousand cf)
6.58 5.19 (1.39) (21.1%)
Average unit price of domestic sales (¥/m3)
52.29 43.36 (8.93) (17.1%)
Average exchange rate (¥/$) 119.95 108.3811.57 yen
appreciation9.6% yen
appreciation
Apr. ‘15 - Mar. ‘16 Apr. ‘16 - Mar. ‘17 Change %Change
Net sales (Billions of yen) 306.2 235.7 (70.4) (23.0%)
Sales volume by region (million cf) Apr. ‘15 - Mar. ‘16 Apr. ‘16 - Mar. ‘17 Change %Change
Japan65,304
(1,750 million m3*)71,295
(1,910 million m3*)
5,991
(+161 million m3*)9.2%
Asia & Oceania 238,759 230,183 (8,576) (3.6%)
Eurasia (Europe & NIS) - 1,947 1,947 -
Middle East & Africa - - - -
Americas 33,153 39,569 6,416 19.4%
Total 337,216 342,994 5,778 1.7%
(FYI) LPG Sales
Apr. ‘15 - Mar. ’16 Apr. ‘16 - Mar. ’17 Change %Change
Net Sales (Billions of yen) 10.5 6.7 (3.7) (35.8%)
*1m3=41.8605MJ

25
Statement of Income
(Billions of Yen) Apr. ‘15 - Mar. ’16 Apr. ‘16 - Mar. ’17 Change %Change
Net sales 1,009.5 874.4 (135.1) (13.4%)
Cost of sales 526.7 453.8 (72.9) (13.8%)
Gross profit 482.8 420.5 (62.2) (12.9%)
Exploration expenses 6.1 6.7 0.5 9.2%
Selling, general and administrative expenses
86.5 77.3 (9.1) (10.5%)
Operating income 390.1 336.4 (53.6) (13.8%)
Other income 69.9 39.0 (30.8) (44.1%)
Other expenses 85.3 41.6 (43.6) (51.2%)
Ordinary income 374.7 333.8 (40.8) (10.9%)
Extraordinary loss
(Impairment loss)45.8 6.3 (39.5) (86.1%)
Total income taxes 354.3 271.3 (83.0) (23.4%)
Net income (loss) attributable to non-controlling interests
(42.2) 9.9 52.2 -
Net income attributable to owners of parent
16.7 46.1 29.3 175.2%
Cost of sales for Crude Oil : 304.4(Change) (39.7)
Cost of sales forNatural Gas* : 136.9(Change) (33.7)* Including LPG
Increase in sales volume : +34.8
Decrease in unit price : (85.9)
Exchange rate
(Appreciation of yen) : (85.1)
Others : 1.0
Main factors for change :
Gain on sales of marketable securities (25.9)
Dividend income (8.0)
Main factors for change :
Equity in losses of affiliates (20.6)
Provision for allowance for recoverable accounts under production sharing
(10.6)Loss on disposal of fixed Assets (8.5)

26
Other Income/Expenses
(Billions of Yen) Apr. ‘15 - Mar. ‘16 Apr. ‘16 - Mar. ‘17 Change %Change
Other income 69.9 39.0 (30.8) (44.1%)
Interest income 10.7 10.4 (0.2) (2.7%)
Dividend income 10.8 2.8 (8.0) (74.1%)
Gain on sales of marketable securities 25.9 - (25.9) -
Gain on sales of investment securities 5.6 4.9 (0.6) (11.8%)
Equity in earnings of affiliates - 2.1 2.1 -
Foreign exchange gain 2.9 - (2.9) -
Other 13.7 18.6 4.9 35.8%
Other expenses 85.3 41.6 (43.6) (51.2%)
Interest expense 4.1 5.2 1.0 24.5%
Equity in losses of affiliates 20.6 - (20.6) -
Provision of allowance for doubtful accounts 0.1 8.3 8.1 -
Provision for allowance for recoverable accounts under production sharing 25.0 14.3 (10.6) (42.6%)
Provision for exploration projects 0.3 - (0.3) -
Foreign exchange loss - 3.7 3.7 -
Loss on disposal of fixed assets 13.2 4.7 (8.5) (64.0%)
Other 21.6 5.1 (16.4) (76.0%)

27
16.7
34.8
(85.1)
1.0
72.910.4
9.1 1.8
39.5
46.1
(85.9)
83.0
(52.2)
-150
-100
-50
0
50
100
150
(億円)(億円)
Net income(loss)
attributable to non-controlling
interests
Net income attributableto owners of parentApr.16 –Mar. ‘17
Net income attributableto owners of parentApr.15 –Mar. ‘16
Analysis of Net Income Increase
*Provision for allowance for recoverable accounts under production sharing and Provision for exploration projects
Increasein Sales volume
Decrease inUnit price
Decrease in Cost ofsales
Decrease in Exploration
expenses andAllowance forexploration*
Decrease in
SG&A
Other income
and expenses
Net Sales
Decrease in income
tax payable
OthersExchange rate(Appreciation
of yen)
(Billions of Yen)
Extraordinaryloss
(Impairmentloss)
28
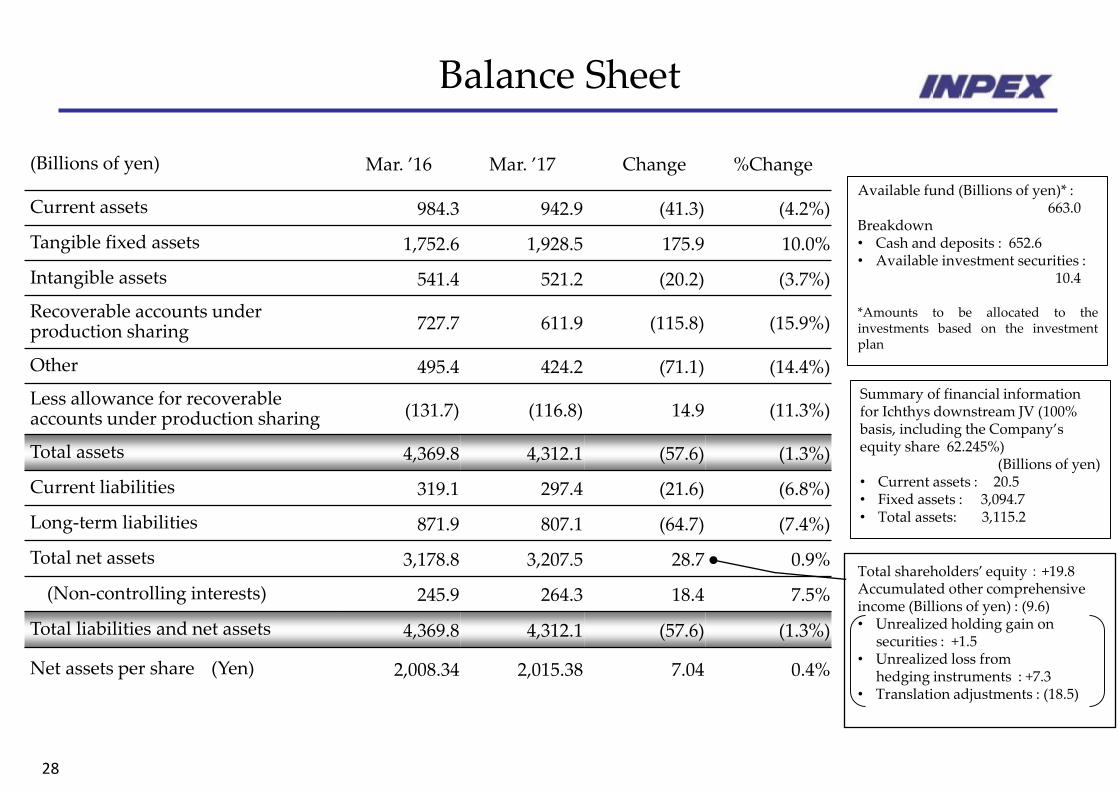
Balance Sheet
(Billions of yen) Mar. ’16 Mar. ’17 Change %Change
Current assets 984.3 942.9 (41.3) (4.2%)
Tangible fixed assets 1,752.6 1,928.5 175.9 10.0%
Intangible assets 541.4 521.2 (20.2) (3.7%)
Recoverable accounts under production sharing 727.7 611.9 (115.8) (15.9%)
Other 495.4 424.2 (71.1) (14.4%)
Less allowance for recoverableaccounts under production sharing (131.7) (116.8) 14.9 (11.3%)
Total assets 4,369.8 4,312.1 (57.6) (1.3%)
Current liabilities 319.1 297.4 (21.6) (6.8%)
Long-term liabilities 871.9 807.1 (64.7) (7.4%)
Total net assets 3,178.8 3,207.5 28.7 0.9%
(Non-controlling interests) 245.9 264.3 18.4 7.5%
Total liabilities and net assets 4,369.8 4,312.1 (57.6) (1.3%)
Net assets per share (Yen) 2,008.34 2,015.38 7.04 0.4%
Summary of financial information for Ichthys downstream JV (100% basis, including the Company’s equity share 62.245%)
(Billions of yen) • Current assets : 20.5 • Fixed assets : 3,094.7 • Total assets: 3,115.2
Available fund (Billions of yen)* : 663.0
Breakdown • Cash and deposits : 652.6• Available investment securities :
10.4
*Amounts to be allocated to theinvestments based on the investmentplan
Total shareholders’ equity : +19.8Accumulated other comprehensive income (Billions of yen) : (9.6) • Unrealized holding gain on
securities : +1.5 • Unrealized loss from
hedging instruments : +7.3• Translation adjustments : (18.5)

29
Statement of Cash Flows
(Billions of Yen) Apr. ‘15 - Mar. ‘16 Apr. ‘16 - Mar. ‘17 Change %Change
Income before income taxes 328.8 327.5 (1.3) (0.4%)
Depreciation and amortization 86.7 91.1 4.3 5.0%
Recovery of recoverable accounts under production sharing (capital expenditures) 64.1 79.8 15.6 24.4%
Recoverable accounts under production sharing (operating expenditures) (45.8) (2.8) 43.0 -
Income taxes paid (393.5) (292.8) 100.7 (25.6%)
Other 143.2 72.9 (70.3) (49.1%)
Net cash provided by (used in) operating activities 183.7 275.8 92.1 50.1%
Payments for time deposits / Proceeds from time deposits 245.9 566.5 320.6 130.4%
Payments for long-term time deposits / Proceeds from long-term time deposits (439.9) - 439.9 -
Payments for purchases of tangible fixed assets (476.7) (278.3) 198.4 (41.6%)
Payments for purchases of marketable securities/investment securities and proceeds from sales of marketable securities/investment securities
196.4 (69.6) (266.0) -
Investment in recoverable accounts under production sharing (capital expenditures) (60.4) (37.3) 23.1 (38.2%)
Long-term loans made / Collection of long-term loans receivable 169.0 (133.2) (302.2) -
Payments for purchases of mining rights (134.5) - 134.5 -
Other (43.1) 5.4 48.6 -
Net cash provided by (used in) investing activities (543.5) 53.4 597.0 -
Net cash provided by (used in) financing activities 156.7 (65.4) (222.1) -
Cash and cash equivalents at end of the period 53.8 316.7 262.9 -

30
Financial Indices
* Net Debt/Total Capital Employed (Net) = (Interest-bearing debt - Cash and deposits - Public and corporate bonds and other debt securities(with determinable value) – Long term time deposits)/(Net assets + Interest-bearing debt - Cash and deposits - Public and corporate bonds and other debt securities (with determinable value) – Long term time deposits)
** Equity Ratio = (Net assets - Non-controlling interests)/Total assets*** D/E Ratio = Interest-bearing debt/ (Net asset - Non-controlling
interests)
D/E Ratio***
Net Debt/Total Capital Employed (Net)* Equity Ratio**
67.1% 68.3%
Mar.'16 Mar.'17
0.9%
(8.1%)
Mar.'17Mar.'16
25.3% 23.4%
Mar.'16 Mar.'17

Consolidated Financial Forecastsfor the year ending March 31, 2018
Masahiro Murayama
Director, Senior Managing Executive Officer
Senior Vice President, Finance & Accounting

32
Consolidated Financial Forecastsfor the year ending March 31, 2018
Cash dividends per share (yen)
2Q End 9.0 9.0
FY End 9.0 9.0
TOTAL 18.0 18.0
Full YearMar. ‘17(Actual)
Mar. ‘18(Forecasts) Change % Change
Net Sales (Billions of yen) 874.4 844.0 (30.4) (3.5%)
Operating Income (Billions of yen) 336.4 303.0 (33.4) (9.9%)
Ordinary Income (Billions of yen) 333.8 329.0 (4.8) (1.5%)
Net income attributable to owners of parent (billions of yen)
46.1 47.0 0.8 1.8%
1st Half 2nd Half Full year
Brent oil price ($/bbl) 50.0 50.0 50.0
Average exchange rate (¥/$) 110.0 110.0 110.0
Net Sales (Billions of yen) 389.6 431.0 41.3 10.6%
Operating Income (Billions of yen) 138.0 155.0 16.9 12.3%
Ordinary Income (Billions of yen) 132.1 167.0 34.8 26.3%
Net income attributable to owners of parent (billions of yen)
15.7 24.0 8.2 52.6%
1st Half

33
Sales and Investment Planfor the year ending March 31, 2018
Mar. ’17(Actual)
Mar. ‘18(Forecasts ) Change % Change
Sales V
olu
me
Crude oil (thousand bbl)1 122,207 119,393 (2,814) (2.3%)
Natural gas (million cf)2 342,994 266,609 (76,385) (22.3%)
Overseas 271,699 187,643 (84,057) (30.9%)
Japan71,295
(1,910 million m3)
78,967
(2,116 million m3)
7,671
(206 million m3)10.8%
LPG (thousand bbl)3 1,860 257 (1,602) (86.2%)
Note
1 CF for domestic crude oil sales and petroleum products : 1kl=6.29bbl
2 CF for domestic natural gas sales : 1m3=37.32cf
3 CF for domestic LPG sales : 1t=10.5bbl
4 Development expenditure includes investment in Ichthys downstream
5 “Provision for allowance for recoverable accounts under production sharing” + ”Provision for exploration projects”, related to exploration activities
6 Capital increase from Non-controlling interests, etc.
(Billions of yen)Mar. ‘17(Actual)
Mar. ‘18(Forecasts)
Change % Change
Development expenditure4 578.5 606.0 27.5 4.8%
Other capital expenditure 10.5 1.0 (9.5) (90.5%)
Exploration expenditure 16.1 8.0 (8.1) (50.3%)
Exploration expenses and Provision for explorations5 9.5 8.7 (0.8) (8.4%)
(Non-controlling Interests Portion)6 1.9 2.9 1.0 52.6%
Exploration expenses 6.7
Provision for explorations 2.7
Exploration expenses 4.5
Provision for explorations 4.2

34
Net Income Sensitivities
(Note1) The sensitivities represent the impact on net income for the year ending March 31, 2018 against a $1 /bbl increase (decrease) of Brent crude oil price on annual average and a ¥ 1 depreciation (appreciation) against the U.S. dollar. These are based on the financial situation at the beginning of the fiscal year. These are for reference purposes only and the actual impact may be subject to change in production volumes, capital expenditures and cost recoveries, and may not be constant, depending on crude oil prices and exchange rates.
(Note2) This is a sensitivity on net income by fluctuation of crude oil price and is subject to the average price of crude oil (Brent) in the fiscal year.
(Note3) This is a sensitivity on net income by fluctuation of the yen against the U.S. dollar and is subject to the average exchange rate in the fiscal year. On the other hand, a sensitivity related to valuation for assets and liabilities denominated in the U.S. dollar on net income incurred by foreign exchange differences between the exchange rate at the end of the fiscal year and the end of the previous fiscal year is almost neutralized.
Sensitivities of crude oil price and foreign exchange fluctuation on consolidated net income attributable to owners of parent for the year ending March 31, 2018 (Note 1) (Billions of yen)
Brent Crude Oil Price; $1/bbl increase (decrease) (Note 2)
+2.4 (-2.4)
Exchange Rate; ¥1 depreciation (appreciation) against the U.S. dollar (Note 3)
+1.0 (-1.0)