inorganic materials science master thesisessay.utwente.nl/50800/1/verslag_song.pdf · university of...
TRANSCRIPT

Master thesis
Influence of water vapor on silica membranes:
Effect of sorption and percolation
Inorganic Materials Science
Inorganic Materials Science Group MESA+ Research Institute Faculty of Chemical Technology
Name: Chunlin Song Student No.: S0097756 Graduation committee: Prof. dr. ing. Dave H.A. Blank (Chairman) Drs. Tijana Zivkovic (Supervisor) Dr. Henny J.M. Bouwmeester Ing. Henk Kruidhof Dr. Martin van Sint Annaland Dr. ir. Arian Nijmeijer
August 2005
UUnniivveerrssiittyy ooff TTwweennttee TThhee NNeetthheerrllaannddss

Foreword
This final report for the assignment of Master Degree in Chemical Engineering at the
University of Twente specialization in Materials Science is a part of the PhD project of Ms.
Tijana Zivkovic in the Inorganic Materials Science Group of Professor Dave Blank.
During the one-year study at the University of Twente, I finished all of the required seven
courses and this assignment. I sincerely thank Tijana for the full support, including the help
with the literature and experiments.
I would like to thank Dr. Henny J.M. Bouwmeester and Dr. Nieck E. Benes for the
beneficial discussions. I also appreciate the advice from the members of the graduation
committee, although I regretfully lack enough time to realize all of their suggestions.
Further, the technical support from the technicians in the Inorganic Materials Science
Group has been outstanding in terms of teaching me how to make samples, building up the
setup, doing the repairs etc.
Special thanks to Dr. Herbert Wormeester and the Solid State Physics Group where
measurements of sorption were carried out with an ellipsometer in their group. The hospitality
of all group members and the help from the technicians are highly appreciated.
I have spent a wonderful time in the Inorganic Materials Science Group.
Thank you all.
Chunlin Song
Enschede, August 2005

Abstract
Silica-based membranes are considered to be promising means of hydrogen separation at
elevated temperatures due to their high H2 permeance, very good selectivity and relative ease
to scale up. This is especially relevant for their applications in coal gasification and steam
reforming where water vapor is present. The membranes studied here are composed of three
layers: macroporous α-Al2O3 as the support, mesoporous γ-Al2O 3 as the intermediate layer
and microporous amorphous silica as the separation layer.
In this report, the influence of water vapor on He transport through silica membrane has
been investigated in terms of adsorption and percolation effect at relatively low temperatures
(i.e. 50 and 90°C). The selected temperatures maximize the difference of mobility between
He and H2O molecules and avoid the structural change. He is considered to be a mobile
component, while H2O is an immobile one when these two gases transported under the
specified conditions.
Two main methods of characterization on the actual as-deposited membrane layers
employed in this study are spectroscopic ellipsometry for water vapor adsorption and the gas
permeation for He transport in presence of water vapor. The former is a versatile technique to
record the water vapor adsorption in situ, while the later provides the information on the
percolation effect.
The isotherms of water vapor adsorption in the silica layer obtained from the ellipsometry
are of Type I according to the IUPAC classification, complying with the typical adsorption
behavior in the microporous materials. This result is in accordance with the range of pore size
of the studied silica membrane (~4 Å). The adsorption isotherms generally comply with the
first-order Langmuir isotherm with a slight deviation probably caused by the heterogeneous
adsorption of H2O molecules at the different active sites on the silica surface.
He flux through the silica membrane decreases dramatically in presence of water vapor,
even in the low pH2O range due to the blocking effect by the strongly absorbed H2O molecules.
The transport of gas molecules through such small silica pores can be assumed not to be
continuous any more, with the gas molecules hopping from one occupied site to another
unoccupied one under the potential gradient. When the coverage of water vapor in the silica
layer increases, the He permeance is affected by the percolation effect. The irregular lattice,
heterogeneous sites and gas molecules hopping to the sites on the opposite wall of narrow
pore may cause the transition of He flux to happen at the high coverage of immobile
component. He flux does not vanish even when the coverage of immobile H2O molecules is
close to 100% likely due to the presence of big pores in the silica layer.

Contents Assignment description 1 Chapter 1 Theory 2 1.1 Membranes for hydrogen separation 2
1.2 Gas transport in the porous materials 4
1.2.1 Single-component transport 4
1.2.1.1 Viscous flow 5 1.2.1.2 Knudsen diffusion 4 1.2.1.3 Surface diffusion 5
1.2.2 Multi-component transport 5 1.2.2.1 Gaseous diffusion in the macroporous materials 5 1.2.2.2 Micropore diffusion 6 1.2.2.3 Maxwell-Stefan equation 7
1.2.3 Percolation effect 8
1.3 Silica membrane 11
1.3.1 Synthesis of the silica membrane 11 1.3.2 Influence of water vapor on the gas permeance through silica membrane 12
1.4 Gas sorption 15
1.4.1 Introduction 15 1.4.2 Adsorption isotherm 16 1.4.3 Langmuir isotherm 17 1.4.4 Adsorption of water vapor on the unsupported porous silica materials 19 1.4.4.1 Active groups on the surface of silica materials 19
1.4.4.2 Adsorption on the porous silica materials 20
1.5 Sorption measurements in the thin layer by the ellipsometry 23
1.5.1 The principle of ellipsometry 23 1.5.2 Sorption of water vapor on silica layers by the ellipsometry 28
Chapter 2 Sample preparation and experiments 30
2.1 Samples 30
2.2 Experimental methods and setups 30 2.2.1 Water vapor generator 30 2.2.2 Gas permeation 32 2.2.3 Ellipsometry 34

Chapter 3 Results 37
3.1 Gas permeation in the presence of water vapor 37
3.2 Water vapor adsorption in the microporous silica layer 40
Chapter 4 Discussion 44
4.1 Influence of water vapor on gas permeation 44
4.2 water vapor adsorption in the microporous silica layer 45
4.3 Percolation effect 46
Chapter 5 Conclusions 49
Suggestions 50
References 54
Appendix

Assignment description
1
Assignment description Hydrogen is a high-value gas with versatile applications as a chemical feedstock or as an
alternative fuel (e.g. for fuel cells). Currently, hydrogen is produced mainly from the
processes in terms of coal gasification and steam reforming of methane. Both methods
generate a mixture of H2, CO2, H2O and other gases.
Microporous silica membrane is one of the feasible means for separating H2 from this
industrial gaseous mixture in an energy-efficient and cost-saving way, compared to the
conventional separation methods (e.g. pressure swing adsorption and cryogenic separation).
At high temperatures and in the presence of water vapor, silica membrane can undergo
the rehydration or viscous sintering, resulting in the change of pore structure. However, in this
assignment, we have examined how the presence of water vapor can decrease significantly
the permeance of an inert gas through the silica membranes at low temperatures, where no
structural change is expected.
The objective of this assignment is to illustrate that the adsorption and blocking by the
immobile component (e.g. H2O at low temperature) present in the silica micropores may
decrease the permeance of the mobile one (e.g. H2, He) in a binary mixture. In the case of the
silica membrane exposed to the binary gas mixture (e.g. H2 and H2O) at low temperatures,
H2O is considered to be an immobile component, having a strong interaction with the silica
surface. As a result, the permeance of mobile component is lowered due to the adsorption and
blocking effect of water vapor being the most pronounced at the concentration near or above
the percolation threshold, i.e. the point of no flux of the mobile component due to the absence
of a connected path for the mobile component through the membrane.
In a word, this report focuses on the effect of water vapor on silica membranes in terms
of sorption and percolation.

Chapter 1 Theory
2
Chapter 1 Theory 1.1 Membranes for hydrogen separation
The need for hydrogen will increase greatly in the future as a raw material for the
chemical industry and as clean fuels in cars and electric industry (e.g. fuel cells). Currently,
hydrogen is produced mainly by the reforming of fossil fuels and coal gasification. However,
hydrogen is there mixed with large quantities of non-desired components such as light
hydrocarbons, CO and CO2 from fossil fuels [1-2]. The purification or separation of hydrogen
from these industrial gases by means of membrane has several advantages, including low
energy consumption and cost saving.
In general, membranes can be classified as organic and inorganic based on their material
composition, as porous and dense or as symmetric and asymmetric based on their structure etc.
Flux, selectivity, chemical stability and mechanical strength are the important parameters for
the membrane performance. Although organic membranes have an advantageously low price
and good scalability, they cannot be used at high temperatures or in chemically aggressive
environments containing e.g. HCl, SOx, and their poor mechanical strength hinders their high-
pressure application. Dense metal membranes, usually made of palladium or its alloys, have
very high selectivity for hydrogen (~100%) based on the solution-diffusion mechanism, but a
deadly sensitivity to CO and H2S, in terms of coal gas application [3]. Proton conductors,
such as doped BaCeO3, have a very high selectivity in the water vapor atmosphere, because
only protons can migrate through these materials. However, H2 flux through the proton-
conducting membranes is relatively low (~10-8 mol/cm2·s) [4], and their chemical stability in
the presence of certain species (e.g. CO2, H2S) is another major concern. Furthermore, energy
consumption is disadvantageous because they must be operated at high temperatures (e.g.
800-1000°C) in order to obtain high flux.
Inorganic porous membranes can be used in many industrial applications at high
temperatures (>200°C), and they have high flux and very good selectivity. Two of the most
promising porous materials for membrane are zeolite and silica: the pores in the zeolite
membrane are a part of the crystal structure, and hence have uniform dimensions. Many
zeolites are thermally stable above 500°C. Zeolite membranes are generally formed on porous
supports by hydrothermal synthesis, and hence the membranes have a lot of defects, lowering
the selectivity. The most critical barrier for zeolite applications is the difficulty in producing
in a large scale. Microporous silica membranes have high hydrogen permeance and high
selectivity and excellent capacity to scale up [5]. Hereby, silica-based membranes are

Chapter 1 Theory
3
promising candidates for hydrogen separation at elevated temperatures, although the
steam/water stability of these membranes may be an issue [2].
Generally, the porous ceramic membranes for gas separation consist of several layers
(Fig. 1.1): macroporous (dp > 50 nm) support is often several millimeters thick, giving the
mechanical strength to the system; mesoporous (2 nm < dp < 50 nm) intermediate layer of less
than 100 µm thickness is the bridge of the gap between the large pores of the support and the
small pores of the thin microporous layer (dp < 2 nm); the top layer is the actual functional
part for gas separation.
Ceramic top layer providing high hydrogen flux and selectivity is very suitable to
hydrogen separation [6]. R. de Vos [7] reported about crack-free amorphous silica layers by
dip-coating in a clean room, with high H2 permeance (2×10⁻⁶ mol/m2·s·Pa at 200°C) and
very low CO2 and CH4 permeance (10 and 50× lower, respectively, at 200°C), the details of
each layer are listed in Table 1, and they correspond to the characteristics of the membranes
described in this report.
Layer Component Thickness Sintering temperature Pore size in diameter
Macroporous α-Al2O3 ~2.00 millimeter 1100°C 80 nm
Mesoporous γ-Al2O3 ~200 nm 650°C 2~3 nm
Microporous Amorphous silica ~30 nm 400/600°C ~0.5 nm
Table 1.1 Layer properties of a typical silica membrane for hydrogen separation[7]
Fig. 1.1 Composite membranes

Chapter 1 Theory
4
1.2 Gas transport in the porous materials
Gas transport in the porous materials largely depends on the properties of permeating
gases (e.g. kinetic diameter, polarity), membrane characteristics (e.g. pore size, thickness and
groups on the surface) and operating conditions (e.g. temperature, pressure). Single-
component transport is easier to analyze than the multi-component one. For the single-
component transport, Fick’s first law can be applicable; while for the multi-component
transport, even if the friction among components is neglected, Fick’s first law must be
modified. Maxell-Stefan equation is introduced to describe the multi-component transport
when the friction between the components is not negligible. Percolation phenomena should be
considered in the multi-component transport consisting of components greatly differing in
mobility.
1.2.1 Single-component transport
1.2.1.1 Viscous flow
When the mean free path of gas molecule is smaller than the mean pore diameter, the
collision of molecule-molecule is more frequent than that of molecule-wall, and viscous flow
takes place.
It is assumed that molecules lose all their momentum at the pore wall, and the flux along a
pressure gradient in the pore can be described by the modified Poisecuille equation to account
for the contribution of the pore structure [9]:
dzdP
RTPrN
ητε
8
2
−= (1.2.1)
Where N is molar flux [mol/m2·s], ε is porosity, τ is tortuosity, r is pore radius, η is gas
viscosity, P is pressure, R is gas constant, T is absolute temperature and dP/dz is pressure
gradient.
1.2.1.2 Knudsen diffusion
When the mean free path of gas molecule is larger than the mean pore diameter, the
collision of molecule-wall cannot be negligible compared to that of molecule-molecule, and
Knudsen diffusion happens.
For Knudsen diffusion, the following expression is given [9]:
MRTL
rP
NFπτ
ε 832
−=∆
= (1.2.2)
Where F is permeance in [mol/m2·s·Pa], M is molar mass of the gas and L is pore length.

Chapter 1 Theory
5
1.2.1.3 Surface diffusion
Surface diffusion plays an important role when a significant number of gas molecules are
absorbed on the pore surface by either physisorption or chemisorption, with relative strong
affinity between the gases and surface, so that the gas molecules can transport along the
surface concentration gradient. When the energy barrier between neighboring sites is smaller
than the heat of adsorption, it is easier for the gas molecules to hop to the next sites than to
desorb from the wall surface. Surface flux (Js) can be described by the Fick’s law [10]:
z
DqJ ssat
s ∂∂−
−=θρ
τε1 (1.2.3)
Where ρ is density, satq is saturated amount of adsorbates, Ds is chemical surface
diffusion coefficient and θ is coverage which indicates the covering extent.
There are two important factors: adsorption and mobility, both of which dominate the
surface diffusion. When temperature increases, the mobility of adsorbed molecules also
increases, while the amount of adsorbed molecules decreases. Therefore, the final surface
diffusion rate depends on the dominant effect induced by the temperature increase.
Furthermore, coverage θ can affect the value of Ds: at relative low θ, Ds is independent on the
coverage; while Ds decreases when θ becomes higher.
1.2.2 Multi-component transport
1.2.2.1 Gaseous diffusion in the macroporous materials
If the pore size is much larger than the mean free path of the gas molecules and more
than that of any type of species, momentum transfer from the light (fast) molecules to the
heavy (slow) ones gives rise to a non-selective mass transport mechanism. This transport
mechanism is referred to as gaseous diffusion with the binary diffusion coefficient Dij
showing a small variation with composition. For non-polar gases up to 10 bars, the binary
diffusion coefficient can be estimated from [10]:
ji
ji
jiij MM
MM
VVpT +
+×= −
23/13/1
75.12
)(10013.1D
(1.2.4)
Where T is absolute temperature, p is pressure, V is diffusion volume of a species and
M is molar mass.

Chapter 1 Theory
6
1.2.2.2 Micropore diffusion
Micropore diffusion occurs in the micropores (dp<2 nm). With respect to the pore size, the
following three cases are distinguished phenomenologically [7]:
A. When the pore size is close to the mesopore region: in the central region of the pore, the
unabsorbed molecules can move freely (Knudsen diffusion), and the absorbed ones will
diffuse along the surface (surface diffusion).
B. When the pore size is smaller than that in condition A, the molecules in the center of the
pore still can move according to the Knudsen diffusion, but are not really free. The heat of
sorption increases and the mobility of large molecules (compared to the pore size) decreases.
C. When the pore size is less than the summation of the diameters of gas X and Y, but more
than the diameter of single gas X or Y, both gases can enter the pore but can not pass
independently any more, i.e., the molecules may have a strong mutual influence on their
permeance.
The following basic assumptions can be made when the pore size is so small that the
movement of gas molecules is not continuous any longer [1]:
1. In the microporous materials, the gas molecules are surrounded by pore walls and short-
range interactions (e.g. Van der Waals forces and hydrogen bond) are considered to be
important. Consequently, gas molecules vibrate around the positions where the potential
energy is at a minimum; such a position is referred to as a vacancy. Jumps of the gas
molecules from vacancy to vacancy are possible, and the time for a jump is short compared to
the residence time of a molecule on a vacancy.
2. The microporous medium consists of a connected network of qsat energetically independent
vacancies, where only one molecule can be present at the same time. In other words, the
sorption behavior of gas molecules obeys the ideal Langmuir isotherm.
3. Molecules diffuse from one of the adsorption sites to another one under the driving force of
chemical potential only when that site is vacant, i.e. molecules cannot pass over each other.
Furthermore, the interaction of molecules is assumed to be negligible and there are no
external forces acting on the gas molecules.
When the friction between the components is negligible, the flux expression of a
component i according to Onsager’s theory of irreversible thermodynamics is given[1]:
iiii bcJ µ∇= (1.2.5)
Where iJ is flux, ic is concentration, ib is mobility, and iµ∇ is gradient in chemical
potential. ic can be expressed in terms of satq and θ.

Chapter 1 Theory
7
isat
i qc θ= (1.2.6)
When a vacancy diffusion mechanism operates, ib is related with the probability of
finding a neighboring vacancy.
)1(0lii bb θΣ−= (1.2.7)
Where 0ib is the mobility of component i in the limit of an infinitely low lattice
occupancy. ib can be related to the component diffusion coefficient iD by using Nernst-
Einstein equation.
RTbD ii = (1.2.8)
For the single-component transport
))1/(ln( iii RT θθµ −∇=∇ (1.2.9)
Eq. (1.2.5) can now be rearranged into
ii
sat
i
ii
sati DqqJ D θ
θθ
∇−−= =−
∇ ~
1 (1.2.10)
Where iD~
is so-called chemical diffusion coefficient.
For the multi-component transport, the flux expression is changed into
∑∑≠≠
∇+∇−−=il
liiil
lisat
i DqJ )θθθθ )1((~ (1.2.11)
1.2.2.3 Maxwell-Stefan equation
When the friction between the components is taken into consideration, Maxwell-Stefan
equation is introduced [11].
There are two types of forces in the multi-component mixture:
1. Forces on the individual species
2. Forces due to the interactions between the species
The first forces are known as “driving forces”; the second forces are due to the differences
in velocity between the diffusing species. The driving force on a species i in a mixture equals
the sum of the friction forces between i and the other species j:
)( jij
ijiji uuxd ∑≠
−= ζ (1.2.12)
Where id is the driving force on i, ji,ζ is the friction coefficient between i and j, jx is
the mole fraction of j and u is species velocity.

Chapter 1 Theory
8
The relation between flux J and u is
cuJ = (1.2.13)
Where c is concentration.
The Maxwell-Stefan diffusivity msD is defined as an inverse of the friction coefficient.
ij
msij
RTDζ
= (1.2.14)
For a proper description of the mass transport behavior of an n-component mixture in the
microporous materials, the mechanical interactions between the mobile components and the
solid matrix can be accounted by treating the satq vacancies as the (n+1)th component. The
Maxwell-Stefan equation can be expressed as:
∑≠= +
+−+
−=−
n
ijj
msni
niims
ij
jijii D
uuD
uud
1 1,
1θθθ (1.2.15)
Where msi
msni DD =+1, since 01 =+nu
If there are no external forces acting on the mobile species, then id can be written as
)1
ln(∑−
∇=∇=l
ii
sati
isat
i qRT
qdθ
θθµθ (1.2.16)
Combining Equations (1.2.13, 1.2.15 and 1.2.16), the Maxwell-Stefan equation for multi-
component transport can be given [1]:
∑ ∑ ∑∑ ≠ ≠
∇+∇−−
−−
=n
j il illiil
l
msi
sat
msij
jiijmsii
DqD
JJDJ )θθθθ
θθθ
)1(()1(
(1.2.17)
The first part of above equation on the right side is the contribution of the friction between
the components.
1.2.3 Percolation effect
Imagine an infinite square lattice as shown
in Fig 1.2, the cluster is defined as a group of
neighboring sites connected by bonds. Each
site (bond) of the lattice is occupied randomly
with probability p, independent on its
neighbors. Percolation theory deals with the
formed clusters, in other words, with the
groups of neighboring occupied sites (bonds)
Fig 1.2 Clusters in a 2-D square lattice

Chapter 1 Theory
9
[12]. When the sites are considered, it’s called site percolation, and its counterpart is called
bond percolation. The former is more suitable to describe the behavior of the multi-
component transport in the porous materials, especially in case of a binary mixture of mobile
and immobile components. When the pore size is so small that the continuity of gas transport
does not exist any more, gas molecules are assumed to be transported by hopping from one
site to another..
The percolation threshold pc (Table 2) is that concentration p at and above which an
infinite cluster of connected neighbors from one side of lattice to the other appears in an
infinite lattice, whereas for p<pc no such infinite cluster exists [12].
The percolation threshold can be theoretically predicted by many approaches, including
Monte Carlo (MC) simulation and effective medium approximation (EMA) model. For a 3-
dimensional single cubic lattice, the predicted threshold of site percolation is ~0.7 [12,13,14-
16], for a 2-dimensional square lattice, it is 0.32-0.40 (0.40 [12], 0.37 [16], 0.33 [17], 0.38 [18]
or 0.32 [19]).
Furthermore, percolation threshold largely depends on the connectivity of lattices, i.e. the
coordination number N [20]. The percolation threshold increases with increasing the
connectivity [21].
When the gas transport in the micropores is dominated by the basic assumptions in Section
1.2.2.2 in the case of a binary mixture of components that greatly defer in mobility,
percolation behavior may occur if the motion of the mobile component is suppressed. The
minimum value of coverage of the immobile component, above which the transport of the
mobile molecules through the pores is blocked, is also referred to as the percolation threshold
[13], with a reverse value of the ones in Table 2, i.e. 1- pc, represented by imcp in this report.
The transport behavior of a binary mixture through a zeolite membrane was investigated
where the studied gas mixture consisted of fast and weakly adsorbing hydrogen and slow and
strongly adsorbing n-butane [22-23]. The flux of weakly adsorbing H2 is reduced significantly
Lattice Site-percolation Bond-percolation
Honeycomb 0.6962 0.6527
Square 0.5927 0.5000
Triangular 0.5000 0.3473
Diamond 0.4300 0.3880
Simple cubic 0.3116 0.2488
Body Centered Cubic 0.2460 0.1803
Face Centered Cubic 0.1980 0.1190
Table 1.2 Percolation thresholds for various lattices [12]
Chapter 1 Theory
10
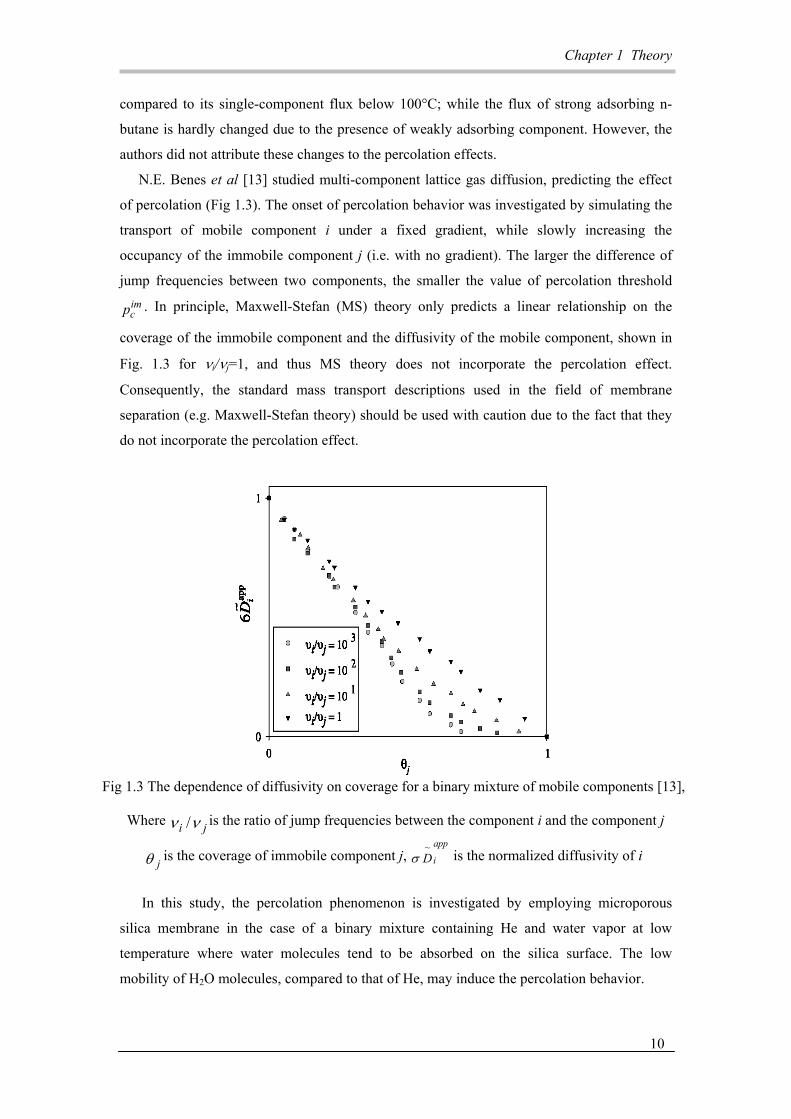
Fig 1.3 The dependence of diffusivity on coverage for a binary mixture of mobile components [13],
Where ji νν / is the ratio of jump frequencies between the component i and the component j
jθ is the coverage of immobile component j, app
iD~
σ is the normalized diffusivity of i
compared to its single-component flux below 100°C; while the flux of strong adsorbing n-
butane is hardly changed due to the presence of weakly adsorbing component. However, the
authors did not attribute these changes to the percolation effects.
N.E. Benes et al [13] studied multi-component lattice gas diffusion, predicting the effect
of percolation (Fig 1.3). The onset of percolation behavior was investigated by simulating the
transport of mobile component i under a fixed gradient, while slowly increasing the
occupancy of the immobile component j (i.e. with no gradient). The larger the difference of
jump frequencies between two components, the smaller the value of percolation threshold imcp . In principle, Maxwell-Stefan (MS) theory only predicts a linear relationship on the
coverage of the immobile component and the diffusivity of the mobile component, shown in
Fig. 1.3 for νi/νj=1, and thus MS theory does not incorporate the percolation effect.
Consequently, the standard mass transport descriptions used in the field of membrane
separation (e.g. Maxwell-Stefan theory) should be used with caution due to the fact that they
do not incorporate the percolation effect.
In this study, the percolation phenomenon is investigated by employing microporous
silica membrane in the case of a binary mixture containing He and water vapor at low
temperature where water molecules tend to be absorbed on the silica surface. The low
mobility of H2O molecules, compared to that of He, may induce the percolation behavior.

Chapter 1 Theory
11
1.3. Silica membrane
1.3.1 Synthesis of the silica membrane
The sol-gel process is one of the most widely used methods for the preparation of very thin
inorganic membranes [24]. Other approaches include Chemical Vapor Deposition, Chemical
Vapor Infiltration and Pulse Laser Deposition. The two main sol-gel routes are colloidal and
polymeric one. Colloidal system is a dispersion of small particles whose diameter is below
1000 nm in a liquid medium so that the effect of gravitational force is negligible and
dispersion is maintained by mutual repulsion forces between the particles. Colloidal particles
can be obtained from hydrolysis and condensation of metal salts or metal alkoxides in water.
The polymeric system is the only gel system where a true oxide network is formed by
chemical polymerization in the liquid near room temperature. Hydrolysis of the alkoxide
groups forms hydroxyl groups; condensation of the hydroxyls forms inorganic polymers and
the polymers are linked to obtain the gel. In the polymerization system, there are two different
mechanisms that dominate the hydrolysis and condensation reaction: acid-catalyzed and base-
catalyzed polymerization [25].
In general, the pore size of the materials obtained by the colloidal route is of the order of
nanometer, whereas the pores of several angstroms can be obtained by the polymeric route.
For silica synthesis, Tetra-Ethyl-Ortho-Silicate (TEOS) is one of the most widely used
precursors. State-of-the-art silica membranes with very narrow pore size and a low number of
defects can be prepared by sol-gel approach in the clean room [7].

Chapter 1 Theory
12
1.3.2 Influence of water vapor on the gas permeance through silica membrane
A good H2-separation membrane should have high hydrogen flux, high H2/CO2 selectivity,
high mechanical strength and good resistance to CO2 & CO and water vapor, necessary for
the application in coal gasification and steam reforming. The kinetic diameters of H2, CO2,
and H2O are 2.89 Å, 3.3 Å and 2.65 Å, respectively. Generally speaking, the greater the
difference between the kinetic diameters of two gas molecules, the higher the membrane
selectivity, and thus the separation of H2 and CO2 is easier than that of H2 and H2O. However,
the separation of gases from a gaseous mixture also depends on the nature of the gas-gas and
gas-surface interaction.
On the silica surface, there are three different groups: siloxane bridges (=Si-O-Si=),
hydroxyl groups (-OH) and unsaturated Si atoms. The siloxane bridges are somewhat
hydrophobic, while hydroxyl groups (-OH) and unsaturated Si atoms are absolutely
hydrophilic. At low temperature, water vapor is absorbed on the silica surface by
physisorption; at high temperature, it becomes chemisorbed by reacting with the siloxanes.
Currently there is a high interest in understanding how the permeance of H2 through silica
membrane is affected in the presence of water vapor.
Since the hydrophobicity of silica surface increases with the decreasing of the amount of
hydroxyl groups, the hydrothermal stability of silica can be improved by increasing the
sintering temperature [7] or by modifying with some organic [26-28] or inorganic [29] groups
to substitute the hydroxyl groups. However, the organic groups on the silica surface
themselves are not very stable at elevated temperatures.
Some general conclusions about the thermal and hydrothermal stability of silica
membrane were represented by R. de Vos [7]:
Thermal stability:
1. The thermal stability up to 300ºC is higher for membranes calcined at higher
temperature.
2. Exposure of silica membrane calcined at 400ºC to a dry atmosphere at 350ºC for 200
hours results in a slight densification of the porous structure
Hydrothermal stability:
1. The influence of water vapor pressure on the membrane deterioration is larger than
that of temperature.
2. For silica membranes calcined at 600ºC, hydrothermal exposure at 350ºC and 475ºC
causes the formation of 200-300 µm holes

Chapter 1 Theory
13
3. Although silica membrane calcined at higher temperatures has less hydroxyl groups,
the decrease of hydroxyl group concentration does not increase the hydrothermal
stability due to the fact that the pore size is reduced with high calcining temperature.
Q. Wei et al [30-31] studied the effect of a low water vapor pressure (pH2O=3.6× 10³ Pa)
on the hydrogen permeance at 200ºC for 120 hours in the case of Silica (400) and methyl-
modified Silica (400) membranes made by sol-gel approach. The H2 permeance of pure Silica
(400) is continually decreasing during 120 hours; however, that of methyl-modified Silica
(400) becomes stable after 50 hours, only dropping about 6% compared with the initial
permeance without the existence of water vapor (Fig. 1.4). This phenomenon indicates that
methyl-modified Silica (400) membrane is more stable than the pure Silica (400). The initial
permeance of modified Silica (400) is higher than that of Silica (400), implying the pore size
of modified Silica (400) is larger, probably due to the addition of methyl groups in the
original sol.
It can be concluded that the permeance through the silica membrane, even the organic-
modified one, is decreased in presence of water vapor. At high temperatures, the interaction
between water vapor and silica surface causes the densification or damage of pore structure,
while at low temperatures, the permeance decreases significantly due to the presence of water
vapor, even without destroying the pore structure [30-31]. The decrease in H2 permeance
could be attributed to the adsorption of water vapor and blocking of silica micropores. This
phenomenon should be more significant at lower temperature where the mobility of H2O
molecules decrease, while the amount of adsorbed H2O molecules increase due to the stronger
interaction.

Chapter 1 Theory
14
0 20 40 60 80 100 1201.8x10-7
1.9x10⁻⁷
2.0x10⁻⁷
2.1x10⁻⁷
2.2x10⁻⁷
2.3x10⁻⁷
2.4x10⁻⁷
2.5x10⁻⁷
H2 p
erm
eanc
e/m
olm
-2Pa
-1s-1
Aging time/hrs
0 20 40 60 80 100 120
PH2O=3.6 X 10³ Pa T=200OC
0 20 40 60 80 100 1201.8x10-7
1.9x10⁻⁷
2.0x10⁻⁷
2.1x10⁻⁷
2.2x10⁻⁷
2.3x10⁻⁷
2.4x10⁻⁷
2.5x10⁻⁷
H2 p
erm
eanc
e/m
olm
-2Pa
-1s-1
Aging time/hrs
0 20 40 60 80 100 120
PH2O=3.6 X 10³ Pa T=200OC
15%15%
(a)
0 20 40 60 80 1004.5x10-7
4.8x10⁻⁷
5.1x10⁻⁷
5.4x10⁻⁷
5.7x10⁻⁷
6.0x10⁻⁷
6.3x10⁻⁷
H2 p
erm
eanc
e/m
olm
-2s-1
Pa-1
Aging time/hrs
0 20 40 60 80 100
PH2O=3.6 X 10³ Pa T=200OC
0 20 40 60 80 1004.5x10-7
4.8x10⁻⁷
5.1x10⁻⁷
5.4x10⁻⁷
5.7x10⁻⁷
6.0x10⁻⁷
6.3x10⁻⁷
H2 p
erm
eanc
e/m
olm
-2s-1
Pa-1
Aging time/hrs
0 20 40 60 80 100
PH2O=3.6 X 10³ Pa T=200OC
0 20 40 60 80 1004.5x10-7
4.8x10⁻⁷
5.1x10⁻⁷
5.4x10⁻⁷
5.7x10⁻⁷
6.0x10⁻⁷
6.3x10⁻⁷
H2 p
erm
eanc
e/m
olm
-2s-1
Pa-1
Aging time/hrs
0 20 40 60 80 100
PH2O=3.6 X 10³ Pa T=200OC
6%6%
(b)
Fig. 1.4 H2 permeance during the water vapor exposure
(a) Pure Silica (400) membrane (b) Methyl modified Silica (400) membrane
The number in the bracket is the calcining temperature in [ºC].

Chapter 1 Theory
15
1.4 Gas sorption
1.4.1 Introduction
When gas molecules meet a solid surface, it is adsorbed onto the solid surface, (the gas
and solid are called adsorbate and adsorbent, respectively) in the process called adsorption,
while the reverse process is called desorption.
Based on the interaction of adsorbate and adsorbent, adsorption can be divided into
following types:
(1) Physisorption.
Physical adsorption is caused mainly by Van der Waals force and
electrostatic force between adsorbate molecules and adsorbent surface. As an
important parameter for physisorption, surface polarity governs the affinity of
adsorbent and adsorbate. Polar adsorbents are thus called “hydrophilic” (e.g.
zeolites, porous silica and alumina), while nonpolar adsorbents are generally
“hydrophobic” (e.g. carbon, polymer). The heat of physisorption is low (less
negative than –25kJ/mol).
(2) Chemisorption
During chemisorption, the adsorbate molecules react with the adsorbent
surface by forming chemical bonds. Generally, the heat of chemisorption is larger
than that of physisorption, more negative than –40 kJ/mol.
Based on the number of layers of the adsorbed molecules, adsorption can be divided into:
(1) Monolayer adsorption
There is only one layer of adsorbate molecules that is formed on the
adsorbent surface. A typical example is chemisorption.
(2) Multilayer adsorption
More than one adsorbate layer are formed due to the interaction of adsorbates
or adsorbates/adsorbents.

Chapter 1 Theory
16
1.4.2 Adsorption isotherm An adsorption isotherm for a single gaseous adsorbate on a solid is the function that
relates the amount of adsorbate adsorbed at the equilibrium to the pressure (or concentration)
of the adsorbate in the gas phase at a constant temperature.
The IUPAC classification of adsorption isotherms is illustrated in Fig. 1.5 [32]
Six types of isotherm are the characteristic of adsorbents that are microporous (type I),
nonporous or macroporous (types II, III, and VI) or mesoporous (types IV and V). The
differences between types II and III isotherms and between types IV and V isotherms arise
from the relative strengths of the adsorbate-adsorbent and adsorbate-adsorbate attractive
interactions: types II and IV are associated with stronger adsorbate-adsorbent interactions and
types III and V are associated with weaker adsorbate-adsorbent interactions. The hysteresis
loops usually exhibited by types IV and V isotherms are associated with the capillary
condensation in the mesopores. Type VI isotherm represents adsorption on nonporous or
macroporous solids where stepwise multilayer adsorption occurs.
Fig. 1.5 IUPAC classification of adsorption isotherms [32].

Chapter 1 Theory
17
1.4.3 Langmuir isotherm
The extent to which adsorption has taken place on the adsorbent surface is indicated by
the coverage θ :
sat
a
nn
=θ (1.4.1)
Where an is the number of occupied adsorption sites and satn is the number of total
adsorption sites.
The ratio of partial vapor pressure of the adsorptive (p) and adsorptive vapor pressure at
which the adsorbent is saturated (psat) is indicated by relative pressure pr:
sat
r ppp = (1.4.2)
Langmuir adsorption is based on the following assumptions:
(1) All adsorption sites are energetically equivalent
(2) Each adsorption site can only host one adsorbate particle (1-to-1 adsorption)
(3) No interaction between adsorbates exists
(4) Coverage is independent on binding energy
(5) Maximum monolayer coverage is 1 (θ = 1)
The rate of adsorption (the change in surface coverage) is proportional to the partial vapor
pressure p of the adsorbate and the amount of free adsorption sites (1-θ). This leads to the
following expression by assuming first order kinetics:
)1( θθ−== pk
dtdr aa (1.4.3)
Where ar is the adsorption rate, ak is the adsorption rate constant.
The desorption rate is
θθdd k
dtdr == (1.4.4)
Where dr is the desorption rate, dk is the desorption rate constant.
Then the equilibration of adsorption rate and desorption rate gives the equilibrium
relations:
)1/( KpKp +=θ (1.4.5)
)1
(1θ
θ−
=K
p (1.4.6)

Chapter 1 Theory
18
The above relations are given by Langmuir (1918) and are called the Langmuir isotherm.
da kkK /= is called adsorption equilibrium constant.
When the number of occupied adsorption sites, an , is far smaller than the adsorption
capacity of the adsorbent, satn , i.e. Kp <<1, and Langmuir isotherm is reduced to the Henry
type equation
Kp=θ (1.4.7)
Further, when Kp >>1, adsorption sites are saturated, and θ =1.
Langmuir adsorption isotherm and the Henry regime are showed in Fig. 1.6.
The Langmuir equation is modified when the interaction between adsorbing molecules is
taken into account [33]:
)/2exp()1
(1 kTK
p µθθ
θ−
= (1.4.8)
Where µ2 represents a pair interaction energy and k is the Boltsmann constant.
Fig. 1.6 Langmuir adsorption isotherm and Henry law

Chapter 1 Theory
19
1.4.4 Adsorption of water vapor on the unsupported porous silica materials
Gas sorption is largely dependent on the properties of the gas and the surface itself. H2O
molecules are polar and tend to be absorbed on the polar surfaces. The properties of silica
surface depend greatly on the preparation approaches, especially on the thermal process.
1.4.4.1 Active groups on the surface of silica materials
The surface properties of silica have been widely investigated in the last decades because
of the widespread use of porous silica materials as an adsorbent, catalyst support, constituent
of chromatographic columns and functional membrane for separation etc.
The main active groups for H2O adsorption are unsaturated Si atoms, hydroxyl and
siloxane groups. Generally, each silicon atom on the surface of amorphous silica tends to
maintain tetrahedral coordination with
oxygen atoms by being covalently bonded
to an outwardly disposed hydroxyl group
[34], and thus the coordination number of Si
is 4. For unsaturated Si atoms, the
coordination number is less than 4 because
some Si-O bonds are missed or broken.
Some authors [35-36] consider them as
primary adsorption sites, although their
concentration is apparently small, and their
concentration is hard to measure.
Computational modeling of water
adsorption on silica and silicate glass
fracture surfaces also suggests that the
strongest adsorption is associated with such
unsaturated Si atoms [37].
In terms of the concentration, hydroxyl
and siloxane groups are dominating; their
structures are shown in Fig. 1.7 [38].
Hydroxyl groups can be subdivided into
free (isolated), bridged (hydrogen-bonded)
and geminal OH. The type of OH groups
can be distinguished by many
Fig. 1.7 Various types of hydroxyl groups on the
surface of silica: (a) free (isolated) OH, (b)
bridged (hydrogen-bonded) OH, (c) geminal OH
and (d) siloxane group [38].

Chapter 1 Theory
20
characterization techniques (e.g. FTIR, H-NMR and weight loss measurement etc), due to the
difference of bond vibration frequency and the bond strength. Generally, physisorbed water
can be removed at ~200°C [39]. Above this temperature, hydroxyl groups start to condense
and evolve water by the interaction of adjacent pairs, and it is assumed that this reaction
happens randomly. About 75% of total OH groups are removed this way [34]. Above 600°C,
only free OH groups exist on the silica surface [38], and they are hard to remove due to the
large distance of isolated OH, but their removal can happen by diffusion and condensation at
increased temperatures. There are still a small amount of OH groups present even above
1000°C (Fig. 1.8).
Heating silica gel decreases the number of hydroxyl groups and increases the number of
siloxane bridges, and therefore the concentration of siloxane groups on the surface calcined
above 600°C should be the highest compared to the number of free hydroxyl groups and
unsaturated Si atoms.
1.4.4.2 Water adsorption on the porous silica materials
As mentioned previously, sorption behavior depends on the nature of adsorption sites and
of adsorbate, e.g. polar molecules (like H2O) prefer hydrophilic surface. Unsaturated Si atoms
and OH groups are hydrophilic, while the hydrophobicity of siloxane largely depends on the
angle between Si-O bonds, where the unstrained siloxane is normally hydrophobic. In fact,
many siloxane bridges are strained in porous materials, and thus siloxane groups are not
Fig. 1.8 Number of the surface hydroxyl groups and the surface siloxane bridges
produced by condensation of OH groups, as a function of preheating temperature [40].

Chapter 1 Theory
21
absolutely hydrophobic. The property of silica surface is changed from hydrophilic to
hydrophobic as the preheating temperature is increased. In principle, dissociative adsorption
of water vapor, i.e. chemisorption, occurs by breaking the siloxane bridge, called rehydration,
yielding two adjacent OH groups.
=Si-O-Si= + H2O 2 =Si-OH
The removal of adjacent OH groups is partly or fully reversible if calcined below 400°C
[39,40], while the stability of siloxane increases with the increasing preheating temperature,
with weak interaction on fully dehydrated silica above 600°C [41], even if heated up to 115°C
in the saturated water vapor for 24 hours [39].
The strong adsorption of H2O molecules on the unsaturated Si atoms is due to the strong
interaction (maybe electrostatic force or weak chemical bond), and leads to a high enthalpy of
interaction. Secondly, H2O molecules are absorbed on the free OH sites via one hydrogen
bond, with a 50-90 kJ/mol enthalpy. Furthermore, the adsorption of H2O molecules on the
unstrained siloxane groups (hydrophobic) and strained siloxane groups (weakly hydrophilic)
is possible through the Van de Waals force, which is significant in very small pores due to the
micropore confinement and the large silica surface. The enthalpy of interaction between H2O
and siloxanes is less than the latent enthalpy of liquefaction of water vapor (44 kJ/mol) due to
the hydrophobicity of siloxane [41]. Since H2O molecules are highly polar, multilayer
adsorption is possible [42]. Consequently, capillary condensation of water occurs in the
mesopores. A. Burneau et al [39] found that the first hydration layer on the porous silica was
non-uniform and involved essentially unconnected water molecules. The extent of water
vapor adsorption in this layer corresponds roughly to the number of hydroxyl groups.
However, H2O molecules start clustering before their bonding to hydroxyls was complete.
This is especially obvious on thermally preheated samples, due to the strong affinity of
isolated hydroxyl groups & H2O molecules and H2O & H2O molecules.
Water vapor sorption in the mesoporous silica materials has been studied in detail [43-47]:
types IV and V isotherms with large hysteresis are typical, with an obvious increase of the
amount of absorbed H2O in the high pressure range due to the capillary condensation based
on Kelvin Equation. Type IV corresponds to the hydrophilic silica surface while type V is the
characteristic of hydrophobic one.

Chapter 1 Theory
22
With the decrease of pore size in the microporous silica materials, the hysteresis and
increase of amount adsorbed in the high-pressure range vanish [47], and the isotherm is of
Type I [45,48], as shown in Fig. 1.9. There is a dramatic increase in the amount adsorbed in
the low-pressure range caused by the micropore confinement and strong interaction between
adsorbate and adsorbent. Generally it is assumed that the isotherm of water vapor in the
micropore materials complies with Langmuir Type adsorption [49].
Fig. 1.9 Isotherms of water vapor on Zeolite 4A at four temperatures (0-101˚C) [48].

Chapter 1 Theory
23
1.5 Sorption measurements in the thin layer by the ellipsometry
1.5.1 The principle of ellipsometry
In this section some relevant theoretical aspects are first introduced before describing
ellipsometry in more details (if not mentioned, Section 1.5.1 is based on the reference [50]).
An electromagnetic wave
Briefly, an electromagnetic wave is a transverse wave consisting of an electric field vector
and a magnetic field vector, both of whose magnitude are a function of position and time. The
electric vector and the magnetic vector are mutually perpendicular and both perpendicular to
the direction of propagation. The two aspects are not independent, and the electric field vector
completely determines the magnetic field vector. If only the electric field vibration is
considered, the light wave can be expressed as
))(2sin(AA 0 ζλπ
+−− vtx= (1.5.1)
Where A is the wave as a function of time and place, AO is the amplitude, λ is the
wavelength, x is the distance, v is the velocity of the light, t is the time and ζ is an arbitrary
phase angle.
If the time is fixed, the electromagnetic wave can be represented schematically in Fig.
1.10.
Fig. 1.10 An electromagnetic wave at a fixed time

Chapter 1 Theory
24
Interaction of light with materials
To describe the interaction of light with materials, a parameter, the complex index of
refraction ~N , is used, which includes a real part and an imaginary part, given as
jkn −=~N (1.5.2)
Where n and k is called the index of refraction and extinction coefficient, respectively; j is
the imaginary number (the square root of –1). For a dielectric material (e.g. glass, silica), no
light is absorbed and hence k=0.
When a light beam passes from one medium into another medium, some of the light is
reflected back while some of the light passes through the surface and changes the direction
where the two phenomenon are called reflection and refraction, respectively (Fig. 1.11).
According to the law of reflection, the angle of incidence ( iφ ) is equal to the angle of
reflection ( rφ ), i.e.
ri φφ= (1.5.3)
The law of refraction is called “Snell’s law” after its discoverer, and is given by
2
~
21
~
1 sinNsinN φφ = (1.5.4)
Polarized light
Most light sources emit non-polarized light that has electric field components oriented in
all possible directions perpendicular to the direction of travel, while the polarized light, i.e.,
Fig. 1.11 The optical phenomenon of reflection and refraction
Chapter 1 Theory
25
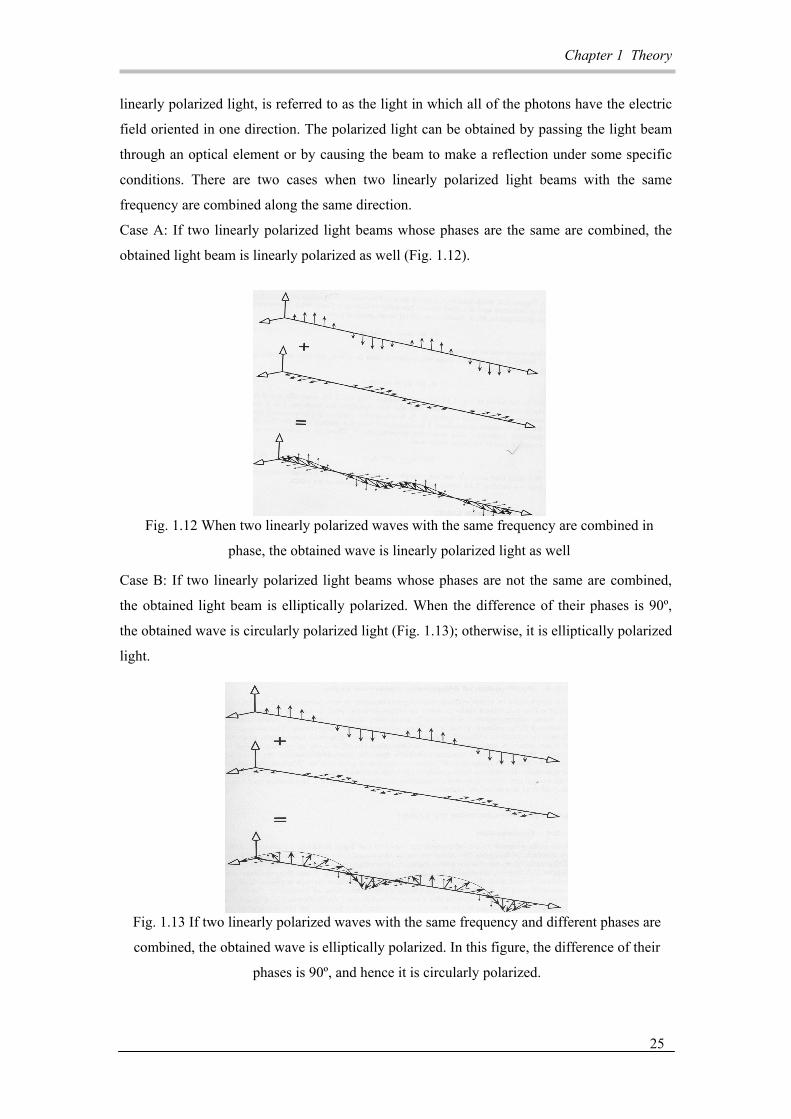
linearly polarized light, is referred to as the light in which all of the photons have the electric
field oriented in one direction. The polarized light can be obtained by passing the light beam
through an optical element or by causing the beam to make a reflection under some specific
conditions. There are two cases when two linearly polarized light beams with the same
frequency are combined along the same direction.
Case A: If two linearly polarized light beams whose phases are the same are combined, the
obtained light beam is linearly polarized as well (Fig. 1.12).
Case B: If two linearly polarized light beams whose phases are not the same are combined,
the obtained light beam is elliptically polarized. When the difference of their phases is 90º,
the obtained wave is circularly polarized light (Fig. 1.13); otherwise, it is elliptically polarized
light.
Fig. 1.12 When two linearly polarized waves with the same frequency are combined in
phase, the obtained wave is linearly polarized light as well
Fig. 1.13 If two linearly polarized waves with the same frequency and different phases are
combined, the obtained wave is elliptically polarized. In this figure, the difference of their
phases is 90º, and hence it is circularly polarized.

Chapter 1 Theory
26
Reflection
To describe the reflection, the plane of incidence is defined as the plane that includes the
light beam prior to and after the reflection, and the normal to the surface is also contained in
the plane of incidence as well. Furthermore, the polarized waves that are in the plane of
incidence are called p-polarized light, and the polarized waves that are perpendicular to the
plane of incidence are called s-polarized light (Fig. 1.14).
To describe the reflection at an interface between two mediums (Fig. 1.6), the Fresnel
reflection coefficient r is introduced, which is the ratio of the amplitude of the reflected wave
to the amplitude of the incident wave for a single interface, given by
2
~
11
~
2
2
~
11
~
2p12
cosNcosN
cosNcosNrφφ
φφ
+
-=
2
~
21
~
1
2
~
21
~
1s12
cosNcosN
cosNcosNrφφ
φφ
+
-= (1.5.5)
Where the subscript “12” denotes that this Fresnel reflection coefficient is for the interface
between mediums 1 and medium 2.
The reflectance ℜ is defined as the ratio of the reflected intensity to the incident intensity.
The expression for a single interface is given below: 2pp r=ℜ and
2ss r=ℜ (1.5.6)
For multiple interfaces (Fig. 1.15), the Fresnel reflection coefficient is modified, resulting
in the total reflection coefficient R, shown below:
)2j(exprr1)2j(exprrR p
23p
12
p23
p12p
ββ
--+=
+ and
)2j(exprr1)2j(exprrR s
23s
12
s23
s12s
ββ
--+=
+ (1.5.7)
β is the film phase thickness and is given by
22
~cosNd(2 φ
λπβ )= (1.5.8)
Where d is the film thickness of interest.
Fig. 1.14 Reflection of a light beam from a surface

Chapter 1 Theory
27
Theoretical basis of ellipsometry
Referring to Fig. 1.14, the parameter ∆ (delta) is defined as the difference of the phase
difference 1δ between the p-wave and s-wave of incidence and the phase difference 2δ
between the p-wave and s-wave of reflection.
21 δδ -=∆ (1.5.9)
Without regard to phase, the amplitude of both p-wave and s-wave may change due to
reflection. pR and sR are defined as the ratio of the amplitude of the corresponding
reflected wave to that of incident wave.
Another parameter for ellipsometry, the quantity ψ, is defined as the angle whose tangent
is the ratio of the magnitude of the total reflection coefficients.
s
p
R
Rtan =ψ (1.5.10)
The last parameter for ellipsometry, the complex quantity ρ is defined to be the complex
ratio of the total reflection coefficients.
s
p
RR=ρ (1.5.11)
Finally, the fundamental equation of ellipsometry is obtained
∆jetanψρ= =s
p
RR (1.5.12)
The quantities ψ and ∆ are precisely measured by ellipsometry, the information about
the sample is contained in the total reflection coefficients, and hence in ρ .
For dielectric materials (e.g. alumina and silica), ∆ (in Eq. 1.5.12) remains close to 180°
or 0°, depending on the angle of incidence.
Fig. 1.15 Reflection of a light beam from multiple interfaces

Chapter 1 Theory
28
1.5.2 Sorption of water vapor on silica layers by ellipsometry
Generally, the traditional techniques for sorption (e.g. gravimetric and volumetric
methods) are convenient for powder samples, but they are not suitable to analyze the actual
porous films, especially since the properties of powder and supported film are generally not
identical. Ellipsometry is a non-destructive optical technique and thus suitable for the
characterization of porous thin films. Recently, ellipsometry is applied to the characterization
of inorganic porous films with low k materials in terms of porosity [51-56], pore size
distribution [51,54,55,57] and sorption [51-55,57-59].
It is known that the optical properties of porous films are changed if the pores absorb gas
molecules or are filled with liquid. The amount of the adsorbate can be calculated if the
optical properties of the materials, which form the porous films, and the adsorbate are known.
There are several methods for performing these calculations based on e.g. Lorentz-Lorentz
equation [52,60]. N. E. Benes et al [52] investigated CO2 adsorption on the porous silica film
by assuming the linear relationship between the number of gas molecules absorbed in the
silica film and the change in the effective dielectric function < eε > of the film, the later
corresponding to the change of tanψ measured by ellipsometer. The maximum adsorption of
CO2 (2.8-3.0 mmol/g) was found, which was in fair agreement with the value of ~2.7 mmol/g
by gravimetric high-pressure sorption setup.
Adsorption of water vapor in the different porous films has been studied by ellipsometry
[58,61-63]. Ellipsometer measures the optical properties of materials with high accuracy and
precision, making this technique useful for studying water sorption on the silica film. The
water vapor isotherms obtained by ellipsometry and consequent calculated pore size
distributions in the mesoporous and microporous films are consistent with traditional
techniques (e.g. N2-sorption by powder samples and SEM by the real film) [62,63]. Since
silica is transparent, i.e. k=0, cos ∆ can be +1 if a proper incidence angle is used. As a result,
only tanψ is changed by water vapor sorption. It has also been deduced theoretically that tanψ
is proportional to the amount of adsorbed H2O molecules by A. A. Herrero (Fig. 1.16) [62],
and this basic relation makes possible to relate optical parameter tanψ to the coverage θ.

Chapter 1 Theory
29
Fig. 1.16 Calculated dependence of tanψ and water volume fraction, assuming that SiO2 volume
fraction is 0.7, pore volume is 0.3. Incident angle is 70.11° and the wavelength is 800 nm [62]
This above relationship was used to develop the adsorption isotherm of water vapor in the
actual silica membrane supported by γ-Al2O3 by S. Kuipers [64]. The studied amorphous
silica membrane has smaller pores (~ 4 Å) than that studied by other authors (larger than 1
nm). Adsorption of water vapor at two temperatures of 31°C and 55°C is well fitted with the
first order Langmuir isotherm, complying with Type I isotherm.
It can be concluded that ellipsometry is a very versatile technique for investigating
surfaces and thin films since it is precise, non-destructive and can provide the thickness and
optical properties of the thin films, including the in situ monitoring of those properties due to
an induced change.

Chapter 2 Sample preparation and experiments
30
Chapter 2
Sample preparation and experiments
2.1 Samples The sol-gel method and procedure for the sample preparation have been described
previously [4,7]. The membranes used in the gas permeation experiments are composed of
two γ-Al2O3 layers and two silica layers to achieve high selectivity for small gas molecules,
like H2 and He. The first γ-Al2O3 layer reduces the roughness of α-Al2O3 support, providing a
smooth surface to coat the second γ-Al2O3 layer. The samples for the ellipsometry
experiments contain single γ-Al2O3 and silica layers, since the additional refraction and
reflection at the interface of two γ-Al2O3 or silica layers make the analysis of optical data
more complex. In this report, we assume the same material properties of once and twice
coated γ-Al2O3 and silica layers, although the pore structure of the top layer may be affected
by the roughness of the underlying layer. Each sample is employed one time in either gas
permeation or ellipsometry experiment, to assure the consistent sample conditions prior to the
water vapor exposure.
2.2 Experimental methods and setups In this assignment, ellipsometry and gas permeation are the two main characterization
techniques used to analyze the specific sorption of water vapor and percolation in the case of
He transport through the silica membranes. H2O and He are used for the gas permeation
experiment, since they have similar kinetic diameter (2.60 and 2.65 Å for He and H2O
molecule, respectively), and both of them can enter the narrow pores in the silica layer
without size exclusion, with the probability of entering the pores being related to the
component concentration The variation in He permeance in presence of water vapor is
measured directly as the water vapor pressure is increased, while ellipsometry is used to study
the adsorption of water vapor.
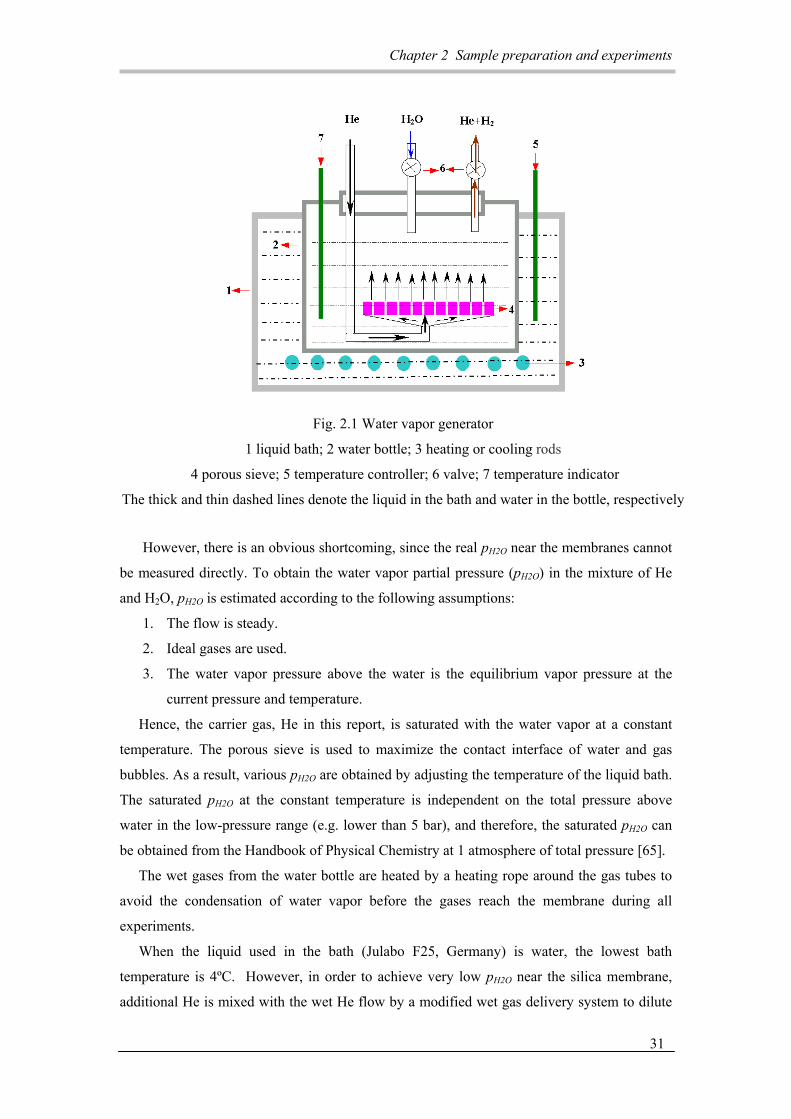
2.2.1 Water vapor generator If the desired concentration of water vapor in the gas mixture is not very high, an easy
way to supply a gaseous mixture with the water vapor is by letting a gas flow through the
water at a constant temperature (Fig. 2.1). There is some water vapor in the gas above the
water surface, and the water vapor is carried by the He flow to the sample cell. Water vapor
generator is used in the experiment of both gas permeation and ellipsometry.
Chapter 2 Sample preparation and experiments
31
Fig. 2.1 Water vapor generator
1 liquid bath; 2 water bottle; 3 heating or cooling rods
4 porous sieve; 5 temperature controller; 6 valve; 7 temperature indicator
The thick and thin dashed lines denote the liquid in the bath and water in the bottle, respectively
However, there is an obvious shortcoming, since the real pH2O near the membranes cannot
be measured directly. To obtain the water vapor partial pressure (pH2O) in the mixture of He
and H2O, pH2O is estimated according to the following assumptions:
1. The flow is steady.
2. Ideal gases are used.
3. The water vapor pressure above the water is the equilibrium vapor pressure at the
current pressure and temperature.
Hence, the carrier gas, He in this report, is saturated with the water vapor at a constant
temperature. The porous sieve is used to maximize the contact interface of water and gas
bubbles. As a result, various pH2O are obtained by adjusting the temperature of the liquid bath.
The saturated pH2O at the constant temperature is independent on the total pressure above
water in the low-pressure range (e.g. lower than 5 bar), and therefore, the saturated pH2O can
be obtained from the Handbook of Physical Chemistry at 1 atmosphere of total pressure [65].
The wet gases from the water bottle are heated by a heating rope around the gas tubes to
avoid the condensation of water vapor before the gases reach the membrane during all
experiments.
When the liquid used in the bath (Julabo F25, Germany) is water, the lowest bath
temperature is 4ºC. However, in order to achieve very low pH2O near the silica membrane,
additional He is mixed with the wet He flow by a modified wet gas delivery system to dilute

Chapter 2 Sample preparation and experiments
32
the concentration of water vapor (Fig. 2.2). The flow of gas is controlled by the calibrated
Mass Flow Controllers (MFC).
2.2.2 Gas permeation Setup
The setup for gas permeation is showed schematically in Fig 2.3. The studied membrane is
placed in a steel cell and sealed with rubber rings, and the He permeance at dry and water
vapor atmospheres is measured by regulating the adjustable valve to be shut down completely
or properly opened, respectively. The valve is operated in such way to keep a certain pressure
difference between the feed gas and permeate side. The flow of permeate gas is measured by
a soap flowmeter after the gas is dried by silica gel with moisture indicator in a long U-shape
tube.
Fig. 2.3 Homemade gas permeation setup
MFC: mass flow controller; PC: pressure controller; PM: pressure meter
Fig. 2.2 Normal (A) and modified (B) wet gas delivery systems

Chapter 2 Sample preparation and experiments
33
Permeation measurement
Prior to the measurements, it is essential to remove the physisorbed water molecules from
the silica layer by a process called outgassing that takes place at 200ºC [34,38] for about 24
hours under a He flow and a high pressure difference (~3 bars), until the He flux is stable. The
samples with high permselectivity (α(He/CH4)>100 at 200ºC) are adopted, i.e. the
membranes are considered to be crack-free.
The He flux (FHe) is obtained by normalizing the flow (N) of dry He at the permeate side
with the membrane area (S) and pressure difference (∆P) between the feed and permeate side.
∆P is measured by PM in Fig 2.3, assuming no pressure loss from PM to the membrane. ∆P is
kept at about 3.0 bar, rendering pH2O negligible compared to ∆P.
When FHe is stable at certain water vapor pressure, the flow of water vapor at permeate
side is calculated by the weight increase of silica gel over a long time (e.g 12 hours). The
silica gel is held in a long U-shape glass tube to make sure that all the water vapor is absorbed
from the wet gas mixture at the permeate side. However, this method is not accurate, since the
concentration of water vapor is very low at the permeate side and the increase of weight is
very small. But it can provide a rough estimate of water vapor flow, in order to compare it
with He flow.
He flux through the silica membrane is measured at different temperatures of water
(T(H2O)) while the temperature of membrane (T(mem)) is kept at 50 or 90ºC. Since the
studied silica membrane is considered to be stable in the presence of water vapor below
100ºC, the selected T(mem) ensure a sufficient variation in H2O mobility, compared to the
much higher mobility of inert He gas. T(H2O) is increased gradually, with the highest T(H2O)
being slightly lower than T(mem), and thus avoiding the condensation of water vapor in the
membrane.

Chapter 2 Sample preparation and experiments
34
2.2.3 Ellipsometry
Ellipsometer
The ellipsometry experiments are carried out in the Solid State Physics Group at the
University of Twente, by a homemade ellipsometer (Fig 2.4). The light beam comes from the
source of Xe lamp, and then passes through a filter and a rotating polarizer. Consequently, the
polarized light is reflected by a sample, and then analyzed. Two parameters (tanψ and ∆),
related to the optical properties of the sample, are measured. The studied membrane is placed
in a special cell [64] (Fig 2.5). The cell contains double glass walls, heated up by an external
oil bath, maintaining the temperature. Quartz windows are placed vertically at the end of the
tubes to accommodate the passing light beam. The angle relative to the normal of the sample
Fig. 2.4 Scheme of a homemade ellipsometer
Fig. 2.5 The cell for ellipsometry experiment [64]

Chapter 2 Sample preparation and experiments
35
surface is ~64.5° to keep cos∆ close to +1 [50]. Furthermore, the cell contains a lamp and a
thermocouple behind the sample, the former being an accessory heater to obtain the
temperatures higher than the maximum oil bath temperature (110ºC). The gas delivery system
is similar to that used in gas permeation experiments with the same total He flow (~60
ml/min).
Measurement
After placing the membrane into the cell, ellipsometer is aligned and calibrated to obtain
a good signal. Prior to the measurements, the outgassing is carried out for about 24 hours at
185ºC. The outgassing temperature is slightly lower than that in gas permeation experiment
(200ºC) due to the heater limitation. The brightness of the lamp within the cell disturbs the
signal and causes that the process of outgassing cannot be recorded in situ (Replacing the
lamp with an electric heater was an option to solve this problem). A one-day outgassing is
considered to be sufficient based on the result of gas permeation experiments.
Two scanning modes are applied to characterize the sorption of water vapor in the silica
layer: energy scan and time scan. When the sorption reaches its equilibrium at each water
vapor pressure, the energy scan is performed over the range of energy values from 1.5 to 3 eV,
to obtain optical properties of silica layer and determine a suitable energy value for the time
scan series. For the investigated sorption process, the higher the optical sensitivity at certain E
values, the better the data to calculate the coverage of water vapor on the silica surface. For
example, the energy value, 2.2 eV, where all energy scans overlap, is not suitable for the time
scans, whereas E=2.35 eV is more appropriate (Fig. 2.6).
Time scan is utilized to measure the process of adsorption and desorption in time. With the
time scan mode, a plateau region is obtained from these scans, indicating the equilibrium at a
certain pH2O during adsorption/desorption. Time scan is performed at a single wavelength
estimated by the energy scans.
The same temperatures (i.e. 50 and 90°C) and conditions (e.g. gas flow) as those in gas
permeation experiments are applied during the ellipsometry measurements.

Chapter 2 Sample preparation and experiments
36
Coverage vs tanψ
Since silica is a transparent material, cos∆ remains constant (+1) and tanψ suffices as the
only measured parameter related to the water vapor sorption.
Tanψ has been proved to be linearly proportional to the adsorbate coverage θ [62],
making it possible to relate tanψ and θ. Consequently, tanψ is substituted by θ as follows:
satψψ
ψψθψ tantan
tantan
0
0−−
= (2.1)
Where θψ is the coverage calculated from ellipsometry experiments.
tanψ0 is the value of tanψ without water vapor (i.e. the dry value)
tanψ is the value at a certain pH2O
tanψsat is obtained by extrapolating tanψ value with the first-order Langmuir
isotherm, and is the theoretically maximum value.
Fig. 2.6 Energy scans at different temperatures of water bath (T(H2O))
where the membrane temperature (T(mem)) is 90ºC

Chapter 3 Results
37
Chapter 3 Results 3.1 Gas permeation in the presence of water vapor
Prior to the gas permeation experiment, an outgassing process is carried out at 200ºC with
a dry He flush, He flux becomes stable after approximately 24 hours with a small fluctuation,
shown in Fig. 3.1, indicating that a one-day outgassing is sufficient to remove the physisorbed
H2O molecules in the pores of silica layer.
Fig. 3.2 He flux over time at different T(H2O) and T(mem)= 50 and 90ºC
Where the numbers in the bracket (1/N) denote the ratio of the wet and dry He flow
Fig. 3.1 Time dependence of He flux at 200ºC during the outgassing process

Chapter 3 Results
38
As soon as water vapor is applied to the silica membrane, FHe decreases dramatically at
both T(mem) (i.e. 50 and 90°C) (Fig 3.2). For each T(H2O), FHe becomes stable after a long
time (~one day). The performance of gas permeation indicates that the effect of water vapor
on the gas permeation is significant, even at low T(H2O).
Water vapor partial pressure (pH2O ) around the membrane is assumed to be the saturated
pH2O at corresponding temperature under 1 atmosphere of total pressure. Consequently, Fig
3.3 is obtained by using the value of stable flux at each T(H2O). In the low pH2O range, FHe
decreases quickly, and it progresses slowly in the high pH2O range.
Since the mobility of gas molecules increases with increasing temperature, the initial
value, i.e. FHe values without water vapor (FHe(dry)), is dependant on T(mem). Fig 3.4 is
obtained by normalizing FHe with FHe(dry). The lowest FHe after water vapor adsorption are
only ~2% and ~11% of FHe(dry) for T(mem)= 50 and 90ºC, respectively, implying that this
effect play a more important role at the lower T(mem), which is in accordance with the lower
mobility of the pore-blocking component (H2O).
Fig. 3.3 He permeance (FHe) as a function of pH2O at T(mem)= 50 and 90ºC
Fig. 3.4 The dependence of normalized FHe and pH2O at T(mem)= 50 and 90ºC

Chapter 3 Results
39
Although to a small extent, water vapor is permeating through the membrane due to the
presence of the potential gradient of pressure and concentration from the feed gas side to the
permeate one. The flow of water vapor is two-order of magnitude lower than that of He at the
same conditions, even in the range of high occupancy (Table 3.1), and H2O flow hardly
changes largely with pH2O and θψ.
T(H2O)
(ºC) pH2O (kPa)
∆P (kPa)
Coverage θψ H2O flow (ml/min)
He flow (ml/min)
10.0 1.23 384 0.369 2.93E-02 5.43 25.0 3.17 385 0.588 4.55E-02 4.44 40.0 7.38 384 0.703 8.34E-02 4.19 60.0 19.92 383 0.802 4.09E-02 3.89 75.0 38.54 383 0.858 4.72E-02 3.81 89.0 67.47 383 0.930 4.12E-02 3.58
Table 3.1 Comparison of He and water vapor flows at T(mem)=90ºC
Note: Coverage θψ is calculated from Equation (2.1) with the data from ellipsometry experiments

Chapter 3 Results
40
3.2 Water vapor adsorption in the microporous silica layer
After complete outgassing, the sorption of water vapor is measured in situ by ellipsometry.
The parameter tanψ obtained from the ellipsometer changes with the amount of H2O
molecules absorbed in the silica layer.
A typical series of changes in tanψ
due to the water vapor adsorption in
the silica layer measured by the mode
of time scan are shown in Fig 3.5.
T(H2O) is increased gradually by
controlling the water bath temperature.
For the dry sample and each T(H2O),
energy scans are carried out after a
stable tanψ is obtained, corresponding
to the flat regions of Fig 3.5, yielding
Fig 3.6 and Fig 3.7. The energies used
for time scans are determined by the
energy scan experiment at the dry
condition (see Fig. 2.6).
Fig. 3.5 Time scans for H2O adsorption in the silica layer
at a constant T(mem) and different T(H2O) conditions
Where the numbers in the bracket (1/N) denote the ratio of
the wet and dry He flow
Fig. 3.6 Energy scans for the equilibrium of water vapor adsorption at T(mem)=50ºC

Chapter 3 Results
41
To calculate coverage θ from tanψ, the tanψ values at corresponding T(H2O) are obtained
from the flat region of the time scan series. As mentioned in Chapter 2, tanψsat is derived by
extrapolating tanψ value with the first-order Langmuir isotherm [64]. The detailed values are
listed in Table 3.2 & 3.3.
Fig. 3.7 Energy scans for the equilibrium of water vapor adsorption at T(mem)=90ºC
T(H2O)( ºC) pH2O (kPa) tanψ (-) Coverage θψ Dry 0 0.3006 0
4.0(1/8) 0.10 0.2886 0.179 4.0(1/4) 0.20 0.2836 0.252 4.0(1/2) 0.41 0.2774 0.344
4.0 0.81 0.2667 0.503 10.0 1.23 0.2596 0.607 25.0 3.17 0.2418 0.872 40.0 7.38 0.2374 0.936 49.0 11.74 - 0.959
Table 3.2 Adsorption parameters of water vapor at T(mem)=50ºC, tanψsat=0.2331 and E=2.60 eV
T(H2O)( ºC) pH2O (kPa) tanψ (-) Coverage θψ
Dry 0 0.3244 0 4.0(1/6) 0.14 0.3120 0.240 4.0(1/3) 0.27 0.3101 0.276
4.0 0.81 0.3033 0.409 10.0 1.23 0.3002 0.469 25.0 3.17 0.2869 0.728 40.0 7.38 0.2830 0.802 60.0 19.92 0.2798 0.865 75.0 38.54 0.2758 0.942 89.0 67.47 - 0.965
Table 3.3 Adsorption parameters of water vapor at T(mem)=90ºC, tanψsat=0.2728 and E= 2.40 eV
Note: tanψsat and the italic numbers are derived by the first-order Langmuir isotherm; coverage θψ is
calculated from Equation (2.1).

Chapter 3 Results
42
Based on the above calculation, the isotherms of water vapor adsorption are obtained, as
shown in Fig 3.8. According to the IUPAC classification, they are typical isotherms of gas
adsorption in microporous materials, where the coverage increases dramatically in the low
pH2O range. Larger K value occurs at the lower T(mem), indicating a stronger interaction
between H2O molecules and the silica surface. The isotherms comply with the first-order
Langmuir isotherm, except in the low pH2O range where the real coverage is slightly higher
than the fit curve.
In order to investigate the existence of multilayer adsorption, the adsorption in the high
pH2O range is measured again to include more points during a consequent set of measurements
at T(mem)= 50ºC , as shown in Fig 3.9. The results indicate that the mesopores and large
defects are absent in the studied membrane.
Fig. 3.8 Isotherms of water vapor adsorption at 50 and 90ºC
da kkK /= is the adsorption equilibrium constant, calculated from the first-order
Langmuir isotherm where the pressure is in [kPa]
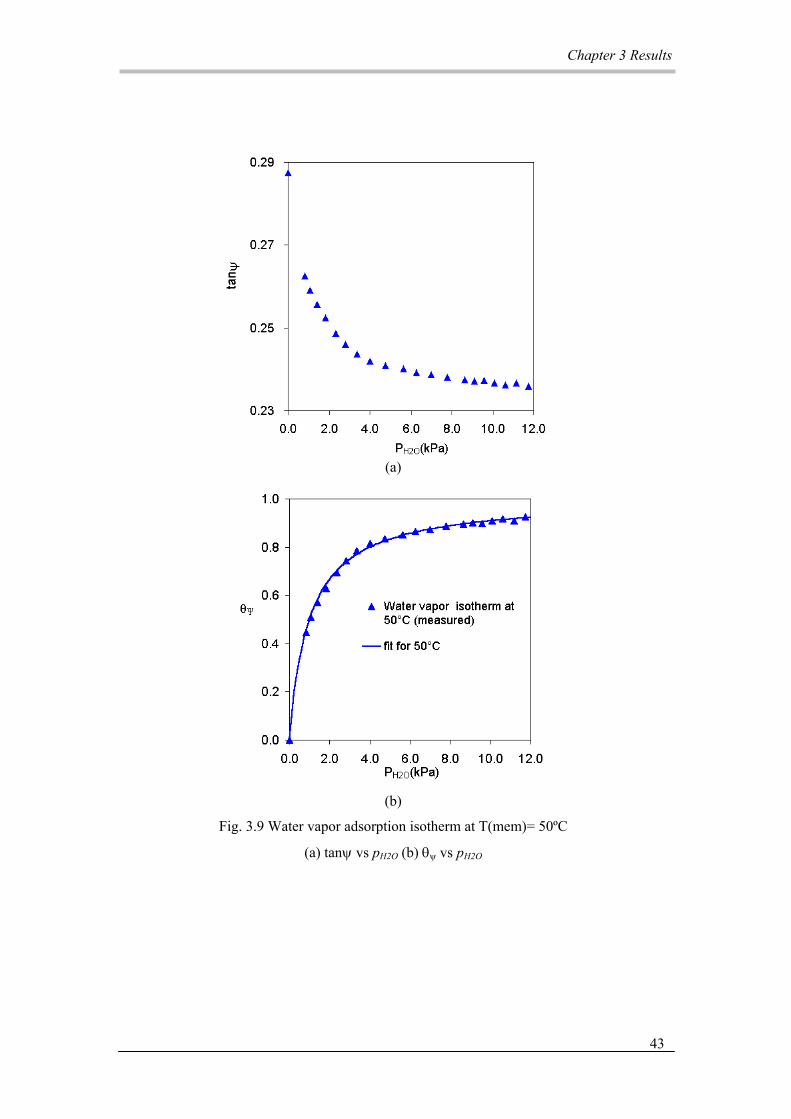
Chapter 3 Results
43
(a)
(b)
Fig. 3.9 Water vapor adsorption isotherm at T(mem)= 50ºC
(a) tanψ vs pH2O (b) θψ vs pH2O

Chapter 4 Discussion
44
Chapter 4 Discussion
4.1 Influence of water vapor on gas permeation
At the studied relatively low T(mem), the influence of water vapor on the gas permeation
through the microporous silica membrane is obvious, even in the low pH2O range. At high pH2O
range, water vapor almost suppresses the movement of He. Similar phenomena have neen
observed in the previous research of silica membrane [7,30], as well as in the system of
zeolites [49,66]. At high temperatures and in water vapor atmosphere, silica membrane could
be viscously sintered or damaged [7]. Since the studied membranes are sintered at 600ºC for 3
hours, viscous sintering and deterioration would not happen at low temperatures below 100ºC,
although some researchers claimed that these would be the case at 110ºC [67]. Rehydration is
also avoided at such low temperatures [39], and thus we believe that the pore size and
microstructure remained unchanged during our experiments.
The gas transport in a multi-component mixture depends largely on the adsorption
capacity of different gas molecules. As a result, the immobile and strongly absorbing
component blocks the movement of the mobile and weakly absorbing one significantly [16-
17]. At the investigated temperatures, polar H2O molecules are relatively immobile compared
to the inert He (Table 3.1), due to the presence of unsaturated Si atoms, hydroxyl groups and
strained siloxane bridges in the silica layer that serve as adsorption sites for H2O molecules.
The lower the temperature, the stronger the interaction between H2O molecules and polar
silica surface, resulting in a stronger blocking effect of H2O molecules on the inert gas
permeation at lower temperature.
Although He flux decreases to a large extent in presence of water vapor, it does not vanish
under the investigated conditions. The reasons may be the following: first, the adsorbed H2O
molecules diffuse along the concentration gradient through the pores, and thus He can
transport along with H2O. However, even at high pH2O, He flow is still much higher than H2O
flow (Table 3.1). Second, even if all active sites are occupied by H2O molecules, perhaps
there are some big pores in the silica membrane, resulting in the suppressed He transport
along the pore surface, but allowing the He transport along the center of these big pores. As a
result, FHe at the highest pH2O are ~2% and ~11% of FHe(dry) for T(mem)= 50 and 90ºC,
respectively.
Chapter 4 Discussion
45
4.2 Water vapor adsorption in the microporous silica layer
The obtained adsorption isotherms of water vapor in the silica layer are the characteristic
in the microporous materials, according to the IUPAC classification, and they generally
comply with the first-order Langmuir isotherm. The results are consistent with the literature
[45, 47-49, 64, 70]. The studied silica layer has an average pore size of ~4 Å, slightly bigger
than the kinetic diameter of the polar H2O molecule (2.65 Å) which has a strong interaction
with the active sites on the adsorbent (silica): unsaturated Si atoms, free hydroxyl groups and
strained siloxane bridges [71]. As a result, at the low pH2O range coverage θ increases
dramatically, which causes a large decrease in He flux in the gas permeation experiment. The
greater the K value, the stronger the interaction of the adsorbates and adsorbents, and hence,
the more molecules are absorbed at lower temperature.
A small deviation of measured points from the ideal Langmuir isotherm may be due to the
heterogeneous adsorption. Basically, the first-order Langmuir isotherm assumes energetically
equivalent adsorption sites. However, polarized H2O molecules can be absorbed on several
types of active sites in the following order of decreasing enthalpies of interaction: unsaturated
Si atoms, free hydroxyls and siloxanes. Although the amount of unsaturated Si atoms is small,
their interaction with H2O molecules is likely to be very strong, and thus these sites are first
occupied [37]; free hydroxyl groups are hydrophilic, interacting with H2O molecules via only
one hydrogen bond and the enthalpy of interaction is below the enthalpy of liquefaction of
water (44 kJ/mol) [41]. Most H2O molecules are absorbed on these abundant hydrophilic sites
at the beginning of adsorption, while the siloxane bridges are hydrophobic, except in the case
of the strained ones, and they play a more important role in the smaller pores due to their
large population. The enthalpy of interaction between H2O molecules and silica decreases
with increasing the coverage/pressure. Therefore, the heterogeneous adsorption can be the
reason that the real adsorption isotherm deviates from the ideal first-order Langmuir isotherm,
with significant deviations in the low pressure range because the stronger interaction makes
the real coverage higher than the prediction from the ideal first-order Langmuir.
The absence of multilayer adsorption indicates that all the pores are in the range of
micropores and that the studied membranes are crack-free.

Chapter 4 Discussion
46
4.3 Percolation effect
Distinct decrease of the mobile component (He) permeance with increasing coverage of
the immobile component (H2O) (Fig. 4.1) at investigated temperatures is indicative of the
percolation behavior, which is more pronounced at lower temperature, where the mobility of
molecules is lower.
The basic assumptions from Section 1.2.2.2, implying incontinuous movement of the gas
molecules in the narrow pores are appropriate in case of the ideal lattice representation of the
microporous material, and consequently, it is suitable only for the qualitative analysis of the
transport phenomena considered in this study, since the real pore network in the silica layer is
more complex. Optionally, a narrow pore can be imagined as a rolled 2-D lattice (Fig. 4.2),
(a)
(b)
Fig. 4.1 The dependence of He permeance on the coverage θ of water vapor
at T(mem)= 50 and 90ºC
(a) real He flux (b) normalized He flux
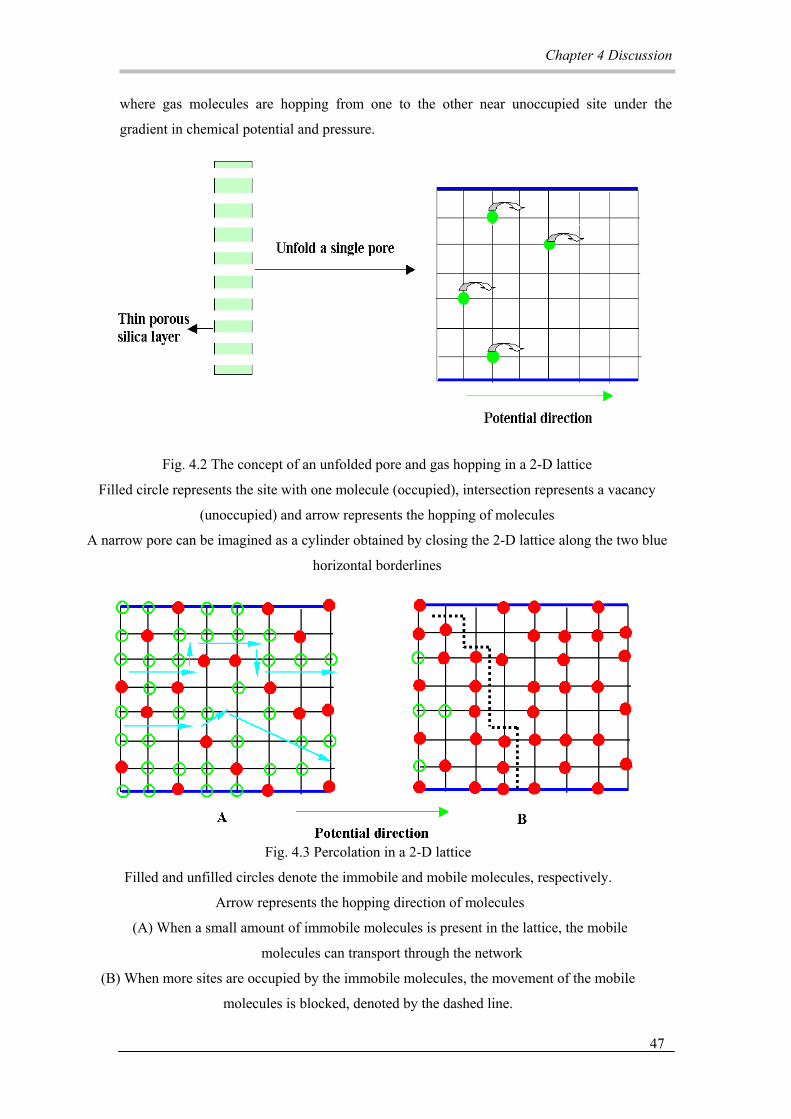
Chapter 4 Discussion
47
where gas molecules are hopping from one to the other near unoccupied site under the
gradient in chemical potential and pressure.
Fig. 4.2 The concept of an unfolded pore and gas hopping in a 2-D lattice
Filled circle represents the site with one molecule (occupied), intersection represents a vacancy
(unoccupied) and arrow represents the hopping of molecules
A narrow pore can be imagined as a cylinder obtained by closing the 2-D lattice along the two blue
horizontal borderlines
Fig. 4.3 Percolation in a 2-D lattice
Filled and unfilled circles denote the immobile and mobile molecules, respectively.
Arrow represents the hopping direction of molecules
(A) When a small amount of immobile molecules is present in the lattice, the mobile
molecules can transport through the network
(B) When more sites are occupied by the immobile molecules, the movement of the mobile
molecules is blocked, denoted by the dashed line.

Chapter 4 Discussion
48
In case of a binary mixture of components greatly differing in mobility that diffuse
through a porous medium, percolation can happen when a connected cluster of immobile
molecules extends from one side of the lattice to the other. When the coverage of immobile
molecules is beyond the percolation threshold, the mobile molecules can hardly move through
the lattice, even under a large potential gradient (Fig. 4.3).
In such a lattice, the coordination number of an active site, indicating the degree of
freedom (here referred to as site connectivity), may be higher than that in the 2-D lattice,
since the molecules can also jump to the sites on the opposite wall of the narrow pore, rather
than only be confined in the lattice plane. The high percolation threshold observed in Fig. 4.1
also implies that the investigated silica pore is more complex (irregular, heterogeneous, with
the molecules hopping in the lattice at different frequencies) than the ideal 2-D lattice model.
Therefore, the irregular lattice, heterogeneous sites and gas molecules hopping to the sites on
the opposite wall of narrow pores may cause the percolation to happen at the high coverage of
immobile H2O.
In principle, He flux should vanish when the percolation occurs. Certain low He flux at
high H2O coverage may be caused by the presence of larger pores in which the basic
assumptions (Section 1.2.2.2) are not valid, since He molecules can be transported along the
pore center, rather than by hopping over the lattice sites. On the other hand, H2O molecules
may also permeate slowly through the membrane due to the chemical potential gradient and
He can move along with them. But the contribution from the movement of H2O is less than
that from the big pores, since H2O flow is much lower than He flow even at high temperature
(Table 3.1).
However, regardless of the chosen lattice model for the silica material, the presence of
percolation behavior should be taken into account when using standard mass transport
descriptions in the field of membrane separation, e.g. Maxwell-Stefan theory, which does not
incorporate the percolation phenomena, since it only predicts a linear relationship of coverage
of the immobile component and diffusivity of the mobile component. The relevance of this
percolation behavior for the validity of MS theory was shown by Benes et al [13] (see Fig 1.3
in this report) by Monte Carlo simulations, and is experimentally qualitatively observed in
this study.

Chapter 5 Conclusions
49
Chapter 5 Conclusions
Based on the detailed discussion, some concise conclusions are given:
• He flux through the silica membrane decreases dramatically in the presence of water
vapor, even in the low pH2O range due to the effect of blocking by the strongly
absorbed H2O molecules.
• Ellipsometry is a sensitive and nondestructive characterization technique and thus
suitable to study the sorption phenomenon in situ in the actual membrane layers,
where other convenient methods (e.g. gravimetric and volumetric methods) fail.
• The isotherms of water vapor adsorption in the silica layer obtained from ellipsometry
are of Type I according to the IUPAC classification, complying with the typical
adsorption behavior in the microporous materials. These results are in accordance with
the average pore size of the studied silica membrane (~4 Å). The adsorption isotherms
generally comply with the first-order Langmuir isotherm, with a slight deviation
probably caused by the heterogeneous adsorption of H2O molecules at different active
sites on the silica surface.
• The transport of gas molecules through such small silica pores can be envisioned by
assuming that the gas molecules are hopping from one occupied sites to the other
unoccupied ones under the potential gradient.
• Because of the strong interaction with silica surface, H2O is immobile compared to the
inert He. For the increased coverage of water vapor, He permeance is affected by the
percolation phenomena. The irregular lattice, heterogeneous sites and gas molecules
hopping to the sites on the opposite wall of narrow pores may cause the transition in
normalized He flux to happen at the high coverage of immobile H2O. He flux does not
vanish even at the highest coverage of immobile H2O molecules likely due to the
presence of big pores in the silica layer.
• The presence of percolation behavior should be taken into account when using
standard mass transport descriptions in the field of membrane separation, e.g.
Maxwell-Stefan theory, which does not incorporate the percolation phenomena, since
it only predicts a linear relationship of coverage of the immobile component and
diffusivity of the mobile component.
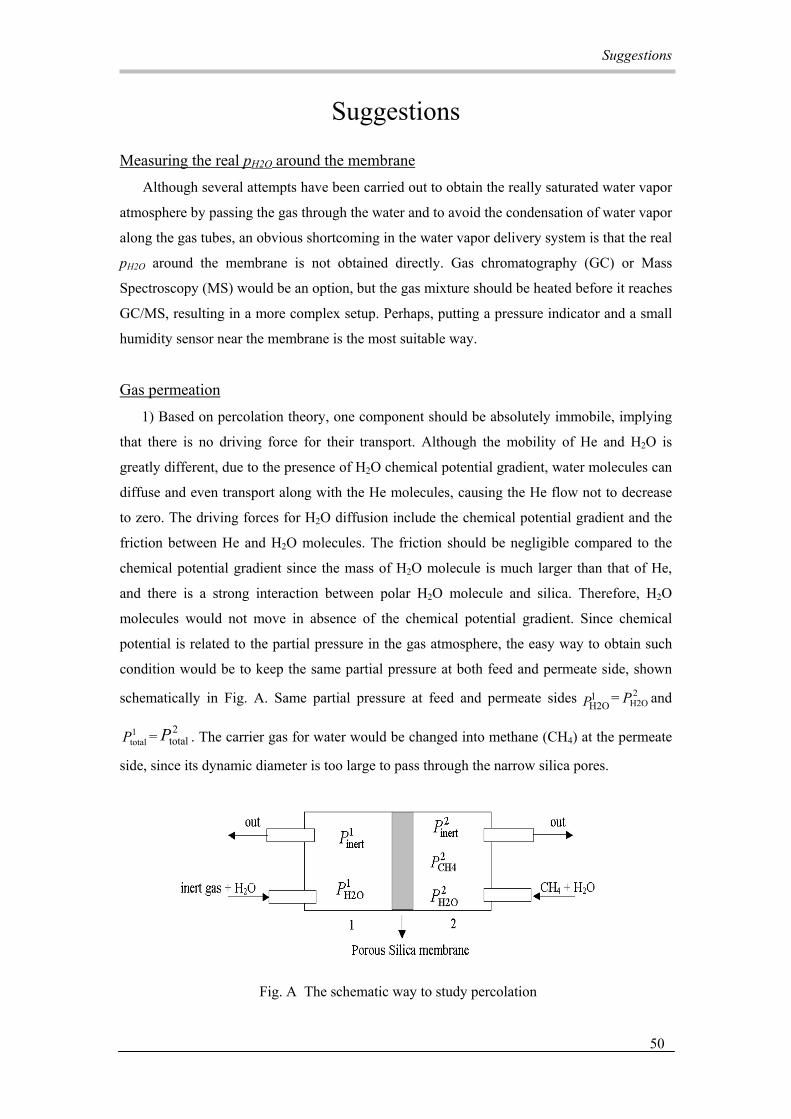
Suggestions
50
Suggestions
Measuring the real pH2O around the membrane
Although several attempts have been carried out to obtain the really saturated water vapor
atmosphere by passing the gas through the water and to avoid the condensation of water vapor
along the gas tubes, an obvious shortcoming in the water vapor delivery system is that the real
pH2O around the membrane is not obtained directly. Gas chromatography (GC) or Mass
Spectroscopy (MS) would be an option, but the gas mixture should be heated before it reaches
GC/MS, resulting in a more complex setup. Perhaps, putting a pressure indicator and a small
humidity sensor near the membrane is the most suitable way.
Gas permeation
1) Based on percolation theory, one component should be absolutely immobile, implying
that there is no driving force for their transport. Although the mobility of He and H2O is
greatly different, due to the presence of H2O chemical potential gradient, water molecules can
diffuse and even transport along with the He molecules, causing the He flow not to decrease
to zero. The driving forces for H2O diffusion include the chemical potential gradient and the
friction between He and H2O molecules. The friction should be negligible compared to the
chemical potential gradient since the mass of H2O molecule is much larger than that of He,
and there is a strong interaction between polar H2O molecule and silica. Therefore, H2O
molecules would not move in absence of the chemical potential gradient. Since chemical
potential is related to the partial pressure in the gas atmosphere, the easy way to obtain such
condition would be to keep the same partial pressure at both feed and permeate side, shown
schematically in Fig. A. Same partial pressure at feed and permeate sides 1H2OP = 2
H2OP and
1totalP = 2
totalP . The carrier gas for water would be changed into methane (CH4) at the permeate
side, since its dynamic diameter is too large to pass through the narrow silica pores.
Fig. A The schematic way to study percolation

Suggestions
51
Although there would be no total pressure difference at both sides, for the inert gas, i.e. He,
there would still be a concentration gradient present, enabling it to diffuse through the
membrane. In case of the same water vapor pressure at both sides , H2O molecules would not
transport from side 1 to side 2, and thus, the real condition for percolation would be achieved.
Consequently, the permeance of the inert gas at different water vapor pressures could be
recorded under these conditions. To achieve this aim, two water baths and an MS or GC are
necessary. The former would be used to generate water vapor and the later to analyze the
concentration of different components in both sides. In the absence of pressure difference at
the two sides, high temperature is necessary to keep the water vapor from condensing in the
intermediate layer due to the capillary phenomenon, or only low water vapor pressure should
be used.
Possibly, another problem can be the fact that the He permeating from side 1 to side 2
would dilute the concentration of water vapor, so that the adjusting of the water vapor
pressure is necessary by changing the temperature of water bath at the permeate side during
the experiment.
2) In this assignment, some relatively low temperatures are used to achieve a large
difference of mobility between He and H2O molecules and to avoid the rehydration of silica
surface by water vapor. Further decrease in temperature may be beneficial for reducing the
mobility of water molecules even more with regard to the expected shift of the percolation
threshold to the lower coverage values. Since the mobility of H2O increases more quickly
than that of He with increasing temperature, the effect of percolation vanishes if their
mobilities are similar. The behavior should comply with Maxwell-Stefan theory. Therefore,
the equivalent He permeance in presence of H2O at high temperature should be interesting.
3) The membranes with two γ-Al2O3 layers and two silica layers have been selected for
the gas permeation to assure crack-free membrane and high selectivity, but it would be useful
to measure the permeance of the membranes with single γ-Al2O3 and silica layers, which are
consistent with the samples for ellipsometry experiment, although more defects are not
desired for gas permeation.
Adsorption of water vapor
1) In this report, the coverage is calculated from the data of tanψ from the time scan at
constant energy. In the relative way, the amount of H2O absorbed molecules can be calculated
[52], but the necessary data from α-Al2O3 and γ-Al2O3 layers is just planed to be measured.
2) The presence of a shift from high to low energy in the energy scans recorded during the
water vapor adsorption may indicate the possible water vapor adsorption in the γ-Al2O3 layer.
Therefore, it is necessary to measure the adsorption in the γ-Al2O3 layer separately.

Suggestions
52
Desorption of water vapor
1) The desorption of water vapor from the silica layer is currently measured under a dry
He flush, and the whole process is recorded in situ by the ellipsometer. The lower final tanψ
value (tanψfinal) after desorption, compared to the initial value (tanψ value at dry condition),
indicates that the adsorption process is irreversible at the corresponding temperatures (Table
A). For the desorption at 50ºC, θψ decreases from 98.0% to 22.7%, while it decreases much
more from 93.0% to 15.9% at 90ºC. The observed irreversible sorption at corresponding
temperatures is consistent with the results of S. Inagaki et al. for the mesoporous silica
powder [46-47].
2) Water vapor desorption at 50 and 90ºC is shown in Fig B. Considerable number of H2O
molecules remain in the silica layer after desorption at the corresponding temperatures of
adsorption, indicating a very strong interaction of water and silica. However, it is possible to
remove all the physically absorbed H2O molecules by significantly increasing temperature.
The duration and shape of desorption curves at 50 and 90ºC are different because of the
difference in implemented temperatures and dry He flows.
Seemingly H2O molecules desorbs from the silica layer in steps, indicated by the three
steps in the desorption curve at 90ºC (shown in Fig B). Steps could correspond to: a) the
different sorption sites in the silica layer, or b) to the three distinguishably different pore sizes
corresponding to the different layers of the membrane.
a) Different groups on the silica surface calcined at 600ºC can be distinguished: siloxane
groups, free hydroxyl groups and unsaturated Si atoms [38,40]. The heats of adsorption on
these groups increase in the same order [37,41], corresponding with the increased difficulty of
the H2O desorption in the same order. From Fig. B, it seems that H2O molecules desorb from
all sites, in other words, the vibration of H2O molecules at corresponding temperatures can
overcome the energy of interactions between the adsorbates and adsorbents. Thus, H2O
Temperature of desorption (ºC)
tanψbegin(-) tanψfinal (-) tanψdry(-) Coverage θψ(begin)
Coverage θψ(final)
50.0 0.2031 0.2469 0.2644 0.98 0.227 90.0 0.2335 0.2593 0.2640 0.930 0.159
Table A. Desorption parameters measured by ellipsometry at 50 and 90ºC
Note: tanψbegin and coverage θψ(begin) are the values at the beginning of desorption
tanψfinal and coverage θψ(final) are the values at the equilibrium of desorption
tanψdry is the values at the dry condition
coverage θψ is calculated from Equation (2.1)

Suggestions
53
molecules on the different sites should desorb at the same time, but with different desorption
rates. Therefore, there would not be a flat range between the two steps, which is in
contradiction with the results of our experiment. The desorption from the confined narrow
pores should be different from that from a flat surface, and the whole process should include
desorption from the sites of weak interaction and diffusion along the pores. It is possible that
the molecules desorbing from the sites of weak interaction are absorbed on the sites of strong
one. Further study is necessary to relate the steps to the adsorption sites (e.g. by using IR
reflectance spectroscopy that can give both information on type and relative amount of
molecules or bonds).
b) Second, the steps may come from different layers with different pore sizes, which can
be examined by changing the number of layers, to determine if the number of steps
corresponds to the number of layers.
Fig. B Water vapor desorption at 50 and 90ºC

References
54
References [1] N. E. Benes Mass Transport in Thin Supported Silica Membranes PhD Thesis University
of Twente Enschede 2000
[2] H.A. Meinema, R.W.J. Dirrix, H.W. Brinkman, R.A. Terpstra, J. Jekerle, P.H. Kösters
Ceramic Membranes for Gas Separation – Recent Developments and State of the Art
Interceram Vol. 54 (2005) [2] pp. 86-91
[3] J.N. Armor Membrane catalysis: where is it now, what needs to be done? Catalysis
Today 25 (1995) pp. 199-207
[4] Truls Norby, Yngve Larring Mixed hydrogen ion–electronic conductors for hydrogen
permeable membranes Solid State Ionics 136–137 (2000) pp. 139–148
[5] Vos R. M. de and H. Verweij High-Selectivity, High-Flux Silica Membranes for Gas
Separation Science 279 (1998a) pp. 1710-1711
[6] Jun Fan, Haruhiko Ohya, Takeshi Suga etc High flux zirconia composite membrane for
hydrogen separation at elevated temperature Journal of Membrane Science 170 (2000)
pp. 113–125
[7] Renate de Vos High-Selectivity, High-Flux Silica Membranes for Gas Separation:
synthesis, transport and stability Ph.D thesis University of Twente Enschede 1998
[8] B.E. Yolds, Hydrolysis of aluminium alkoxides and bayerite conversion J. Appl. Chem.
Biotechnol. 23 (1973) pp.803-809
[9] E.A. Mason and A.P. Malinauskas Gas Transport in Porous Media: The Dusty-Gas Model
Elsevier, 1983.
[10] R.J.R. Uhlhorn Ceramic membranes for gas separation: synthesis and transport
property PhD thesis, University of Twente (1990)
[11] Leo Jacques Pierre van den Broeke The Maxwell-Stefan theory for micropore diffusion
S.N., 1994.
[12] Dietrich Stauffer and Amnon Aharony Introduction to Percolation Theory (revised
second edition) Taylor & Francis London 1994
[13] Nieck E. Benes, Henny J. Bouwmeester and Henk Verweij Multi-component lattice gas
diffusion Chemical Engineering Science 2002, 57, pp. 2673-2678
[14] D. Keffer, Alon V. McCormick and H. Ted Davis Diffusion and percolation on Zeolite
sorption lattices J.Phys. Chem. 1996, 100 pp. 967-973
[15] A.B.Shelekhin, A.G.Dixon and Y.H. Ma Adsorption, diffusion and permeation of gases
in microporous membranes III :application of percolation theory to interpretation of
porosity, tortuosity, and surface area in microporous glass membrances Journal of
Membrane Science, 83 (1993) pp. 181-198
References
55
[16] Don R. Baker, Gerald Paul, Sameet Sreenivasan and H. Eugene Stanley Continuum
percolation threshold for interpenetrating squares and cubes Physical Review E 66,
046136 (2002)
[17] L. Acedo and A. Santos Diffusion in lattice Lorentz gases with a percolation threshold
Physical Review E Vol.60, No. 2 August 1999 pp.1310-1323
[18] Grzegorz Kondrat and Andrzej Pekalski Percolation and jamming in random sequential
adsorption of linear segments on a square lattice Physical Review E 63, 051108
[19] J Quintanilla, S Torquato and R M Ziff Efficient measurement of the percolation
threshold for fully penetrable discs J. Phys. A: Math. Gen. 33 (2000) pp. 399-407
[20] S. Ismadji and S.K. Bhatia Percolation phenomena in micropore adsorption: influence
on single and multicomponent adsorption equilibria Studies in Surface Science and
Catalysis 144 (2002) Elsevier Science B.V. pp. 123-130
[21] M. E. Kainourgiakis, E.S. Kikkinides, A.K. Stubos and N. K. Kanellopoulos Adsorption-
desorption gas relative permeability through mesoporous media-network modeling and
percolation theory Chemical Engineering Science, Vol. 53, No. 13, 1998, pp. 2353-2364
[22] F. Kapteijn, W.J.W. Bakker, J. van de Graaf, G. Zheng, J. Poppe and J.A. Moulijn
Permeation and separation behavior of a silicalite-1 membrane Catalysis 1995, 25, pp.
213-218
[23] Jolinde M. van de Graaf, F. Kapteijn and J.A. Moulijn Modeling permeation of binary
mixtures through zeolites membranes AIChE Journal 1999, Vol. 45, No. 3, pp. 497-511
[24] R.S.A. de Lang, J.H.A. Hekkink, K. keizer and A.J. Burggraaf, Formation and
characterization of supported microporous ceramic membranes prepared by sol-gel
modification techniques J. Membrane Science 99 (1995) pp. 57-75
[25] C. Guizard, in Foudamentals of inorganic membrane science and technology, Membrane
science and technology series, A. J. Burggraaf and L. Cot, Eds 4 (1996)
[26] Katsuya Teshima, Hiroyuki Sugimura, Yasushi Inoue and Osamu Takai Gas Barrier
Performance of Surface-Modified Silica Films with Grafted rganosilane Molecules
Langmuir 2003, 19, pp. 8331-8334
[27] M.C. Capel-Sanchez, L. Barrio, J.M. Campos-Martin, J.L.G. Fierro Silylation and
surface properties of chemically grafted hydrophobic silica Journal of Colloid and
Interface Science 277 (2004) pp. 146–153
[28] A.Venkateswara Rao and Ravindra R. Kalesh Organic Surface Modification of TEOS
Based Silica Aerogels Synthesized by Co-Precursor and Derivatization Methods Journal
of Sol-Gel Science and Technology 30 (2004) pp.141–147
[29] R. M. Barabash, V. N. Zaitsev, T. V. Kovalchuk, H. Sfihi, and J. Fraissard
Low-Temperature Fluorination of Silica by a Nonaqueous Solution of NH4F J. Phys.
Chem. A (2003) 107 pp. 4497-4505

References
56
[30] Wei Qi, Li Jian-Lin, Chunlin Song , Liu Wei and Chen Chu-Sheng Preparation,
Hydrogen Separation and Hydrothermal Stability of Microporous Silica Membrane
Journal of Inorganic Materials Vol. 19, No.1 (2004) pp.132-139
[31] Wei Qi, Li Jian-Lin, Chunlin Song , Liu Wei and Chen Chu-Sheng Preparation,
characterization and hydrothermal stability of hydrophobic methyl-modified silica
membranes Journal of Inorganic Materials Vol. 19, No.2 Mar (2004) pp. 417-423
[32] Thomas J. Barton, Lucy M. Bull, Walter G. Klemperer, Douglas A. Loy etc
Tailored Porous Materials Chem. Mater. 1999 11 pp. 2633-2656
[33] Motoyuki Suzuki Adsorpion Engineering Elesevier Amsterdam-Oxford-New York-
Tokyo 1990 pp. 37-38
[34] B.W.K. Lowen and E.C. Broge Effect of dehydration and chemisorbed materials on the
surface properties of amorphous silica J. Phys. Chem. 65, (1961) pp. 16-19
[35] A.A. Chuiko Reaction Kinetics Catal. Lett. 50 (1993) 1.
[36] A.A. Chuiko and Yu.I. Gorlov, Silica Surface Chemistry. Surface Structure, Active
Centers, Sorption Mechanisms Naukova Dumka, Kiev, 1990.
[37] Elam A.Leed and Carlo G.Pantano Computer modeling of water adsorption on silica and
silicate glass fracture surfaces Journal of Non-Crystalline Solids 325 (2003) pp. 48-60
[38] Pascal Van Der Voort, Iwan Gillis-D’Hamers, Karl C. Vrancken and Etienne F. Vansant
Effect of porosity on the distribution and reactivity of hydroxyl groups on the surface of
silica gel J. Chem. Soc. Faraday Tran. 1991, 87(24) pp. 3899-3905
[39] A. Burneau, J. Lepage, G. Maurice Porous silica-water interactions. I. Structural and
dimensional changes induced by water adsorption Journal of Non-Crystalline Solids 217
(1997) pp. 1-10
[40] Shuhei Shioji, Masashi Kawaguchi, Yasuhiro Hayashi, Kenjiro Tokami and Hideo
Yamamoto Rehydroxylation of dehydrated silica surfaces by water vapor adsorption
Advanced Powder Technol. Vol. 12 No. 3 (2001) pp. 331-342
[41] Vera Bolis, Bice Fubini, Leonardo Marchese, Gianmario Martra and Doninique Costa
Hydrophilic and hydrophobic sites on dehydrated crystalline and amorphous silicas J.
Chem. Soc. Faraday Trans., 1991, 87(3) pp. 497-505
[42] V.V. Turov and I.F. Mironyuk Adsorption layers of water on the surface of hydrophilic,
hydrophobic and mixed silicas Colloids and Surfaces A: Physicochemical and
Engineering Aspects 134 (1998) pp. 257-263
[43] Tatsuo Ishikawa, Mitsuhiko Matsuda, Akemi Yasukawa etc Surface silanol groups of
mesoporous silica FSM-16 J. Chem. Soc., Faraday Trans., 1996, 92(11) pp. 1985-1989
[44] Puibasset and R. J.-M. pellenq A grand canonical Monte Carlo simulation study of water
adsorption in a Vycor-like disordered mesoporous materials at 300K Studies in Surface
Science and Catalysis, 144, 2002, Elsevier pp. 371-377

References
57
[45] J. Alcaniz-Monge and D. Lozano-Castello Water adsorption on micro and mesoporous
silicas Studies in Surface Science and Catalysis, 144, 2002 Elsevier pp. 291-298
[46] SHINJI INAGAKI YOSHIAKI FUKUSHIMA KAZUO KURODA and KAZUYUKI
KURODA Adsorption Isotherm of Water Vapor and Its Large Hysteresis on Highly
Ordered Mesoporous Silica JOURNAL OF COLLOID AND INTERFACE SCIENCE
180, ( 1996) pp. 623–624
[47] S. Inagaki and Y. Fukushima adsorption of water vapor and hydrophobicity of ordered
mesoporous silica, FSM-16 Microporous and Mesoporous Materials 21 (1998) pp. 667-
672
[48] A. GORBACH, M. STEGMAIER AND G. EIGENBERGER Measurement and
Modeling of Water Vapor Adsorption on Zeolite 4A—Equilibria and Kinetics Adsorption
10, 2004 pp. 29–46
[49] Trevor E. Clark, Harry W. Deckman, Donald M. Cox and Ronald R. Chance In situ
determination of the adsorption characteristics of a zeolite membrane Journal of
Membrane Science 230 (2004) pp. 91–98
[50] Herland G. Tompkins A user’s Guide to Ellipsometry Academic Press, INC San Diego
1993
[51] A.Bourgeois, A.Brunet Bruneau, V.Jousseaume, N.Rochat, S.Fisson, B.Demarets and
J.Rivory Description of the porosity of inhomogeneous porous low-k films using solvent
adsorption studied by spectroscopic ellipsometry in the visible range Thin Solid Films
455 –456 (2004 ) pp. 366 –369
[52] N. E. Benes, G. Spijksma and H. Verweij etc CO2 Sorption of a Thin Silica Layer Determined by Spectroscopic Ellipsometry AIChE Journal 2001 Vol.47 No.5 pp. 1212-1218
[53] C. Wongmanerod, S. Zangooie and H. Arwin Determination of pore size distribution and
surface area of thin porous silicon layers by spectroscopic ellipsometry Applied Surface
Science 172 (2001) pp. 117-125
[54] A. Bourgeois, A. Brunet Bruneau and S. Fisson etc Determination of pore size
distribution in thin organized mesoporous silica films by spectroscopic ellipsometry in the
visible and infrared range Thin Solid Films (2004) 447–448 pp. 46 –50
[55] F. N. Dultsev and M. R. Baklanov Nondestructive Determination of Pore Size
Distribution in Thin Films Deposited on Solid Substrates Electrochemical and Solid-State
Letters, 2 (4) (1999) pp.192-194
[56] E. S. Kooij, H. Wormeester, A. C. Galcac and B. Poelsema Optical Anisotropy and
Porosity of Anodic Aluminum Oxide Characterized by Spectroscopic Ellipsometry
Electrochemical and Solid-State Letters, 6 (11) (2001) B52-B54

References
58
[57] C. NEGORO, N. HATA, K. YAMADA and T. KIKKAWA Nondestructive
Characterization of a Series of Periodic Porous Silica Films by in situ Spectroscopic
Ellipsometry in a Vapor Cell Japanese Journal of Applied Physics Vol.43, No.4 A,
2004, pp.1327 –1329
[58] A. Alvarez-Herrero, A.J. Fort, H. Guerrero and E. Bernabeu Ellipsometric
characterization and influence of relative humidity on TiO2 layers optical properties
Thin Solid Films 349 (1999) pp. 212-219
[59] R. Denoyel Microcalorimetry and ellipsometry in surfactant adsorption studies Colloids
and Surfaces A: Physicochemical and Engineering Aspects 205 (2002) pp. 61–71
[60] M.A. Fardad, E.M. Yearman, E.J.C. Dawnay, Mino Green and F. Horowitz Effects of
H2O on structure of acid-catalysed SiO2 sol-gel films Journal of Non-crystalline Solids
183 (1995) pp. 260-267
[61] A. Alvarez-Herrero, G. Ramos, F. Monte, E. Bernabeu and D. Levy Water adsorption in
porous TiO2–SiO2 sol –gel films analyzed by spectroscopic ellipsometry Thin Solid Films
455–456 (2004 ) pp. 356 –360
[62] A. Alvarez-Herrero, R. L. Heredero, E. Bernabeu and D. Levy Adsorption of water on
porous Vycor glass studied by ellipsometry APPLIED OPTICS 2001 Vol. 40, No. 4
pp. 527-532
[63] Alberto Alvarez-Herrero, Raquel L. Heredero, Eusebio Bernabeu, and David Levy
Analysis of nanostructured porous films by measurement of adsorption isotherms with
optical fiber and ellipsometry APPLIED OPTICS Vol. 41, No. 31 (2002) pp.6692-6701
[64] Sjoerd Kuipers Inorganic membrane layer characterization using ellipsometry Water
sorption study on hydrogen selective silica membranes Master thesis, University of
Twente 2004
[65] Boca Raton etc CRC handbook of chemistry and physics CRC press 1913
[66] R. Krishma, D. Paschek and R. Baur Modeling the occupancy dependence of
diffusivities in zeolites Microporous and Mesoporous Materials 2004 76 pp.233-246
[67] R. Leboda, E. Mendyk, A. Gierak and V.A. Tertykh Hydrothermal modification of silica
gel (xerogel).1.Effect of treatment temperature on their porous structure Colloids and
Surface A: Physicochemical and Engineering Aspects, 1995, 105, pp.181-189
[68] F. Kapteijn, W.J.W. Bakker, J. van de Graaf, G. Zheng, J. Poppe and J.A. Moulijn
Permeation and separation behavior of a silicalite-1 membrane Catalysis 1995, 25, pp.
213-218
[69] Jolinde M. van de Graaf, F. Kapteijn and J.A. Moulijn Modeling permeation of binary
mixtures through zeolites membranes AIChE Journal 1999, Vol. 45, No. 3, pp. 497-511

References
59
[70] M. Bhandarker, A.B. Shelekhin and A.G. Dixon and Y.H. Ma Adsorption, permeation,
and diffusion gas in microporous membranes I: adsorption of gases on microporous glass
membranes Journal of Membrane Science, 75 (1992) pp. 221-231
[71] L.T.Zhuravlev Surface characterization of amorphous silica—a review of work from the
former USSR Colloid and Surfaces A: Physicochemical and Engineering Aspects, 74
(1993) pp. 71-90

Appendix
1
Appendix
Figure
Fig. 1.1 Composite membranes
Fig. 1.2 Clusters in a 2-D square lattice
Fig.1.3 The dependence of diffusivity on coverage for a binary mixture of mobile
components
Fig. 1.4 H2 permeance during the water vapor exposure
Fig. 1.5 IUPAC classification of adsorption isotherms
Fig. 1.6 Langmuir adsorption isotherm and Henry law
Fig. 1.7 Various types of hydroxyl groups on the surface of silica
Fig. 1.8 Number of the surface hydroxyl groups and the surface siloxane bridges produced
by condensation of OH groups, as a function of preheating temperature
Fig. 1.9 Isotherms of water vapor on Zoelite 4A at four temperatures (0-101˚C)
Fig. 1.10 An electromagnetic wave at a fixed time
Fig. 1.11 The optical phenomenon of reflection and refraction
Fig. 1.12 When two linearly polarized waves with the same frequency are combined in phase,
the obtained wave is linearly polarized light as well
Fig. 1.13 When two linearly polarized waves with the same frequency and different phases
are combined, the obtained wave is elliptically polarized. In this figure, the
difference of their phases is 90º, and hence it is circularly polarized
Fig. 1.14 Reflection of a light beam from a surface
Fig. 1.15 Reflection of a light beam from multiple interfaces
Fig. 1.16 Calculated dependence of tanψ and water volume fraction, assuming that SiO2
volume fraction is 0.7, pore volume is 0.3. Incident angle is 70.11° and the
wavelength is 800 nm
Fig. 2.1 Water vapor generator
Fig. 2.2 Normal (A) and modified (B) ‘wet gas’ delivery systems
Fig. 2.3 Homemade gas permeation setup
Fig. 2.4 Scheme of a homemade ellipsometer
Fig. 2.5 The cell for ellipsometry experiment
Fig. 2.6 Energy scans at different temperatures of water bath (T(H2O)) where the temperature
of membrane (T(mem)) was 90ºC
Fig. 3.1 Time dependence of He flux at 200ºC during the outgassing process
Fig. 3.2 He flux over time at different T(H2O) and T(mem)= 50 and 90ºC

Appendix
2
Fig. 3.3 He permeance (FHe) as a function of pH2O at T(mem)= 50 and 90ºC
Fig. 3.4 The dependence of normalized FHe and pH2O at T(mem)= 50 and 90ºC
Fig. 3.5 Time scans for H2O adsorption in the silica layer at a constant T(mem) and different
T(H2O) conditions
Fig. 3.6 Energy scans for the equilibrium of water vapor adsorption at T(mem)=50ºC
Fig. 3.7 Energy scans for the equilibrium of water vapor adsorption at T(mem)=90ºC
Fig. 3.8 Isotherms of water vapor adsorption at 50 and 90ºC
Fig. 3.9 Water vapor adsorption isotherm at T(mem)= 50ºC
Fig. 4.1 The dependence of He permeance on the coverage θ of water vapor at T(mem)= 50
and 90ºC
Fig. 4.2 The concept of an unfolded pore and gas hopping in a 2-D lattice
Fig. 4.3 Percolation in a 2-D lattice
Fig. A The schematic way to study percolation
Fig. B Water vapor desorption at 50 and 90ºC
Table
Table 1.1 Layer properties of a typical silica membrane for hydrogen separation
Table 1.2 Percolation thresholds for various lattices
Table 3.1 Comparison of He and water vapor flows at T(mem)=90ºC
Table 3.2 Adsorption parameters of water vapor at T(mem)=50ºC
Table 3.3 Adsorption parameters of water vapor at T(mem)=90ºC
Table A. Desorption parameters measured by ellipsometry at 50 and 90ºC