inorganic materials chemistry and functional...
TRANSCRIPT

Inorganic materials chemistry
and functional materials
Helmer Fjellvåg and Anja Olafsen Sjåstad
Lectures at CUTN spring 2016
Chemical bonding

X-ray diffraction and structure analysis

Lin
(C
ou
nts
)
0
1000
2000
3000
4000
5000
6000
7000
8000
9000
10000
11000
12000
13000
14000
15000
16000
17000
18000
19000
2-Theta - Scale
10 20 30 40 50 60 70 80 90
The powder X-ray diffraction pattern
Diffraction peak
Intensity (relative)
Position (2Q, d)
Peak profile (width)
background
X-ray diffraction; methods and analyses

Characteristic features of the pattern
Diffraction peaks
• Intensities
• Position (2theta d-values; Braggs law)
• Profile (width FWHM; Gaussian & Lorentzian contributions)
• Due to ONE or MORE crystalline phases
Background
• Caused by diffuse scattering etc
• Caused by fluorescence
• Caused by sample holder (capillary); sample prep..
• Caused by amorphous impurities
X-ray diffraction; methods and analyses

Information to be analyzed/extracted
• Intensities
– Presence/absence symmetry (space group)
– Atomic arrangement = crystal structure; coordinates
– Preferred orientation of crystallites
• Position (2Q d-values; Braggs law)
– Unit cell dimensions
• Profile (width FWHM; Gaussian & Lorentzian)
– Particle size, strain, stacking disorder
• Intensity+position
– Phase identification; qualitative + quantitative analysis
– Crystal structure
X-ray diffraction; methods and analyses

Information from powder diffraction
• It is a fingerprint of a crystalline compound (or mixtures)
phase identification
can be used for quantitative phase analysis
• It provides information on the unit cell (crystal system; size)
useful for evaluation of doping/substitutions/solid solubility
• It provides information of the atomic arrangement
can be used to refine atomic coordinates of a partly known
crystal structure
can be used to solve an unknown crystal structure
It provides information on particle size, strain, disorder,....
X-ray diffraction; methods and analyses

Phase ID and quantification from powder
555453525150494847464544434241403938373635343332313029282726252423222120
800
750
700
650
600
550
500
450
400
350
300
250
200
150
100
50
0
-50
-100
-150
-200
-250
Silicon 5.51 %
KCl 8.75 %
Apatite-(CaOH) 34.31 %
Arcanite 15.06 %
Calcite 31.55 %
Quartz low 0.87 %
Periclase 3.96 %
example
X-ray diffraction; methods and analyses
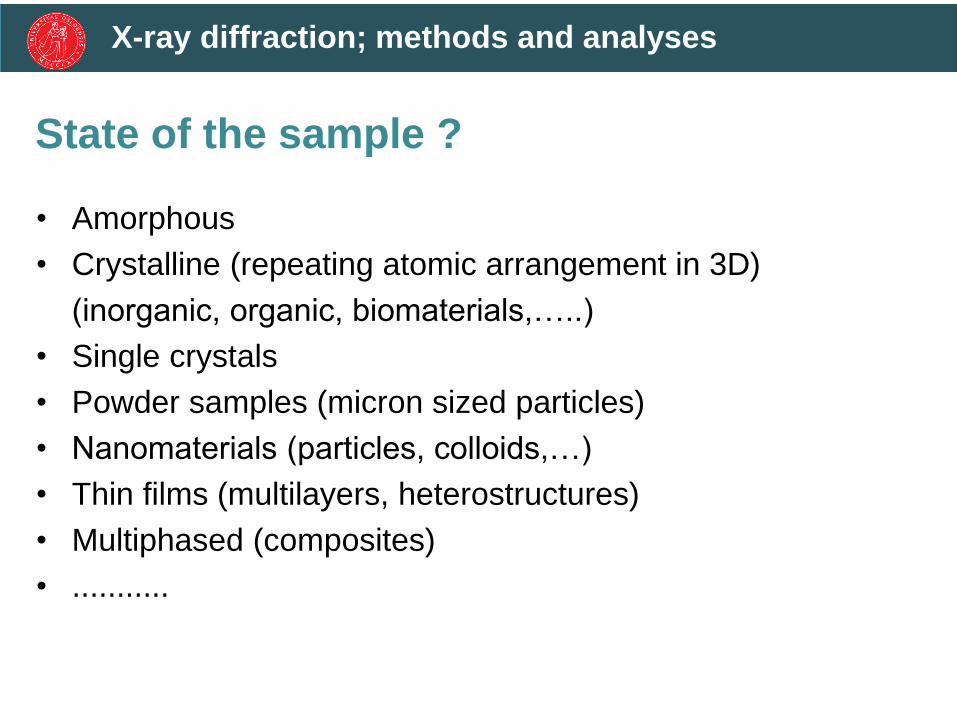
State of the sample ?
• Amorphous
• Crystalline (repeating atomic arrangement in 3D)
(inorganic, organic, biomaterials,…..)
• Single crystals
• Powder samples (micron sized particles)
• Nanomaterials (particles, colloids,…)
• Thin films (multilayers, heterostructures)
• Multiphased (composites)
• ...........
X-ray diffraction; methods and analyses

0 1 2 3 4 5 60
10
20
Fre
que
ncy %
dimameter / nm
900 W, 5min
DMF, PVP 0.8 gr
mean: 3.3 nm
SD:0.79
Small Spheres mol PVP / mol Precursors = 0.28
2 4 6 8 100
5
10
15
20
25
Fre
qu
en
cy %
diagonal / nm
900 W, 5min
DMF, PVP 0.4 gr
mean: 6.4 nm
SD:1.1
Truncated Cubes mol PVP / mol Precursors = 0.14
Monodisperse Pt-Rh nanoparticles
20 nm
20 nm
5 nm
5 nm
Dr. M. Kalyva, NAFUMA group

Utstyr og brukere Single crystals
Single crystallites = single crystals; but can be extremely small
OK for electron diffraction (very short wave length)
Larger single crystals;
may ”consist of more” mosaicity
may consist of twinned crystals (rooted in the symmetry)
Suitable size for home laboratory: some 50 micron and upwards
Suitable size at synchrotron: a few microns and upwards

Fe Ti
Ni
BF image
EFTEM images
Si substrate
JB1044
NAFUMA @ SMN / KI / UiO
Activities: thematic overview Thin films and multilayers

sin2 hkldn
Lin
(C
ounts
)
0
1000
2000
3000
4000
5000
6000
7000
8000
9000
10000
11000
12000
13000
14000
15000
16000
17000
18000
19000
2-Theta - Scale
10 20 30 40 50 60 70 80 90
The sample
Data collection
Theory and tools Results
structure, composition, morphology
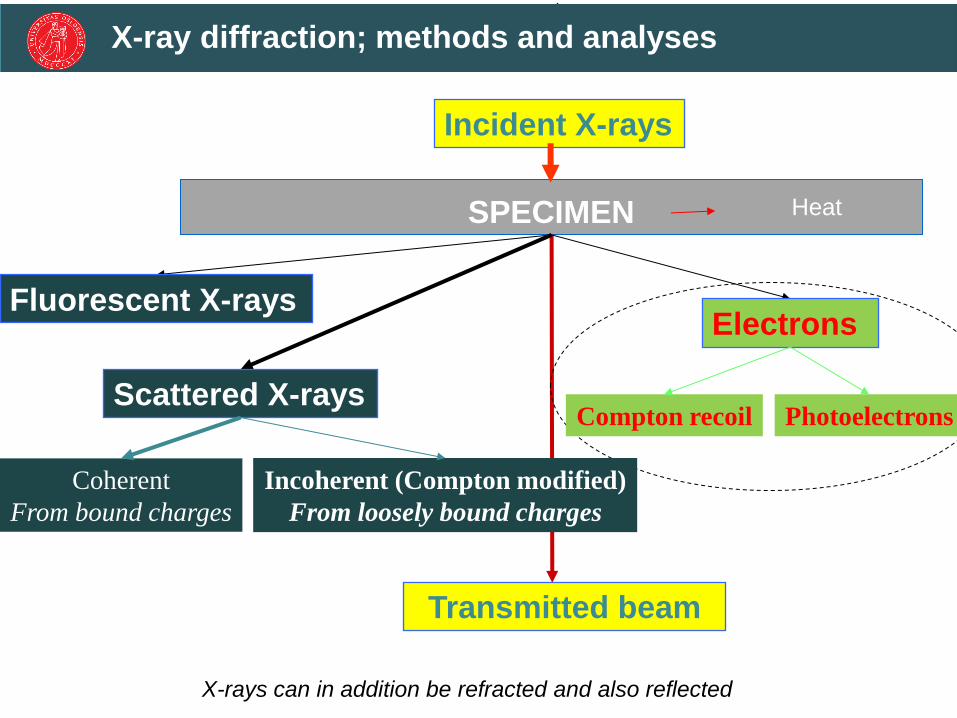
Heat
Incident X-rays
SPECIMEN
Transmitted beam
Fluorescent X-rays Electrons
Compton recoil Photoelectrons Scattered X-rays
Coherent
From bound charges
Incoherent (Compton modified)
From loosely bound charges
X-rays can in addition be refracted and also reflected
X-ray diffraction; methods and analyses

X-ray diffraction; methods and analyses
Principle of X-ray tube (home lab)
• Electrons are emitted
by heated cathode and
accelerated towards
anode.
• They hit the anode
which leads to – Creation of white radiation
(Bremsstrahlung).
– Emission of characteristic
radiation (cf anode material)
– Heat evolution (98-99% of
the total energy!).
– Hence; cooling by water….
+-
6 V
³15 kV
e-
Emission window (Be)
Anode
Heated cathode
Vacuum
IKa1
KbKa2

http://www.esrf.eu/cms/live/live/en/sites/www/home/about/synchrotron-
science/synchrotron-light-animation.html
X-ray diffraction; methods and analyses

X-ray diffraction; methods and analyses
Depends on machine and optical elements (magnets)
A broad range of wavelengths/energies available
Selected by monochromators
Allows experiments with fixed wavelength (typically for diffraction)
Allows spectroscopy over selected energy ranges
Hard X-rays: for diffraction/scattering, spectroscopy, imaging...
Soft X-rays: for spectroscopy,...

X-ray diffraction; methods and analyses
Spectrum consists of both
white (continuous) radiation
and characteristic radiation
Target for use:the strong Ka
In some cases are Ka1 and
Ka2 overlapping (not
resolved). A diffraction
experiment can then result in
only one single peak.
Otherwise partly splitted
peaks will be observed.
The weaker Ka2-radiation can
be removed by means of a
primary monochromator
(a single crystal of e.g.
Ge)
White radiation

X-ray diffraction; methods and analyses
L K Ka (2p 1s)
M K Kb (3p 1s)
K-shell
Characteristic radiation
The energy difference depends on the element !
Wavelength depends on type of filament in the X-ray tube
Main quantum number
An electron is first kicked out from
the inner level
This hole is then filled by an
outer electron (L, M shell);
and light (Xrays) are emitted

X-ray diffraction; methods and analyses
X-ray radiation: hazards The effect of ionizing radiation on living tissue is more closely
related to the amount of energy deposited Absorbed
dose Medical purposes
Mammography
UiO lab: No warning sign for ionizing radiation = safe lab

sin2 hkldn
BD = d sin DC = d sin BDC = 2d sin = n
X-ray diffraction; methods and analyses
Bragg’s law

If Bragg’s eq. is NOT satisfied then NO diffraction can occur
If Bragg’s eq. is satisfied then diffraction MAY occur
Diffraction = Reinforced Coherent Scattering
Reflection versus Scattering
Reflection Diffraction
Occurs from surface Occurs throughout the bulk
Takes place at any angle Takes place only at Bragg angles
~100 % of the intensity may be
reflected Small fraction of intensity is diffracted
X-rays can be reflected at very small angles of incidence; X-ray reflectometry
X-ray diffraction; methods and analyses

Peak Positions: Miller Indices (hkl)
2 Theta (Degrees)
20 30 40 50 60
Inte
nsity
(111) / d = 3.26Å
(200) / d = 2.82Å
(220) / d = 1.99Å
(400) / d = 1.41Å
(311) / d = 1.70Å
22
X-ray diffraction; methods and analyses

Top of sample
Correct too high too low
Gives rise to height error (shift in observed Bragg positions)
And may after analyses yield incorrect unit cell dimensions
Hence; height correction must (always) be carried out
Helpful; use of internal standard for calibration
X-ray diffraction; methods and analyses

Structure factor (F)
Occupation number
Polarization factor
Lorentz factor
Absorption factor
Displacement factor
Scattering from atoms in the unit cell; coordinates
Number of equivalent scattering planes
Effect of wave polarization; instrument dependent
Combination of three geometric factors
Specimen absorption; element dependent
Dynamics of atoms; static displacements
2
1
2
1
SinCos
SinfactorLorentz
21 2CosIP
(hkl) multiplicity
Site occupancy for atoms in the unit cell
X-ray diffraction; methods and analyses

Absorption Intensity loss due to sample absorbing the x-ray beam
Wavelength dependent
Sample and geometry dependent
For flat plate absorption is a linear function
For cylindrical sample/Debye-Scherrer transmission
geometry there is angular dependence
For transmission geometry: the absorption should be
calculated prior to data collection, and if needed, the
sample should be diluted
25
X-ray diffraction; methods and analyses

linear absorption coefficient [cm-1]
dt thickness
Attenuation (loosing intensity) through collisions with atoms
teII
dtIdI
0
X-ray diffraction; methods and analyses
m
miiP
Mass absorption coefficient m = density
If the absorbing sample consists of more elements:
P = weight fraction of the relevant element

Radiation with low energy
(high ) is heavily absorbed
Soft radiation (low energy) will
not penetrate absorbing samples
Radiation with higher energy
is absorbed less
Hard radiation is then useful
1/wavelength
long short
Home lab: Energy defined by
the type of X-ray tube
Synchrotron: all wavelengths
available
X-ray diffraction; methods and analyses
energy
Absorption
edge
Fine
structure

Linear absorption coefficient
depends on wavelength and sample
increases with increasing (i.e. lower energy)
is discontinuous (due to absorption edges)
Absorption is at maximum at a slightly lower (higher E)
than the absorption edge
For medium heavy elements, the K-absorption edge is in
the range of commonly used for X-ray diffraction
experiments
For heavy atoms, K-electrons are hardly excited and
hence L-edge is more important with respect to
absorption of home-lab X-rays)
X-ray diffraction; methods and analyses

X-ray diffraction; methods and analyses

Argonne web-page; help to calculate absorption and
dilution of sample with an inert
How to reduce absorption (in transmission geometry):
Sample dilution by mixing in:
Silica (will enhance amorphous background)
MgO; a few additional peaks; well-defined, easy to analyse
KCl: a few additional peaks + increased absorption
Just use a smaller capillary; ...?
Uneven particle distribution
Poor capillary filling
X-ray diffraction; methods and analyses

Fluorescence
Fluorescence by Co compared to Ni when using CuKa1 radiation
Fluorescence reduces the signal-to-noise ratio
Can be filtered electronically in many cases
Alternatively: use a different energy for the X-ray radiation
Highly increased background
X-ray diffraction; methods and analyses

Vacuum level
Energy
levels
KE
1LE
2LE
3LE
K
1L
2L
3L
Emission of
characteristic fluorescent x-rays
Emitted in all directions
Electron kicked out
from inner shell
X-ray diffraction; methods and analyses
Fluorescence
Incoming
X-rays

Fluorescence occurs when electrons are
excited to high energy states by incoming X-rays
As the electrons return to their normal energy
levels energy is given out as fluorescence
Lower energy than the incident X-rays
Co Kα transition (6.9 KeV) is just below Cu Kα (8
KeV)
Easily excited by Cu radiation
Fe Kα (6.4 KeV) is also excited by Cu radiation
X-ray diffraction; methods and analyses

X-ray diffraction; methods and analyses
Atoms in an excited state generated by absorption of X-rays, may emit characteristic radiation by outer electrons falling into vacant inner orbitals
Fluorescence has always lower energy (longer wavelength) than the exciting (incoming) X-ray radiation
Atoms are excited more strongly by radiation with wavelength close to the absorption edge
Fluorescence radiation is the basis for X-ray fluorescence spectrometry (XRF)
NB! For X-ray diffraction fluorescence is a nuisance and
experimental conditions should be selected so as to
minimize its impact
Fluorescence

X-ray diffraction; methods and analyses
Systematic absences (systematic extinctions)
arise when symmetry elements containing translational
components are present
- Lattice centering
- Screw axes
- Glide planes
Specific rules can be identified and applied – for
determining likely space group, based on the observed
diffraction pattern

Peak Intensities
Many variables, some instrumental, some sample dependent Instrument geometry and optics (transmission, reflection)
Radiation choice (λ in the Bragg equation)
Lorentz polarisation
Sample (crystal structure & symmetry) Atom type and position in the structure (scattering and
structure factors)
Occupation number - Site multiplicity (from space group)
Thermal displacement parameters
Absorption
Fluorescence (background; signal-to-noise)
Sample preparation Poor preparation gives poor data !
Preferred orientation
Particle size (nanopowders)
36
X-ray diffraction; methods and analyses

h
adh 00
)sin(2)( 0021 hRR dNCM
ha
x
AC
ABSBRRR )(
31
fractional for x´ ́222
Phase31
hxa
xh
ha
xRR
)(2 obtains one 3DIn zhykxh
Ray R3 reflects from atoms in positions within the unit cell.
Ray R1 hits the corner atom A of the unit cell.
X-ray diffraction; methods and analyses
RAY 1 in R1
RAY 2 in R2
RAY 3 in R3
R1´
R3´
R1´

The sum of all waves scattered by all atoms in the unit cells has a resultant
amplitude which depends on the scattering plane (hkl)
The resultant unit cell scattering factor is termed the Structure Factor (F)
When summarizing the scattering amplitudes for all atoms, these must be
weighed by the respective atomic scattering factors (f), which strongly depends
on nb of electrons in the X-ray scattering case.
electronan by scattered waveof Amplitude
cellunit in atoms allby scattered waveof AmplitudeFactor StructureF
)](2[ zhykxhii feAeE
2intensity n Diffractio FI
)](2[
11
jjjj zhykxhin
j
j
n
j
i
j
hkl
n efefF
Note:
The structure factor depends on atomic coordinates (x,y,z), type of atoms (atomic
scattering factor), site occupancy, BUT independent of shape and size of unit cell (a,b,c)
X-ray diffraction; methods and analyses

Bravais lattice (0,0,0) + (½, ½, ½); (plus any motif (xi,yi,zi))
)](2[ jjjj zhykxhi
j
i
j efefF
]1[ )()]
2(2[
0
)]2
1
2
1
2
1(2[
)]000(2[
lkhi
lkhi
hkhihkhi
efefef
efefF
Using the structure factor to evaluate systematic extinctions for a
body centered orthorhombic (I) structure
X-ray diffraction; methods and analyses
Now summarizing over (just) the two atoms at (0,0,0) and (½, ½, ½):
)](2[
11
jjjj zhykxhin
j
j
n
j
i
j
hkl
n efefF
Note: 𝒆𝒏𝒊𝝅
= -1 for n odd
= +1 for n even
For (h+k+l) odd, F = 0 and I = F2 = 0; e.g. (100), (001), (111); (210), (032), (133)
will be systematically absent (extinctions)
Whereas, for (h+k+l) even, F = 2f and I = F2 = 4f2, and Bragg reflections like
(110), (200), (211); (220), (022), (310) are allowed (have non-zero intensities)

X-ray diffraction; methods and analyses
A requirement for a reflection to
appear in the diffraction pattern of a
body-centered crystal, is that the sum
of the Miller indices (hkl) must be
even. If the sum is an odd number,
the intensity is zero due to destructive
interference.
Hence, the first diffraction peak to be
observed in a powder diffraction
pattern will be (110) followed by (200)
and (211)
Body-centered cubic (bcc) Simple cubic lattice with vectors ax, ay, az. Basis (atoms) at r0 = 0 and r1 =
(1/2)(ax, ay, az) . In such a monatomic crystal, all the form factors f are identical.
The diffracted intensity for a scattering vector with respect to the crystal plane (hkl) is
Systematic extinction
This rule applies to
all I-centered
structures !

X-ray diffraction; methods and analyses
:
SCREW AXES; extinctions
For two-fold screw axes, rules for systematic
absences are
For this symmetry operator certain intensities will cancel (become zero).
Consider the structure factor
F = ƒ cos 2π ( hx + ky + lz ) + ƒ cos 2π ( - hx - ky + l [(1/2) + z] )
Taking into account cos a + cos b = 2 cos (a+b)/2 cos (a-b)/2, we obtain
F = 2 ƒ cos π (2 l z + l/2) cos π (2hx + 2ky - l/2)
This vanishes (F=0) for hkl reflections with h=0, k=0 and l=2n+1.
This defines the systematic absences owing to the given screw axis.
We may observe intensity for reflections of type 00l with l=2n, but not for l=2n+1
21[001]
21[100] h00 h = 2n
21[010] 0k0 k = 2n
21[001] 00l l = 2n

Bravais lattice Reflections that may
be present (allowed)
Systematic
absences
Primitive (P) all None
Body centred (I) (h + k + l) even (h + k + l) odd
Face centred (F) h, k , l all even /all odd h, k, l mixed odd/even
Side centred
(A,B,C)
h + k even
C centred
h + k odd
C centred
Extinction Rules; lattices
X-ray diffraction; methods and analyses
Additional Extinction Rules;
Translations: screw axis / glide planes

Peak Intensities
Many variables, some instrumental, some sample dependent Instrument geometry and optics (transmission, reflection)
Radiation choice (λ in the Bragg equation)
Lorentz polarisation
Sample (crystal structure & symmetry) Atom type and position in the structure (scattering and structure
factors)
Occupation number - Site multiplicity (from space group)
Thermal displacement parameters
Absorption
Fluorescence (background; signal-to-noise)
Sample preparation Poor preparation gives poor data !
Preferred orientation
Particle size (nanopowders)
43
X-ray diffraction; methods and analyses

Atomic Scattering Factors (form factors, f)
Each atom has a characteristic
scattering curve for the
radiation used, therefore the
scattering strength is usually
plotted against sinθ/λ
The scattering factor decreases
with θ
Scattering increases with
atomic number because X-rays
are scattered by electrons
Highly relevant for magnetic
scattering when neutrons are
used (the magnetic reflections
will hence have higher
intensities at low angles. 44
X-ray diffraction; methods and analyses

Thermal Displacement Parameters
= “temperature factors” and “Debye-Waller factors”
Describe (ideally) the thermal dynamics of the atoms
Difficult to determine due to correlation with background
(especially at high diffraction angles), site occupancy,
absorption
Also static disorder/displacement may show up as an
enhanced displacement parameter
45
X-ray diffraction; methods and analyses

X-ray diffraction; methods and analyses
Before experiment: what does my sample contain?
Just light elements?
A lot of heavy elements?
Certain transition elements that may give a lot of
fluorescence scattering if Cu-X-rays are used?
Regular particles, or platelets or needles
(impurities; amorphous stuff,….)
Necessary for optimizing the experiment
Transmission (light elements) vs reflection (heavy)
Choice of radiation (wavelength)
Means to reduce preferred orientation

Sample Preparation
Essential for reliable PXRD data!
Bad sample preparation can lead to:
Incorrect peak positions
Bad peak shapes
Incorrect intensities
5 minutes of sample preparation can save hours of
work identifying and fitting phases from bad data!
47
X-ray diffraction; methods and analyses
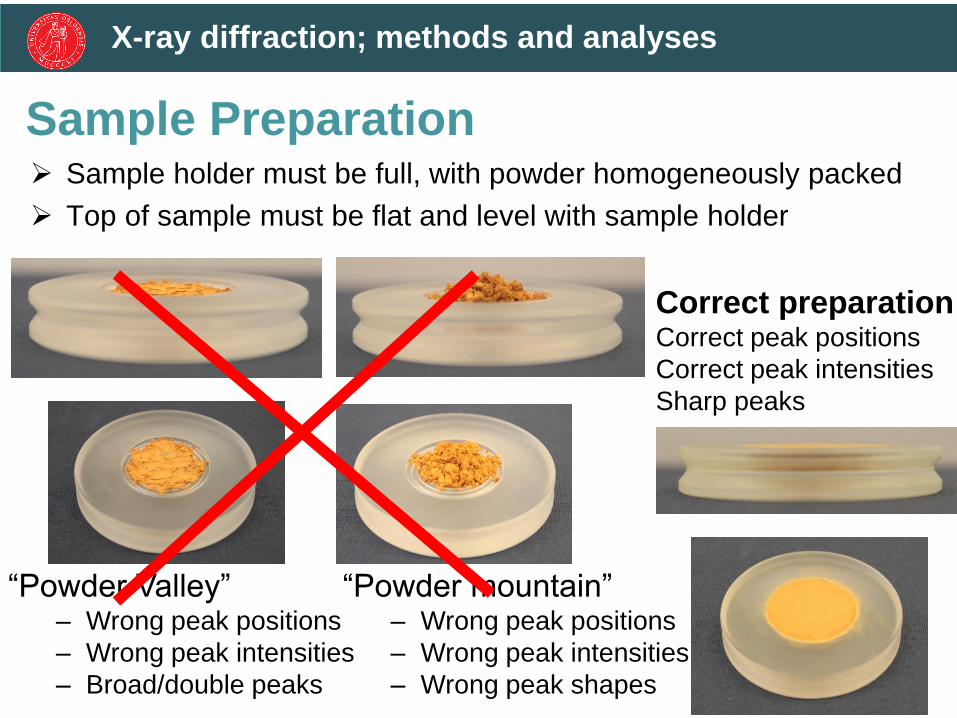
Sample Preparation Sample holder must be full, with powder homogeneously packed
Top of sample must be flat and level with sample holder
“Powder mountain” – Wrong peak positions
– Wrong peak intensities
– Wrong peak shapes
“Powder Valley” – Wrong peak positions
– Wrong peak intensities
– Broad/double peaks
Correct preparation Correct peak positions
Correct peak intensities
Sharp peaks
X-ray diffraction; methods and analyses

Sample preparation
2 Theta
30 31 32 33 34 35 36
Correct
2 Theta
20 30 40 50 60 70 80
Powder
valley
Powder
mountain
X-ray diffraction; methods and analyses

Preferred orientation issues becomes important when
crystallization gives: needles or platelike crystallites
When preparing a sample for powder X-ray diffraction, it then
becomes difficult to distribute the sample in such a way that all crystal
planes are randomly distributed in space
the diffraction pattern is hence reflecting the orientation of the
crystallites; results in preferred orientation effects
gives systematic enhancement/weakening of certain I(hkl)
May sometimes be helpful to grind the material
along with an inert standard
One may also observe other effects; e.g.
- width of diffraction peaks may vary
X-ray diffraction; methods and analyses

Peak Intensity: Preferred Orientation
Random distribution of crystallites is assumed for
powder diffraction
But real crystallites can have shapes which do not lend
themselves to this!
E.g. mica flakes; tend to lie flat on plate sample holders
51
X-ray diffraction; methods and analyses

Peak Intensity: Preferred Orientation
Preferred orientation can lead to changes in peak intensity as certain orientations are under represented in the sample
Strong P.O. effects can in the extreme case lead to peaks being completely absent from the diffractogram
Can be avoided by correct sample preparation Capillaries
Roughened sample holders
Can also be modelled in profile fits
52
MICA
Operations: Import
MICA - File: COURSE_280311_MICA.raw - Type: 2Th/Th locked - Start: 3.000 ° - End: 40.003 ° - Step: 0.016 ° - Step time: 0.3 s - Temp.: 25 °C (Room) - Time Started: 16 s - 2-Theta: 3.000 ° - Theta: 1.500 ° - Chi: 0.
Lin
(C
ou
nts
)
0
10000
20000
30000
2-Theta - Scale
3 10 20 30 40
mica
Operations: Import
mica - File: mica_group_II.raw - Type: 2Th/Th locked - Start: 3.000 ° - End: 70.002 ° - Step: 0.008 ° - Step time: 0.5 s - Temp.: 25 °C (Room) - Time Started: 15 s - 2-Theta: 3.000 ° - Theta: 1.500 ° - Chi: 0.00 ° - Phi: 0
Lin
(C
ounts
)
0
100
200
300
400
500
600
700
2-Theta - Scale
3 10 20 30 40 50 60 70
X-ray diffraction; methods and analyses

Extracting data from the pattern
• Peak positions: unit cell parameters, Miller
indices, d-spacings of layers, fingerprint for
phases, indexing, spacegroup determination
• Intensities: Atom types present in phases, site
occupancies, thermal parameters, instrumental
factors(!)
• Peak broadening: Instrumental factors,
Crystallite size and strain, shape, structural
defects
53
X-ray diffraction; methods and analyses

“Fingerprint” phase identification
Bragg’s law shows us that the diffraction pattern is very
characteristic of the crystal lattice for a given phase
We can use the diffraction pattern for phase identification
Visual (if you know the pattern of your phase)
Databases (COD, PDF2, ICDD FindIt)
When we know the phase we can study it further…
54
X-ray diffraction; methods and analyses

Quantitative Analysis
If the sample contains more than one phase then the
pattern corresponds to the weight percentage of each
phase
Can fit using intensities of single characteristic peaks
Now easy to determine from full profile using software
(TOPAS is excellent for this)
Common application of XRD in industry
Be aware that preferred orientation (see later) can cause
problems
55
X-ray diffraction; methods and analyses

Indexing and unit cell refinement
Assignment of Miller indices to a pattern according to a
specific unit cell
Can be done by hand for high symmetry examples
Use of software is more common (TREOR, TOPAS,
DICVOL etc)
If we know the cell (from indexing or phase identification)
we can refine the lattice parameters against the data
56
X-ray diffraction; methods and analyses

Unit cell dimension refinement
Changes in the unit cell parameters can be used to study phase
modifications, e.g.:
Substitution of atoms in a phase- the substituent usually has a different
atomic radius and different bond lengths to the original atom
Unit cell parameters change with substitution
Can also be used to look at vacancies, interstitials, etc
Least squares refinement methods are used. This can be done with
simple scripts and spreadsheets or complex software packages like
GSAS, FULLPROF and TOPAS
Care must be taken to assure calibration! Adding of internal
standards (silicon, LaB6; high quality standard from NIST); proper
zero point and displacement corrections (sample height for reflection
geometry)
57
X-ray diffraction; methods and analyses

Peak Shape: Size and Strain
Peak shapes are made up of two basic
contributions:
Instrumental (radiation, optics and geometry)
Includes the bulk of asymmetric broadening
Can be fitted with fundamental parameters of analytical peak
shapes
Sample (crystallite size and strain, defects, shape)
Analysis can be complex
58
X-ray diffraction; methods and analyses

Nanomaterialss
Normal, sharp diffraction peak Broad peak; high noise
FWHM
0.075°
Step size gives 4 data
points above FWHM
Should be
minimum 5!
X-ray diffraction; methods and analyses

Peak Shape: Crystallite Size
Scherrer equation describes the relationship
between peak broadening and crystallite size
60
hkl
KDhkl
b
cos
K: Constant (0.89)
λ: Wavelength (Å)
β: Broadening (rad)
θ: Diffraction angle (rad)
Beware! The Scherrer equation is not a panacea (solves it all…):
Weight averaged size of the crystallites may not represent the
real distribution of sizes (Fourier transform methods can help)
Assumes spherical crystallites- real crystals have many
shapes (this can be fitted with more complex methods)
Strain can also cause similar broadening effects (this can in
some cases be deconvoluted)
Strongly dependent on the quality of peak fit
X-ray diffraction; methods and analyses

Peak Shape: Strain
Strain (simplified)
εstr = β/{4 tan θ}
Slightly different
broadening effect to
crystallite size
61
X-ray diffraction; methods and analyses

Space Group Determination
Crystal symmetry is described by space groups
Space groups describes the essential symmetry in terms of Bravais lattice centering
Mirror planes, inversion centres and rotation axes from molecular symmetry (crystallographic point groups)
Translational symmetry (periodic lattices only): Screw axes and glide planes
Centring and translational symmetry elements lead to further interference phenomena in the diffraction pattern: Systematic absences
Systematic absences are used to determine the space group based on the diffraction pattern Difficult, limited number of observations in powder data (single
crystal is much easier)
Usually done with software 62
X-ray diffraction; methods and analyses

X-ray diffraction; methods and analyses
Systematic absences
(systematic extinctions) – space groups
EXAMPLE:
The following extinction rule is likely based on careful analysis of a
diffraction pattern of an orthorhombic sample (powder XRD data):
Which space groups could be possible?
hkl: none
0kl: k+l=2n
hk0: h=2n
h00: h=2n
0k0: k=2n
00l: l=2n

X-ray diffraction; methods and analyses
“Our” likely
extinctions:
hkl: none
0kl: k+l=2n
hk0: h=2n
h00: h=2n
0k0: k=2n
00l: l=2n
Using the
International
Tables of
Crystallography
to find the
likely space
group options

Mn0.63Cr0.37As 10 K Synchrotron radiation
Swiss Norwegian Beam Line
Grenoble 2001
X-ray diffraction; methods and analyses

X-ray diffraction; methods and analyses
Obtaining crystal structure information from powder diffraction data
Step 1: Indexing of diffraction pattern (TREOR, ITO, DICVOL, SIRPOW..)
Obtain suggestions for possible unit cell
Evaluate thoroughly; figure of merit (size of cell relative to nb. peaks)
Step 2: Profile fitting (Le Bail fitting) (various Rietveld type codes)
Are all peaks fitted?
Evaluation of possible systematic extinctions
Evaluation of likely space groups
Step 3: Sample composition – chemical formula
Databasis: any isostructural compound already described (known structure)
Step 4: Rietveld type analysis: refining the crystal structure based on a model

X-ray diffraction; methods and analyses
Refinements according to the method described by H. Rietveld
Instrumental/sample dependent parameters
Absorption
Zero point or height error
Peak width
Background
Crystallographic parameters
Unit cell dimensions
Atomic coordinates
Occupation numbers
Displacement parameters
Step 1: Determine background – introduce corrections/models
Step 2: Optimize unit cell dimensions and zero point / height error
Step 3: Manually adjust peak width parameters to provide at least fair
fit to the observed intensity profiles
Step 4: Refine atomic coordinates; heavy atoms first
Step 5: Refine peak width parameters
Step 6: Refine thermal displacement parameters (and occupation nb)

X-ray diffraction; methods and analyses

X-ray diffraction; methods and analyses
Mn0.63Cr0.37As
at 10, 150, 200, 295 K Synchrotron radiation
Swiss Norwegian Beam Line
Grenoble 2001
X-ray diffraction; methods and analyses

X-ray diffraction; methods and analyses
295 K: Paramagnetic
226 K:
2.Order para – antiferromagnetic transition
(incommensurate Hc spiral)
Around 160 K
1.Order magnetostructural phase transtion
(at LT: incommensurate Ha spiral)
Large jumps in the unit cell dimensions
DV ≠ 0

X-ray diffraction; methods and analyses
Practical exercise
Rietveld analysis of powder synchrotron data, for
(a)Orthorhombic MnP-type Mn0.63Cr0.37As solid solution (Pnma)
(b)LaCoO3 rhombohedral perovskite in hexagonal setting (R-3cH)
Data files and input parameters:
Mn0.63Cr0.37As at 230 K: a/b/c approx: 5.645/3.561/6.239 Å
Atomic coordinates as given for MnP-type in the compendium
Raw data (format 10 in Fullprof): 230K.epf
LaCoO3 at 115 K: a and c approximately 5.430 and 13.035 Å
La: 0,0,1/4
Co: 0,0,0
O: 0.554 0 ¼
Raw data (format 10 in Fullprof): LaCoO3_115K_nofield_1.dat