inorganic and prepolymerized filler content analysis of
TRANSCRIPT

Inorganic and Prepolymerized Filler Content Analysis of Four Resin Composites
By
DaisySalazar,D.D.S.
AthesissubmittedinpartialfulfillmentoftherequirementsforthedegreeofMastersofScienceinRestorativeDentistry
HoraceH.RackhamSchoolofGraduateStudiesTheUniversityofMichigan
AnnArbor,Michigan2011
ThesisCommitteeMembers:PeterYaman,D.D.S.,M.S.(Chairman)JosephB.Dennison,D.D.S,M.S.(Co‐Chairman)

ii
Dedication
Tomyfather,JesusSalazar,andmymother,DaisyZ.LopezdeSalazar,whose
unconditionallove,guidance,andsupporthavemadethisaccomplishmentpossible.
Thank you for giving me the opportunity to follow my dreams and become the
womanIamtoday.
Tomysister,Zuly,andbrother,JR, for their constant support and love and for
encouraging me to further my education.
To my Grandmother, Marina de Salazar, for her love and prays for my success.
To my Salazar and Lopez families, for their constant support throughout my
wholelife.

iii
Acknowledgements
Itisapleasuretothankthosewhomadethisthesispossible;
To Dr. Peter Yaman, my program director and Chairman of my thesiscommittee, for his teaching, mentorship, continuous guidance, and stimulation.Thankyouforyourinvaluableknowledgeandhelpduringthesethreeyearsintheprogram and feedback during this research and above all, your support andconfidencetowardme.Thankyouforbeingafriendandforthetendernessduringthedifficulttimes.Ialwayswillrememberyouruniquesenseofhumorandallthesweetsthatyouprovidedmeduringalltheseyears.Yousetanexampleofaworld‐classprofessorforyourrigorandpassiononteaching.
ToDr.JosephDennisonforservingasamemberofmythesiscommittee.Hisperpetual energy and enthusiasm in research had motivated all his advisees,includingme.Inaddition,hewasalwaysaccessibleandwillingtohelpanystudentwiththeirresearch.Asaresult,thisresearchbecamesmoothandrewardingforme.
ToDr.JunLiuandtheClarksonlab–SchoolofDentistry,fortheuseoftheirequipmentforallmysamplespreparation.
To Mr. Kai Sun at the Space Research Building (Aerospace EngineeringSchool – University of Michigan) for his considerable help in the SEM and EDSanalysis.
ToMr.GaryMoraandtheUniversityofMichiganSchoolofDentistryfortheuseoftheburnoutfurnace,Neymatic101.
To3MESPE,Bisco,GCAmericaandIvoclarVivadentforprovidingmaterialsforthisresearchproject.
To the entire faculty, staff, and residents in Graduate Dentistry Clinic forgiving me the opportunity to work together, and for their support through thisproject.
To my classmates Jay, Sarah and Fahad, for their friendship and supportthroughoutthesethreeyears.Withoutallofyouthisprogramwouldhavenotbeingthesame.
Last but not least, I offermy regards andblessings to allmy friends:MikeHanes, Tania Gonzalez, Eneida Villanueva, Daniela Orellana, Wendy Jativa,Alexandra Rodriguez, Penny Spyropoulou, Juliette Sturla, Mohammad Almazedi,ReginaZajia,KylePullen,AlbertoHerrero,Dr.GiselleNeiva, JoseVivas,PilarHita,KaterinaOikonomopoulou,SandraAparicio, JuanLopez,DanielaGarcia,MattDart,CindyMavares,PaolaSanchez,VassilisTriantopoulosandallthosewhosupported,encouraged,andlovedmeinanyrespectduringalltheseyears.

iv
TableofContents
Page TitlePage…………………………………………………………………………………………………………..iDedication...………….…………………………………………………………………………………..……….iiAcknowledgements…..……………………………………………………………………………………….iiiTableofContents………………………………………………………………………………………………ivListofFigures……………………………………………………………………………………….…………..viiListofTables……………………………………………………………………………………….……………viiiChapterI
I. BackgroundandSignificance……………………………………………………………...1II. Purpose…………………………………………………………………………………………….6III. Hypothesis………………………………………………………………………………………..6IV. SpecificAims……………………………………………………………………………………..7V. Literaturereview………………………………………………………………………………8
Classificationsystems……………………………………………………………….8
PhysicalProperties…………………………………………………………………..14 Shrinkagestrain/Polymerizationstress……………………………15 Fillervs.Wear…………………………………………………………………...20 FlexuralStrength……………………………………………………………….21 Consistency……………………………………………………………………….22 SurfaceRoughness…………………………………………………………….24 OpticalProperties……………………………………………………………..26
MechanicalProperties……………………………………………………………...27 Mesoporousfillers…………………………………………………………….33
FillerAnalysis………………………………………………………………………….34
NewtechnologyinResin–basedcomposites……………………………40 Nanocomposite…………………………………………………………………40 Silorane…………………………………………………………………………….43 Ormocer‐basedcomposites………………………………………………..47
VI. References………………………………………………………………………………………...49

v
ChapterII
I. Abstract……………………………………………………………………………………………..52II. Introduction………………………………………………………………………………………53III. MaterialsandMethods……………………………………………………………………….55IV. Results………………………………………………………………………………………………60V. Discussion…………………………………………………………………………………………77VI. Conclusion…………………………………………………………………………………………85VII. References…………………………………………………………………………………………86

vi
ListofFigures
ChapterI
1. Methacrylateresinchemistry…………………………………………………………………...2
2. Reactivesitesofsiloraneandmethacrylatesandcorresponding
shrinkagereductionafterpolymerization…………………………………………………3
3.Compositeclassificationbasedontypesoffillers………………………………………8
4. ClassificationofMethacrylatebasedandSiloranebasedmaterials…………….13
ChapterII
1‐4. FEIQuanta2003DFocussedIonBeamWorkstationand
EnvironmentalScanningElectronMicroscope………………………………………….585.Comparisonoffillercontentmeasurementtechniques……………………………...61
6. Comparisonoffillerbyweightaftereachdissolutionwithacetone……………62
7.SEMphotomicrographsofAeliteLSafteracetonedissolutionat20,000X
(left)and40,000X(right)magnification………………………………………………….64
8.SEMphotomicrographsandfillermeasurementsofAeliteLSafter
acetonedissolutionat40,000Xmagnification…………………………………………...64
9. SEMphotomicrographsandfillermeasurementsofFiltekLSafter
acetonedissolutionat20,000X(left)and40,000X(right)magnification……65
10. SEMphotomicrographsandfillermeasurementsofFiltekLSafter
acetonedissolutionat40,000Xmagnification………………………………………….65
11. SEMphotomicrographsofKaloreafteracetonedissolutionat20,000X
(left)and40,000X(right)magnification……………………………………………………66
12.SEMphotomicrographsandfillermeasurementsofKaloreafter
acetonedissolutionat40,000Xmagnification………………………………………….66

vii
13.SEMphotomicrographsofEmpressDirectafteracetonedissolution
at20,000X(left)and40,000X(right)magnification………………………………...67
14.SEMphotomicrographsandfillermeasurementsofEmpressDirect
Directafteracetonedissolutionat40,000Xmagnification…………………………67
15. Energydispersivespectroscopyanalysisofthefillerparticlesin
AeliteLSafteracetonedissolution……………………………………………………………69
16.SEMphotomicrographsusedforEDSanalysis(left)andEDS
colormappingoverlay(right)forAeliteLS………………………………………………..69
17.EDScolormappingofSi,O,YbandCadistributioninAeliteLS…………………..70
18. Energydispersivespectroscopy(EDS)analysisofthefiller
particlesinFiltekLSafteracetonedissolution…………………………………………...71
19. SEMphotomicrographsusedforEDSanalysis(left)andEDS
colormappingoverlay(right)forFiltekLS………………………………………………..71
20. EDScolormappingofMg,Si,F,OandYdistributioninFiltekLS…………………72
21. Energydispersivespectroscopic(EDS)analysisofthefiller
particlesinKaloreafteracetonedissolution……………………………………………..73
22. SEMphotomicrographsusedforEDSanalysis(left)andEDS
colormappingoverlay(right)forKalore……………………………………………………73
23. EDScolormappingofMg,Si,F,OandYdistributioninKalore…………………...74
24. Energydispersivespectroscopic(EDS)analysisofthefiller
particlesinEmpressDirectafteracetonedissolution………………………………..75
25. SEMphotomicrographsusedforEDSanalysis(left)andEDS
colormappingoverlay(right)forEmpressDirect……………………………………75
26. EDScolormappingofBa,Si,F,YbandCadistributionin
EmpressDirect……………………………………………………………………………………….76

viii
ListofTables
ChapterI1. Experimentalmicrofilledcompositeresinsusedinthisstudy……………………20
2. Experimentalcompositeseriesformulations…………………………………………….25
ChapterII1. Compositesexaminedinthisstudy…………………………………………………………..552. Fillerbyweightwithtwodifferenttechniques…………………………………………62
3. Fillerbyweightaftereachdissolutionwithacetone…………………………………63
4. Correlationbetweenashinginairandtwo‐acetonedissolutions……………….63
5. Type,elementsdetectedandfillercontentofresin‐basedcomposites……….68

1
ChapterI
BackgroundandSignificance
The ultimate goal of dental restorativematerials is to replace the biological,
functional and esthetic properties of healthy tooth structure. Gold alloys and
amalgam, which have a long record of clinical success have been used as dental
restorativematerials formore than a hundred years especially in posterior teeth,
because of theirmechanical properties, however, thesemetallicmaterials are not
appealingtothehumaneye1,2.
During the last four decades, innovative improvements of direct restorative
compositematerialshavebeenmade,toallowtheiruseasanaestheticalternative
to amalgam for posterior and anterior restorations. However, Bowen’s chemistry
formulation has remained relatively unchanged, therefore the mechanical
properties of the most recent composites have not improved substantially. The
formulation ofmethacrylate‐based composites generally encompasses threemain
components: the inorganic filler particles, organic‐resin matrix and the coupling
agent.Theinorganicfillersaretypicallycreatedfromsiliconderivativesandconsist
ofparticlessuchasglass,quartz,pyrogenicsilicondioxide,andcolloidalsilicaviaa
sol–gel process. The organic matrix consists of base monomers, photoinitiators,
pigments, and stabilizers. Bisphenol‐A glycidyl methacrylate (Bis‐GMA) and
urethane dimethacrylate (UDMA) are commonly used as dental‐base monomers
(Figure 1). The coupling agent, usually silane, which is widely used to bond the
inorganicfillertotheorganic‐resinpolymer,enhancesthemechanicalpropertiesof
theweakerresinpolymermatrixandfacilitatesstresstransferbyformingaunitary
material3‐5.

2
Figure1.Methacrylateresinchemistry
The use of resin composite for large restorations is still controversial and
fracture of restorations in the posterior region has been found to be a common
caused for restoration failure6.The two main reasons why today’s methacrylate‐
basedcompositesstillhaveshortcomingsthatlimittheirapplicationinvolveswear
phenomena and polymerization stress7. During polymerization, shrinkage may
stresstheadhesivelyplacedtooth‐coloredrestorationwhileitfunctionswithinthe
complexoralenvironmentthroughmasticationandtemperaturefluctuations.With
the passage of time, wear, fatigue, and internal stress–strain from thermal
contractionandexpansionmaycreateplasticdeformationandmarginalleakageand
subsequently increase the risks of cuspal deflection, secondary‐caries formation,
andpulpalinflammation3,7,8.
Efforts to improve the clinical performance and to diminish external
deformation and internal stress of methacrylate‐based composites have been
focusedonthedevelopmentofinnovativemonomers,andnewfillertechnology3,5,
9.Amongthemethodsdevelopedtomodifythemonomermatrixincludethetypical
dimethacrylatemonomers being replacedbymethacrylateswith reduced reactive
groups (for example hydroxyl‐free Bis‐GMA) or the development of the
urethandimethacrylate. Other approaches proposed for reducing polymerization
Improvements on the composite side were achieved, to a great extent, by optimizing the fillers – while the chemistry behind the organic resin matrix remained essentially the same since the pioneering work of R. L. Bowen in the 1960s. Practically all composites employ dimethacrylates such as TEGDMA, Bis-GMA or UDMA, which are radically polymerized as the primary resin (Fig. 1).
It is striking, that during these decades of improvement, polymerization shrinkage was only incrementally reduced to a somewhat lower level. Reducing the polymerization shrinkage of composite materials without compromising physical and handling properties remained the major challenge for material scientists.
Shrinkage is one of the major drawbacks of composite materials. Shrinkage results in a built-in polymerization stress which challenges the tooth/composite interface. To achieve long-term marginal integrity of restorations, technically-perfect bonding to enamel and dentin with high bond strength is necessary to counteract the shrinkage and polymerization stress.
Polymerization shrinkage is an intrinsic property of the resin matrix. Upon curing, the single resin molecules move towards each other and are linked by chemical bonds to form a polymer network. This reaction leads to a significant volume contraction.
To date, the main strategy to reduce shrinkage focused on increasing the filler load, thereby reducing the proportion of the methacrylate resin (Fig. 2). Since the shrinkage is caused by the resin, the lower the proportion of resin in a composite, the lower the shrinkage will be. However, the shrinkage intrinsic to the methacrylate resin has remained a major challenge. Therefore, exchanging the resin seems the most promising pathway to solve the shrinkage problem.
4
3,5
3
2,5
2
1,5
1
0,5
0
Shr
inka
ge (v
ol %
)
Filler Content (wt %)
SiloraneMethacrylate
60 65 70 75 80 85 90 95 100
Figure 2: Simulated dependency of the volumetric shrinkage of composites on the filler content in weight percent plotted for typical methacrylate-based resins and the silorane resin
Source: 3M ESPE internal data
2
OO
O
OO
O
O
O
OHO O O
OH
O
OO N
H
NH
OO
O
O
O
O
TEGDMA
UDMA
Bis-GMA
INTRODUCTION
Figure 1: Methacrylate resin chemistry.
3
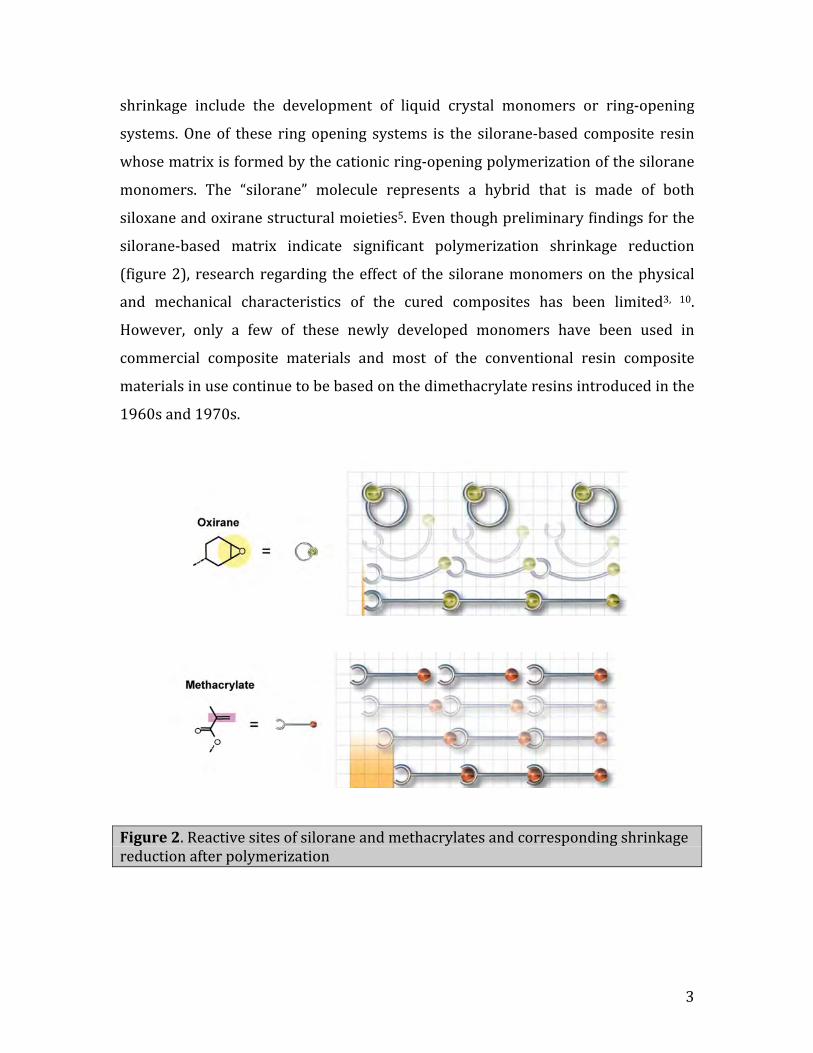
shrinkage include the development of liquid crystal monomers or ring‐opening
systems.Oneof these ring opening systems is the silorane‐based composite resin
whosematrixisformedbythecationicring‐openingpolymerizationofthesilorane
monomers. The “silorane” molecule represents a hybrid that is made of both
siloxaneandoxiranestructuralmoieties5.Eventhoughpreliminaryfindingsforthe
silorane‐based matrix indicate significant polymerization shrinkage reduction
(figure2), research regarding theeffectof the siloranemonomerson thephysical
and mechanical characteristics of the cured composites has been limited3, 10.
However, only a few of these newly developed monomers have been used in
commercial composite materials and most of the conventional resin composite
materialsinusecontinuetobebasedonthedimethacrylateresinsintroducedinthe
1960sand1970s.
Figure2.Reactivesitesofsiloraneandmethacrylatesandcorrespondingshrinkagereductionafterpolymerization
Ring-Opening Polymerization The polymerization process of Filtek Silorane restorative occurs via a cationic ring-opening reaction which results in a lower polymerization contraction, compared to the methacrylate-based resins which polymerize via a radical addition reaction of their double bonds.
The ring-opening step in the polymerization of the silorane resin significantly reduces the amount of polymerization shrinkage which occurs in the curing process. The reduced amount of shrinkage is illustrated schematically in Fig. 6. During the polymerization process, molecules have to approach their “neighbors” to form chemical bonds. This process results in a loss of volume, namely polymerization shrinkage. In contrast to the linear-reactive groups of methacrylates, the ring-opening chemistry of the siloranes starts with the cleavage and opening of the ring systems. This process gains space and counteracts the loss of volume which occurs in the subsequent step, when the chemical bonds are formed. In total, the ring-opening polymerization process yields a reduced volumetric shrinkage.
Besides shrinkage, another parameter of paramount importance to the performance of a restorative material is polymerization stress. Polymerization stress is generated when composites are cured in the bonded state and the polymerization shrinkage develops forces within the cavity walls. The rigid tooth structure will withstand this force to a certain degree, however, these tensions can lead to marginal gaps or to damage of healthy tooth structure by its deformation. These forces or tensions are summarized under the term “polymerization stress.”
From the restorative material perspective, polymerization stress is mainly determined by three factors: 1) the polymerization shrinkage, 2) the internal flowability of the material, and 3) the polymerization kinetics (polymerization speed). A highly-shrinking material with a small, internal flowability and very fast curing speed in the first few seconds, will exhibit the highest polymerization stress.
Silorane technology was developed to minimize shrinkage, and is thus also predestined for low stress development. Moreover, the kinetics of the initiation and polymerization of the Filtek Silorane resin were optimized to provide very low polymerization stress, as will be shown in the Test Result chapter.
5
OVERVIEW OF MATERIALS
Figure 6: Reactive sites of silorane and methacrylates and corresponding shrinkage reduction upon polymerization
1 <1% volumetric shrinkage tested by bonded disc method

4
Modifications in filler size, morphology and components have markedly
affected the recent commercial composites. Barium glass has been added for
radiopacity, amorphous silica has been introduced for improved handling and
ytterbiumhasbeenaddedforanestheticeffect.Furthermore,particleshavebecome
sphericalandsmaller.Theshapeofprepolymerizedfillerparticleshasbecomemore
diverse, and various types of composites containing both prepolymerized and
irregular‐shapedfillerparticleshavebeendeveloped11‐14.Oneofthemostimportant
advances of the last few years in the field of dentistry is the application of
nanotechnology to resin composites. Nanotechnology is known as the production
and manipulation of materials and structures in the range of about 0.1–100
nanometersbyvariousphysicalorchemicalmethods15.While thesizeof thefiller
particles liesaround8–30µm inhybridcompositesand0.7–3.6µm inmicrohybrid
composites,recently,newfillerswithsizerangingfromaround5–100nanometers
havebeendevelopedalthough40nmparticleswerealreadypresentinmicrofilled
composites14. Therefore, these materials could be considered as precursors of
nanofilledcomposites.Duetothereduceddimensionoftheparticlesandtoalarge
sizedistribution,anincreasedfillerloadcouldbeachievedwiththeconsequenceof
reducing the polymerization shrinkage and increasing the mechanical properties
such as tensile strength, compressive strength and resistance to fracture. These
seemtobeequivalentorevensometimeshigherthanthoseofuniversalcomposites
andsignificantlyhigherthanthoseofmicrofilledcomposites.Ontheotherhand,the
smallsizeofthefillerparticlesimprovestheopticalpropertiesofresincomposites
becausetheirdiameter isa fractionofthewavelengthofvisible light(0.4–0.8µm)
resultinginthehumaneye’sinabilitytodetecttheparticles.Furthermore,thewear
rate is diminished and the gloss retention is better. As a consequence,
manufacturers now recommend the use of nanocomposites for both anterior and
posteriorrestorations9,16.
Despite all these efforts, due to the complexity of thematerials, a clear and
general valid classification of composites, especially in regard of their clinical
success,couldnotbefound.Researchershavesuggestedthatfillercontent,size,and

5
morphology of the filler particles within a composite resin formulation has the
potentialtoinfluencethemechanicalperformanceofacompositeresin.Inaddition,
ithasreportedthat,increasingthefillerparticlesizewilleffectivelymodifynotonly
the pattern ofwear, but the rate ofwear aswell. It has also been stated that the
greaterthesizeoftheparticle,thegreaterthepotentialforwear16‐19.Thusitwould
seemreasonabletoexpectmorestudiesreportingclassificationofcompositesand
correlationsbetweenwearandfillerparticlesize.Perhapsthelackofsomeresearch
isdue to thedifficulty indetermining theexact sizeof the fillerparticleswithina
compositeresin.
Testing mechanical properties of composites often correlates a physical
property with filler loading. The filler content is often a mixture of organic and
inorganic filler. Whenstudiesdetermine filler loading theyoftenuseoneof three
methods:1.manufacturer’sreporteddata;2.thermogravimetricanalysis(TGA);or
3. ashing in air. True filler content of both organic and inorganic particles is not
capturedusingashing inairorthermogravimetricanalysistechniquessincesilane
coatings and prepolymerized particles are often used in weight percentage filler
contents reported by a manufacturer. The problems with ashing in air and
thermogravimetricanalysisaretemperaturesthatarewellabovethedecomposition
pointsforsilaneandtheorganicmatrixthatcomprisemuchoftheprepolymerized
particles.
No studies have concentrated on measuring filler content by weight or
volume for current commercial composites using a technique, which preserves
prepolymerized particles for the final filler calculation. There is no standard
procedure for verifying a manufacturer’s report of filler loading except the least
expensive method of ashing in air. With ashing techniques, the temperature and
timeofexposurecanvarygreatly.Previousstudieshaveusedtemperaturesranging
from570to1125oCandtimesof20to60minutes14,16,19‐24.

6
Scanningelectronmicroscopy(SEM)oftenusesadissolutiontechniquewith
acetoneorethylalcoholtoremovetheorganicmatrixfrominorganicfillers16,20,25.
Accordingtosomemanufacturerstheashinginairtechniquecanburnoffsomeof
thefillercontentofcompositesandthusgivefalseresults.Tocombatthisproblema
separation of the matrix and filler using acetone or ethyl alcohol needs to be
explored. It is hypothesized that a solvent such as acetonewill not break down
prepolymerized filler, silane, agglomerates, or clusters from composite
formulations.
Purpose:
Thepurposeofthisstudyistocomparethefillercontentbyweightreported
by themanufacturerwithashing in air andacetonedissolution techniquesand to
determine if any differences exist between each technique. Secondary objectives
includecomparingthefillercomposite,morphologyandsizeofeachcompositewith
SEMandEDSafterdissolutionwithacetone.
Hypothesis:
Primary:
Ho1: There is no statistically significant difference in filler percent by
weightcontentusingashinginairandacetonedissolutiontechniques.
Ha1: Thereisastatisticallysignificantdifferenceinfillerpercentbyweight
contentusingashinginairandacetonedissolutiontechniques.

7
Secondary:
Ho2: Thepercentfillercontentbyweightofselectedcompositesusingthe
ashing in air and acetone dissolution techniques is similar to
manufacturer’sdata.
Ha2: Thepercentfillercontentbyweightofselectedcompositesusingthe
ashing in air and acetone dissolution techniques are not similar to
manufacturer’sdata.
Third:
Ho3: There is not significant difference of the filler composition,
morphologyandsizeofeachcompositewithSEMorEDS
Ha3: There is significant difference of the filler composition,morphology
andsizeofeachcompositewithSEMandEDS.
SpecificAims:
Theobjectivesofthisproposedstudyareto:
1. Determineifthereisastatisticallysignificantdifferenceinfillerpercent
by weight content using ashing in air and dissolution by acetone
techniques.
2. Determine if the fillerbyweightof selectedcompositesusingashingby
airandacetonedissolutionaresimilartothemanufacturer’sdata.
3. Evaluatefillercomposition,morphologyandsizeofeachcompositeunder
SEMandEDSafterdissolutionwithacetone.

8
LiteratureReview
Classificationsystems
Lutz and Phillips17 in 1983 published an article that reviews composite
resinclassificationsystemsbasedon theircomponentsaswellassomeguidelines
for the selection of the currently available composites resins. Resin‐based
restorative materials were defined as three‐dimensional combinations of at least
two chemically different materials with a distinct interface. A composite resin
encompasses threephases: a) theorganicphase (matrix); b) the interfacial phase
(coupling agents) and c)thedispersedphase (fillers).Basedon themanufacturing
technique, fillers average size and chemical composition can be divided in three
categories: 1. Traditional macrofillers, 2. Microfillers (pyrogenic silica), and 3.
Microfiller‐basedcomplexes.
Figure3.Compositeclassificationbasedontypesoffillers
MICROFILLER-BASED COMPLEXES
MICROFILLERS(PYROGENIC SILICA)
TRADITIONALMACROFILLERS
ORGANIC MATRIX
COUPLING AGENT OR HOMOPOLYMERIZATION
HOMOGENEOUS MICROFILLED
COMPOSITE RESIN
HETEROGENOUS MICROFILLED
COMPOSITE RESIN
HYBRID COMPOSITE RESIN
TRADITIONAL COMPOSITE RESIN

9
Traditionalmicrofillersaremechanicallypreparedfromlargerpiecesofthe
material by grinding and/or crushing. The particles are purely inorganic, usually
splinter shaped. The average particle size is generally between 1 to 5µm.
Microfillers are derived chemically by hydrolysis and precipitation and consist of
very finely dispersed radiolucent glass spheres. The commonly used primary
particlesizerangeis0.05to0.1µm.Microfiller‐basedcomplexesweredevelopedto
attainmaximuminorganicloadingwithmicrofillers.Therearethreedifferenttypes:
1. splintered prepolymerized microfilled complexes (1 to 200µm), 2. spherical
polymer‐basedmicrofilledcomplexes(20to30µm)and3.agglomeratedmicrofiller
complexes(1to25µm).Thethreetypesoffillerspreviouslydescribedrepresentthe
backboneoftheclassification.Thisclassificationinthenoreganizedintofourmajor
systems: 1. Traditional composite resins, 2. Hybrid composite resins, 3.
Homogeneus microfilled composite resins and 4. Heterogeneous microfilled
composites which fall into three different subclasses: a) those with splintered
prepolymerizedparticles,b) thosewithsphericalprepolymerizedparticles andc)
thosewithagglomeratedmicrofillercomplexes.Ingeneral,hybridcompositeresins
canbeconsideredanoptimalcombinationofthewelltriedtraditionalandthenew
microfiller composite resin technology. The most promising anterior types,
especiallywithregardtoesthetics,consistofanextremelysmall(1to2µm),rather
soft,traditionalmacrofillerwithaspecialsizedistributionplacedintoareinforced
organic matrix. If esthetics is the primary concern, thenmicrofilled resin system
particularly light‐cured versions, are the materials of choice, especially the
heterogeneous microfilled composite resins with splintered prepolymerized
particles. As the filler particle size is reduced, the polishability, permanence of
surface smmotheness, and esthetics improve. However, to achieve restorations of
consistently outstanding quality, attention to technique sensitivity should be
maintained,andcertainmodificationshavetobemadeintheclinicalprocedures.
Lang,JaardaandWang19in1992thoughtthatmicrostructurewasoneofthe
keystounderstandmaterialproperties.Inthepast,investigatorshadrelied,inpart,
on these classification systems to describe the filler particle contents of the

10
composite for the purpose of developing correlations between wear and filler
particle size. The assumptionswere two‐fold: 1. thatmicrofilled composites have
smaller particles than traditional composites, and 2. the classification of the
composites in question was accurate. To demonstrate the problems that exist,
twelve composite resins were selected for this study, based on their published
classificationtypes,toexaminethenullhypothesisthat:“Therearenodifferencesin
thefillerparticlesizesbetweencompositesgroupedaccordingtotheirclassification
category as traditional, fine particle, or blends using the several classification
systems”. The twelve composite resins selected were: two microfilled composite
resins (Heliomolar, and Distalite), seven fine particle composites (P‐ 10, Bisfil 1,
EstiluxPosterior,P‐30,Visio‐Fil,Ful‐Fil,andStatus),andthreecompositesclassified
as blends (Herculite‐Condensable, Sinter‐Fil II, and Adaptic II). A 0.5 g sample of
eachcompositewasplacedin5mlofthesolvent,Acetone,andcentrifugedfor2min
at1000rpmtoseparatethesolventandmatrixsubstancefromthefillerparticles.
Thisprocesswasrepeatedthreetimesusingtheacetone.Theremainingcomposite
masswasnextplacedin5mlofChloroformforfurtherwashingandseparationof
the filler particles,whichwere clumped together as a result of the dissolution in
acetone.Thecompositemasswasagaincentrifugedfor2minat1000rpm,andthe
chloroform and residual matrix substance was discarded. The second washing
process was repeated three times. Finally, the remaining filler particles were
suspended in 5 ml of absolute Ethanol, and the suspended solution and filler
particles were smeared on a glass slide, for further SEM evaluation (2000x and
500x) to determine the range of filler particle sizes in each composite. After
establishing the rangeof fillerparticle sizes ineach compositeusing theSEM, the
samples were photographed at a magnification of 125x under light microscopic
examination and photo enlargement. Based on the filler particles sizes observed
during theSEMevaluation, the12compositeresinswouldappear to fall into four
groups.Thefirstgroupcontainingfillerparticlesthatrangeinsizesfromsubmicron
togreater than25µmwere:Visio‐Fil,Heliomolar,Status,andDistalite,Thesecond
groupwith fillerparticles thatrange insizes fromsubmicrontoapproximately10
µmwere: P‐10, P‐30, Bisfil I, and Estilux Posterior. The third group of composite

11
with filler particles in the submicron to 5µm rangewere: Adaptic 11, Ful‐Fil, and
Siuter‐Fil11.ThecompositeHerculite‐Condensablewasplacedinthefourthgroup
because it contains extremely small filler particles mostly in the micron to
submicronrange.Groupingcompositesonthebasisofthefillerparticlesizesfound
afterwashingwas easily correlatedwithwear and supported the suggestion that
compositeswith smaller filler particleswear less. The results of this studywould
appear to indicate that classification systems for composite resins should be
reviewed.Ifinvestigatorscannotapplytheclassificationsystemstoacompositeand
accuratelyandreliablyverifythatthecompositeisappropriatelyclassified,thenthe
utility of the system should be questioned. Certainly, using the system's
classification nomenclature (fine particle, microfilled, etc.,) to report correlation
withthephysicalpropertiesofcompositesingeneralmustbequestionedaccording
thisproject.
Ardu,Braut,Uhac,Benbachir, Feilzer,Krejci18 in2009 proposed anew
classificationof resin‐basedaestheticadhesivematerialsaccordingof theirmatrix
andfillermorphology.Elevenresin‐basedrestorativematerialswereinvestigatedin
this study. In order to obtain the SEM micrographs which is used for filler
characterization, 4 samples of each material were readied and their surface was
dissolved in chloroform (Chloroform pro analysis, Meck KGaA, Germany) with a
double step technique: 1) each specimen was rubbed with chloroform for 90
seconds,airdriedandpolymerizedfor60secondswithaLEDlightcuringunit(L.E.
Demetron II curing light, Kerr Corp, USA), and then again covered with several
drops of chloroform for 5 minutes followed by the chloroform removal. Finally,
specimens were dried at room temperature for 12 hours, gold sputtered and
observed in the SEM (Phillips XL 20, Eindhoven, and NL, 400x magnification).
According to the matrix composition, a general scheme of four different matrix
systems,which characterize thematerial’s level of hydrophobicity,was proposed.
ThesubsequentSEMfilleranalysisshowedamorecomplexschemebasedonfiller
sizeandconstruction:1)macrofilledcomposite(Concise,3MEspe)fillersize2‐5µm;
2)microfilled homogeneous composite (Isotit SR, Ivoclar Vivadent) filler size

12
0.04µm; 3)microfilled inhomogeneus composites (Durafill, Heraeus) with
prepolimerizedblocksof5‐30µmwhicharereinforcedwithmicrofilledparticlesof
0.4µm size; 4)coarse hybrid composite (Clearfill, Kuraray) filler size 1‐2µm;
5)hybrid finecomposite (EnamelplusHFO,Micerium) fillersize0.6‐1µm;6)micro
hybrid homogeneous composite (Point 4, Kerr) ; 7)micro hybrid inhomogeneous
compositewithaggregatedparticles(FilteksupremeXT,3MESPE);8)microhybrid
inhomogeneous composites with splinters (Tetric Evoceram, Ivoclar Vivadent)
whichisfilledwithcruncheddownpre‐polymerizedparticlesmadeoutofthesame
typeofcomposite:micro‐hybrids9)microhybrid inhomogeneouscompositeswith
heterologoussplinters(GradiaDirect,GCAmerica)whichisbasedonsplintersmade
ofanothertypeofcomposite:microfill.Allmicrohybridcompositesmeanfillersize
rangesfrom0.4to0.6µm.Thesecondlevelofclassification,consideringthematrix
besides the filler morphology, are divided in: 1) compomer based composites
(Dyract, Dentsply); 2) methacrylate based composites (all above composite
materials); 3) ormocer based composites (CeramX, Dentsply); 4) silorane based
composites(FiltekSilorane,3MESPE).Thisnewclassificationforresinrestorative
materialsproposedbythisauthor,whichtakesinaccountnotonlyresinmatrixbut
also filler size, allows a better understanding of the mechanical and aesthetic
characteristicsofresincompositesaswellascompomers,ormocersandsiloranes.

13
Figure 4. Classification of Methacrylate based (up) and Silorane based materials(down)
Methacrylate based
Macrofillers Microfillers
conventional2um - 5um
Hybrid0.4um - 2um
microfilled0.4um
Inhomogeneus with splinters
Homogeneous
Micro Hybrid0.4um - 0.6um
Coarse Hybrid1um - 2um
Fine Hybrid0.6um - 1um
HomogeneousInhomogeneous
Heterologous Homologous
with Aggregatedwith Splinters
Silorane
Macrofillers Microfillers
Hybrid 0.4 um - 2um
Fine Hybrid0.6um - 1um

14
Physicalproperties
Rodrigues, Scherrer, Ferracane and Della Bona26 in 2008 conducted a
study that characterized themicrostructure of two different composites, and also
determined their influence on the physical properties and fracture behavior. The
hypothesis to be tested were that differences in the properties between the two
compositescouldbeattributedtodifferencesintheirfillercompositionandextent
of cure, and that fractography of unnotched specimens tested in flexure could be
used to determine fracture toughness and result in similar values as the more
commonly used single edge notch beam (SENB) method. Two composites were
investigated:amicrohybrid(FiltekZ250,3MESPE)andananofill(FiltekSupreme,
3MESPE).The fillerweightpercentagewasdeterminedby the thermogravimetric
ashing technique, by placing porcelain crucibles containing the composite in a
furnace at 900oC for a period of 1 hour. The weight of the filler fraction in the
materials was considered to be the difference in weight before and immediately
after ashing by using an analytical balance. For the analysis of fillermorphology,
composites were evaluated under the SEM (Quanta 200 MK2, FEI Company,OR)
using the back scatter imaging mode at accelerating voltage of 15kV. A semi‐
quantitative elemental analysis was performed with electron disperse analysis
(SwiftEDmodel6650,OxfordInstruments).A100gloadwasappliedusingaknoop
indenterwitha30sdwelltimeandadiamondindenterwitha136oincludedangle
todeterminematerialhardness.Degreeofconversion(FourierTransformInfrared
Spectrometer),dynamicelasticmodulus(ECALCandSigview‐Fsoftware)werealso
determined.Barspecimensweresubjectedtoflexureloadingandflexuralstrength
was calculated. Fractographic analysis was performed to determine the fracture
origin for calculation of fracture toughness, and these results were compared to
thoseoffromthesingleedgenotchbeam(SENB)method.Resultswerestatistically
analyzed using two‐way ANOVA, Student’s t‐test and Weibull analysis. The filler
weightpercentageof Filtek250 (78.7±0.5%)was significantlyhigher than that of
Filtek Supreme (73.2±0.5%). The semi‐quantitative analysis revealed similar

15
elementalcompositionbetweenthecomposites.Hardnesswassignificantlyhigher
atthetopsurfaceofbothcomposites.Thedegreeofconversionofthemicrohybrid
composite was similar at the top and bottom surfaces, while it decreased at the
bottomsurfaceof thenanofill composite.Elasticmoduluswas significantlyhigher
for the microhybrid composite (25.5 GPa) then the nanofill (21.8 GPa). No
statistically significant differenceswere found between fracture toughness values
calculatedbythefractographicapproachortheSENBforbothcomposites.Withthis
paper the authors concluded that the procedures of characterization used in this
study for a microhybrid and a nanofill composite revealed that different sizes of
fillerparticlesmightresult indifferentmicrostructuresand fillercontents.Among
thefactorsevaluated,thefillercontentseemstobethemostimportantfactorinthe
determination of the properties of composites. On the other hand, the fracture
behavior and the structural reliability seem to not be affected in the highly filled
composites,sothe initialhypothesis isrejected.Fractographicapproachprovedto
be a reliable alternative for the determination of the fracture toughness of
composites.
Shrinkagestrain/Polymerizationstress
Lu, Lee, Oguri and Powers27 in 2006 conducted a study that compared
polymerization shrinkage, wear resistance, andmechanical properties of a resin‐
basedcompositefilledwithsphericalinorganicfillertootherpopularcontemporary
resincomposites.Sixdentalresincompositesweretestedincluding:onesubmicron
filled composite (Esthelite∑, Tokuyama Dental), one nano‐composite (Filtek
Supreme, 3M ESPE), two microfilled composites (Heliomolar‐ Ivoclar Vivadent;
Renamel – Cosmedent) and two microhybrid composites (Esthet X improved‐
Dentsply;TetricCeram,IvoclarVivadent).Compressivestrength,diametricaltensile
strength, flexural strength, flexural modulus, generalized wear resistance and
polymerization shrinkagewere evaluated for the sixmaterials. The surface of the
specimens were light cured according to themanufacturers’ instructions in their
appropriatemolds,storedandthentestedonauniversalmaterialtestingmachine

16
(Instron4465,InstronCorp,Canton,Ma,USA)atacrossheadspeedof0.5mm/min.
Generalized wear resistance was tested with a Leinfelder‐type wear tester for
400,000cyclesand the totalwear‐offvolumewasmeasuredwitha3‐dimensional
profilometer (MTS, St Paul, MN, USA). Polymerization shrinkage (Volumetric
shrinkage)was testedaccording to theArchimedesmethodat1,24and48hours
continuallyafterpolymerization.Datawereanalyzedby1‐wayanalysisofvariance
(ANOVA) to detect the influence of composite on properties. The results showed
thatEsteliteperformedsimilarlytonano‐compositeandmicrohybridcompositesin
mechanicalpropertiesandgeneralizedwearresistance,whileEsteliteandSupreme
had the lowest polymerization shrinkage among the materials tested. The two
microhybridmaterialshadsimilarproperties,whilethetwomicrofilledcomposites
weredifferentformostpropertiestested.Ingeneral,themicrofilledcompositeshad
lowermechanicalstrengththanothercompositesexceptRenamelforcompressive
strength. All thematerials had a similar shrinkage pattern, in that about 99% of
shrinkageoccurredinlessthan24hours.
Condon and Ferracane27 in 2000, studied the relationship between
polymerization stress and marginal debonding on a variety of dental composite
materials. Also, they explored the effect of a novel monomer in reducing
polymerization stress. Eleven commercial composites were tested to determine
their polymerization stress in a confined setting. They also tested an array of
experimentalcompositescontainingadifferentmonomer(methacrylatedderivative
of styrene‐allyl alcohol, or MSAA) to evaluate the potential for reducing
polymerization stress levels. A mechanical testing machine was used to evaluate
polymerization stress tests of fourmicrofills ‐ Durafill VS, (Heraeus Kulzer), Epic
TMPT, (Parkell), Litefil IIA, (Shofu), and Heliomolar, (Ivoclar‐Vivadent), three
minifills ‐ Tetric, (Ivoclar‐Vivadent), Charisma, (Heraeus Kulzer), and Herculite,
(SDSKerr)andthreemidifills‐Fulfil,(DENTSPLY/Caulk),Estelite,(Tokuyama),and
PrismaTPH,(DENTSPLY/Caulk).Theself‐curedcompositeBisfil2wasalsotestedto
examinetheeffectofitsdifferentcuringmode.Aseriesofexperimentalcomposites,
whichincorporatedMSAA,hasbeenproposedasanadjuncttoBis‐GMA.TheMSAA

17
molecule consists of a carbon chain backbone with an average of six pendant
methacrylategroupsflankedbyaromaticrings.Itsadditionhasbeenfoundtoyield
improved compressive strengthanddegreeof conversionofmethacrylate groups.
The high mobility of the functional ends could provide a flexible link by which
internal stresses could be resolved within the growing polymer. Six composites
were formulatedbyreplacingMSAAwithBis‐GMAat the levelof0,20,40,60,80
and100percentinalight‐curedresin.TheBis‐GMA/MSAAcombinationamounted
to50percentbyweightoftheresinpresent.Thethickmonomersweredilutedwith
TEGDMA,whichmadeup the remaining50percent byweight of the resin phase.
Silane treated fillerparticles (78percentbyweight [62percentbyvolume])were
addedtoformacomposite.Theyfoundasignificantrelationshipbetweenhighfiller
volumeand increasedpolymerizationstressamongthecommercialmaterials.The
introductionofMSAAproduceda30percentreductioninpolymerizationstressesin
theexperimental compositematerial.Thesignificanceof thisarticle is thathigher
levels of inorganic fillermaterials in a compositemix aremore likely to produce
lowerlevelsofpolymerizationstress.Theselowerlevelsofstresscouldresultina
reductioninpostoperativesensitivity,marginalstainingandrecurrentcaries.
Goncalves,KawanoandBraga28 in2010evaluated the influence of filler
fraction of experimental composites on the polymerization stress and its
determinants as degree of conversion, volumetric shrinkage and elastic modulus
and also they investigated the association between polymerization stress and the
other variables. Eight experimental composites containing BisGMA, TEGMA, and
bariumglassatincreasingconcentrationsfrom25to60vol%(5%increments)were
tested. Polymerization stress testwas evaluatedwith a universal testingmachine
(Instron5565,MA,USA)usingacrylicasabondingsustrate.Volumetricshrinkage
was determined using a picnometer (5 cm3, Brand Gbmh, Germany) and elastic
modulus was obtained by three‐point flexural test 15 min after
photopolymerizationinauniversal testingmachine(Instron5565)withan8‐mm
span between the supports at a crosshead speed of 0.5 mm/min. Degree of
conversionwasassessedbyFouirier‐transformedRamanspectroscopy(RFS‐100/S

18
,USA). The results showed the polymerization stress and shrinkage showed an
inverse relationshipwith filler content (R2=0.965 and R2=0.966, respectively). On
theotherhand,elasticmodulusshowedadirectcorrelationwithinorganiccontent
(R2=0.984).Polymerizationstressshowedastrongdirectcorrelationwithshrinkage
(R2=0.982) and inverse correlation with elastic modulus (R2=0.966). Degree of
conversion did not vary significantly. In summary, high inorganic contents were
associated with low polymerization stress values, which can be explained by the
reducedvolumetricshrinkagepresentedbyheavilyfilledcomposites.
Satterthwaite,VogelandWatts29 in2009conductedastudyto investigate
thevariationsoffillerparticlesizeandshapeontheshrinkage‐strainaccompanying
polymerization of resin‐composites. Twelve visible‐light‐cured experimental resin
compositestogetherwithanestablishedcommerciallyavailableformulation(Tetric
Ceram,IvoclarVivadent)wereevaluated.Theresinmatrix inallcompositeswasa
mix of BisGMA, UDMA, and TEGMA with a dispersed phase of the same volume
fraction (56.7%), which was treated with a silane coupling agent
(methacryloxypropyltrimethoxysilane). The filler graded in size, and furtherwere
either spherical or irregular. The bonded disk method was used to determine
shrinkage‐strain. A resin‐composite test specimen was placed in a brass ring
situateduponaglassslab lightlygrit‐blastedwithalumina topromotebonding to
composite.Compressionwasachievedthroughtheuseofthickglasscoverslipanda
thickglassplacedoverthesample.Auni‐axialLVDT(typeGT2000RDPElectronics)
waspositioned centrallyover the cover slip and recordeddisplacementoccurring
duetopolymerizationduringandfollowingirradiationfor40sfromQTHlight‐cure
unitat600mW/cm2.Thefractionalvolumetricshrinkage‐strainwascalculatedand
expressed as a percentage. Values were evaluated using two‐way ANOVA and
multiple pairwise comparisions using a Scheffé post hoc test to establish
homogeneus subsets. The shrinkage‐strain values were generally lower for those
compositeswith spherical filler particles than thosewith irregular filler particles.
Formaterialswithsphericalfiller,themeanshrinkage‐strainwas2.66%(SD0.18)
and for those with irregular filler it was 2.89% (SD 0.11). With regard to filler

19
particlesize,thehighestshrinkage‐strainwasseeninthosecompositeswithsmaller
fillerparticles.
Herrero, Yaman and Dennison30 in 2005 were concerned about the
availability of firmer and more packable composites that will ensure proper
proximal contour and contacts as well as marginal seal. They evaluated
polymerizationshrinkageanddepthof cureof fivedifferentpackable composites:
Surefil (Dentsply), Alert (Jeneric/Pentron), Solitaire (Heraeus/Kulzer), P60 (3M
Dental Products) and Prodigy Condensable (Kerr). This studywas divided in two
phases: the first phasemeasured linear polymerization shrinkage and the second
measured the composite hardness. For the first phase ten specimens of each
compositeintwodifferentthickness(2mmthickand5mmthick)weretransferred
toaglassslidewhichwascoatedwithaseparatingmediumtoallowthecomposite
toshrinkfreeofsurfaceadhesion.Aflataluminumtargetwasplacedontopofthe
specimen and the entire assemblywasmounted in a vertical position. The target
and the specimen were positioned at the required distance below a sensor
connected to a measurement system or linometer (KµDATM, Kaman
Instrumentation), which was calibrated prior to each measurement. Once
positioned, the composite specimenswerepolymerized for forty seconds (Optilux
401 light, Demetron Research). For the second phase, ten specimens of each
thickness for eachmaterial were prepared (n=100), and exposed for 40 seconds
usingthesamelightcuringlight.Threehardnessmeasurementsweremadeonthe
bottomandtopsurfaceofeachspecimenwitha200gdiamondpyramidalindenter
(Tukon tester,Wilson instruments). For shrinkage and hardness, themeans and
standarddeviationswerecalculatedforeachgroup.Aone=wayanalysisofvariance
(ANOVA)wasusedaswellasTukeymultiplecomparisontest.Forthe2mm‐thick
specimens the volumetric shrinkage was: 0.2% for Alert, 1.2% for P60, 1.4% for
Surefil,1.8%forProdigyand2.1%forSolitaire.Hardnessforthebottomsurfaceat
5mm thickness showed that Alert (16.5) and P60 (16.3) had higher values than
Surefil (8.9). Hardness for the bottom surface of the 2mm thickness showed that
P60 (48.5) and Alert (42.6) had significant higher values than Solitaire (11.2). In

20
conclusion Solitaire had the most shrinkage and Alert the least at 2 and 5mm
thickness.Also,thedepthofcurewassignificantlycompromisedforallmaterialsat
a5mmdepth.
Fillervs.Wear
Lim,Ferracane,CondonandAdey31questionedtheinfluenceofmicrofiller
particlesoncompositewear.Therefore, in2002,theyinvestigatedtheinfluenceof
filler volume fraction and filler surface treatment on the filler distribution in the
resin matrix and wear resistance of experimental microfilled composites. Four
seriesofexperimentalmicrofilledcompositeswerecreatedwithalightcuredresin
(33%Bis‐GMA/33%UDMA/33%TEGMA)andcolloidalsilica.
Table1.Experimentalmicrofilledcompositeresinsusedinthisstudy
Thesurfacetreatmentofthecolloidalsilicaineachgroupvaried:GroupFmicrofiller
wastreatedwith10wt%functionalsilane,groupNFmicrofillerwastreatedwith
10wt.%non‐functionalsilane,andgroupUmicrofillerwasnottreatedatall.Silux
plusservedasacontrol.Specimensweremadeinsteelmoldsandcuredinalight‐
curing unit (Triad II) for 40 sec on each side. Abrasion and attrition wear were
evaluated in an in vitro wear tester (OHSU oral wear simulator) with a abrasive
slurry and human enamel antagonist (cycled 50,000 times). The composite wear
patterns were analyzed with a diamond‐tipped profilometer. The average of five
specimenswascomputedandcomparedusinganANOVA/Tukey’s testatP≤0.05.
The surface of the wear patterns and the distribution of filler particles were
!"#$%#!&'())* !$ +%$,&-# .(!%&/ +%$!#'!&$01 2())(, #! ()1 345%#+$%!#- !"(! (0 $+!&.6. .&'%$7))#% )#,#) 8(9 (++%$/&:.(!#)* ;< ,$)1= !$ ('"&#,# !"# >$$- 8#(% %#9&9!(0'# ?$%9.()):+(%!&')# "*@%&- '$.+$9&!#9A &? !"# 7))#%9 8#%# -&9!%&@:6!#- 8#))1B&))#% +(%!&')# ')69!#%&0> &9 !"$6>"! !$ @# $0# $? !"# -#!%&:
.#0!() ?('!$%9 !$ !"# +#%?$%.(0'# $? +(%!&')# %#&0?$%'#-'$.+$9&!#91 2(%!&')# ')69!#%&0> .(* $%&>&0(!# ?%$. !"# 7))#%.(06?('!6%&0> +%$'#991 C''$%-&0> !$ D$E-#%"$). 3F5A !"#9&)(0# '$6+)&0> (>#0! !#0-9 !$ ?$%. (>>%#>(!#9 $0 !"# 7))#%96%?('#1 C>>%#>(!#9A "$8#,#%A -$ 0$! ?$%. ( ,#%* 9!(@)#@$0- @#!8##0 7))#% (0- %#9&01 G$"9#0 (0- H%(&> 3I596>>#9!#- !"(! -&9+#%9&$0 $? !"# 7))#% &0 !"# .$0$.#%.&/!6%#9 &0,$),#- 8#!!(@&)&!* $? !"# 7))#% 96%?('# @* !"#.$0$.#%A -&9+#%9&$0 $? !"# +(%!&')#9A (0- 9!(@&)&J(!&$01 K?!"&9 &9 0$! ('"&#,#-A .&'%$7))#% +(%!&')#9 .(* 0$! @# "$.$:>#0#$69)* -&9+#%9#- &0 !"# %#9&0 .(!%&/1 L$ #9!&.(!# !"#7))#% #??#'! $0 '$.+$9&!# 8#(%A M((%-( #! ()1 3;NA;;5 69#-DOG (0- -&>&!() &.(>&0> !$ #/(.&0# P6()&!(!&,#)* (0- P6(0:!&!(!&,#)* '$.+$9&!#9 &0 !#%.9 $? !"# 06.@#%9A 9&J#9A (0-(%#( $''6+&#- @* !"# 7))#%1 L"#* %#,#()#- !"(! '$..#%'&()'$.+$9&!#9 '$0!(&0#- 9&>0&7'(0! (.$60!9 $? 7))#% +(%!&')#9)(%>#% !"(0 9!(!#- &0 !"# )&!#%(!6%#1D!6-	 @* .(0* %#9#(%'"#%9 ')#(%)* "(,# -#.$09!%(!#-
!"# &.+$%!(0! %$)#9 !"(! 7))#% '$0!#0! (0- '$6+)&0> (>#0!9+)(* &0 -#!#%.&0&0> +(%(.#!#%9 96'" (9 9!%#0>!" (0- (@%(:9&$0 %#9&9!(0'# 3QA;QR;S51 D&0'# !"# +%$'#99 $? !"%##:@$-*(@%(9&$0 &0,$),#9 !"# '6!!&0> (8(* $? ( 9$?! .(!#%&() @* ("(%- (@%(9&,#A &! 9##.9 %#(9$0(@)# !"(! (--&0> "(%- &0$%:>(0&' 7))#% +(%!&')#9 !$ ( 9$?! %#9&0 .(!%&/ 9"$6)- #0"(0'#( '$.+$9&!#T9 $,#%()) %#9&9!(0'# !$ (@%(9&$01 H$6+)&0>(>#0!9 &.+%$,# !"# (-"#9&$0 @#!8##0 ( +$)*.#%&' +"(9#(0- -#09# &0$%>(0&' +"(9#A )#(-&0> !$ @#!!#% )$(- !%(09?#%(0- &0'%#(9#- 8#(% %#9&9!(0'#1 U$8#,#%A !"# %#96)!9 ?%$.V#(!!* #! ()1 3;S5 &0-&'(!# !"(! 0$ -&%#'! %#)(!&$09"&+ #/&9!9@#!8##0 7))#% +%#:!%#(!.#0! (0- 8#(% %#9&9!(0'# ?$% .&'%$:7)) '$.+$9&!#91 K! &9 +$99&@)# !"&9 +"#0$.#0$0 8(9 -6#!$ 7))#%R%#9&0 &0!#%('!&$0 $% !$ ( -&??#%#0'# &0 -&9!%&@6!&$0$? 7))#% ')69!#%9 &0 !"# %#9&0 .(!%&/1W#'#0!)*A 0$0:@$0-#- .&'%$7))#%9 "(,# @##0 (--#- !$
'$.+$9&!#9 !$ %#-6'# +$)*.#%&J(!&$0 '$0!%('!&$0 9!%#993;<51 L"# (--&!&$0 $? +(%!&')#9 !"(! (%# #&!"#% 60!%#(!#- $%'$(!#- 8&!" ( 0$0:?60'!&$0() 9&)(0# -&- 0$! "(,# ( 0#>(!&,##??#'! $0 .#'"(0&'() +%$+#%!	A (0- &0 ?('! 696())*&.+%$,#- ?%('!6%# !$6>"0#99 3;X51 C9 !"# 0$0:?60'!&$0()9&)(0# !%#(!#- .&'%$7))#%9 -$ 0$! ?$%. ( '"#.&'() @$0- !$!"# %#9&0 .(!%&/A &! &9 $? &0!#%#9! !$ #/(.&0# !"# #??#'! $? 0$0:?60'!&$0() 9&)(0# !%#(!.#0! $0 !"# 8#(% @#"(,&$% $? .&'%$7))'$.+$9&!#91G$9! '$..#%'&() .&'%$7)) '$.+$9&!#9 '$0!(&0 +%#:+$)*:
.#%&J#- %#9&0 7))#%91 U$8#,#%A "$.$>#0$69 .&'%$7)) -#0!()'$.+$9&!#9A 96'" (9 H$0'#+! YK,$')(%Z (0- 2#%?#'!&$0 Y[#0:G(!ZA "(,# @##0 '$..#%'&())* (,(&)(@)#1 K0 (--&!&$0A ('6%%#0! !%#0- &0 '$.+$9&!# !#'"0$)$>* &9 !$8(%- !"# 69# $?"$.$>#0#$69)* -&9!%&@6!#- 0(0$+(%!&')#91 L"#9# +(%!&')#9(%# ,#%* 9&.&)(% &0 9&J# !$ !"# .&'%$7))#%9 69#- &0 '6%%#0!
'$..#%'&() -#0!() '$.+$9&!#9A 8"&'" (%# !"# 9(.# (9 !"#$0#9 69#- &0 !"&9 9!6-*1 L"#%#?$%#A $6% >$() 8(9 !$ 9!6-* !"#&0\6#0'# $? .&'%$7))#% +(%!&')#9 $0 '$.+$9&!# 8#(%1 K0+(%!&'6)(%A !"# $@]#'!&,# 8(9 !$ &0,#9!&>(!# !"# &0\6#0'# $?7))#% ,$)6.# ?%('!&$0 (0- 7))#% 96%?('# !%#(!.#0! $0 !"#7))#% -&9!%&@6!&$0 &0 !"# %#9&0 .(!%&/ (0- 8#(% %#9&9!(0'#$? #/+#%&.#0!() .&'%$7))#- '$.+$9&!#91
!" #$%&'($)* $+, -&%./,*
B$6% 9#%	 $? #/+#%&.#0!() .&'%$7))#- '$.+$9&!#9 8#%#.(-# 8&!" ( )&>"!:'6%#- %#9&0 Y^^=V&9:_GC`^^=a[GC`^^=LO_[GCZ (0- '$))$&-() 9&)&'( Yb/:<NA [#>699(A_#%.(0*Z YL(@)# ;Z1 L"# 96%?('# !%#(!.#0! $? !"# '$))$&-()9&)&'( Y(,#%(># -&(.#!#%! N1NS !.Z &0 #('" ,(%&#-c >%$6+ B.&'%$7))#% 8(9 !%#(!#- 8&!" ;N 8!1= ?60'!&$0() 9&)(0# Y":.#!"('%*)$/*+%$+*)!%&.#!"$/* 9&)(0#Zd >%$6+ eB .&'%$7):)#% 8(9 !%#(!#- 8&!" ;N 8!1= 0$0:?60'!&$0() 9&)(0# Y3^A^A^!%&\6$%$+%$+*)5:!%&.#!"$/* 9&)(0#Zd >%$6+ a .&'%$7))#% 8(90$! !%#(!#- (! ())1 C)) 7))#%9 8#%# +%$-6'#- ?$% !"&9 9!6-* @* (-#0!() .(06?('!6%#% YV&9'$ K0'1A D'"(6.@6%>A Kf1A aDCZ1L"# '$.+$9&!#9 8#%# +%$-6'#- @* "(0-:.&/&0> !"# .$0$:.#% (0- 7))#% &0 (++%$+%&(!# +%$+$%!&$091L$ .&0&.&J# !"# (&% @6@@)#9 &0 !"# 9+#'&.#09A 9.())
(.$60!9 $? +(9!# 8#%# 9+(!6)(!#- $0 ( "$! +)(!# @#?$%# +$6%:&0> &0!$ !"# 9+#'&.#0 .$)-1 D+#'&.#09 8#%# ?$%.#- &0 !"#9"(+# $? @(%9 YQ1< .. !"&'g ! < .. 8&-# ! ;Q .. )$0>Z &0( 9!(&0)#99 9!##) .$)-1 L"# !$+ (0- @$!!$. 96%?('#9 $? !"#@(% 8#%# '$,#%#- 8&!" ( ')#(% .(!%&/1 O('" @(% 8(9 '6%#- ?$%SN 9`9&-# &0 ( )&>"!:'6%&0> 60&! YL%&(- KKA [#0!9+)*A h$%gA2CA aDCZ1 C)) 9+#'&.#09 8#%# (>#- &0 -#&$0&J#- 8(!#%?$% QS " (! ^4!H @#?$%# @#&0> .$60!#- &0 ('%*)&' %&0>9YQ< .. -&(.#!#%Z 69&0> .#!())$>%(+"&' #+$/*1 H$..#%'&().&'%$7))#- '$.+$9&!#A D&)6/ 2)69 Y^G [#0!() 2%$-6'!9A D!2(6)A GeA aDCZA 8(9 69#- (9 ( '$0!%$)1 D&)6/ 2)69 '$0!(&09^F ,$)1= $? .&'%$7))#% +(%!&')#9 &0 ( V&9:_GC`LO_[GC%#9&0 .(!%&/1C@%(9&$0 (0- (!!%&!&$0 8#(% 8#%# #,()6(!#- &0 (0 &0 ,&!%$
8#(% !#9!#% YbUDa $%() 8#(% 9&.6)(!$%Z 8&!" (0 (@%(9&,#9)6%%*1 L"# .#'"(0&'9 $? !"# bUDa $%() 8#(% 9&.6)(!$%"(,# @##0 -#9'%&@#- +%#,&$69)* 3;451 L"# 9+#'&.#09Y!! <Z 8#%# '*')#- <NANNN !&.#9 69&0> (0 #0(.#) '69+ &0( 9)6%%* $? >%$60- +$++* 9##-9 (0- 2GGC @#(-9 (! Q;!H1L"# '$.+$9&!# 8#(% +(!!#%09 8#%# (0()*J#- @* .(g&0> !#0
"#$%# &'( )* +,# - .)!*+, /+*)0'+,1 23 456657 2822Q
L(@)# ;O/+#%&.#0!() .&'%$7))#- '$.+$9&!# %#9&09 69#- &0 !"&9 9!6-*
H$-# B&))#% Y,$)1=Z B&))#% !%#(!.#0!
C QN BA eBAaV Q< BA eBAaH ^N BA eBAa[ ^< BA eBA(
( K! 8(9 0$! +$99&@)# !$ +%$-6'# ( ^< ,$)1= '$.+$9&!# 8&!" 60!%#(!#-.&'%$7))#% -6# !$ &!9 "#(,* '$09&9!#0'* (0- +$$% "(0-)&0>1

21
examinedusingSEManddigital imaging.Theresults showed thatas fillervolume
increased, wear was reduced regardless of filler treatment. The amount of wear
observedinspecimensC(filler30vol%)andD(filler35vol%)weresignificantly
lowerthanspecimensA(filler20vol%)andB(filler25vol%).Compositesingroup
F(with functionalsilane treatedmicrofiller)producedsignificantly lesswear than
those inGroupNF (withnon‐functionalmicrofiller) at 30 and35 vol.%, and less
thantheGroupU(untreatedmicrofiller)at30vol.%.SEMofspecimensofgroupNF
showedlargefilleragglomerates(size>1µm)intheresinmatrix,whilespecimensof
groupFandUshowedfeweragglomerates.Digitalimaginganalysisrevealedsmall
fillerclusters(size≤1µm)intheresinmatrixofallspecimens.Thisresultsuggest
thattheadditionoffillerparticlestothecompositeincreasesitswearresistance,but
thatoptimalenhancementofwear resistancecanbeonlyachieved if theparticles
arewellbonded to the resinmatrix.Themicrofilled composite thatpossesses the
highestpercentofinorganicfiller,thebesthomogeneousdispersionoffiller,andthe
strongest chemical bond between filler and matrix should have the best wear
resistance.
FlexuralStrength
In2007,Rodrigues,Zanchi,DeCarvalhoandDemarco32conductedastudy
to assess the filler composition effect in different commercially available resin‐
based composites, including flexural strength and modulus of elasticity. Filler
weightcontentwasdeterminedbyheatingeachcompositesampleat900oCfor30
minutes inanelectric furnace toeliminate theorganicmatrix.Theweightofeach
sample were measured before and after the heating process using an analytical
balance(AG200,Brazil).Twelvespecimensweremadeofeachcomposite;Supreme,
Esthet‐X, Z250, Charisma, andHelio Fillwith the dimensions specified by the ISO
4049/2000specification(25mmx2mmx2mm).Thecompositewascuredfor40
seconds in three consecutive points, producing a partial overlappingwith a light‐
curing unit with 450 mW/cm2 (Ultralux). Then, the specimens were stored in
distilledwater at room temperature for 7 days. Theywere submitted to a three‐

22
point bend test with a universal testing machine (4411, Instron,Brazil) with a
crosshead speed of 1mm/min. Flexural strength andmodulus of elasticitywere
calculated.ThedataobtainedfromthetestswereanalyzedusingANOVAandTukey
test. Pearson’s correlation testwas used to establish if therewas any correlation
betweenthefillerwt%dataandthemechanicalproperties.Thestatisticalanalysis
showed significant differences between composites both for the flexural strength
andthemodulusofelasticity.ThehighestflexuralstrengthwasobtainedwithZ250,
168.87(±15.36).ThemodulusofelasticityofEsthet‐X,6.93(±0.69)wassimilarto
thatofZ250,6.40(±0.96)andsignificantlyhigherthanthatofothers.Asignificant
positive correlation was found between the filler weight and the mechanical
propertiesflexuralstrength(r=0.591)andmodulusofelasticity(r=0.423).Itcould
beconcludedthatthefillercontentsignificantlyinfluencedintheflexuralstrength
and modulus of elasticity of the composites. This study showed the correlation
betweenfillercontentandthemechanicalpropertiesoftestedcompositeresins.
Consistency
Tyas, Jones, and Rizkalla23 in 1998 evaluated a method for the
assessmentoftheconsistencyofunsetresincomposite.Fourteencommercialresin
composites were selected : Dyract (Denstply), Herculite XR (Kerr), Herculite XR
Unidose(Kerr),P‐50(3M),Prisma‐Fil(Denstply),Prodigy(Kerr),SilarAandB(3M
Dental), Silux Plus (3M), Solitaire (Heraeus), Surefil (Denstply), Tetric (Ivocalar),
TPH (Denstply) and Z‐100 (3M). The range of consistencies were assessed
subjectively.Thematerialwasplacedinacylindricalmoldandthemoldwasplaced
on the base of a universal mechanical testing machine (Instron 1000, High
Wycombe).Agroundglassrodwithaflatendwasmountedbeneaththecross‐head
andloweredslowlyuntilitmadelightcontactwiththesurfaceofthecenterofthe
composite.Afterafewseconds,therodwasdrivenintothecompositefor6secata
rateof24.4mmmin‐1;thenthemaximumloadrecordedwasdisplayedusingadata
capture package (Labview v3.1.1, National Instruments). This test was repeated
nine times.Themeanmaximumforced foreachcompositewascalculatedandthe

23
valueswere compared for significantdifferencesbetweenmaterials usingANOVA
followed by Duncan’s multiple range test. The thermogravimetric analysis was
performed to determine theweight percentage of inorganic filler, using a Perkin‐
Elmer TGS‐2 analyzer. The mean wt% for each material was calculated and the
values compared for significant differences using ANOVA followed by Duncan’s
multiple range test. The results showed that the consistency values ranged from
0.33N(SilarA)to31.3N(Surefil),withthehighestvaluesbeingfoundforsomeof
therecentlyintroducedpackablematerials(Surefil,HerculiteXRUnidose,Solitaire
andTetricCeram).No correlationwas foundbetween consistency force and filler
weightforthefourteenmaterials;Thetwomaterialswiththehighestfillercontent
(P50,84.6%w/w;Z‐100,81.6%w/w)exhibitedmuchlowerconsistencyforcesthan
Solitaire (65.4%w/w), Prodigy (74.5% w/w) and Herculite XR Unidose (75.9%
w/w),whichhavemuchlowerfillercontent.Thetestmethodusedfordetermining
the consistency described in this study readily discriminates between a range of
consistenciesofthecompositesmaterialsusedinthis investigation.Therefore, the
consistency test describedmay prove to be useful as a standard testmethod for
characterizingthehandlingconsistency.Furtherworkwillberequiredtodetermine
forstickiness.
Kaleem, Satterthwaite and Watts33 in 2009 investigated the effect of
variation in filler particle size and morphology within an unset model series of
resin‐composites on two stickiness parameters:maximum probe separation‐force
(Fmax) and work of separation (Ws) and to assess the effect of temperature and
speedofprobeseparation.Thenullhypotheseswerethatchangesinfillerparticle
size,morphology,speedandtemperaturehavenoeffectonthestickinessofunset
resincomposite.Elevenexperimentalformulations,alllightcured,wereusedinthis
study. All composites had the same matrix (Bis‐GMA, UDMA and TEGMA, with
0.33% camphoroquinine) and the filler‐volume fraction (56.7%), however filler
particlesvaried insizeandshapeandwereeitherunimodalormultimodal insize
distribution.Eachmaterialwasplacedinacylindricalmoldheldat26or37oC.The
maximum force (Fmax) andworkofprobe‐separation (Ws)weremeasuredwitha

24
textureanalyzer(TA.XT2i,StableMicroSystems).Aflat‐endedstainless‐steelprobe
wasmechanically lowered onto and into the surface of the unset sample, until a
compressive force of 1N was reached, which was held constant for 1s. Then the
probe was moved vertically upward at a constant velocity of 2 or 8mm/s. The
tensile force produced on the probe by the sticky composite was plotted against
displacement and the maximum value was identified. Data was analyzed by
multivariate ANOVA andmultiple pair‐wise comparisons using a Tukey post hoc
testtoestablishhomogenoussubsetsforFmaxandaGames‐HowellwasusedforWs.
Aspotentialmeasuresofstickiness,FmaxandWsshowedmorecoherenttrendswith
filler size when measured at the lower of the two probe speeds, 2mm/s. For
unimodalresin‐compositeFmaxrangedfrom1.04to5.11NandWsfrom0.48to11.12
Nmm.Forthemultimodalresin‐compositetheyrangedfrom1.64to4.13Nandfrom
2.32to8.34Nmmrespectively.TemperatureincreasetendedtoslightlyreduceFmax,
althoughthistrendwasnotconsistent.Wsgenerallyincreasedwithtemperature.In
summary Filler particle size and morphology influences Fmax and Ws of uncured
resin‐composite,whichpartlyexpressthehandlingbehaviorsofresin‐composites.
SurfaceRoughness
Marghalani34 in 2010 evaluated the effect of different filler sizes ranging
from 100 and 1500 nm and geometry (spherical and irregular) on the surface
characteristicsofexperimentalresincomposites.Thenullhypothesisstatedthat:1)
There was no difference between surface roughness values of experimental
compositeseries,and2)therewasnocorrelationbetweenbothverticalaswellas
horizontal surface roughness parameters and the increase in filler particle size.
Eleven series of experimental resin composites on different particle size
formulations (range of 100‐1500nm) and twodifferent geometries (spherical and
irregular)wereinvestigated.

25
Table2.Experimentalcompositeseriesformulations
Thirty‐threedisc‐shapedspecimenswerepreparedinasplitteflonmold,light‐
cured (450mW/cm2 for40 s) atboth topandbottomsurfaces, finished,polished
with 1500 SCI paper as well as aluminum oxide slurry pastes and stored for 3
months in distilled water. The surface roughness values in the form of surface
finish‐vertical parameter, maximum roughness depth and horizontal roughness
parameterwererecordedusingaprofilometer.Thedatawereanalyzedbyone‐way
ANOVA and the means were compared by Scheffé post‐hoc test (α=0.05). The
results showed that the lowest surface roughnesswas observed in the composite
with spherical filler particle shape and 100nm of size (0.079±0.013), while the
roughestsurfacewasnoted incompositeswith irregular fillerparticleshapesand
filler sizes 450:700:1000 (0.125±0.011) and 450:1000 (0.124±0.004). The
spherical‐shape series showed the smoothest surface finish compared to the
irregular‐shape ones with higher significant difference (p>0.05). The vertical
surface roughness parameter values increased as the filler size increased. On the
contrary, the filler size as well as the filler shape did not significantly affect the
horizontal paramete. In summary, the filler particle’s size and shape have a great
conventional ones. Lately, one of the important
advances in nanotechnology science is their
application to dental resin composites as in Filtek
Supreme XT7,10,11
. Nanofill composites are
composed of nanomer or nanocluster, whereas
nanohybrids are hybrid resin composites with
nanofiller in a prepolymerized filler form11. Nanofill
composites are claimed to offer ultimate
esthetics, excellent wear resistance and
strength10
. Surface characteristics of composites
in form of roughness, topography and texture
have been considered as important parameters
of clinical relevance for wear resistance, plaque
retention and discoloration susceptibility. In vitro
studies have indicated that nanofill resin
composites showed favorable mechanical
properties as optical and gloss characteristics,
reduced polymerization shrinkage, higher surface
quality and superior polish18,21
.
Several studies have been made to study the
effects of dental composite’s microstructure on
its properties1,10
. Filler component in term of size,
distribution, geometry and volume fraction have
been investigated extensively1,20
. Fundamental
understandings of the factors that affect the
superior clinical performance of the resin
composites can assist in more refinement of these
materials during manufacturing. Therefore, this
study is aimed to evaluate the effect of different
filler sizes ranged from 100 to 1500 nm and
geometry (spherical and irregular) on the surface
characteristics of experimental resin composite
series. The surface roughness was measured
from both vertical and horizontal dimensions to
give more details on the surface structure of the
composite materials. The null hypotheses stated
that; (a) there are no differences between surface
roughness values of the experimental composite
series, and (b) there is no correlation between
both vertical as well as horizontal surface
roughness parameters and the increase in filler
particle size.
MATERIAL AND METHODS
Eleven series of experimental resin composites
based on different filler particle size formulations
(range of 100-1500 nm) and two geometries
(spherical and irregular) were investigated (Table
1). These series comprised Bis-GMA, UDMA,
TEGDMA resin matrix, 0.33% camphorquinone
and barium glass particles of 56.7% filler volume
fraction. These particulate dispersed phases were
systematically graded in size and treated with a
silane coupling agent
(methacryloxypropyltrimethoxysilane). The
spherical particles were silica and made from
solution, while the irregular particles were ground
glass melts (Ba-Al-B-silicate glass).
Thirty-three disc-shaped specimens (10 mm
Resin-composite Code Filler Particles Matrix Manufacturerseries (Batch #) Size (nm) Shape Wt% Vol%
RZD 102 S-100 100 Spherical 72.3 56.7RZD 107 S-250 250 Spherical 72.6 56.7RZD 106 S-500 500 Spherical 72.6 56.7RZD 105 S-1000 1000 Spherical 72.5 56.7RZD 114 S-100/250/1000 100:250:1000 Spherical 72.0 56.7 Bis-GMA, Ivoclar
(1:1:2) UDMA, Vivadent,RZD 103 I-450 450 Irregular 76.4 56.7 TEGDMA Schaan,RZD 108 I-700 700 Irregular 76.4 56.7 LiechtensteinRZD 109 I-1000 1000 Irregular 76.4 56.7RZD 110 I-1500 1500 Irregular 76.4 56.7RZD 111 I-450/1000 450:1000
(1:3) Irregular 76.4 56.7RZD 112 I-450/700/1000 450:700:1000 Irregular 76.4 56.7
(1:1:3)
Table 1- Experimental composite series formulations
Effect of Filler Particles on Surface Roughness of Experimental Composite Series
J Appl Oral Sci. 2010;18(1):59-6760

26
effectonthesurfaceroughnessparametersoftheresincompositesevaluatedinthis
study.
Opticalproperties
Mundim, Garcia Lda and PiresdeSouza 35 in 2010 assessed the color
changeofthreetypesofcompositeresinsexposedtocoffeeandcoladrinkaswellas
theeffectofrepolishingonthecolorstabilityofthesecompositesafterstaining.The
tested null hypothesis was that there is no difference in the color stability of
compositesafterimmersioninstainingsolutionsandrepolishing.Threecommercial
composite resins currently indicated for esthetic anterior and/or posterior
restorationswereusedinthestudy:Esthet‐X,Denstply(microhybrid);FiltekZ‐250,
3M ESPE (microhybrid) and Surefil, Dentsply (high‐density hybrid). Fifteen
specimens of each composite were fabricated and polishedwith aluminum oxide
discs(Sof‐Lexdiscssequence,3MESPE).ColorwasmeasuredaccordingtotheCIE
(Commision Internationale de l’Eclairage) L*a*b* system relative to CIE standard
illuminantD65, against awhite background (Standard for 45/0 degrees; Gardner
Laboratory) in a reflection spectrophotometer (PCB 6807 BYK Gardner). After
baseline colormeasurement, the specimenswere assigned to three groups (n=5),
each one immersed in a different solution, and subjected to a new color
measurement. Group 1 (control) was immersed in distilled water, Group 2 was
immersedincoffeeandGroup3wasimmersedinacolasoftdrink(Coca‐Cola).After
15 days, specimenswere cleaned properly before the second colormeasurement
with spectrophotometer. Color stability was determined by the difference (∆E)
between the coordinates L*a*b* obtained from the specimens before and after
immersion into the solutions and after repolishing. The means and standard
deviationsofcolorchangewerecalculatedandsubmittedtostatisticalanalysisby3‐
wayrepeatedmeasureANOVAandTukey’stestat5%significancelevel.Theresults
showed no statistical difference among the ∆E values for the different types of
compositesafterstainingor repolishing.Forall composite resins, coffeeproduced
more color change (∆E>3.3), than distilled water and the cola soft drink. After
27
repolishing, the ∆E values of the specimens immersed in coffee decreased to
clinicallyacceptablevalues(∆E<3.3),butremainedsignificantlyhigherthanthoseof
the other groups. In summary, no significant difference was found between
compositeresinsoramongcolorvaluesbeforeandafter repolishingof specimens
immersed indistilledwaterandcola. Immersing samples in coffee causedgreater
colorchangeinall typesofcompositeresinstestedandrepolishingcontributedto
decreasedstainingtoclinicallyacceptable∆Evalues.
Mechanicalproperties
Chung and Greener21 understood that by increasing the content of the
reinforcing filler and development of bulky and rigidmonomer systemswere the
usual methods of producing dental composites for utilization as posterior
restorations. Thus, in 1990, they correlated the degree of conversion, filler
concentration andmechanical properties in highly filleddental composites. Seven
commerciallyavailablecompositeswereusedinthestudy:Marathon‐DentMat,Ful
fill‐L.D.Caulk,Estilux‐Kulzer,Sinterfil‐TeledyneGetz,Occlusin‐ImperialandBis‐
filI‐Bisco.Thepolimerizationreactionofthesecompositeswasmonitorizedwitha
Fourier Transfrom spectrometer. The degree of convertion was calculated by
comparing the absorvance ratio of the aliphatic C=C peak with the unchanged
aromatic ring C=C peak for the pre‐ and post‐polymerized resins. The inorganic
filler content was determined by the gravimetric ashing technique, in which the
differenceinweightiscomparedbeforeandafterashingat700oC.Thedensityofthe
filler was measured pycnometrically. The strength test was performed using an
Instron universal testing machine with a crosshead speed of 0.1‐inch min‐1. The
Knoop hardness test was performed at 24±1oC under a 200 grams load on a
microhardness tester (M12a metallurgical microscope), using a Knoop diamond
indenter.ResultswereanalyzedbyANOVA,Scheffe’stestandPearson’sr‐test.The
degreeofconversionofcompositesrangedfrom43.5–73.8%.Theweightfraction
offillerobtainedwas66.3–85.2%.Thevolumefractionvariedfrom58.2–74.2%.

28
Themean values of the compressive and diametral tensile strengths ranged from
242.3 ‐ 324.7MPa and from 39.8 – 62.6MPa, respectively. The Knoop Hardness
valuesrangedfrom41.8–81.9.Significantcorrelationswereobservedbetweenthe
volumefractionoffillerandthediametraltensilestrength,andbetweenthevolume
fractionoffillerandtheKnoophardnessnumber.Nocorrelationwasfoundbetween
the degree of conversion and any of the mechanical properties of the composite
resinstested.Becauseofthecorrelationsbetweenthevolumefractionoffillerand
the diametral tensile strength, and between the volume fraction of filler and the
Knoop hardness numbers, it was concluded that the filler concentration plays a
prominentroleindeterminingthepropertiesofcontemporaryposteriorcomposite
resins.
Modificationsinthefillersize,morphology,andcomponentshavemarkedly
affected the recent development of composites in the market. Given that filler
morphologyaffectsthefillerloadingrateofcomposites,Kim,Ong,andOkuno14in
2002hypothesizedthata)compositescanbeclassifiedbytheirmorphology,b)filler
loadingisdependentonfillermorphology,andc)fillermorphologyandfillerloading
influencethemechanicalpropertiesofcommerciallyavailablecomposites.Fourteen
commercial composites were evaluated in this study: four composites with pre‐
polymerized particles (Metafil CX, Silux Plus, Heliomolar Radiopaque, Palfique
Estelite), six composites with irregular‐shaped particles (Aelitefil, Charisma,
Herculite XR,Hipolite, TPH,Veridonfil), one compositewithpre‐polymerizedplus
irregularshapedparticles(Photoclearfil)andfourcompositeswithroundparticles
(Pertac‐Hybrid, Z‐100, Palique Toughwell). Scanning electron microscopy and
elemental analysis (FE‐SEM S‐4200 Hitachi Co, Tokyo, Japan) were performed to
evaluate three specimens per composite at X500 magnification. Filler weight
content was determined in three specimens per composite by the standard ash
method: theweight of each samplewasmeasuredwith an analytical balance and
laterheatedinafurnaceat600oCfor30mintoburnouttheorganicmatrixandthen

29
re‐weighted. The final weight consisted only of the inorganic filler, which was
determinedbythefollowingformula:
Fillerwt%=initialweight/finalweightx100%
Thefillervolumefraction(vol%)oftheinorganicfillerwascalculatedasfollow:
Fillervol%=____dr×wt%________x100
dr×wt%+df(100–wt%)
wheredristhedensityoftheresinanddfisthedensityofthefiller.Fourmechanical
propertieswereinvestigated:flexuralstrength,flexuralmodulus,Vickershardness,
and fracture toughness. Flexural strength and flexural modulus were determined
with a 3‐point bending test in a universal testing machine (Model 4202; Instron
Corp, Canton, Mass.) at a crosshead speed of 0.1 mm/min. to determine Vickers
hardness,specimensfromeachcompositewerepreparedintriplicatesanda200‐g
load was applied for 15 seconds (FM‐7; Future‐Tech Co, Tokyo, Japan). To
determine fracture toughness, five single‐edge notch specimens from each
composite were fabricated and at a crosshead speed of 0.1mm/min, a 3‐point
bendingtestwasperformedinauniversaltestingmachine.Eachtestparameterwas
evaluatedwith1‐wayanalysis of variance (ANOVA)andDuncan’smultiple range
testwasused forpost‐hocanalysis (P<.05).The results showed that filler loading
was influenced by fillermorphology. Composites containing prepolymerized filler
particles had the lowest filler content (25‐51% of filler volume), whereas
composites containing round particles had the highest filler content (59‐60% of
filler volume). Themechanical properties of the compositeswere related to their
filler content. Composites with the highest filler by volume exhibited the highest
flexuralstrength(120‐129MPa),flexuralmodulus(12‐15MPa),andhardness(101‐
117 VHN). Fractured toughnesswas also affected by filler volume, butmaximum
toughnesswasfoundatathresholdlevelofapproximately55%fillervolume.

30
Ikejima, Nomoto and McCabe36 in 2003, understood that the most
appropriatekindofmechanical testingregime forevaluatingrestorativematerials
has not been agreed amongst the international community responsible for
developingstandard tests forcompositesproducts.Shear testhasbeenadvocated
as it has certain advantages overmore traditional compressive and flexural tests.
Thepurposeofthisstudywastoidentifytheeffectoffillervolumefraction,particle
sizeandsilanationonshearpunchstrength,flexuralstrengthandflexuralmodulus
of different types of resin composites. Fourteen model resin matrix dental
compositesmanufacturedbyShofu,Inc.Japan,wereusedinthisstudy.Hybridtype
glasswithfillersilanation(0±65.2vol%),compositeswithoutfillersilanation(30.7
±51.0vol%)andmicrofilledtype(0±13.0vol%).Theresinmatrixwasablendof
UDMAandEGDMA.Fortheshearpunchtest,10discspecimenswerepreparedfor
each composite and testedwith a3.2mmdiameterpunchat1mm/min. Flexural
strength (n=10)wasmeasured by the three‐point flexural testing performed at a
test speed of 1mm/min and both flexural strength and flexural modulus were
calculated.Datawereanalyzedusingone‐wayANOVAandFisher'smultiple‐range
test, t‐test and test for correlation/regression. The results showed shear punch
strengthandflexuralstrengthincreasedwithincreasingfillercontentupto52.2%
for hybrid composites and between 0 and 9.1% formicrofilled composites. Shear
punch strength and flexural strength decreased with increasing filler volume
fraction for un‐silanated composites. Flexuralmodulus for allmaterials increased
withincreasingfillervolumefraction.Hybridcompositeswithsilanatedfillershave
significantly higher values of flexural strength, flexuralmodulus and shear punch
strength than equivalentmaterialswith un‐silanated fillers. Accordingwith these
resultsfillersilanationisanimportantfactorfordeterminingmaterialstrengthand
theadditionofsmallquantitiesofmicrofillersappearedtohaveagreatereffecton
shearstrengththansimilaramountsofhybridfiller.Theshearpunchtestmayprove
beneficial for routine testing of composites as specimen preparation was simple,
specimenqualitywaseasytomaintainandtheresultsweremeaningful.

31
Beun,Glorieux,Devaux,VrevenandLeloup16in2007conductedastudy
thatcharacterizedtheinorganicfractionandmeasurdthemechanicalpropertiesof
ninecommercialresinbasedcomposites.Furthermore,thedegreeofconversionof
thephotopolymerizedmaterialswas evaluatedusinghalogen andLEDunits. Two
microfilled (A11‐3M ESPE and Durafill VS‐Heraeus‐Kulzer), three nanohybrids
(Supreme‐3MESPE,Grandio‐Voco,Grandioflow‐Voco)andfouruniversal(Point4‐
Kerr,TetricCeram‐Ivoclar‐Vivadent,Venus‐Heraeus‐Kulzer,Z100‐3MESPE)were
thematerialstestedinthisstudy.Theweightpercentageoffillerswasdetermined
using thermogrametric analysis (TGA/SDTA861, Metler‐Toledo, Switzerland).
Threesamplesofeachmaterialwereanalyzed.Theweightchangeswereevaluated
duringathermalprogramrangingfrom30to900oCattherateof10o/minfollowed
byaircoolingtoroomtemperature.Thecalculatedratiobetweenthe finalsample
weight and its initial weight is designated to the inorganic fraction. The filler
morphology was determined using SEM. The washing technique was used to
removetheunpolymerizedmonomers:0.5gofeachmaterialwasdissolvedin4mlof
acetone and centrifuged for 5 min at 700rpm. This process was repeated three
times and repeated three other times using chloroform for a complete
unpolymerizedresinelimination.Theremainingfillersweresuspendedinethanol,
smearedonaglassslideanddried.Aftergoldcoating,fillerswereobservedbySEM
(Leica Stereoscan S‐260, /Cambridge, UK) at 5000 and 10,000 magnifications.
Furthermore,fivesamplesofeachmaterialwerepreparedandlightcuredusingtwo
conventional curing devices (XL 3000, 3M‐ESPE, St. Paul, MN, USA, 650mW/cm2
followedbymechanicalpropertiesmeasurements:1)Dynamicmodulus:measured
by the impulse excitation technique, 2) Static modulus and flexural strength:
measured using a three‐ point bending setup according to the ISO‐4049, and 3)
Vickersmicrohardness:whichwas carried out on the fractured samples obtained
fromaprevioustestwithaDurimetmicrohardnesstester(Leitz,Wetzlar,Germany).
Thedegreeof conversionwas evaluated in composites samplespolymerizedwith
theXL3000(3M‐ESPE,St.Paul,MN,USA)for40swithanintensityof650mW/cm2
andwiththeEliparFreelight2(3M‐ESPE,St.Paul,MN,USA)for10s.Thedegreeof
convertionwasmeasuredusingtheRamanspectrophotometry.Themeanvaluesof

32
thepercentageoffillersbyweightrangedfrom51.3%fortheDurafillVSto84.1%
fortheGrandio.Ontheotherhand,valuesvariedbetween71‐79.7%forUniversal
hybridcomposites,51.3–54.9%forthemicrofilledcompositesand71.9and84.1%
forthenanofilledcomposites.TheSEMmicrophotographstheZ‐100,Supremeand
Point‐4 showed spherical particles. Irregular shaped particles were found in
Grandio, Grandio flow, Tetric‐Ceram and Venus.Microfilled composites contained
large filler aggregates. Nanofilled resin composites showed higher elastic moduli
than theuniversalormicrofilled composites, except for theZ‐100.For theoverall
mechanicalpropertiesevaluations,themicrofilledcompositesexhibitedthelowest
values.Thedegreesofpolymerizationobtainedwiththehalogenlampwerehigher
than theonesobtainedwith theLED lamp. The significanceof this article is that
nanofilled resin composites show mechanical properties comparable to the
universalhybridcomposites,soitcanbeexpectedtheyareabletoresiststressesat
least as well as the universal composites and could thus be used for the same
indicationsandinanteriorrestorationsduetotheirhighaestheticproperties.
IlieandHickel37in2009analyzedinanlaboratorytestunderstandardized
andsimulatedclinicalconditionseightdifferentmaterialscategoriesofcommercial
composites. Seventy‐two hybrid, nano‐hybrid, micro‐filled, packable, ormocer‐
based and flowable composites, compomers and flowable compomers were
comparedforflexuralstrengthandmodulusofelasticity,compressiveanddiametral
tensile strengthwere evaluated.The followingnull hypotheseswere tested: there
are no differences in the mechanical properties between the eight material
categories,andthebehaviorofthetestedmaterialsissimilarinthethreedifferent
loadingconditions.Theflexuralstrengthandflexuralmodulusweredeterminedina
three‐point bending test (MCE 2000 ST, Germany)with a crosshead speed of 0.5
mm/min. The universal testingmachinemeasured the force during bending as a
functionofdeflectionofthebeamandthebendingmoduluswascalculatedfromthe
slopeof the linearpart of the force‐deflectiondiagram.The compressive strength
anddiametraltensilestrengthweredeterminedwiththeuniversaltestingmachine
anda compressive loadappliedaxiallyat a crossheadspeedof0.5mm/min.Data

33
wereanalyzedusingone‐wayANOVA,TukeyHSDposthoctestandthemultivariate
analysis. Largedifferencesbetween the testedmaterialswithin the samematerial
categorywere found.Thehybrid (116.6MPa),nano‐hybrid (103.1MPa),packable
(105.9MPa)andormocer‐based(104.3MPa)compositesdonotdiffersignificantly
amongeachotherasamaterialtype,reachingthehighestflexuralstrengthvalues.
Nano‐hybrid composites are characterized by good flexural strength, the best
diametral tensile strength but a low flexural modulus. The lowest mechanical
properties were with the micro‐filled hybrids. The flowable composites and
compomers showed comparable result for all properties . Both flowablematerial
categoriesdonotdiffersignificantly fromthemicro‐filledcomposites forthemost
mechanicalproperties,showingonlyahigherdiametral tensilestrength.The filler
volumehad themost influenceon themeasuredproperties, inducing amaximum
flexuralstrengthandflexuralmodulusatalevelof60%,whereassuchdependence
was not measured for diametral tensile strength or compressive strength. The
influenceof the typeofmaterial on themechanicalpropertieswas significantbut
verylow,havingthestrongestinfluenceonthecompressivestrength.
Mesoporousfillers
Samuel,Li,Mukherjee,Guo,Patel,Baran,andWei38in2009studiedthe
mesoporous fillers because of their potential for creating micromechanical
filler/resinmatrixinterphasebondingwhichcouldeliminatetheneedforthesilane
treatment of the filler. They synthesizedmesoporous by using the non‐surfactant
templatingmethod.Theporous silicaused in this study contained interconnected
poresandchannelsasopposedtoporousfillerscontainingsurfacepores.Thenlight
cured experimental resin composites were prepared. For comparision purposes,
experimental dental composites were created using three types of fillers: A.
mesoporoussilicafillers,B.mesoporousandnonporoussilicafillers(500nm)andC.
3‐ methacryloxypropyltrimethoxysilane treated nonporous spherical silica fillers
(500 nm). Compression testingwas performed tomeasure compressive strength,
yield stress, and compressive modulus by using a servohydraulic machine (MTS

34
Mini‐Bionix 2, Eden Prairie,MN) using a cross head speed of 1mm/min. Flexural
strengthandflexuralmodulusofthepostcuredcompositesweredeterminedbya
three point bending test. The results showed that composites containing a
combination of mesoporous and monodisperse spherical fillers have a higher
compressive modulus (8.1±0.5 GPa) when compared with composites that only
contain mesoporous (5.7±0.14 GPa) or MPS silane treated nonporous spherical
fillers (5.7±0.4GPa).Asexpected, theyieldstrength increasedwithan increase in
fillercontent.Compositescontainingacombinationofmesoporousandnonporous
spherical fillers had a significantly higher flexural modulus (10.3±0.8 GPa) when
comparedtothecompositescontainingmesoporousfillersalone(6.7±0.5GPa).The
flexural strength however was not statistically significant. These results showed
that porous fillerswith interconnecting pores are promisingmaterials to prepare
strongerdentalcompositesbut furtherstudiesareneededto find therelationship
between the extent of resin penetration and the final mechanical property of
mesoporousfillerbasedcomposites.
Filleranalysis
Acharya and Greener25 in 1972 studied the effectiveness of
thermogravimetrictechniquesasatoolinthecharacterizationofdentalcomposites
andtofindtheresidual“ash”contentoncompletionofathermallyinducedweight
loss.Also,thethermogravimetrictechniquewasusedtodeterminefluidabsorption
bypolymericmaterialsandtocharacterizepolymersonthebasisofthisparameter.
The six commercially available composite resins investigatedwere designated as:
CR1 (Adaptic, Johnson and Johnson), CR2 (Addent 12, 3M), CR3 (Addent 35, 3M),
CR4‐unfilled polymer (Addent XV, 3M), CR5 (Blendant, Kerr), and CR6 (Concise,
3M). The thermogravimetric apparatus consisted of a vertical cylindrical furnace
that surroundedapyrexhangdown tube that contained theplatinumsamplepan.
Thesamplepanwashungonathinplatinumwireconnectedtothetorquemotorof
theelectrobalance.Thefurnacetemperaturewasraisedlinearlyintherangeof25

35
to 680 OC. The sample was hung about 10mm from the closed bottom end and
samples were pyrolyzed essentially in their own gaseous environment. The
composite samples were prepared according to the manufacturers’ instructions.
Samples from each of the brands were also immersed for 96 hours in Ringer’s
solution(NaCl,KCl,CaCl2,NaHCO3)atroomtemperaturebeforebeingpolymerized.
Theweightlossvs.temperatureforallsixresincompositeswassimilar.Therateof
weightlosswentthroughamaximuminthetemperatureintervalof370to440C.
ThesimilarityoftheTGvaluesofthesixcompositessuggeststhattheyaremadeof
essentiallythesameresinsystem.Theashedweight,whichwastakentobethefiller
weight, varied between 70% and 75% by weight. From pyrolysis and fluid
absorptiondata, itwasconcludedthatbrandsCR4andCR6aredifferent fromthe
otherfourcomposites.
Hosoda, Yamada and Inokoshi24 in 1990 examined composite resins by
scanningelectronmicroscopy(SEM)andbyqualitativeanalysis(EDX)toobtainan
understanding for the appropriate selection for composites resins for clinical use.
Sixty‐six commercially available composite resins were used, which included
twenty‐four chemically‐cured resin composites, twenty‐one light‐cured anterior
resin composites, three light‐cured anterior and posterior composite resins, and
eighteen light‐cured posterior composites. The weight filler contents were
determined for individualmaterials by ashing at 570oC in air. The surface of the
composite resin specimenswas analyzedwith EDX (SED‐880, Seiko EG&G) under
500powermagnification.Whenafewfillerparticles,differentinshapeandshade,
were observed under the SEM, the energy spectra of elements present in the
individualfillerswereobtainedunder3000through5000powermagnification.The
composite resin specimensused forEDXanalysiswere re‐polished to remove the
carboncoating.Aftervapor‐coatingwithgold,thepolishedsurfaceswereexamined
intheSEMwiththeback‐scatteredelectronimagesunder500powermagnification.
Theresultsshowedthattheweightfillercontentofthetraditionalresinspresented
highinorganiccontentsrangingfrom70%to80%.Themicrofilledcompositeresins
showedrelativelylooserquantitiesaround50%.Theheavilyfilledcompositeresins

36
exhibited approximately 85% inorganic contents. The filler content of the other
varied from 60% to 80%. The elements detected in the polished composite resin
surfaceswere Si, Al, Ba, Zr, La, Yb Zn and Ti. Only Si appeared in the traditional
composite resinsurfacesand themicrofiller–filledcomposite resins.Al,Ba,Zr,La,
Ti,Zn,and/orYbappearedintheotherresins.Thefillerparticleshavingradiopacity
contained Ba, Al, Zr, Zn, and/or Yb. The composition SEM images of the polished
surfaces produced by using back‐scattered electrons were divided in five groups
according to the filler typeand theirdistribution:1.Angularquartz fillerparticles
distributed in the matrix (traditional resin composites); 2. Angular‐splintered
microfiller complexes of various sizes incorporated in a microfiller‐reinforced
matrix; 3. Angular‐splintered prepolymerized complexes making up spherical
submicron‐fillerparticlesaddedtoasubmicron‐fillerreinforcedorganicmatrix;4.
Angular‐splinteredprepolymerizedoragglomeratedmicrofilledcomplexesandthe
inorganic fillerparticlesofvarioussizesaredistributed inamicrofiller‐reinforced
composite resinmatrix;5.Sphericalmicrofilledcomplexesand the inorganic filler
particlesareobservedinamicrofiller‐reinforcedmatrix.Basedintheseresults,the
authors proposed to divide the resin composites in five groups with two
hypotheticalcategories:
1.Traditionalcompositeresin:traditionalmacrofiller
2.Microfilledcompositeresin(0.06‐0.04µm)
3.Microfilledtypecompositeresin:
3. Microfiller(0.06‐0.04µm)splinteredmicrofilledcomplex
4. Microfiller(0.06‐0.04µm)agglomeratedmicrofillercomplex
4. Submicrofilled type composite resin: Submicrofiller (0.3‐0.2 µm) splintered
submicrofilledcomplex
5.Hybridcompositeresin:traditionalmacrofillermicrofiller(0.06‐0.04µm)
6.Hybridtypecompositeresin:
a. Traditional macrofiller microfiller (0.06‐0.04 µm) splintered microfilled
complex

37
b. Traditional macrofiller microfiller (0.06‐0.04 µm) spherical microfilled
complex
c. Traditional macrofiller microfiller (0.06‐0.04 µm) agglomeratedmicrofiller
complex
7.Semihybridorheavily‐filledcompositeresin
a. Traditionalmicrofiller(50‐0.1µm)
b. Traditionalsmallfiller(6.5‐0.1µm)
Jaarda,Lang,Wang,andEdwards15in1993initiatedastudytoexaminetwo
methods that would qualify the filler particle content of a composite resin and
quantify the number, size, and area occupied by the filer particle in composite
resins. The experiment was divided in two parts: the first part examined
qualitatively thesizeof the fillerparticlescontained in the threecompositeresins
withtheSEM.Thesecondpartof theprojectusedtheSEMplusdigital imagingto
qualitatively measure the number, size, and area occupied by filler particles in
compositessamples.Threefine‐particlecompositesresins,BIS‐FilI(BISCO),Visio‐
Fil (ESPE‐Premier) and Ful‐Fil (L.D. Caulk) were the materials selected for this
study.Forpartone,sampleswereprepared,suspendedinacetone,centrifugedfor
twominutesat1000rpmtoseparatethefillerparticlesfromthematrixfollowedby
SEMevaluation.Theacetonewashingprocesswas repeated three times.After the
SEM analysis, the remaining filler particleswere placed in chloroform for further
washingandcentrifugedfortwominutesat1000rpmandlaterexaminedbySEM.
Thischloroformwashingwasrepeatedthreetimes.Finallytheremainingfillerwas
suspended in absolute ethanol followed by SEM evaluation. For the second part
sampleswerepreparedandembeddedinEXAKT7200Technovitmedium(EXAKT‐
Kulser, Germany) and preparedwith a series of sandpaper disks and the EXAKT
machining system. Then the surface was carbon‐coated for SEM examination
(AMRAY1000‐BSEM,Bedford,Mass.)anddigitalimaging(PrincetonGammaTech4
Plusdigital imagingsystem)at500Xand5000X.Tocharacterize the fillerparticle
content of the composites studied, seven groups were established with specific

38
filler‐particle size groupings and an eight category for the matrix was added to
provideameasureofthepercentoffillofthecompositeresin:GroupI:0.11‐0.5µm
(0.0094≤0.2µm2), Group II: 0.5‐1.0µm (0.2≤0.8µm2), Group III: 1.0‐2.0µm(0.8
≤3µm2), Group IV: 2‐5µm(3≤20µm2), Group V: 5‐9µm(20≤60µm2), Group VI: 9‐
20µm(60≤300µm2), Group VII: 20µm(300≤µm2), Group VIII: matrix. The results
demonstratedthattherangeofparticlessizesandtheindividualfillerparticlesize
differencesaredramaticallydifferentforeachcomposite.Thetotalmeannumberof
particleswere7991 forFul‐Fil, 6850 forVisio‐Fil, and5033 forBisfil I composite
resins.Ful‐Filwasthemosthighlyfilledcomposite followedbyBis‐Fil IandVisio‐
Fil. No filler particles smaller than 0.11µm in diameter were found in the three
composites. When the seven groups were combined with the matrix, the data
indicatedthatthepercentageoffillforeachcompositewas55.26%fillfortheViso‐
Fil composite, 36.49% for Bis‐Fil I, and 32.14% for Full‐Fil composite. Themean
particlesizewas2.31µm2 forVisio‐Filcomposite,2.08µm2 forBis‐Fil Icomposite,
1.15µm2forFul‐Filcomposite.Itcanbeconcludedthatthethreecompositeswere
significantlydifferent in themeannumber for filler content and in themeanarea
occupied by the filler particles. The conventional classification as fine particle
composite resin could not be justified for the threematerials, and the validity of
suchsystemsasaselectionguidefortheclinicianisquestioned.Characterizingthe
fillerparticlecontentofacompositeresinbyusingtheprofilemapprovedtobea
much better method than the previously used conventional methods of
classification asmicrofilled, fine particle, andblends. SEManddigital imaging are
valid and reliable methods to evaluate composite resins qualitatively and
quantitatively for filler particle numbers, sizes, and the area occupied by the
particles.
In2004,Sabbagh,Ryelandt,Bacheries,Biebuyck,Vreven,Lambrechts,and
Leloup20conductedastudytodeterminethepercentagebyweightoftheinorganic
fillers in thirty‐nine compositematerials (flowable and packable) and to examine
the filler morphology by SEM (scanning electron microscopy). One commercially
light‐cured, one chemically cured resin composites and two resinbasedmaterials

39
knownasOrmocerswere thematerialsused in thisstudy.Thethermogravimetric
analysis was used to determine the percentage of fillers by weight using a
thermogravimetric analyzer (Perkin‐ Elmer TGA‐7). Three specimens of each
materialwereheatedatarateof30˚Cmin‐1 from30to900˚C.Thepercentagesof
inorganic fillersbyweight (n=3)was alsodeterminedby the ashing techniqueby
comparingtheweightdifferencebeforeandafterashinginair0.5gofeachmaterial
at900˚C.Thesampleswereintroducedintoafurnaceforanhourandthenweighted
using an analytical balance. For the SEM, the unpolymerized monomers were
removed by a washing technique. Each sample was dissolved in acetone and
centrifugedfor5minat700g.Thisprocesswasrepeatedthreetimesusingacetone
andthreeothertimeswithchloroformfollowedbywashingandeliminationofthe
unpolymerized resin. The remaining filler particles including the prepolymerized
fillerswereplacedinethanolandthesuspensionoffillerparticleswassmearedona
glassslideanddriedat37˚for6hours.Then,athincoatingofgoldwassputteredon
thefillerbearingslides.Morphologicalexaminationwasperformedusingascanning
electronmicroscopeoperatingat20kV.Theresultsshowedthattheweightfraction
of inorganic fillers ranged between 41.6% and 84.6% and a wide variation was
foundamongmaterialsofthesamecategory.Insomematerials,thevaluesrecorded
weredifferentfromthosegivenbythemanufacturers.TheSEMphotomicrographs
showed various shapes, and sizes of inorganic fillers. When comparing universal
hybridmaterialswithflowablescomposites,theflowableshavelowerfillerloading
and packable resin composites did not show higher values as claimed by some
manufacturers.Somefactorscouldexplaintheobserveddiscrepanciesbetweenthe
manufacturer’s data and their results. The silane treatment as well as the
incorporation of organicmaterial as part of the fillers of the composite could be
responsibleforthosedifferences.

40
NewtechnologyinResin–basedcomposites
Nanocomposite
Mitra, Wu and Holmes9 in 2003 conducted a study that reported the
developmentofanewdentalnanocomposite,FiltekSupremeUniversalRestorative
(3MESPEDental products) that has the esthetic properties required for cosmetic
restorations and the mechanical properties necessary for posterior restorations.
Theymeasuredthenanocompositepropertiesandtheywerecomparedwiththose
of several commercial composites. They synthesized two types of nanofiller
particles for this investigation: nanomeric particles and nanoclusters. The
nanomeric particles aremonodisperse nonaggreagted and nonagglomarated silica
nanoparticles. The silica particles were treated with the coupling agent 3‐
metacryloxypropyltrimethoxysilaneorMPTStomakethefillercompatiblewiththe
resin before curing to prevent agglomeration or aggregation. Two types of
nanoclustersweresynthesized:Zirconiasilicaparticleswhoseparticlesizeranged
between 2‐20nm with spheroidal particles with and average size of 0.6µm. The
other type of nanocluster filler was a silica particle of 75nmwith another broad
particlesizewitha0.6µmaverage.Theresinsystemusedwasthesameproprietary
mixture used in Filtek Z250 Universal restorative composite (3M ESPE). Using
statistically designed experimentation methodology, many combinations of
nanocluster and nanomeric fillers were studied to determine an optimal
formulation.The commercialmaterials testedwereFiltekA110 (3MESPE), Filtek
Z250 (3MESPE),TPHSpectrum(DenstplyCaulk),EsthetX (DenstplyCaulk),Point
4(Kerr),FiltekSupremestandard(3MESPE),andFiltekSupremeTranslucent(3M
ESPE). The properties they studied were compressive strength and diametrical
tensile strength (Instron 4505), in vitro three‐bodywear (Profilometer), Flexural
strength(three‐pointbending),fracturetoughness,polishretention(micro‐tri‐gloss
instrument,BYK‐Gardner,Columbia,Md)andsurfacemorphologyaftertoothbrush
abrasion (SEM analysis). The statistical analysiswas performed by an analysis of
variance, or ANOVA/Tukey‐Kramer paired analysis at a ninety‐five percent

41
confidence interval. The compressive and diametral strengths and fracture
resistance of the nanocomposite were equivalent to or higher than those of the
othercompositestested.Thethree‐bodywearresultsofthenanocompositessytems
developedwerestaticallybetterthanthoseoftheallothercompositestested.The
nanocompositeshowedbetterpolishretention thanthehybridsandmicrohybrids
testedforallthebrushingperiods.Afterextendedtoothbrushabrasion,thedentin,
body and enamel showed polish retention similar to that of the microfill tested,
while translucent shades showed better polish retention than the microfill. In
summary, combinations of these two types of nanofillers resulted in the best
combination foran improvedphysicalproperty.With thecombinationof superior
esthetics, long‐termpolish retentionandotheroptimizedphysicalproperties, it is
expectedthatthisnovelnanocompositesystemwouldbeusefulforallposteriorand
anteriorrestorativeapplications.Furtherclinicalstudieswillbeneededtoconfirm
theseinvitrofindings.
Newresin‐basedcompositeswithnanofillershavebeencommercializedthe
last decade. Whilemanufacturersmake claims of improved clinical performance
and characteristics little evidence is available that suggests thesematerials show
improvementsoverothermaterialsalready in themarket.YesilZ,AlapatiS,and
Johnston,39 in 2008 evaluated the relative wear resistance of 2 nanofilled
composites (FiltekSupreme,Premise)with the traditionalmicrofilled (Heliomolar
RO)andmicrohybrid(Point4)resincomposites.Sixspecimensofeachcomposite
materialwere subjected to a 3‐bodywear tests using theOregonHealth Sciences
UniversityOralWearSimulatortoproduceabrasivewearandattrition.Theenamel
cuspisforcedintocontactwiththecompositespecimenthroughalayeroffoodlilke
slurry.Thecuspimpartsaninitial20‐Nloadtothecompositeandisslidacrossthe
surfaceoveran8mmlinearpath.Attheend,astatic70‐Nloadisappliedtoproduce
localizedattritionwearwithasequenceof1.0Hzfor50,000cycles.Theamountof
abrasion and attrition was measured using a profilometer (Surfanalyzer; Mahr
Federal, Inc, Providence, RI). Profilometric tracing were performed at 1 mm
incrementsfromtheheadofthewearpatterntothetail.Todeterminetheaverage

42
roughness of wear facet, an additional profilometric tracing was made along the
entire length of the wear facet. 1‐way ANOVA and Tukey multiple range test
compared the wear and surface roughness data. The size of the wear facets was
assessedtodeterminetherelativewearoftheantagonistenamelcusps.SEMimages
were made to qualitatively assess the surface characteristics after testing. The
resultsindicatethatthecompositeresintypedidnotinfluencetheoverallattrition
wear rate of thematerial, but did significantly affect abrasivewear. Themicrofill
material exhibited significantly less abrasive wear than the nanohybrid material.
Also,nosignificantdifferencewasfoundintheaveragesizeoftheopposingenamel
wearfacetgeneratedbythedifferentcompositesmaterials.Themicrofilledmaterial
resulted in a significantly rougher surface within the wear facet than either
nanohybrid or microhybrid composites but was not significantly different than
nanofilledcomposites.Inconclusion,theincorporationofnanofillersdidnotresult
insignificantlyimprovedinvitroabrasiveorattrition/wearinthematerialstested.
Chen40 in 2010 reviewed recent studies of the development of dental
nanocompositesandtheirclinicalapplications.Nanocompositesallowforincreasing
filler loading and a reduced amount of resin matrix, thereby reducing
polymerization shrinkage while providing esthetics and strength. Many
nanocomposites are in the market, and some of them are: Filtek Supreme (3M
ESPE), Premise (Kerr/Sybron) and Ceram‐X (Denstply DeTrey). Nanocomposites
canbe strengthenedby theadditionof reinforced fillerswithnanofibers, shortE‐
glassfibers,andTiO2nanoparticles.Ion‐releasingnanocompositescanalsobeused
to increase themineral content of dental caries lesions by the use of nano‐DCPA
whiskers or TTCP‐whiskers for releasing Ca and PO4 ions, by the use of calcium
fluoridenanoparticlesforfluoriderelease,orbytheuseofbothcalciumfluorideand
DCPAforF,Ca,andPO4release.Polymer‐kaolinitenanocompositescanalsorelease
fluoride, and C (Kacrylamide) might be a useful material for caries prevention.
Nanocomposites with a ring‐opening resin matrix can reduce polymerization
shrinkagebytheuseofepoxy‐polyols,orbytheuseofSilorane(3M‐ESPE),whichis
generatedbythecationicring‐openingpolymerizationofthecycloaliphaticoxirane

43
moieties, or by the use of epoxy resin ERL 4221 or SSQ monomers. Different
approaches have been used to prevent nanoparticles from forming microscopic
aggregation during processing. The same silica fillers are coated with MPTS (3‐
methacryloxypropyltrimethoxysilane) to avoid particles aggregation and promote
interfacialadhesion throughcovalentandH‐bonding.Silica fillerscanbemodified
by OTMS (n‐octyltrimethoxysilane), a non‐reactive aliphatic silane, to interact
throughweakVanDerWaalsforces.Thesilanestructureusedforthesilanizationof
nanosilicahasaneffectonsolventabsorptionandthesolubilityofcomposites.The
composite containing UDMS (3‐[(1,3(2)‐dimethacryloyloxypropyl)‐2(3)‐
oxycarbonylamido]prop‐yltriethoxysilane)showedthehighestamountofabsorved
water, the compositewithOTMS showed thehighest solubility in bothwater and
ethanol/water.GPS (γ‐glycidoxypropyl trimethoxysilane)canbeusedasacouplin
agent in nanocomposites with epoxy resin matrix. ATES: (organosilane
allytriethoxysilane)increasethedispersionandlinkageofTiO2nanoparticleswithin
the resin matrix. There are several commercial nanocomposites that have good
strengthafter1dayofimmersioninwater.However,theirstrengthcandecreaseby
more than 50% after just a couple of months of immersion; therefore, strength
durabilityisanimportantissue,especiallyinion‐releasingcomposites.Overall,the
development of nanocomposites has led to significant improvements in dental
materials and their clinical applications. However, more improvement in the
properties of nanocomposites needs to be done, so it is worthwhile to continue
furtherresearch.
Silorane
IlieandHickel10in2006conductedastudytoexaminethecharacteristics
of a silorane‐basedcompositematerial in termsofdegreeof cureandmechanical
propertiesasafunctionofdifferentcuringconditionsandcomparethemwiththose
of well known methacrylate based composites when examined under equivalent
curingconditions.Thecuringbehaviorofasiloranebasedcomposite(Hermes,3M
ESPE) shade A3 was evaluated by assessing the degree of cure and variation of

44
hardnessandmodulusofelasticitywithdepthafterpolymerizingthematerialwith
16 curing regimes comprising one halogen and three LED‐curing units. One
incrementofcompositeinamold2mmhighand4mmdiameterand3increments
ina6mmhighmoldwereusedtoevaluatethedegreeofcure.Measurementswere
madeinrealtimewithanFTIRspectrometerwithanATRaccessoryfor20minutes
at thebottomof thesamples.Toanalyze thepolymerizationqualityhardnessand
modulus of elasticity profiles the middle of the samples were measured and
calculated for each group as a curve‐fitted line, based on data from five samples
(300measuringpoints).Resultswerethencomparedusingaone‐wayANOVAand
Tukey’sHSDposthoctest.Theresultsshowedhighestirradiancewasmeasuredfor
the halogen curing unit, Astralis 10 (1857 mW/cm2), whereas LED curing units,
MiniLED,Freelight2,andBluephase,withanarrowbandspectraloutput,achieved
irradiances of 1141 mW/cm2, 1226 mW/cm2, and 1435 mW/cm2 respectively.
Highest decrease rate of irradiance with distance was observed for the halogen
curingunit,whereasthatoftheLEDcuringunit,MiniLED,waslessthanaquarterof
Astralis 10's in the first fivemillimeters.No significant differences (p<0.05)were
foundamongthecuringunitsregardingthedegreeofcureat2‐mmdepth‐withthe
exceptionofMiniLEDPulseregime.At6‐mmdepth,nosignificantdifferencesinthe
degreeofcurewereobservedforthe10‐secondpolymerizationtime.However,with
the 20‐second and 40second regimes, curing units with a turbo tip yielded
significantly lower DC than the curing units with a standard tip. Themechanical
propertiestendedtodecreasewithdepth.However,nosignificantdifferenceswere
observedbetween2‐mmand6‐mmdepthswithinoneregime,orbetweendifferent
curing regimes. At 2mm, no such correlationwas found between polymerization
time and mechanical properties, and that irradiance did not correlate with any
measured property. At 6‐mm depth, the influence of polymerization time on the
degree of cure and mechanical properties increased. A silorane composite and a
representativecommercialmethacrylate‐basedcomposite(TetricEvoCeram)were
curedunderthesameconditions.Nodifferenceswereregisteredbetweenthetwo
categoriesofmaterial in termsof hardness.However,modulusof elasticity of the
siloranematerialwasslightlylowerandthecreepresistancehigherwhencompared

45
with themethacrylate‐based composite. The study presented appropriate sample
sizes for each group. The methodology should provide more details on the
comparison of silorane and methacrylate based composites. In addition, the
hypothesisandclinicalsignificancesshouldbeaddressed.
LienandVandewalle3 in2010 realized that the introductionof a silorane‐
basedcompositeopensnewideasinthequesttoreducepolymerizationshrinkage
and to balance volumetric stress caused by the behavior of polymerization
contraction. The purpose of their study was to determine and to distinguish the
unique physical properties of a new‐silorane based restorative material in
comparison to five methacrylate‐based restorative materials consisting of a
compomer, giomer, nanocomposite, hybrid, and micro‐hybrid. Six restorative
materialswereselected:FiltekLS ‐3MESPE(silorane‐based),Beautiful II–Shofu
(giomer),DyractExtra–Denstply(Compomer),EsthetX–Denstply(Microhybrid),
FiltekSupreme–3MESPE(Nanocomposite),andFiltekZ250–3MESPE(Hybrid).
Diametral tensile strength (universal testingmachine and crosshead speed of 1.0
mm/min),compressivestrength(universaltestingmachineandcrossheadspeedof
1.0 mm/min), flexural strength and flexural modulus (three‐point bending test
using universal testing machine, crosshead speed of 0.25 mm/min), fracture
toughness (single‐edge notched‐beam method, UTM and crosshead speed of
1mm/min),knoopmicrohardness(diamondindenter,LM300ATLeco,witha200g
load and a 10s dwell time), and polymerization shrinkage (video‐imaging device,
AcuVol, Bisco) were the properties examined. The mean and standard deviation
were determined per group and one‐way ANOVA/Tukey was performed per
property.Theresultsshowedthatthehybridmaterialhadthehighestcompressive
strength, which was not significantly different from the nanocomposite, and the
silorane–based composite had the lowest compressive strength. There was no
significant difference between any of the restorative materials for the diametral
tensilestrengthtest.Thehybridresin‐compositehadthehighest flexuralstrength,
whichwasnotsignificantlydifferentfromthesilorane‐basedcomposite.Themicro
hybrid had the lowest flexural strength. The giomer and the silorane materials

46
showed the highest flexuralmodulus. On the other hand, the nanocomposite and
microhybrid had the lowest flexural modulus. None of the materials showed a
significantdifferencerelatedtothefracturetoughnessexceptthecompomer,which
hadthelowestvalue.Thehybridmaterialhadthehighestmicro‐hardnessfollowed
by the hybrid composite and the giomermaterial. Thematerials with the lowest
micro‐hardnessvalueswerethecompomerandmicrohybridcomposite.Finally,for
thevolumetricshrinkageproperty,thecompositematerialsthatshowedthelowest
shrinkagewerethesiloraneandnanocomposite,andthecompositematerialswith
thehighestshrinkagevalueswerethemicrohybridandcompomer.
Marchesi, Breschi, Antoniolli, Di Lenarda, Ferracane and Cadenaro41 in
2010wereconcernedaboutthevolumetricshrinkageandsubsequentcontraction
stress arisingduring thepolymerization reactionof the resin‐based tooth colored
restorative materials. They measured the contraction stress of a silorane‐based
material and a new low‐shrinkage nanohybrid composite compared to three
conventional dimethacrylate‐based resin composites during photo‐polymerization
with a halogen curing light using a universal testing machine provided with a
feedbacksystemandstressanalyzerwithnofeedback.Thehypothesestestedwere:
1.Thesilorane‐basedandthelow‐shrinkagenanohybridcompositesdeveloplower
contraction stressduringphoto‐polymerization than conventionaldimethacrylate‐
basedrestorativematerials irrespectiveofthestresstestingmethodand2.Testing
systemaffectsthemeasuredstressvalues.ThematerialstestedwereFiltekSilorane
LS ‐ 3M ESPE (silorane), Venus Diamond ‐ Heraeus Kulzer (low shrinkage
nanohybrid), Tetric EvoCeram ‐ Ivoclar Vivadent (nanohybrid), Quixfil ‐ Dentsply
DeTrey (packable), andFiltekZ250 ‐3MESPE(universalmicrohybrid).Shrinkage
stress was assessed using a stress‐strain analyzer consisting of two opposing
attachments,oneconnectedtoaloadsensorandtheotherfixedtothedevice,ora
system fixed to a universal testing machine with an extensometer as a feedback
system.Allspecimenswerepolymerizedwithaquartz‐tungstenhalogencuringlight
for 40s; the contraction force generated during polymerization was continuously
recorded for300s.Contraction stress (MPa)was calculatedatboth40sand300s.

47
Data were statistically analyzed by three‐way ANOVA and Tukey's multiple
comparison test. The results showed that Venus Diamond exhibited the lowest
stressunderbothexperimental conditions. Stressvalues scoredas follows:Venus
Diamond<TetricEvoCeram<FiltekSiloraneLS<Quixfil<FiltekZ250(p<0.05).Stress
valuesmeasuredwiththestress‐strainanalyzerweresignificantlylowerthanthose
measured with the universal testingmachine with feedback. The hypothesis was
partially rejected because onlyVenusDiamond exhibited the lowest stress values
amongthetestedmaterials.Contractionstresswashigherforallcompositeswhen
measuredinatestsystemwithafeedback.Thisstudyconfirmsthatsimplyreducing
theshrinkagedoesnotensurereducedstressdevelopmentincomposites.
Ormocerbasedcomposites
Leprince, Palin, Mullier, Debaux, Vreven and Lepoud42 in 2010 were
concerned information of a new inorganic‐organic resin type thatwas developed
many years ago for the polymer industry and has subsequently been adapted for
dentaluse,knownasORMOCER‐basedcompositewasnotwidelyreported.Ormocer
technology consist of an organic reactive species which is bound by the in situ
formationofa inorganic(Si‐O‐Si)network,whichmayresult inreducedshrinkage
ranging from 1.46 to 2.64 vol%, depending on the material and measurement
method.Theaimofthisstudywastocharacterizetheinorganicfractionofmaterials
belonging to each type of composite and to compare theirmechanical properties.
Eightresincompositeswereincludedinthisstudy:twoOrmocers(Admiraandan
experimentalOrmocerV35694),onesilorane(FiltekLS)andfivemetacrylate‐based
composites (Filtek Supreme XT, Tetric EvoCeram, Grandio, Synergy D6 and one
experimental material V34930). Inorganic fillers were quantified by
thermogravimetric analysis and morphologically characterized by SEM. The
mechanical propertiesmeasuredwere: dynamicmodulus, staticmodulus, flexural
strength and Vickers microhardness. Dynamic modulus was determined by an
impulseexcitationtechnique,staticelasticmodulusandflexuralstrengthbyathree‐
point bending method and Vicker microhardness with a Durimet microhardness

48
testerand200‐gload.TheresultswereanalyzedusingANOVAtests(P<0.05)and
linear correlation. Grandio (84.3 vol%), V34930 (86.7 vol%) and V35694 (86.5
vol%) exhibited significantly higher fillermass fractions. Both dynamic and static
moduliofGrandio(24.9GPaand9.2GParespec.)andV34930(25.7GPaand9.0GPa
respec.)weresignificantlyhigher than theothermaterials (P<0.05),althoughno
significantdifferenceinflexuralstrengthwasobservedbetweenmaterialtype(P>
0.05).Fromthepresentfindings, itwassuggestedthatV35694andFiltekSilorane
exhibit comparable properties to conventional methacrylate‐based composites,
although clinically the cavity type and locationmust guidematerial choice.Under
high occlusal load, the use of Grandio and V34930 might be favored. For small
cavities, alternative technologies could be preferred as the need for mechanical
resistanceislowerandthepotentialforstressgenerationisgreater.

49
REFERENCE
1. Mjor IA, Jokstad A, Qvist V. Longevity of posterior restorations. Int Dent J1990;40(1):11‐7.
2. BogackiRE,HuntRJ,delAguilaM,SmithWR.Survivalanalysisofposteriorrestorationsusinganinsuranceclaimsdatabase.OperDent2002;27(5):488‐92.
3. Lien W, Vandewalle KS. Physical properties of a new silorane‐basedrestorativesystem.DentMater2010;26(4):337‐44.
4. Rueggeberg FA. From vulcanite to vinyl, a history of resins in restorativedentistry.JProsthetDent2002;87(4):364‐79.
5. WeinmannW,ThalackerC,GuggenbergerR.Siloranesindentalcomposites.DentMater2005;21(1):68‐74.
6. CollinsCJ,BryantRW,HodgeKL.Aclinicalevaluationofposteriorcompositeresinrestorations:8‐yearfindings.JDent1998;26(4):311‐7.
7. Ferracane JL. Buonocore Lecture. Placing dental composites‐‐a stressfulexperience.OperDent2008;33(3):247‐57.
8. Ausiello P, Apicella A, Davidson CL. Effect of adhesive layer properties onstress distribution in composite restorations‐‐a 3D finite element analysis.DentMater2002;18(4):295‐303.
9. MitraSB,WuD,HolmesBN.Anapplicationofnanotechnology inadvanceddentalmaterials.JAmDentAssoc2003;134(10):1382‐90.
10. IlieN,HickelR.Silorane‐baseddentalcomposite:behaviorandabilities.DentMaterJ2006;25(3):445‐54.
11. BayneSC,HeymannHO,SwiftEJ,Jr.Updateondentalcompositerestorations.JAmDentAssoc1994;125(6):687‐701.
12. WillemsG, LambrechtsP,BraemM,Celis JP,VanherleG.A classificationofdental composites according to their morphological and mechanicalcharacteristics.DentMater1992;8(5):310‐9.
13. Ferracane JL. Current trends in dental composites. Crit Rev Oral Biol Med1995;6(4):302‐18.
14. KimKH,OngJL,OkunoO.Theeffectoffillerloadingandmorphologyonthemechanical properties of contemporary composites. J Prosthet Dent2002;87(6):642‐9.
15. JaardaMJ,LangBR,WangRF,EdwardsCA.Measurementofcompositeresinfillerparticlesbyusing scanningelectronmicroscopyanddigital imaging. JProsthetDent1993;69(4):416‐24.
16. Beun S, Glorieux T, Devaux J, Vreven J, Leloup G. Characterization ofnanofilled compared to universal and microfilled composites. Dent Mater2007;23(1):51‐9.
17. Lutz F, Phillips RW. A classification and evaluation of composite resinsystems.JProsthetDent1983;50(4):480‐8.
18. Ardu S, Braut V, Uhac I, et al. A new classification of resin‐based aestheticadhesivematerials.CollAntropol2009;34(3):1045‐50.

50
19. Lang BR, Jaarda M, Wang RF. Filler particle size and composite resinclassificationsystems.JOralRehabil1992;19(6):569‐84.
20. Sabbagh J, Ryelandt L, Bacherius L, et al. Characterization of the inorganicfractionofresincomposites.JOralRehabil2004;31(11):1090‐101.
21. Chung KH, Greener EH. Correlation between degree of conversion, fillerconcentration and mechanical properties of posterior composite resins. JOralRehabil1990;17(5):487‐94.
22. KhanAM,SuzukiH,NomuraY, et al.Characterizationof inorganic fillers invisible‐light‐cured dental composite resins. J Oral Rehabil 1992;19(4):361‐70.
23. Tyas MJ, Jones DW, Rizkalla AS. The evaluation of resin compositeconsistency.DentMater1998;14(6):424‐8.
24. HosodaH,YamadaT, Inokoshi S. SEMandelemental analysis of compositeresins.JProsthetDent1990;64(6):669‐76.
25. AcharyaA,GreenerEH.Thermogravimetricanalysisofcompositerestorativeresins.JDentRes1972;51(5):1363‐8.
26. Rodrigues SA, Jr., Scherrer SS, Ferracane JL, Della Bona A. Microstructuralcharacterization and fracture behavior of a microhybrid and a nanofillcomposite.DentMater2008;24(9):1281‐8.
27. LuH,LeeYK,OguriM,PowersJM.Propertiesofadentalresincompositewithasphericalinorganicfiller.OperDent2006;31(6):734‐40.
28. Goncalves F, Kawano Y, Braga RR. Contraction stress related to compositeinorganiccontent.DentMater2010;26(7):704‐9.
29. Satterthwaite JD,VogelK,WattsDC.Effectof resin‐composite fillerparticlesizeandshapeonshrinkage‐strain.DentMater2009;25(12):1612‐5.
30. HerreroAA, YamanP,Dennison JB. Polymerization shrinkage anddepth ofcureofpackablecomposites.QuintessenceInt2005;36(1):25‐31.
31. LimBS, Ferracane JL, Condon JR, Adey JD. Effect of filler fraction and fillersurface treatment on wear of microfilled composites. Dent Mater2002;18(1):1‐11.
32. RodriguesJuniorSA,ZanchiCH,CarvalhoRV,DemarcoFF.Flexuralstrengthandmodulusofelasticityofdifferent typesofresin‐basedcomposites.BrazOralRes2007;21(1):16‐21.
33. Kaleem M, Satterthwaite JD, Watts DC. Effect of filler particle size andmorphology on force/work parameters for stickiness of unset resin‐composites.DentMater2009;25(12):1585‐92.
34. MarghalaniHY.Effectoffillerparticlesonsurfaceroughnessofexperimentalcompositeseries.JApplOralSci2010;18(1):59‐67.
35. MundimFM,GarciaLdaF,Pires‐de‐SouzaFdeC.Effectofstainingsolutionsand repolishing on color stability of direct composites. J Appl Oral Sci2010;18(3):249‐54.
36. IkejimaI,NomotoR,McCabeJF.Shearpunchstrengthandflexuralstrengthof model composites with varying filler volume fraction, particle size andsilanation.DentMater2003;19(3):206‐11.
37. IlieN,HickelR.Investigationsonmechanicalbehaviourofdentalcomposites.ClinOralInvestig2009;13(4):427‐38.

51
38. Samuel SP, Li S, Mukherjee I, et al. Mechanical properties of experimentaldental compositescontainingacombinationofmesoporousandnonporoussphericalsilicaasfillers.DentMater2009;25(3):296‐301.
39. YesilZD,AlapatiS,JohnstonW,SeghiRR.Evaluationofthewearresistanceofnew nanocomposite resin restorative materials. J Prosthet Dent2008;99(6):435‐43.
40. ChenMH.Updateondentalnanocomposites.JDentRes2010;89(6):549‐60.41. MarchesiG,BreschiL,AntoniolliF,etal.Contractionstressoflow‐shrinkage
composite materials assessed with different testing systems. Dent Mater2010;26(10):947‐53.
42. Leprince J, Palin WM, Mullier T, et al. Investigating filler morphology andmechanical properties of new low‐shrinkage resin composite types. J OralRehabil2010;37(5):364‐76.

52
CHAPTERII
AbstractObjectives: To determine the filler content by weight percentage of four resin
compositesandtoexaminethemorphology,sizeandelementaldistributionof the
fillerparticles.
Methodsandmaterials:Fourcommerciallyavailablelight‐curedresincomposites
(Kalore, Filtek LS, Aelite LS and IPS Empress Direct) were evaluated for filler
content by weight using ashing in air and acetone dissolution techniques. Ten
specimens,0.5geach,wereanalyzed foreachmaterialand technique. Specimens
for ashing were heated to 650oC for 30 min. For the acetone dissolution, the
specimenswere dissolved, centrifuged and decanted. In addition, SEM evaluation
and Energy Dispersive X‐ray Spectroscopy (EDS) analysis were performed to
determine morphological characteristics and elemental distribution, respectively.
Filler percentages were compared against manufacturer’s data and statistically
analyzedbyoneway‐ANOVA,PearsonCorrelation,TukeyMultipleComparisonand
Independentt‐tests.
Results: Filler percentage by weight for Aelite LS, Filtek LS, Empress Direct and
Kalore from ashed in air were: 86.44%, 77.86%, 72.17 and 70.62%, and from
acetonedissolutionwere:85.05%,75.56%,78.88%and77.73%,respectively.Mean
values for all materials were significantly different for both ashing and acetone
dissolution. Aelite LS had significantly higher filler content for both techniques.
Kalorehad significantly lower filler content for ashing (70.62%)andFiltekLS for
acetone dissolution (75.55%). Manufacturer reported filler content for Aelite LS
(88%) and Filtek LS (76%) approximated the study results for both techniques,
while Kalore (82%) and IPS EmpressDirect (79%)were only similar for acetone
dissolution, indicating higher content of prepolymerized particles. Morphological
examination showed spherical shaped particles for Aelite LS and splintered and
irregularshapedparticlesforallothermaterials.

53
Conclusions: Aelite LS had the highest filler content for both ashing and acetone
dissolution.Values for filler contentbyweightusing theacetonedissolutionwere
closertomanufacturerreportedvalues.
Introduction
Thedevelopmentofresincompositetechnologyforrestorativedentistrywas
one of themost significant contributions to dentistry in the last century. Initially,
they were widely used by dentists for restoring anterior teeth. However, the
growingdemandofthepatientsforaestheticrestorationsandtheirconcernabout
mercurycontainingalloys,haspromotedtheirusedasasubstituteforamalgamin
posteriorteeth1,2.
Sincetheveryfirstdentalresincompositesweredeveloped,manyeffortsto
improve their clinical performance have been undertaken. Researchers have
suggested that filler content, size, andmorphology of the filler particles within a
composite resin formulation, has the potential to influence the strength, elastic
modulus, wear resistance, color matching and polymerization shrinkage of a
compositeresin3‐8.Inadditiontheyhavereportedthatincreasingthefillerparticle
size will effectively modify not only the pattern and rate of wear, but the
restoration’spolishabilityaswell.Ithasalsobeenstatedthatthegreaterthesizeof
the particle, the greater the potential for wear, which in turn affects mechanical
properties of composites 3, 8‐10. Thus it would seem reasonable to expect more
studies reporting correlations between mechanical properties and filler particle
morphologyandsize.Perhapsthelackofsomeinvestigationsisduetothedifficulty
in determining the exact size of the filler particles within a composite resin11.
Furthermore, attempts to improve clinical performance and to decrease
polymerization stress ofmethacrylate‐based compositeshavebeen focused in the
developmentofnewmonomers,suchasring‐openingsiloranechemistry12‐14;anda
newfillertechnology,suchasnano‐sizedparticles7,15,16.

54
Severalmethodshavebeensuggestedtodeterminethefillerloadinginresin‐
based composites. Ideally, filler loading should not vary with the different test
methods.However,differentresultshavebeenreportedbyvaryingthetestmethod
amongresin‐basedcompositematerials.Factors likeorganicmatrixand inorganic
fillersaswellassilanecoatingandprepolymerizedparticleshavebeenreportedto
influence the filler content results of thesematerials. Actually, themost routinely
usedmethodsare:1.manufacturer’s reporteddata;2. thermogravimetric analysis
(TGA);or3.ashinginair8‐10,17‐19.
No studieshave reportedmeasuring filler contentbyweightorvolume for
currentcommercialcompositesusingatechnique,whichpreservesprepolymerized
particlestodeterminefillercontent.Thereisnostandardprocedureforverifyinga
manufacturer’sreportoffillerloadingexcepttheleastexpensivemethodofashing
in air. With ashing techniques, the temperature and time of exposure can vary
greatly.Previousstudieshaveusedtemperaturesrangingfrom570to1125oCand
times of 20 to 60minutes3, 8‐10, 20. From this data, it could be concluded that the
organicresinmatrixcanbeeffectivelyburnedoffata temperatureof650oC in30
minutes.
Scanningelectronmicroscopy(SEM)oftenusesadissolutiontechniquewith
acetoneorethylalcoholtoremovetheorganicmatrixfrominorganicfillers3,8‐10,20‐
23. According tosomemanufacturersashing inair techniquecanburnoffsomeof
thefillercontentofcompositesandthusgivefalseresults.Tocombatthisproblema
separation of the matrix and filler using acetone or ethyl alcohol needs to be
explored. It is hypothesized that a solvent such as acetonewill not break down
prepolymerized filler, silane, agglomerates, or clusters from composite
formulations.
Purpose:Theaimofthisstudywastodeterminethefillerpercentagebyweightof
fourdifferent resin compositesusing ashing in air andacetonedissolution and to
examinethemorphologyofthefillerparticleswithSEMandEDSanalysis.Thenull

55
hypotheses tested were that there was no difference in filler percent by weight
content using ashing in air and acetone dissolution techniques, the percent filler
content by weight of selected composites using the ashing by air and acetone
dissolutiontechniquesweresimilartomanufacturer’sdataandthattherewasnot
significantdifferenceofthefillermorphologyandsizeofeachcompositeunderSEM.
MaterialsandMethods:Fourcommerciallyavailablelight‐curedresincomposites
(listed in Table 1)were chosen based on their filler content by particle size, and
evaluated in this study for filler content by weight percentages. In addition, EDS
analysis and SEM morphological characterization were performed on the filler
particles. Ten specimens (n=10)were analyzed for eachmaterial and technique.
Fillerpercentagesobtainedwerecomparedagainstmanufacturer’sdata.
Table1.Compositesexaminedinthisstudy
1.Percentageoffillersbyweightusingashinginair
Thefillercontentsoftheselectedcompositesweredeterminedbyusingan
ashinginairtechnique.Ten(n=10)0.5gspecimensofeachcompositewereplaced
inaburnoutfurnaceat1200oF(Neymatic101, JMNeyCompany,Bloomfield,CT).
All crucibleswere cleanedwith cavicidewipes. Each cruciblewasweighed empty
and then weighed after specimen loading. The crucibles (high alumina, 10 mL,
Brandname Fillertype Manufacturer
Kalore Nanohybrid GCAmerica
FiltekLS Microhybrid 3MESPE
AeliteLS Microhybrid Bisco
IPSEmpressDirect Nanohybrid Ivoclar

56
Cole‐PalmerInstrumentCo.,Golden,CO)loadedwithspecimenswereintroducedin
thefurnaceafterthetemperaturereached650oCandthentheywerelefttoashfor
30minutes.Thecrucibleswiththeashedspecimenswereweighedonananalytical
scale (Analytical Standard, AS200‐S, O’Haus, Florham Park, NJ). Crucibles were
allowed to cool for 15minutes prior toweighing. The formula thatwas used to
determinepercentagebyweightofthespecimenswasasfollows:
Wtafterashing–Wtofcrucible
WeightPercent=X100
InitialWtofsample
2.PercentageoffillerbyweightusingdissolutionwithAcetone
The percentages of organic and inorganic fillers by weight (n=10) were
determined using acetone in a dissolution process. A specimen of 0.5 g of each
materialwasmixedwith10mLofacetone(electronicgrade,FisherChemical,Fair
Lawn,NJ)inatesttube(Pyrex50mL,FisherScientific,HanoverPark,IL).Alltubes
wereweighedinitiallyemptyandthenweighedagainfollowingloadingwiththe0.5
gspecimen. Tubeswerecoveredwithaluminumfoiltopreventlightexposure.All
specimens initiallywereagitated (Maxi‐mix1,Thermolyne,Dubuque, IA),until all
solid was dissolved and verified visually. Aggitation continued with a gyrotory
shaker (G10, New Brunswick Scientific, New Brunswick, NJ) within a controlled
temperaturechamber(NorlakeScientific,HudsonWI)at370Cfor1hour.Specimen
tubeswere centrifuged (Centrifuge5810R,Eppendorf,Hamburg,Germany) for15
minutes at 4000 rpm and then decanted twice (5 mL pipette, Novamed Inc,
Lawndale Skokie, IL) for a total of 9.5 mL. The specimens were left to dry
overnightinthetemperature‐controlledchambertoensureallacetoneevaporated
and weights of the specimens were measured to the nearest 0.001‐gram the
followingmorning.Theentireprocesswasrepeatedtwicetoensuredissolutionof
theorganicmatrix.Thecalculationof fillerpercentagebyweightwas thesameas
the ashing technique except that residual material might include prepolymerized

57
fillers,clusters,andpossiblesilanecontents.Theformulatodeterminepercentage
byweightofthespecimensafteracetonedissolutionwasasfollows:
Wtafterdissolution–Wtoftube
WeightPercent=X100
InitialWtofsample
3.FillermorphologyusingSEMevaluation
The specimens from ashing in air and dissolutionwith acetone techniques
werecollectedforeachcompositeandstoredinseparate50mLpolystyreneconical
tubes (Blue Max Jr., Becton Dickinson, Franklin Lakes, NJ). Residual fillers from
ashing in air tests were mixed with 10 mL of acetone to produce a suspension,
whichwas smeared on an aluminumSEM stub, and allowed to dry. Morphologic
evaluation was done using a Scanning Electron Microscope, (FEI Quanta 200 3D
FocussedIonBeamWorkstationandEnvironmentalScanningElectronMicroscope,
Tokyo,Japan)withinspectionsatmagnificationsof20,000Xand40,000Xat20‐30
kVbeamaccelerationvoltage.
4.ElementalAnalysiswithEDXAnalysis
The same areas of the samples utilized for SEM observation (with different
magnification)wereadditionallyx‐rayscannedusingaFEIQuanta2003DSEM/FIB
Microscope (Figures 1‐4) with an EDXA‐EDX system for qualitative and semi‐
quantitative analyses to determine the elemental distribution profile. After the
identificationofallpeaksontheEDXspectrum,X‐raycolormappingwasperformed
oneachmountedsampletodetectalltheelementspresentineachcomposite.

58
Figure1. FEIQuanta2003DFocussed IonBeamWorkstationandEnvironmentalScanningElectronMicroscope
Figure2. FEIQuanta2003DFocussed IonBeamWorkstationandEnvironmentalScanningElectronMicroscope

59
Figure3. FEIQuanta2003DFocussed IonBeamWorkstationandEnvironmentalSEM Chamber (top) with sample mounted in Aluminum wheel (right and leftbottom)

60
Figure4.FEIQuanta2003DFocussedIonBeamWorkstationandEnvironmentalScanningElectronMicroscope.Screensdisplacesamplelocation(right)andelementanalysis(left).
Statisticalanalysis
The results for each individual test were analyzed for difference between
materials by using one‐way analysis of variance and Tukey’s test for making
multiplecomparisonsbetweenmeans.AStudent’st‐testwasalsousedtocompare
differences between procedures for each material to determine statiscally
significantlydifferences.Allanalyseswereatp<0.05levelofsignificance.
Results
Four commercially available light‐cured resin composites,GCKalore, Filtek
LS,AeliteLSandIPSEmpressDirectwereevaluatedforfillercontentbyweight.Ten
specimens(n=10)foreachcompositewereevaluatedforpercentagefilleranalysis
using ashing in air and acetone dissolution methods. SEM morphological
characterizationofthefillerparticleswasalsoperformed.
Figure 5 and Table 2 show the means and standard deviations of the
materialsevaluatedwithboth techniques.Weightpercentof inorganic fillers from
ashed specimens ranged from 70.62 to 86.44%. Weight percent of fillers from

61
acetonedissolutionspecimensrangedbetween75.56and85.05%.Meanvaluesfor
all materials were significantly different for both ashing and acetone dissolution.
When comparing techniques, there was a significant difference for eachmaterial
(p<0.05).KaloreandIPSEmpressDirecthadhighervaluesforacetonedissolution
andFiltekLSandAeliteLShadslightlyhighervaluesforashinginair.AeliteLSand
FiltekLSshowedcloserresultsforpercentagesbyweighttomanufacturerreported
datawhenusingashingandacetonetechnique.Ontheotherhand,KaloreandIPS
EmpressDirect, showed results closer tomanufacturer reporteddatawhenusing
acetone dissolution forweightmeasurements. Aelite LS had a significantly higher
loading than the others for weight percentage by both ashing in air and acetone
dissolution. Comparisons of filler by weight after each acetone dissolution are
showninTable3.
Table4showsthecorrelationbetweenashinginairandacetonedissolution
tecniques.Bothtechniqueswerehighlycorrelated(r=0.72).
Figure5.Comparisonoffillercontentmeasurementtechniques
60
65
70
75
80
85
90
Kalore AeliteLS FiltekLS IPSEmpressDirect
Weight%
Manufacturer
Ashing
Acetone

62
Table2.Fillerbyweightwithtwodifferenttechniques
Note.Meanvaluesforallmaterialsweresignificantlydifferentforbothashingandacetone dissolution (one‐wayANOVA, p<0.001; TukeyMultiiple Comparison Test,p<0.001)
Figure6.Comparisonoffillerbyweightaftereachdissolutionwithacetone
60
65
70
75
80
85
90
Kalore AeliteLS FiltekLS IPSEmpressDirect
weight%
Manufacturer
Acetone1
Acetone2
ProductReportedfillerbyWt.
%
FillerbyWt.%afterAshingin
Air
FillerbyWt.%aftertwoAcetonedissolutions
Significance(Independent
ttest)
Kalore 82 70.62(0.3) 77.73(0.3) p<0.001
AeliteLS 88 86.44(1.1) 85.05(0.5) p=0.003
FiltekLS 76 77.86(0.1) 75.56(0.2) p<0.001
IPSEmpressDirect 79 72.17(0.1) 78.88(0.5) p<0.001

63
Table3.Fillerbyweightaftereachdissolutionwithacetone
Note.Seconddissolutionvaluesweresignificantlydifferentfromfirstdissolutionvaluesforallmaterials(pairedt‐test,p<0.05).
Table4.Correlationforcombinedmaterialsbetweenashinginairandtwo‐acetonedissolutions
Correlation=0.72
RepresentativeSEMphotomicrographs(backscatteredelectronimages)ofthe
compositesevaluatedinthisstudyat20,000Xand40,000XareshowninFigs.7‐14.
Irregular particles (3.96 µm) in conjunctionwith spherical (32.03 nm ‐ 2.22 µm)
fillerparticlesofdifferentsizesandagglomeratedparticleswereobservedinAelite
LS(Figure7).Overall,AeliteLSwasthematerialthatshowedthebiggest(3.96µm)
and smallest filler particles (32.03 nm) (Figure 8). Irregular and splintered filler
particles of different sizes were seen in Filtek LS, Empress Direct and Kalore. In
FiltekLS,mostoftheseparticlesweresomewhatlarger(598nm‐2.74µm),while
theremainderswerebetween212.77nm–321.61nm(Figure10).Kaloreshowed
themost irregularlyshapedfillerparticlesamongallcompositesevaluated,witha
Product ReportedfillerbyWt.%
FirstdissolutionWt.%
SeconddissolutionWt.%
Kalore 82 79.29(0.7) 77.73(0.3)
AeliteLS 88 85.91(0.5) 85.047(0.5)
FiltekLS 76 76.10(0.6) 75.56(0.2)
IPSEmpressDirect 79 79.43(0.5) 78.88(0.5)

64
mixofmedium(631nm‐1.85µm)andsmall(48nm‐157nm)sizeparticles(Figure
11and12).Most fillerparticles inKaloreweresmaller than0.5µm.On theother
hand,inEmpress,amoreregularshape‐patterninthefillerparticleswasobserved,
withparticlestypicallyrangingfrom1.28µmto1.77µm,andthesmallestparticles
beingaround56.62nm(Figures13and14).
Figure7.SEMphotomicrographsofAeliteLSafteracetonedissolutionat20,000X(left)and40,000X(right)magnification
Figure8.SEMphotomicrographsandfillermeasurementsofAeliteLSafteracetonedissolutionat40,000Xmagnificationwithparticlesizesnoted

65
Figure9.SEMphotomicrographsofFiltekLSafteracetonedissolutionat20,000X(left)and40,000X(right)magnification
Figure 10. SEM photomicrographs and filler measurements of Filtek LS afteracetonedissolutionat40,000Xmagnificationwithparticlesizesnoted

66
Figure11.SEMphotomicrographsofKaloreafteracetonedissolutionat20,000X(left)and40,000X(right)magnification
Figure12.SEMphotomicrographsandfillermeasurementsofKaloreafteracetonedissolutionat40,000Xmagnificationwithparticlesizesnoted

67
Figure 13. SEMphotomicrographs of EmpressDirect after acetone dissolution at20,000X(left)and40,000X(right)magnification
Figure14.SEMphotomicrographsandfillermeasurementsofEmpressDirectafteracetonedissolutionat40,000Xmagnificationwithparticlesizesnoted

68
The elements and elements’ concentration detected in the resin composites
are shown in Table 5 and Figures 15 to 26. In general, the Energy dispersive
spectroscopic(EDS)analysisdoneinAeliteLS,FiltekLS,KaloreandEmpressDirect
showedthefollowingelements:Si,Al,Sr,Na,Ba,Y,Mg,F,Yb,OandZr.Si,AlandO
werecommomelementsforalltheresincompositestested(Table5).Empresswas
the material that presents the greatest variety of elements, followed by Kalore,
FiltekandAelitewiththeleastamountofdifferentelementsinitscomposition.Ca
wasonlyfoundinAeliteLS,whichistheonlymaterialwithsphericalfillerparticles.
Table5.Type,elementsdetectedandfillercontentofresin‐basedcomposites
Brandname Type ElementsdetectedWeightfiller
content(%)
Kalore Microhybrid Si,Al,O,Mg,F,YbSr,Y 82%
AeliteLS Nanohybrid Si,Al,O 88%
FiltekLS Nanohybrid Si,Al,OMg,F,Y 76%
EmpressDirect Microhybrid Si,Al,O,Mg,F,Yb,Zr,Na,Ba 79%

69
Figure15.EnergydispersivespectroscopicanalysisofthefillerparticlesinAeliteLSafteracetonedissolution
Figure 16. SEM photomicrographs used for EDS analysis (left) and EDS colormappingoverlay(right)onAeliteLS

70
Si(Blue) Al(Red)
O(Lightblue)
Figure17.EDScolormappingofSi,AlandOdistributionforAeliteLS

71
Figure18.Energydispersivespectroscopic(EDS)analysisofthefillerparticlesinFiltekLSafteracetonedissolution
Figure 19. SEM photomicrographs used for EDS analysis (left) and EDS colormappingoverlay(right)forFiltekLS

72
Mg(Blue) Si(Pink)
F(Green) O(Red)
Y(LightBlue)
Figure20.EDScolormappingofMg,Si,F,OandYdistributioninFiltekLS

73
Figure21.Energydispersivespectroscopic(EDS)analysisofthefillerparticlesinKaloreafteracetonedissolution
Figure 22. SEM photomicrographs used for EDS analysis (left) and EDS colormappingoverlay(right)forKalore
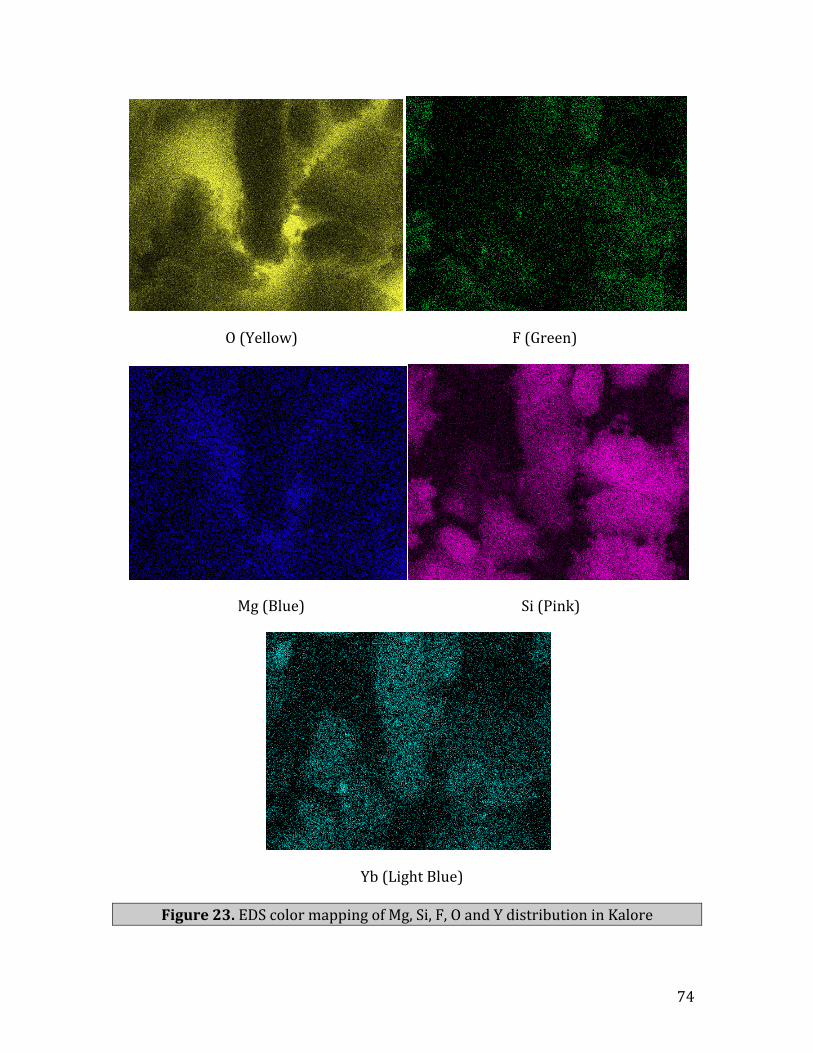
74
O(Yellow)F(Green)
Mg(Blue) Si(Pink)
Yb(LightBlue)
Figure23.EDScolormappingofMg,Si,F,OandYdistributioninKalore

75
Figure24.Energydispersivespectroscopic(EDS)analysisof the fillerparticles inEmpressDirectafteracetonedissolution
Figure 25. SEM photomicrographs used for EDS analysis (left) and EDS colormappingoverlay(right)forEmpressDirect

76
Ba(Blue) Si(Yellow)
F(Green)Yb(Red)
Ca(Purple)
Figure26.EDScolormappingofBa,Si,F,YbandCadistributioninEmpressDirect

77
DISCUSSION
FillerMassFraction
Many methods could be used to study the filler concentration by weight.
Thermogravimetryisatechniqueinwhichthemassofamaterialismonitoredasa
functionoftemperatureandtimeasasamplespecimenissubjectedtoacontrolled
temperatureprogram11,19,24.Thethermogravimetrycurvepatternvariedaccording
tothematerialstested,thusreflectingthevariationsinorganiccomposition.Ashing
in air, on the other hand, is the techniquemost frequently used to determine the
percentageoffillersbyweight.Itisbasedontheeliminationoftheorganicfraction
of theresincompositebyheatingthecomposite toaconstant temperature. Some
authors, like Kim and Chung, ashed the materials in an electric furnace at
temperatures that ranged between 600‐700oC, respectively, for 30 minutes3, 8‐10.
AeliteLS(86.44%)andFiltekLS(77.86%)compositesshowedthehighestamount
ofinorganiccontentafterbeingashedinthefurnace.Whencomparingtheseresults
with the manufacturer’s reported data, the microhybrid materials are the
composites that showedcloser resultswhenusingashing inair technique.On the
otherhand, thenanohybrid composite’s (KaloreandEmpressDirect) results after
ashedtechniqueweredifferentthanthemanufacturer’sdata.
Thedifferencewithinthesecompositescouldbeexplainedbythedefinitionof
fillercontent.Thefillercontentreportedbymanufacturers,sometimesincludesthe
inorganic filler particles and anything organic is vaporized in the ashing in air
technique.Prepolymerizedparticlesinmanycompositesusetheorganicmatrixand
inorganic fillerparticleswhichare first cured intosolidblocksand thenmilledor
grounddownintosizesrangingfrom17to60um1,25.Thenthemilledparticlesare
added to a non‐polymerized resin along with inorganic particles and dispersed
aggregates to increase loading. Pre‐polymerized fillers are relatively large fillers
withlesssurfacearea,enablinggreaterweightfillerloadingandtherebyresultingin

78
less volumetric shrinkage. These larger fillers also prevent the resinmatrix from
moving as a result of friction between the resin and the pre‐polymerized filler
surfaceduringcuring,therebyreducingshrinkage26.
Prepolymerized particles present different shapes and sizes, and they can
haveasmuchas50%organiccontent10, 11, 19, 20, 22, 26, 27. It isofinterestastowhat
constitutesfillercontentwithdifferentcompanies.EmpressDirectandKalorehave
prepolymerized particles in their filler composition. During ashing in air, organic
matrix as well as prepolymerized particles can be vaporized which can result in
significantlylowerpercentagebyweightvalues(Table2).Prepolymerizedparticles
withorganic contentwere included in the filler calculationofEmpressDirect and
Kalore,givingadifferenceof7%forbothmaterials.EmpressDirectmanufacturer
reports 50.2% of barium‐aluminum‐fluorosilicate glass and 19.6% of
prepolymerizedparticlesinitstotalfillerpercentagebyweightof79%.Ontheother
hand, Kalore reported a higher filler content, with a total of 82% of
fluoroaluminosilicate and strontium glass and prepolymerized, which could be
related to a higher percentage of prepolymerized particles with a higher organic
content. So, Kalore and Empress Direct are directly related in how their filler
percentages byweightwere calculated. The nanohybrid composites results after
acetonedissolutionwerecloser to the fillerbyweightmanufacturers’ reportsand
thesmalldifferencesmaybeduetosomeparticleslostduringeachacetonepipette
decantationstep.However,thesesmalldifferenceswerenotseenwhenusingashing
in air technique instead of acetone for the same measurement. Kalore had the
smallest fillerbyweightpercentage after ashing in air (70.62%), and thismaybe
duetoahigheramountofsilaneandprepolymerizedparticleswithahighorganic
matrixinitscomposition.Accordingtotheirmanufacturer,AeliteLSandFiltekLS,
donothaveprepolymerizedparticlesincorporatedintheirfillercomposition,which
resulted in the smallest difference between ashing in air and acetone dissolution
techniques.Themicrohybridmanufacturers’reportswereveryclosetotheresults
obtained in this study and the small differences could be due to loss of some
particles during handling of samples from furnace to analytical scale after ashing

79
techniqueorlossofparticlesduringthedecantationstepintheacetonedissolution
technique.AeliteLShadthehighestpercentageoffillercontentbyweightforboth
techniques while Filtek LS had the lowest percentage of filler by weight after
acetonedissolution(75.56%).
Filtek LS is claimed by the manufacturer to be a low‐shrinkage composite
basedonasiloraneorganicmatrix,whichconsistsofsiloxaneandoxiranefunctional
moieties14,16.Thesiloxanedeterminesthehydrophobicnatureofthesiloranes,and
the cycloaliphatic oxirane functional groups are claimed to be responsible for the
decreased shrinkage of siloranes compared to methacrylate‐based composites.
Oxiranes, which are cyclic ethers, polymerize via a cationic ring‐opening
mechanism, whereas typically methacrylates polymerize via free radical
mechanism. The volumetric shrinkage and polymerization stress have been
decreased with the new silorane organic matrix because the ring opening
mechanism results in expansion whereas the free radical mechanism caused
shrinkage.
Others factors could explain differences found between our data and those
given by the manufacturers. The first one is the variable amount of silane.
Silanationprocessplaysamainrole intheadhesionof theorganicresinmatrixto
theinorganicmineralfillers34.Manufacturersandlaboratoriestreatthefiller‐matrix
interfaceaccording to theirownmethodsandusedifferentways to calculate the
percentages of fillers8. Some manufacturers seem to evaluate the percentage of
fillersbyweightbefore the silanizationprocessof the fillers,whileothers include
thepercentageofsilanecoatingintheircalculation.Inaddition,thesurfaceareaof
thefillerswillaffectthepercentageofsilaneused,thesmallerthefillers,thehigher
thequantityofsilane.
Furthermore, samples from each composite were dissolved in acetone to
evaluate the filler content by weight using a technique that preserves the
prepolymerizedparticles.Previousstudieshadevaluated fillerstructureandsize8,
10, 11, 20, 22, but no studies in the literature have determined filler percentage by

80
weight using the acetone dissolution technique. With the new generation of
composites, it will be necessary to evaluate these materials considering their
prepolymerizedparticles.Apilotstudywasdonetodeterminetheamountofcycles
of acetone dissolution necessary to obtain a stable percentage by weight. No
significantdifferenceswerefoundbetweensecondandthirddissolution,therefore,
two cycles of acetone dissolution were chosen as a standard procedure. Kalore
showedthehighestdifferenceinfillercontentbyweightfortheacetonedissolution
technique (77.73%) . A similar increase was seen with Empress Direct when
comparingashinginair(72.17%)andacetonedissolution(78.88%).AeliteLSand
Filtek LS showed a decreasedweight percentagewhen using acetone dissolution,
which may be related to residual nanoparticles suspended in the acetone after
centrifugesedimentationthatarelostduringpipetteaspiration.
FillerMorphologyandSize
For the fillermorphologyanalysis, the samplesdissolved in acetonewhere
collectedanddissolvedathirdtimeformountingpurposes.OntheSEMevaluation,
allcompositesshowedanirregulartosplinteredshapeexceptforAeliteLS,whichis
the only composite in this study that contains spherical particles mixed with
irregular‐shaped particles. A spherical shape is known to have many advantages
such as to allowan increased filler load for composites and also to enhance their
fracturestrength,surfaceroughnessandshrinkagestrainsincemechanicalstresses
tendtoconcentrateontheanglesandprotuberancesofthefillerparticles3,8,10,28,29.
Thesphericalparticleshaddifferentdiametersthatrangedfrom32nmto2µmwhile
the bigger irregularly shaped particles presented an average size of 4µm. This
compositeshowedthebiggestfillerparticlesamongallresincomposites.TheSEM
images showed some nanoclusters and dispersed nanoparticles surrounding the
biggerfillerparticles.
For Filtek LS, the SEM images confirmed a distinct filler morphology of
irregularlyshapedfillers.FiltekLS’smanufacturerclaimedthattheradicalchangein

81
theshapeofthefillers,amongthefiltekcompositevarieties,isrelatedtothespecific
characteristic that the silorane–based organic matrix needs in its composition.
Siloraneisknowntocontainquartzparticles,whichcannotbeprocessedbyasol‐
geltechniqueandmayexplainthemoreirregularmorphologycomparedwithother
materialsprovidedby thesamemanufacturer.According to themanufacturer, the
average size rangewas from40nm to1700nm;however theSEM images in this
study showed particles that range from 200nm to 3µm in size. In addition, the
images showed a more homogeneous size pattern (average size 470nm) when
comparedtoKalore,theothermicrohybridmaterial.
Still,thereisnotaclearexplanationonthepositiveeffectofacertainparticle
sizeandshape (sphericalor irregular)on thephysicalandmechanicalproperties.
Eventhecomparisonofexperimentalcompositeshasresultedinunclearresults30,31.
Some studies have speculated that the filler loading is the main factor for
determining elastic modulus properties, while filler size and shape should be
consideredassecondaryfactorthatwillaffectmaterialproperties.
Accordingtothemanufacturer,Kalorecontains60%fillercontentbyweight
of400nmnano‐sizedmodifiedstrontiumglassand20%fillercontentbyweightof
100nm of lanthanoid fluoride. Prepolymerized nanoclusters of fillers, inorganic
fillers and mono‐dispersed particles, contained in this specific nanohybrid
compositepresent size rangesbetween16nm to17µm.When the sampleswere
evaluated under SEM, the images showed irregular‐shaped filler particles, whose
biggerparticlesrangefrom630nmto1.85µmandsmallparticlesrangefrom48nm
to 158nm. Among all materials, Aelite LS (32 nm) and Kalore (48 nm) are the
materials thathad thesmallest fillerparticles in their structure.AswellasKalore
and Fitek LS, Empress Direct also showed irregular shaped particles with large
fillersthatrangefrom1.28µm‐1.77µmandsmalleraggregatesparticleswithsizes
from56.62nmto196.97nm.
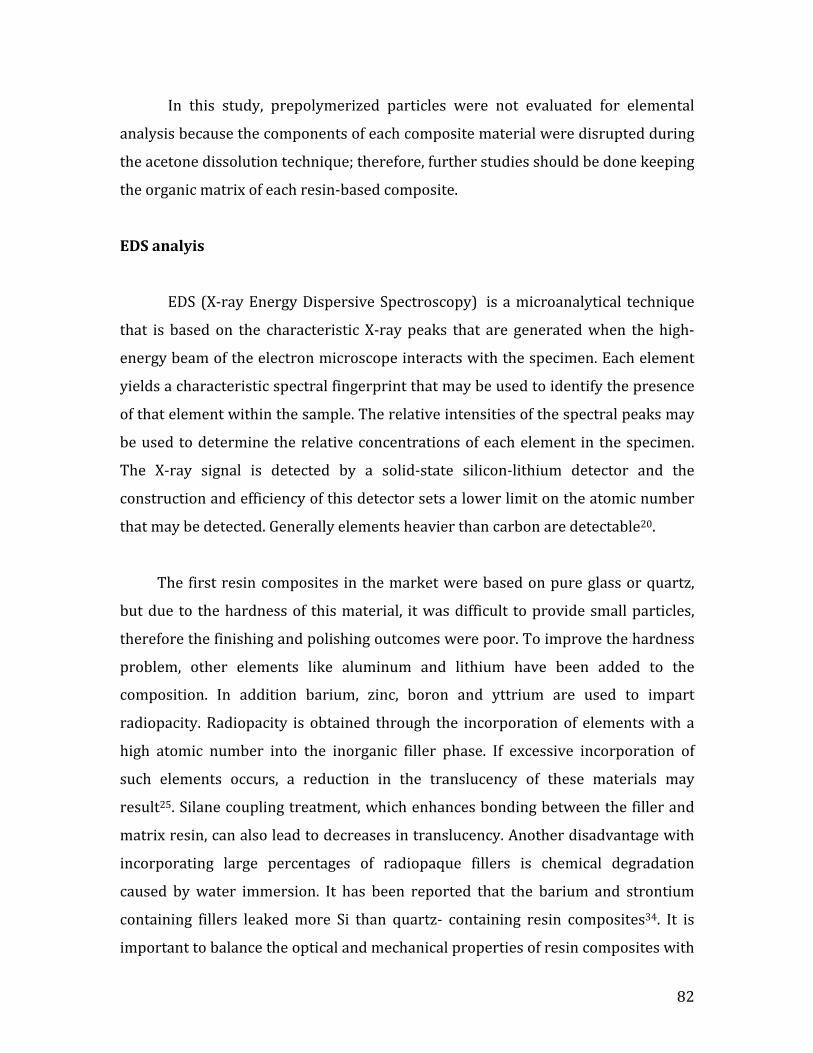
82
In this study, prepolymerized particles were not evaluated for elemental
analysisbecausethecomponentsofeachcompositematerialweredisruptedduring
theacetonedissolutiontechnique;therefore,furtherstudiesshouldbedonekeeping
theorganicmatrixofeachresin‐basedcomposite.
EDSanalyis
EDS(X‐rayEnergyDispersiveSpectroscopy) isamicroanalytical technique
that is basedon the characteristic X‐raypeaks that are generatedwhen thehigh‐
energybeamoftheelectronmicroscopeinteractswiththespecimen.Eachelement
yieldsacharacteristicspectralfingerprintthatmaybeusedtoidentifythepresence
ofthatelementwithinthesample.Therelativeintensitiesofthespectralpeaksmay
beusedtodeterminetherelativeconcentrationsofeachelement in thespecimen.
The X‐ray signal is detected by a solid‐state silicon‐lithium detector and the
constructionandefficiencyofthisdetectorsetsalowerlimitontheatomicnumber
thatmaybedetected.Generallyelementsheavierthancarbonaredetectable20.
Thefirstresincomposites inthemarketwerebasedonpureglassorquartz,
butdue to thehardnessof thismaterial, itwasdifficult toprovidesmallparticles,
thereforethefinishingandpolishingoutcomeswerepoor.Toimprovethehardness
problem, other elements like aluminum and lithium have been added to the
composition. In addition barium, zinc, boron and yttrium are used to impart
radiopacity.Radiopacity is obtained through the incorporationof elementswith a
high atomic number into the inorganic filler phase. If excessive incorporation of
such elements occurs, a reduction in the translucency of these materials may
result25.Silanecouplingtreatment,whichenhancesbondingbetweenthefillerand
matrixresin,canalsoleadtodecreasesintranslucency.Anotherdisadvantagewith
incorporating large percentages of radiopaque fillers is chemical degradation
caused bywater immersion. It has been reported that the barium and strontium
containing fillers leakedmore Si than quartz‐ containing resin composites34. It is
importanttobalancetheopticalandmechanicalpropertiesofresincompositeswith

83
the incorporation of filler particles. Other elements like Ytterbium fluoride have
beenincorporatedtocreatenewfluoridereleasingcomposites25.ResultsfromEDX
spectroscopyanalysisoftheinorganicfillersrevealedagreatvarietyofelementsin
thecompositionofdifferenttypesoffillers23.TheelementsdetectedwereSilica(Si),
Aluminum (Al), Strontium (Sr), Y (Yttrium), Magnesium (Mg), F (Fluorine), Yb
(Ytterbium), O (Oxygen), Zr (Zirconium) and Barium (Ba). Si, Al and O were the
commonelementsinthecomposition,butaccordingtoeachelementspectralpeak
emission,Alshowedthehighestconcentrationamongallmaterials, followedbySi
withthesecondhighestconcentration.
Fillercontentrelatedtophysicalproperties
The additionof inorganicparticleshasbeen themain factor studied in the
developmentofnewresincomposites.Thephysicalpropertiesofdentalcomposites
areknowntodependontheconcentrationandparticlesizeofthefiller.Volumetric
polymerization shrinkage is mainly determined by, composition of the material,
suchasthetypeandamountoftheresinmatrixused,theiniatiationsystemandthe
filler loading3, 9, 32.AccordingtoChang’sevaluationonthesamecomposites,Filtek
LS showed significantly lower volumetric shrinkage (0.45%) than the other
materials. Aelite LS (1.59%), Kalore (1.65%) and Empress Direct (1.83%) have
statistically similar shrinkage values33. These results indicated that the low
shrinkage silorane chemistry proclaimed by the manufacturer reflected the high
shrinkagereductionseeninthisnewlineofFiltekcomposites.
AeliteLS,being the resin‐compositewith thehighest filler content, showed
similar shrinkagevalues to the compositeswith lower filler content.The rounded
filler geometry on Aelite LS, filler particle size and the prepolymerized particles
contained in the nanohybrid composites, did not seem to influence the degree of
volumetric shrinkage in these materials. For the Knoop surface hardness
evaluation, Aelite LS (114.55 KHN) demonstrated the greatest surface hardness
followed by Filtek LS, Kalore and Empress Direct (36.59 KHN) with the lowest.

84
These values were better correlated with the percentage of filler content, since
AeliteLSwasthecompositewiththestatisticallysignificantlyhigher fillercontent
byweightwhencomparedtotheothermaterials. Intheotherphysicalproperties
evaluated, Aelite LS and Filtek LS were significantly greater in Vickers surface
hardness and flexural strength than Kalore and Empress Direct. This significant
difference could be associated with the difference in the proprietary matrix
composition of the low‐shrinkage materials when compared to the metacrylate‐
based resin composites. Regarding physical properties and filler particle size
correlation, the materials with the largest filler particles embedded in their
composition, Aelite LS and Filtek LS, were the composites with the most ideal
physical properties; however, further SEM imaging across the surface of each
sampleneedstobemicroanalysed.

85
Conclusions
• Meanvaluesforallmaterialsweresignificantlydifferentforbothashingand
acetonedissolution.
• Aelite LS had the highest filler content for both ashing and acetone
dissolution.
• Valuesforfillercontentbyweightusingtheacetonedissolutionwerecloser
tomanufacturerreportedvalues.
• ManufacturerreportedfillercontentforAeliteLS(88%)andFiltekLS(76%)
approximatedthestudyresultsforbothtechniques,whileKalore(82%)and
IPS Empress Direct (79%) were only similar for acetone dissolution,
indicatinghighercontentofprepolymerizedparticles.
• Kalorehadsignificantly lower fillercontent forashing(70.62%)andFiltek
LSforacetonedissolution(75.56%).
• Morphological examination showedspherical shapedparticles forAeliteLS
andsplinteredandirregularshapedparticlesforallothermaterials.
• The elements detected were Silica (Si), Aluminum (Al), Strontium (Sr), Y(Yttrium), Magnesium (Mg), F (Fluorine), Yb (Ytterbium), O (Oxygen), Zr
(Zirconium)andBarium(Ba),withSi,AlandOthecommonelementsinthe
compositionofallfourresin‐compositesevaluated.

86
References
1. Rueggeberg FA. From vulcanite to vinyl, a history of resins in restorativedentistry.JProsthetDent2002;87(4):364‐79.
2. Ferracane JL. Resin composite‐‐state of the art. DentMater 2011;27(1):29‐38.
3. KimKH,OngJL,OkunoO.Theeffectoffillerloadingandmorphologyonthemechanical properties of contemporary composites. J Prosthet Dent2002;87(6):642‐9.
4. LuH,LeeYK,OguriM,PowersJM.Propertiesofadentalresincompositewithasphericalinorganicfiller.OperDent2006;31(6):734‐40.
5. YesilZD,AlapatiS,JohnstonW,SeghiRR.Evaluationofthewearresistanceofnew nanocomposite resin restorative materials. J Prosthet Dent2008;99(6):435‐43.
6. MundimFM,GarciaLdaF,Pires‐de‐SouzaFdeC.Effectofstainingsolutionsand repolishing on color stability of direct composites. J Appl Oral Sci2010;18(3):249‐54.
7. ChenMH.Updateondentalnanocomposites.JDentRes2010;89(6):549‐60.8. Sabbagh J, Ryelandt L, Bacherius L, et al. Characterization of the inorganic
fractionofresincomposites.JOralRehabil2004;31(11):1090‐101.9. Chung KH, Greener EH. Correlation between degree of conversion, filler
concentration and mechanical properties of posterior composite resins. JOralRehabil1990;17(5):487‐94.
10. Beun S, Glorieux T, Devaux J, Vreven J, Leloup G. Characterization ofnanofilled compared to universal and microfilled composites. Dent Mater2007;23(1):51‐9.
11. KhanAM,SuzukiH,NomuraY, et al.Characterizationof inorganic fillers invisible‐light‐cured dental composite resins. J Oral Rehabil 1992;19(4):361‐70.
12. IlieN,HickelR.Silorane‐baseddentalcomposite:behaviorandabilities.DentMaterJ2006;25(3):445‐54.
13. Lien W, Vandewalle KS. Physical properties of a new silorane‐basedrestorativesystem.DentMater2010;26(4):337‐44.
14. MarchesiG,BreschiL,AntoniolliF,etal.Contractionstressoflow‐shrinkagecomposite materials assessed with different testing systems. Dent Mater2010;26(10):947‐53.
15. MitraSB,WuD,HolmesBN.Anapplicationofnanotechnology inadvanceddentalmaterials.JAmDentAssoc2003;134(10):1382‐90.
16. WeinmannW,ThalackerC,GuggenbergerR.Siloranesindentalcomposites.DentMater2005;21(1):68‐74.
17. Rodrigues SA, Jr., Scherrer SS, Ferracane JL, Della Bona A. Microstructuralcharacterization and fracture behavior of a microhybrid and a nanofillcomposite.DentMater2008;24(9):1281‐8.
18. IlieN,HickelR.Investigationsonmechanicalbehaviourofdentalcomposites.ClinOralInvestig2009;13(4):427‐38.

87
19. Tyas MJ, Jones DW, Rizkalla AS. The evaluation of resin compositeconsistency.DentMater1998;14(6):424‐8.
20. HosodaH,YamadaT, Inokoshi S. SEMandelemental analysis of compositeresins.JProsthetDent1990;64(6):669‐76.
21. BraemM, FingerW, Van Doren VE, Lambrechts P, Vanherle G. Mechanicalproperties and filler fraction of dental composites. Dent Mater1989;5(5):346‐8.
22. Lang BR, Jaarda M, Wang RF. Filler particle size and composite resinclassificationsystems.JOralRehabil1992;19(6):569‐84.
23. JaardaMJ,LangBR,WangRF,EdwardsCA.Measurementofcompositeresinfillerparticlesbyusing scanningelectronmicroscopyanddigital imaging. JProsthetDent1993;69(4):416‐24.
24. AcharyaA,GreenerEH.Thermogravimetricanalysisofcompositerestorativeresins.JDentRes1972;51(5):1363‐8.
25. Fortin D, Vargas MA. The spectrum of composites: new techniques andmaterials.JAmDentAssoc2000;131Suppl:26S‐30S.
26. Lutz F, Phillips RW. A classification and evaluation of composite resinsystems.JProsthetDent1983;50(4):480‐8.
27. WillemsG, LambrechtsP,BraemM,Celis JP,VanherleG.A classificationofdental composites according to their morphological and mechanicalcharacteristics.DentMater1992;8(5):310‐9.
28. Satterthwaite JD,VogelK,WattsDC.Effectof resin‐composite fillerparticlesizeandshapeonshrinkage‐strain.DentMater2009;25(12):1612‐5.
29. MarghalaniHY.Effectoffillerparticlesonsurfaceroughnessofexperimentalcompositeseries.JApplOralSci2010;18(1):59‐67.
30. Leprince J, Palin WM, Mullier T, et al. Investigating filler morphology andmechanical properties of new low‐shrinkage resin composite types. J OralRehabil2010;37(5):364‐76.
31. Kaleem M, Satterthwaite JD, Watts DC. Effect of filler particle size andmorphology on force/work parameters for stickiness of unset resin‐composites.DentMater2009;25(12):1585‐92.
32. IkejimaI,NomotoR,McCabeJF.Shearpunchstrengthandflexuralstrengthof model composites with varying filler volume fraction, particle size andsilanation.DentMater2003;19(3):206‐11.
33. Chang M, Yaman P, Dennison J. Physical property evaluation of fourcompositematerials.M.S.Thesis,UniversityofMichigan,2011.
34. O’Brien,WJ.DentalMaterialsandTheirSelection.2002.3rded.:p.113‐131.