innovative versus new - nacds homepage · innovative versus new ... hy-vee jill turner-mitchael...
TRANSCRIPT
INNOVATIVE VERSUS NEW
HOW RETAILERS AND SUPPLIERS COLLABORATE ON NEW ITEM LAUNCHES
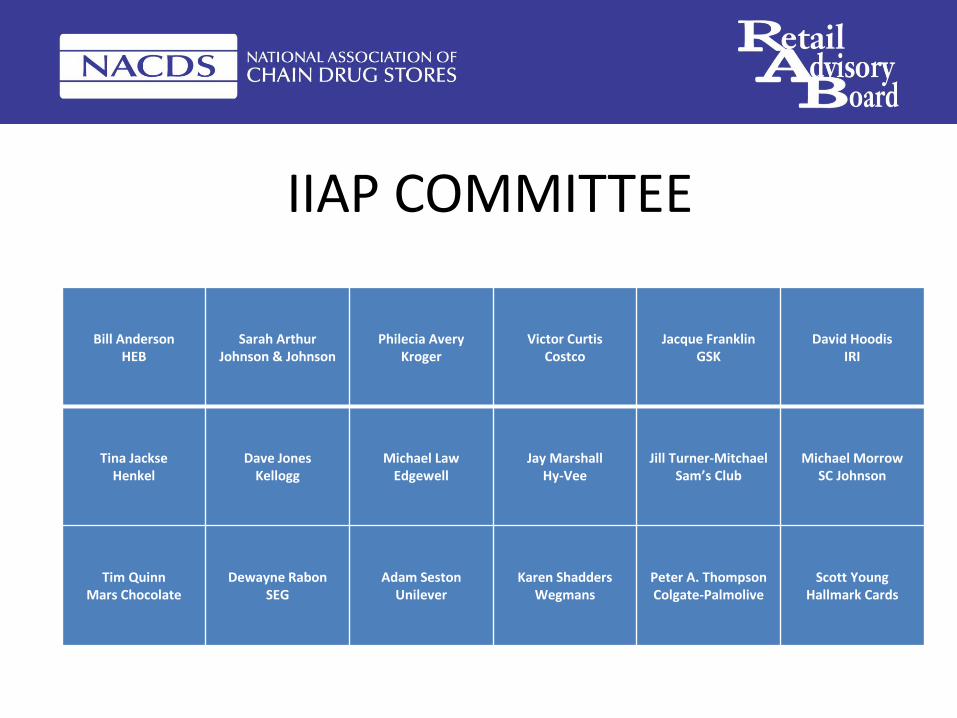
IIAP COMMITTEE
Bill AndersonHEB
Sarah ArthurJohnson & Johnson
Philecia AveryKroger
Victor CurtisCostco
Jacque FranklinGSK
David HoodisIRI
Tina JackseHenkel
Dave JonesKellogg
Michael LawEdgewell
Jay MarshallHy-Vee
Jill Turner-MitchaelSam’s Club
Michael MorrowSC Johnson
Tim QuinnMars Chocolate
Dewayne RabonSEG
Adam SestonUnilever
Karen ShaddersWegmans
Peter A. ThompsonColgate-Palmolive
Scott YoungHallmark Cards
Our Committee to the NACDS Membership
Deliverables:
1. Executive Summary at TSE
2. Deliverable our findings at the December ‘16 RAB meeting
Insight:
• New Item Classifications
• Scorecard Accountability
• Process Learning’s – Opportunities and Challenges
4
“”
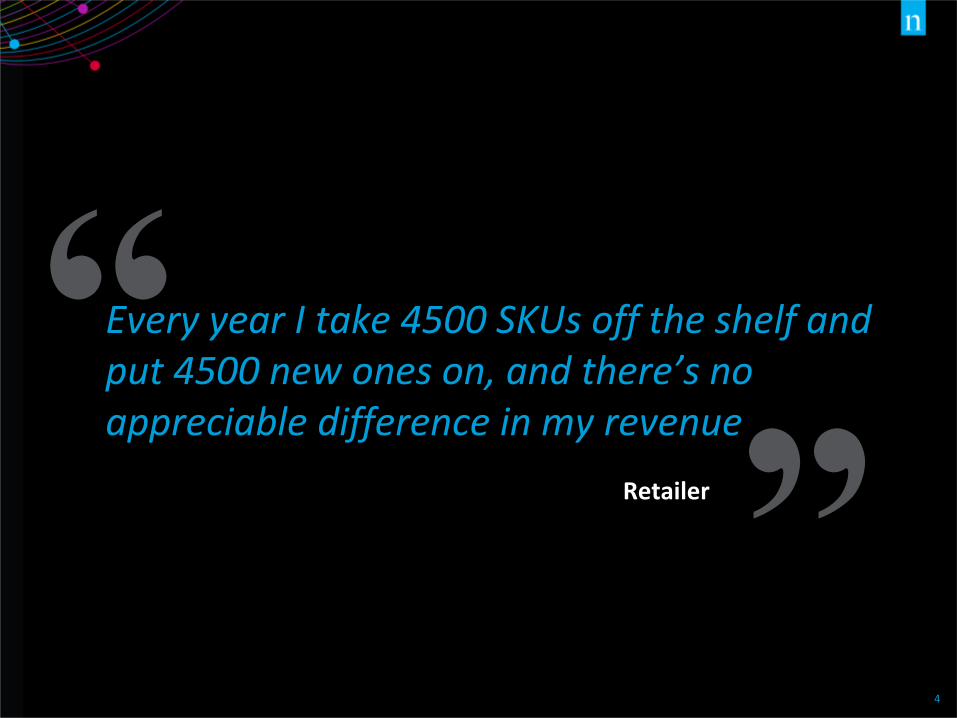
Every year I take 4500 SKUs off the shelf and put 4500 new ones on, and there’s no appreciable difference in my revenue
Retailer
Cop
yri
gh
t ©
20
16
Th
e N
iels
en
Com
pa
ny.
Con
fid
en
tia
l a
nd
pro
pri
eta
ry.
5
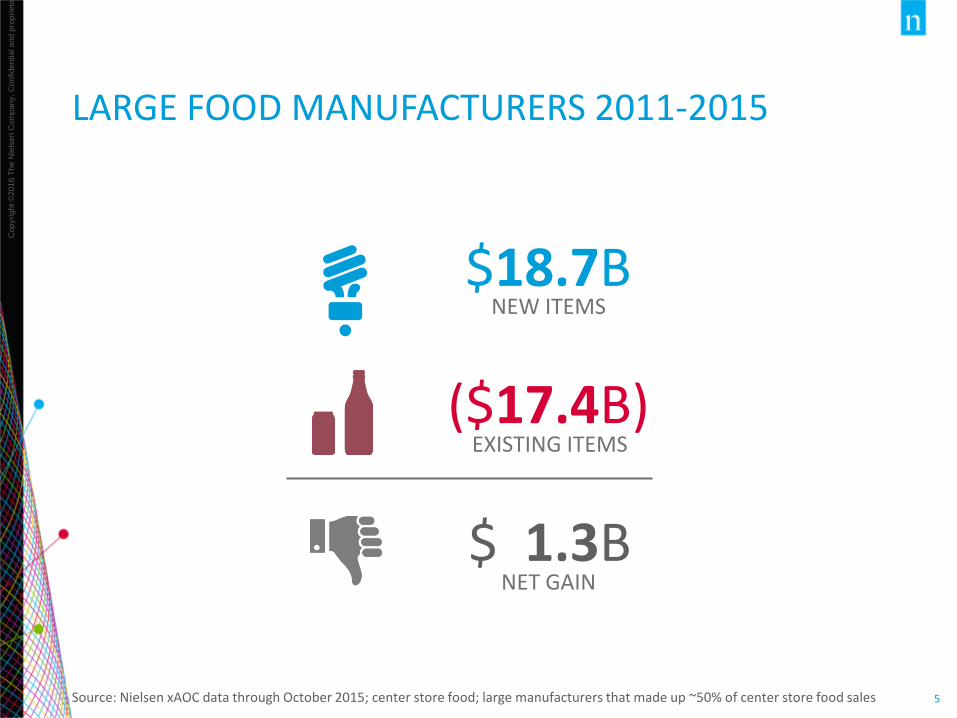
LARGE FOOD MANUFACTURERS 2011-2015
Source: Nielsen xAOC data through October 2015; center store food; large manufacturers that made up ~50% of center store food sales
EXISTING ITEMS($17.4B)
$18.7BNEW ITEMS
$ 1.3BNET GAIN
6
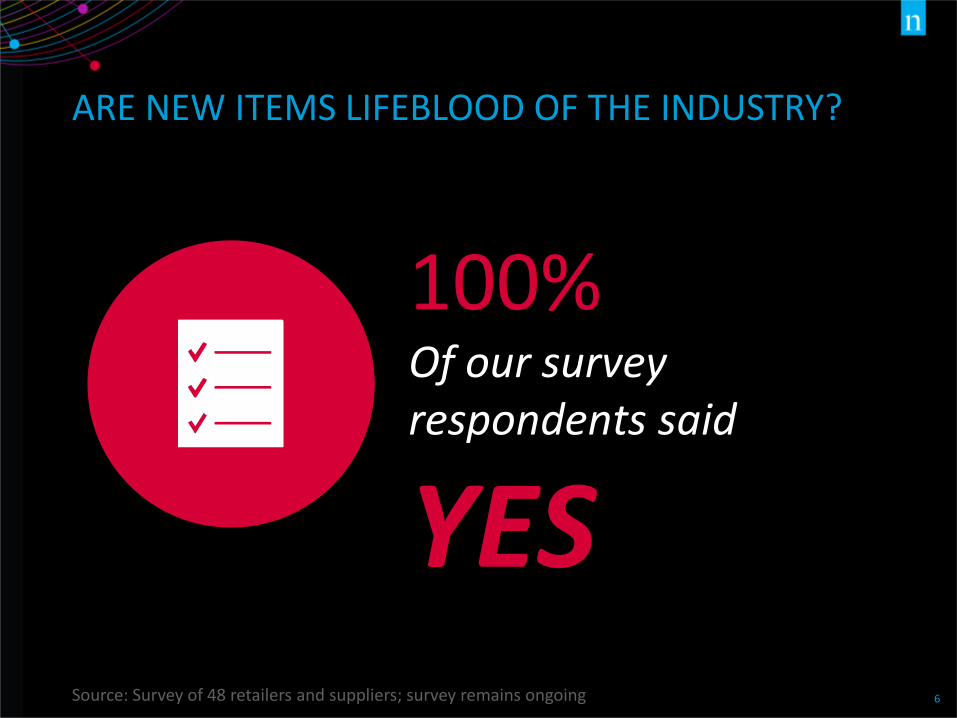
100%Of our survey respondents said
YES
ARE NEW ITEMS LIFEBLOOD OF THE INDUSTRY?
Source: Survey of 48 retailers and suppliers; survey remains ongoing
7
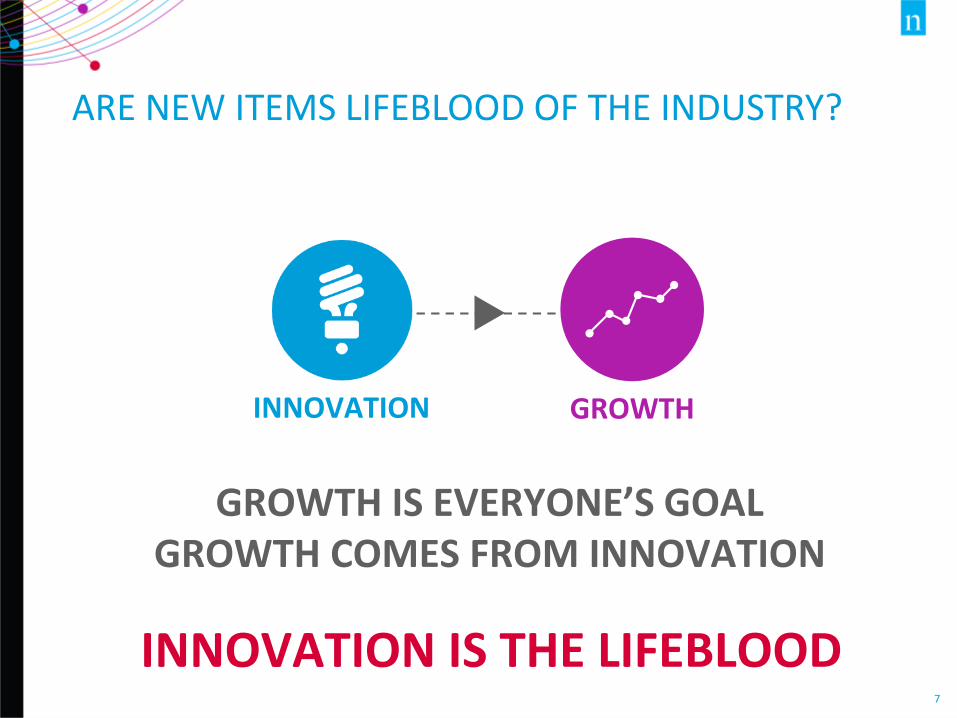
GROWTH
INNOVATION IS THE LIFEBLOOD
ARE NEW ITEMS LIFEBLOOD OF THE INDUSTRY?
INNOVATION
GROWTH IS EVERYONE’S GOALGROWTH COMES FROM INNOVATION
8
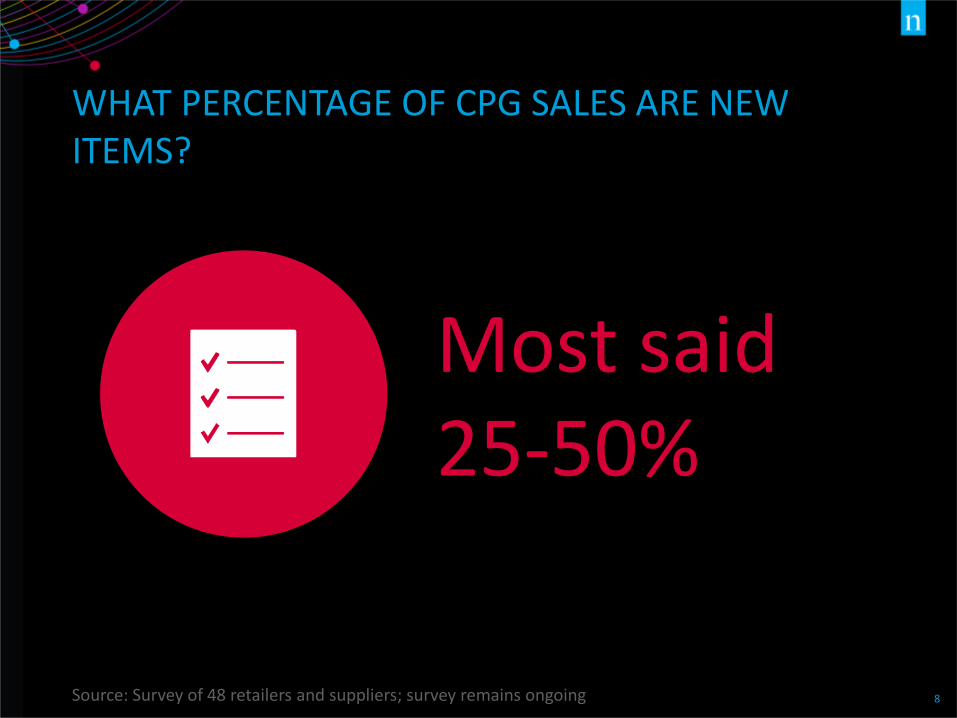
WHAT PERCENTAGE OF CPG SALES ARE NEW ITEMS?
Most said25-50%
Source: Survey of 48 retailers and suppliers; survey remains ongoing
9
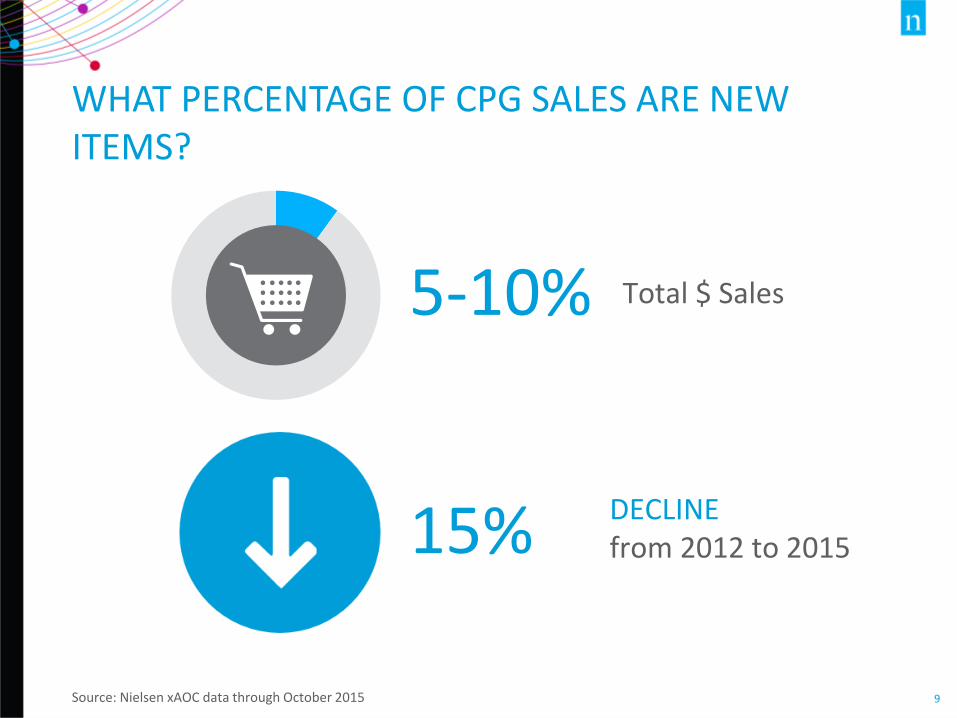
WHAT PERCENTAGE OF CPG SALES ARE NEW ITEMS?
Source: Nielsen xAOC data through October 2015
5-10% Total $ Sales
15% DECLINEfrom 2012 to 2015
Cop
yri
gh
t ©
20
16
Th
e N
iels
en
Com
pa
ny.
Con
fid
en
tia
l a
nd
pro
pri
eta
ry.
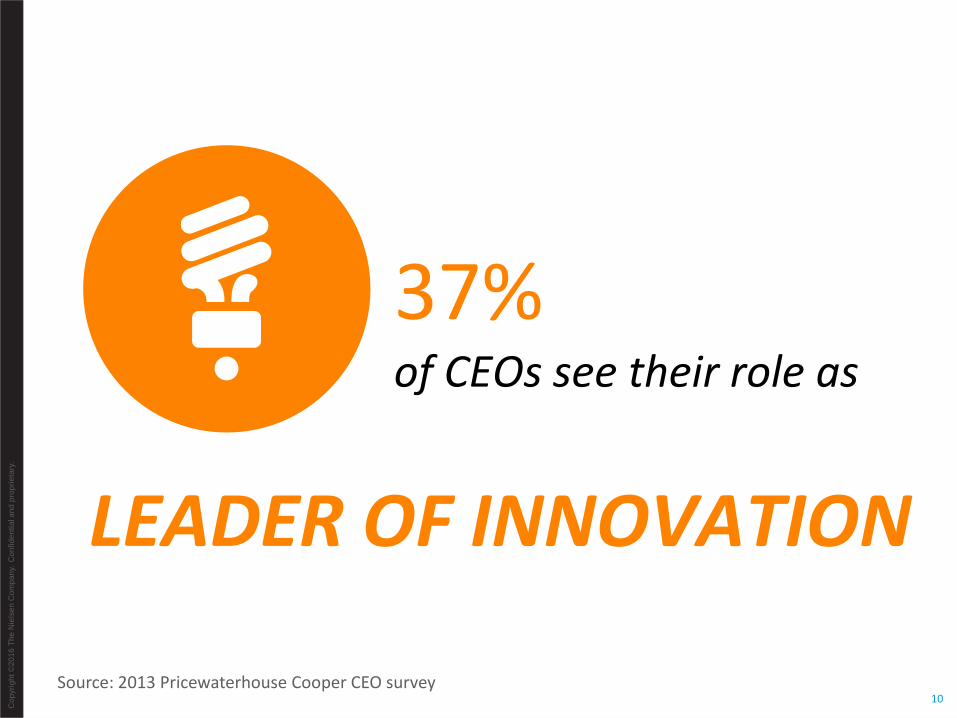
10Source: 2013 Pricewaterhouse Cooper CEO survey
37%of CEOs see their role as
LEADER OF INNOVATION
11
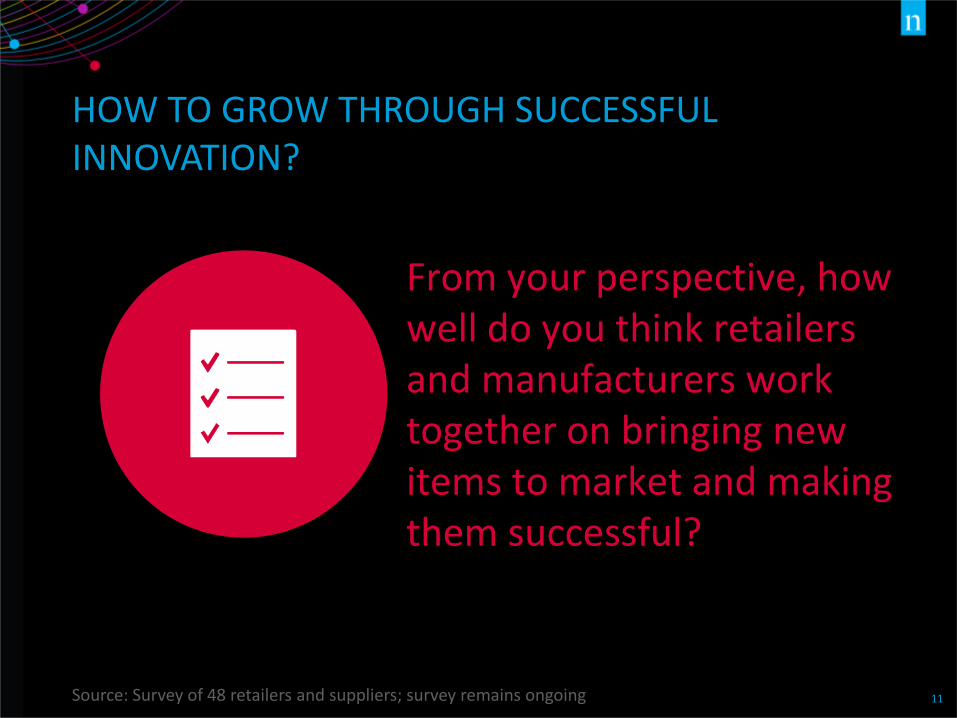
HOW TO GROW THROUGH SUCCESSFUL INNOVATION?
From your perspective, how well do you think retailers and manufacturers work together on bringing new items to market and making them successful?
Source: Survey of 48 retailers and suppliers; survey remains ongoing
12
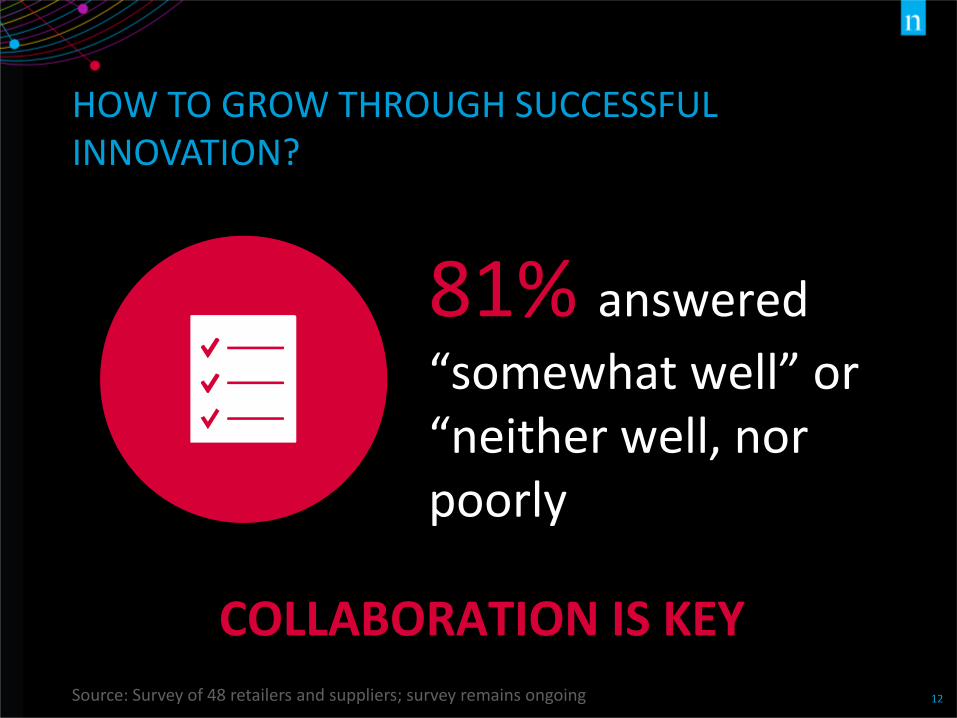
HOW TO GROW THROUGH SUCCESSFUL INNOVATION?
81% answered
“somewhat well” or “neither well, nor poorly
COLLABORATION IS KEYSource: Survey of 48 retailers and suppliers; survey remains ongoing
13
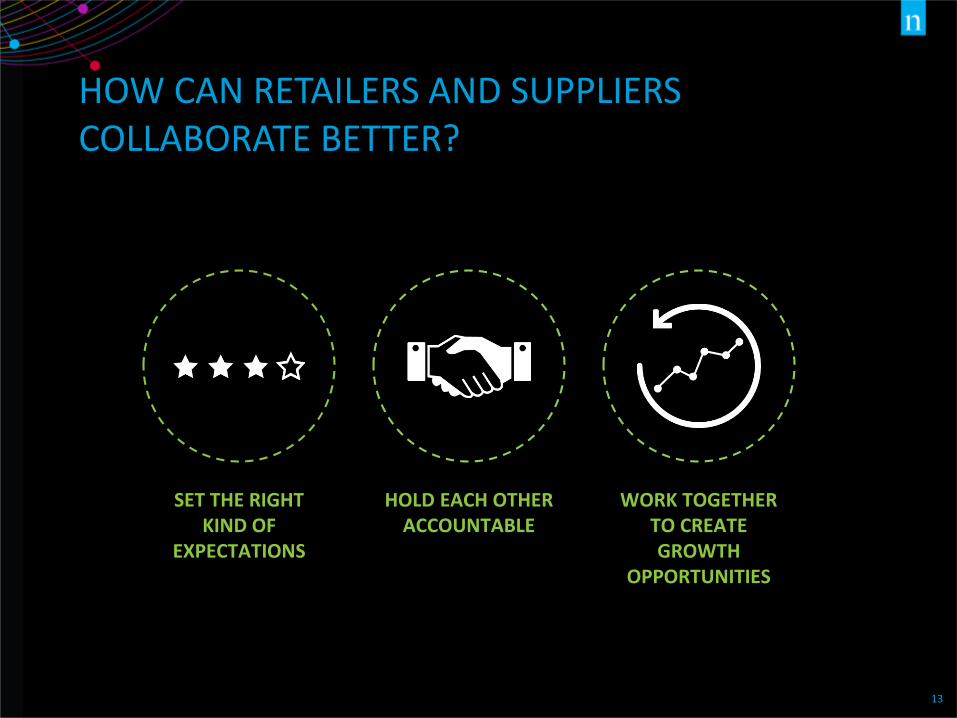
HOW CAN RETAILERS AND SUPPLIERS COLLABORATE BETTER?
SET THE RIGHT KIND OF
EXPECTATIONS
HOLD EACH OTHER ACCOUNTABLE
WORK TOGETHER TO CREATE GROWTH
OPPORTUNITIES
14
CASE STUDIES FROM NIELSEN BREAKTHROUGH INNOVATION REPORT

SET THE RIGHT KIND OF
EXPECTATIONS
16
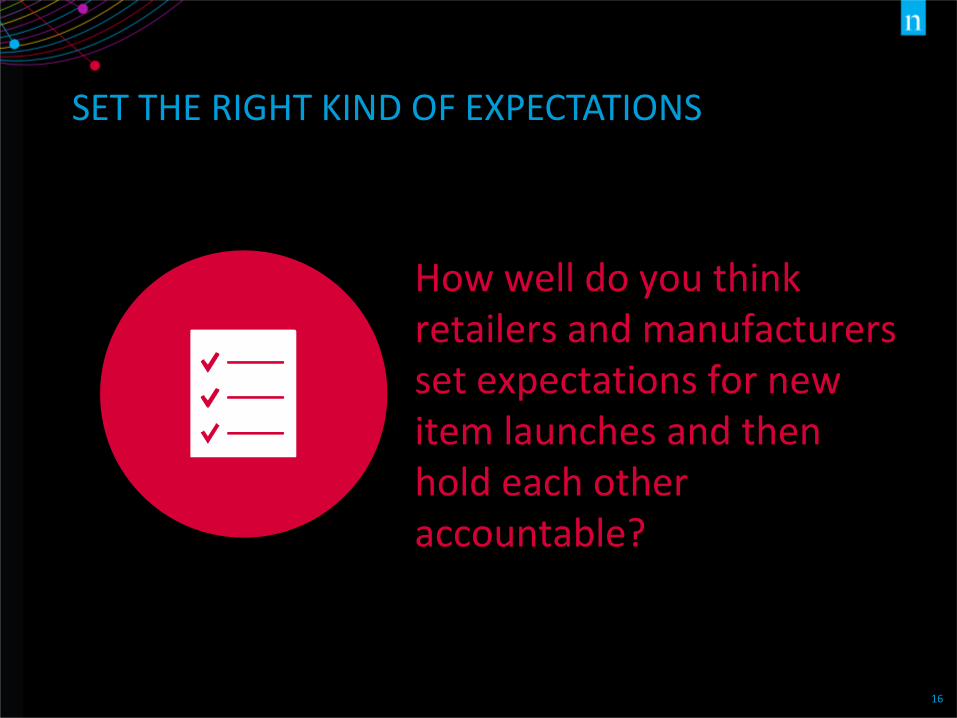
SET THE RIGHT KIND OF EXPECTATIONS
How well do you think retailers and manufacturers set expectations for new item launches and then hold each other accountable?
17
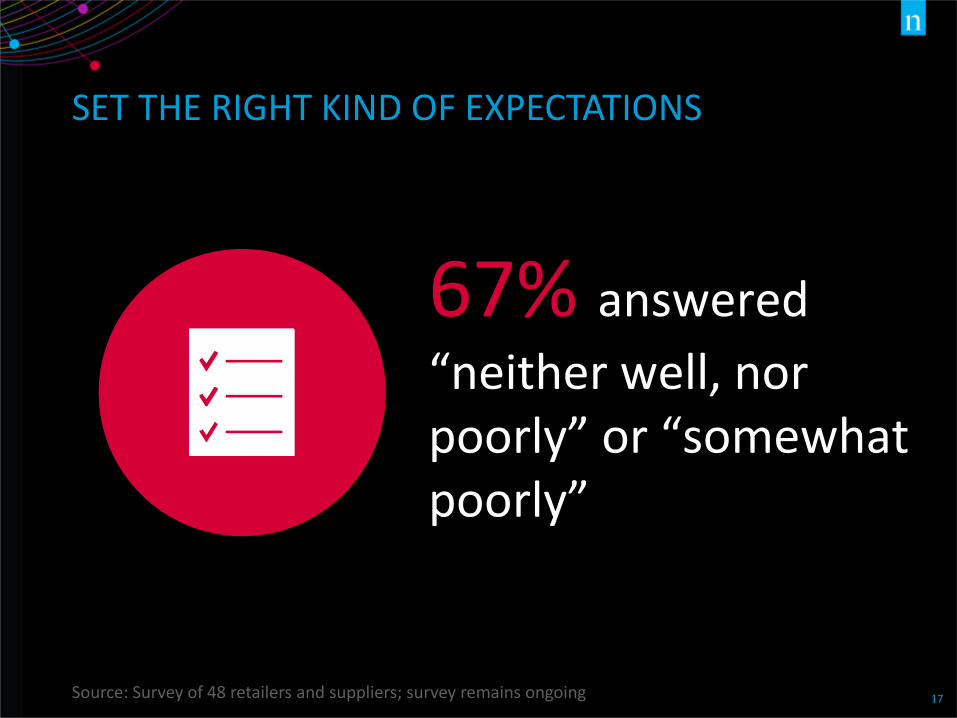
SET THE RIGHT KIND OF EXPECTATIONS
Source: Survey of 48 retailers and suppliers; survey remains ongoing
67% answered
“neither well, nor poorly” or “somewhat poorly”
18
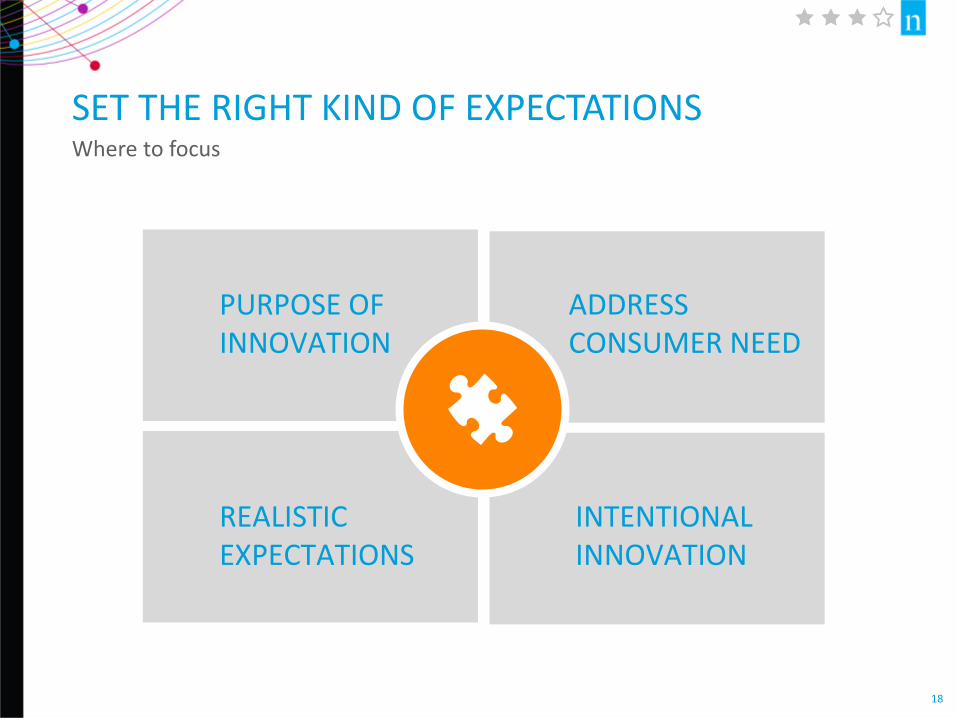
SET THE RIGHT KIND OF EXPECTATIONS
PURPOSE OF INNOVATION
REALISTIC EXPECTATIONS
ADDRESS CONSUMER NEED
INTENTIONAL INNOVATION
Where to focus
Cop
yri
gh
t ©
20
16
Th
e N
iels
en
Com
pa
ny.
Con
fid
en
tia
l a
nd
pro
pri
eta
ry.
19
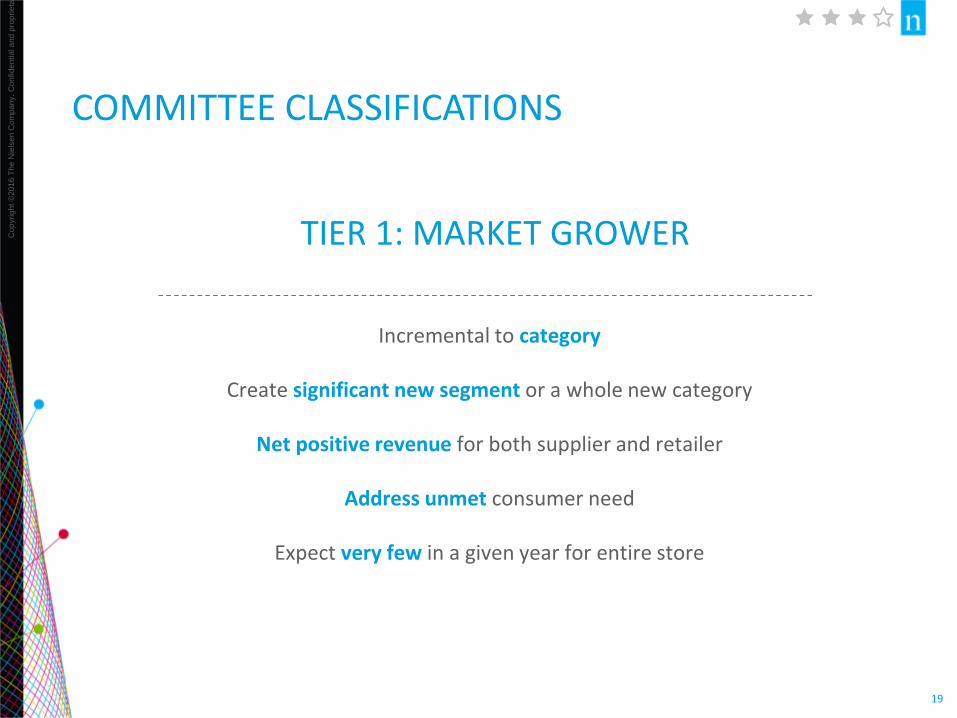
COMMITTEE CLASSIFICATIONS
Incremental to category
Create significant new segment or a whole new category
Net positive revenue for both supplier and retailer
Address unmet consumer need
Expect very few in a given year for entire store
TIER 1: MARKET GROWER
Cop
yri
gh
t ©
20
16
Th
e N
iels
en
Com
pa
ny.
Con
fid
en
tia
l a
nd
pro
pri
eta
ry.
20
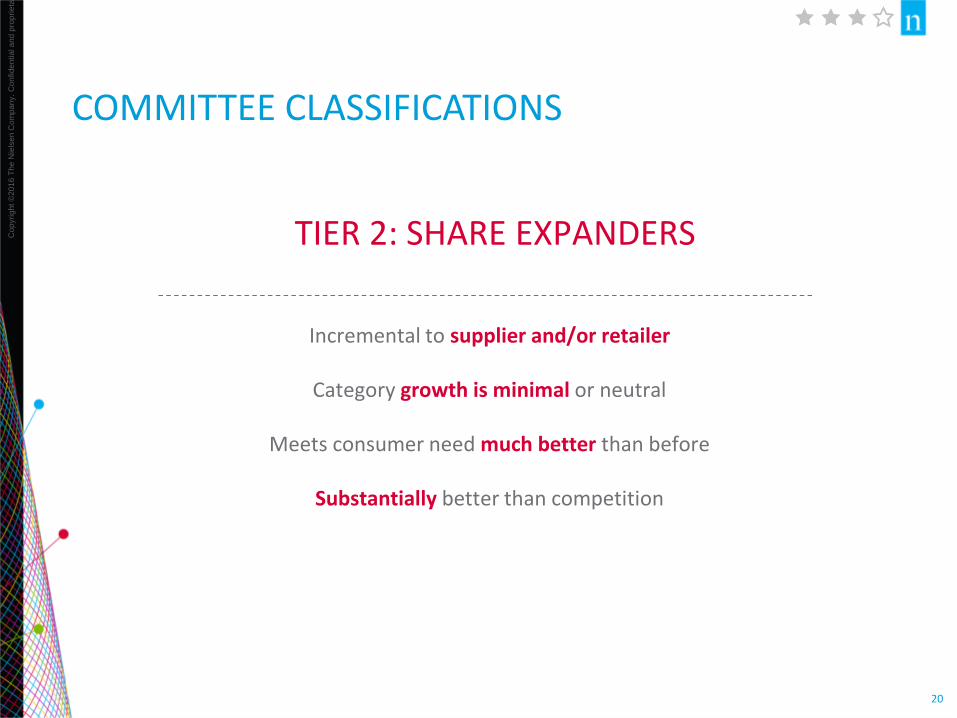
COMMITTEE CLASSIFICATIONS
Incremental to supplier and/or retailer
Category growth is minimal or neutral
Meets consumer need much better than before
Substantially better than competition
TIER 2: SHARE EXPANDERS
Cop
yri
gh
t ©
20
16
Th
e N
iels
en
Com
pa
ny.
Con
fid
en
tia
l a
nd
pro
pri
eta
ry.
21
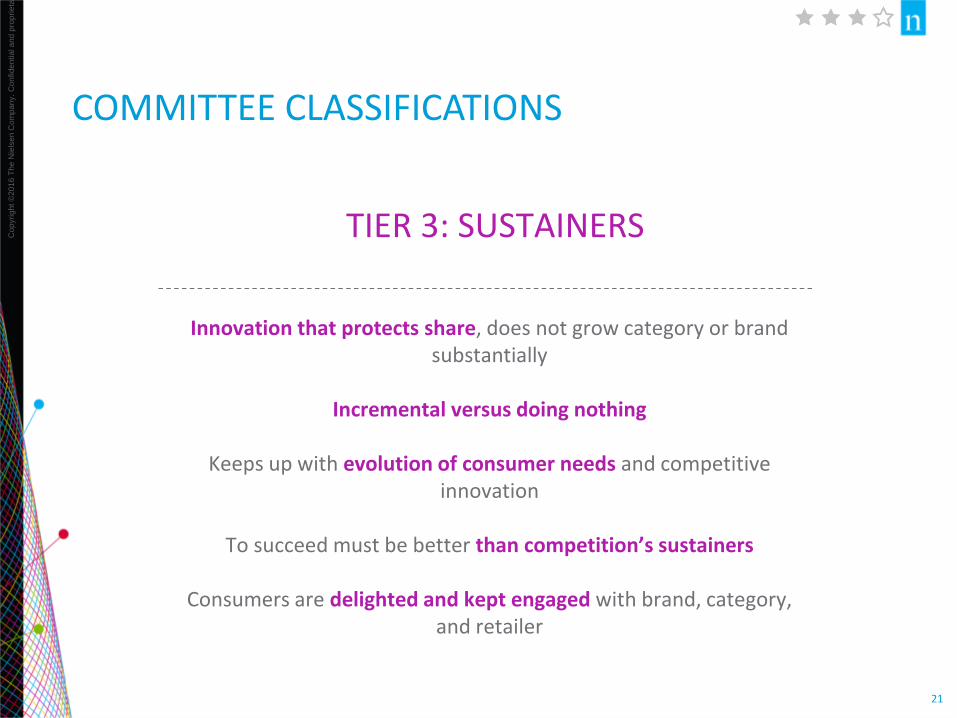
COMMITTEE CLASSIFICATIONS
Innovation that protects share, does not grow category or brand substantially
Incremental versus doing nothing
Keeps up with evolution of consumer needs and competitive innovation
To succeed must be better than competition’s sustainers
Consumers are delighted and kept engaged with brand, category, and retailer
TIER 3: SUSTAINERS
22
SUSTAINING INNOVATION IS NECESSARY
2016 Nielsen Breakthrough Innovation Report
“”
The vast majority of innovation activity comprises the closer-in launches that keep brands fresh, consumers engaged, and retail customers supportive. ‘Sustaining innovation,’ as the term itself suggests, is a requirement for survival. You need it every year – year in, year out…The mark of innovation mastery is a balanced innovation portfolio.
23
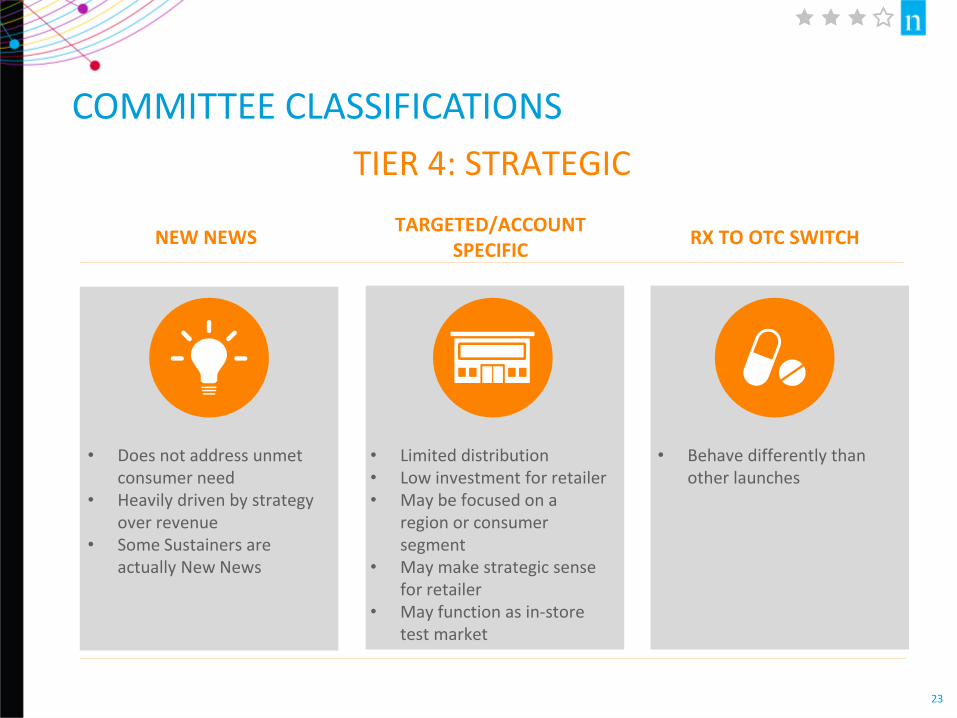
COMMITTEE CLASSIFICATIONS
NEW NEWSTARGETED/ACCOUNT
SPECIFICRX TO OTC SWITCH
• Does not address unmet consumer need
• Heavily driven by strategy over revenue
• Some Sustainers are actually New News
• Limited distribution• Low investment for retailer• May be focused on a
region or consumer segment
• May make strategic sense for retailer
• May function as in-store test market
• Behave differently than other launches
TIER 4: STRATEGIC
24
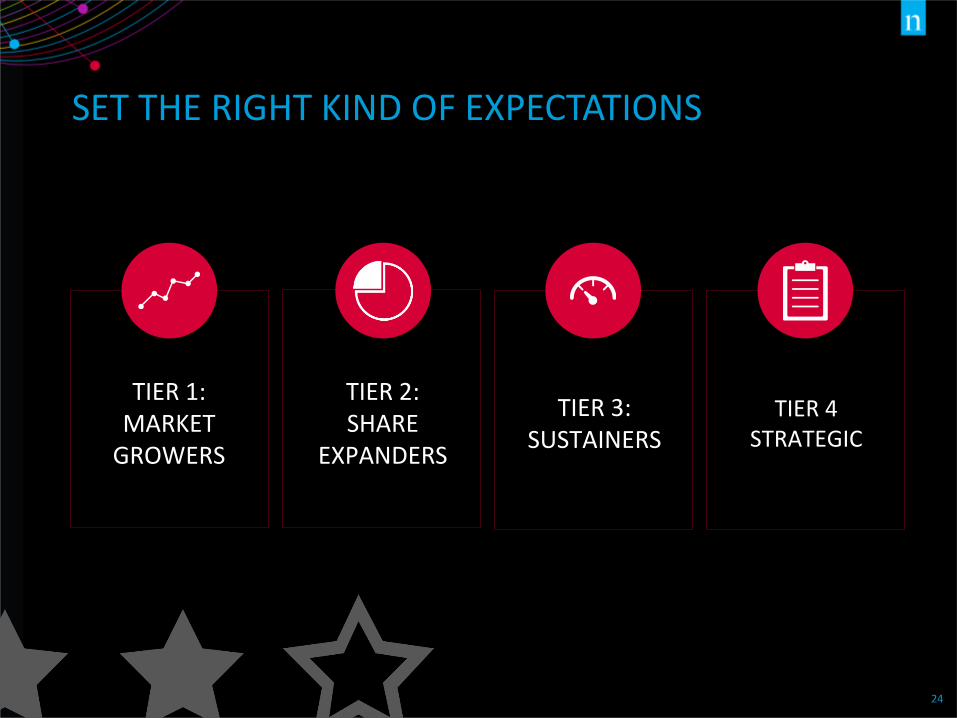
SET THE RIGHT KIND OF EXPECTATIONS
TIER 4STRATEGIC
TIER 1:MARKET
GROWERS
TIER 2:SHARE
EXPANDERS
TIER 3:SUSTAINERS
HOLD EACH OTHER
ACCOUNTABLE
26
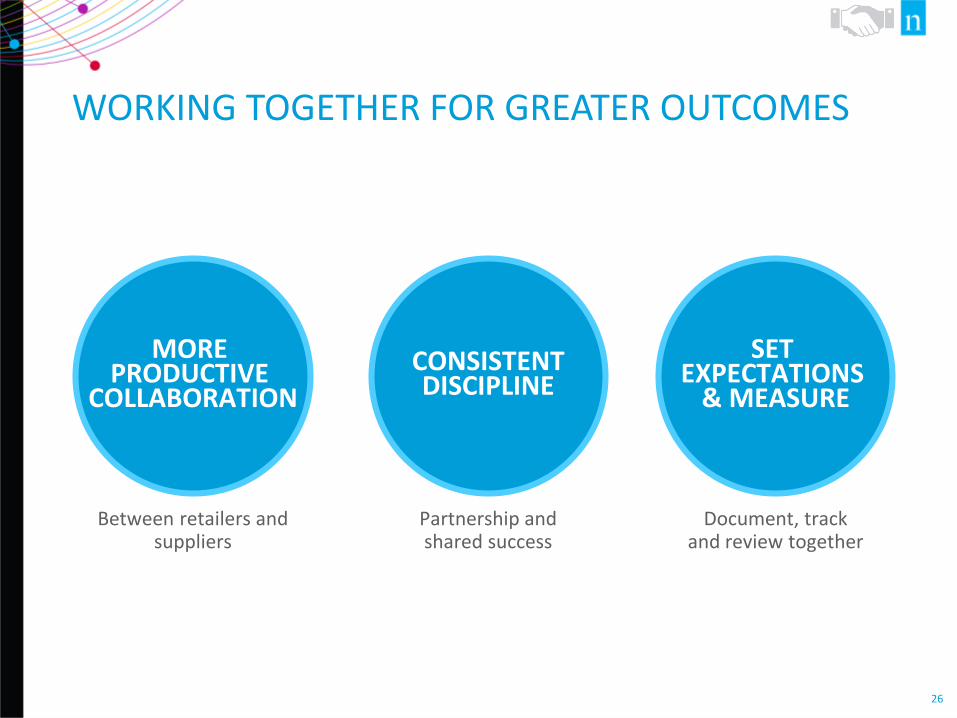
WORKING TOGETHER FOR GREATER OUTCOMES
CONSISTENTDISCIPLINE
Partnership and shared success
MORE PRODUCTIVE
COLLABORATION
SET EXPECTATIONS
& MEASURE
Between retailers and suppliers
Document, track and review together
Cop
yri
gh
t ©
20
16
Th
e N
iels
en
Com
pa
ny.
Con
fid
en
tia
l a
nd
pro
pri
eta
ry.
27
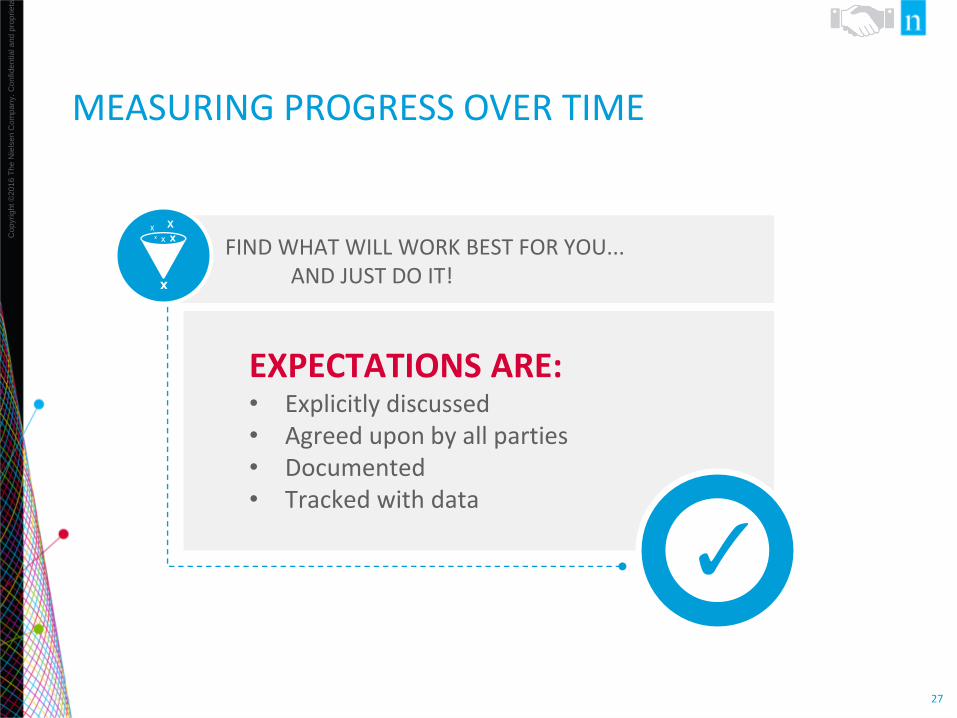
MEASURING PROGRESS OVER TIME
EXPECTATIONS ARE:• Explicitly discussed• Agreed upon by all parties• Documented• Tracked with data
FIND WHAT WILL WORK BEST FOR YOU...AND JUST DO IT!
28
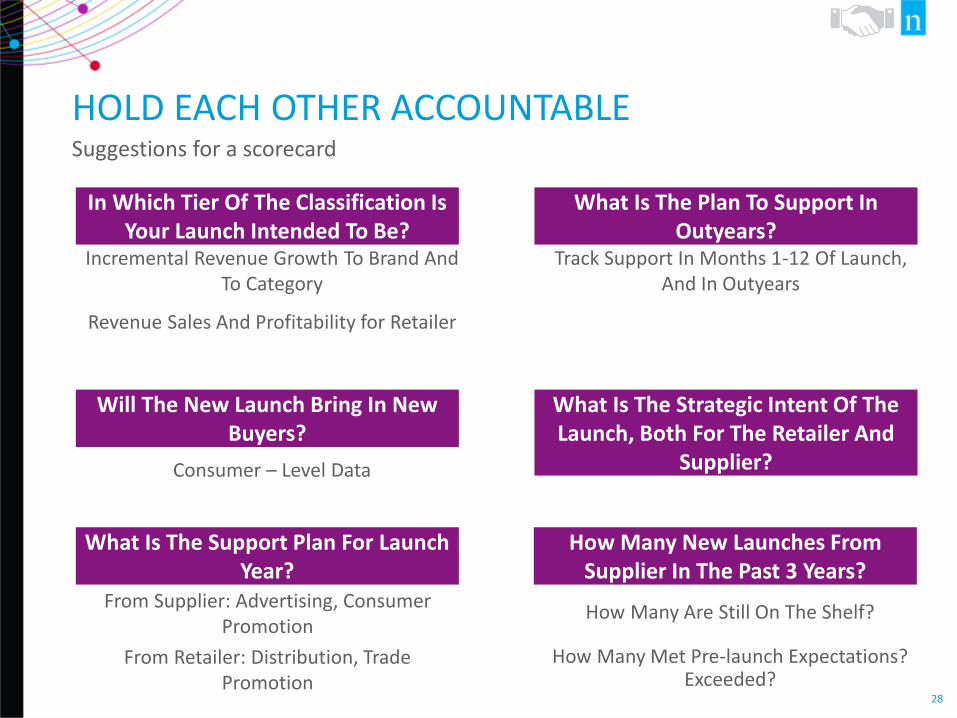
HOLD EACH OTHER ACCOUNTABLE
In Which Tier Of The Classification Is Your Launch Intended To Be?
Incremental Revenue Growth To Brand And To Category
Revenue Sales And Profitability for Retailer
Will The New Launch Bring In New Buyers?
Consumer – Level Data
What Is The Support Plan For Launch Year?
From Supplier: Advertising, Consumer Promotion
From Retailer: Distribution, Trade Promotion
What Is The Plan To Support In Outyears?
Track Support In Months 1-12 Of Launch, And In Outyears
What Is The Strategic Intent Of The Launch, Both For The Retailer And
Supplier?
How Many New Launches From Supplier In The Past 3 Years?
How Many Are Still On The Shelf?
How Many Met Pre-launch Expectations? Exceeded?
Suggestions for a scorecard
29
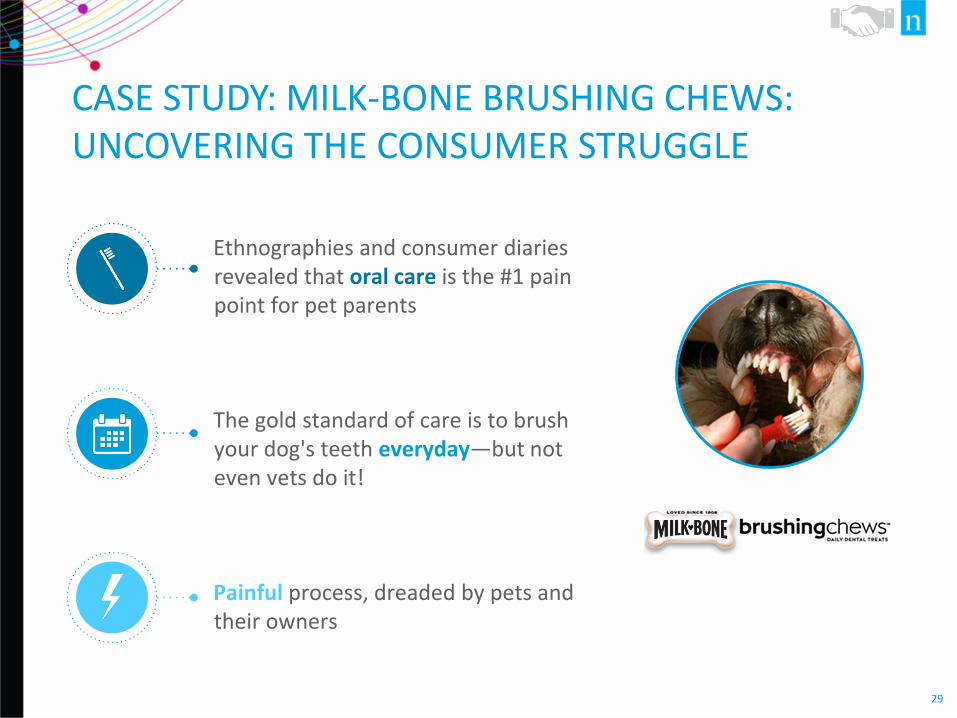
CASE STUDY: MILK-BONE BRUSHING CHEWS: UNCOVERING THE CONSUMER STRUGGLE
Ethnographies and consumer diaries revealed that oral care is the #1 pain point for pet parents
The gold standard of care is to brush your dog's teeth everyday—but not even vets do it!
Painful process, dreaded by pets and their owners
30
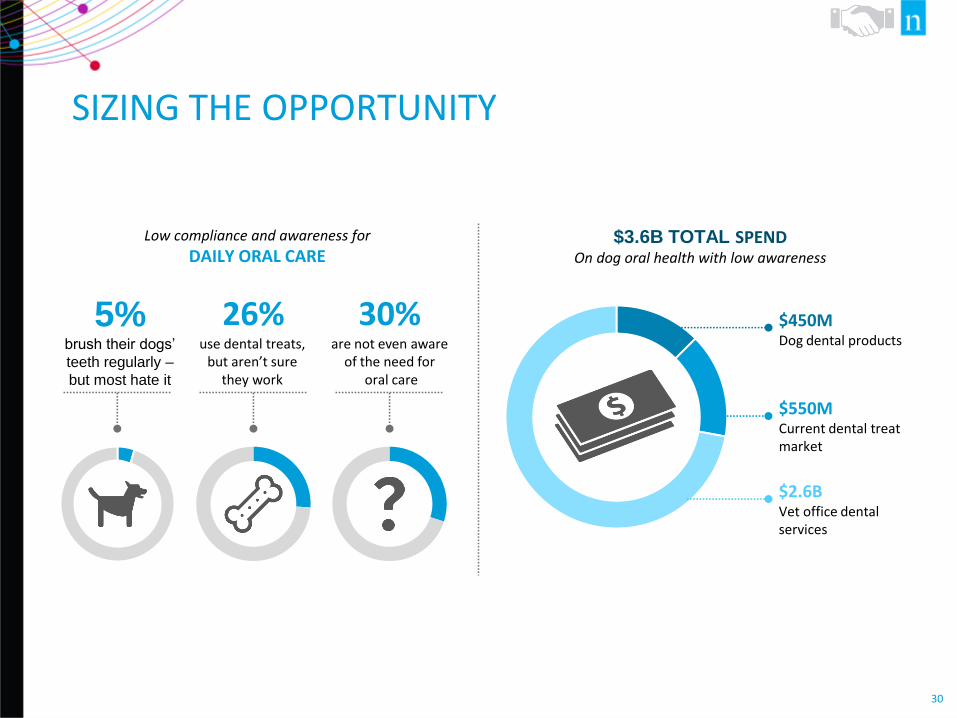
SIZING THE OPPORTUNITY
Low compliance and awareness for
DAILY ORAL CARE$3.6B TOTAL SPEND
On dog oral health with low awareness
5%brush their dogs’
teeth regularly –
but most hate it
26%use dental treats,
but aren’t sure they work
30%are not even aware
of the need fororal care
$2.6BVet office dentalservices
$550MCurrent dental treat market
$450MDog dental products
31
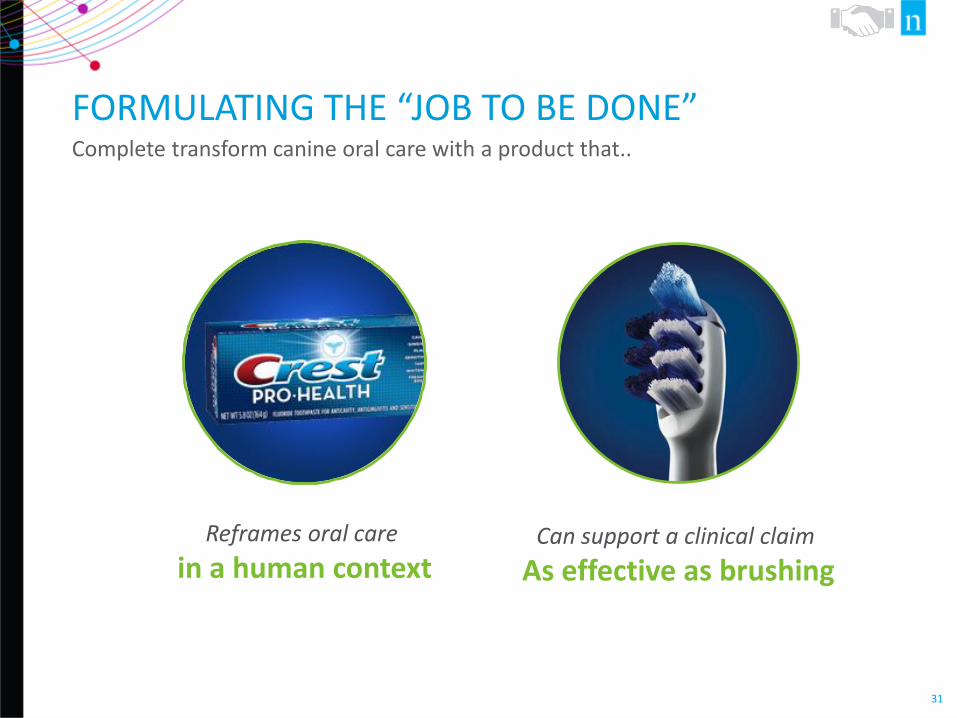
FORMULATING THE “JOB TO BE DONE”Complete transform canine oral care with a product that..
Reframes oral care
in a human contextCan support a clinical claim
As effective as brushing
32
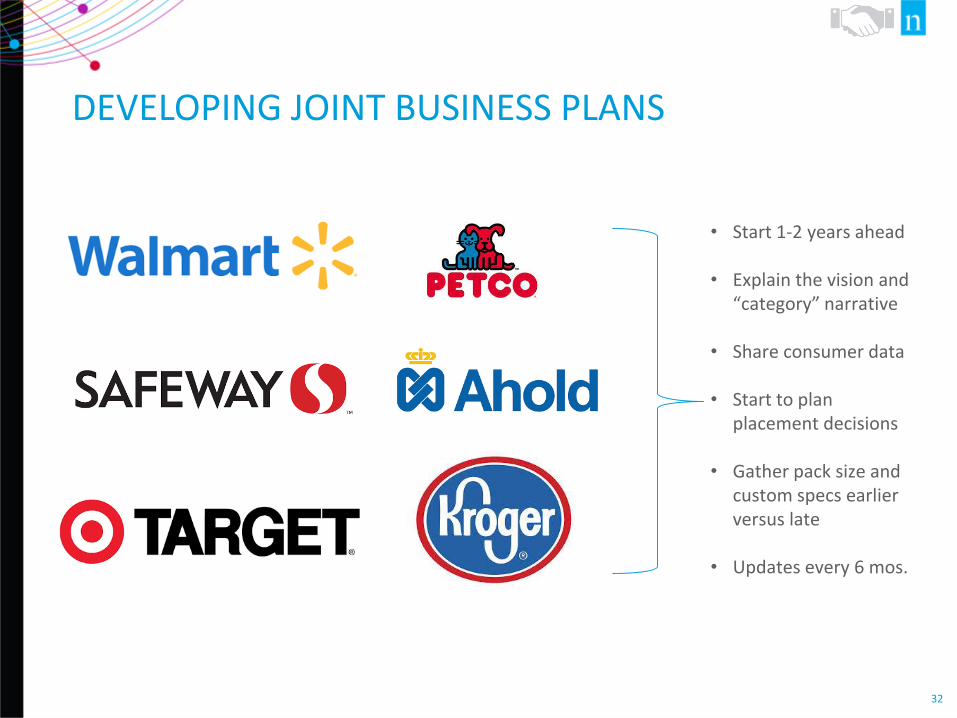
DEVELOPING JOINT BUSINESS PLANS
• Start 1-2 years ahead
• Explain the vision and “category” narrative
• Share consumer data
• Start to plan placement decisions
• Gather pack size and custom specs earlier versus late
• Updates every 6 mos.
33
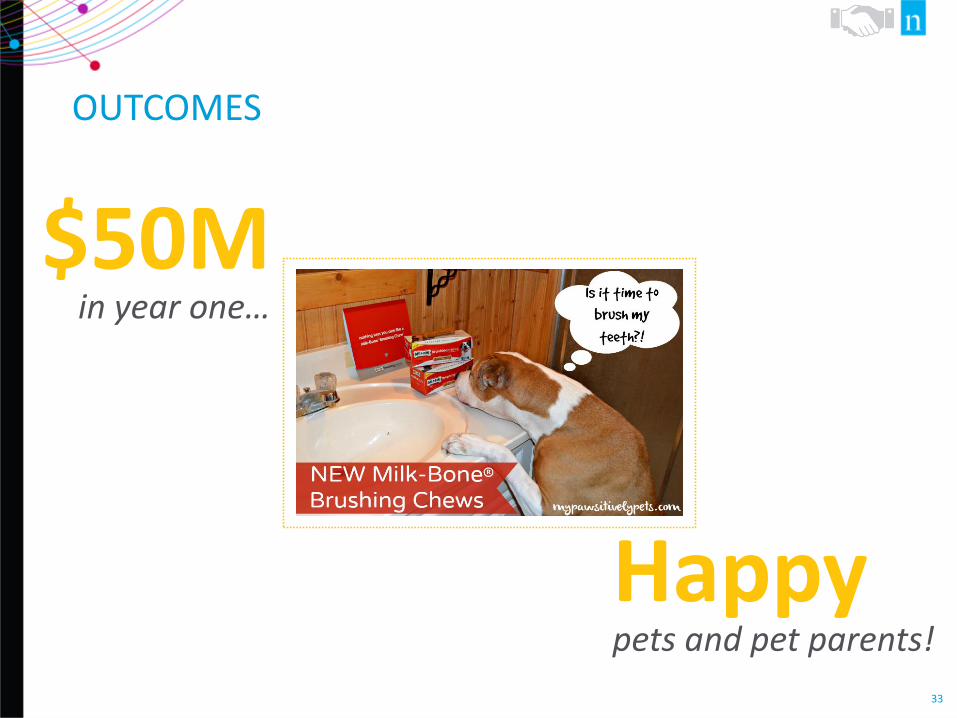
OUTCOMES
$50Min year one…
Happypets and pet parents!
34
“”
Building distribution, cultivating retailer relationships, working hard on the in-store execution – this is mundane stuff, but it’s the bones and flesh of great consumer products businesses. Bai, 2016 Nielsen Breakthrough
Innovation Report
WORK TOGETHER TO CREATE GROWTH
OPPORTUNITIES

36
“”
Sometimes I feel like it’s a launch and leave. There’s excitement when it launches, but then we just move on to the next thing. It should be launch and leverage!
Cop
yri
gh
t ©
20
16
Th
e N
iels
en
Com
pa
ny.
Con
fid
en
tia
l a
nd
pro
pri
eta
ry.
37
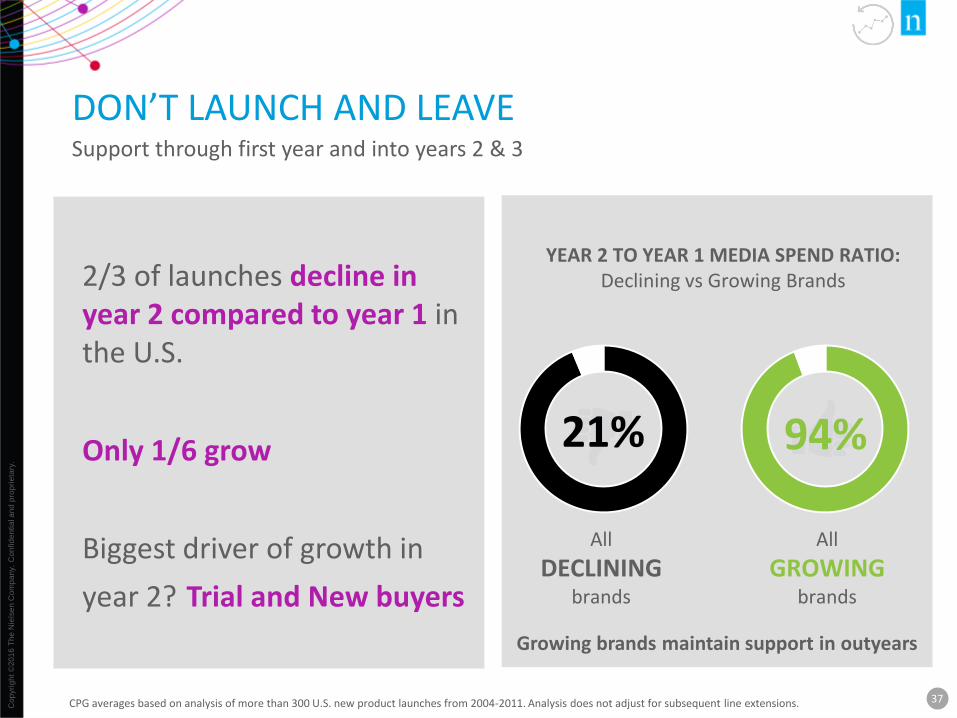
DON’T LAUNCH AND LEAVESupport through first year and into years 2 & 3
2/3 of launches decline in year 2 compared to year 1 in the U.S.
Only 1/6 grow
Biggest driver of growth in
year 2? Trial and New buyers
CPG averages based on analysis of more than 300 U.S. new product launches from 2004-2011. Analysis does not adjust for subsequent line extensions.
All
GROWINGbrands
94%
All
DECLININGbrands
21%
YEAR 2 TO YEAR 1 MEDIA SPEND RATIO:Declining vs Growing Brands
Growing brands maintain support in outyears
38
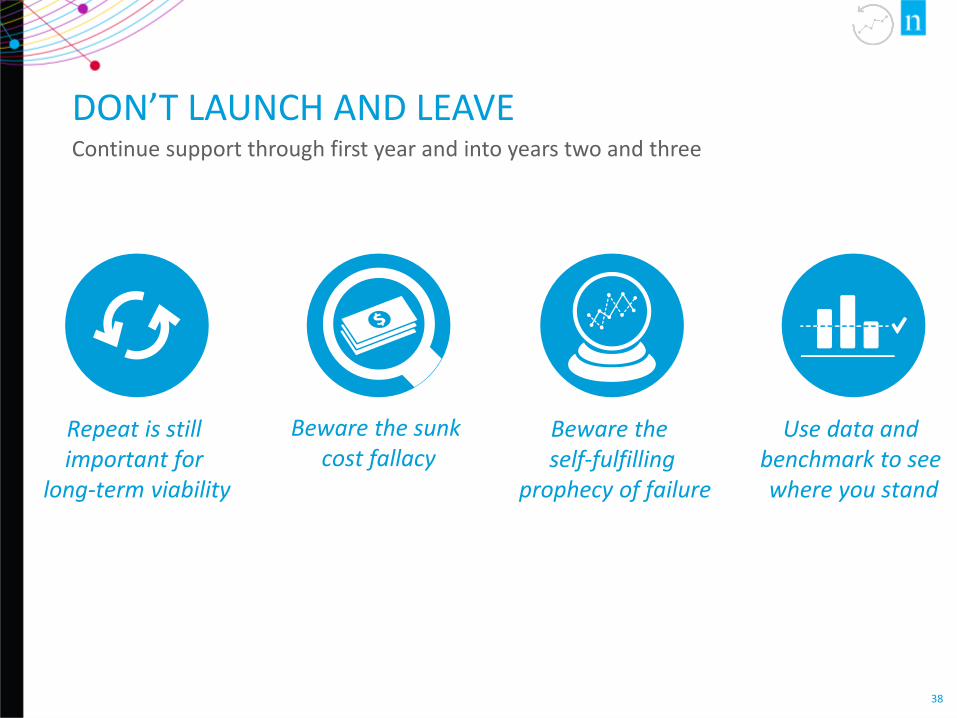
DON’T LAUNCH AND LEAVEContinue support through first year and into years two and three
Repeat is still important for
long-term viability
Beware the sunk cost fallacy
Beware the self-fulfilling
prophecy of failure
Use data and benchmark to see where you stand
39
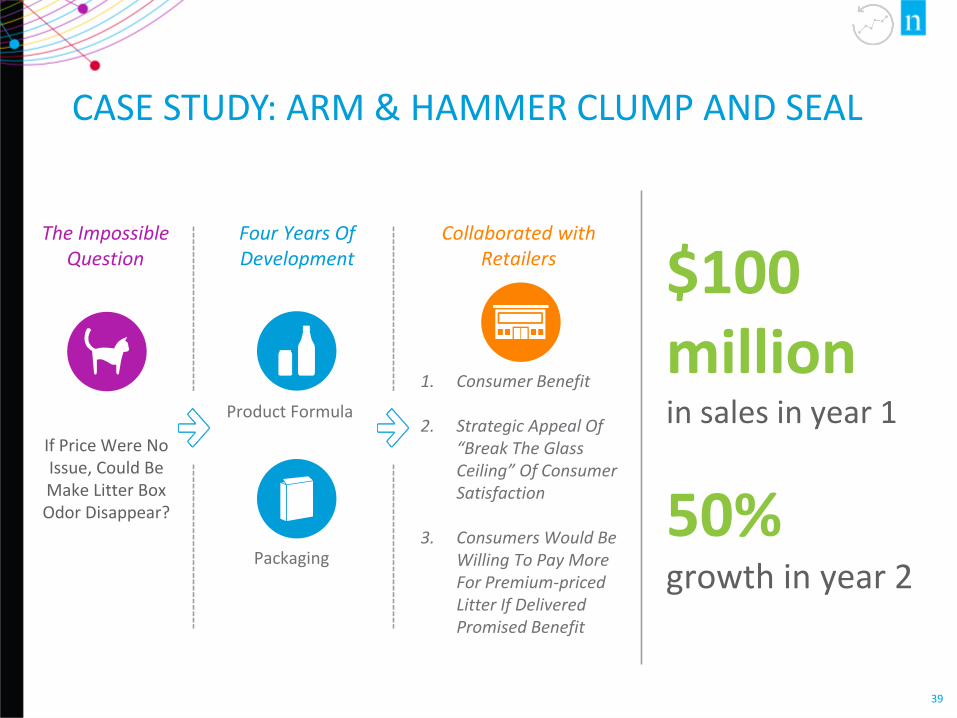
CASE STUDY: ARM & HAMMER CLUMP AND SEAL
$100 million in sales in year 1
50% growth in year 2
If Price Were No Issue, Could Be Make Litter Box Odor Disappear?
Product Formula
Packaging
Four Years Of Development
Collaborated with Retailers
1. Consumer Benefit
2. Strategic Appeal Of “Break The Glass Ceiling” Of Consumer Satisfaction
3. Consumers Would Be Willing To Pay More For Premium-priced Litter If Delivered Promised Benefit
The Impossible Question
WORK TOGETHER TO CREATE GROWTH
OPPORTUNITIES

41
HOW CAN RETAILERS AND SUPPLIERS COLLABORATE BETTER?
SET THE RIGHT KIND OF
EXPECTATIONS
HOLD EACH OTHER ACCOUNTABLE
WORK TOGETHER TO CREATE GROWTH
OPPORTUNITIES