innovative residential floor construction: structural evaluation of steel
TRANSCRIPT

U.S. Department of Housing and Urban Development Office of Policy Development and Research
INNOVATIVE RESIDENTIAL FLOOR CONSTRUCTION:
STRUCTURAL EVALUATION OF STEEL JOISTS WITH
PRE-FORMED WEB OPENINGS


INNOVATIVE RESIDENTIAL FLOOR CONSTRUCTION:
STRUCTURAL EVALUATION OF STEEL JOISTS WITH PRE-FORMED WEB OPENINGS
Prepared for
The U.S. Department of Housing and Urban Development Office of Policy Development and Research Washington, DC
and
Dietrich Industries, Inc. Pittsburgh, PA
and
The National Association of Home Builders Washington, DC
by
NAHB Research Center, Inc. 400 Prince George's Boulevard Upper Marlboro, MD 20774-8731
Contract No. H-21134CA
March 1999

Disclaimer
While the information in this document is believed to be accurate, neither the authors, nor reviewers, nor the U.S. Department of Housing and Urban Development of the U.S. Government, nor Dietrich Industries, Inc., nor the National Association of Home Builders, nor the NAHB Research Center, Inc., nor any of their employees or representatives makes any warranty, guarantee, or representation, expressed or implied, with respect to the accuracy, effectiveness, or usefulness of any information, method, or material in this document, nor assumes any liability for the use of any information, methods, or materials disclosed herein, or for damages arising from such use.
The contents of this report are the views of the contractor and do not necessarily reflect the views or policies of the U.S. Department of Housing and Urban Development or the U.S. Government.
ii
Acknowledgements
This report was prepared by the NAHB Research Center under sponsorship of the U.S. Department of Housing and Urban Development (HUD), Dietrich Industries, Inc. and the National Association of Home Builders (NAHB). Special appreciation is extended to William Freeborne of HUD and Greg Ralph and Jeff Pribyl of Dietrich Industries for their guidance and assistance throughout the project.
The principal author of this report is Nader R. Elhajj, P.E. G. Robert Fuller, P.E., and Jay Crandell, P.E., provided technical review. Christian Jacobs and Jeff Pribyl provided lab support and Lynda Marchman provided administrative support.
iii

iv

Table of Contents
Acknowledgements........................................................................................................................ iii
1.0 Introduction......................................................................................................................... 1
2.0 Literature Review................................................................................................................ 2
3.0 Experimental Approach ...................................................................................................... 3
3.1 Test Plan and Specimens .........................................................................................5 3.2 Test Procedure .........................................................................................................6
4.0 Analytical Approach ......................................................................................................... 10
4.1 Web Elements without Openings...........................................................................10 4.2 Web Elements with Openings................................................................................11
5.0 Test Results....................................................................................................................... 13
5.1 Tensile Coupon Tests.............................................................................................13 5.2 Shear Tests .............................................................................................................13 5.3 Bending Tests.........................................................................................................14 5.4 Combined Shear and Bending Tests ......................................................................14 5.5 Web Crippling Tests ..............................................................................................14 5.6 Failure Modes ........................................................................................................15
6.0 Analysis of Test Data........................................................................................................ 16
7.0 Summary ........................................................................................................................... 21
8.0 Conclusions....................................................................................................................... 23
9.0 References......................................................................................................................... 24
Appendix A - Test Results
Appendix B - Sample Calculations
Appendix C - Safety Factor Calculation
Appendix D - Test Photographs
Appendix E - Test Plots
Appendix F - Metric Conversion
v

vi

List of Tables
Table 1 Floor Joist and Opening Dimensions .................................................................................4 Table 2 Floor Joist Test Plan............................................................................................................5 Table 3 Shear Test Results.............................................................................................................13 Table 4 Bending Test Results ........................................................................................................14 Table 5 Combined Shear and Bending Test Results ......................................................................14 Table 6 Web Crippling Test Results ..............................................................................................15 Table 7 Evaluation of Shear Test Data...........................................................................................16 Table 8 Evaluation of Bending Test Data ......................................................................................17Table 9 Evaluation of Web Crippling Test Data............................................................................17 Table 10 Evaluation of Combined Shear and Bending Test Data....................................................18 Table 11 Comparison of Tested and Calculated Allowable Loads ..................................................19 Table 12 Ratio of Tested to Calculated Allowable Loads Due to Shear ..........................................20 Table 13 Ratio of Tested to Calculated Allowable Loads Due to Bending......................................20 Table 14 Ratio of Tested to Calculated Allowable Loads Due to Shear & Bending .......................20 Table 15 Ratio of Tested to Calculated Allowable Loads Due to Web Crippling ...........................21 Table 16 Measured vs. Predicted Deflections ..................................................................................21Table A1 Physical and Mechanical Properties of Test Specimens ..................................................A1 Table A2 Mean Physical and Mechanical Properties of Test Specimens ........................................A2 Table A3 Standard Deviation and Coefficient of Variation of Physical and Mechanical Properties......................................................................................................A2 Table A4 Tested Ultimate Capacity of Floor Joists ...................................................................A3,A4 Table A5 Measured Mid-Span Deflections of Joists .......................................................................A5
List of Figures
Figure 1 Joist with 8-inch Web Depth...............................................................................................4 Figure 2 Joists with 10-inch and 12-inch Web Depths......................................................................4 Figure 3 Shear Test Setup .................................................................................................................7 Figure 4 Bending Test Setup .............................................................................................................7 Figure 5 Combined Bending and Shear Test Setup...........................................................................8 Figure 6 ETF Web Crippling Test Setup...........................................................................................9 Figure 7 ITF Web Crippling Test Setup............................................................................................9 Figure 8 Stiffened ETF Web Crippling Test Setup ...........................................................................9
vii

viii
1.0 Introduction
Over the past several years, the materials used to construct the frame of a home have been subject to various forces that have contributed to upward pressures on home prices. Unpredictable fluctuations in the price of framing lumber, as well as concerns with its quality, have caused builders and other providers of affordable housing to seek alternative building products.
Since 1992, the U.S. Department of Housing and Urban Development (HUD) has sponsored numerous successful studies to identify, evaluate, and implement innovative structural materials, such as cold-formed steel, in the residential market. For example, a comprehensive set of prescriptive construction guidelines was developed for residential cold-formed steel [1]. Similar to wood-framing, these guidelines are now accepted in current U.S. building codes [2]. However, the use of steel framing is still very limited, partly because steel is not being effectively “integrated” into conventional home construction. Cold-formed steel framing (CFS) is particularly suitable for residential floor systems, because thermal issues are minimal and most floors are currently constructed of more expensive, older growth lumber to meet the loading requirements. Therefore, it is appropriate to focus attention on improving the cost-effective use of steel in one of its most promising applications ⎯ residential floors.
One of the major barriers to the use of CFS floor joists is the impact it has on placement of large waste drains and ductwork installed in the floor system. Current requirements limit maximum hole (opening) sizes in CFS joists to about 2.5-inches (6.35 cm) in diameter. This limitation can accommodate short plumbing runs and electrical wiring, but restricts the use of larger and longer septic drains and ductwork.
Cold-formed steel C-sections are typically produced with standard web perforations or web openings ranging in size from 3/4-inch (1.91 cm) by 2-inch (5.08 cm) to 1-1/2-inch (3.81 cm) by 4-inch (10.16 cm). These holes are typically located along the centerline of the member with a spacing of 24 inches (61 cm) on center. The current AISI Design Specification does not explicitly address web perforations in flexural members [3]. The specification does address local buckling behavior of solid webs and webs with small circular holes. Thus, the advantage of being able to provide commodity CFS steel floor joists with larger sized holes is not realized.
The objectives of this test program are to:
1) develop an innovative preformed hole detail for CFS joists; 2) determine the structural performance of typical CFS joists with various hole
dimensions and locations; and 3) provide substantiation for needed building code improvements.
CFS floor joist serviceability issues (such as vibration and noise) are not addressed in this report; however, the presence of large holes in CFS joists have not been shown to appreciably affect floor vibration characteristics [4].
Some of the practical benefits of this innovation in the design of CFS floor joists are as follows:
• availability as a commodity product,
1

• job site flexibility (i.e. constructability), • allowance for larger HVAC ducts, plumbing, and electrical systems in the floor
cavity, • elimination of shrinkage problems occasionally experienced with wood frame
floors, • capability of long spans, and • light weight.
This report begins with a brief literature review of relevant work followed by a detailed overview of the experimental and analytical approach. Next, experimental results are presented and analyzed in comparison to existing design specifications and guidelines. The report closes with practical conclusions that recommend adoption of the findings in residential and commercial applications. Appendices at the end of the report give detailed data and example calculations.
2.0 Literature Review
ICBO Evaluation Service, Inc. Acceptance Criteria AC46 [5] provides a method of calculating the allowable bending moment, allowable shear, and allowable web crippling strength for a perforated steel flexural member subject to the following limitations:
• Web perforations center-to-center spacing shall be no less than 24-inches (6.1 cm). • Web perforation maximum width shall be the lesser of 0.5 times the member depth or
2-1/2-inches (6.4 cm). • Web perforation length shall not exceed 4-1/2-inches (11.4 cm). • Minimum distance between the end of the member and the near edge of the web hole
shall be 10-inches (25.4 cm). • All web holes shall be located along the centerline of the web. • The section height-to-thickness ratio, h/t, shall not be greater than 200.
The American Iron and Steel Institute (AISI) published a design guide titled “Design Guide for Cold-Formed Steel Beams with Web Perforations” [6] that provides design recommendations for beams with web perforations. The design guide is based on studies conducted at the University of Missouri-Rolla, (UMR). The UMR design recommendations are based on full-scale C-section beams having web height-to-thickness (h/t) ratios as high as 200 and hole depth-to-web depth (a/h) ratios as high as 0.8. The test program considered rectangular and circular openings. Three hole diameters were studied: 2-inch (5.1 cm) and 4-inch (10.2 cm) holes in 6-inch (15.2 cm) deep C-section beams and 6-inch (15.2 cm) holes in 8-inch (20.3 cm) deep C-section beams. In the Design Guide, limit states of bending, shear, and web crippling as well as combinations of bending-and-shear and bending-and-web crippling were addressed.
Shan determined that the local buckling characteristics of a flexural member are slightly influenced by the presence of web perforations along the centerline of the web, a region of only minor bending stress [7] [8]. Shan recommended the following equation to determine the nominal moment (flexural) capacity, Mn, of a beam containing web punchouts:
Mn = Sxe Fy
2

Fy is the yield stress of the steel and Sxe is the effective section modulus computed at Fy. Sxe is calculated utilizing the effective width approach of the AISI Design Specification [3]. The effective compression portion of the web is computed assuming the web element above the punchout to be an unstiffened compression element under uniform stress, Fy, with a plate buckling coefficient, k, of 0.43.
Schuster et al. also investigated the degradation in web shear strength due to the presence of a web perforation [9]. The findings were similar to those of UMR.
Langan investigated the effect of web perforations on the End-One-Flange (EOF) loading condition for web crippling and combined bending and web crippling [10]. The EOF loading condition is defined in Section C3.4 of the AISI Design Specification [3]. Langan introduced reduction factor equations that can be applied to AISI Equations C3.4-1 and C3.4-2. The reduction factor equations are applicable only to single web unreinforced sections when the web opening is not located above or below the EOF concentrated load. Langan’s reduction factor equations ensure that limit states associated with web crippling and combined bending and web crippling are accommodated. Other failure modes, however, (i.e. shear, flexure, and combinations thereof) were not addressed by Langan.
Yu and Davis and Sivakumaran and Zielonka performed experimental studies on the web crippling behavior of cold-formed steel flexural members with web perforations [11] [12]. Both of these investigations were primarily concerned with the Interior-One-Flange (IOF) loading condition with the web perforation centered along the member’s web as described in Section C3.4 of the AISI Design Specification [3]. As a result of these investigations, reduction factors were developed. LaBoube recommended modifications to Sivakumaran’s and Zielonka’s equations as an interim design recommendation [13].
3.0 Experimental Approach
As an initial step, a functional preformed hole detail was developed as shown in Figure 1, Figure 2, and Table 1. The holes were stiffened with cold-formed folded edges having a depth (across the web) up to 6-1/4-inches (15.9 cm) in 10- and 12-inch (25.4 and 30.5 cm) joists. These holes may be located anywhere along the centerline of the CFS joist span with a minimum center-tocenter spacing of 24-inches (61 cm).
3

Table 1 Floor Joist and Opening Dimensions
Nominal SSMA Minimum Web Flange Hole Hole Hole Joist Size Designation1 Thickness Size Width Depth2 Length3 Bend
“t” “h” (in.) “a” (in.) Radius (in.) (in.) (in.) (in.)
2 x 8 x 43 800S162-43 0.043 8 1.625 4.25 7.00 2.21 2 x 8 x 54 800S162-54 0.054 8 1.625 4.25 7.00 2.21 2 x 10 x 54 1000S162-54 0.054 10 1.625 6.25 9.00 3.21 2 x 12 x 54 1200S162-54 0.054 12 1.625 6.25 9.00 3.21 2 x 12 x 68 1200S162-68 0.068 12 1.625 6.25 9.00 3.21
For SI: 1 inch = 2.54 cm. 1 This designation system is used by the Steel Stud Manufacturers’ Association’s (SSMA). 2 Hole depth is the dimension of the hole measured across the depth of the joist. 3 Hole length is the dimension of the hole measured along the length of the joist.
Figure 1 - Joist with 8-inch Web Depth
Figure 2 - Joists with 10-inch and 12-inch Web Depths 4

3.1 Test Plan and Specimens
A total of 67 CFS joists with the stiffened hole details were tested in a variety of configurations as shown in Table 2. All steel materials conformed to the dimensional requirements of Table 1 and had a minimum specified tensile strength of 33 or 50 ksi (228 and 345 MPa), which was verified by tensile tests in accordance with ASTM A370 [14]. Tensile tests were performed on a sample of three joists for each joist size and thickness. Base steel thicknesses were measured in accordance with ASTM A90 [15]. Mechanical properties were based on coupons cut longitudinally from the center of the specimen’s web.
Table 2Floor Joist Test Plan
Nominal Joist Size
SSMA Designation
Thickness (Gauge)
Yield Strength
(ksi)
Span Length (ft-in)
Test No. Planned Failure Mode
2 x 8 x 43 800S162-43 18 33 2’-6” 1,2,3 Shear 2 x 8 x 43 800S162-43 18 33 2’-0” 7,8 Web Crippling (ETF) 2 x 8 x 43 800S162-43 18 33 2’-0” 9,10,11 Web Crippling (ITF) 2 x 8 x 43 800S162-43 18 33 2’-0” 12,13,14 Web Crippling
(ETF Stiffened) 2 x 8 x 43 800S162-43 18 33 8’-0” 4,5,6 Combined Shear &
Bending 2 x 8 x 43 800S162-43 18 33 12’-0” 15,16,17 Bending 2 x 8 x 54 800S162-54 16 50 2’-6” 18,19,20 Shear 2 x 8 x 54 800S162-54 16 50 8’-0” 21,22,23 Combined Shear &
Bending 2 x 8 x 54 800S162-54 16 50 12’-0” 24,25,26 Bending
2 x 10 x 54 1000S162-54 16 50 2’-6” 27,28,29 Shear 2 x 10 x 54 1000S162-54 16 50 8’-0” 30,31,32 Combined Shear &
Bending 2 x 10 x 54 1000S162-54 16 50 20’-0” 33,34,35 Bending 2 x 12 x 54 1200S162-54 16 50 2’-6” 36,37,38 Shear 2 x 12 x 54 1200S162-54 16 50 2’-0” 45,46 Web Crippling (ETF) 2 x 12 x 54 1200S162-54 16 50 2’-0” 47,48 Web Crippling (ITF) 2 x 12 x 54 1200S162-54 16 50 2’-0” 49,50 Web Crippling
(ETF Stiffened) 2 x 12 x 54 1200S162-54 16 50 8’-0” 39,40,41 Combined Shear &
Bending 2 x 12 x 54 1200S162-54 16 50 20’-0” 42,43,44 Bending 2 x 12 x 68 1200S162-68 14 50 2’-6” 51,52,53 Shear 2 x 12 x 68 1200S162-68 14 50 2’-0” 61,62 Web Crippling (ETF) 2 x 12 x 68 1200S162-68 14 50 2’-0” 63,64,65 Web Crippling (ITF) 2 x 12 x 68 1200S162-68 14 50 2’-0” 66,67 Web Crippling
(ETF Stiffened) 2 x 12 x 68 1200S162-68 14 50 8’-0” 54,55,56, 57 Combined Shear &
Bending 2 x 12 x 68 1200S162-68 14 50 20’-0” 58,59,60 Bending
Total Number of Tests 67 For SI: 1 inch = 2.54 cm, 1 foot = 0.3 m, 1 ksi = 6.9 MPa.
5

3.2 Test Procedure
The specimens were tested in the NAHB Research Center’s Universal Testing Machine (UTM) using the test method in ASTM D198-97 [16]. The ASTM standard requires specimens to be mounted in a testing apparatus capable of applying measurable loads at a constant load rate.
The cross-head of the UTM was fitted with an apparatus capable of applying the total load at one point or two points equidistant from the reactions. The locations of the two point loads and end reactions divide the specimen (bending test) into three equal sections. The load was applied by the UTM and transmitted to the load plates by a cross beam. The following information was recorded and reported for each test:
• Depth, width, return lip, and hole size of specimens (see Table A1 of Appendix A), • Span length (see Table 2), • Load, support mechanics, and any lateral supports used, • Rate of load application, • Actual physical and mechanical properties, including thickness, yield strength, ultimate
strength (coupon tests), and a statistical measure of variability of these values (see Tables A1, A2, and A3 of Appendix A),
• Description of observed failure mode, and, • Ultimate loads and deflections and a statistical measure of variability of these values (see
Tables A4 and A5 of Appendix A).
When thin steel bending members with web openings are subjected to loads, three failure modes may occur: (a) bending, (b) shear, or (c) web crippling. Therefore, joists were tested to induce shear failure, bending failure, web crippling failure, and combined shear and bending interaction failure.
Shear Test
The purpose of this test was to investigate the behavior of a single web with openings when subjected to a constant shear force. To preclude web crippling at load point, stiffeners were attached vertically to the web. Short span members were used to minimize the influence of bending. Each test specimen utilized a single joist, simply supported, with a 30-inch (76.2 cm) long span. Rollers and bearing plates were used at each end. To prevent the beam from moving laterally and rotating, vertical rollers were positioned at both ends. In addition, lateral supports braced the central portion of the joist to prevent lateral movements at mid span. Both ends of each joist were reinforced to prevent web crippling failure. A small gap was provided between the joist and the web stiffeners and the stiffener screws were located closer to the center of the web to eliminate the web crippling failure mode without impacting the shear strength of the web. A concentrated load was applied near the joist support, as shown in Figure 3. A deflection gage was placed under the joist to measure the vertical deflection of the test specimen at mid-span.
6

P
24”
30”
Lateral Support
Figure 3 - Shear Test Setup
Bending Test
The purpose of this test was to investigate pure bending capacity of joists stabilized against lateral-torsional buckling. To stabilize the specimen against lateral-torsional buckling, each test specimen consisted of two C-shaped sections inter-connected by 23/32-inch (1.83 cm) thick oriented-strand-board (OSB) and 5/8- inch (1.6 cm) thick gypsum board strips. The 6-inch x 16inch x 1/2-inch (15.2 cm x 40.6 cm x 1.3 cm) OSB strips were spaced at 24-inches (61 cm) on center and fastened to top flanges with #8 self-drilling, tapping screws (two screws per flange). The 5/8-inch (1.6 cm) gypsum board strips were also spaced at 24-inches (61 cm) on center and fastened to the bottom flanges with #6 self-drilling, tapping screws (two screws per flange). The test set up is shown in Figure 4. Vertical rollers were positioned at each end to prevent the joist from moving laterally and rotating. Rollers and bearing plates were used at each end of the assembly. Two concentrated loads were applied at third point locations of each specimen. This loading arrangement provided a pure moment region in the central portion of the beam while the two end sections experienced a linearly increasing bending moment with increasing distance from the ends. A deflection gage was placed under the assembly at mid-span to measure the vertical deflection of the test specimen.
80” (for 10” & 12” Joists)P
23/32” OSB P 48” (for 8” Joists)
5/8” Gypsum Board 24” 24” TYP.
240” (for 10” and 12” Joists)
144” (for 8” Joists)
Figure 4 - Bending Tests Setup
7

Combined Shear and Bending (Interaction) Test
The purpose of this test is to investigate the behavior of a single joist with web openings when subjected to a combined shear force and bending moment. Each test specimen was tested as a continuous two-span beam subjected to two point loads. The continuous joist length was 8-feet (2.4 m), with each span 48-inches (122 cm) long. Point loads were applied at a distance of 24inches (61 cm) from each end. Rollers and bearing plates were used at each end and a bearing plate was used at mid-span. Vertical rollers were positioned at both ends to prevent the beam from moving laterally or rotating. In addition, lateral supports were attached to the central portion of the beam to prevent lateral-torsional buckling of the test specimens. Web Stiffeners were installed at both load locations and at joist ends to prevent local buckling failure. Deflection gages were placed under each point load to measure the vertical deflection of the test specimen. The combined shear and bending test configuration is shown in Figure 5.
48” 48” PP 24”
Lateral Support
96”
Figure 5 - Combined Bending and Shear Test Setup
Web Crippling Test
Web crippling tests were conducted utilizing single simply supported joists with 24-inch (61 cm) spans. Rollers and bearing plates were used at each end. Vertical rollers were positioned at each end to prevent the joist from moving laterally or rotating. In addition, braces were attached to the central portion of the joist. Three different loading configurations were investigated with respect to web crippling failure. They are described as follows:
• End-Two-Flange (ETF). The test specimens had the edge of the hole aligned with the edge of the bearing support but not less than 3-inches (7.6 cm) from the end of the joist. The load was applied at the bearing support. This configuration is shown in Figure 6. Bearing plates and rollers were placed at bearing reactions to achieve a simple support condition for the specimen.
8

P
2 4 ”
L a te ra l S u p p o rt
3 ”
Figure 6 - ETF Web Crippling Test Setup
• Interior-Two-Flange (ITF). Each test specimen had the hole and the load centered on the joist span. A bearing support was located directly under the load point as shown in Figure 7. Lateral supports were provided at each end of the specimen.
P 12” Lateral Support
24”
Figure 7 - ITF Web Crippling Test Setup
• Stiffened End-Two-Flange (ETF) loading. Each test specimen had the hole centered at the edge of the joist span with the load applied at the center of the bearing location as shown in Figure 8. Lateral support was provided near one end of the specimen as shown in Figure 8.
P Lateral Support
Figure 8 - Stiffened ETF Web Crippling Test Setup
24”
9

4.0 Analytical Approach
4.1 Web Elements without Openings
The AISI Design Specification [3] provides equations for the determination of a member’s capacity (i.e. shear, bending, web crippling, etc.) based on a solid section (i.e. section with no holes). The design checks are as follows:
Bending Strength
According to the AISI Design Specification [3], the nominal moment capacity for a flexural member, Mn, is:
Mn = Sef
Where Se is the effective section modulus at some stress level f. This means that the flexural capacity of a C-joist is a function of the stress at the buckling load times the effective section modulus calculated at the buckling stress.
Shear Strength
The nominal shear capacity is given as a function of the flat portion of the web, the thickness of the web, and the shear buckling coefficient (kv). The nominal shear strength, Vn, at any section along the joist is calculated using Section C3.2 of the AISI Design Specification [3] as follows:
EkvFor h t/ .≤ 0 96 ⇒ V = 0 60F ht F n . y
y
For 0 96 . Ekv < / ≤ 1415 . Ekv ⇒ Vn = 0 64 t 2h t . F Ek y vF Fy y
Ek π 2 Ek t 3
For h t/ > 1415 . Fy
v ⇒ Vn = 12 1 − μ
v 2 h
= 0 905. Ek t v 3 / h
( )
where: Vn = nominal shear strength, lb. (N) t = thickness of web, inches (cm) h = depth of flat portion of web, inches (cm)
kv = shear buckling coefficient = 5.34 for unreinforced webs. E = modulus of elasticity, psi (kPa) Fy = yield strength, psi (kPa) μ = poisson’s ratio for steel = 0.30
10

Combined Shear and Bending
Strength for combined bending and shear is calculated using Section C3.3 of the AISI Design Specification [3]. The applied moment, M, and applied shear, V, for beams with unreinforced webs must satisfy the following interaction equation:
2 2⎛ Ωb M ⎞ ⎛ ΩvV ⎞ ⎜⎜ ⎟⎟ + ⎜⎜ ⎟⎟ ≤ 1.0 ⎝ M nxo ⎠ ⎝ Vn ⎠ where:
Ωb = Factor of safety for bending per Section C3.1.1. Ωv = Factor of safety for shear per Section C3.2. Mnxo = Nominal flexural strength about the centroidal x-axis determined in
accordance with Section C3.1.1 of the AISI Design Specification, in.-lb. (N-cm)
Vn = Nominal shear force when shear alone exists, lb. (N).
Web Crippling
Web crippling strength is calculated using Section C3.4 of the AISI Design Specification [3]. Specification equation C3.4-6 is used for End-Two-Flange (ETF) loading and equation C3.4-8 is used for Interior-Two-Flange (ITF) loading.
ETF: Pn = t2 k C3 C4 C9 Cθ [244 - 0.57(h/t)][1 + 0.01(N/t)] Equation C3.4-6 ITF: Pn = t2 k C1 C2 C9 Cθ [771 - 2.26(h/t)][1 + 0.0013(N/t)] Equation C3.4-8
where: k = 894Fy/E Equation C3.4-21 C1 = 1.22 - 0.22k Equation C3.4-10 C2 = 1.06 - 0.06R/t ≤ 1.0 Equation C3.4-11 C3 = 1.33 - 0.33k Equation C3.4-12 C4 = 1.15 - 0.15R/t ≤ 1.0 (not less than 0.5) Equation C3.4-13 C9 = 1.0 (for kips and inches) Cθ = 0.7 + 0.3(θ/90)2 Equation C3.4-20 N = Bearing length, inch (cm). t = web thickness, inch (cm) h = Depth of the flat portion of the web, inch (cm). Pn = Nominal strength for concentrated load or reaction per web, kips
(kN). R = Inside bend radius, inch (cm). θ = Angle between the plane of the web and the plane of the bearing
surface ≥ 45° but not more than 90°.
4.2 Web Elements with Openings
The Design Guide for Cold-Formed Steel Beams with Web Penetrations [6] provides reduction factors that are applied to the AISI Specification’s equations to account for unstiffened web holes
11

that do not exceed 75 percent of the depth of the flat portion of the web and that are located along the centerline of the web. The following design checks are required:
Bending Strength
For members subjected to bending alone, the AISI Design Guide [6] recommends the nominal cross-section moment capacity, Mn, to be evaluated as follows: Mn = SeFy, where Se is the effective section modulus of the member.
When the ratio a/h (depth of the hole divided by the depth of the flat portion of the web) is smaller than 0.4, the Design Guide recommends that the hole be ignored and the gross web section be used in calculating Se.
When a/h ≥ 0.4, the effect of the hole must be considered by deducting the hole size from the web section in computing Se. The effective section modulus, Se, is determined using the effective width of the compression portion of the web above the penetration (hole) computed as an unstiffened compression element with k taken as 0.43 (for unstiffened hole).
Shear Strength
The AISI Design Guide [6] recommends two reduction factors (qs1 and qs2) to be applied to the shear capacity of a section with web holes as follows:
Vallow = qs1qs2Va
When c/t ≥ 54 ⇒ qs1 = 1.0 and qs2 = 1.0 When 5 ≤ c/t ≤ 54 ⇒ qs1= c/54t and qs2 = 1.5(V1/V2) - 0.5 ≤ 1.3
where: c = h/2 - a/2.83 for circular holes, inch (cm). c = h/2 - a/2 for all other web holes, inch (cm). t = Steel base metal thickness, inch (cm). a = Depth of hole, inch (cm). h = depth of flat portion of web, inch (cm). V1/V2 = The variation in shear along the longitudinal axis of the web hole.
V1 is the larger shear and V2 is the smaller shear at the edge of hole.
Va = Allowable shear strength calculated per Section C3.2 of the AISI Specification (with no holes), lb. (N).
Vallow = Allowable shear strength of section with holes, lb. (N).
Web Crippling
The web crippling capacity of flexural members with web holes subjected to concentrated load or reactions is reduced by a reduction factor, Rc. This reduction factor is applicable for End-One-Flange (EOF) and Interior-One-Flange (IOF) loading only. Tests in accordance with the Design Specification’s Section F1 must be conducted on two-flange loading conditions.
The reduction factors recommended in the AISI Design Guide [6] are shown below: 12

Pallow = Pa Rc
For EOF loading when hole is not within the bearing length: Rc = 1.01 - 0.325(a/h) + 0.083(x/h)
For IOF loading when hole is not within the bearing length: Rc = 0.900 - 0.047(a/h) + 0.053(x/h)
where: x = the nearest distance between hole & bearing edge, inch (cm). a = depth of web hole, inch (cm). h = depth of flat portion of web, inch (cm).
Combined Shear and Bending
As required in the AISI Design Guide [6], the interaction equation for combined shear and bending must be checked with the reduced shear and moment allowable capacities.
5.0 Test Results
5.1 Tensile Coupon Tests
The mechanical properties of the steel used for the beam specimens were established by standard tensile coupon tests as described previously. Table A1 (Appendix A) lists the tensile test data for yield strength (Fy), ultimate tensile strength (Fu), uncoated steel thickness (t) and percent elongation in 2-inch (5.1 cm) gage length and 1/2-inch (1.3 cm) gage length. Mean property values shown in Table A2 of Appendix A were used for analytical purposes.
5.2 Shear Tests
Fifteen CFS joists with webs having openings were tested for shear strength. The results are tabulated in Table A4 of Appendix A. Table 3 shows the average shear capacity at peak loads per web, Vt.
Table 3Shear Test Results
Nominal Joist Size1
SSMA Designation
Span Length
(in.)
h/t a/h Vt (lb.)
2 x 8 x 43 800S162-43 30 174 0.5503 5,285 2 x 8 x 54 800S162-54 30 141 0.5538 9,979 2 x 10 x 54 1000S162-54 30 173 0.6466 3,094 2 x 12 x 54 1200S162-54 30 208 0.5359 2,688 2 x 12 x 68 1200S162-68 30 164 0.5380 5,471
For SI: 1 inch = 2.54 cm, 1 lb. = 4.5 N. 1Refer to Table 1 for actual joist dimensions.
13

5.3 Bending Tests
A total of 15 CFS joist specimens with stiffened web openings were tested for bending strength. The results are tabulated in Table A4 of Appendix A. Joist mid-span deflections were also recorded and tabulated in Table A5 of Appendix A. The average ultimate capacity at peak load, Pu(test), for each joist type is recorded in Table 4. Table 4 also lists the average ultimate moment capacity, Mt, for each test specimen computed on the basis of the average ultimate peak load, Pu(test). An example of this calculation is provided in Section II of Appendix B.
Table 4Bending Test Results
Nominal Joist Size1
SSMA Designation
Span Length (in.)
h/t a/h Pu(test) (lb.)
Deflection @ Pu(test)
2
(in.)
Mt (in-lb)
2 x 8 x 43 800S162-43 144 174 0.5503 1,918 0.97 46,030 2 x 8 x 54 800S162-54 144 141 0.5538 3,463 0.87 83,110 2 x 10 x 54 1000S162-54 240 177 0.6462 2,502 1.42 100,080 2 x 12 x 54 1200S162-54 240 215 0.5353 2,496 1.67 99,840 2 x 12 x 68 1200S162-68 240 164 0.5380 4,766 1.54 190,640
For SI: 1 inch = 2.54 cm, 1 lb. = 4.5 N, 1in-lb = 0.113 N-m.1Refer to Table 1 for actual joist dimensions.2Deflection measurements were taken at mid-span.
5.4 Combined Shear and Bending Tests
A total of 16 CFS joist specimens with stiffened web openings were tested and failed in combined shear and bending. The results are tabulated in Table A4 of Appendix A. Table 5 shows the average ultimate capacity at peak load, Pu(test), the ultimate shear load, Vt, computed as (0.69Pu(test)/2), and the ultimate bending moment, Mt, computed on the basis of Vt. An example of this calculation is provided in Section III of Appendix B.
Table 5Combined Shear and Bending Test Results
Nominal Joist Size1
SSMA Designation
Span Length (in.)
h/t a/h Pu(test) (lb.)
Vt (lb.)
Mt (in-lb)
2 x 8 x 43 800S162-43 96 174 0.5503 4,630 1,597 20,800 2 x 8 x 54 800S162-54 96 141 0.5538 8,531 2,943 38,300 2 x 10 x 54 1000S162-54 96 173 0.6466 7,487 2,583 33,600 2 x 12 x 54 1200S162-54 96 208 0.5359 6,419 2,215 28,800 2 x 12 x 68 1200S162-68 96 164 0.5380 13,336 4,601 59,900
For SI: 1 inch = 2.54 cm, 1 lb. = 4.5 N, 1in-lb = 0.113 N-m. 1Refer to Table 1 for actual joist dimensions.
5.5 Web Crippling Tests
A total of 21 CFS joists with stiffened web openings were tested to failure by web crippling. Six failed in ETF loading, eight failed in ITF loading, and seven failed in a stiffened ETF loading.
14

The results are tabulated in Table A4 of Appendix A. Table 6 shows the average ultimate test capacity at load, Pn(test).
Table 6Web Crippling Test Results
Nominal Joist Size1
SSMA Designation
Span Length
(in.)
Loading Configuration
N 2
(in.) h/t a/h Pn(test)
(lb.)
30 ETF 3.5 174 0.5503 543 2 x 8 x 43 800S162-43 30 ITF 3.5 174 0.5503 1,543
30 Stiffened ETF 3.5 174 0.5503 9,495 30 ETF 3.5 215 0.5353 879
2 x 12 x 54 1200S162-54 30 ITF 3.5 215 0.5353 2,681 30 Stiffened ETF 3.5 215 0.5353 8,154 30 ETF 3.5 164 0.5380 1,502
2 x 12 x 68 1200S162-68 30 ITF 3.5 164 0.5380 3,342 30 Stiffened ETF 3.5 164 0.5380 6,999
For SI: 1 inch = 2.54 cm, 1 lb. = 4.5 N. 1Refer to Table 1 for actual joist dimensions. 2N is bearing length.
5.6 Failure Modes
Shear
The maximum shear stress occurs at mid-depth of the web. Where web material is removed as for a web opening, a stress concentration is created at the corners of the opening that typically creates premature shear failure of the joists with stiffened holes. This failure mode, however, was not observed in the shear tests. The actual failure occurred away from the opening. This is an indication that the web opening stiffened the web and increased its shear strength at the opening beyond the solid web itself. In all specimens tested for shear, the failure mode was not pure shear failure. Failure occurred mainly due to web buckling, flange curling, web rotation, and/or stiffener buckling. This is a clear indication that CFS joists will not typically fail in shear.
Bending
For bending test specimens, the failure pattern is defined by either local buckling or mixed local and lateral-torsional buckling. The lateral-torsional buckling mode would typically result in premature web failure of test specimens. The test specimens did not show signs of lateral-torsional buckling. All test specimens failed in local buckling and yielding. The OSB and gypsum board strips provided adequate lateral strength to prevent the lateral-torsional mode of buckling. Deflections in the range of 0.84- to 1.70 inches (2.13- to 4.32 cm) were observed at mid-span (see Table A5). No deformation of the web opening was observed at failure of any of the specimens. Failed specimens were not severely deformed.
Web Crippling
Deformations from web crippling failure were concentrated at the region of the applied load. No web crippling failure was observed at or in the vicinity of the stiffened web opening. Because of
15

the simply supported configuration of the test specimens, the web crippling failures occurred in the absence of significant bending degradation of the web crippling strength. Therefore, the web crippling strength could be considered directly without consideration of the combined behavior of bending and web crippling.
Combined Bending and Shear
For test specimens that failed by the combined shear and bending behavior, the failure pattern occurred as a bending type failure at mid-span and a diagonal shear failure between the load points and the opening location. These two failure modes occurred simultaneously as the ultimate load was achieved. Web openings did not show any deformation at failure loads.
6.0 Analysis of Test Data
Nominal capacities of the joists were calculated in accordance with the AISI Design Specification [3] as described in the Analytical Approach Section of this report (Section 4.0). Tested capacities are compared to these values to determine the safety margin (ratio) relative to the AISI Design Specification applied to joists with no openings.
Shear
The ratio of the average tested shear capacity (Vt) to the nominal calculated shear capacities (Vn and Vn1) of each test specimen are listed in Table 7. Vn is the nominal shear capacity calculated per Section C3.2 of the AISI Design Specification [3]. Vn1 is the nominal shear capacity calculated per the AISI Design Guide [6].
Table 7Evaluation of Shear Test Data
Nominal Joist Size1
SSMA Designation
h/t a/h Vt (lb.)
Vn (lb.)
Vn1 (lb.)
Vt/Vn Vt/Vn1
2 x 8 x 43 800S162-43 174 0.5503 5,285 1,615 1,171 3.27 4.51 2 x 8 x 54 800S162-54 141 0.5538 9,979 2,979 1,695 3.35 5.89 2 x 10 x 54 1000S162-54 173 0.6466 3,094 2,556 1,450 1.21 2.13 2 x 12 x 54 1200S162-54 208 0.5359 2,688 2,152 1,926 1.25 1.40 2 x 12 x 68 1200S162-68 164 0.5380 5,471 4,372 3,061 1.25 1.79
Mean Ratio 2.07 3.14 Standard Deviation 1.02 1.75
For SI: 1 lb. = 4.5 N. 1 Refer to Table 1 for actual joist dimensions.
Bending
The ratios of the average tested moment capacity (Mt) to the nominal calculated moment capacities (Mn and Mn1) of each test specimen are listed in Table 8. Mn is the nominal moment capacity calculated per Section C3.1 of the AISI Design Specification [3]. Mn1 is the nominal moment capacity calculated per the AISI Design Guide [6]. An example of this calculation is provided in Section II of Appendix B.
16

Table 8Evaluation of Bending Test Data
Nominal Joist Size1
SSMA Designation
h/t a/h Mt (in-lb)
Mn (in-lb)
Mn1 (in-lb)
Mt/Mn Mt/Mn1
2 x 8 x 43 800S162-43 174 0.5503 46,030 43,350 36,380 1.06 1.27 2 x 8 x 54 800S162-54 141 0.5538 83,110 70,130 59,090 1.19 1.41
2 x 10 x 54 1000S162-54 177 0.6462 100,080 86,300 76,030 1.16 1.32 2 x 12 x 54 1200S162-54 215 0.5353 99,840 98,230 85,400 1.02 1.17 2 x 12 x 68 1200S162-68 164 0.5380 190,640 160,680 127,320 1.19 1.50
Mean Ratio 1.12 1.37 Standard Deviation 0.07 0.11
For SI: 1 inch = 2.54 cm, 1 in-lb. = 0.113 N-m. 1 Refer to Table 1 for actual joist dimensions.
Web Crippling
The ratios of the average tested web crippling strength (Pn(test)) to the nominal calculated web crippling strengths (Pn and Pn1) of each test specimen are listed in Table 9. Pn is the nominal web crippling strength calculated per Section C3.4 of the AISI Design Specification [3]. Pn1 is the nominal web crippling strength calculated per the AISI Design Guide [6]. An example of this calculation is provided in Section IV of Appendix B. It is to be noted that, the AISI Design Guide does not provide web crippling reduction factors for ITF and ETF loading. In Table 9, the recommended reduction factors for IOF and EOF loadings were used for the ITF and ETF conditions respectively.
Table 9Evaluation of Web Crippling Test Data
Nominal Joist Size1
SSMA Designation
Loading Config-uration
h/t a/h Pn(test) (lb.)
Pn (lb.)
Pn1 2
(lb.) Pn(test)/Pn Pn(test)/Pn1
2 x 8 x 43 800S162-43 ETF 174 0.5503 543 496 446 1.09 1.22 ITF 174 0.5503 1,543 919 842 1.68 1.83
2 x 12 x 54 1200S162-54 ETF 215 0.5353 879 642 564 1.37 1.56 ITF 215 0.5353 2,681 1,177 1,062 2.28 2.52
2 x 12 x 68 1200S162-68 ETF 164 0.5380 1,502 1,328 1,167 1.13 1.29 ITF 164 0.5380 3,342 3,027 2,731 1.10 1.22
Mean Ratio for ETF Loading 1.20 1.36 Standard Deviation for ETF Loading 0.151 0.18
Mean Ratio for ITF Loading 1.69 1.86 Standard Deviation for ITF Loading 0.59 0.65
For SI: 1 inch = 2.54 cm, 1 lb. = 4.5 N. 1 Refer to Table 1 for actual joist dimensions. 2 The IOF and EOF reduction factors from [6] were used for ITF and ETF conditions.
Combined Bending and Shear
The ratios of the tested average ultimate shear capacity, Vt, (due to combined shear and bending) to the calculated nominal shear capacity, Vn, and the tested average moment capacity, Mt, to the nominal moment capacity, Mnv, of each test specimen are listed in Table 10. For each test specimen Vt was determined as 0.69Pu/2, where Pu is the peak load in the combined shear and
17

bending tests and 0.69 Pu is the maximum shear at the middle support for a continuous two-span simply supported beam. The tested ultimate bending moment, Mt, was computed on the basis of Vt. The unmodified nominal shear strength, Vn, and nominal moment capacity, Mnv, based on Vn, were calculated in accordance with the AISI Design Specification interaction equation [3]. Vnp is the nominal shear capacity for the tested joist configuration (simply supported two-span joist with two concentrated loads) per the AISI Design Specification. Mnp is the nominal moment capacity based on Vnp. An example of this calculation is provided in Section III of Appendix B.
Table 10 Evaluation of Combined Shear and Bending Test Data1
Nominal Joist Size
SSMA Designation
Span (in.)
Vt 2
(lb.)
Mt 3
(in-lb)
Vn2 4
(lb.)
Mnv 5
(in-lb)
Vnp 6
(lb.)
Mnp 7
(in-lb)
Vt/Vn Mt/Mnv
2 x 8 x 43 800S162-43 96 1,597 20,800 1,615 13,080 863 11,250 0.99 1.59 2 x 8 x 54 800S162-54 96 2,943 38,300 2,979 22,700 1,738 20,250 0.99 1.69 2 x 10 x 54 1000S162-54 96 2,583 33,600 2,556 18,000 1,380 16,700 1.01 1.87 2 x 12 x 54 1200S162-54 96 2,215 28,800 2,152 16,500 1,263 15,750 1.03 1.75 2 x 12 x 68 1200S162-68 96 4,601 59,900 4,372 33,400 2,560 32,400 1.05 1.79
Mean ratio 1.01 1.74 Standard Deviation 0.023 0.094
For SI: 1 inch = 2.54 cm, 1 lb. = 4.5 N, 1in-lb = 0.113 N-m. 1Refere to Table 1 for actual joist dimensions. 2The ultimate shear capacity is based on the tested ultimate capacity. 3The ultimate moment capacity is calculated based on Vt. 4The unmodified shear capacity for a joist section multiplied by a factor of safety from Section C3.2 of the AISI Specification [3].5The ultimate moment capacity calculated based on Vn2. 6Unmodified maximum shear capacity for a continuous simply-supported two-span-beam (8-ft long) with a point load at the center
of each span. A factor of safety from Section C3.2 of the AISI Specification [3] is used to convert the allowable shear capacity to an ultimate capacity.
7The ultimate moment capacity calculated based on Vnp.
Table 11 summarizes the allowable tested values (using a factor of safety of 2.0 as calculated in Appendix C) and the allowable capacities calculated using the AISI Specification [3] and the AISI Design Guide [6] recommended equations. Tables 12 through 15 show the ratios between the tested allowable capacities (using a factor of safety of 2.0) and the calculated allowable capacities using the AISI Specification [3] and the Design Guide [6] equations. Table 16 compares the average measured deflection (at design load) for each joist specimen (bending tests) to the predicted (calculated) joist mid-span deflection at design load.
18

Table 11 Comparison of Tested and Calculated Allowable Loads
Nominal Joist Size1
SSMA Designation
Failure Mode2
Tested Ultimate Load3
lb.
Allowable Tested Load4
lb.
Allowable Load per AISI Design
Specification5
lb.
Allowable Load per AISI Design
Guide Equations6,7
lb. 2 x 8 x 43 800S162-43 S 5,285 2,643 967 701 2 x 8 x 43 800S162-43 ETF 543 272 268 241 2 x 8 x 43 800S162-43 ITF 1,543 771 497 455 2 x 8 x 43 800S162-43 STIFF 9,495 4,748 - -2 x 8 x 43 800S162-43 B 1,919 960 948 886 2 x 8 x 43 800S162-43 S & B 4,631 2,315 2,480 1,835 2 x 8 x 54 800S162-54 S 9,979 4,989 1,738 1,015 2 x 8 x 54 800S162-54 B 3,463 1,731 1,747 1,427 2 x 8 x 54 800S162-54 S & B 8,531 4,265 4,460 2,805
2 x 10 x 54 1000S162-54 S 3,094 1,547 1,530 862 2 x 10 x 54 1000S162-54 B 2,502 1,251 1,244 1,006 2 x 10 x 54 1000S162-54 S & B 7,487 3,743 3,900 2,422 2 x 12 x 54 1200S162-54 S 2,688 1,344 1,289 1,153 2 x 12 x 54 1200S162-54 ETF 879 439 347 305 2 x 12 x 54 1200S162-54 ITF 2,681 1,341 636 574 2 x 12 x 54 1200S162-54 STIFF 8,154 4,077 - -2 x 12 x 54 1200S162-54 B 2,496 1,248 1200 1,142 2 x 12 x 54 1200S162-54 S & B 6,419 3,210 3,480 3,174 2 x 12 x 68 1200S162-68 S 5,471 2,736 2,618 1,833 2 x 12 x 68 1200S162-68 ETF 1,502 751 718 631 2 x 12 x 68 1200S162-68 ITF 3,342 1,671 1,636 1,476 2 x 12 x 68 1200S162-68 STIFF 6,999 3,499 - -2 x 12 x 68 1200S162-68 B 4,766 2,383 2,404 2,073 2 x 12 x 68 1200S162-68 S & B 13,336 6,668 7,000 5,069
For SI: 1 inch = 2.54 cm, 1 lb. = 4.5 N. 1Refer to Table 1 for actual joist dimensions. 2“S” indicates shear, “B” indicates bending, “S&B” indicates shear and bending, “ITF” indicates interior-two- flange loading,
“ETF” indicates exterior-two-flange loading, and “STIFF” indicates stiffened ETF. 3Values are based on an average of three tests (minimum) per configuration for shear, bending and combined shear and bending, and an average of two tests for web crippling tests.
4The allowable tested load is calculated as the tested “ultimate” load divided by a factor of safety of 2.0 (refer to Appendix C).5The calculations are based on actual yield stress and thickness (reported in Appendix A) in accordance with the AISI Design
Specification [3] with unpunched webs. 6The calculations are based on actual yield stress and thickness (reported in Appendix A) in accordance with the AISI Design
Guide [6]. Maximum hole size is 4.25-inches (10.8 cm) for 8-inch (20.3 cm) joists and 6.25-inches (15.9 cm) for 10- and 12inch (25.4 and 30.5 cm) joists.
7The EOF and IOF reduction factors are used for the ETF and ITF loading conditions, respectively.
19

Table 12 Ratio of Tested to Calculated Allowable Loads Due to Shear
Nominal Joist Size
SSMA Designation
Failure Mode
Allowable Tested Load/AISI
Specification Allowable Load
Allowable Tested Load/AISI Design Guide Allowable
Load 2 x 8 x 43 800S162-43 S 2.73 3.77 2 x 8 x 54 800S162-54 S 2.87 4.92 2 x 10 x 54 1000S162-54 S 1.01 1.78 2 x 12 x 54 1200S162-54 S 1.04 1.17 2 x 12 x 68 1200S162-68 S 1.05 1.49
Mean 1.74 2.63 Standard Deviation 0.867 1.463
Table 13 Ratio of Tested to Calculated Allowable Loads Due to Bending
Nominal Joist Size
SSMA Designation
Failure Mode
Allowable Tested Load/AISI
Specification Allowable Load
Allowable Tested Load/AISI Design Guide Allowable
Load 2 x 8 x 43 800S162-43 B 1.01 1.08 2 x 8 x 54 800S162-54 B 0.99 1.21 2 x 10 x 54 1000S162-54 B 1.01 1.24 2 x 12 x 54 1200S162-54 B 1.04 1.09 2 x 12 x 68 1200S162-68 B 0.99 1.15
Mean 1.01 1.15 Standard Deviation 0.018 0.063
Table 14 Ratio of Tested to Calculated Allowable Loads Due to Shear & Bending
Nominal Joist Size
SSMA Designation
Failure Mode
Allowable Tested Load/AISI
Specification Allowable Load
Allowable Tested Load/AISI Design
Guide Allowable Load
2 x 8 x 43 800S162-43 S & B 0.93 1.26 2 x 8 x 54 800S162-54 S & B 0.96 1.52
2 x 10 x 54 1000S162-54 S & B 0.96 1.55 2 x 12 x 54 1200S162-54 S & B 0.92 1.01 2 x 12 x 68 1200S162-68 S & B 0.95 1.32
Mean 0.94 1.32 Standard Deviation 0.016 0.20
20

Table 15 Ratio of Tested to Calculated Allowable Loads Due to Web Crippling
Nominal Joist Size
SSMA Designation
Failure Mode
Allowable Tested Load/AISI Specification
Allowable Load
Allowable Tested Load/AISI Design Guide Allowable
Load 2 x 8 x 43 800S162-43 ETF 1.01 1.13 2 x 8 x 43 800S162-43 ITF 1.55 1.69
2 x 12 x 54 1200S162-54 ETF 1.27 1.44 2 x 12 x 54 1200S162-54 ITF 2.11 2.34 2 x 12 x 68 1200S162-54 ETF 1.05 1.19 2 x 12 x 68 1200S162-68 ITF 1.02 1.13
Mean 1.34 1.49 Standard Deviation 0.43 0.47
Table 16 Measured vs. Predicted Deflections1
Nominal Joist Size2
SMSA Designation
Joist Span “L” (ft.)
Average Measured Deflection
(in.)
Predicted Deflection @ Design Load
(in.)
(Average Measured Deflection @ Design Load) ÷(Predicted Deflection @
Design Load)
@ Ultimate
Load
@ Design Load3
2 x 8 x 43 800S162-43 12.0 0.97 0.35 0.375 0.93 2 x 8 x 54 800S162-54 12.0 0.87 0.42 0.57 0.74
2 x 10 x 54 1000S162-54 20.0 1.42 0.87 1.077 0.81 2 x 12 x 54 1200S162-54 20.0 1.67 0.58 0.683 0.85 2 x 12 x 68 1200S162-68 20.0 1.54 0.82 1.035 0.79
For SI: 1 in. = 2.54 cm, 1 ft = 0.3 m. 1Deflections measured at mid-span and taken from bending tests.2Refer to Table 1 for actual joist dimensions. 3Refer to Table 11 for design loads. Design loads are calculated in accordance with AISI Design Specification [3].
7.0 Summary
The objective of this investigation was to study the behavior of C-shaped joist members with elliptical shaped web openings with folded edges subjected to shear, bending, web crippling, and combined shear and bending. The elliptical web opening had folded edges that stiffened the web around the opening. A total of 67 tests were performed, and the tested capacities were compared to those computed using the AISI Design Specification [3] and the AISI Design Guide [6] equations. Based on the test results and analysis, the major findings are as follows:
21

Shear
The AISI Design Specification [3] equations underestimated the shear strength of the 8-inch (20.3 cm) by 273% to 287% (see Table 12). The same equations accurately estimated the shear strength of the 12-inch (30.5 cm) joists. The AISI Design Guide [6] equations consistently underestimated the shear strength by 17% to nearly 400%. Therefore, the AISI Design Specification shear equations can be used to conservatively predict the shear strength of floor joists with stiffened web openings having folded edges and having an a/h ratio not larger than 0.65.
Bending
The ratio of tested to calculated bending strength, using the AISI Design Specification [3] equations provided a reasonably accurate prediction of bending capacity with a ratio of 0.99 to 1.04 (see Table 13). The AISI Design Guide [6] equations underestimated the bending strength by 8% to 24%. Thus, the AISI Design Specification can be used to give a reasonably accurate design check for bending of floor joists with stiffened web openings having folded edges and an a/h ratio no greater than 0.65.
Combined Shear and Bending
The AISI Design Specification [3] equations overestimated the shear and bending interaction capacity by approximately 4 to 8% (see Table 14). The AISI Design Guide [6], on the other hand, underestimated the shear and bending capacity by 1% to 55%. Comparing the nominal (ultimate) tested loads to the nominal (ultimate) calculated loads (see Table 10) resulted in load ratios ranging from 0.99 to 1.05 for nominal shear capacity and 1.59 to 1.87 for nominal moment capacity (calculated based on the nominal shear capacity). Therefore, the AISI Specification [3] interaction equation can be used to conservatively predict the bending moment and shear capacity of beams with web openings having folded edges, and having an a/h ratio not larger than 0.65, without any reductions to the shear and moment capacities.
Web Crippling
The AISI Design Specification [3] web crippling equations underestimated the capacity by 2% to 111% (see Tables 9 and 15). The AISI Design Guide [6] equations (using IOF and EOF reduction factors) underestimated the web crippling capacity for ITF and ETF loadings by 13% to 134%. Thus, the AISI Design Specification’s web crippling equations can be used to conservatively predict the web crippling strength for ITF and ETF loading of beams with web openings having folded edges, and having an a/h ratio not larger than 0.65.
22
8.0 Conclusions
The results of the cold-formed steel (CFS) floor joists tested for shear, bending, combined shear and bending, and web crippling are set out in this report. A total of 67 CFS joist specimens were tested, including 15 for pure bending, 15 for pure shear, 16 for combined bending and shear, and 21 for web crippling. Test results showed that the equations of the AISI Design Specification [3] can be used to conservatively predict the moment capacity, shear strength, web crippling strength, and combined bending and shear strength of CFS joist members (C-sections) with folded web openings. Based on the findings of this study, the following conclusions regarding the behavior of CFS floor joists with relatively large, stiffened openings (i.e. folded edges) under gravity loads can be made:
• The presence of web openings with folded edges did not reduce the ultimate shear, bending, Interior-Two-Flange (ITF) and End-Two-Flange (ETF) loading, and combined shear and bending strengths. Actually, the folded edge web openings resulted in an increase in the strength of CFS joist specimens investigated in this study.
• The presence of web openings did not promulgate any failure. All observed failures took place at a distance from the openings. None of the web openings experienced any deformation under any of the loading conditions examined.
• The current AISI Design Guide [6] equations, though more conservative than the AISI Design Specification [3], do provide an accurate estimation of bending and web crippling strength for End-Two-Flange and Interior-Two-Flange loading.
• Shear strength was not a controlling factor in the design of CFS joists with folded openings as identified in this report. Pure shear failure did not occur in any of the tested specimens.
• CFS joists with folded edge web openings (hole ratio a/h ≤ 0.65) can be safely used in residential construction to accommodate long septic drains, plumbing runs, routing of ductwork, and other trade installations.
• The results of this report can be reasonably applied to 2x7.25-inch (18.4 cm) joists (725S162-43, 725S162-54 and 725S162-68) with 4.25-inch (10.8 cm) folded web openings and to 2x9.25-inch (23.5 cm) joists (925S162-54 and 925S162-68) with 6.25inch (15.9 cm) folded web openings.
• The floor joist span tables in the Prescriptive Method for Residential Cold-Formed Steel Framing [1] and the CABO One- and Two-Family Dwelling Code [2] can be safely (and conservatively) used for CFS joists with folded web openings (holes), as detailed in this report.
23

9.0 References
[1] Prescriptive Method for Residential Cold-Formed Steel Framing, Second Edition. Prepared for the US Department of Housing and Urban Development, the American Iron and Steel Institute, and the National Association of Home Builders, by the NAHB Research Center, Inc., Upper Marlboro, MD, September 1997.
[2] One and Two Family Dwelling Code, Council of American Building Officials (CABO), Falls Church, VA. 1998.
[3] Cold-Formed Steel Design Manual: Specification for the Design of Cold-Formed Steel Structural Members, 1996 Edition. American Iron and Steel Institute (AISI), Washington, DC, June 1997.
[4] Kraus, C. A., and Murray, T. M. (1997), “Floor Vibration Criterion for Cold-Formed C-Shaped Supported Residential Floor Systems,” Report No. CE/VPI-ST 97/04. Virginia Polytechnic Institute and State University, Department of Civil Engineering, Blacksburg, VA. February 1997.
[5] Acceptance Criteria for Steel Studs, Joists and Tracks, ICBO Evaluation Service, Inc., No. AC 46, International Conference of Building Officials (ICBO), Whittier, CA. April 1998.
[6] Design Guide for Cold-Formed Steel Beams with Web Penetrations, AISI Publication RG-9712, American Iron and Steel Institute, Washington, DC, August 1997.
[7] Shan, M.Y. (1994), “Behavior of Web Elements with Web Openings Subjected to Bending, Shear, and the Combination of Bending and Shear,” Ph.D. Dissertation submitted to the University of Missouri-Rolla. Rolla, MO.
[8] Shan, M. Y., LaBoube, R. A., and Yu, W. W. (1994), “Behavior of Web Elements with Openings Subjected to Bending, Shear and the Combination of Bending and Shear,” Final Report, Civil Engineering Series 94-2, Cold-Formed Steel Series, Department of Civil Engineering, University of Missouri-Rolla, Rolla, MO.
[9] Schuster, R. M., Rogers, C.A., and Celli, A. (1995), “Research into Cold-Formed Steel Perforated C-Sections in Shear,” Progress Report No. 1 of Phase I of CSSBI/IRAP Project, Department of Civil Engineering, University of Waterloo, Waterloo, Ontario, Canada.
[10] Langan, J. E. (1994), “Structural Behavior of Perforated Web Elements of Cold-Formed Steel Flexural Members Subjected to Web Crippling and a Combination of Web Crippling and Bending,” Ph.D. Dissertation submitted to the University of Missouri-Rolla, Rolla, MO.
[11] Yu, W.W., and Davis, C.S. (1973), “Cold-Formed Steel Members with Perforated Elements,” Journal of the Structural Division, Vol. 99, No. ST10, October 1973, American Society of Civil Engineers, Reston, VA.
24
[12] Sivakumaran, K.S. and Zielonka, K.M. (1989) “Web Crippling Strength of Thin-Walled Steel Members with Web Openings,” contained in publication titled, Thin-Walled Structures, Elsevier Science Publishers Ltd., Great Britain.
[13] LaBoube, R. A. (1990), “Design Guidelines for Web Elements with Web Openings,” Civil Engineering Department, University of Missouri-Rolla, Rolla, MO.
[14] ASTM A 370- 1997a, Standard Test Methods and Definitions for Mechanical Testing of Steel Products, American Society for Testing and Materials (ASTM), West Conshohocken, PA.
[15] ASTM A 90/A90M-1995, Standard Test Method for Weight [Mass] of Coating on Iron and Steel Articles with Zinc or Zinc-Alloy Coatings, American Society for Testing and Materials (ASTM), West Conshohocken, PA.
[16] ASTM D 198-1997, Standard Test Methods of Static Tests of Lumber in Structural Sizes. American Society for Testing and Materials (ASTM), West Conshohocken, PA.
25


APPENDIX A
TEST RESULTS

Table A1Physical and Mechanical Properties of Test Specimens
Nominal Joist Size
SSMA Designation
Web Size
(in.)
Flange Size
(in.)
Lip Size
(in.)
Yield Point 1
(ksi)
Tensile Strength 1
(ksi)
Uncoated Thickness2
(in.)
Elongation 3
(percent) 2”
gauge 1/2”
gauge 2 x 8 x 43 800S162-43 8 1.625 0.5 43.05 50.67 0.04460 25 38 2 x 8 x 43 800S162-43 8 1.625 0.5 45.12 49.66 0.04430 26 38 2 x 8 x 43 800S162-43 8 1.625 0.5 40.63 49.66 0.04430 24 38 2 x 8 x 54 800S162-54 8 1.625 0.5 57.41 66.67 0.05400 21 38 2 x 8 x 54 800S162-54 8 1.625 0.5 55.15 66.18 0.05440 20 34 2 x 8 x 54 800S162-54 8 1.625 0.5 56.78 66.67 0.05460 21 38
2 x 10 x 54 1000S162-54 10 1.625 0.5 50.36 64.75 0.05560 30 56 2 x 10 x 54 1000S162-54 10 1.625 0.5 50.36 64.29 0.05600 19 31 2 x 10 x 54 1000S162-54 10 1.625 0.5 48.53 64.69 0.05565 28 38
2 x 10 x 54 4 1000S162-54 10 1.625 0.5 55.68 69.60 0.05460 18 28 2 x 10 x 54 4 1000S162-54 10 1.625 0.5 56.51 69.72 0.05450 16 28 2 x 10 x 54 4 1000S162-54 10 1.625 0.5 56.47 69.22 0.05490 19 28 2 x 12 x 54 1200S162-54 12 1.625 0.5 45.28 64.17 0.05610 30 50 2 x 12 x 54 1200S162-54 12 1.625 0.5 46.39 62.80 0.05605 22 50 2 x 12 x 54 1200S162-54 12 1.625 0.5 46.76 64.29 0.05600 28 47
2 x 12 x 54 4 1200S162-54 12 1.625 0.5 52.00 70.57 0.05385 21 44 2 x 12 x 54 4 1200S162-54 12 1.625 0.5 51.38 69.73 0.05450 21 44 2 x 12 x 54 4 1200S162-54 12 1.625 0.5 57.20 70.11 0.05420 19 31 2 x 12 x 68 1200S162-68 12 1.625 0.5 62.24 70.45 0.07060 14 25 2 x 12 x 68 1200S162-68 12 1.625 0.5 59.49 67.99 0.07060 14 25 2 x 12 x 68 1200S162-68 12 1.625 0.5 58.82 67.23 0.07140 15 28
For SI: 1 inch = 2.54 cm, 1 ksi = 6.9 MPa 1Tested per ASTM A 370 [14]. 2Tested per ASTM A 90 [15]. 3 Tested per ASTM A 370 [14] for a 2-inch (5.1 cm) and ½-inch (1.3 cm) gauge length. 4 Joists used for bending and web crippling tests (where required).
A-1

Table A2Mean Physical and Mechanical Properties of Test Specimens1,2
Nominal Joist Size
SSMA Designation
Web Size
(in.)
Flange Size
(in.)
Lip Size
(in.)
Yield Point
(ksi)
Tensile Strength
(ksi)
Uncoated Thickness
(in.)
Elongation 4
(percent)
2 x 8 x 43 800S162-43 8 1.625 0.5 42.94 50.00 0.04440 25 2 x 8 x 54 800S162-54 8 1.625 0.5 56.44 66.50 0.05433 21 2 x 10 x 54 1000S162-54 10 1.625 0.5 49.75 64.58 0.05575 26
2 x 10 x 54 3 1000S162-54 10 1.625 0.5 56.22 69.51 0.05467 18 2 x 12 x 54 1200S162-54 12 1.625 0.5 46.15 63.75 0.05605 27
2 x 12 x 54 3 1200S162-54 12 1.625 0.5 53.52 70.13 0.05418 20 2 x 12 x 68 1200S162-68 12 1.625 0.5 60.18 68.56 0.07087 14
For SI: 1 inch = 2.54 cm, 1 ksi = 6.9 MPa 1Values shown represent the mean of three tests per specimen. 2Refer to Table A3 for standard deviation and coefficient of variation (COV). 3 Joists were used for bending and web crippling tests. 4 Average elongation in 2-inch (5.1 cm) gage length is shown.
Table A3 Standard Deviation and Coefficient of Variation of Physical and Mechanical Properties
Nominal Joist Size
SSMA Designation
Standard Deviation (σ) Yield Strength
(ksi) Tensile Strength
(ksi) Uncoated Thickness
(in.) 2 x 8 x 43 800S162-43 2.26 0.58 0.00017 2 x 8 x 54 800S162-54 1.17 0.28 0.00031 2 x 10 x 54 1000S162-54 1.06 0.25 0.00022
2 x 10 x 54 2 1000S162-54 0.47 0.26 0.00021 2 x 12 x 54 1200S162-54 0.78 0.83 0.00005
2 x 12 x 54 2 1200S162-54 3.20 0.42 0.00033 2 x 12 x 68 1200S162-68 1.81 1.69 0.00046
Nominal Joist Size
SSMA Designation
Coefficient Of Variation (COV) 1
Yield Strength Tensile Strength Uncoated Thickness 2 x 8 x 43 800S162-43 0.0526 0.0117 0.0039 2 x 8 x 54 800S162-54 0.0207 0.0043 0.0056 2 x 10 x 54 1000S162-54 0.0213 0.0039 0.0039
2 x 10 x 54 2 1000S162-54 0.0083 0.0038 0.0038 2 x 12 x 54 1200S162-54 0.0169 0.0130 0.0009
2 x 12 x 54 2 1200S162-54 0.0597 0.0060 0.0060 2 x 12 x 68 1200S162-68 0.0300 0.0246 0.0065
For SI: 1 in. = 2.54 cm, 1 ksi = 6.9 MPa 1 COV equals the standard deviation divided by the mean. 2 Joists were used for bending and web crippling tests.
A-2

1 2 3 4 5 6 7 8 9 10 11 12 13 14 15 16 17 18 19 20 21 22 23 24 25 26 27 28 29 30 31 32 33 34 35 36 37 38 39 40 41
Table A4Tested Ultimate Capacity of Floor Joists
Test No.
Nominal Joist Size 1
SMSA Designation
Joist Thickness
(gauge)
Joist Span
(ft-in.)
Test Mode 2 Ultimate Load 3
(lb)
2 x 8 x 43 800S162-43 18 2’-6” Shear 5,501 2 x 8 x 43 800S162-43 18 2’-6” Shear 4,950 2 x 8 x 43 800S162-43 18 2’-6” Shear 5,405 2 x 8 x 43 800S162-43 18 8’-0” Shear & Bending 4,672 2 x 8 x 43 800S162-43 18 8’-0” Shear & Bending 4,714 2 x 8 x 43 800S162-43 18 8’-0” Shear & Bending 4,505 2 x 8 x 43 800S162-43 18 2’-0” ETF 522 2 x 8 x 43 800S162-43 18 2’-0” ETF 563 2 x 8 x 43 800S162-43 18 2’-0” ITF 1,532 2 x 8 x 43 800S162-43 18 2’-0” ITF 1,554 2 x 8 x 43 800S162-43 18 2’-0” ITF 1,543 2 x 8 x 43 800S162-43 18 2’-0” Stiffened 9,706 2 x 8 x 43 800S162-43 18 2’-0” Stiffened 9,285 2 x 8 x 43 800S162-43 18 2’-0” Stiffened 9,494 2 x 8 x 43 800S162-43 18 12’-0” Bending 1,838 2 x 8 x 43 800S162-43 18 12’-0” Bending 1,939 2 x 8 x 43 800S162-43 18 12’-0” Bending 1,981 2 x 8 x 54 800S162-54 16 2’-6” Shear 9,651 2 x 8 x 54 800S162-54 16 2’-6” Shear 10,440 2 x 8 x 54 800S162-54 16 2’-6” Shear 9,845 2 x 8 x 54 800S162-54 16 8’-0” Shear & Bending 8,483 2 x 8 x 54 800S162-54 16 8’-0” Shear & Bending 8,579 2 x 8 x 54 800S162-54 16 8’-0” Shear & Bending 8,530 2 x 8 x 54 800S162-54 16 12’-0” Bending 3,411 2 x 8 x 54 800S162-54 16 12’-0” Bending 3,479 2 x 8 x 54 800S162-54 16 12’-0” Bending 3,498 2 x 10 x 54 1000S162-54 16 2’-6” Shear 3,103 2 x 10 x 54 1000S162-54 16 2’-6” Shear 3,010 2 x 10 x 54 1000S162-54 16 2’-6” Shear 3,170 2 x 10 x 54 1000S162-54 16 8’-0” Shear & Bending 7,352 2 x 10 x 54 1000S162-54 16 8’-0” Shear & Bending 7,499 2 x 10 x 54 1000S162-54 16 8’-0” Shear & Bending 7,611 2 x 10 x 54 1000S162-54 16 20’-0” Bending 2,501 2 x 10 x 54 1000S162-54 16 20’-0” Bending 2,416 2 x 10 x 54 1000S162-54 16 20’-0” Bending 2,588 2 x 12 x 54 1200S162-54 16 2’-6” Shear 2,698 2 x 12 x 54 1200S162-54 16 2’-6” Shear 2,617 2 x 12 x 54 1200S162-54 16 2’-6” Shear 2,750 2 x 12 x 54 1200S162-54 16 8’-0” Shear & Bending 6,354 2 x 12 x 54 1200S162-54 16 8’-0” Shear & Bending 6,395 2 x 12 x 54 1200S162-54 16 8’-0” Shear & Bending 6,509
A-3

Table A4Tested Ultimate Capacity of Floor Joists (continued)
Test No.
Nominal Joist Size 1
SMSA Designation
Joist Thickness
(gauge)
Joist Span
(ft-in.)
Test Mode 2 Ultimate Load 3
(lb) 42 2 x 12 x 54 1200S162-54 16 20’-0” Bending 2,441 43 2 x 12 x 54 1200S162-54 16 20’-0” Bending 2,498 44 2 x 12 x 54 1200S162-54 16 20’-0” Bending 2,550 45 2 x 12 x 54 1200S162-54 16 2’-0” ETF 919 46 2 x 12 x 54 1200S162-54 16 2’-0” ETF 839 47 2 x 12 x 54 1200S162-54 16 2’-0” ITF 2,704 48 2 x 12 x 54 1200S162-54 16 2’-0” ITF 2,659 49 2 x 12 x 54 1200S162-54 16 2’-0” Stiffened 8,198 50 2 x 12 x 54 1200S162-54 16 2’-0” Stiffened 8,110 51 2 x 12 x 68 1200S162-68 14 2’-6” Shear 5,417 52 2 x 12 x 68 1200S162-68 14 2’-6” Shear 5,530 53 2 x 12 x 68 1200S162-68 14 2’-6” Shear 5,468 54 2 x 12 x 68 1200S162-68 14 8’-0” Shear & Bending 12,690 55 2 x 12 x 68 1200S162-68 14 8’-0” Shear & Bending 13,378 56 2 x 12 x 68 1200S162-68 14 8’-0” Shear & Bending 13,408 57 2 x 12 x 68(4) 1200S162-68 14 8’-0” Shear & Bending 13,221 58 2 x 12 x 68 1200S162-68 14 20’-0” Bending 4,748 59 2 x 12 x 68 1200S162-68 14 20’-0” Bending 4,830 60 2 x 12 x 68 1200S162-68 14 20’-0” Bending 4,720 61 2 x 12 x 68 1200S162-68 14 2’-0” ETF 1,444 62 2 x 12 x 68 1200S162-68 14 2’-0” ETF 1,561 63 2 x 12 x 68 1200S162-68 14 2’-0” ITF 3,355 64 2 x 12 x 68 1200S162-68 14 2’-0” ITF 3,360 65 2 x 12 x 68 1200S162-68 14 2’-0” ITF 3,312 66 2 x 12 x 68 1200S162-68 14 2’-0” Stiffened 6,885 67 2 x 12 x 68 1200S162-68 14 2’-0” Stiffened 7,113
For SI: 1 inch = 2.54 cm, 1 ft = 0.3 m, 1 lb = 4.5 N.
Notes to Table A4:
1Refer to Table 1 for actual joist dimensions. 2 “ETF” denotes end two-flange loading. “ITF” denotes interior two-flange loading, “Stiffened” denotes stiffened web hole at end of member for ETF web crippling tests.
3The ultimate capacity is the total vertical load applied to the joist at peak load. 4 Joist was tested with damaged hole (folded steel around the hole is broken). The test results showed no impact on joist performance.
A-4

Table A5Measured Mid-Span Deflections of Joists
Test No.
Nominal Joist Size 1
SMSA Designation
Joist Thickness
Joist Span
Test Mode
Mid-span Deflection 2
(in.) (Gauge) “L”
(ft-in.) @ Ultimate
Load @ Design
Load
15 2 x 8 x 43 800S162-43 18 12’-0” Bending 0.99 0.45 16 2 x 8 x 43 800S162-43 18 12’-0” Bending 0.93 0.49 17 2 x 8 x 43 800S162-43 18 12’-0” Bending 0.98 0.48 24 2 x 8 x 54 800S162-54 16 12’-0” Bending 0.87 0.46 25 2 x 8 x 54 800S162-54 16 12’-0” Bending 0.91 0.40 26 2 x 8 x 54 800S162-54 16 12’-0” Bending 0.84 0.39 33 2 x 10 x 54 1000S162-54 16 20’-0” Bending 1.46 0.87 34 2 x 10 x 54 1000S162-54 16 20’-0” Bending 1.38 0.91 35 2 x 10 x 54 1000S162-54 16 20’-0” Bending 1.42 0.83 42 2 x 12 x 54 1200S162-54 16 20’-0” Bending 1.67 0.53 43 2 x 12 x 54 1200S162-54 16 20’-0” Bending 1.64 0.60 44 2 x 12 x 54 1200S162-54 16 20’-0” Bending 1.70 0.61 58 2 x 12 x 68 1200S162-68 14 20’-0” Bending 1.55 0.83 59 2 x 12 x 68 1200S162-68 14 20’-0” Bending 1.58 0.85 60 2 x 12 x 68 1200S162-68 14 20’-0” Bending 1.49 0.77
For SI: 1 inch = 2.54 cm, 1 ft = 0.3 m. 1Refer to Table 1 for actual joist dimensions. 2Deflection measurements were taken at joist mid-span for bending tests.
A-5

A-6

APPENDIX B
SAMPLE CALCULATIONS


SAMPLE CALCULATIONS (for metric conversion, refer to Appendix F)
Calculate the allowable moment, shear, and web crippling capacity of a 1000S162-54 (2x10x54 mil) joist with 6-1/4 in. x 9 in. (15.9 cm x 22.9 cm) hole located along the centerline of the web for the spans shown below. Calculate also the allowable load due to the shear, bending, web crippling, and combined shear and bending capacity. Use the AISI Design Specification [3] and the AISI Design Guide [6].
I. Allowable Shear Capacity:
Simply supported 2’-6” span:
a = 6.25 in. (hole depth across web), b = 24 in. (joist spacing) t = 0.0557 in. (thickness) Fy = 49.745 ksi
a. AISI Design Specification (Section C3.2):
h = 10 - 2(0.0557 + 0.125) = 9.639 in. h/t = 9.639 / 0.0557 = 172.90
0.96[Ekv / Fy]1/2 = 0.96[(29,500)(5.34) / 49.745]1/2 = 54.022 Where kv = 5.34 for un-reinforced webs
1.415[Ekv / Fy]1/2 = 1.415[(29,500)(5.34) / 49.745]1/2 = 79.63
h/t > 1.415[Ekv / Fy]1/2 ⇒ Vn = 0.905 Ekv t3/h Equation C3.2-3
Vn = 0.905 (29,500,000)(5.34)(0.0557)3/ 9.639 = 2,563 lb.
Ωv = 1.67 (factor of safety)
Va = 2,563 / 1.67 = 1530 lb. (web with no holes)
Maximum Load due to Allowable Shear: P = 1,530 lb.
b. AISI Design Guide
Apply the reduction factors qs1 and qs2 to the allowable shear value.
c = h/2 - a/2 = 9.639/2 - 6.25/2 = 1.6945 in. c/t = 1.6945 / 0.05575 = 30.39 5 ≤ c/t ≤ 54 qs1 = c / 54t = 1.6945 / (54 x 0.05575) = 0.5629 qs2 = 1.0
Va = 1530 x 0.5629 x 1.0 = 862 lb. Maximum Load due to Allowable Shear for section with holes: P = 862 lb.
B-1

II. Allowable Moment Capacity:
Simply supported 20’-0” span. The top flanges are laterally supported.
P/2 P/2
P/2
L/3
P/2
L/3 L/3
a. AISI Design Specification (Section C3.1):
Mn = SeFy
Se is calculated to be 1.6697 in3; Ω = 1.67
Mn = 1.6697 x 49.745 = 83.06 in.-kips.
Ma = 83.06 / 1.67 = 49.74 in.-kips = 4.145 ft-kips. (moment capacity for section with no holes)
Maximum load due to allowable bending moment = P
Mmax = PL/6 ⇒ P = 6 Mmax / L
P = 6(4.145)/20 = 1.243 kips = 1,243 lb.
b. AISI Design Guide
a/h = 6.25 / 9.639 = 0.65 > 0.4 ⇒ Web holes can not be ignored.
Check Compression Flange
R = 2 x 0.0557 = 0.1114 in. w = 1.625 –2(0.1114 + 0.0557) = 1.2908 in. w/t = 23.17 < 60
S = 1.28[E/f]1/2 = 1.28[29,500/49.745]1/2 = 31.17 S/3 = 10.39 S/3= 10.39 < w/t=23.17 < S=31.17 Therefore, AISI Design Specification Section B4.2 case II applies.
B-2

Ia = 399t4{(w/t)/S) - (ku/4)1/2}3 = 0.00028 in.4 Equation B4.2-4 Where ku = 0.43
d = 0.5 - 0.1115 - 0.0557 = 0.3328 in. Is = d3t/12 = 0.00017 in.4
Is / Ia = 0.611 D/w = 0.387
k = C2n(Ka - Ku) + Ku Equation B4.2-7
ka = 5.25 - 5(D/w) ≤ 4.0 ka = 5.25 - 5(0.387) = 3.315 ≤ 4.0
C2n = Is/Ia but not greater than 1.0
n = ½ k = 0.611(3.315 – 0.43) + 0.43 = 2.19
λ = 0.676 > 0.673 Equation B2.1-4 b = ρw Equation B2.1-2 ρ = (1-0.22/λ)/λ Equation B2.1-3 ρ = 0.998 b = 0.998(1.2908) = 1.288 in.
Compression Edge Stiffener
k = 0.43 d/t = 5.975 λ = 0.393 < 0.673 Therefore, ds’ = d ds = ds’ (Is/Ia) ≤ ds’ Therefore, ds = d = 0.3328 in.
Compression Portion of the Web
The section modulus must be determined by assuming the area above the web hole is an unstiffened compression element.
k = 0.43 w = (h - a)/2 = 1.708 in. w/t = 30.63 λ = 2.02 > 0.673 ρ = 0.44 Equation B2.1-3 b = 1.708 x 0.44 = 0.75 in.
Use the effective widths previously calculated (flange, lip, and web) to calculate the effective section modulus Se.
B-3

Element L y Ly Ly2 I1 '
(From Top) Web-compression 0.754 0.54 0.410 0.223 0.0357 Web-tension 1.708 8.98 15.334 137.679 0.4150 Upper Corners 0.438 0.084 0.037 0.003 0 Lower corners 0.438 9.972 4.364 43.520 0 Compression Flange 1.288 0.028 0.036 0.001 0 Tension Flange 1.288 9.972 12.844 128.08 0 Compression Stiffener 0.333 0.334 0.111 0.0370 0.0031 Tension Stiffener 0.333 9.834 3.272 32.177 0.0031
6.580 36.408 341.72 0.457
Ycg = 36.408 / 6.580 = 5.533 in. Ix
' = Ly2 + I1' - LYcg
2 = 140.8 in.4
Ix = Ix' t = 7.84 in.4 (t = 0.0557 in.)
Se = Ix / Ycg = 1.417 in.3
Mn = SeFy = 70.49 in.-kip Ma = Mn /Ω = 70.49 / 1.67 = 42.21 in.-kip.
Calculate maximum load due to bending moment:
Mmax = PL/6 ⇒ P = 6 Mmax / L P = 6(42.21 x 1000) / (20x12”) = 1,305 lb. (Table 11 shows a value of 1244 lb. The difference is due to rounding up numbers)
III. Combined Shear and Bending Capacity:
For two-span beam with one concentrated load at each mid-span
a. AISI Design Specification (Section C3.3):
P L/2L/2 L/2 P L/2
L = 4’ R2 = 1.38PR 1
(M/Ma)2+(V/Va)2 ≤ 1.0
Allowable shear and allowable moments were previously calculated to be:
Va = 1,530 lb. Ma = 49.74 in.-kips = 49,740 in.-lb.
B-4

For the two-span simply supported beam:
Moment
-0.187PL
P P
+0.156PL
Shear
0.31P
0.69P
Mmax. = 0.187 PL/2 Vmax. = 0.69 P
Substitute for M, V, Ma, and Va in the above interaction equation:
P = 1,950 lbs.
Total Load = 2P = 3,900 lb.
b. AISI Design Guide
Use the AISI Design Specification interaction equation, with the modified shear and bending allowables.
Va = 1,085 lb. Ma = 40.224 in.-kips = 40,224 in.-lb.
Substitute for M, V, Ma, and Va in the above interaction equation:
P = 1,211 lbs. Total Load = 2P = 2,422 lb.
B-5

IV. Web Crippling Capacity:
The web crippling capacity is checked for a 2’-0” simply supported span.
Three web crippling cases were investigated:
End-two-flange (ETF) loading Interior-two-flange (ITF) loading, and Stiffened end-two-flange (ETF) loading
a. AISI Design Specification (Section C3.4):
Web crippling equation C3.4-6 applies to the ETF loading condition and equation C3.4-8 applies to the ITF loading condition.
Pn = t2 k C3 C4 C9 Cθ [244 - 0.57(h/t)][1 + 0.01(N/t)] Equation C3.4-6 Pn = t2 k C1 C2 C9 Cθ [771 - 2.26(h/t)][1 + 0.0013(N/t)] Equation C3.4-8
k = 894Fy/E = 1.5075 Equation C3.4-21 C1 = 1.22 - 0.22k = 0.888 Equation C3.4-10 C2 = 1.06 - 0.06R/t = 0.94 Equation C3.4-11 C3 = 1.33 - 0.33k = 0.8325 Equation C3.4-12 C4 = 1.15 - 0.15R/t ≤ 1.0 but not less than 0.5 Equation C3.4-13 C9 = 1.0
Cθ = 0.7 + 0.3(θ/90)2 = 1.0 Equation C3.4-20 N/t (ETF) = 26.91 (1.5 in. bearing length) N/t (ITF) = 53.81 (3 in. bearing length)
End-Two-Flange (ETF): Pn = 611 lb. Pa = 611 / 1.85 = 330 lb.
Interior-Two-Flange (ITF): Pn = 1,587 lb. Pa = 1587 / 1.85 = 858 lb.
b. AISI Design Guide
The AISI Design Guide does not address two-flange loading conditions. The reduction factors are provided only for one-flange loading cases (EOF and IOF). Although the reduction factors do not apply to the loading cases in this example, they will be used for comparison purposes only.
End-Two-Flange (ETF) Pa = 330 lb. Interior-Two-Flange (ITF) Pa = 858 lb.
EOF: Rc(EOF) = 1.01 - 0.325(a/h) + 0.083(x/h) ≤ 1.0 Equation 6 IOF: Rc(IOF) = 0.900 - 0.047(a/h) + 0.053(x/h) ≤ 1.0 Equation 7 Where: a = hole size = 6.25 in.
B-6

h = flat portion of the web x = nearest distance between the penetration edge and edge of bearing
Rc(EOF) = 1.01 - 0.325(0.6466) + 0.083(6/9.67) = 0.851 Rc(IOF) = 0.900 - 0.047(0.6466) + 0.053(6/9.67) = 0.902
Apply the Rc(EOF) and Rc(IOF) to the ETF and ITF web crippling loads.
Pa(ETF) = 330 x 0.851 = 281 lb. Pa(iTF) = 858 x 0.902 = 774 lb.
B-7

B-8

APPENDIX C
SAFETY FACTOR CALCULATION


SAFETY FACTOR CALCULATION
The factor of safety used in estimating the tested allowable loads from the tested ultimate loads, in Table 11 is calculated in accordance with Section F of the AISI Design Specification [3] as follows:
The allowable axial capacity Ra = Rn/Ω .
Where: Rn = Average value of the test results. Ω = Factor of safety = 1.6/φ
φ = Resistance factor = 15. ( M F P e −β0 V 2 M +V 2
F +C V P P 2 +V 2
Q)m m m
Mm = Mean value of the material factor = 1.10 Fm = Mean value of the fabrication factor = 1.00 Pm = Mean value of the professional factor for the tested component = 1.0 β0 = Target reliability index = 2.5 VM = Coefficient of variation of the material factor = 0.10 VF = Coefficient of variation of the fabrication factor = 0.05 CP = Correction factor = 5.7 VP = Coefficient of variation of the test results = 5.5% (see note below) VP = 6.5% (for Vp < 6.5%, use 6.5%) m = Degree of freedom = 1 VQ = Coefficient of variation of the load effect = 0.21
0.10 2 +0.05 2 +5.7 x0.065 2 +0.21 2φ = 15 110 100 100 . x . )e−2 5 .. ( . x = 0.81
φ = 0.81
Ω = Factor of safety = 1.60/φ = 1.60/0.81 = 1.975 (conservatively, use 2.0)
Note: The coefficient of variation (COV) of the test results is obtained by calculating the average COV of the individual COVs for each set of tests (minimum of two-test samples) and adding one standard deviation. The average COV is calculated to be 3.601 percent for all test groups. The standard deviation of all test group COVs is 1.937 percent. Therefore, the representative COV is 3.6 + 1.9 = 5.5. This represents an upper 64 percentile (plus one standard deviation) of the COV experience in the tests. It does not represent the “global” COV that may be experienced by multiple producers in various production runs. Considering this source variance in real production may tend to increase the safety factor estimate. The conservative bias relation to specific minimum strength (i.e., 33 ksi or 50 ksi steel) versus actual strength is not considered in the safety factor determination. Considering this effect would tend to lower the safety factor estimate.
C-1

C-2

APPENDIX D
TEST PHOTOGRAPHS


APPENDIX E
TEST PLOTS

APPENDIX F
METRIC CONVERSION


METRIC CONVERSION FACTORS
The following list provides the conversion relationship between U.S. customary units and the International System (SI) units. A complete guide to the SI system and its use can be found in ASTM E 380, Metric Practice.
To convert from to multiply by To convert from to multiply By
Length
inch (in.)inch (in.)inch (in.)inch (in.)foot (ft)yard (yd) mile (mi)
micrometer (μm) millimeter (mm) centimeter (cm) meter (m) meter (m)
meter (m) kilometer (km)
Area
25,400 25.4 2.54 0.0254 0.3048 0.9144 1.6
square foot (sq. ft) square meter (sq. m ) 0.0929 square inch (sq. in) square centimeter (sq. cm) 6.452 square inch (sq. in.) square meter (sq. m ) 0.00064516 square yard (sq. yd) square meter (sq. m ) 0.8391 square mile (sq. mi) square kilometer (sq. km ) 2.6
Mass (weight)
pound (lb.) avoirdupois kilogram (kg) 0.4535924 ton, 2000 lb. kilogram (kg) 907.1848 grain kilogram (kg) 0.0000648
Mass (weight) per length)
kip per linear foot (klf) kilogram per 0.001488 meter (kg/m) pound per linear foot (plf) kilogram per 1.488 meter (kg/m)
Moment
1 foot-pound (ft-lb.) Newton-meter 1.356 (N-m)
Volume
cubic inch (cu in.) cubic centimeter (cu cm) 16.387064 cubic inch (cu in.) cubic meter (cu m) 0.00001639 cubic foot (cu ft) cubic meter (cu m) 0.02831685 cubic yard (cu yd) cubic meter (cu m) 0.7645549 gallon (gal) Can. liquid liter 4.546 gallon (gal) Can. liquid cubic meter (cu m) 0.004546 gallon (gal) U.S. liquid* liter 3.7854118 gallon (gal) U.S. liquid cubic meter (cu m) 0.00378541 fluid ounce (fl oz) milliliters (ml) 29.57353 fluid ounce (fl oz) cubic meter (cu m) 0.00002957
Force
kip (1000 lb.) kilogram (kg) 453.6 kip (1000 lb.) Newton (N) 4,448.222 pound (lb.) kilogram (kg) 0.4535924 pound (lb.) Newton (N) 4.448222
Mass per volume (density)
pound per cubic foot (pcf) kilogram per 16.01846 cubic meter (kg/cu m) pound per cubic yard kilogram per 0.5933 (lb/cu yd) cubic meter (kg/cu m)
Velocity
mile per hour (mph) kilometer per hour 1.60934 (km/hr)
mile per hour (mph) kilometer per second 0.44704 (km/sec)
Temperature
Stress or pressure
kip/sq. inch (ksi) megapascal (Mpa) kip/sq. inch (ksi) kilogram/square
centimeter (kg/sq. cm) pound/sq. inch (psi) kilogram/square
centimeter (kg/sq. cm) pound/sq. inch (psi) pascal (Pa) ** pound/sq. inch (psi) megapascal (Mpa) pound/sq. foot (psf) kilogram/square
meter (kg/sq. m) pound/sq. foot (psf) pascal (Pa)
6.894757 70.31
0.07031
6,894.757 0.00689476 4.8824
47.88
degree Fahrenheit (°F) degree Celsius (°C) tC = (tF - 32)/1.8 degree Fahrenheit (°F) degree Kelvin (°K)tK= (tF + 59.7)/1.8 degree Kelvin (°F) degree Celsius (°C)tC = (tK - 32)/1.8
* One U.S. gallon equals 0.8327 Canadian gallon ** A pascal equals 1000 Newton per square meter.
The prefixes and symbols below are commonly used to form names and symbols of the decimal multiples and submultiples of the SI units.
Multiplication Factor Prefix Symbol
1,000,000,000 = 109
1,000,000 = 106
1,000 = 103
0.01 = 10-2
0.001 = 10-3
0.000001 = 10-6
0.000000001 = 10-9
giga G mega M
kilo k centi c milli m micro μ nano n
F-1

Joist Failure –Combined Shear and bending Test
Combined Shear and Bending Test Setup
F-2

Joist Failure – Combined Shear and Bending
Joist Failure – Shear Test
F-3

F-4

2x8x43 Shear Test #1
0
1000
2000
3000
4000
5000
6000
0 0.05 0.1 0.15 Deflection (in.)
Ulti
mat
e Lo
ad (l
b)
2x8x43 Shear Test #2
0
1000
2000
3000
4000
5000
0 0.05 0.1 0.15 Deflection (in.)
Ulti
mat
e lo
ad (l
b)
2x8x43 Shear Test #3
0
1000
2000
3000
4000
5000
6000
0 0.02 0.04 0.06 0.08 0.1 0.12 Deflection (in.)
Ulti
mat
e lo
ad (l
b)
F-5

2x8x54 Shear Test #1
0
2000
4000
6000
8000
10000
12000
0 0.05 0.1 0.15 Deflection (in.)
Ulti
mat
e Lo
ad (l
b)
2x8x54 Shear Test #2
0
2000
4000
6000
8000
10000
12000
0 0.05 0.1 0.15 0.2 0.25 Deflection (in.)
Ulti
mat
e Lo
ad (l
b)
2x8x54 Shear Test #3
0
2000
4000
6000
8000
10000
12000
0 0.05 0.1 0.15 0.2 Deflection (in.)
Ulti
mat
e Lo
ad (l
b)
F-6

2x8x43 Stiffened Test #1
0
2000
4000
6000
8000
10000
0 0.05 0.1 0.15 Deflection (in.)
Ulti
mat
e Lo
ad (l
b)
2x8x43 Stiffened Test #2
0
2000
4000
6000
8000
10000
12000
0 0.05 0.1 0.15 Deflection (in.)
Ulti
mat
e Lo
ad (l
b)
F-7

2x8x43 Stiffened Test #3
0
2000
4000
6000
8000
10000
0 0.05 0.1 0.15 Deflection (in.)
Ulti
mat
e Lo
ad (l
b)
2x12x54 Stiffened Test #1
0 1000 2000 3000 4000 5000 6000 7000 8000 9000
0 0.05 0.1 0.15 Deflection (in.)
Ulti
mat
e Lo
ad (l
b)
F-8
2x12x54 Stiffened Test #2
0 1000 2000 3000 4000 5000 6000 7000 8000 9000
0 0.05 0.1 0.15 Deflection (in.)
Ulti
mat
e Lo
ad (l
b)

F-9

2x12x68 Stiffened Test #2
0 1000 2000 3000 4000 5000 6000 7000 8000
0 0.05 0.1 0.15 Deflection (in.)
Ulti
mat
e Lo
ad (l
b)
2x12x68 Stiffened Test #1
0 1000 2000 3000 4000 5000 6000 7000 8000
0 0.05 0.1 0.15 Deflection (in.)
Ulti
mat
e Lo
ad (l
b)
F-10

2x8x43 I TF Test #1
0 200 400 600 800
1000 1200 1400 1600 1800
0 0.02 0.04 0.06 0.08 0.1 Deflection (in.)
Ulti
mat
e Lo
ad (l
b)
2x8x43 I TF Test #2
0 200 400 600 800
1000 1200 1400 1600 1800
0 0.02 0.04 0.06 0.08 0.1 Deflection (in.)
Ulti
mat
e Lo
ad (l
b)
2x8x43 I TF Test #3
0 200 400 600 800
1000 1200 1400 1600 1800
0 0.02 0.04 0.06 0.08 0.1 Deflection (in.)
Ulti
mat
e Lo
ad (l
b)
F-11

2x12x54 I TF Test #1
0
500
1000
1500
2000
2500
3000
0 0.02 0.04 0.06 0.08 0.1 0.12 Deflection (in.)
Ulti
mat
e Lo
ad (l
b)
2x12x54 I TF Test #2
0
500
1000
1500
2000
2500
3000
0 0.02 0.04 0.06 0.08 0.1 0.12 Deflection (in.)
Ulti
mat
e Lo
ad (l
b)
F-12

2x12x68 I TF Test #1
0 500
1000 1500 2000 2500 3000 3500 4000
0 0.02 0.04 0.06 0.08 Deflection (in.)
Ulti
mat
e Lo
ad (l
b)
2x12x68 I TF Test #2
0 500
1000 1500 2000 2500 3000 3500 4000
0 0.02 0.04 0.06 0.08 Deflection (in.)
Ulti
mat
e Lo
ad (l
b)
2x12x68 I TF Test #3
0
500
1000
1500
2000
2500
3000
3500
0 0.02 0.04 0.06 0.08 Deflection (in.)
Ulti
mat
e Lo
ad (l
b)
F-13

2x8x43 ETF Test #1
0
100
200
300
400
500
600
0 0.02 0.04 0.06 0.08 0.1 0.12 0.14 Deflection (in.)
Ulti
mat
e Lo
ad (l
b)
2x8x43 ETF Test #2
0
100
200
300
400
500
600
0 0.02 0.04 0.06 0.08 0.1 0.12 0.14 Deflection (in.)
Ulti
mat
e Lo
ad (l
b)
F-14

2x12x54 ETF Test #1
0 100 200 300 400 500 600 700 800 900
1000
0 0.02 0.04 0.06 0.08 0.1 0.12 0.14 Deflection (in.)
Ulti
mat
e Lo
ad (l
b)
2x12x54 ETF Test #2
0 100
200 300
400 500
600 700
800 900
0 0.02 0.04 0.06 0.08 0.1 0.12 0.14 Deflection (in.)
Ulti
mat
e Lo
ad (l
b)
F-15

2x12x68 ETF Test #1
0
200
400
600
800
1000
1200
1400
1600
0 0.05 0.1 0.15 0.2 0.25 Deflection (in.)
Ulti
mat
e Lo
ad (l
b)
2x12x68 ETF Test #2
0
200 400
600 800
1000 1200
1400 1600
1800
0 0.05 0.1 0.15 0.2 0.25 Deflection (in.)
Ulti
mat
e Lo
ad (l
b)
F-16

2x8x43 Bending Test #1
0 200 400 600 800
1000 1200 1400 1600 1800 2000
0 0.2 0.4 0.6 0.8 1 1.2 1.4 Deflection (in.)
Ulti
mat
e Lo
ad (l
b)
2x8x43 Bending Test #3
0 200 400 600 800
1000 1200 1400 1600 1800 2000
0 0.2 0.4 0.6 0.8 1 1.2 1.4 1.6 1.8 Deflection (in.)
Ulti
mat
e Lo
ad (l
b)
2x8x43 Bending Test #2
0 200 400 600 800
1000 1200 1400 1600 1800 2000
0 0.2 0.4 0.6 0.8 1 1.2 1.4 Deflection (in.)
Ulti
mat
e Lo
ad (l
b)
F-17

2x8x54 Bending Test #1
0
500
1000
1500
2000
2500
3000
3500
4000
0 0.2 0.4 0.6 0.8 1 1.2 1.4 1.6 Deflection (in.)
Ulti
mat
e Lo
ad (l
b)
2x8x54 Bending Test #2
0
500
1000
1500
2000
2500
3000
3500
4000
0 0.2 0.4 0.6 0.8 1 1.2 1.4 1.6 Deflection (in.)
Ulti
mat
e Lo
ad (l
b)
2x8x54 Bending Test #3
0
500
1000
1500
2000
2500
3000
3500
4000
0 0.2 0.4 0.6 0.8 1 1.2 1.4 1.6 Deflection (in.)
Ulti
mat
e Lo
ad (l
b)
F-18

2x10x54 Bending Test #1
0
500
1000
1500
2000
2500
3000
0 0.2 0.4 0.6 0.8 1 1.2 1.4 1.6 Deflection (in.)
Ulti
mat
e Lo
ad (l
b)
2x10x54 Bending Test #2
0
500
1000
1500
2000
2500
3000
0 0.2 0.4 0.6 0.8 1 1.2 1.4 1.6 Deflection (in.)
Ulti
mat
e Lo
ad (l
b)
2x10x54 Bending Test #3
0
500
1000
1500
2000
2500
3000
0 0.2 0.4 0.6 0.8 1 1.2 1.4 1.6 Deflection (in.)
Ulti
mat
e Lo
ad (l
b)
F-19

2x12x54 Bending Test #1
0
500
1000
1500
2000
2500
3000
0 0.2 0.4 0.6 0.8 1 1.2 1.4 1.6 1.8 Deflection (in.)
Ulti
mat
e Lo
ad (l
b)
2x12x54 Bending Test #2
0
500
1000
1500
2000
2500
3000
0 0.2 0.4 0.6 0.8 1 1.2 1.4 1.6 1.8 Deflection (in.)
Ulti
mat
e Lo
ad (l
b)
2x12x54 Bending Test #3
0
500
1000
1500
2000
2500
3000
0 0.2 0.4 0.6 0.8 1 1.2 1.4 1.6 1.8 2 Deflection (in.)
Ulti
mat
e Lo
ad (l
b)
F-20
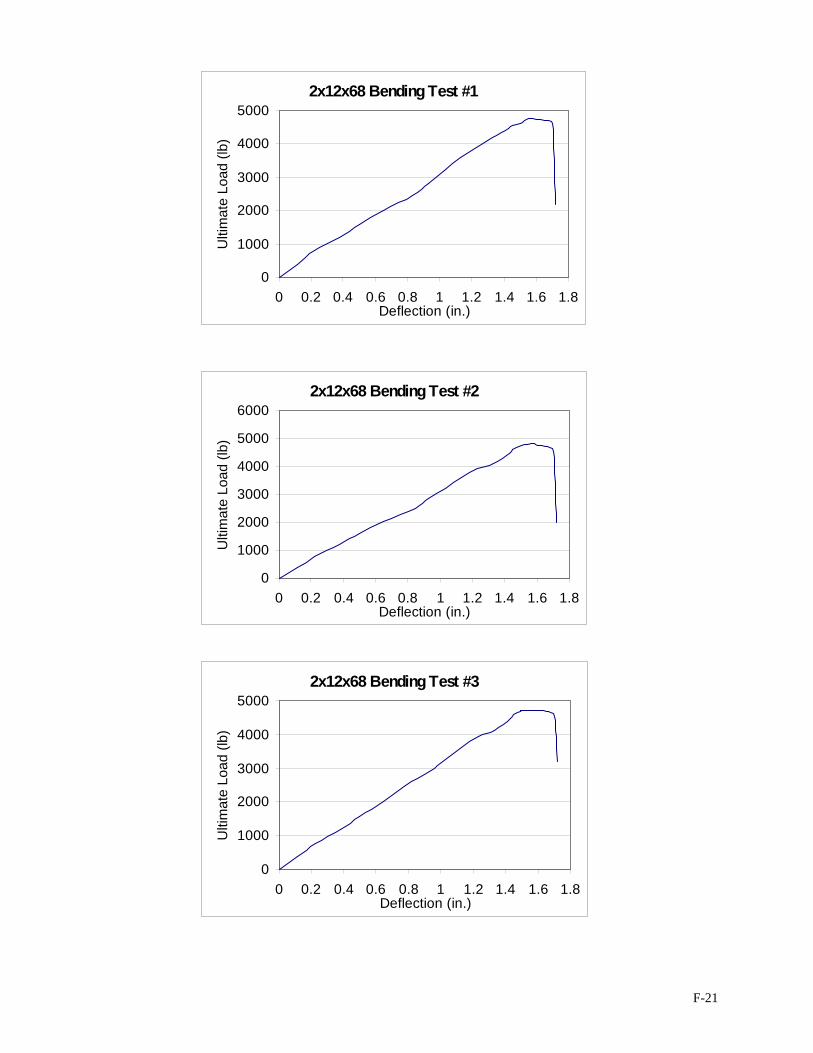
2x12x68 Bending Test #1
0
1000
2000
3000
4000
5000
0 0.2 0.4 0.6 0.8 1 1.2 1.4 1.6 1.8 Deflection (in.)
Ulti
mat
e Lo
ad (l
b)
2x12x68 Bending Test #2
0
1000
2000
3000
4000
5000
6000
0 0.2 0.4 0.6 0.8 1 1.2 1.4 1.6 1.8 Deflection (in.)
Ulti
mat
e Lo
ad (l
b)
2x12x68 Bending Test #3
0
1000
2000
3000
4000
5000
0 0.2 0.4 0.6 0.8 1 1.2 1.4 1.6 1.8 Deflection (in.)
Ulti
mat
e Lo
ad (l
b)
F-21
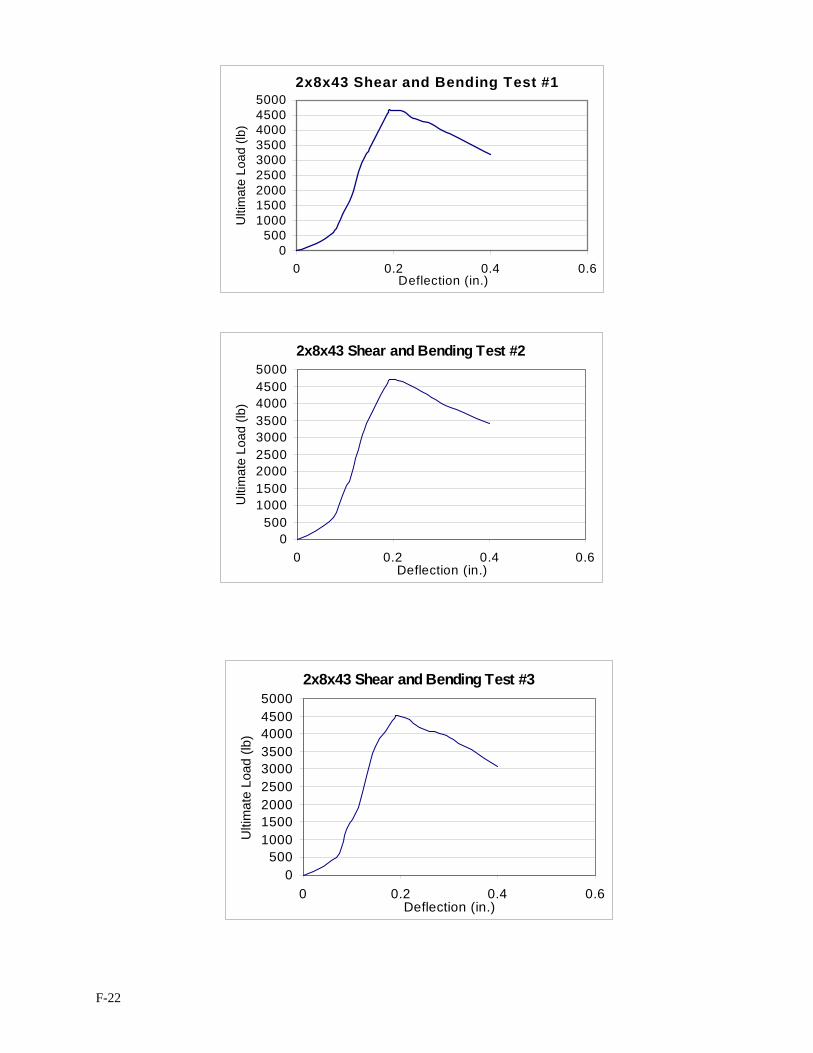
2x8x43 Shear and Bending Test #1
0 500
1000 1500 2000 2500 3000 3500 4000 4500 5000
0 0.2 0.4 0.6 Deflection (in.)
Ulti
mat
e Lo
ad (l
b)
2x8x43 Shear and Bending Test #2
0 500
1000 1500 2000 2500 3000 3500 4000 4500 5000
0 0.2 0.4 0.6 Deflection (in.)
Ulti
mat
e Lo
ad (l
b)
2x8x43 Shear and Bending Test #3
0 500
1000 1500 2000 2500 3000 3500 4000 4500 5000
0 0.2 0.4 0.6 Deflection (in.)
Ulti
mat
e Lo
ad (l
b)
F-22

2x8x54 Shear and Bending Test #1
0 1000 2000 3000 4000 5000 6000 7000 8000 9000
0 0.2 0.4 0.6 Deflection (in.)
Ulti
mat
e Lo
ad (l
b)
2x8x54 Shear and Bending Test #2
0 1000 2000 3000 4000 5000 6000 7000 8000 9000
0 0.2 0.4 0.6 Deflection (in.)
Ulti
mat
e Lo
ad (l
b)
2x8x54 Shear and Bending Test #3
0 1000 2000 3000 4000 5000 6000 7000 8000 9000
0 0.2 0.4 0.6 Deflection (in.)
Ulti
mat
e Lo
ad (l
b)
F-23

2x10x54 Shear and Bending Test #1
0 1000 2000 3000 4000 5000 6000 7000 8000 9000
0 0.2 0.4 0.6 Deflection (in.)
Ulti
mat
e Lo
ad (l
b)
2x10x54 Shear and Bending Test #2
0 1000 2000 3000 4000 5000 6000 7000 8000 9000
0 0.2 0.4 0.6 Deflection (in.)
Ulti
mat
e Lo
ad (l
b)
2x10x54 Shear and Bending Test #3
0 1000 2000 3000 4000 5000 6000 7000 8000 9000
0 0.2 0.4 0.6 Deflection (in.)
Ulti
mat
e Lo
ad (l
b)
F-24

2x12x54 Shear and Bending Test #1
0 1000 2000 3000 4000 5000 6000 7000 8000 9000
0 0.2 0.4 0.6 Deflection (in.)
Ulti
mat
e Lo
ad (l
b)
2x12x54 Shear and Bending Test #2
0 1000 2000 3000 4000 5000 6000 7000 8000 9000
0 0.2 0.4 0.6 Deflection (in.)
Ulti
mat
e Lo
ad (l
b)
2x12x54 Shear and Bending Test #3
0 1000 2000 3000 4000 5000 6000 7000 8000 9000
0 0.2 0.4 0.6 Deflection (in.)
Ulti
mat
e Lo
ad (l
b)
F-25

F-26

2x12x68 Shear and Bending Test #1
0
2000
4000
6000
8000
10000
12000
14000
0 0.2 0.4 0.6 Deflection (in.)
Ulti
mat
e Lo
ad (l
b)
2x12x68 Shear and Bending Test #2
0
2000
4000
6000
8000
10000
12000
14000
0 0.2 0.4 0.6 Deflection (in.)
Ulti
mat
e Lo
ad (l
b)
2x12x68 Shear and Bending Test #3
0
2000
4000
6000
8000
10000
12000
14000
0 0.2 0.4 0.6 Deflection (in.)
Ulti
mat
e Lo
ad (l
b)
F-27

2x12x68 Shear and Bending Test #4
0
2000
4000
6000
8000
10000
12000
14000
0 0.2 0.4 0.6 Deflection (in.)
Ulti
mat
e Lo
ad (l
b)
F-28

F-29