innovative regions and industrial clusters within...
TRANSCRIPT

1
Innovative regions and industrial clusters within hydrogen and fuel cell technologies
Anne Nygaard Madsen*, Per Dannemand Andersen
Department of Management Engineering, Technical University of Denmark, P.O. Box 49,
Building 110, DK-4000 Roskilde, Denmark
*) Corresponding author:
E-mail: [email protected]
Phone: +45 4677 5138
Fax: +45 4677 5199
Abstract
Regional governments in Europe seem to play an increasing role in the hydrogen and fuel
cell (H2FC) development. A number of regions support demonstration projects and build
networks among regional stakeholders in order to strengthen the region’s engagement in
H2FC technologies. In this article we analyse regions that are highly engaged in H2FC ac-
tivities based on three indicators: existing hydrogen infrastructure and production sites, gen-
eral innovativeness, and the presence of industrial clusters with relevance for H2FC. We find
that regions with a high activity in H2FC also are generally innovative regions. Moreover,
the article points out certain industrial clusters that favours some regions’ conditions for tak-
ing part in the H2FC development. However, existing hydrogen infrastructure seems to play
a minor role for region’s engagement. The article concludes that an overall well-functioning
regional innovation system is important in the formative phase of an H2FC innovation sys-
tem, but that further research is needed before qualified policy implications can be drawn.
Keywords: Clusters, Regions, Hydrogen,
2
1 Introduction
Innovation in energy technologies is high on the political agenda in Europe not only for rea-
sons of energy and climate policy, but also to help increase the EU’s overall competitiveness
(the “Lisbon Agenda”) through initiatives such as the Competitiveness and Innovation
Framework Programme (CIP). In this connection competitiveness not only refers to mini-
mizing firms’ expenditures to energy but also (and maybe in particular) to industry’s ability
to innovate and stay competitive within new and sustainable energy technologies.
The regional level seems to have an increasing importance in providing good political and
socio-economic framework conditions for innovation. Asheim and Gertler (2005) have em-
phasized that a regional level of governance of economic processes, between the national
level and the level of clusters and firms, is important in supporting the institutional settings
that can promote innovation. In a study of a global economy’s impact on innovation policy
Lundvall and Borrás (1999) find that ‘The region is increasingly the level at which innova-
tion is produced through regional networks of innovators, local clusters and the cross-
fertilising effects of research institutions’. This trend seems to be confirmed by studies and
actions at the hydrogen and fuel cell (H2FC) area in Europe, where the regional level has
been recognised as a significant driver on the pathway to a hydrogen economy. Examples on
this are the work done in recent years to get the local and regional authorities represented in
the Joint Technology Initiative and the Hydrogen and Fuel Cell Platform which has culmi-
nated in the constitution of the Regions and Municipalities Partnership on Hydrogen and
Fuel Cells (HyRaMP) in April 2008.
The Internet provides numerous examples of regions (remote islands, cities, municipalities,
federal states, etc.) that declare themselves as hydrogen communities (Mans et al., 2008).
Furthermore, regional authorities have in many cases developed fully fletched strategy plans
3
and allocated significant public financing in achieving the goals of such strategies. Just two
examples representing both small and large communities are:
o The Western Isles Hydrogen Community Plans: Creating a Pathway to the Hydrogen
Economy (concerning the Outer Hebrides, a part of the UK)
o Fuel Cell and Hydrogen Network in North Rhine-Westphalia (Concerning a federal
state in Germany)
The European project Roads2Hycom has analysed 96 potential hydrogen communities based
on a call for Registration of Interest (Shaw and Mazzucchelli 2007). Their analysis shows
that government or regional/local authorities are involved in nearly 80% of the registrated
projects. This makes regional authorities the most important actor ahead of SMEs and large
corporations. Regional authorities’ engagement is typically guided by energy and environ-
mental policy concerns but also by industrial or political-economical policy concerns - espe-
cially stimulating new industrial clusters based on these new technologies. As regional
authorities actively are involved in stimulating H2FC technologies and related industrial
clusters a range of questions arise. Hence, the research questions for this article are:
o Do geography and cluster aspects matter in establishing a European hydrogen energy
technology innovation system?
o Are there any geographical relationship between regions with a high level of H2FC
activities and
- existing hydrogen infrastructure and hydrogen production sites?
- generally innovative regions in Europe? And
- existing industrial clusters in Europe?
2 Innovation systems and industrial clusters
The process of innovation is often complex and uncertain and technological innovation is not
solely a matter of technology, manufacturers and markets. Policy makers, analysts and inno-
4
vators also have to address the wider framework or environment in which companies oper-
ate, and in which new innovations and technologies emerge. The concept of innovation sys-
tems takes this broad view of the process of innovation. An innovation system can be defined
as the “elements and relationships which interact in the production, diffusion and use of new
and economically useful knowledge” (Lundvall, 1992). The elements are various types of
actors forming the system: Manufactures, suppliers, consultancy companies, public authori-
ties, policy makers, universities, research institutes, trade associations, consumers etc. Rela-
tionships take shape as informal or formal networks such as project activities or buyer-
supplier relationships. These relationships link actors in interactive learning processes. For
instance, the relationship between actors involved in a demonstration project builds on ex-
change of knowledge and know-how. The interaction is influenced by the institutional set-up
in which it takes place. The institutional set-up is laws and rules shaped by policies that regu-
late the interaction between actors. It also includes norms and codes of practice, which typi-
cally depends on cultural differences.
When analysing regional policy measures for promoting hydrogen communities two theo-
retical branches of innovation system studies are available. First, the analytical focus can be
set on the technology or the emerging industrial sector and innovation theorists then talk
about technology-specific innovation systems – TIS (Jacobsson & Bergek 2004, Hekkert
et.al. 2006, Carlson & Stankiewicz 1991) or sectoral innovation systems – SIS (Breschi &
Malerba 1997, Malerba 2002). Second the analytical focus can be set on the geographical
entity of the community and innovation theorists then talk about regional innovation systems
- RIS (Cooke, 2001; Asheim & Gertler, 2004; Asheim & Gertler, 2005). These two theoreti-
cal approaches are parallel to two distinguished but often related policy fields, respectively
Research and Development policy and Regional Development policy. The technology spe-
cific approach is more concerned about directing R&D initiatives at an overall level. Its fo-
cus is on analysing barriers and possibilities in the technological development.

5
The regional innovation system approach is to a larger extent interested in directing regional
innovation policy. This approach takes a more holistic view on a region’s production struc-
ture. In the regional approach the administrative borders of a region defines what to include
in the analysis depending on which industries are located in the region. The focus is partly on
strengthening the regional innovation system’s ability to innovate and partly on improving
the ability to benefit from external links. The two approaches TIS and RIS can therefore be
seen as relevant for two different political levels, respectively national (or supra-national)
and regional level.
2.1 Regional innovation systems and clusters
Focus in analyses of regional innovation systems (RIS) is on the “institutional infrastructure
supporting innovation within the production structure of a region” (Asheim & Gertler,
2005). RIS emphasizes the importance of a regional level of governance of economic proc-
esses between the national level and the level of clusters and firms.
The RIS approach focuses particularly on localised learning and intra- and interregional
knowledge flows. As in the other branches of innovation system studies, learning is viewed
as a social interactive process building on trust (Lundvall 1992, Cooke 2002). But in the RIS,
geographical proximity is often seen as a vital facilitator of innovation processes, because of
the tacit character of knowledge. In RIS studies geographical proximity is thought of as one
out of more factors influencing innovation processes positively. Other factors are 1) special-
ised suppliers with a specific technology or knowledge-base, 2) regional culture such as
norms, values, routines and expectations (Asheim and Gertler 2005), and 3) a certain degree
of social cohesion to avoid polarisation in a region (Lundvall and Borrás 1999).
The approach of RIS is tightly affiliated with the concept of industrial clusters but the two
concepts should not be conflated. Clusters should be seen as more sector specific than RIS
(Asheim and Coenen 2004). The latter can in principle stretch across several sectors because

6
it includes the entire production structure within a region. In consequence regional innovati-
on systems may consist of several clusters with relevance for H2FC development.
Porter (2000) defines a cluster as a “Geographic concentration of interconnected companies,
specialized suppliers, service providers, firms in related industries, and associated institu-
tions (for example universities, standard agencies, and trade associations) in particular
fields that compete but also co-operate”.
Two matters are important to notice in Porter’s definition of a cluster. The first is the notion
of geographical concentration. Physical proximity is seen as extremely important for the in-
novation process because it eases the sharing of tacit knowledge. Another important matter
in the definition of a cluster is how companies are interconnected. In a cluster, companies,
suppliers and service providers compete and cooperate both horizontally and vertically in the
value chain. In fact the interaction between companies and the physical proximity is two
sides of the same coin. They are mutually related and that is what creates the spill-over in
form of a specialized workforce, specialized regional suppliers, information, and training
facilities. And that is considered to increase the productivity with which companies can
compete, nationally and globally.
Although, some studies find that for high-tech sectors physical proximity is of less impor-
tance (Mans et al. 2008). In some high-tech sectors external relationships to companies lo-
cated worldwide can be of just as great importance – or maybe greater – as relationships to
companies located in their own region. In relation to H2FC technology this should not be
neglected and it might suggest that regions in formulating their policy strategies pay a spe-
cial attention to how these ties can be strengthened as well.
From a regional policy perspective the most commonly used policy instrument in promoting
clusters has been to support network activities (Sölvell et al.2003). Within the H2FC area

7
this has often been in form of Public Private Partnerships (PPP). Other policy objectives
have been to promote innovation through RD&D (research, development and demonstration)
funding, create a special brand for the region, attract new firms and talent to the region, pro-
vide assistance to businesses, diffuse technology within the cluster, study and analyse the
cluster and its needs, etc.
In the H2FC area industrial clusters in Porter’s version do not exist yet. And it seems uncer-
tain if it is an appropriate strategy to start creating H2FC clusters from scratch. Instead the
most reasonable way for regions to promote the creation of H2FC clusters seem to be sup-
port of other (relevant) clusters in the direction of a stronger uptake of H2FC technologies.
In this way a region will be able to build their H2FC engagement upon competences and
strengths already present in the region.
However, in order to create the right conditions to fulfil the vision of a hydrogen economy
the cluster approach seems to be too partial to stand alone. Its focus on segregated single
clusters seems to be inadequate to address the system character of a future hydrogen based
energy system. Furthermore, directing policy towards a single cluster is in jeopardy of fa-
vouring certain technology options (“picking the winner”). Hence, regional innovation pol-
icy needs to create framework conditions for H2FC innovation that are broader based than
the single cluster focus. To this purpose a broader analytical perspective, such as the regional
innovation system approach, might be appropriate.
The RIS approach provides greater insight into strengths and competences at the regional
level. As an analytical tool it can reveal functions of the system that need support in order to
improve the overall innovation environment in the region.

8
3 Data for innovation studies
Following the recent decades’ interest in innovation studies and policy analyses solid statis-
tical data has been provided by different authorities. However, for this study, it has been an
analytical challenge that it is dealing with both geographical units and distinct technologies.
H2FC are a new area of industrial technologies and data to describe and analyse its charac-
teristics is rather limited. There are neither comprehensive time series established nor do the
technology data necessarily match with regional data.
3.1 Geographical units
The main analytical focus in this study is concerned with the geographical distribution of
H2FC activities in EU-27, Iceland, Norway, Liechtenstein and Switzerland. Data have been
mapped at NUTS level 2 by the means of a geographical information system tool (GIS).
NUTS (Nomenclature d'Unités Territoriales Statistiques) is created by Eurostat as hierarchi-
cal classification of geographical units used for statistical production across the European
Union. NUTS level 1 corresponds to a territory with a population of 3-7 million inhabitants.
NUTS level 1 thus often reflects high administrative levels such as the German Länder. The
analyses of this study is carried out on NUTS-level 2 (NUTSII) defined by Eurostat as ‘basic
regions’ and comprise 268 regions in Europe. Basic regions are used by Member States for
the application of their regional policies. Although this was the intention with the subdivi-
sion of NUTSII some countries are too small in terms of population to comply with Euro-
stat’s definition of regional geographical entities. For instance Denmark and Luxembourg
are characterised as NUTSII regions even though they represent nations with national policy
authorities. The more detailed level of NUTSIII comprises 1213 administrative regions in
Europe.
9
3.2 Sources of data
Regional innovation system and industrial cluster analyses usually draw on the vast geo-
graphical oriented statistical material provided by national statistical offices and EuroStat. In
Europe comprehensive statistical data are typically available as two entries: Geographical
entries of the levels of NUTS and industry level based entries on the NACE (Nomenclature
statistique des Activités économiques dans la Communauté Eu-ropéenne) codes. NACE is a
European industry standard classification system consisting of a 6 digit code and data is pro-
vided by national statistical offices based on questionnaires filled in by individual firms (for
example NACE code DJ.28.22 is “Manufacture of central heating radiators and boilers”).
The challenge is that no codes are available for neither hydrogen nor fuel cells, and the dis-
persed field of energy technologies is spread over many different NACE codes. A recent
analysis of self-declared hydrogen clusters in the Netherlands (Mans et al. 2008) is based on
a database on 166 hydrogen related projects carried out in the Netherlands between 2000 and
2005 involving 250 Dutch actors. The database contains information on geographical infor-
mation on each of the actors allowing analyses of geographical concentration of actors on the
level of the so-called COROP areas. COROP divides the Netherlands in 40 COROP-areas.
These areas are identical with Eurostat’s NUTSIII level. Such detailed databases are not yet
available for a Europe-wide study like the present.
Technology specific innovation system analyses usually draw on slightly different types of
statistical data than geographical oriented analysts. Bergek, Hekkert and Jacobsson (2007)
have proposed a number of indicators and data to map the functions of technological innova-
tions systems (TIS). Examples on indicators of the development and diffusion of knowledge
are patents, bibliometrics (publications, citations), and governmental expenditures on R&D.
Examples on indicators on market formation are size of the market (e.g. for fuel cells) and
support schemes (e.g. public investments subsidies). In the context of the European Envi-
ronmental Technologies Action Plan (EU ETAP) a variety of investigations have been car-
10
ried out on the concept of “eco-innovation” and indicators for this (Andersen, 2006). Much
of such statistical information is available for energy technologies such as H2FCs. Consul-
tancies such as Fuel Cell Today (www.fuelcelltoday.com) provide market based intelligence
on the fuel cell industry. Fuel Cell Quarterly published by FuelCell.org provides a similar
market surveys on both fuel cells and hydrogen technology. Patent statistics can be obtained
using databases like Derwent, and bibliometrics (publications and citations) can be obtained
from Web of Science – familiar to most scholars. The International Energy Agency (IEA)
provides statistics on governmental expenditures on energy related R&D. But IEA has only
included statistics on hydrogen and fuel cells since 2004 and data is still lacking from a
number of countries. Seymour, Borges & Fernandes (2007) have discussed and applied indi-
cators such as patents, publications and citations in an analysis of European countries public
research in H2FC technologies. Similarly, Lee, Mogi and Kim (2008) have used the same
kind of indicators to analyse scenarios for Korea’s industrial potentials based on these tech-
nologies.
For our use the problem is that these statistical data only is available on national level and
not on regional levels. We are therefore left with doing analyses on what is available, and in
the following sections we will analyse on data made available from the Roads2Hycom pro-
ject (see description of data and the use of data below). Besides these data we have included
data from two major studies of the spatial economy of Europe – The Regional Innovation
Scoreboard and The European Cluster Observatory.
4 Hydrogen and fuel cells activities in Europe
H2FC technologies are emerging technologies and the markets for these technologies are
still in the formative phases. Therefore, it is not yet possible to analyse existing industrial
clusters based on these technologies. However, hints can be drawn on analysing available
information. Available information provided by different parts of the Roads2Hycom project
comprises the following data at NUTSII level:
11
- H2FC demonstration projects
- Hydrogen fuelling stations
- Registration of Interest (RoI) for communities undertaking large-scale H2FC pro-
jects and innovative applications
Comparing these data indicates which European regions (at NUTSII level) are involved in
H2FC activities. Although the data may not give a complete picture of all H2FC activities in
Europe it seems to be the best available and can give us a broad idea of where hydrogen ac-
tivities are located.
We have classified the data (for each indicator) into four intervals based on natural breaks in
the data, i.e. the biggest gaps in the dataset were used to classify the data into groups (Nel-
son, R. 1999). We used this classification method to ensure that similar observations were
grouped together in the same interval. In order to be able to sum the three indicators into one
total score for H2FC activities we then ranked the intervals with a score from 1-4. For exam-
ple for the dataset on demonstration sites we first classified the data in five groups: 0, 1, 2-3,
4-5 and 5<. Next we ranked the intervals with the values from 0 to 4. The total score for each
region was calculated by summarising the score for the three indicators: demonstration sites,
fuelling stations and registration of interests. All NUTSII regions with a total score higher
than three (15 regions) have been included in the further studies. Additionally we have in-
cluded one NUTSI region (Wales, NUTS-code: UKL) because the data on the Regional In-
novation Scoreboard (that we compare the regions with later) only exists for the English re-
gions at this level. An adding up of activities from NUTSII to NUTS level I for the UK re-
gions ranked Wales among the most active regions within H2FC.

12
4.1 Hydrogen and fuel cell demonstration projects
Based on existing and regularly maintained databases the European project Roads2Hycom
has identified and analysed over 130 hydrogen demonstration projects within the European
Union and the associated countries Norway and Iceland (Steinberger-Wilckens and Trümper,
2007). The demonstration projects were mostly related to transport, stationary use, and com-
binations hereof. The study included and distinguished between four types of demonstration
projects: In planning, in operation, finished and interrupted. Only 2 of the projects comprised
portable use of H2FC technology.
The NUTSII regions were ranked based on data for demonstration projects using the follow-
ing score: 0: no demonstration projects, 1: 1 demonstration project, 2: 2 to 3 demonstration
projects, 3: 4 to 5 demonstration projects, 4: more than 5 demonstration projects.
Demonstration projects were located in 15 countries. Most in Germany (24%), but also
France, Denmark and Italy hosted each more than 10 percent of the total. Steinberger-
Wilckens and Trümper (2007) conclude that an early clustering of demonstration projects
seems to appear in the German Rhein-Ruhr/Rhein-Main area and in the cross-boarder region
of Denmark and southern Sweden.
4.2 Hydrogen fuelling stations
Hydrogen fuelling stations are a prerequisite for developing the use of hydrogen in the trans-
port sector. Based on a study by German consulting firm Ludwig-Bölkow-Systemtechnik the
Roads2Hycom project has analysed the existing and planned hydrogen fuelling stations for
vehicles (cars and busses) in Europe. The analysis included stations in operation, expired
stations and planned stations (Perrin, Steinberger-Wilckens, Trümper, 2007).
By the time of the study (end of 2007) 35 hydrogen fuelling stations were in operation in
Europe. Most of these were located in Germany. Furthermore, a large number of fuelling
stations were planned especially in Scandinavia. In total, 72 operational or planned hydrogen
13
fuelling stations were analysed with geographical data on NUTSIII level. Data for the analy-
sis of this study was aggregated at NUTSII level and ranked by following the natural breaks
(see above) of the data set: 0: no H2 fuelling stations, 1: 1 H2 fuelling stations, 2: 2-3 H2
fuelling stations, 3: 4-5 fuelling stations, 4: more than five H2 fuelling stations.
We have not distinguished between planned and operational hydrogen fuelling stations in
our mapping exercise in this study. We found that an aggregated count of fuelling stations
‘in planning’ and ‘in operation’ is adequate to indicate the level of activity. However, there is
a risk that the planned fuelling stations never will be realised, but at present stage they indi-
cate regions intention and can therefore very well illustrate the activity level.
4.3 Registration of Interest (RoI) for communities undertaking hydrogen and fuel cell pro-
jects
During 2006 the European project Road2Hycom launched a call for “Registration of Inter-
est” for potential hydrogen communities in Europe (in this case: EU27, EEA and acceding
and candidate countries). In an overall database 96 potential hydrogen communities were
listed. Not surprisingly the largest number of potential hydrogen communities was regis-
trated in Germany with almost a quarter of the total. Also Italy, and UK had each more than
10% of the total number of communities. Collectively the five Nordic countries accounted
for 17% of all projects (Shaw and Mazzucchelli, 2007). From the overall database a sample
of 36 projects is included in this analysis. They are the communities who have responded on
the Call for RoI for potential hydrogen communities. The call was launched in May 2006
and is regularly updated as new information becomes available.
Due to the low amount of registrations the maximum count in one region is three. The rank-
ing of the regions are therefore as follow (with a maximum score of three): 0: no RoI, 1: 1
RoI, 2: 2 RoI and 3: 3 RoI.

14
4.4 European regions with a high level of hydrogen and fuel cell activities
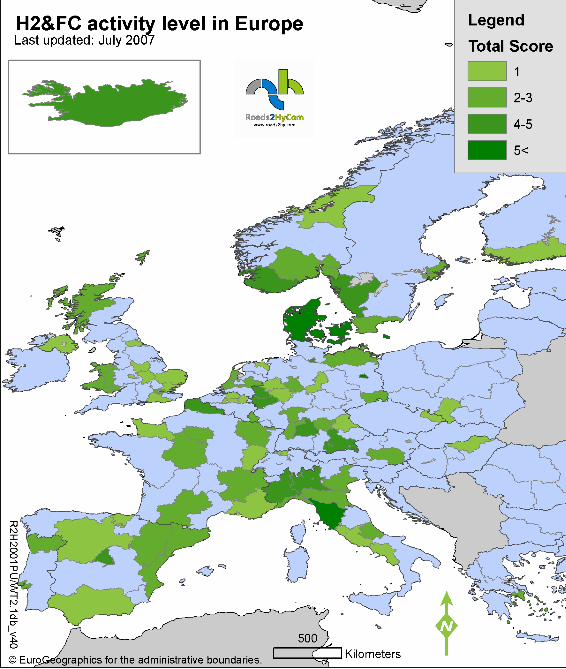
Figure 1 indicates the total H2FC score of the NUTSII regions in Europe. Furthermore, the
detailed result for 16 NUTSII regions with the highest H2FC score is shown in Table 1.
INSERT FIGURE 1 ABOUT HERE
INSERT TABLE 1 ABOUT HERE
In many cases the clustering of activities in neighbouring regions matches the location of
partnerships or corporative H2FC initiatives. The high score in the Scandinavian regions
matches the location of ‘The Scandinavian hydrogen highway partnership’ (SHHP) that fo-
cuses their collaboration on South/South-eastern Norway, the Swedish west coast and Den-
mark (www.scandinavianhydrogen.org). SHHP is a collaboration between three national
bodies: The HyNor (Norway), The Hydrogen Link (Denmark) and Hydrogen Sweden.
The score in the regions of the federal state North-Rhine-Westphalia in Western Germany
illustrates the many activities carried out by ‘Fuel Cell and Hydrogen Network NRW’. One
may note that the NUTSII level is well below the political entity of North-Rhine-Westphalia;
looking at NRW requires an adding up of these activities.
In Northeast Spain it is the Aragon hydrogen initiative initiated by the Spanish Ministry of
Industry in 2002. The high score in Northern Italy illustrates the many diverse Italian pro-
jects that have been carried out during the last decade. For example, In Lombardy: the Zero
Regio project in Mantova, the Bicocca Project in Milan, and the Arese project in Arese; in
Tuscany: the HBUS project in Florence and the Arezzo project. And in Piedmonte: the Hy-
drogen system laboratory in Turin.
15
Additionally, the German cities Hamburg and Berlin also score within the highest ranked
regions as well as North East England, Iceland and Nord-Pas-de-Calais in France.
5 High-level H2FC regions and existing infrastructure and production capacities
In the following we will examine whether the 16 high activity H2FC regions are located in
regions with existing infrastructure such as hydrogen pipelines and hydrogen production
sites.
5.1 Existing hydrogen production capacity
Hydrogen is used as an industrial gas in many process industries throughout Europe. The
total industrial hydrogen consumption in Europe is estimated to be about 61bn m3 (in 2003).
The most of this hydrogen was consumed by two industries: in oil refineries (ca. 50%) and
for production of ammonia (ca. 32%). ´The total production of hydrogen in European Union
amounts to 80 bn m3 (Steinberger-Wilckens, Trümper, 2007) – which means that some over-
capacity exists.
The number of hydrogen production sites in each NUTSII regions was counted. A ranking of
the regions is based on the following score: 1: 1-2 production sites, 2: 3-5 production sites, 3:
6-8 production sites, 4: 9-14 production sites. It was not possible to look at the specific pro-
duction processes of these facilities within the scope of this study.
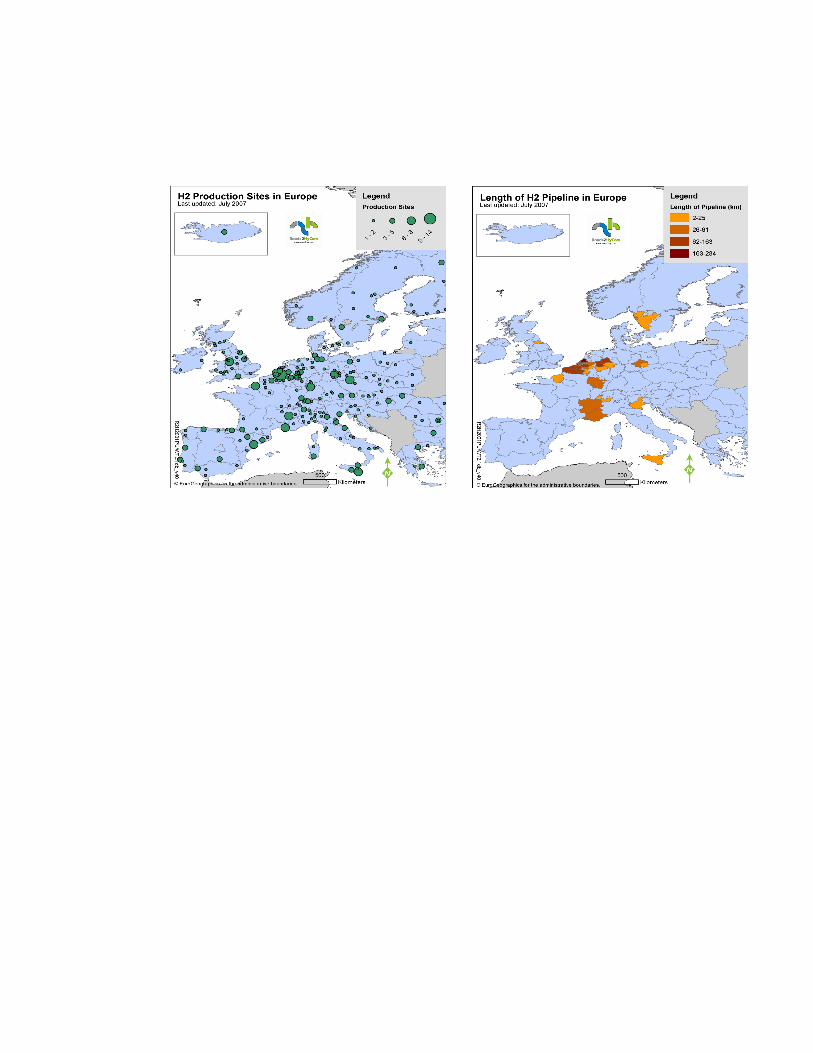
Important clusters of hydrogen production are mainly in the Benelux-countries, the Rhine-
Main area, Midlands in the UK, Southern France and in North Italy, but also regions in rim
of the European Union such as Ireland, Finland Lithuania, North East Spain, and Romania
have hydrogen production. Moreover it is interesting to note, that the new member states in
total have many H2 production sites.
16
5.2 Existing hydrogen pipeline infrastructure
The Roads2Hycom project has identified 15 larger hydrogen pipeline networks in different
parts of Europe with a total length of nearly 1600 km (Perrin, Steinberger-Wilckens, Trüm-
per, 2007). These pipeline networks are operated by firms like Air Liquide, Linde Gas and
Air Products. Pipelines are located in Western Belgium, Southern and Western Netherlands,
the German regions North-Rhein Westfalen, Sachsen and Sachsen-Anhalt and in the three
regions in eastern France (incl. South-East France). The length of the pipeline is measured in
km and mapped at NUTSII level. A ranking of the areas is based on the following score: 1:
2-25 km, 2: 26-61 km, 3: 62-163 km, and 4: 164-284 km. Figure 2 shows the geographical
distribution of respectively hydrogen production sites and hydrogen pipelines.
INSERT FIGURE 2 ABOUT HERE
5.3 Relationship between high-level H2FC regions and existing hydrogen infrastructure
A total score on existing infrastructure and production capacity was calculated by summaris-
ing the score for respectively production sites and the length of H2 pipelines. Then we
grouped the NUTSII regions based on their score on existing infrastructure into 3 groups:
High score: 4-8 points, Medium score: 2-3 points and Low score: 0-1 points. The distribution
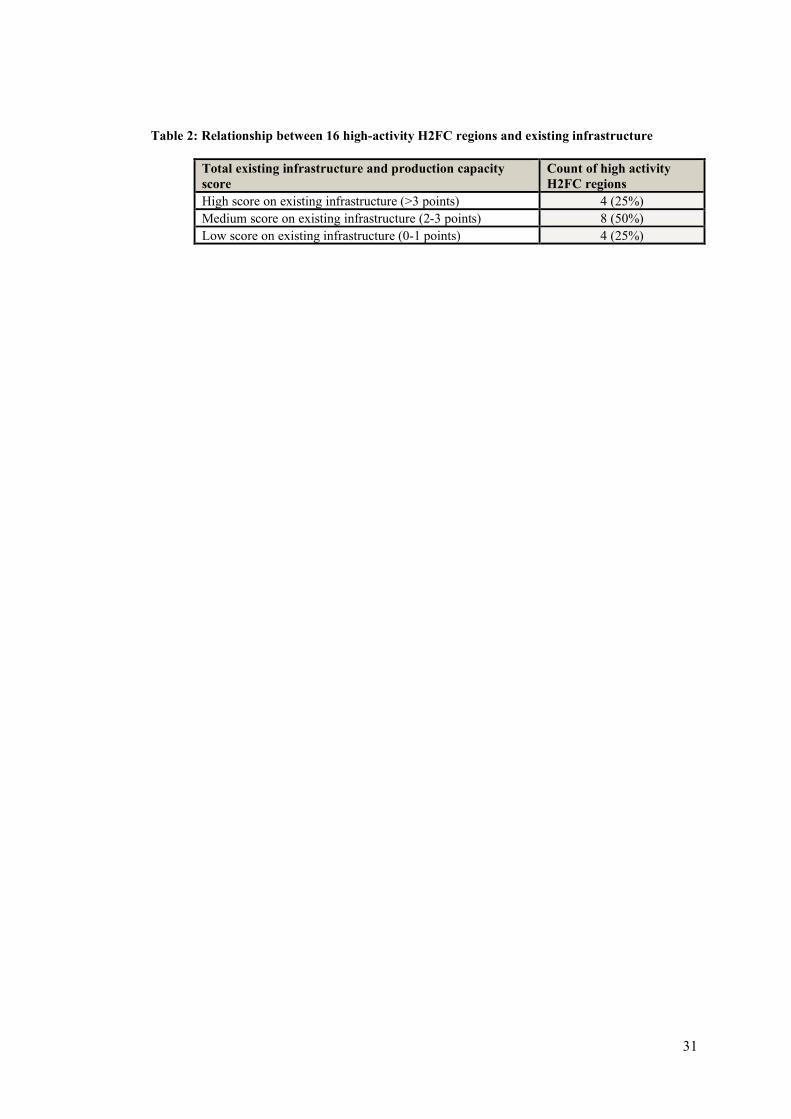
of the 16 high activity H2FC regions between the three groups can be seen in Table 2. Only
4 of the high activity H2FC regions score high on existing infrastructure and production ca-
pacity (Düsseldorf (DEA1) and Köln (DEA2) in Nordrhein-Westphalia, Nord – Pas-de-
Calais (FR30) and Lombardy (ITC4) in Northern Italy). Half of the high activity regions
score 2-3 points (Medium) on existing infrastructure and four regions score in the very low
end, 0-1 point.
INSERT TABLE 2 ABOUT HERE
17
Therefore, we cannot conclude that existing H2 production capacity and H2 pipelines play a
dominant role when regions decide on engaging in H2FC activities. However, the analysis
point out four regions that have a high activity level and a high activity of H2 capacity:
Düsseldorf and Köln in Nordrhein-Westphalia, Nord – Pas-de-Calais in France and
Lombardy in Northern Italy. Provided that existing H2 infrastructure (production capacities
and pipelines) is rewarding for H2FC development these four regions seem to have compara-
tive advantages for carrying out larger lighthouse projects.
6 Match between regions’ level of H2FC activities and their score in EU’s Regional
Innovation Scoreboard
The Regional Innovation Scoreboard 2006 was conducted by Maastricht Economic and so-
cial Research and training centre on Innovation and Technology (MERIT). It measures seven
innovation indicators: human resources in science and technology, participation in life long
learning, public and private R&D, patent applications, employment in medium-high and
high-tech manufacturing. It indicates the general innovation climate based on quantitative
data within a region. The scores of the scoreboard data lie within an interval of 0 to 1
whereby the region with the highest ranking scores 0.90 (Stockholm, Sweden).
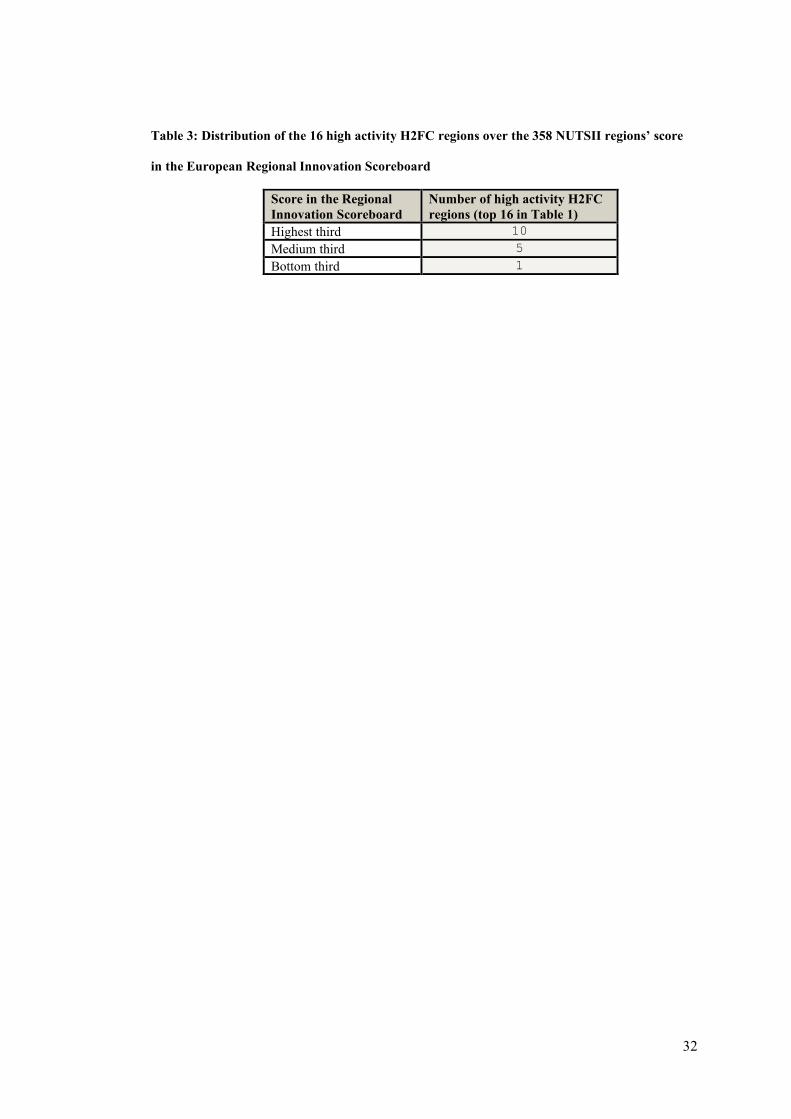
For the purpose of this study the Regional Innovation Score can be split into three categories;
the bottom third, the middle third and the highest third. Of the 16 highest placed H2FC re-
gions 10 (or 62.5 %) are also among the top third most innovative regions. (See table 3).
INSERT TABLE 3 ABOUT HERE
This clearly indicates that H2FC activities take place in regions that are generally innovative.
This confirms the general thesis in cluster theory that greater spill-over will happen where
knowledge concentration is high on beforehand (so-called endogenous growth theory). Pro-
vided that these regions also perform better (which has not been analysed here) the result

18
suggest that innovative regions have been faster in their attempts to promote H2FC activities.
It also suggests that innovative regions find it easier to jump on new technology paths or at
least are keener to take chances on new and uncertain technologies.
The high activity H2FC regions placed in the medium third are the Italian regions – Toscana,
Piedmont and Lombardy, the UK-region Wales, and the German region Düsseldorf. The
only high activity H2FC region in the bottom third is Nord – Pas-de-Calais a major centre
for heavy industry in the 19th century (coal mines and steel mills). After a heavy recession in
1970’s and 1980’s the region focuses today on tourism. This result also raises the question
about to which extent H2FC demonstration activities can be used in a political agenda on
improving regions innovative capabilities in general.
7 Assessing the presence of clusters in H2FC-regions
The following section compares the presence of likely future H2FC related industrial clusters
in high activity H2FC regions. The aim is to investigate whether certain existing clusters are
represented more frequently in high activity H2FC regions than in the rest of Europe.
The analysis is based on the cluster mapping carried out by the European Cluster Observa-
tory. The European Cluster Observatory has carried out cluster analyses in 32 countries with
NUTSII regions as the geographical unit. The analyses define clusters according to Michael
Porter’s analysis of employment distribution in North America (Porter, 2003). The American
study analysed the geographical distribution of employment in different industries and found
different patterns depending on type of industry. The industries were grouped into three dif-
ferent categories showing their diverse geographical profiles:
- Local industries are present in all regions as they serve local markets. They are not ex-
posed to direct competition across regions and are characterised by lower wages, produc-
19
tivity and rates of innovation. According to the European Cluster Observatory, local in-
dustries account for around 57 % of all employment in Europe.
- Traded cluster industries experience advantages in choosing their location and serve
markets across regions. They have a tendency to ‘cluster together’ and are characterised
by wages above average and higher productivity and level of innovation. The cluster sec-
tor accounts for about 37 % of European employment.
- Natural resource-based industries are located close to the deposits of the natural re-
sources they exploit and are therefore also geographically concentrated but for other rea-
sons. Around 5 % of the European employment is employed in the natural resource
based industry.
From the perspective of creating a hydrogen economy in all parts of society all three industry
groups will be affected. Local Industries will be affected either as users of new hydrogen
products or as retailers. The Natural Resource-Based Industries will be affected as hydrogen
is not an energy source in itself, but needs to be produced using fossil energy sources, bio
resources or similar. But in the development phase of a new technological trajectory the most
important industry actors should be found within the Traded Cluster Industries.
The European Cluster Observatory has divided the ‘Traded cluster industries’ into 38 cluster
categories (see www.clusterobservatory.eu). They have categorised a cluster’s strength in
accordance to size, specialisation and focus in order to measure sufficient critical mass to
develop the type of spill-over and linkages that creates positive economic effects. According
to the Cluster Observatory’s evaluation a cluster present in a given region receives between 1
and 3 stars depending on the strength of the cluster. However, in our study we do not distin-
guish between the amounts of stars but only focus on whether or not a cluster is present in
the given region.
20
We have calculated a Cluster Quotient (CQ) for each of the 38 clusters. The CQ is a measure
for co-location of H2FC activities and clusters. The CQ compares the proportion of clusters
(within the same cluster category) located in the 16 high activity H2FC regions to the pro-
portion of the total amount of clusters (within that same cluster category) in all the 258 re-
gions (see equation).
The Cluster Quotient is thus calculated as
CQi = (Ai/B)/(Ci/D);
where
i is a cluster according to the Cluster Observatory, e.g. Automotive
Ai is the number for i Clusters in all high activity H2FC regions
B is the number of all high activity H2FC regions (=16)
Ci is the number of all i type clusters (e.g. automotive) in all regions analysed by the
Cluster Observatory
D is the number of all regions analysed by the Cluster Observatory (=258)
A CQ>2 shows that the cluster are more frequently located in the high-level H2FC regions
than in the rest of Europe. Table 4 shows the calculated CQ for the 38 clusters in Europe.
INSERT TABLE 4 ABOUT HERE
First and foremost it is important to keep in mind that table 4 reveals a statistical measure for
co-location of H2FC activities and clusters. The CQ is not measuring whether or not a causal
relationship between certain clusters and H2FC technology exists. Furthermore, clusters are
analysed by studying concentration of employment within industrial sectors. Employment
with relevance for H2FC is most likely employed in companies’ R&D departments and
comprises a small part of the total employment. R&D departments are often located where

21
companies have there headquarters or where there is a critical mass of skilled workers.
Therefore, we presume that this co-location measure can give us some information on which
clusters play a role in the H2FC development.
Generally seen table 4 reflects the result from the analysis above of the correlation between
high active H2FC regions and the regional innovation scoreboard. Clusters with a high CQ
(>2) generally score higher in the indicators that form the innovation scoreboard (Human
resources in science and technology, participation in life long learning, public and private
R&D, patent applications, employment in medium-high and high-tech manufacturing) than
clusters with a CQ<2. Table 4 therefore confirm that an overall well-functioning innovation
environment is important for regions’ engagement in H2FC activities.
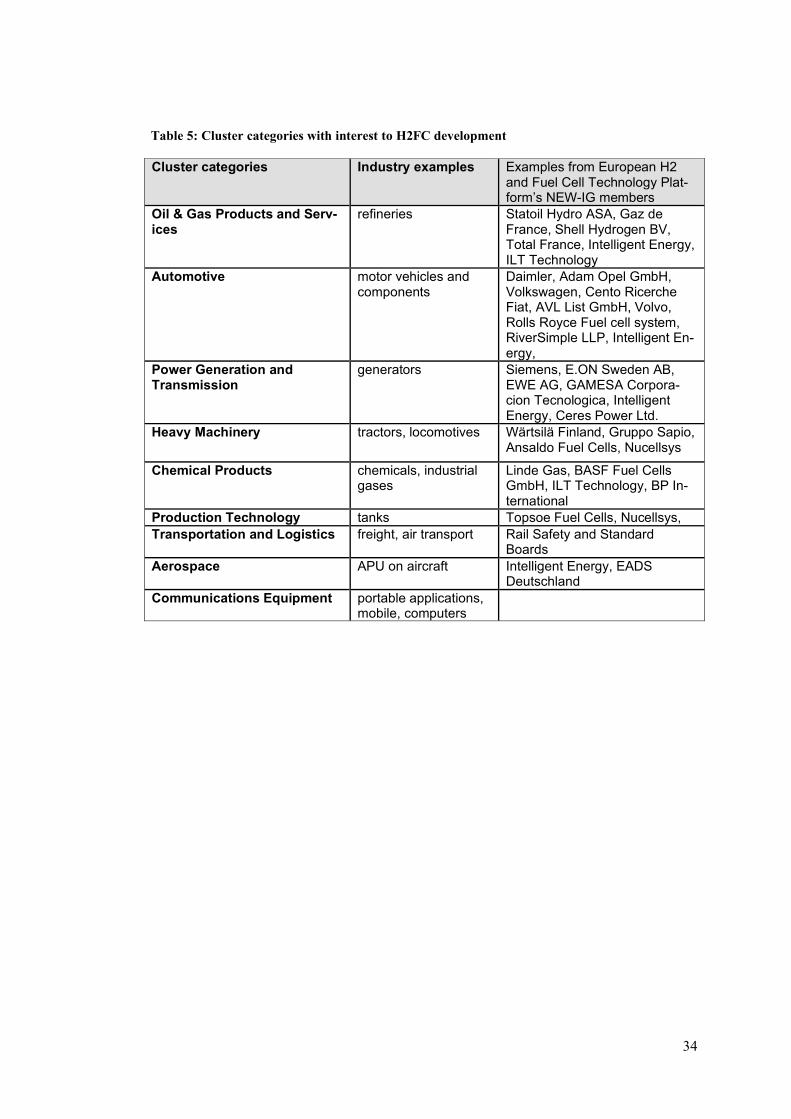
H2FC technology is yet at a stage where the relevance for many of the established clusters is
limited. We have identified nine cluster categories that most likely play a role in the devel-
opment of the technology and in improving the state-of-the-art of the technology. The nine
clusters are highlighted in table 4 and presented in details in Table 5. Table 5 present the
nine cluster categories, examples of industries and some examples of companies involved in
H2FC development.
Of the nine clusters with high relevance for H2FC technology seven have a CQ higher than
2. Only transportation and heavy machinery have a CQ less than 2.
Transportation covers inventories and logistics and distinguishes itself from the other clus-
ters by being a service sector providing transport and not the technology for transportation.
The transportations sector will be among the large end-user groups of H2FC based transpor-
tation technology. Heavy Machinery clusters are located in 4 out of the 16 H2FC clusters so
the result indicates, not surprisingly, that this cluster does not play a leading role in the re-
gional H2FC activities.
22
TABLE 5 INSERTED ABOUT HERE
Chemicals (3.1), Power generation and transmission (3.1), and Oil and gas (2.4) are three
clusters that are in particular relevant in producing and distributing hydrogen. Automotive
(2.4), communications equipment (2.9), aerospace (2.9), and production technology (2.9) are
clusters with an interest in the various application options H2FC offer. The CQs show a high
activity of co-location between H2FC activities and these clusters.
This result can be explained by taking the market maturity of H2FC technologies into ac-
count. Firms interested in developing and demonstrating H2FC technologies are in this early
phase firms seeking business opportunities in producing these technologies and providing the
hydrogen. Whereas, firms that potentially could become end-users of such technologies
(such as transportation) are likely to become involved in a later state of the technologies
market development.
Clusters, most unlikely to support the development of H2 and fuel cell technologies such as
Footwear, Furniture and Processed Food (beer, dairies, glass packages/wrapping) have a CQ
< 1. Also this seems quite naturally; firms in these sectors are only likely to become end-
users of H2FC technologies when they are fully matured, and competitive with other energy
technologies.
To sum up, a positive correlation is found between the presences of clusters assessed to be
H2FC friendly and the high activity H2FC regions. This indicates that specific clusters may
play a role in driving the development of H2FC technology. However, the most important
result of the study of Cluster Quotients seems to be a confirmation of the correlation between
innovative regions (hosting innovative clusters) and H2FC technology development. An in-

23
stitutional set-up with favourable conditions for innovation is therefore seen as extremely
important in promoting innovation activities within H2FC.
This study of regions’ role in H2FC development has a preliminary character and has to be
followed up by more in-depth studies. In particular studies of the relationship between cer-
tain clusters and H2FC technology will be of interest. A study of the institutional set-up at
the regional governance level and how to improve this through innovation policies would
also be very interesting and would be fruitful for the regional engagement in H2FC devel-
opment in the future.
8 Conclusion
In the introduction of the article we raised a number of research questions. In the following
we will try to answer these questions and discuss their implications for energy and regional
policy.
First of all we can conclude that geography and cluster aspects seem to matter in establishing
a European H2FC technology innovation system. It is obvious that some regions are more
active in the formative phase of H2FC innovation systems.
Regions with the highest level of H2FC activities are found different places in Europe and in
many cases the clustering of activities in neighbouring regions matches the location of part-
nerships or corporative H2FC initiatives. In Southern Scandinavia the regions matches the
location of ‘The Scandinavian hydrogen highway partnership’ (SHHP). In the federal state
North-Rhine-Westphalia in Western Germany might benefit from the activities carried out
by ‘Fuel Cell and Hydrogen Network NRW’. In Northeast Spain it is the Aragon hydrogen
initiative initiated by the Spanish Ministry of Industry in 2002. Also in the case of Northern
Italy it reflects projects that have been carried out during the last decade. For example, In
24
Lombardy: the Zero Regio project in Mantova, the Bicocca Project in Milan, and the Arese
project in Arese; in Tuscany: the HBUS project in Florence and the Arezzo project.
These geographical patterns of H2FC activities indicate that some European regions are
building up critical-mass within H2FC.
Second, the relationship between early adopting H2FC regions and existing hydrogen pro-
duction capacities as well as pipeline infrastructure is weak. Small projects can indeed be
done with on-site hydrogen production and do not require existing production or pipeline
infrastructure. The latter should therefore not be seen as preconditions for the engagement
with H2FC. However, the existence of production capacities and infrastructure is without a
doubt a positive factor for the implementation of large scale projects and the development of
H2FC clusters.
Third, it can be concluded, that regions which are very active in pursuing H2FC deployment
typically also are generally innovative regions. This finding is consistent with endogenous
growth theories and thus confirms the hypothesis that innovative regions can more easily
engage with and advance in H2FC technologies. Less innovative regions may therefore need
specific support schemes to help them engage with H2FC. However, such support should be
subject to the condition that the less innovative region in question disposes of some other
success factors (e.g. hydrogen production infrastructure) which promise to make the invest-
ment a rewarding one. In any case it is important to be aware of the extent of the hydrogen
chain and that efforts are needed at all steps. It is yet too early to tell where the breakthrough
will happen that can make hydrogen competitive with incumbent technologies. Less innova-
tive regions might be engaged in development paths which can lead to breakthroughs in
niche markets that can improve the overall state-of-the art of the technology. It is therefore
not recommendable to cut-off less innovative regions from funding sources.

25
Fourth, the most active regions in the field of H2FC are characterized by the location of in-
novative clusters which confirms the importance of an overall well-functioning innovation
system for the development of emerging technologies. Some of the industrial clusters located
in the highly active H2FC regions can furthermore be characterised as favourable for the de-
velopment of H2FC. This relation is particularly strong for clusters in chemical products,
power generation, production technology, oil and gas, automotive and aerospace, which re-
flects the early stage of H2FC market development. In fact, the investment in other H2FC
applications depends on the advances in hydrogen generation and fuel cell technology. The
relative importance of industries that provide end-use applications (such as transportation) is
likely to increase in a later stage of the technologies market development. The decision of
local authorities and/or the European level on whether to support a regional initiative should
therefore take the specific regional cluster structure and the general stage of market devel-
opment into account.
These findings might help to develop a comparative assessment scheme and support ensuing
policies across European regions. This article has only provided a preliminary insight into
the economic geography of H2FC development. Additional studies of the character of re-
gional innovation systems and how they can facilitate the H2FC development through inno-
vation and cluster policy is necessary in order to pave the way for a hydrogen economy. An-
other interesting issue this article has revealed is the benefits and synergies the clustering of
activities in neighbouring regions seem to have for the H2FC development. Also this rela-
tionship needs further study before qualified policy implications can be drawn.
9 Acknowledgement
This article is one of the results of the integrated project Roads2Hycom supported by the
European Commission’s sixth framework programme. The project was conducted by a con-
sortium of 29 partners from industry, research institutes and universities.

26
The authors would like especially to thank Sören Christian Trümper (PLANET GbR), Su-
sanne Shaw (JRC-IFE), Paola Mazzucchelli (JRC-IFE) and Raimund Bleischwitz and Niko-
las Bader (College of Europe) for valuable contributions and comments for this article.
10 References
Andersen, M. M.: Eco-Innovation Indicators. European Environment Agency, Copenhagen,
February 2006.
Anderson, T,; S. S. Serger, J. Sörvik and E. W. Hansson, The Cluster Policies Whitebook,
International Organisation for Knowledge Economy and Enterprise Development (IKED),
2004. http://www.iberpymeonline.org/Documentos/TheClusterPoliciesWhitebook.pdf
(See also www.iked.org).
Asheim, B., and Gertler, M.S., (2004), The Geography of Innovation: Regional Innovation
Systems, in Fagerberg, J., et al (2004), The Oxford Handbook of Innovation, Oxford Univer-
sity Press.
Bergek, A.; Marko Hekkert and Staffan Jacobsson (2007), Functions in innovation systems:
A framework for analysing energy system dynamics and identifying goals for system-
building activities by entrepreneurs and policy makers. RIDE/IMIT Working Paper No.
84426-008, www.chalmers.se/tme/EN/centers/ride
Breschi, S., and Malerba, F., (1997), “Sectoral Innovation Systems: Technological Regimes,
Schumpeterian Denamics, and Spatial Boundaries,” in Edquist, C., (ed.) (1997), Systems of
Innovation: Technologies, Institutions and Organizations, London: Pinter.
27
Carlson, B., and Stankiewicz, R., (1991), “On the nature, functions and composition of tech-
nological systems,” in Journal of Evolutionary Economics, 1, pp. 93-118, Berlin: Springer.
Cooke, P., (2001), “Regional Innovation Systems, Clusters, and the Knowledge Economy,”
in Industrial and Corporate Change, 10 (4), pp. 945-74.
Cooke, P. (2002) Knowledge Economies: Clusters, Learning and Cooperative Advantage,
Routledge, London
Godoe, H. and S. Nygaard (2006), Systems failure, innovation policy and patents: Fuel cells
and related hydrogen technology in Norway 1990-2002, Energy Policy 34 1697-1708
Hekkert, M.P., et al. (2006), “Functions of innovation systems: A new approach for analys-
ing technological change,” in Technological Forecasting & Social Change, Elsevier.
Jacobsson, S., and Bergek, A., et al. (2004), “Transforming the energy sector, the evolution
of technological systems in renewable energy technology,” in Industrial and Corporate
Change, vol. 13, no. 5, pp. 815-849
Lee, S. K.; G. Mogi; J. W. Kim, 2008, The competitiveness of Korean as a developer of hy-
drogen energy technology: The AHP approach, Energy Policy, 36, 1284-1291.
Lundvall, B.A., eds. (1992) National Systems of Innovation: Towards a Theory of Innova-
tion and Interactive Learning, Printer, London
28
Lundvall, B. A. and Borrás, (1999): The Globalising Learning Economy: Implications for
Innovation Policy, Luxembourg: Office for Official Publications of the European Communi-
ties
Malerba, F., (2002), “Sectoral systems of Innovation and Production,” in Research Policy
31, pp.247-64
Midttun, A.; Anne-Louise Koefoed (2005), Green Innovation in Nordic Energy Industry:
Systemic Contexts and Dynamic Trajectories. In Matthias Weber & Jens Hemmelskamp,
Towards Environmental Innovation Systems, Springer Verlag, 2005.
Perrin, J.; Robert Steinberger-Wilckens and Sören Christian Trümper (eds.), DELIVER-
ABLE 2.1 AND 2.1a “European Hydrogen Infrastructure Atlas” and “Industrial Excess Hy-
drogen Analysis”. PART III: Industrial distribution infrastructure, PLANET GbR, Olden-
burg, Germany, Document Number: R2H2007PU.1 3 July 2007.
http://www.ricardo.com/roads2hycom/pub_download.asp?PageIndex=1
Pieter Mans, Floortje Alkemade, Tessa van der Valk, Marko P. Hekkert (2008), Is cluster
policy useful for the energy sector? Assessing self-declared hydrogen clusters in the Nether-
lands, Energy Policy, Vol. 36, No 4, pp1375-1385
Porter M. (2000): "Locations, clusters, and company strategy", in Clark, G., Feldman, M.,
Gertler, M. (Eds), The Oxford Handbook of Economic Geography, Oxford University Press,
Oxford, pp.253-74.
Porter, M. (2003): The economic performance of regions, Regional Studies, pp. 549-478,
vol. 37, 6&7, 2003.
29
Seymour, E. H.; F. C. Borges , R. Fernandes, 2007, Indicators of European public research in
hydrogen and fuel cells – An input-output analysis, Int. J. of Hydrogen Energy, 43, 3212-
3222.
Shaw, S. and Paola Mazzucchelli (2007a), Results from call for community registration of
interest: Mapping analysis of potential hydrogen communities in Europe, Joint Research
Centre – Institute for Energy, Document Number: R2H3011PU.1, September 2007.
Shaw, S. and Paola Mazzucchelli (2007b), PROFILING OF HYDROGEN COMMUNITIES
IN EUROPE: A FRAMEWORK FOR SELF-EVALUATION & ADVICE ON SUCCESS
FACTORS, Joint Research Centre – Institute for Energy, Document Number:
R2H3010PU.2; December 2007
Steinberger-Wilckens, R.; Sören Christian Trümper (eds.) (2007a), Mapping of existing
European Hydrogen Demonstration Sites, PLANET GbR, Oldenburg, Germany, Document
Number: R2H2005PU.1, 19 April 2007
http://www.ricardo.com/roads2hycom/pub_download.asp?PageIndex=1
Steinberger-Wilckens, R.; Sören Christian Trümper (eds.) (2007b), DELIVERABLE 2.1
AND 2.1a “European Hydrogen Infrastructure Atlas” and “Industrial Excess Hydrogen
Analysis” Executive Summary of Part I, II, III; PLANET GbR, Oldenburg, Germany;
Document Number: R2H2004PU.1; 3 July 2007
http://www.ricardo.com/roads2hycom/pub_download.asp?PageIndex=1
Sölvell, Ö, Lindqvist, G., and Ketels, C. (2003): The Cluster Initiative Greenbook,

30
Tables (including captions)
(Note! Figures uploaded separately, figure captions added on the last page of this document)
Table 1: Distribution of H2FC activities in the 16 most active regions in Europe within H2FC. Listed according to NUTSII identification code.
NUTSII region
Demonstration Sites
Fuelling sta-tions
Registration of Interest
H2FC-SCORE
Code Name count point count point count point Total points DE11 Stuttgart 3 2 5 3 0 0 5 DE21 Oberbayern 1 1 5 3 1 1 5 DE30 Berlin 5 3 3 2 1 1 6 DE60 Hamburg 4 3 1 1 1 1 5 DEA1 Düsseldorf 3 2 1 1 2 2 5 DEA2 Köln 3 2 1 1 1 1 4 DK00 Danmark 17 4 9 4 3 3 11 ES30 Comunidad de Madrid 4 3 1 1 0 0 4 FR30 Nord - Pas-de-Calais 4 3 1 1 1 1 5 IS Iceland 5 3 1 1 1 1 5 ITC1 Piemonte 3 2 1 1 2 2 5 ITC4 Lombardia 2 2 3 2 1 1 5 ITE1 Toscana 1 1 4 3 2 2 6 NO04 Agder and Rogaland 2 2 3 2 1 1 5 SE0A Västsverige 3 2 0 0 2 2 4 UKL Wales 4 4 0 0 1 1 5
31
Table 2: Relationship between 16 high-activity H2FC regions and existing infrastructure
Total existing infrastructure and production capacity score
Count of high activity H2FC regions
High score on existing infrastructure (>3 points) 4 (25%) Medium score on existing infrastructure (2-3 points) 8 (50%) Low score on existing infrastructure (0-1 points) 4 (25%)
32
Table 3: Distribution of the 16 high activity H2FC regions over the 358 NUTSII regions’ score
in the European Regional Innovation Scoreboard
Score in the Regional Innovation Scoreboard
Number of high activity H2FC regions (top 16 in Table 1)
Highest third 10
Medium third 5
Bottom third 1

33
Table 4: Cluster Quotients
Cluster Category CQ Medical Devices 4,7 Publishing 4,4 Distribution service 4,3 Analytical Instruments 3,9 IT 3,9 Biopharmaceuticals 3,1 Power generation and transmission 3,1 Chemicals 3,1 Sporting 2,9 Production Tech. 2,9 Aerospace 2,9 Communications equipment 2,9 Forest products 2,8 Lighting 2,8 Plastics 2,7 Entertainment 2,4 Jewelry 2,4 Oil and Gas 2,4 Automotive 2,4 Business Services 2,1 Building Fixtures 2,0 Constr. Materials 2,0 Tobacco 1,9 Education 1,6 Leather 1,5 Heavy Machinery 1,4 Finance 1,4 Agricultural 1,4 Textiles 1,3 Transportation 1,3 Fishing 1,3 Hospitality 1,2 Metal manufact. 1,1 Footwear 0,9 Apparel 0,8 Furniture 0,7 Food 0,7 Construction 0,7
34
Table 5: Cluster categories with interest to H2FC development
Cluster categories Industry examples Examples from European H2 and Fuel Cell Technology Plat-form’s NEW-IG members
Oil & Gas Products and Serv-ices
refineries Statoil Hydro ASA, Gaz de France, Shell Hydrogen BV, Total France, Intelligent Energy, ILT Technology
Automotive motor vehicles and components
Daimler, Adam Opel GmbH, Volkswagen, Cento Ricerche Fiat, AVL List GmbH, Volvo, Rolls Royce Fuel cell system, RiverSimple LLP, Intelligent En-ergy,
Power Generation and Transmission
generators Siemens, E.ON Sweden AB, EWE AG, GAMESA Corpora-cion Tecnologica, Intelligent Energy, Ceres Power Ltd.
Heavy Machinery tractors, locomotives Wärtsilä Finland, Gruppo Sapio, Ansaldo Fuel Cells, Nucellsys
Chemical Products chemicals, industrial gases
Linde Gas, BASF Fuel Cells GmbH, ILT Technology, BP In-ternational
Production Technology tanks Topsoe Fuel Cells, Nucellsys, Transportation and Logistics freight, air transport Rail Safety and Standard
Boards Aerospace APU on aircraft Intelligent Energy, EADS
Deutschland Communications Equipment portable applications,
mobile, computers

35
FIGURE captions:
.
Figure 1: Map showing combined H2FC activity level at NUTS2 level.
Figure 2: Left: Total H2 Production Sites in Europe, Right: H2 Pipeline in Europe