innovations to solutions
TRANSCRIPT
May 2011
www.broadlandstraining.com
Innovations to Solutions (ILM 8600-223)
2012

Innovations to Solutions Workbook_v3_221112 Page 2 of 43
Created by Broadlands Approved by: John McGuire Broadlands - November 2012©
© 2012 Broadlands Consulting Ltd Registered Office: New Media House, Upper St John Street, Lichfield, Staffordshire, WS14 9DU, United Kingdom All rights reserved No part of this publication may be reproduced, stored in a retrieval system, or transmitted in any form, or by any means, electronic, electrostatic, mechanical, photocopied or otherwise, without the express permission in writing from a Director of Broadlands Consulting Ltd.

Innovations to Solutions Workbook_v3_221112 Page 3 of 43
Created by Broadlands Approved by: John McGuire Broadlands - November 2012©
CONTENTS
Learning Outcomes: ............................................................................................. 4
1. What is the relationship between creativity and innovation? .............................. 5
1.1 Encouraging Creativity ............................................................................ 5
1.2 The Innovation Health Audit .................................................................... 6
2. The Problem Solving / Decision Making Cycle ................................................... 9
3. Defining and Screening the Problem .............................................................. 10
3.1 Defining the Problem............................................................................. 10
3.1.1 Monitoring the Performance Dashboard ............................................. 10
3.2 Data Gathering - Screening the Problem and Getting the Facts First ......... 14
3.2.1 The Fishbone Diagram ..................................................................... 15
3.2.2 Mind-Mapping .................................................................................. 18
3.2.3 Comparison of the Fishbone to the Mind Map .................................... 20
3.2.4 The 5 Whys Method ......................................................................... 21
4. Generating Solutions – Paradigm Shifts ......................................................... 22
4.1 Developing the Mindset ......................................................................... 25
4.2 A Process for Generating Options ........................................................... 26
4.3 Brainstorming – a Creativity and Innovation Tool .................................... 26
4.4 Other Creativity and Innovation Tools .................................................... 29
4.5 Screening Solutions - Evaluation Tools and Techniques ........................... 31
4.5.1 The Decision Matrix .......................................................................... 31
4.5.2 The Six Thinking Hats ...................................................................... 33
4.5.3 The Criteria Matrix ........................................................................... 36
4.5.4 Decision Trees ................................................................................. 37
5. Implementation ........................................................................................... 39
5.1 Communicating the Decision .................................................................. 39
5.2 Force Field Analysis ............................................................................... 40
5.3 Implementation Plan ............................................................................. 41
6. Review and Evaluation ................................................................................. 41
6.1 Lessons Learned ................................................................................... 41
6.2 Monitoring Processes ............................................................................ 42
6.3 Evaluation ............................................................................................ 42
6.4 Looking Back ........................................................................................ 42
Innovations to Solutions Workbook_v3_221112 Page 4 of 43
Created by Broadlands Approved by: John McGuire Broadlands - November 2012©
Learning Outcomes:
At the end of the training, delegates should be able to know, demonstrate, and apply the
following learning outcomes:
� Apply the tools of problem solving and decision making in a structured and
systematic manner
� Seek innovative solutions through a critical analysis of the situation: current and
future
� Take ownership to implement solutions within the organization
Innovations to Solutions Workbook_v3_221112 Page 5 of 43
Created by Broadlands Approved by: John McGuire Broadlands - November 2012©
1. What is the relationship between creativity and innovation?
There are lots of different definitions; a good place to start is to think about the differences
between the two. Dr William Coyne (a former senior vice president for R&D of the 3M
Corporation) said creativity is "the thinking of novel and appropriate ideas" whereas
innovation is "the successful implementation of those ideas within an organisation".
Speaking at the 6th UK Innovation Lecture at the Queen Elizabeth II Conference Centre (5 March
1996)
Another way of thinking about it is that creativity is the new or original idea, but innovation
is the process by which that idea is turned into practice.
So what is more important for the organisation - to be able to develop creative ideas, or to
be innovative and turn creative ideas into practice? In reality they are both critical, but
unfortunately we can all think of many organisations where the people are creative but the
organisation lacks the willingness to turn these ideas into real products or services, or to
change their processes.
The Centre for Exploitation of Science and Technology (CEST) define the ‘innovation gap’ as
the gap between vision and reality, between generating the creative idea in the first place
and the subsequent analysis to identify the potential of the new idea or process and its
implementation. In other words, the biggest problem facing companies is not coming up
with creative ideas, but the innovation that puts them into practice.
Bridging the Innovation Gap (1995)
1.1 Encouraging Creativity
"If at first, the idea is not absurd, there is no hope for it."
Albert Einstein
Everyone is capable of being creative and thinking up novel and new ideas. Unfortunately,
most of us lack the confidence to think such ideas, particularly in our workplace.
Part of our conditioning is to spend a lot of our time thinking and acting in a conventional
way; following the rules and procedures - the way that things have always been done.
There is also quite a lot of history which shows us that there are plenty of ‘brakes’ on
innovation and creativity:
Innovations to Solutions Workbook_v3_221112 Page 6 of 43
Created by Broadlands Approved by: John McGuire Broadlands - November 2012©
"This telephone has too many shortcomings to be seriously considered as a means of
communication. The device is inherently of no value to us."
Western Union internal memorandum: 1876
"Who… wants to hear actors talk?"
H M Warner, Warner Brothers: 1927
"We don't like their sound, and guitar music is on the way out."
Decca Recording Company Executive rejecting the Beatles: 1962
"There is no reason anyone would want a computer in their home."
Ken Olsen, President, Chairman and founder of Digital Equipment Corporation: 1977
As a supervisor or manager, if you are keen to help people think up novel and appropriate
ideas, you will need to create the right environment. Creativity is not something that can be
turned on or off as and when required, it is a way of thinking which exists as a result of a
long-term exposure to an encouraging climate of creativity. The following ‘Innovation Health
Audit’ is designed to evaluate the climate for innovation in your organisation.
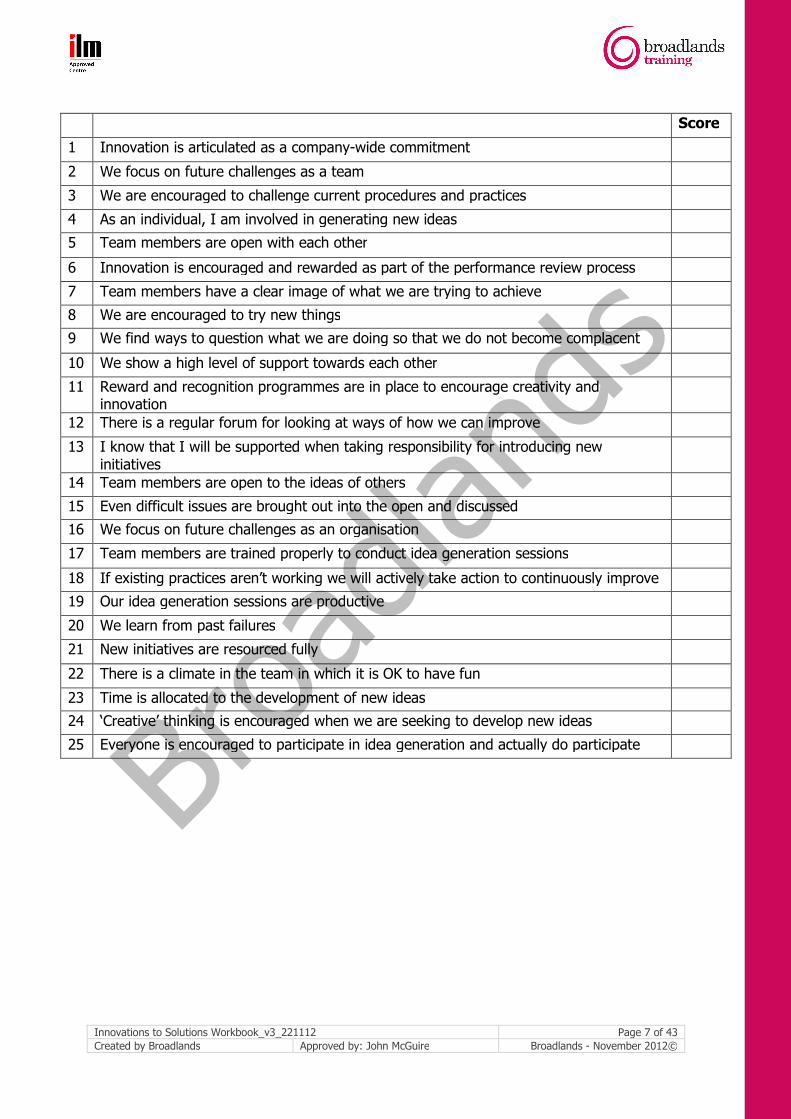
1.2 The Innovation Health Audit
In order to diagnose the ‘health’ of innovation within your organisation/team, perform the
following ‘innovation health audit’. If you can involve team members, so much the better. If
not, complete it yourself. The objective is to raise awareness of the state of health of
innovation and to take subsequent positive action.
Look at each statement and give a score according to the scale below. Record your score
next to the statement in the place provided.
If the team is completing the audit, each team member should have his/her own copy of the
audit and should complete it individually and without conferring. Final results should then be
compared and discussed, and a consensus score entered for each question.
Scoring: This is always true 5 points
This is often true 3 points
This is true about 50% of the time 2 points
This is largely untrue 1 point
This is totally untrue 0 points
Innovations to Solutions Workbook_v3_221112 Page 7 of 43
Created by Broadlands Approved by: John McGuire Broadlands - November 2012©
Score
1 Innovation is articulated as a company-wide commitment
2 We focus on future challenges as a team
3 We are encouraged to challenge current procedures and practices
4 As an individual, I am involved in generating new ideas
5 Team members are open with each other
6 Innovation is encouraged and rewarded as part of the performance review process
7 Team members have a clear image of what we are trying to achieve
8 We are encouraged to try new things
9 We find ways to question what we are doing so that we do not become complacent
10 We show a high level of support towards each other
11 Reward and recognition programmes are in place to encourage creativity and innovation
12 There is a regular forum for looking at ways of how we can improve
13 I know that I will be supported when taking responsibility for introducing new initiatives
14 Team members are open to the ideas of others
15 Even difficult issues are brought out into the open and discussed
16 We focus on future challenges as an organisation
17 Team members are trained properly to conduct idea generation sessions
18 If existing practices aren’t working we will actively take action to continuously improve
19 Our idea generation sessions are productive
20 We learn from past failures
21 New initiatives are resourced fully
22 There is a climate in the team in which it is OK to have fun
23 Time is allocated to the development of new ideas
24 ‘Creative’ thinking is encouraged when we are seeking to develop new ideas
25 Everyone is encouraged to participate in idea generation and actually do participate

Innovations to Solutions Workbook_v3_221112 Page 8 of 43
Created by Broadlands Approved by: John McGuire Broadlands - November 2012©
Copy your scores from the questionnaire onto the score grid below. Add the scores in each
vertical column and enter the figures in the total boxes.
1. 2. 3. 4. 5.
6. 7. 8. 9. 10.
11. 12. 13. 14. 15.
16. 17. 18. 19. 20.
21. 22. 23. 24. 25.
Totals A. B. C. D. E.
Transfer the totals above on to the next page by putting a cross on each row, A to E, which
reflects the scores above.
0 5 10 15 20 25
A
Low Organisational Commitment to Innovation
High Organisational Commitment to Innovation
B
Inappropriate Team Climate for Innovation
Highly Appropriate Team Climate for Innovation
C
Low Tolerance to Risk Taking
Strong Tolerance of Risk Taking
D
Uninvolved Team Members in Idea Generation
Fully Involved Team Members in Idea Generation
E
Closed Thinking Open Thinking
Connect up the crosses to provide a profile of the health of innovation within your
organisation/team
Quest
ion N
os.

Innovations to Solutions Workbook_v3_221112 Page 9 of 43
Created by Broadlands Approved by: John McGuire Broadlands - November 2012©
2. The Problem Solving / Decision Making Cycle
We’re going to explore this discipline using a structured approach. It’s a simple,
straightforward and logical structure comprising the following steps:
1. Defining and the problem
2. Screening the problems
3. Generating potential solutions
4. Deciding which solutions to implement
5. Implementation
6. Review and Evaluation
Whilst the terminology is slightly different, the problem solving cycle below mirrors,
graphically, the steps presented above.
� First, we need to monitor ‘what’s going on’ and identify any problems
� Second, having identified that a problem exists, we need to find out what we
know about the problem by gathering relevant data
� Third, once the relevant data has been gathered, we must analyse the data and
identify the root causes

Innovations to Solutions Workbook_v3_221112 Page 10 of 43
Created by Broadlands Approved by: John McGuire Broadlands - November 2012©
� Fourth, having identified the root causes, we must generate a range of solutions
to the problem by asking the question ‘what could we do?’
� Fifth, we should select the optimal solution or solutions by asking the question:
‘what’s the best thing to do?’
� Sixth, having selecting the optimal solution or solutions, we need to plan for its
implementation – i.e. ‘how do we go about it?’
� Seventh, having implemented the solution, we must monitor its implementation
and analyse whether it has provided a long term solution to the problem
� Finally, we need to review and evaluate our activities in order to continuously
improve.
3. Defining and Screening the Problem
3.1 Defining the Problem
3.1.1 Monitoring the Performance Dashboard
A first key stage of the process is ‘defining the problem’. Imagine that you are driving a car.
Not only are you having to monitor external information in order to get from point A to point
B safely, you also need to monitor internal information such as: fuel levels, the oil level
warning light, engine temperature, speed and so on. Without monitoring these sources of
information, we may fail to get to our destination.
We can use this analogy for running a business operation. In the same way that your car
provides you with valuable information on the dials facing you on the dashboard, as
managers we also need to monitor the operation’s ‘performance dashboard’. But what issues
would you need to monitor? Pause and think about this for a moment –fill in your
performance dashboard and then compare it to ours on the following page.
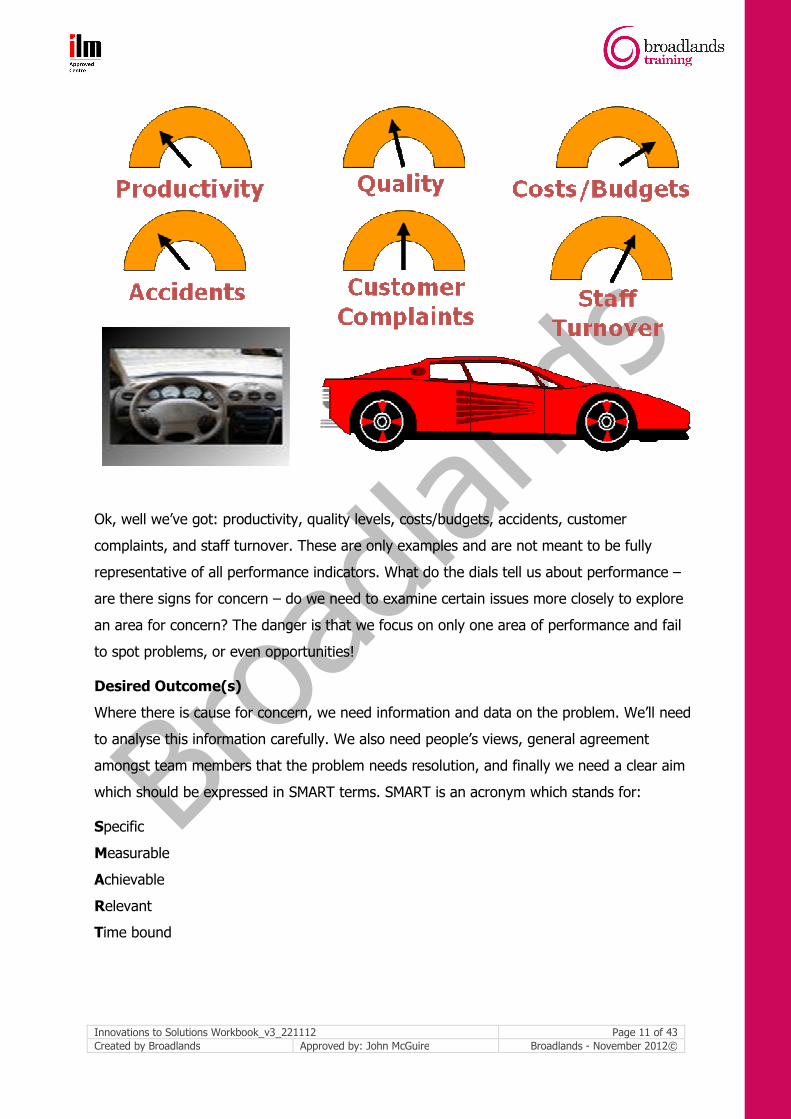
The Performance Dashboard
Innovations to Solutions Workbook_v3_221112 Page 11 of 43
Created by Broadlands Approved by: John McGuire Broadlands - November 2012©
Ok, well we’ve got: productivity, quality levels, costs/budgets, accidents, customer
complaints, and staff turnover. These are only examples and are not meant to be fully
representative of all performance indicators. What do the dials tell us about performance –
are there signs for concern – do we need to examine certain issues more closely to explore
an area for concern? The danger is that we focus on only one area of performance and fail
to spot problems, or even opportunities!
Desired Outcome(s)
Where there is cause for concern, we need information and data on the problem. We’ll need
to analyse this information carefully. We also need people’s views, general agreement
amongst team members that the problem needs resolution, and finally we need a clear aim
which should be expressed in SMART terms. SMART is an acronym which stands for:
Specific
Measurable
Achievable
Relevant
Time bound

Innovations to Solutions Workbook_v3_221112 Page 12 of 43
Created by Broadlands Approved by: John McGuire Broadlands - November 2012©
Would you consider the following aim to be a SMART aim in response to a rise in customer
complaints?
SMART AIM: To reduce customer complaints.
Quite simply, you need to ask the following questions?
� Is it specific?
� Is it measurable?
� Is it time bound?
When writing SMART aims/objectives, you certainly need to assess whether or not it is
achievable and relevant, however, this does not form part of the written objective; it should
be implicit that these points have been considered. It is crucial that the objective is: specific,
measurable, and time bound.
When writing a SMART objective, you should consider the following:
Structure of an Objective Example
Must start with a verb of movement or attainment, e.g. to reduce, increase, improve, eliminate, deliver
To reduce the number of
Identify the condition to be addressed, e.g. wastage, sales, costs, meetings, response times, quality
customer complaints in the front line customer service team
State the measure in terms of the quantity/standard, e.g. from 5 units to 10 units, by 50% from £50K to £100K
from the present 10 cases per month to a maximum of 2 cases per month
Ensure it is time bound by 30th June 20XX
For example,’ to reduce customer complaints to 10% of their current level by 30 June 20—‘.
Importantly, this objective is specific, measurable and time bound. Once we have progressed
through the process, we can review this objective to see whether or not we have achieved
an effective solution to the problem.

Innovations to Solutions Workbook_v3_221112 Page 13 of 43
Created by Broadlands Approved by: John McGuire Broadlands - November 2012©
Perceiving the Problem
Below is a picture of a ship approaching an iceberg … surrounded by fish. Ok, it’s not to
scale! Consider the messages presented in the picture and answer the questions in the
following page.
So how can this image act as an analogy for how we approach a problem?
1. Who’s in the ship? 2. What does the person in the ship see? 3. What does the iceberg represent? 4. Who are the fish? 5. What do the fish see?

Innovations to Solutions Workbook_v3_221112 Page 14 of 43
Created by Broadlands Approved by: John McGuire Broadlands - November 2012©
3.2 Data Gathering - Screening the Problem and Getting the Facts First
Having identified that a problem exists and that it needs resolution, the next step is to
screen the problem in order to get to the root cause. The danger is that we only skim the
surface of the problem without looking at all the potential causes and worse still, start trying
to generate solutions before this crucial stage of the process has been completed.
The screening tools which are going to be presented to you in this section are as follows:
� the fishbone method
� mind-mapping
� the 5 whys method
These are just a selection of some of the problem screening tools available to you. You may
like some tools and not others – it’s what works for you. And don’t forget, you can always
adapt them and make them yours.
Before we proceed, have a look at the following image entitled: ‘So How Do you Eat an
Elephant?’
So How Do You Eat an Elephant?
What’s its relevance to our discussion here? Well … without wishing to upset anyone –
you’ve got to cut it down into small manageable chunks, otherwise the task may seem
completely insurmountable and you may just give up straight away. The following tools and
techniques are designed to help you to breakdown the problem.
Equally, you need to focus on the end goal. If you focus on all the potential obstacles in your
way then, again, you will find it very difficult to proceed and you may decide not to start the

Innovations to Solutions Workbook_v3_221112 Page 15 of 43
Created by Broadlands Approved by: John McGuire Broadlands - November 2012©
journey at all. The trick is to imagine yourself standing on the top of a hill overlooking a
valley with its many obstacles below but with the view of the goal on the other side of the
valley. Keep focusing on the image on the following page – it helps!
3.2.1 The Fishbone Diagram
The vast majority of problems occur over and over again because the root cause of the
problem is not established or eradicated. For complex errors or problems that have cropped
up repeatedly, the fishbone (or cause and effect) diagram may help you to get to the root
cause of the problem. It is also known as the Ishikawa diagram after the Japanese
academic, Kauro Ishakawa, who used the technique in the Japanese steel industry.
The Fishbone Diagram is a technique that is best conducted with the team in order to get
several different perspectives on the problem. The key steps are as follows:
1. Using as large a whiteboard or piece of paper as you can get your hands on, draw
a fish skeleton right across the page like the one below.
2. Write your problem or error in the fish head (as specifically as possible – this helps
to keep people focused on the specific problem).
3. Label the main bones with the key factors that you see as contributing to the
problem. Alternatively, use the standard ‘PEM/PEM‘ prompts as shown or the 3MP
prompts: these are: people, materials, methods, machinery.

Innovations to Solutions Workbook_v3_221112 Page 16 of 43
Created by Broadlands Approved by: John McGuire Broadlands - November 2012©
People Environment Methods
Plant Equipment Materials
4. Generate ideas on the causes of the problem and write each one up on a smaller
bone feeding into the appropriate main arterial bone. (It may be easiest to write
them onto ‘post-it’ notes first so that you can move them around and alter the
order)
5. Pursue each cause to the limit – keep asking why?
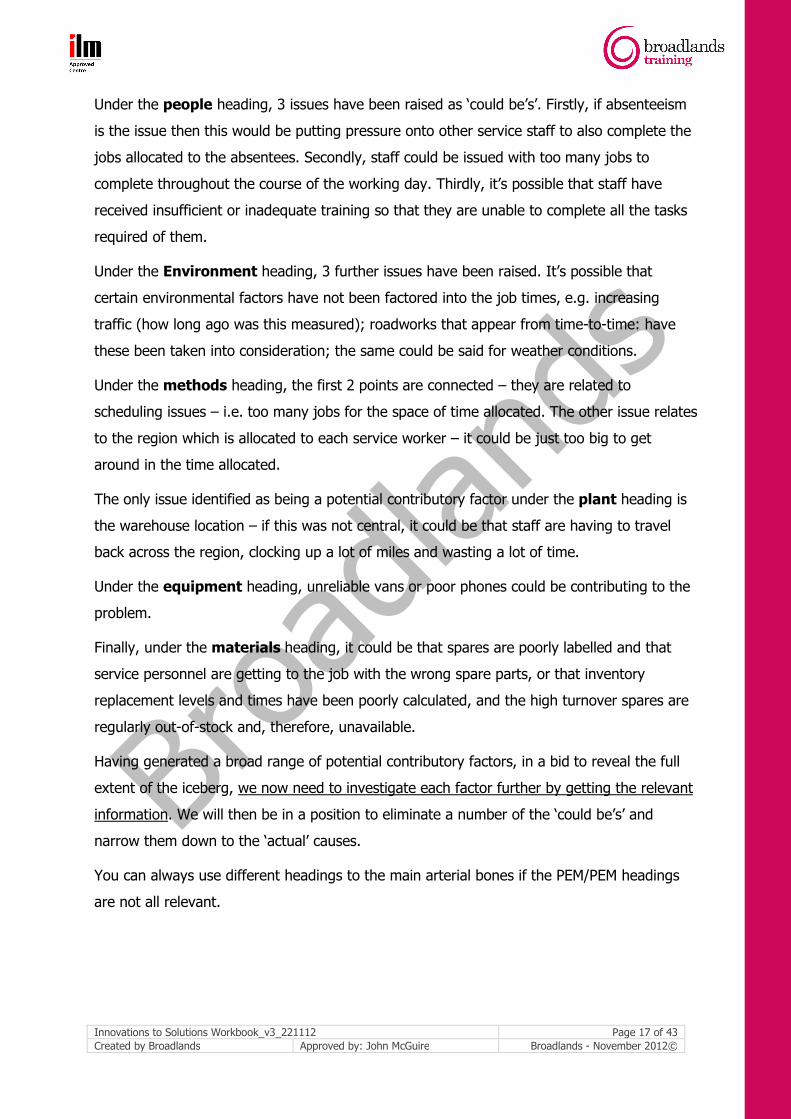
Here’s a completed example and it’s based upon a problem which we can all relate to as
customers. You know ... you’re waiting at home for someone to come at the designated time
and fix your boiler, but they turn up late!!! The problem, which is written in specific terms, is
that ‘20% of service calls are more than one hour late’.
20% of service
calls are more
than one hour
late
People
absenteeism
overloaded staff
untrained staff
Plant
warehouse location
Environment
traffic
roadworks
weather
Equipment
unreliable vans
poor phones
Methodspoor scheduling
over-ambitious rotas
region too big
poor spares labelling
unavailable spares
Materials
Problem
Innovations to Solutions Workbook_v3_221112 Page 17 of 43
Created by Broadlands Approved by: John McGuire Broadlands - November 2012©
Under the people heading, 3 issues have been raised as ‘could be’s’. Firstly, if absenteeism
is the issue then this would be putting pressure onto other service staff to also complete the
jobs allocated to the absentees. Secondly, staff could be issued with too many jobs to
complete throughout the course of the working day. Thirdly, it’s possible that staff have
received insufficient or inadequate training so that they are unable to complete all the tasks
required of them.
Under the Environment heading, 3 further issues have been raised. It’s possible that
certain environmental factors have not been factored into the job times, e.g. increasing
traffic (how long ago was this measured); roadworks that appear from time-to-time: have
these been taken into consideration; the same could be said for weather conditions.
Under the methods heading, the first 2 points are connected – they are related to
scheduling issues – i.e. too many jobs for the space of time allocated. The other issue relates
to the region which is allocated to each service worker – it could be just too big to get
around in the time allocated.
The only issue identified as being a potential contributory factor under the plant heading is
the warehouse location – if this was not central, it could be that staff are having to travel
back across the region, clocking up a lot of miles and wasting a lot of time.
Under the equipment heading, unreliable vans or poor phones could be contributing to the
problem.
Finally, under the materials heading, it could be that spares are poorly labelled and that
service personnel are getting to the job with the wrong spare parts, or that inventory
replacement levels and times have been poorly calculated, and the high turnover spares are
regularly out-of-stock and, therefore, unavailable.
Having generated a broad range of potential contributory factors, in a bid to reveal the full
extent of the iceberg, we now need to investigate each factor further by getting the relevant
information. We will then be in a position to eliminate a number of the ‘could be’s’ and
narrow them down to the ‘actual’ causes.
You can always use different headings to the main arterial bones if the PEM/PEM headings
are not all relevant.
Innovations to Solutions Workbook_v3_221112 Page 18 of 43
Created by Broadlands Approved by: John McGuire Broadlands - November 2012©
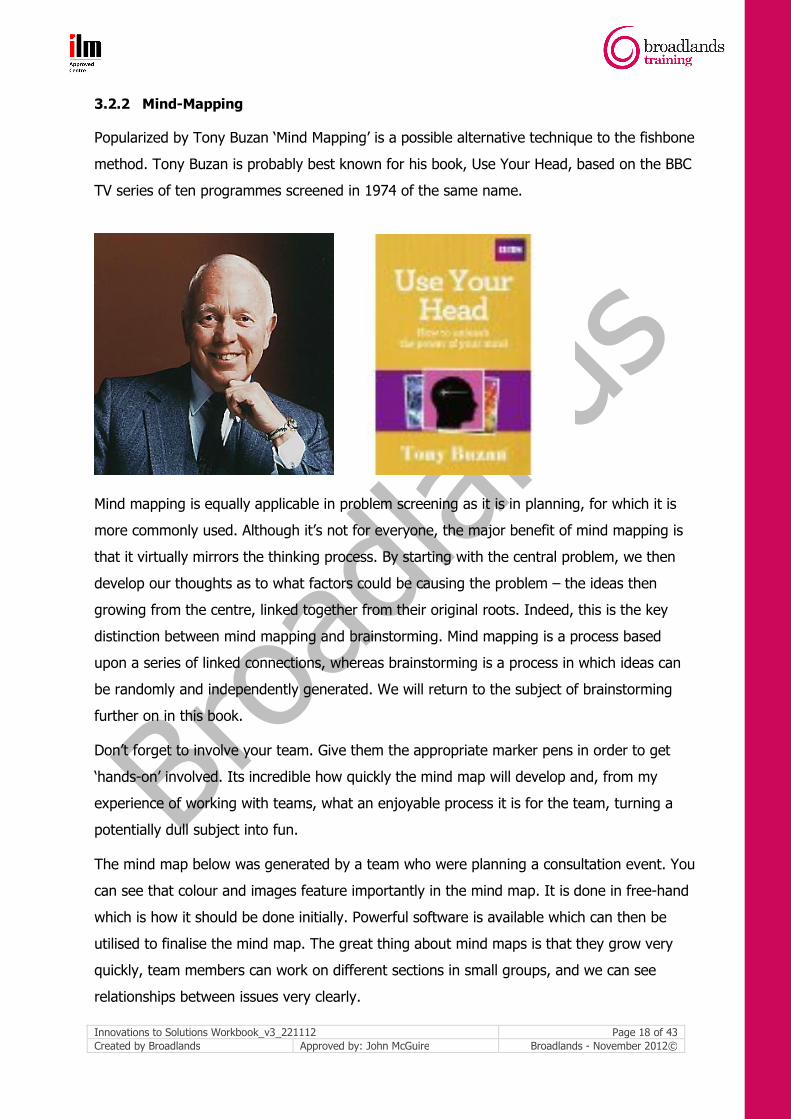
3.2.2 Mind-Mapping
Popularized by Tony Buzan ‘Mind Mapping’ is a possible alternative technique to the fishbone
method. Tony Buzan is probably best known for his book, Use Your Head, based on the BBC
TV series of ten programmes screened in 1974 of the same name.
Mind mapping is equally applicable in problem screening as it is in planning, for which it is
more commonly used. Although it’s not for everyone, the major benefit of mind mapping is
that it virtually mirrors the thinking process. By starting with the central problem, we then
develop our thoughts as to what factors could be causing the problem – the ideas then
growing from the centre, linked together from their original roots. Indeed, this is the key
distinction between mind mapping and brainstorming. Mind mapping is a process based
upon a series of linked connections, whereas brainstorming is a process in which ideas can
be randomly and independently generated. We will return to the subject of brainstorming
further on in this book.
Don’t forget to involve your team. Give them the appropriate marker pens in order to get
‘hands-on’ involved. Its incredible how quickly the mind map will develop and, from my
experience of working with teams, what an enjoyable process it is for the team, turning a
potentially dull subject into fun.
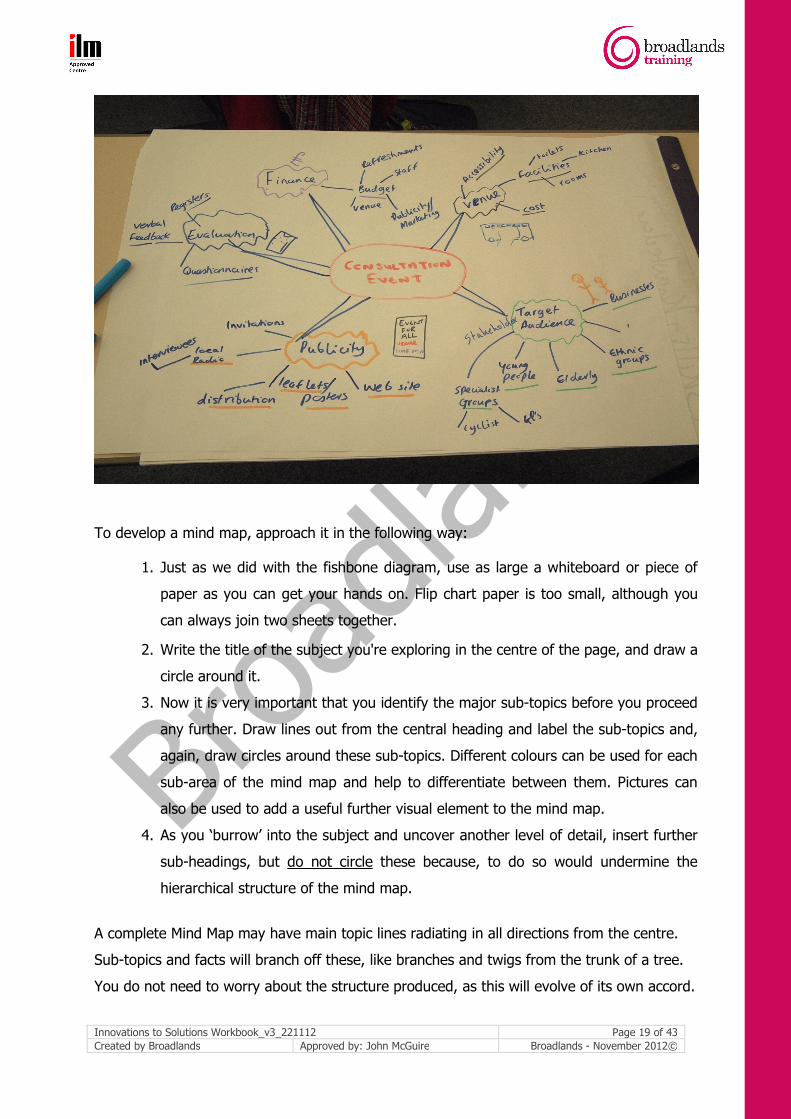
The mind map below was generated by a team who were planning a consultation event. You
can see that colour and images feature importantly in the mind map. It is done in free-hand
which is how it should be done initially. Powerful software is available which can then be
utilised to finalise the mind map. The great thing about mind maps is that they grow very
quickly, team members can work on different sections in small groups, and we can see
relationships between issues very clearly.
Innovations to Solutions Workbook_v3_221112 Page 19 of 43
Created by Broadlands Approved by: John McGuire Broadlands - November 2012©
To develop a mind map, approach it in the following way:
1. Just as we did with the fishbone diagram, use as large a whiteboard or piece of
paper as you can get your hands on. Flip chart paper is too small, although you
can always join two sheets together.
2. Write the title of the subject you're exploring in the centre of the page, and draw a
circle around it.
3. Now it is very important that you identify the major sub-topics before you proceed
any further. Draw lines out from the central heading and label the sub-topics and,
again, draw circles around these sub-topics. Different colours can be used for each
sub-area of the mind map and help to differentiate between them. Pictures can
also be used to add a useful further visual element to the mind map.
4. As you ‘burrow’ into the subject and uncover another level of detail, insert further
sub-headings, but do not circle these because, to do so would undermine the
hierarchical structure of the mind map.
A complete Mind Map may have main topic lines radiating in all directions from the centre.
Sub-topics and facts will branch off these, like branches and twigs from the trunk of a tree.
You do not need to worry about the structure produced, as this will evolve of its own accord.

Innovations to Solutions Workbook_v3_221112 Page 20 of 43
Created by Broadlands Approved by: John McGuire Broadlands - November 2012©
Just as with the fishbone diagram, having now generated a broad range of potential
contributory factors, in a bid to reveal the full extent of the iceberg, we now need to
investigate each factor further by getting the relevant information. We will then be in a
position to eliminate a number of the ‘could be’s’ and narrow them down to the ‘actual’
causes.
Screening Problems
Fishbone Diagram
Vs
Mind Map
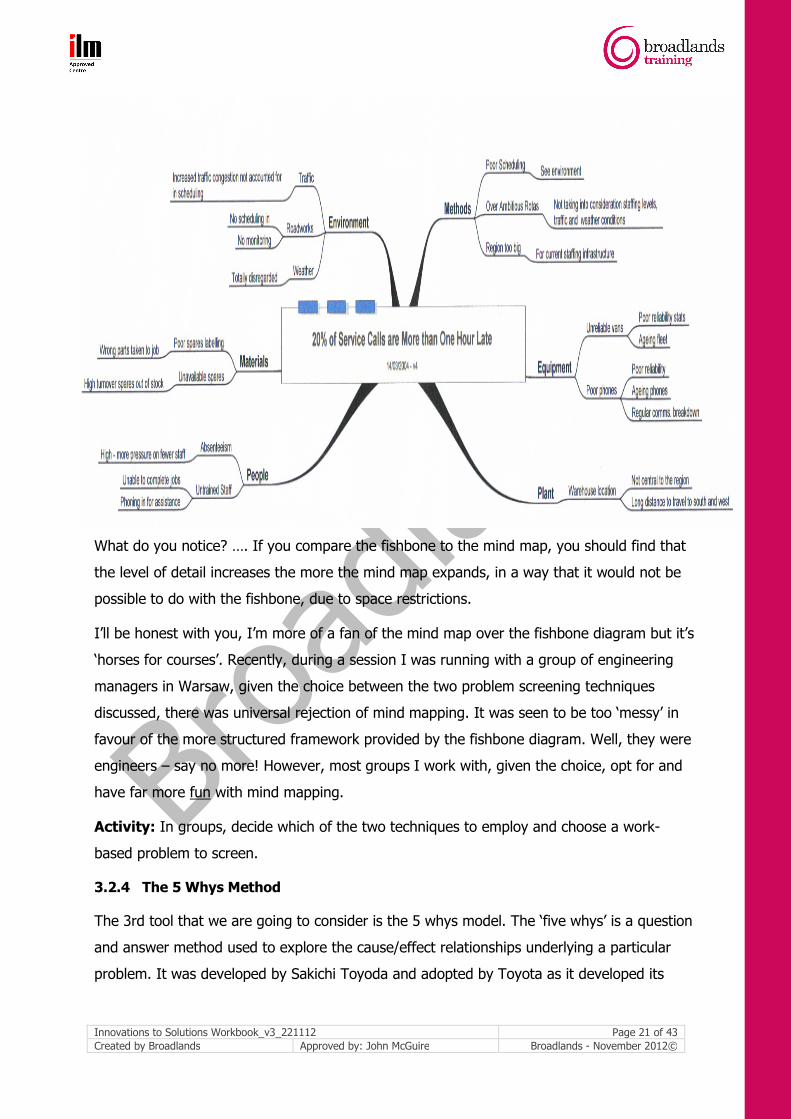
3.2.3 Comparison of the Fishbone to the Mind Map
To compare the fishbone diagram to the mind map, as problem screening techniques, the
problem presented on the original fishbone diagram (on service calls being late) is now
produced in mind map form.
Innovations to Solutions Workbook_v3_221112 Page 21 of 43
Created by Broadlands Approved by: John McGuire Broadlands - November 2012©
What do you notice? …. If you compare the fishbone to the mind map, you should find that
the level of detail increases the more the mind map expands, in a way that it would not be
possible to do with the fishbone, due to space restrictions.
I’ll be honest with you, I’m more of a fan of the mind map over the fishbone diagram but it’s
‘horses for courses’. Recently, during a session I was running with a group of engineering
managers in Warsaw, given the choice between the two problem screening techniques
discussed, there was universal rejection of mind mapping. It was seen to be too ‘messy’ in
favour of the more structured framework provided by the fishbone diagram. Well, they were
engineers – say no more! However, most groups I work with, given the choice, opt for and
have far more fun with mind mapping.
Activity: In groups, decide which of the two techniques to employ and choose a work-
based problem to screen.
3.2.4 The 5 Whys Method
The 3rd tool that we are going to consider is the 5 whys model. The ‘five whys’ is a question
and answer method used to explore the cause/effect relationships underlying a particular
problem. It was developed by Sakichi Toyoda and adopted by Toyota as it developed its

Innovations to Solutions Workbook_v3_221112 Page 22 of 43
Created by Broadlands Approved by: John McGuire Broadlands - November 2012©
manufacturing processes. Some if the manufacturing companies I have worked with have
integrated it into their standard, prescribed problem screening process.
Ultimately, the goal of the method is to drill down to the root cause of a problem or defect
by repeatedly questioning ‘why’. Whilst it’s called the 5 Whys method, you may find that you
reveal the root cause before you have get to the fifth why. I have to say that from my own
experience, rather than continuing to ask the question ‘why’, which is rather like a child
quizzing his/her mum or dad (and you know what the outcome often is when that happens),
it is preferable to make it more of a conversation, e.g. why do you think …?
The following is an example of the 5 whys method.
Level of Problem Consequent Improvement
Puddle of oil – why? Clean up oil
Machine leaking – why?
Gasket deteriorating – why? Replace gasket
Bought cheaper gaskets – why? Buy better quality gaskets
Good deal – why?
Buyers are evaluated on cost savings Change policy
As you can see above, by continuing to drill down to the root cause of the problem through
questioning, we have moved from initially identifying the problem being that a machine is
leaking oil, through to the real cause of the problem, which is that buyers are evaluated on
cost savings, hence they are buying inferior gaskets.
Activity: Working in pairs, each of you identify a work-based problem and take it in turns to
employ the 5 whys method in order to get to the root cause of the problem.
4. Generating Solutions – Paradigm Shifts
Having screened the problem comprehensively, gathered the facts, and identified the root
causes of the problem, we can now proceed onto the 4th stage of the process: ‘generating

Innovations to Solutions Workbook_v3_221112 Page 23 of 43
Created by Broadlands Approved by: John McGuire Broadlands - November 2012©
potential solutions’. Before we look at the range of tools and techniques available to you in
this stage, let us first consider the role that creativity can play in this process.
The thinking mechanism of the human brain can be described as consisting of two parts:
one part for uninhibited creative thinking and the other for analytical or judicial thinking.
Over the years, the term ‘green-light thinking’ has been applied to the thought process
most conducive to the generation of creative ideas. In this instance, the quantity, not the
quality, of ideas is emphasised. It is normally associated with right-brain thinking and it is
that side of the brain given to daydreaming, imagination, rhythm, and colour.
The judicial side of the brain, normally associated with left-brain thinking, analyses and
evaluates ideas emanating from the creative, uninhibited side. Here, the focus is on the
quality of ideas. The term ‘red light thinking’ is often used to describe this process. It is
that side of the brain given to logic and analysis.
GreenLight
Thinking
RedLight
Thinking
Daydreaming
Imagination
Logic
Analysis
Because most of our educational processes and systems have been devoted to developing
the judicial thinking function, most people have far more creative ability than they
realise. In fact, our potential in this area is always present and can be developed to a much
greater extent quite easily with the proper coaching. Interestingly, children are far more pre-
disposed to green light thinking owing to their reduced exposure to right brain focused
thinking. As Albert Einstein said: ‘Imagination is more important than knowledge’.
To illustrate this point, attempt the following activity - draw a square.

Innovations to Solutions Workbook_v3_221112 Page 24 of 43
Created by Broadlands Approved by: John McGuire Broadlands - November 2012©
Are the following squares? Does the first one look like the one you drew – is it positioned
parallel to the page?
Activity: draw a square
Are these squares?
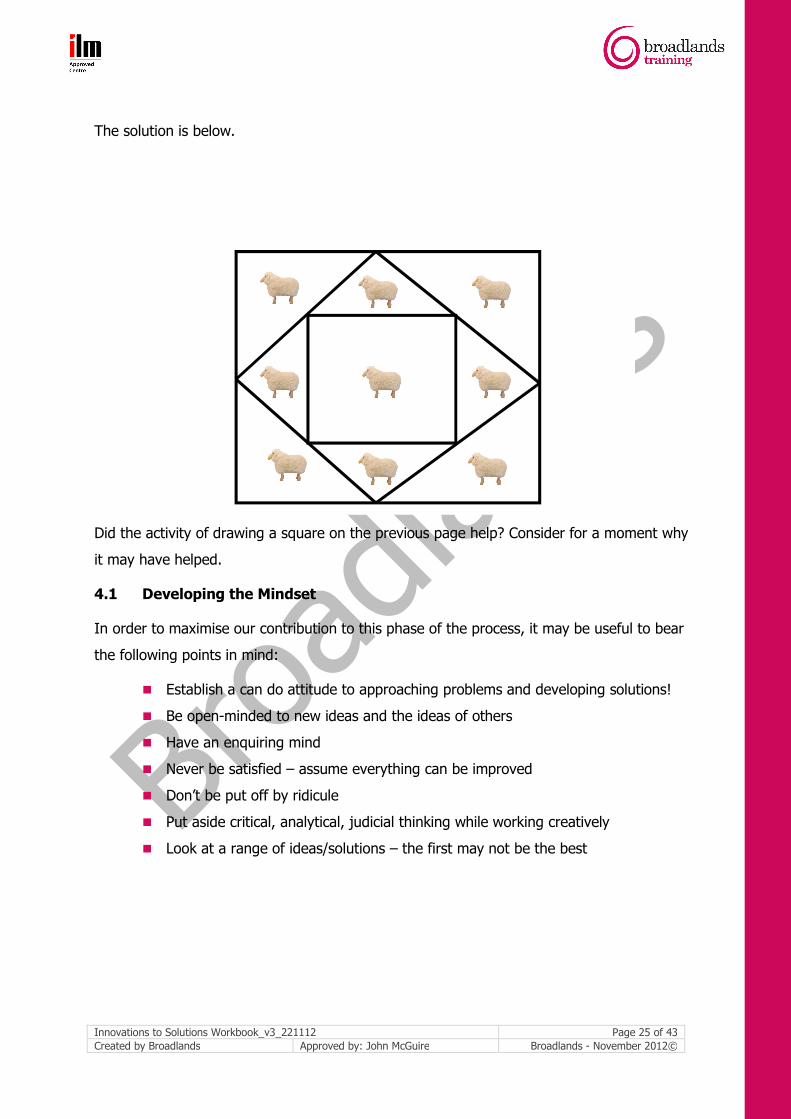
Now have a go at the following activity. The aim is to enclose each of the sheep separately
by drawing only 3 squares.
Innovations to Solutions Workbook_v3_221112 Page 25 of 43
Created by Broadlands Approved by: John McGuire Broadlands - November 2012©
The solution is below.
Did the activity of drawing a square on the previous page help? Consider for a moment why
it may have helped.
4.1 Developing the Mindset
In order to maximise our contribution to this phase of the process, it may be useful to bear
the following points in mind:
� Establish a can do attitude to approaching problems and developing solutions!
� Be open-minded to new ideas and the ideas of others
� Have an enquiring mind
� Never be satisfied – assume everything can be improved
� Don’t be put off by ridicule
� Put aside critical, analytical, judicial thinking while working creatively
� Look at a range of ideas/solutions – the first may not be the best

Innovations to Solutions Workbook_v3_221112 Page 26 of 43
Created by Broadlands Approved by: John McGuire Broadlands - November 2012©
4.2 A Process for Generating Options
Time Out
Spread of Ideas
(Possibles)
Filtering Down
(Feasibles)
Green Light Open
Thinking
Red Light Practical Thinking
Opportunity
Solution
Generative Stage
Cut-Off Point
Evaluative Stage
The diagram above shows graphically the process for generating solutions. The idea is that,
during the generative stage, we should look to employ green light thinking where we are
generating a spread of ideas ‘the possibles’. At some point, the idea generation stage will
reach its natural conclusion. It is highly recommended that, at this cut off point, we have a
time out for at least an hour or so, or preferably, overnight or even better - over the
weekend. Why, because if we move on to the evaluative stage where we apply red light
thinking, and fliter down the ideas to the feasibles, it is highly likely that we will get rid of
ideas that had potential but we hadn’t given sufficient time to consider. Like seedlings in a
green house, ideas need time to germinate – our sub-conscious works relentlessly on those
ideas until, on occasion, a connection is made, a bell rings in our head, and a eureka
moment is achieved. A real danger is that the generative stage never happens – because of
our educational conditioning we move straight into red light thinking, dismissing the more
creative ideas as impractical and even ridiculous.
4.3 Brainstorming – a Creativity and Innovation Tool
An excellent and widely-used tool for generating solutions is popularly known as
brainstorming, a term which is now, apparently, acceptable again. This is where a
group of people with a stake in a problem are brought together in order to, literally, storm
through ideas until a potential consensus solution is found. This is not, however, a free-for-
all. There are certain rules that need to be followed if the session is to maximise the
Innovations to Solutions Workbook_v3_221112 Page 27 of 43
Created by Broadlands Approved by: John McGuire Broadlands - November 2012©
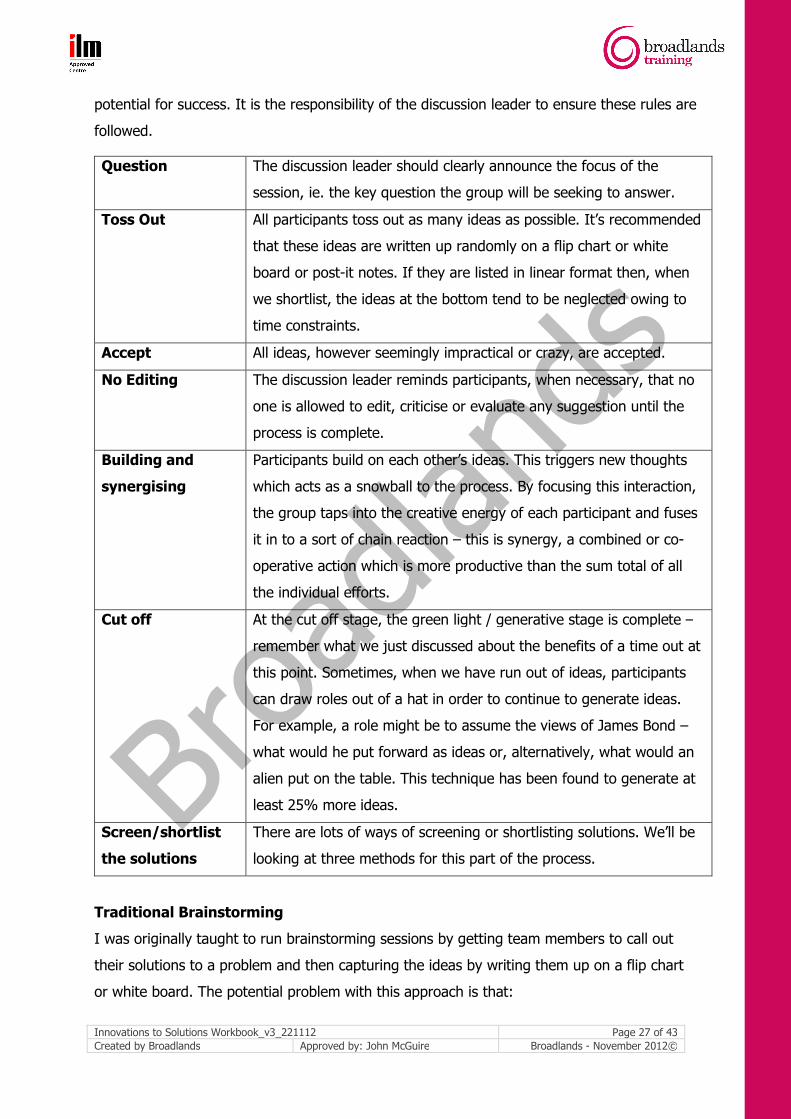
potential for success. It is the responsibility of the discussion leader to ensure these rules are
followed.
Question The discussion leader should clearly announce the focus of the
session, ie. the key question the group will be seeking to answer.
Toss Out All participants toss out as many ideas as possible. It’s recommended
that these ideas are written up randomly on a flip chart or white
board or post-it notes. If they are listed in linear format then, when
we shortlist, the ideas at the bottom tend to be neglected owing to
time constraints.
Accept All ideas, however seemingly impractical or crazy, are accepted.
No Editing The discussion leader reminds participants, when necessary, that no
one is allowed to edit, criticise or evaluate any suggestion until the
process is complete.
Building and
synergising
Participants build on each other’s ideas. This triggers new thoughts
which acts as a snowball to the process. By focusing this interaction,
the group taps into the creative energy of each participant and fuses
it in to a sort of chain reaction – this is synergy, a combined or co-
operative action which is more productive than the sum total of all
the individual efforts.
Cut off At the cut off stage, the green light / generative stage is complete –
remember what we just discussed about the benefits of a time out at
this point. Sometimes, when we have run out of ideas, participants
can draw roles out of a hat in order to continue to generate ideas.
For example, a role might be to assume the views of James Bond –
what would he put forward as ideas or, alternatively, what would an
alien put on the table. This technique has been found to generate at
least 25% more ideas.
Screen/shortlist
the solutions
There are lots of ways of screening or shortlisting solutions. We’ll be
looking at three methods for this part of the process.
Traditional Brainstorming
I was originally taught to run brainstorming sessions by getting team members to call out
their solutions to a problem and then capturing the ideas by writing them up on a flip chart
or white board. The potential problem with this approach is that:

Innovations to Solutions Workbook_v3_221112 Page 28 of 43
Created by Broadlands Approved by: John McGuire Broadlands - November 2012©
� Louder members of the team may dominate
� Quieter team members’ ideas are not ‘heard’
� The leader may start editing ideas according to his/her preference
An Alternative Approach to Brainstorming
A really effective way of overcoming these problems is through the use of large post-it notes.
It works like this:
� Each member of the team is given a number of post-it notes and a flip chart
marker pen. The reason for the latter is twofold: firstly, ideas have to be kept
brief because of the size of the writing and, secondly, everyone can actually see
the ideas
� Team members work individually, developing their ideas
� Team members place their completed post-it notes randomly on the flip
chart/whiteboard
The great benefit of this approach is that everyone is involved and gets their ideas aired.
Let’s try this approach with the following scenario
A company operates from a 10 storey office building. Those on the upper floors complain
that the lifts are slow and, therefore, they have to wait in the lobby for an inconveniently
long time.
� Once all the ideas have been captured, the team should assemble around the flip
chart/whiteboard and discuss the ideas that have been generated
� At this stage, we should try to start categorising the ideas by writing appropriate
headings at the top of the flip chart, and placing the ideas under the appropriate
headings, as in the example below.

Innovations to Solutions Workbook_v3_221112 Page 29 of 43
Created by Broadlands Approved by: John McGuire Broadlands - November 2012©
4.4 Other Creativity and Innovation Tools
Nominal Group Technique. This starts my people writing down their ideas (a kind of
private brainstorming) and then sharing these with the group in turn, so that each person
reads out one idea. They each go around until everyone has completed their lists. Instead
of the no discussion rule of brainstorming, these ideas are discussed as they are described.
(Delbecq, Van de Ve and Gustafson).
Trigger Sessions. Members of the group each write their ideas down on a sheet of paper
and then pass them on to the next person. Having read someone else's ideas, people can
and add their own thoughts (triggered by these ideas) to the list and pass this on again.
The sheets are circulated until they are back where they started, or everyone runs out of
ideas. This technique can allow duplication, so the different ideas are called out in turn
around the table, people missing out on the ideas from the list in front of them that have
been mentioned already.
A variant of this uses Sticky Notes or Post-itTM notes. Ideas are stuck up and read as
people come up with them and variants can be added. The advantage of this technique is
that similar ideas can be physically grouped together to encourage development and
refinement of the concepts.
Synectics: In this context Synectics is based on the principle of bringing together
contradictory or very different ideas in order to generate a creative solution to a problem. It
Innovations to Solutions Workbook_v3_221112 Page 30 of 43
Created by Broadlands Approved by: John McGuire Broadlands - November 2012©
starts by detailed analysis and definition of the problem on the grounds that you need to be
very clear exactly what it is you want, in order to avoid solving the wrong problem or dealing
with a symptom rather than the cause.
Synectics: The Development of Creative Capacity: WJ Gordon (1961)
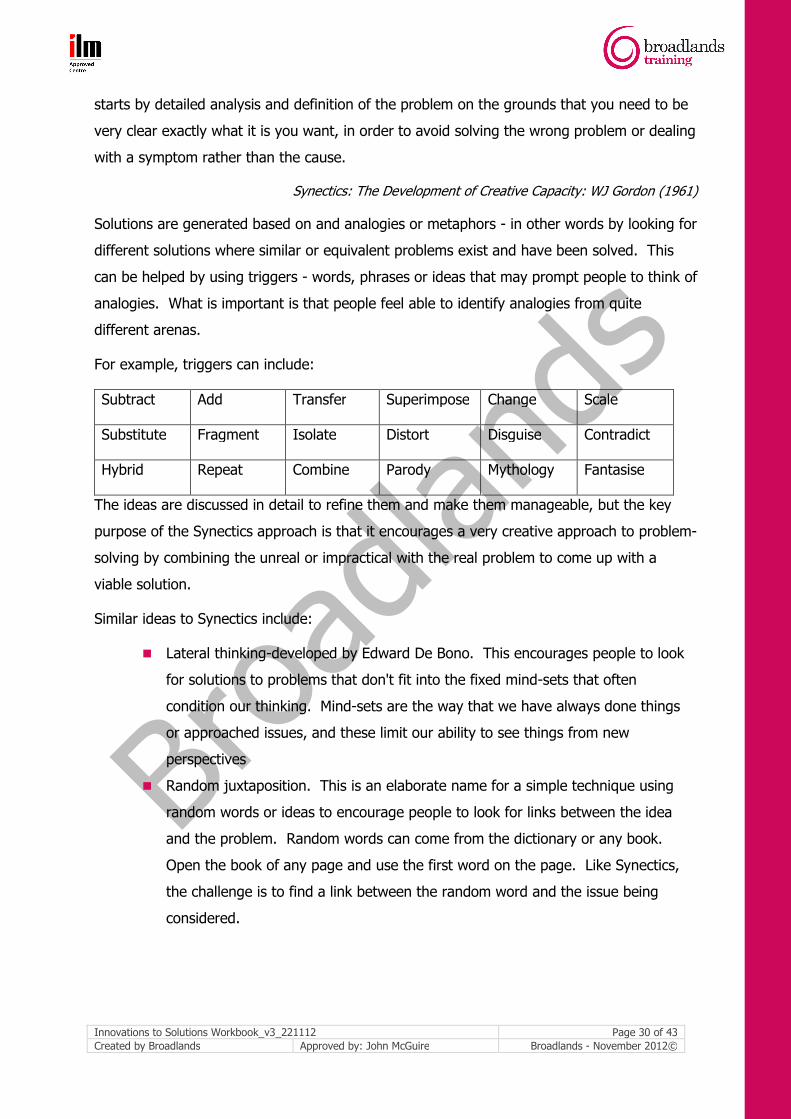
Solutions are generated based on and analogies or metaphors - in other words by looking for
different solutions where similar or equivalent problems exist and have been solved. This
can be helped by using triggers - words, phrases or ideas that may prompt people to think of
analogies. What is important is that people feel able to identify analogies from quite
different arenas.
For example, triggers can include:
Subtract Add Transfer Superimpose Change Scale
Substitute Fragment Isolate Distort Disguise Contradict
Hybrid Repeat Combine Parody Mythology Fantasise
The ideas are discussed in detail to refine them and make them manageable, but the key
purpose of the Synectics approach is that it encourages a very creative approach to problem-
solving by combining the unreal or impractical with the real problem to come up with a
viable solution.
Similar ideas to Synectics include:
� Lateral thinking-developed by Edward De Bono. This encourages people to look
for solutions to problems that don't fit into the fixed mind-sets that often
condition our thinking. Mind-sets are the way that we have always done things
or approached issues, and these limit our ability to see things from new
perspectives
� Random juxtaposition. This is an elaborate name for a simple technique using
random words or ideas to encourage people to look for links between the idea
and the problem. Random words can come from the dictionary or any book.
Open the book of any page and use the first word on the page. Like Synectics,
the challenge is to find a link between the random word and the issue being
considered.

Innovations to Solutions Workbook_v3_221112 Page 31 of 43
Created by Broadlands Approved by: John McGuire Broadlands - November 2012©
4.5 Screening Solutions - Evaluation Tools and Techniques
Having generated solutions, we now need to progress to the 4th stage: ‘deciding which
solution to implement’. Within this stage, we are going to consider the application of 4
decision making tools:
� The Decision Matrix
� De Bono’s 6 Thinking Hats
� The Criteria Matrix
� Decision Trees
Screening the Solutions
You may remember that we used the syphon analogy for screening the problem. Well, it is
equally appropriate at this stage because, essentially, the function of this stage is to screen
the range of solutions and select the optimal solution or solutions.
Possible Solutions
Selected Solutions
This is the stage where you explore and develop your choices (the three or four main
options) to a stage where you have sufficient information to weigh them up against each
other and make an objective decision.
4.5.1 The Decision Matrix
We could also use the ‘Decision Matrix’ method to screen the options. Whilst the following
criteria will be used to screen the shortlist of solutions in the decision matrix, these criteria
were not known to participants when brainstorming solutions. Had they been, this would

Innovations to Solutions Workbook_v3_221112 Page 32 of 43
Created by Broadlands Approved by: John McGuire Broadlands - November 2012©
have restricted the free flow of ideas. Team members would have been too focused on
ensuring each idea met the criteria – disasterous!
The criteria are as follows:
Essential Criteria: Any solution must reduce complaints to 10% of their present level
Desirable Criteria:
1. Ease congestion
2. Cost less than £5,000
3. Not take the lifts out of commission for more than one day
4. Not spoil the newly decorated lobby
Decision Matrix
Possible Solutions
Benefits Costs Risks Meets Essential Criteria
Meets Desirable Criteria
1 2 3 4
A. Speed up lift travel by fitting new motors
Reduction in complaints and congestion
£30,000 New motor means lift not operational for one month
High likelihood Yes No No Yes
B. Reprogram one lift to serve only upper floors
Could reduce complaints.
Might increase number of stair users.
£500 Might increase waiting times for some staff
High likelihood Yes Yes Yes Yes
C. Allow only senior staff to use lift in peak hours
Less congestion in lifts at peak hours.
Junior staff get more exercise by climbing stairs.
Nil Staff rebellion! Unlikely Yes Yes Yes Yes
D. Refurbish reception inc. TV screen, fish tank etc
Takes people’s minds off the wait
£2,000 Staff stay in reception longer than necessary to watch the TV
Medium likelihood
No Yes Yes Yes
E. Stagger lifts to serve different floors
More targeted utilisation of lifts
£1,000 Certain floors may be more popular
High likelihood Yes Yes Yes Yes
F. Flexi-time working
Less congestion in lobby at start of day.
£1,000 to set up
System is abused. Inaccurate records kept.
High likelihood Yes Yes Yes Yes
This is the decision matrix. Take a moment to familiarise yourself with its structure.
Essentially, 6 solutions have been shortlisted:
A. Speed up lift travel by fitting new motors
B. Reprogram one lift to serve only upper floors
C. Allow only senior staff to use lift in peak hours
D. Refurbish the reception area
E. Stagger lifts to serve different floors
F. Flexi-time working
Innovations to Solutions Workbook_v3_221112 Page 33 of 43
Created by Broadlands Approved by: John McGuire Broadlands - November 2012©
These are screened in terms of benefits, costs, risks, and the essential and 4 desirable
criteria listed on the previous slide.
Out of all 6 potential solutions, options B, E, and F meet both the essential criteria and all
the desirable criteria. Option D, to put a TV and fish tank in reception meets most of the
criitera, closely followed by option A. However when you look at option A, the cost soon
makes it prohibitive in the short term. Should we, therefore, select options B, D, E, and F?
4.5.2 The Six Thinking Hats
Certain types of thinking can be allowed to dominate the evaluation of ideas. For example,
too much weight can be attached to one negative comment, effectively damning an idea
before its positive aspects have even been considered. Alternatively, we can become so
carried away with our enthusiasm for an idea, that we overlook or ignore the potential
pitfalls.
To help us refine and explore/develop the options, there is an opportunity, at this stage, to
use one of Edward de Bono’s many contributions to the field of creativity and innovation: the
‘Six Thinking Hats’ approach. He argued that one of the main difficulties with thinking is
confusion, ie. we try to do too much at once and, consequently, emotions, logic, information,
hope and creativity all crowd in on us.
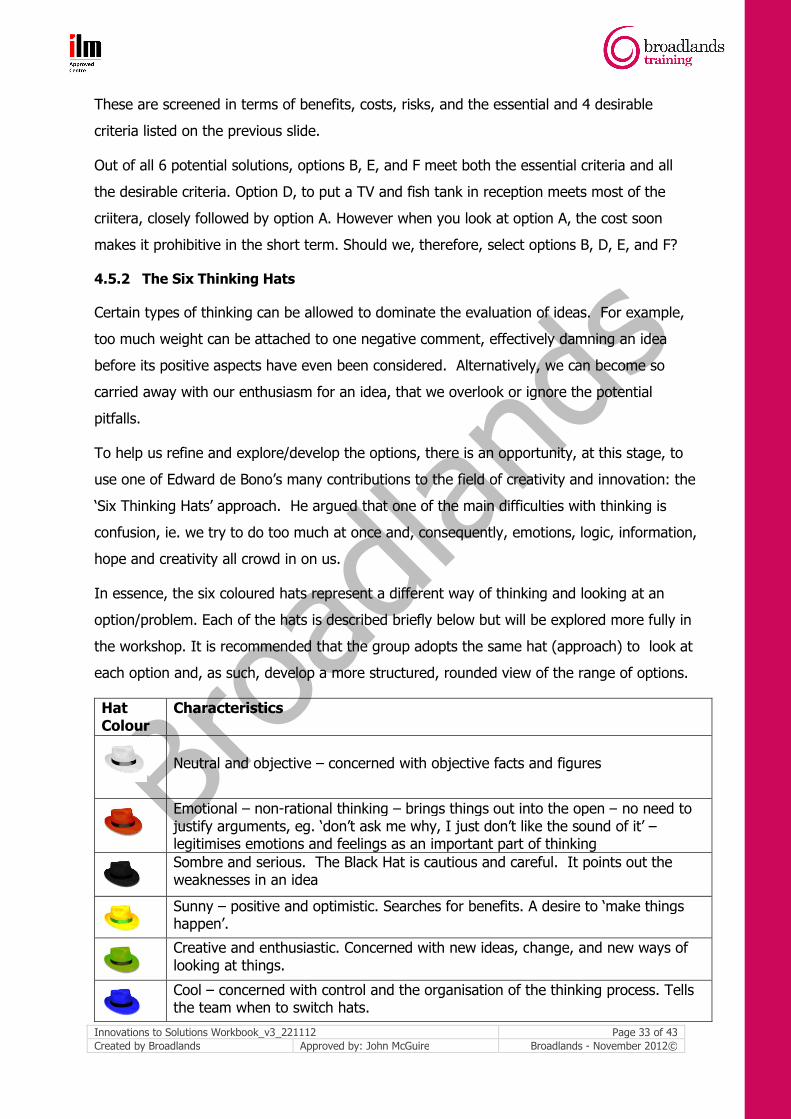
In essence, the six coloured hats represent a different way of thinking and looking at an
option/problem. Each of the hats is described briefly below but will be explored more fully in
the workshop. It is recommended that the group adopts the same hat (approach) to look at
each option and, as such, develop a more structured, rounded view of the range of options.
Hat Colour
Characteristics
Neutral and objective – concerned with objective facts and figures
Emotional – non-rational thinking – brings things out into the open – no need to justify arguments, eg. ‘don’t ask me why, I just don’t like the sound of it’ – legitimises emotions and feelings as an important part of thinking
Sombre and serious. The Black Hat is cautious and careful. It points out the weaknesses in an idea
Sunny – positive and optimistic. Searches for benefits. A desire to ‘make things happen’.
Creative and enthusiastic. Concerned with new ideas, change, and new ways of looking at things.
Cool – concerned with control and the organisation of the thinking process. Tells the team when to switch hats.

Innovations to Solutions Workbook_v3_221112 Page 34 of 43
Created by Broadlands Approved by: John McGuire Broadlands - November 2012©
The hats are always referred to by their colour and never their thinking. In organisations
where the Six Hats method has been used, amazing results have been achieved. An oil
company in Norway had a problem with a rig that was costing them $100,000 per day. A
trainer introduced the Six Hats method and the problem was solved in 12 minutes. The
$100,000 per day expenditure was reduced to zero.
De Bonos’ Six Hats techniques can be used to solve problems very quickly, or can be used as
part of a longer process. Here, we use it to demonstrate how you can evaluate, develop and
prepare for a decision, using four stages.
You have got your three or four options, and you wish to develop them or add richness to
the detail – do some ‘colouring in’ so that you have a full picture of the pros and cons, and
the different features of the option or idea.
Stage One: is about ensuring all of those involved in evaluating the idea have a clear and
consistent understanding of what it is. It provides an opportunity to share any known
factual information about the idea and for those owning the idea to ensure that the idea has
been explained clearly.
At this stage only factual information should be shared. This is not the time for opinions or
for individuals to start identifying problems or opportunities within the idea. List all the key
information you can about the idea. To help you, ask questions like:
� What is the idea?
� What problem is the idea intended to solve?
� How was the idea generated?
� How much will it cost?
� How long will it take to implement?
� What competition exists?
� What market research has been undertaken?
� When is it intended to be implemented?
� Who will be involved/affected?
� What training will be required?
Depending upon how far the idea has been developed, you may not be able to answer all
applicable questions at this stage. The important thing is that all available factual
information is shared, and that everyone has a consistent understanding of what is being
evaluated. Remember, at this stage it is important to retain a neutral and objective manner.
Do not attempt to interpret the facts.
Innovations to Solutions Workbook_v3_221112 Page 35 of 43
Created by Broadlands Approved by: John McGuire Broadlands - November 2012©
Stage Two: This is the stage at which the potential pitfalls, problems or dangers within an
idea are identified and highlighted. This is the time to get all the negative thoughts out into
the open. Questions you might ask at this stage include:
� What could go wrong?
� What’s wrong with the idea?
� Where are the potential dangers?
� What don’t you like?
At this stage, subjective judgements are allowed. All concerns should be recorded.
Stage Three: This is the time for optimistic thinking, when all of the things liked about the
idea, potential benefits and opportunities are identified and highlighted. Questions you
might ask at this stage include:
� What are the benefits?
� What opportunities could be created?
� What do we like about the idea?
� What’s the best thing about it?
� What could go right?
At this stage, subjective judgements are allowed, but it is very important that you don’t
revert to Stage Two here, allowing negative comments to be made. The facilitator will need
to ensure focus is kept on the positive.
Stage Four: This stage provides an opportunity to refer back to Stage Two and try to
identify ways in which the objections and concerns could be overcome. This is the creative
stage of evaluation where suggestions for adapting or changing the idea can be made.
Questions you might ask at this stage include:
� How can we overcome the objections?
� How could the idea be made better?
� What improvements can we suggest?
� How could the idea be adapted to help avoid the pitfalls?
If you significantly change the idea as a result of Stage Four, simply go back to Stage One
and repeat the process for the new idea, refining it until you reach a point where the
consensus view is either that the idea is worth progressing to pilot/trial, or that it should be
discarded.
Innovations to Solutions Workbook_v3_221112 Page 36 of 43
Created by Broadlands Approved by: John McGuire Broadlands - November 2012©
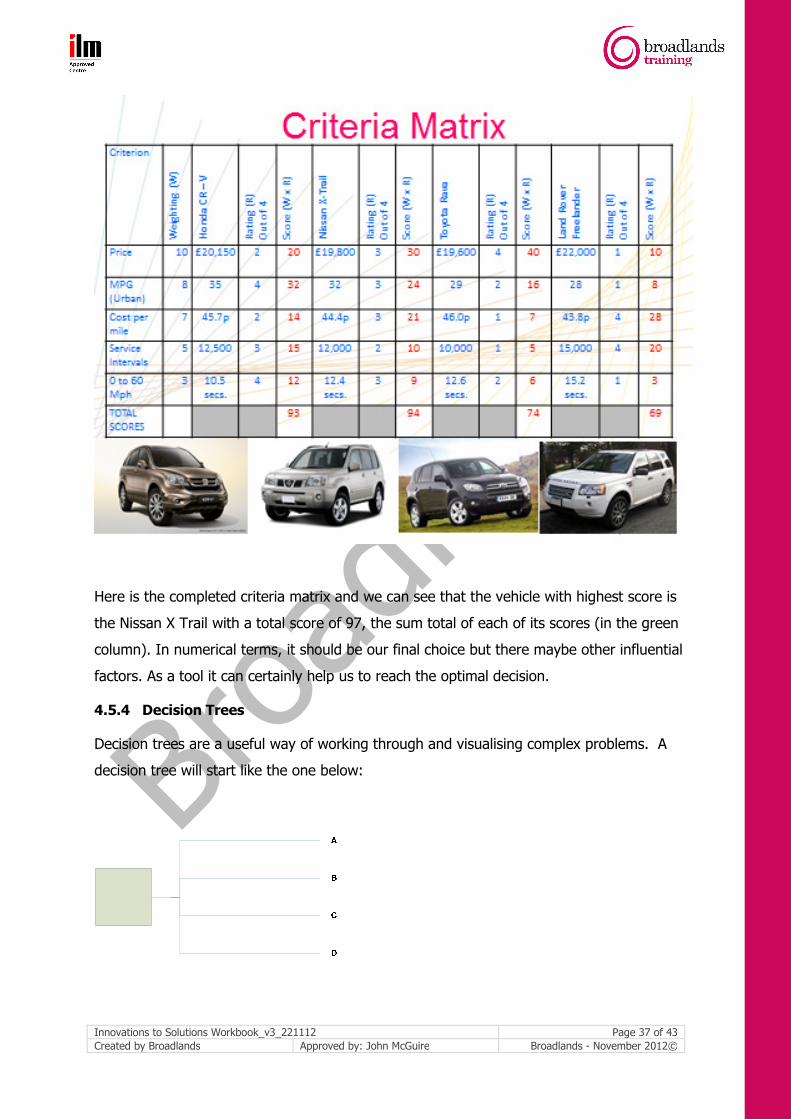
4.5.3 The Criteria Matrix
The Criteria Matrix is another solution screening tool which we will be looking at in this stage
of the module; not to be confused with the critical examination matrix which we looked at
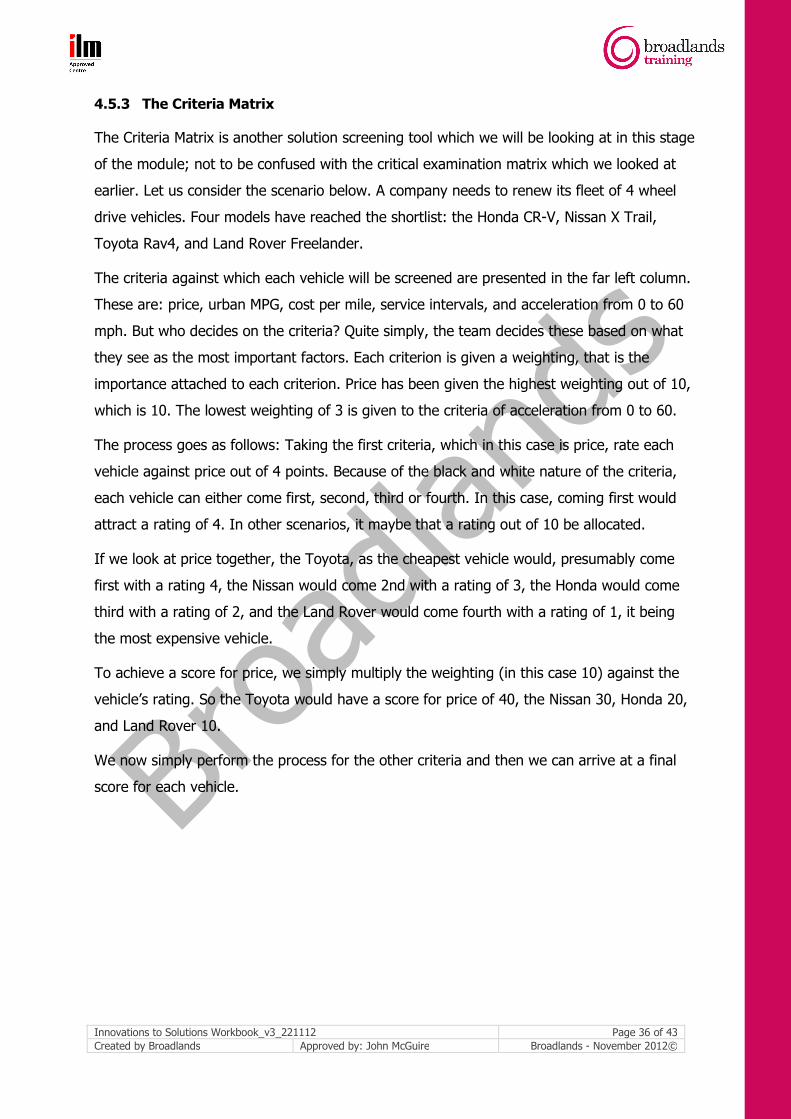
earlier. Let us consider the scenario below. A company needs to renew its fleet of 4 wheel
drive vehicles. Four models have reached the shortlist: the Honda CR-V, Nissan X Trail,
Toyota Rav4, and Land Rover Freelander.
The criteria against which each vehicle will be screened are presented in the far left column.
These are: price, urban MPG, cost per mile, service intervals, and acceleration from 0 to 60
mph. But who decides on the criteria? Quite simply, the team decides these based on what
they see as the most important factors. Each criterion is given a weighting, that is the
importance attached to each criterion. Price has been given the highest weighting out of 10,
which is 10. The lowest weighting of 3 is given to the criteria of acceleration from 0 to 60.
The process goes as follows: Taking the first criteria, which in this case is price, rate each
vehicle against price out of 4 points. Because of the black and white nature of the criteria,
each vehicle can either come first, second, third or fourth. In this case, coming first would
attract a rating of 4. In other scenarios, it maybe that a rating out of 10 be allocated.
If we look at price together, the Toyota, as the cheapest vehicle would, presumably come
first with a rating 4, the Nissan would come 2nd with a rating of 3, the Honda would come
third with a rating of 2, and the Land Rover would come fourth with a rating of 1, it being
the most expensive vehicle.
To achieve a score for price, we simply multiply the weighting (in this case 10) against the
vehicle’s rating. So the Toyota would have a score for price of 40, the Nissan 30, Honda 20,
and Land Rover 10.
We now simply perform the process for the other criteria and then we can arrive at a final
score for each vehicle.
Innovations to Solutions Workbook_v3_221112 Page 37 of 43
Created by Broadlands Approved by: John McGuire Broadlands - November 2012©
Here is the completed criteria matrix and we can see that the vehicle with highest score is
the Nissan X Trail with a total score of 97, the sum total of each of its scores (in the green
column). In numerical terms, it should be our final choice but there maybe other influential
factors. As a tool it can certainly help us to reach the optimal decision.
4.5.4 Decision Trees
Decision trees are a useful way of working through and visualising complex problems. A
decision tree will start like the one below:

Innovations to Solutions Workbook_v3_221112 Page 38 of 43
Created by Broadlands Approved by: John McGuire Broadlands - November 2012©
The square is the decision point, and the branches are four different choices. For
example, your choices might be (A) to use cash to buy a new computer system; (B) get a
loan to buy it; (C) hire the equipment; or (D) continue to use the existing equipment.
If the choice can only have one outcome, the branch of the decision tree for that alternative
is complete. Usually however, the choice will have several possible outcomes and we show
this on the decision tree by putting in outcome point (circle) with each possible choice,
shown as a subsidiary
branch.
The probability of each
outcome is written on the
relevant branch.
In the example shown here,
there are two options facing the decision maker: A and B. If A is chosen, there is only one
possible outcome, but if B is chosen, there are two possible outcomes: high profits or low
profits. In the example above, let's assume that we are certain that option A will give a
profit of QR 25,000. But option B could yield either QR 10,000 or QR 30,000: which option is
the best one to choose? There is more certainty with option A, even though there is the
prospect of a slightly higher return with the high profit line on option B. In this simple
example the judgement
may come down to your
appetite for risk.
The more complex the
problem, the more likely
you are to need to use
something like a decision
tree:
SWOT Analysis
Simply, using SWOT Analysis, you can screen the solutions in order to identify their:
� Strengths
� Weaknesses
� Opportunities
� Threats

Innovations to Solutions Workbook_v3_221112 Page 39 of 43
Created by Broadlands Approved by: John McGuire Broadlands - November 2012©
Strengths
Weaknesses
Opportunities
Threats
5. Implementation
5.1 Communicating the Decision
As we know from our real life, where other people are involved, it is often necessary to
explain, to convince or to negotiate before we can implement. You also may need other
people's help to implement the solution. You will certainly need to communicate with a
whole range of other people so that they understand what is happening.
Use these simple points to check that you are clear about the ‘what’ and the ‘how’:
� Decide what you want the people to do/know after the communication
� define target audiences (may be you have done this as part of stakeholder
mapping
� determine the content of messages for each audience group
� identify the most effective and efficient media to use, per message, per audience
group
Innovations to Solutions Workbook_v3_221112 Page 40 of 43
Created by Broadlands Approved by: John McGuire Broadlands - November 2012©
� identify barriers to effective communication (organisation and physical)
� agreed best delivery date(s), day, time and situation
� identify the most effective communicators of the message
� check if the right message has been heard by the right people at the right time
� keep at least one step ahead of the target audience’s thinking processes
� prepare for adverse outcomes.
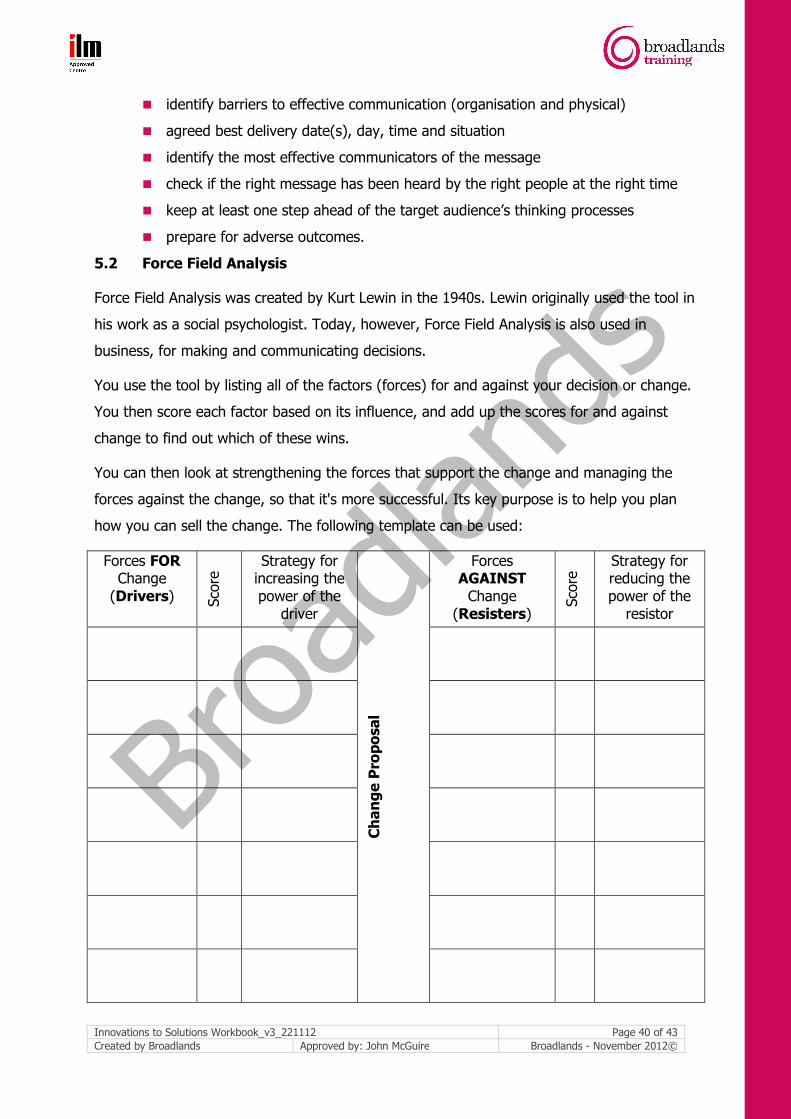
5.2 Force Field Analysis
Force Field Analysis was created by Kurt Lewin in the 1940s. Lewin originally used the tool in
his work as a social psychologist. Today, however, Force Field Analysis is also used in
business, for making and communicating decisions.
You use the tool by listing all of the factors (forces) for and against your decision or change.
You then score each factor based on its influence, and add up the scores for and against
change to find out which of these wins.
You can then look at strengthening the forces that support the change and managing the
forces against the change, so that it's more successful. Its key purpose is to help you plan
how you can sell the change. The following template can be used:
Forces FOR Change
(Drivers) Sco
re Strategy for
increasing the power of the
driver
Change Proposal
Forces AGAINST Change
(Resisters)
Sco
re Strategy for
reducing the power of the
resistor

Innovations to Solutions Workbook_v3_221112 Page 41 of 43
Created by Broadlands Approved by: John McGuire Broadlands - November 2012©
5.3 Implementation Plan
Unless the solution is very simple and does not involve other people, you will need to create
an action plan. In many cases, we may produce a Gantt chart – either using an IT system
or on paper. A Gantt chart looks like this:
You may also need to put in place new systems or controls/checks and balances in order to
make the solution work, particularly if you are changing something that is already in use in
your organisation. A plan which covers the following would be helpful:
� what is to be done
� the start date
� who needs to carry out the action
� how they are going to do it
� the resources required
� the risks involved and any actions to ‘mitigate’ the effects of risk
� the target completion date.
6. Review and Evaluation
6.1 Lessons Learned
Once the problem has been solved, there is a tendency to forget about it. The reality is that
our lives are full of problems and so the sooner we finish with one thing and move onto the
next the better. But as we saw when looking at projects, learning lessons from past
experience in order to apply them to the future is very important. So sometimes we
Innovations to Solutions Workbook_v3_221112 Page 42 of 43
Created by Broadlands Approved by: John McGuire Broadlands - November 2012©
undertake a ‘Lessons Learned’ session. This is about getting together those involved in
the project or implementation, and asking what went well, what went badly, and what could
be done differently next time.
6.2 Monitoring Processes
You will want to put in place some kind of process (even a very simple one) for checking on
progress post-implementation and ensuring that any quality systems are updated and
maintained.
With a complex problem, it's rarely sensible to implement the solution and just assume that
no further action is required. This is particularly so where you are changing things that
involve people.
The kind of monitoring that you undertake will depend on the nature of the change. If you
have changed systems or processes in an organisation with lots of transactions, you can use
formal systems such as customer satisfaction questionnaires and computer printouts, or
informally by checking with the people involved to see if the problem has been resolved. As
a manager, you can also check out the system for yourself.
6.3 Evaluation
Evaluation is a process of comparing the actual outcome of the implemented solution (as
measured by the monitoring) with your planned outcome. In other words, how successful
did the solution turn out to be? In evaluating your solution when it is in operation, you will
see:
� Whether or not it is working
� whether and how it could be improved
� how to solve a similar problem in the future more quickly and efficiently.
6.4 Looking Back
Each time you go through a problem-solving process, you will have the opportunity to learn
something that will help you do it even better next time.
As a final point, let's review some of the key things to think about when you look back:
� What caused the problem in the first place? Could it have been avoided?
� Have you taken steps to ensure that the problem will not re-occur?
� Was your initial approach to the problem the correct one? What can be learned
from the mistakes made in the early stages?

Innovations to Solutions Workbook_v3_221112 Page 43 of 43
Created by Broadlands Approved by: John McGuire Broadlands - November 2012©
� Were you objective in your approach to solving the problem?
� Was the eventual price you paid for solving the problem worth it, or would you
have been better off not tackling the issue at all?
� Did your definition of the problem turn out to be correct, or were you forced to
revise your impression of it?
� Did you have enough information to make a sound decision? Could you have had
any more information?
� Are you confident that you will be able to recognise a problem of the same type
in the future, so that you can use a similar solution?
� Can you use the result or method again for a similar problem?
� Did you use all the help you could get? Were you surprised to find out who the
most helpful people were?
� Could you have arrived at the result differently? Does it all now seem obvious?
� Would you tackle a problem like this in the same way again?
� What have you learned?
Broadlands Consulting Ltd PO Box 27111
Commercial Bank Plaza Doha Qatar 2012