innovations in market mix modelling
TRANSCRIPT
© AbsolutData 2013 Proprietary and Confidential
Chicago New York London Dubai New Delhi Bangalore SingaporeSan Francisco
www.absolutdata.com
20 January 2014
Meet-up Data Science Oxford
Our exploration into innovations in Marketing Mix Modelling

© AbsolutData 2013 Proprietary and Confidential 2
Friends do not let friends to use Excel for statistical analysis
Agenda
NLMixed & MCMC to automate the fitting of s-curves and more
The statistical Challenges and the curse of the s-curve
What is Marketing Mix Modeling?
VARx Modelling
Discussion

© AbsolutData 2013 Proprietary and Confidential 3
Friends do not let friends to use Excel for statistical analysis
Strategic vs. tactical decisions
Spend Brand Equity
Engagement
Web
Purchase
Profile/segment
Preferences
Propensity Models
Strategic
How to spread the budget?
What campaigns?
Product design
Pricing strategy
? ??
Tactical
Who?
What?
When?
? ??
Decision support modelling and
tools

© AbsolutData 2013 Proprietary and Confidential 4
Friends do not let friends to use Excel for statistical analysis
Measurement of effectiveness & efficiency by marketing driver –Answering key business questions
Identify brand/s’ volume growth/decline drivers
Explain what is driving year over year change in sales
Determine relative importance & estimates elasticity of different drivers
Identify the competition and assesses impact
Determine the key competitive levers that impact/interact with own brand
Build a robust framework for investment decisions for short term -brands that should be supported
Determine an optimal realistic investment plan for the future based on simulated scenarios

© AbsolutData 2013 Proprietary and Confidential 5
Friends do not let friends to use Excel for statistical analysis
Magazine
Online
Radio
TV
We would like to measure the direct and indirect impact of marketing investment at a granularity relevant to planning
Overall Sales
Affiliate Clicks
Paid Search Clicks
Display Clicks
DecisionSupportAnalysis

© AbsolutData 2013 Proprietary and Confidential 6
Friends do not let friends to use Excel for statistical analysis
Marketing mix modeling & optimization @ AbsolutDatafocus on shift towards true attribution & predictive spend mix
Data Collection
From Disparate
Data Sources
Data Review –Confirming directional
movements of prominent variables
Review past performance to
determine CONTRIBUTION of
each marketing mix element
Traditional Regression Based
Modeling Techniques such as
OLS
DIYSimulator
What-If Scenario Planning
Optimized Media
Calendar
Objective Function & Constraints
Attribution & ROI
Measurement – Multi channel
influence and interactions
Advanced Modeling
Techniquessuch as
Auto Regressive, VARX, SEM
Added model
granularity at
customer segment
and regional
level
© AbsolutData 2013 Proprietary and Confidential 7
Friends do not let friends to use Excel for statistical analysis
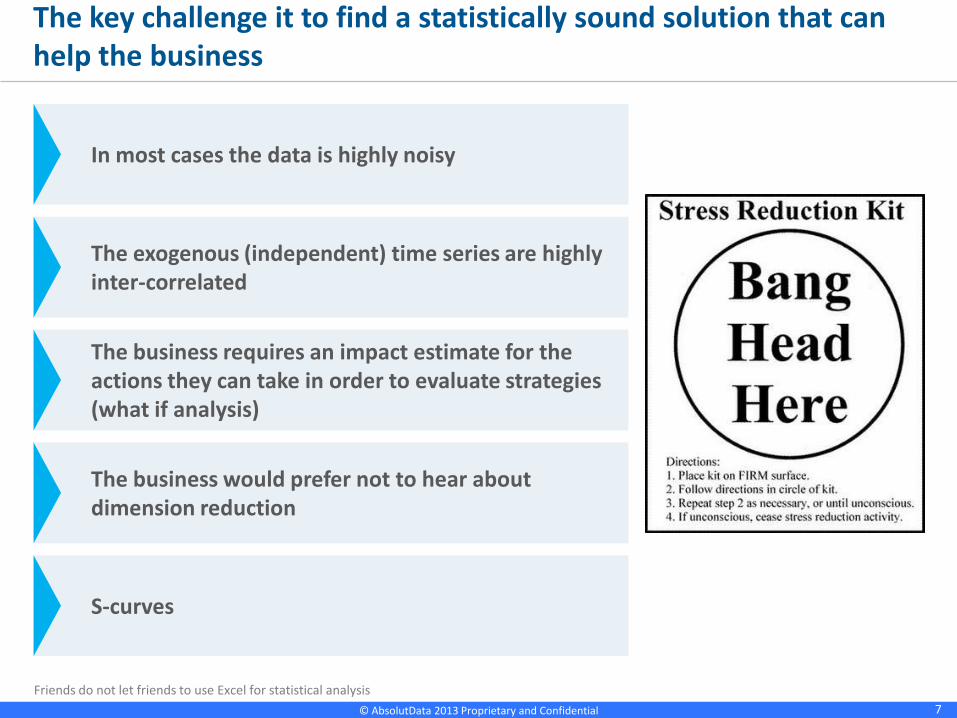
The key challenge it to find a statistically sound solution that can help the business
In most cases the data is highly noisy
The exogenous (independent) time series are highly inter-correlated
The business requires an impact estimate for the actions they can take in order to evaluate strategies (what if analysis)
The business would prefer not to hear about dimension reduction
S-curves

© AbsolutData 2013 Proprietary and Confidential 8
Friends do not let friends to use Excel for statistical analysis
Ad-stock
Saturation Effects
Ad stock captures exponential decay effect of GRPs - TV
This depends on the temporal effect of GRPs, can be done for Print , Radio as well
Research suggests that immediate response generated by advertising follows an S-curve
It introduces three additional parameters: saturation rate, point of inflexion and ‘half-life’ parameter (for carryover effect) as unknowns in the model
Together this captures the diminishing return of advertising
Ad-stock impact which depends on the temporal effect of GRPs
Carry-Over Effect
Samp
le O
utp
ut
Business understanding is introduces through transformation
© AbsolutData 2013 Proprietary and Confidential 9
Friends do not let friends to use Excel for statistical analysis
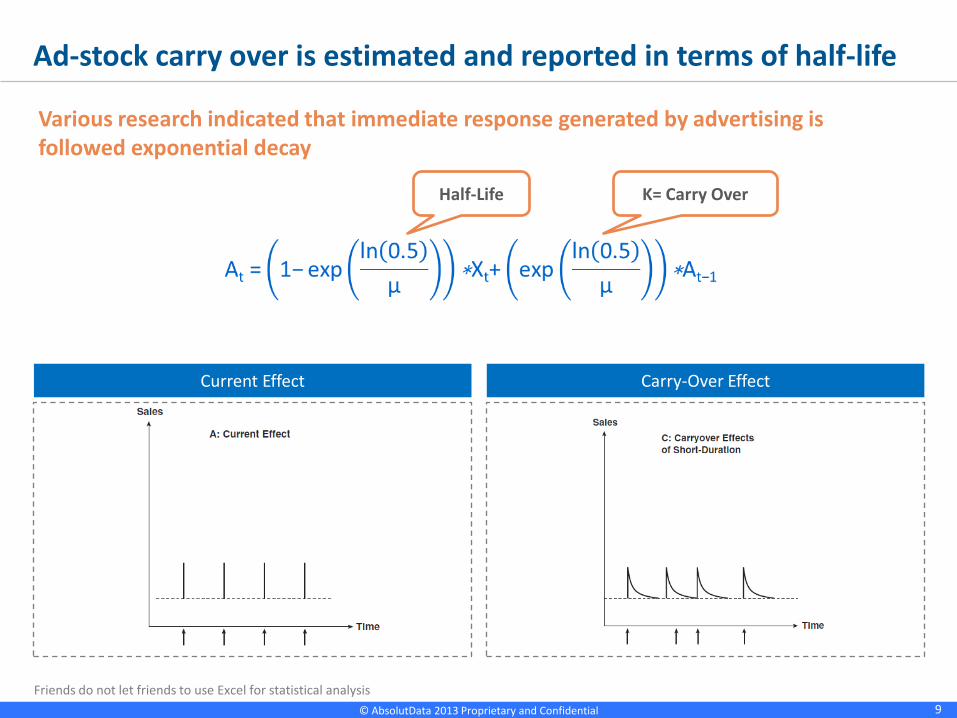
Various research indicated that immediate response generated by advertising is followed exponential decay
Ad-stock carry over is estimated and reported in terms of half-life
Current Effect
Half-Life K= Carry Over
Carry-Over Effect

© AbsolutData 2013 Proprietary and Confidential 10
Friends do not let friends to use Excel for statistical analysis
0
200
400
600
800
1000
1200
1400
1600
1800
0 50 100 150 200 250 300 350 400 450
Re
ven
ue
Imp
act
(Exc
lud
ing
Car
ry-o
ver
eff
ect
)
$ Spent per Week
Inflexion Point
Saturation Level
Adstock Equation:
Where, X is actual spending, K is decay constant and determined by expression exp(ln(0.5)/t1/2); V as saturation parameter and Xd as diminishing return point (point of inflexion)
S-Curve Impact Carry-over ImpactAd-stock Impact
At= 1/(1+exp(-V*(X-Xd ))) + K*At-1
S-Curves transformation reflect the belief that Marketing spend reduces in its effectiveness at a certain point and it impact decays over time
Half-Life
Research suggests that immediate response generated by advertising can be modeled using an S-curve followed byexponential decay of effect which helps capture the diminishing return of advertising
© AbsolutData 2013 Proprietary and Confidential 11
Friends do not let friends to use Excel for statistical analysis
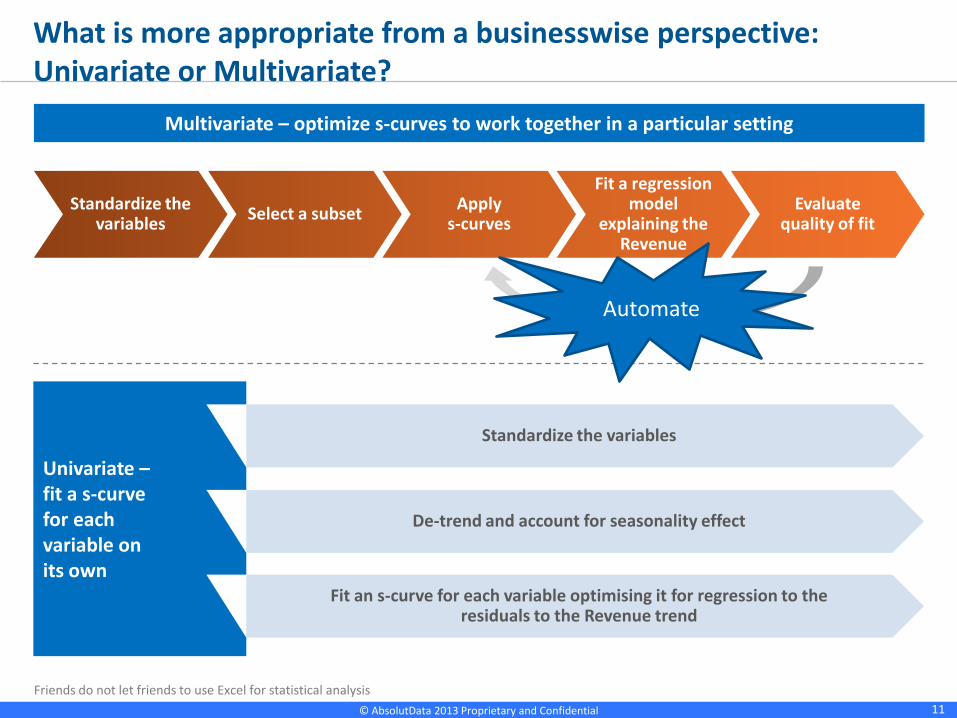
What is more appropriate from a businesswise perspective: Univariate or Multivariate?
Standardize the variables
Select a subsetApply
s-curves
Fit a regression model
explaining the Revenue
Evaluatequality of fit
Multivariate – optimize s-curves to work together in a particular setting
Manually optimize
Univariate –fit a s-curve for each variable on its own
Standardize the variables
De-trend and account for seasonality effect
Fit an s-curve for each variable optimising it for regression to the residuals to the Revenue trend
Automate

© AbsolutData 2013 Proprietary and Confidential 12
Friends do not let friends to use Excel for statistical analysis
Instead of calculating the s-curve from t=0, I concentrate on the last n lags:
I explored two sas procedures for fitting the s-curves
Fit aggregation model where S is the dependent and the residual to the Revenue trend is the independent (no intercept for now – might need to reconsider that)
NLMIXED MCMC

© AbsolutData 2013 Proprietary and Confidential 13
Friends do not let friends to use Excel for statistical analysis
My code – if you must
%Macro HazSThree(SVar);
S_Mue=1/(1+exp(-sV*(&SVar._lag&Nlags.-sXd))) ;
%do l=%sysevalf(&Nlags.-1) %to 0 %by -1;
S_Mue=1/(1+exp(-sV*(&SVar._lag&l.-sXd))) + sK*S_Mue;
%end;
%mend
proc nlmixed data=HAZ.Detrend MAXITER=4000 maxfunc=4000;
ods select ParameterEstimates;
parms b1=1 se=1 sV=1 sXd=0 SK=0.25;
bounds se>0;
bounds sV>0;
bounds 0<SK<1;
bounds b1>0;
%HazSThree(&HazVar.);
Mue= b1*S_Mue;
model Detrended ~ normal(mue, se);
proc mcmc data=HAZ.Detrend &MCMCOptions.;
ods select PostSummaries ;
parms b1 se
sV sXd SK
;
prior b1 ~ normal(mean = 1, var = 0.5);
prior se ~ igamma(shape = 3/10, scale = 10/3);
prior SK ~ uniform(0,1);
prior sXd ~ uniform(-2,2);
prior sV ~ uniform(0,10);
%HazSThree(&HazVar.);
Mue=b1*S_Mue;
model Detrended ~ n(mue, sd = se);
For illustrative purposes the code shown here fits only one s-cure. The solution actually fits a baseline and all thecurves

© AbsolutData 2013 Proprietary and Confidential 14
Friends do not let friends to use Excel for statistical analysis
Vector Auto Regression (VAR)
time
Steady stateprogression
Target
Sales/Signups
time
Co dependencyassociationIndigenous
Web search
time
Marketing impact & decay
Exogenous
campaigns
© AbsolutData 2013 Proprietary and Confidential 15
Friends do not let friends to use Excel for statistical analysis
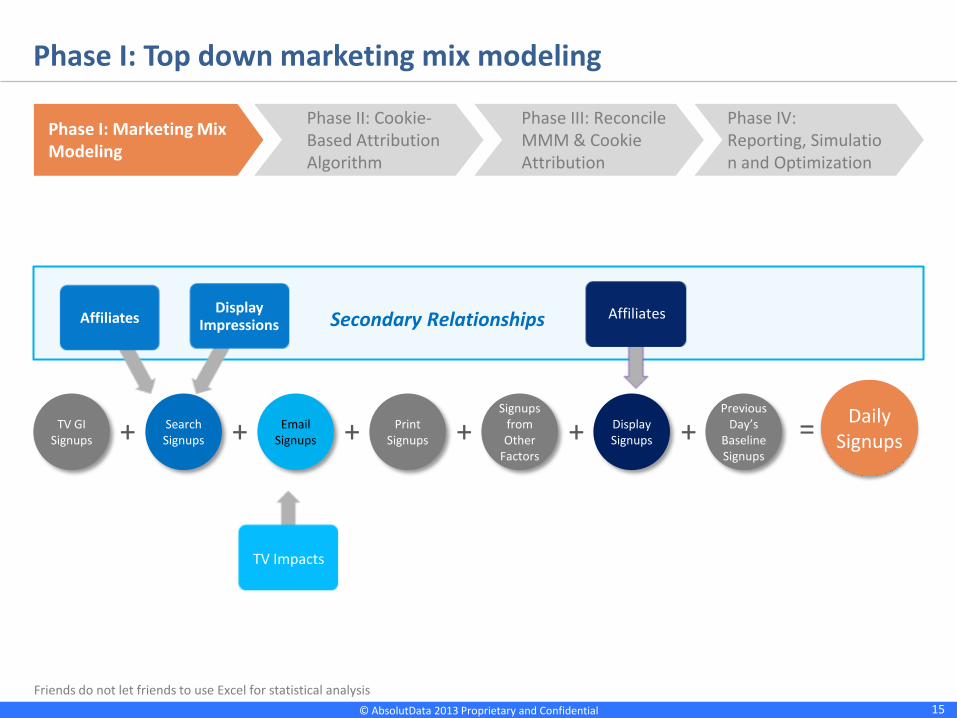
Phase I: Top down marketing mix modeling
Phase III: Reconcile MMM & Cookie Attribution
Phase IV: Reporting, Simulation and Optimization
Phase I: Marketing Mix Modeling
Phase II: Cookie-Based Attribution Algorithm
Search Clicks
AffiliatesDisplay
Impressions
TV Impacts
AffiliatesSecondary Relationships
Search Signups
Email Signups
Print Signups
Signups from Other
Factors
Previous Day’s
Baseline Signups
+TV GI Signups
Display Signups+ + + + +
Daily Signups=
© AbsolutData 2013 Proprietary and Confidential 16
Friends do not let friends to use Excel for statistical analysis
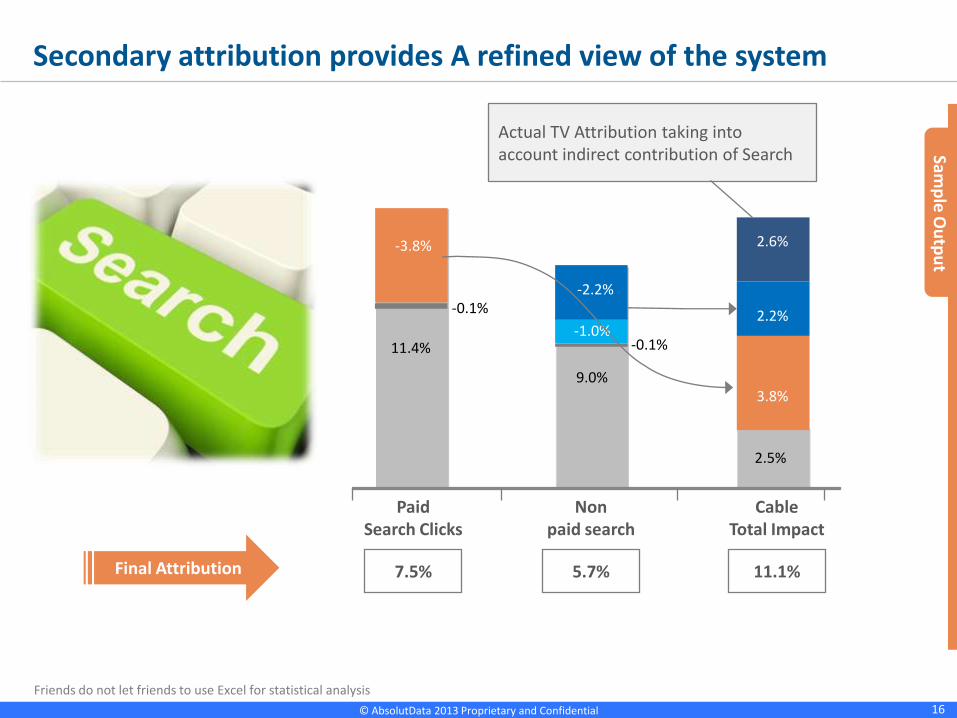
Secondary attribution provides A refined view of the system
PaidSearch Clicks
Nonpaid search
CableTotal Impact
11.4%
9.0%
2.5%
3.8%
-1.0%2.2%
-0.1%
2.6%-3.8%
-2.2%
Actual TV Attribution taking into account indirect contribution of Search
Final Attribution 7.5% 5.7% 11.1%
Samp
le O
utp
ut
-0.1%

© AbsolutData 2013 Proprietary and Confidential 17
Friends do not let friends to use Excel for statistical analysis
Applying VARx to a BIG
number of SKUs
How to choose priors
We have encountered interesting challenges
Challenges
Modelling short term and long
term effect
Cookie data allows to not only do attribution but
identify key sequences

© AbsolutData 2013 Proprietary and Confidential 18
Friends do not let friends to use Excel for statistical analysis
Incomplete sales (Target) data
We do not know what is sold when by the distributers We sell to their stock
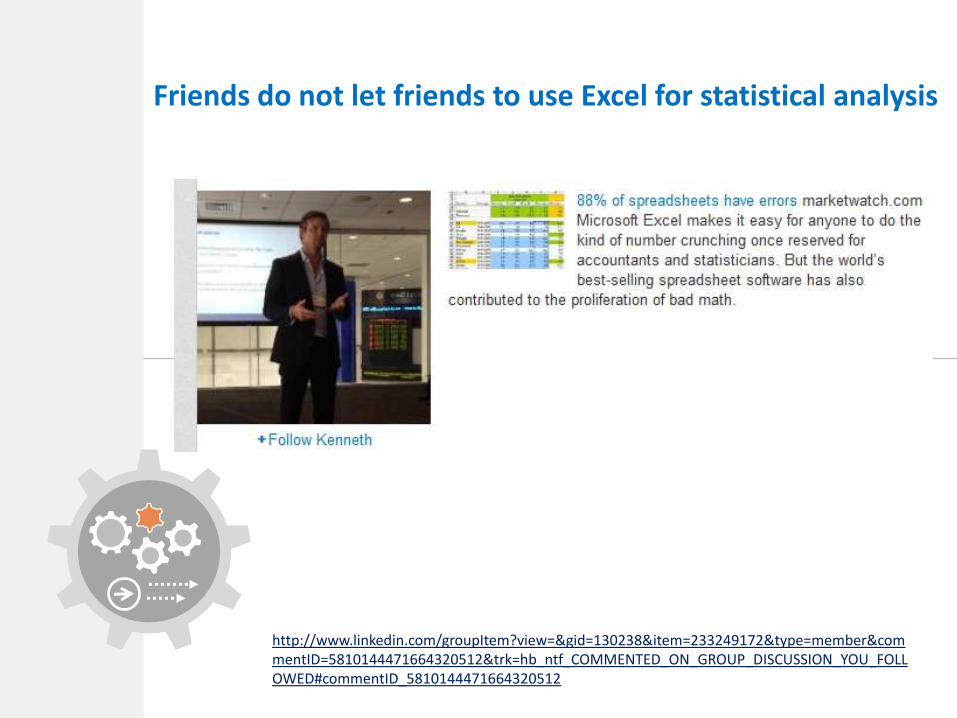
Friends do not let friends to use Excel for statistical analysis
http://www.linkedin.com/groupItem?view=&gid=130238&item=233249172&type=member&commentID=5810144471664320512&trk=hb_ntf_COMMENTED_ON_GROUP_DISCUSSION_YOU_FOLLOWED#commentID_5810144471664320512
© AbsolutData 2013 Proprietary and Confidential 20
Friends do not let friends to use Excel for statistical analysis
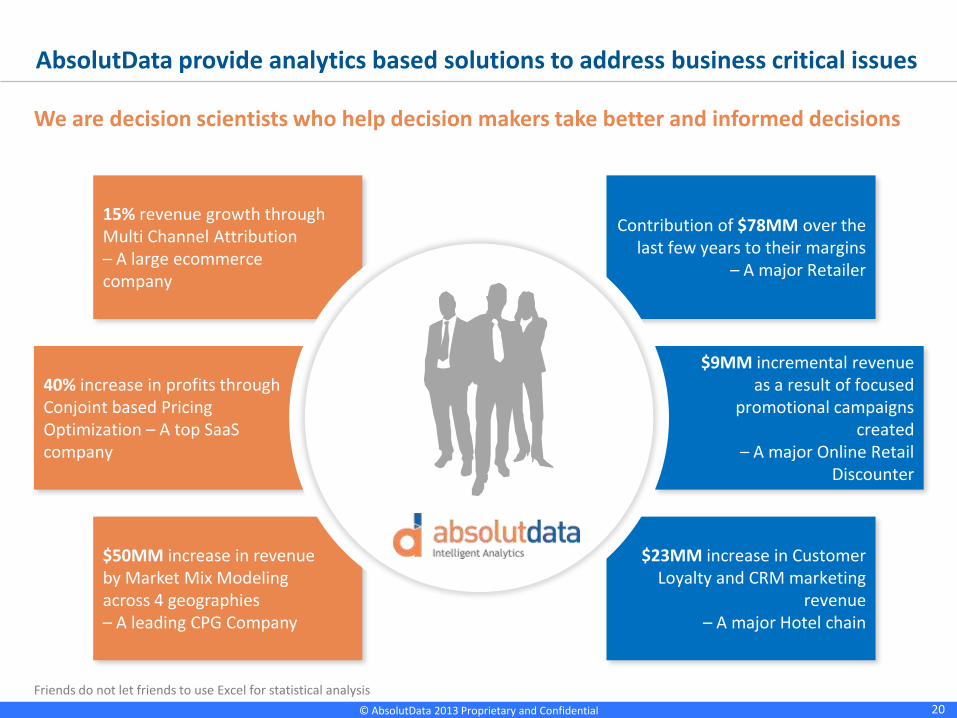
AbsolutData provide analytics based solutions to address business critical issues
40% increase in profits through Conjoint based Pricing Optimization – A top SaaS company
$50MM increase in revenue by Market Mix Modeling across 4 geographies– A leading CPG Company
15% revenue growth through Multi Channel Attribution– A large ecommerce company
$23MM increase in Customer Loyalty and CRM marketing
revenue– A major Hotel chain
$9MM incremental revenue as a result of focused
promotional campaigns created
– A major Online Retail Discounter
Contribution of $78MM over the last few years to their margins
– A major Retailer
We are decision scientists who help decision makers take better and informed decisions
Thank You
Eli Y. KlingDirector - Analytics
Phone: +44 (0)7940094976Email: [email protected]: Uk.linkedin.com/in/elikling